bbg research series · pdf file · 2016-03-30the changing media landscape in...
TRANSCRIPT

BBG Research Series
The Changing Media Landscape in Vietnam

Vietnam Findings from the World Poll

Vietnam Surveys — Background and Conditions
Since 2006, there have been 10 annual national surveys of individuals aged 15 and older
Nationally representative of more than 57 million Vietnamese
Geographic exclusions in 2014 of areas that were deemed unsafe or remote areas representing about 10% of the total population
Sample size: 1,000 per year
Face-to-face mode
PAPI: 2006-2014
Response Rate: 71%
3 Copyright © 2015 Gallup, Inc. All rights reserved.

Challenging transportation infrastructure Far flung provinces with poor/no
roads make travelling difficult Weather exacerbates difficulties
Flooding makes in-person interviewing difficult
October–April, central; May– September, north and south
Disputed areas or areas under strict government control for security reasons
Language barrier
Conducting Survey Research in Vietnam
4 Copyright © 2015 Gallup, Inc. All rights reserved.

5
Please imagine a ladder with steps numbered from zero to 10. On which step would you say you currently stand? On which step do you think you will stand five years from now?
5.3 5.4 5.5 5.3 5.3 5.8 5.5
5.0 5.1
6.6 7.0 6.7
6.3 6.7
7.1 6.5 6.5
7.5
0.0
2.0
4.0
6.0
8.0
10.0
2006 2007 2008 2009 2010 2011 2012 2013 2014
Average rating, life today Average rating, life in five years
Copyright © 2015 Gallup, Inc. All rights reserved.
Vietnamese optimism about the future shows an increase
Average rating, life today
Average rating, life in five years

6
Please imagine a ladder with steps numbered from zero to 10. On which step would you say you currently stand?
3.6 4.2 4.5
4.1 4.1 4.2 3.9 3.7 3.9
5.3 5.4 5.5 5.3 5.3 5.8 5.5
5.0 5.1 4.6 4.9 4.8 4.5 4.7 5.0 5.1 5.2 5.2
0.0
2.0
4.0
6.0
8.0
10.0
2006 2007 2008 2009 2010 2011 2012 2013 2014
Cambodia Vietnam China
Copyright © 2015 Gallup, Inc. All rights reserved.
Vietnamese satisfaction with present life is largely unchanged; Chinese have seen an increase
Cambodia
Vietnam
China

7
Please imagine a ladder with steps numbered from zero to 10. On which step do you think you will stand five years from now?
4.9 5.5 5.8 5.5 5.5 5.3 5.2 5.1
6.3
6.6 7.0
6.7 6.3
6.7 7.1
6.5
6.5
7.5
6.5 6.8
6.8 6.4
6.2 6.6 6.5
6.8 6.8
0.0
2.0
4.0
6.0
8.0
10.0
2006 2007 2008 2009 2010 2011 2012 2013 2014
Cambodia Vietnam China
Copyright © 2015 Gallup, Inc. All rights reserved.
Vietnamese as optimistic about the future as the Chinese
Cambodia
Vietnam
China

8
Right now, do you feel your standard of living is getting better or getting worse?
63.7%
72.9%
28.3% 22.5%
6.9% 3.4%
All Vietnamese Vietnamese aged 15 to 34
Getting better Staying the same Getting worse
Copyright © 2015 Gallup, Inc. All rights reserved.
Most Vietnamese say their living standards are improving

9
Right now, do you feel your standard of living is getting better or getting worse?
81.7%
72.9%
11.8%
22.5%
4.2% 3.4%
Chinese aged 15 to 34 Vietnamese aged 15 to 34
Getting better Staying the same Getting worse
Copyright © 2015 Gallup, Inc. All rights reserved.
Vietnamese youth are equally positive about momentum on standard of living
10
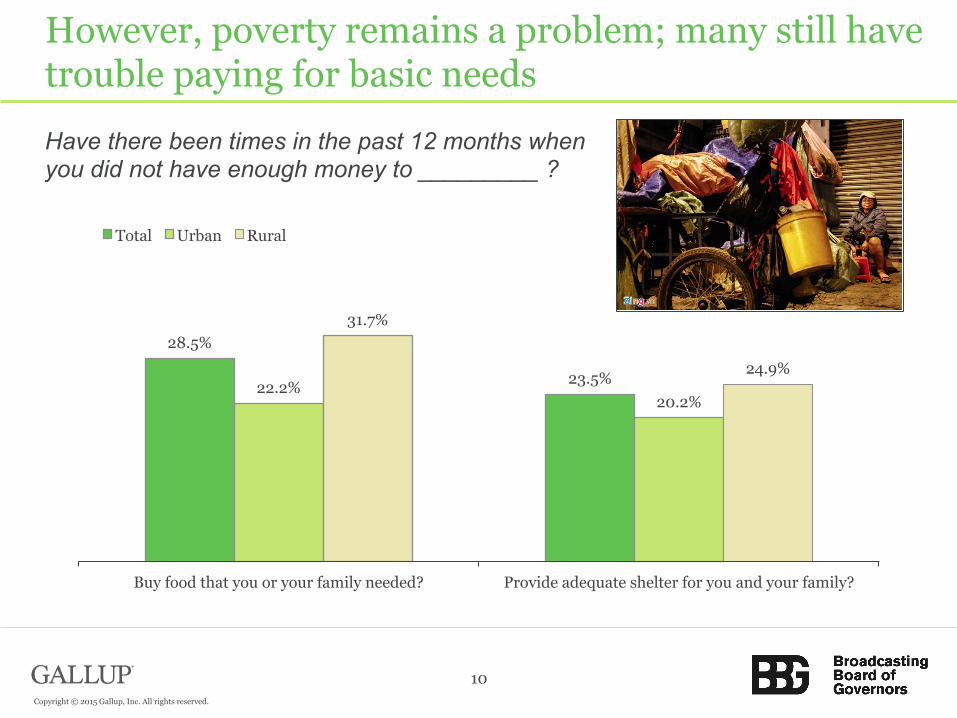
Have there been times in the past 12 months when you did not have enough money to _________ ?
28.5%
23.5% 22.2% 20.2%
31.7%
24.9%
Buy food that you or your family needed? Provide adequate shelter for you and your family?
Total Urban Rural
Copyright © 2015 Gallup, Inc. All rights reserved.
However, poverty remains a problem; many still have trouble paying for basic needs

11
14.9%
36.5%
13.3% 1.1%
34.2%
2014 Full-time for employer Full-time for self Part-time Unemployed Not in workforce
30% worried about losing
their job
Copyright © 2015 Gallup, Inc. All rights reserved.
Full-time self employment is the main source of livelihood
11% worried about losing their livelihood

12
46%
62%
55%
30%
48%
32% 35%
34%
43%
11% 12%
25%
49%
31%
14%
32%
36% 40%
10%
20%
30%
40%
50%
60%
70%
2006 2007 2008 2009 2010 2011 2012 2013 2014
Good time Bad time
Thinking about the job situation in the city or area where you live today, would you say that it is now a good time or a bad time to find a job?
Copyright © 2015 Gallup, Inc. All rights reserved.
Optimism about finding a job is still lower than pre-economic crisis levels
Good time
Bad time
13
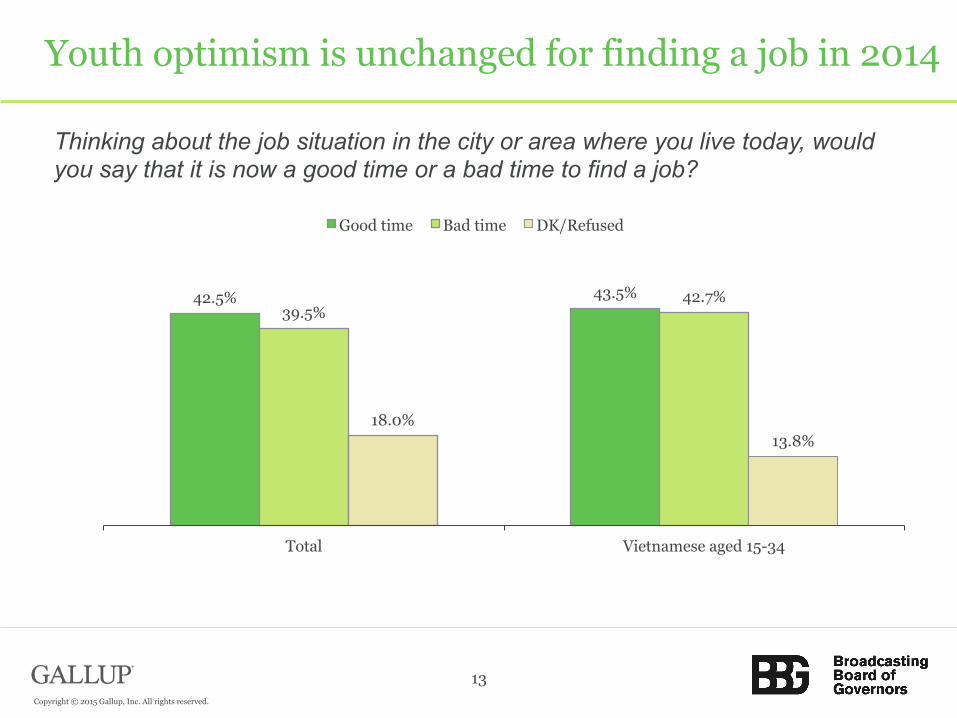
Thinking about the job situation in the city or area where you live today, would you say that it is now a good time or a bad time to find a job?
42.5% 43.5% 39.5%
42.7%
18.0% 13.8%
Total Vietnamese aged 15-34
Good time Bad time DK/Refused
Copyright © 2015 Gallup, Inc. All rights reserved.
Youth optimism is unchanged for finding a job in 2014
14
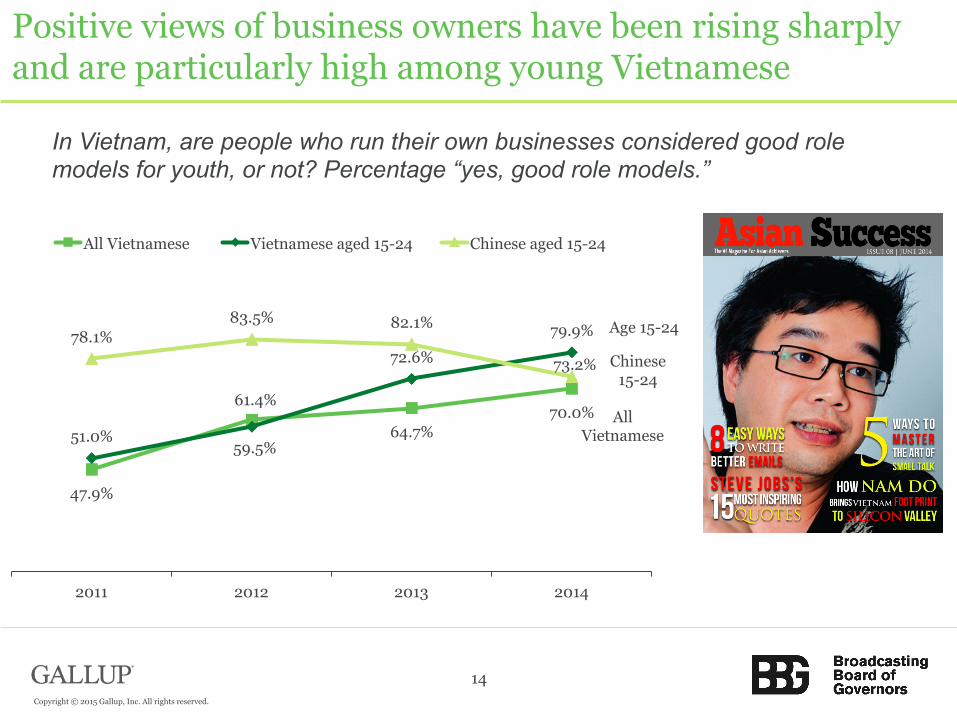
In Vietnam, are people who run their own businesses considered good role models for youth, or not? Percentage “yes, good role models.”
47.9%
61.4%
64.7% 70.0%
51.0% 59.5%
72.6%
79.9% 78.1% 83.5% 82.1%
73.2%
2011 2012 2013 2014
All Vietnamese Vietnamese aged 15-24 Chinese aged 15-24
Chinese 15-24
All Vietnamese
Copyright © 2015 Gallup, Inc. All rights reserved.
Positive views of business owners have been rising sharply and are particularly high among young Vietnamese
Age 15-24

15
Do you agree or disagree with the following statement: You would rather take a risk and build your own business than work for someone else.
The proportion of Vietnamese who prefer to take a risk and build their own business has shot upward since 2011
21.6%
32.3% 44.8%
68.2%
21.9% 31.0%
49.2%
74.7%
44.1% 40.7%
53.2% 62.3%
2011 2012 2013 2014
All Vietnamese Vietnamese aged 15-24 Chinese aged 15-24
Chinese 15-24
Copyright © 2015 Gallup, Inc. All rights reserved.
Vietnamese 15-24
All Vietnamese

Media Use in Vietnam
Copyright © 2015 Gallup, Inc. All rights reserved.
16

National Survey Background
Face-to-face survey of 3,000 randomly selected Vietnamese adults (15+) covering 54 of Vietnam’s 63 provinces and municipalities
Nationally representative of more than 58 million Vietnamese adults
Excluded some dangerous or very remote minority areas representing less than 15% of the population
Conducted from January to March 2015
Copyright © 2015 Gallup, Inc. All rights reserved.
17
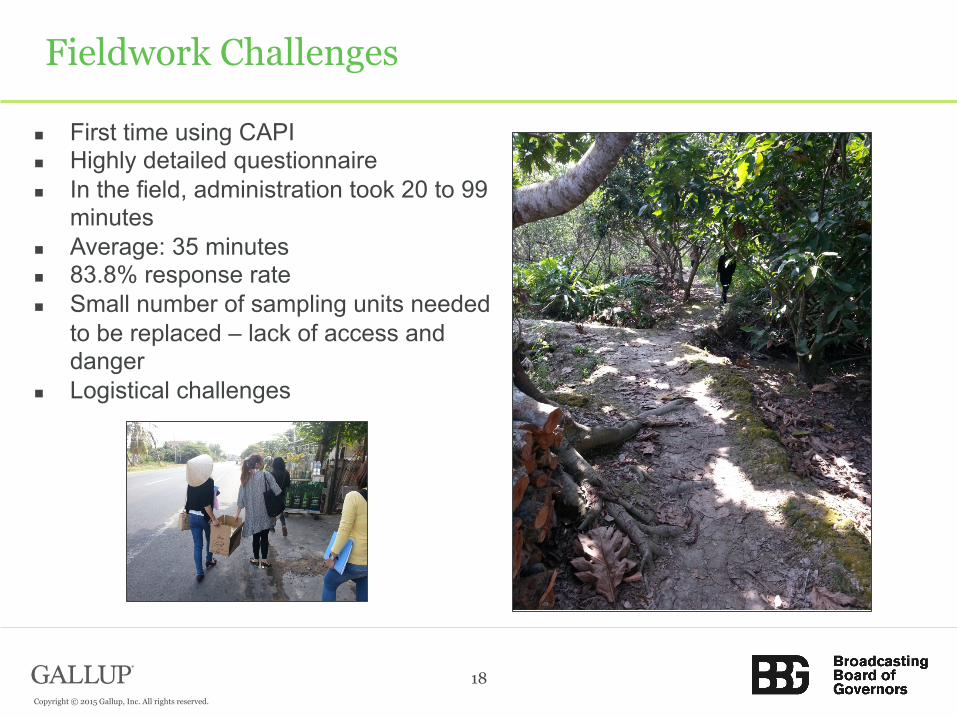
Fieldwork Challenges
First time using CAPI Highly detailed questionnaire In the field, administration took 20 to 99
minutes Average: 35 minutes 83.8% response rate Small number of sampling units needed
to be replaced – lack of access and danger
Logistical challenges
Copyright © 2015 Gallup, Inc. All rights reserved.
18

Media Environment
Copyright © 2015 Gallup, Inc. All rights reserved.
19
Photo: AFP
Photo: AFP
Photo: AFP
Photo: RFA

TV ownership is universal; mobile is close behind
Which of the following do you have working in your household?
97.9% 93.3%
42.9% 33.3%
16.1% 6.4%
98.4% 95.9%
58.9% 49.7%
15.7% 13.1%
97.7% 92.0%
35.2% 25.4%
16.3%
3.2%
Television set Mobile phone Internet access, which can include your
mobile
Computer Radio set iPad or tablet device
Total (n=2,000) Urban (n=904) Rural (n=2,096)
TV ownership is identical to 2012 Mobile ownership has grown by 10% since 2012; it was just over 50% in 2008 Radio ownership is down from 21.2%; Internet is up, but asked differently in 2012
Copyright © 2015 Gallup, Inc. All rights reserved.
20

TV remains most used media; Internet use is growing
96.9%
26.3% 27.6%
97.4%
38.8%
24.8%
TV Internet Radio
2012-2013 2015
Percentages of Vietnamese adults who use TV, Internet and radio at least weekly 60% of urban TVs receive
signals from cable Antennas and satellite
dishes are more common in rural areas; almost all dishes are one meter or less
Radio use is equally common in urban and rural areas, but trends upward with education
Listening to the radio on mobile phones is almost as common as listening on a radio set
Copyright © 2015 Gallup, Inc. All rights reserved.
21

Mobile dominates the Internet in Vietnam
Weekly Internet Users (n=1,061)
All Respondents (n=3,000)
Devices
Mobile phone 80.5% 31.3%
Desktop computer 45.5% 17.7%
Laptop computer 26.5% 10.3%
Tablet device, e.g., iPad, Google Nexus or Galaxy Tab 9.8% 3.8%
Languages
Vietnamese 99.4% 40.7%
English 16.0% 6.4%
Chinese 0.8% 0.3%
These are the access details among weekly Internet users and respondents overall.
Copyright © 2015 Gallup, Inc. All rights reserved.
22

Youngest and most highly educated use Internet more
When was the last time that you used the Internet? The Internet could have been accessed using a computer, tablet, or a mobile phone, using social media sites such as Facebook or Viber, or using mobile apps. (Used in the last seven days.)
38.8% 51.8%
32.6%
18.2%
39.4%
69.0% 78.5%
55.0%
20.0% 7.9%
Total Urban Rural Middle school
incomplete or less
Middle school
complete through
high school complete
Vocational training/
some college or
higher
15-24 25-34 35-54 55+
Copyright © 2015 Gallup, Inc. All rights reserved.
23
Education Age Area
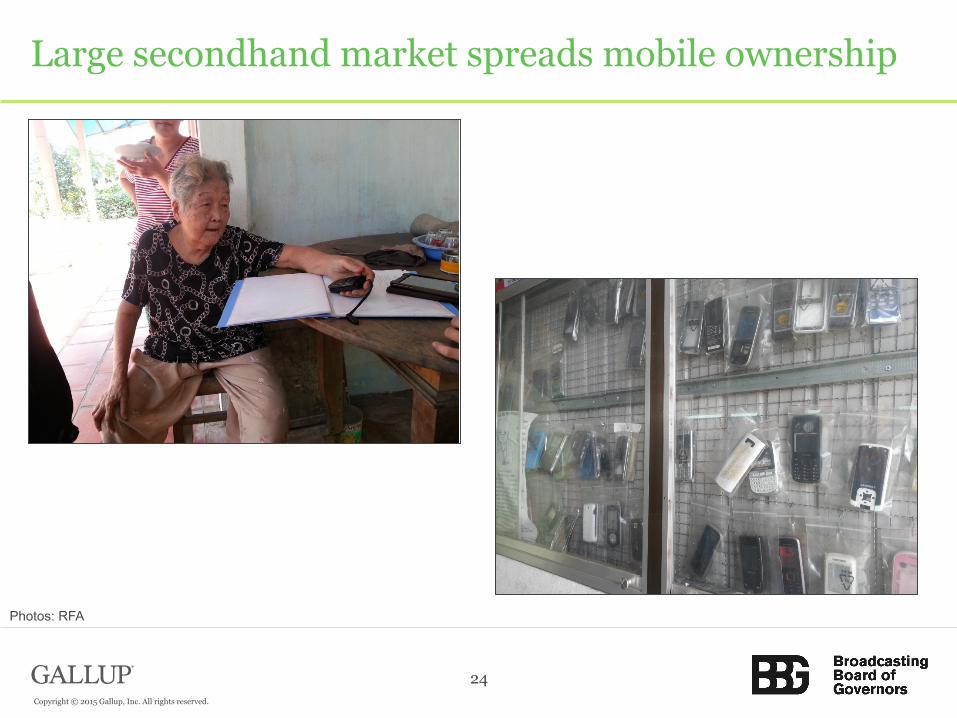
Large secondhand market spreads mobile ownership
Copyright © 2015 Gallup, Inc. All rights reserved.
24
Photos: RFA

Youngest cohort has the most advanced phones
Do you have a mobile phone that only receives calls and text messages, or do you own one that connects to the Internet, has mobile apps, or allows you to access social media such as Facebook?
36.6%
48.4%
30.9% 18.0%
37.2%
63.7% 65.8% 56.0%
21.2%
7.5%
Total Urban Rural Middle school incomplete or less
Middle school complete through high school complete
Vocational training/ some college or higher
15-24 25-34 35-54 55+
Top Smartphones: Nokia (29.5%); Samsung Galaxy (27.4%); iPhone (14.3%)
Copyright © 2015 Gallup, Inc. All rights reserved.
25
Education Age Area

Youngest cohort fuels mobile Internet
Total (n=3,000)
Age
15-24 (n=429)
Age 25-34
(n=713)
Age 35+
(n=1,858)
Made/received a phone call 87.9% 89.6% 95.0% 84.2%
Sent/received SMS 70.9% 86.2% 87.9% 57.5%
Accessed the Internet 31.1% 62.4% 48.0% 11.2%
Listened to the radio 10.8% 20.6% 13.2% 5.7%
Percentage among all Vietnamese adults who have used a mobile phone for each function in the past week.
Copyright © 2015 Gallup, Inc. All rights reserved.
26

International giants are very widely used, especially by young people
Age Age Total
Vietnamese Population (n=3,000)
15-24 (n=429)
25-34 (n=713)
35+ (n=1,858)
Total Vietnamese Population (n=3,000)
15-24 (n=429)
25-34 (n=713)
35+ (n=1,858)
Google 35.3% 71.3% 50.1% 14.4% Zing me 18.5% 47.4% 25.8% 3.8%
Facebook 29.9% 72.8% 40.9% 7.8% Zalo 18.4% 40.5% 29.3% 4.8%
YouTube 27.0% 59.7% 39.9% 8.2% Yahoo! 7.9% 17.2% 11.9% 2.4%
Which of the following Internet or mobile services have you used in the past seven days on any computer or mobile device?
There was evidence of Facebook blocking beginning in 2009, but not anymore. In 2013, Vietnam passed a law banning anti-government content on social media.
Copyright © 2015 Gallup, Inc. All rights reserved.
27

Local companies – Zalo and Zing are making headway
Both owned by ZNG Corporation, originally a gaming company
Zalo: Chatting app, very cute emoticons, first messaging app preloaded on Nokia phones, 2G, 3G and 4G; aggressive marketing campaign
Zing: More traditional social network; it was created in 2009
Photo: TechInAsia
Copyright © 2015 Gallup, Inc. All rights reserved.
28

Applications for same brands most used
First Response
Included Among Three Responses
Facebook 47.3% 71.9%
Google 16.0% 40.0%
Zalo 13.2% 44.6%
YouTube 3.0% 20.2%
Zing/Zing Me 1.6% 11.7%
What three mobile phone software apps do you use most frequently? Results among Vietnamese who say they use mobile apps. (n=830)
China’s giant app WeChat was barely mentioned.
Copyright © 2015 Gallup, Inc. All rights reserved.
29

News and Opinions
Copyright © 2015 Gallup, Inc. All rights reserved.
30
Photo: Mywork.com.vn
Photo: AFP
Photo: Adhoc
Photo: AFP

New media age gap extends to news gathering
Percentage who use each method/platform for news at least weekly.
Total (n=3,000)
Age 15-24
(n=429)
Age 25+
(n=2,571)
TV 95.8% 93.7% 96.4%
Friends/relatives 74.7% 78.3% 73.7%
Mobile 48.1% 69.1% 42.1%
Internet 37.9% 72.9% 27.9%
Radio 21.3% 25.2% 20.2%
Print media 19.3% 20.2% 19.0%
Copyright © 2015 Gallup, Inc. All rights reserved.
31

Young Vietnamese news sources are more diverse and digital…
Percentage Naming Source as Their First
Response, Total Population (n=3,000)
Percentage Naming Source Among Their Three Possible Responses
Total Population (n=3,000)
Age 15-24 (n=429)
Age 25-34 (n=713)
Age 35+ (n=1,858)
VTV 43.9% 64.8% 48.6% 58.4% 74.1% Your provincial TV station 16.0% 29.0% 22.8% 29.6% 31.4% Vietnam Television Corporation (VTC) 9.9% 14.5% 8.2% 14.1% 17.2%
Ho Chi Minh City TV (HTV) 7.6% 12.8% 11.8% 12.6% 13.3% 24 Gio 2.6% 7.7% 16.6% 12.7% 1.9% Ho Chi Minh City Television Choice Center (HTVC) 7.6% 7.6% 5.7% 7.9% 8.2%
Facebook 0.1% 4.7% 15.2% 4.6% 0.4% Dantri.com.vn 0.9% 4.2% 5.0% 6.4% 2.9% Kenh14.vn 3.4% 4.0% 14.6% 2.8% 0.2% Zing 1.2% 3.2% 11.4% 2.6% 0.2%
What are your three MOST important specific sources of news and information?
Copyright © 2015 Gallup, Inc. All rights reserved.
32

… and South China Sea and environment top concerns
Percentage naming each problem as their first response
Total Population Age
15-24 Age
25-34 Age 35+
Chinese territorial claims (i.e., South China Sea) 16.8% 17.3% 19.4% 15.6%
Crime/lack of safety 11.2% 9.6% 13.1% 7.3%
Environmental problems 8.5% 11.7% 7.3% 7.7%
Poverty 5.9% 2.8% 3.9% 8.2%
Unemployment/lack of jobs 5.6% 8.1% 7.5% 3.8%
Corruption 4.4% 2.3% 2.4% 6.0%
Education 3.3% 9.2% 2.3% 1.4%
Increasing food prices 3.0% 1.1% 3.9% 3.4%
Copyright © 2015 Gallup, Inc. All rights reserved.
33
Please tell me what, in your opinion, are the three most serious problems facing Vietnam. Asked on an open-ended basis; most commonly mentioned problems.

Young Vietnamese close to their elders on key issues
Copyright © 2015 Gallup, Inc. All rights reserved.
34
Photo: AFP
Please tell me your level of agreement with each statement. Percent “strongly agree.”
43.2%
35.0%
30.0%
60.0%
48.9%
27.5%
32.9%
62.7%
Our national leadership is committed to economic
fairness
Slowing growth to protect the environment is good
China's economic rise is not good for other Asian countries
Western countries should help resolve territorial disputes in
the South China Sea Age 15-24 (n=665)
Age 25+ (n=2,337)

Young Vietnamese are more open to non-official news
Copyright © 2015 Gallup, Inc. All rights reserved.
35
Please tell me your level of agreement with each statement. Percent “strongly agree.”
72.1%
45.1%
37.7%
72.6%
37.7%
45.6%
Our media should try to present Vietnam and Vietnamese in a positive
way
Overseas media cannot truthfully provide information on our country's
affairs
Personal blogs and microblogs are more believable than official news
Age 15-24 (n=665)
Age 25+ (n=2,337)

Conclusions
Vietnam has a highly engaged, optimistic and entrepreneurial population and a rapidly changing media environment.
Television remains the most used medium and the top source for news and information – especially from official TV.
Vietnam severely restricts its news media but Vietnamese want their media to present the country and its people in a positive light.
Vietnamese adults tend to say they trust blogs more than official news, though serious blogging is very risky.
Young people are pushing digital media forward by what they own and what they do digitally. Mobile is the dominant platform.
Google, Facebook and YouTube are very widely used. Across demographic segments, conflicts in the South China Sea are
seen as Vietnam’s most serious problem and Vietnamese overwhelming support of Western involvement in resolving this issue.
Copyright © 2015 Gallup, Inc. All rights reserved.
36

Upcoming BBG Research Series Events
Learn more about the BBG Research series at bbg.gov/bbgresearch
Have a question? Contact us at 202-203-4400 or [email protected]

This document contains proprietary research, copyrighted materials and literary property of Gallup, Inc. It is for the guidance of your company only and is not to be copied, quoted, published or divulged to others outside of your organization. Gallup® is a trademark of Gallup, Inc. All other trademarks are the property of their respective owners.
This document is of great value to both your organization and Gallup, Inc. Accordingly, international and domestic laws and penalties guaranteeing patent, copyright, trademark and trade secret protection protect the ideas, concepts and recommendations related within this document.
No changes may be made to this document without the express written permission of Gallup, Inc.
Copyright Standards
Copyright © 2015 Gallup, Inc. All rights reserved.
38