bbc r&d white paper whp189
TRANSCRIPT

Research White Paper
WHP 189
March 2011
A comparison of the carbon footprint of digital
terrestrial television with video-on-demand
Jigna Chandaria, Jeff Hunter, Adrian Williams
BRITISH BROADCASTING CORPORATION

BBC Research White Paper WHP 189
A comparison of the carbon footprint of digital terrestrial television with video-on-demand
Jigna Chandaria1, Jeff Hunter1, Adrian Williams2
1BBC R&D, 2Cranfield University
Abstract
Recent studies have estimated that television and related equipment account for 1.8% of global greenhouse gas (GHG) emissions and Information and Communication Technology is responsible for 2% of global GHG emissions. Both these sectors are forecast to grow as the developing world increases its uptake of technology.
This study estimates the carbon footprint of two different ways of watching television: using broadcast digital terrestrial television (DTT) and video-on-demand (VOD) over the Internet. It compares the two distribution methods and the corresponding consumer equipment. It uses the principles of life cycle assessment (LCA) to derive the carbon footprints using a bottom-up analysis of the system applied to the BBC’s television services. This was the only environmental impact considered and was mainly from electricity use. Equipment manufacturing was not included.
The main results showed that broadcast DTT has a smaller carbon footprint per viewer-hour than VOD for average sized audiences, but not with small audiences or for homes using an aerial amplifier. The largest environmental impact from watching television is from the consumer equipment. This amounts to 76% of the total for DTT and 78% and 37% for VOD using desktop and laptop computers respectively. The trend for larger screens could increase this although there is a parallel increase in viewing on small mobile devices. Programme-making contributes 12% to 35%.
Results were sensitive to the viewer numbers per display. Doubling the number of viewers per display reduces the carbon footprint by 44% for digital terrestrial television. For VOD, there was large uncertainty in the energy consumption data for the content delivery network and the Internet. However, this does not affect the main outcomes.
A future question is whether digital video recorders automatically recording the most popular programmes when they are broadcast, so that a viewer can watch them ‘on-demand’, would use less energy than video-on-demand over the Internet.
This document is partially based on work published in: Chandaria, Jigna (2010). A comparison of the carbon footprint of digital terrestrial television with video-on-demand, Masters thesis. Cranfield University. Cranfield.
Additional key words: environmental impact

© BBC 2011. All rights reserved. Except as provided below, no part of this document may be reproduced in any material form (including photocopying or storing it in any medium by electronic means) without the prior written permission of BBC Future Media & Technology except in accordance with the provisions of the (UK) Copyright, Designs and Patents Act 1988.
The BBC grants permission to individuals and organisations to make copies of the entire document (including this copyright notice) for their own internal use. No copies of this document may be published, distributed or made available to third parties whether by paper, electronic or other means without the BBC's prior written permission. Where necessary, third parties should be directed to the relevant page on BBC's website at http://www.bbc.co.uk/rd/pubs/whp for a copy of this document.
White Papers are distributed freely on request.
Authorisation of the Head of Broadcast/FM Research is required for publication.
iii
BBC Research White Paper WHP 189
A comparison of the carbon footprint of digital terrestrial television with video-on-demand
Jigna Chandaria1, Jeff Hunter1, Adrian Williams2
1BBC R&D, 2Cranfield University
Contents
Abstract .............................................................................................................................. i
Contents ........................................................................................................................... iii
List of figures ................................................................................................................... v
List of tables ..................................................................................................................... v
List of Abbreviations ....................................................................................................... vi
1 Introduction ............................................................................................................... 1
1.1 Background ........................................................................................................ 1
1.2 Life Cycle Assessment and Carbon Footprinting .............................................. 3
1.2.1 The Functional Unit .................................................................................... 4
1.3 Research aim, objectives and questions ............................................................. 4
1.4 The scope of the research ................................................................................... 4
2 Literature review ....................................................................................................... 5
3 Method ...................................................................................................................... 9
3.1 The system ......................................................................................................... 9
3.1.1 The Functional Unit .................................................................................. 10
3.1.2 System boundary ...................................................................................... 10
3.1.3 Assumptions ............................................................................................. 10
3.2 Data requirements ............................................................................................ 11
3.3 Data sources ..................................................................................................... 11
3.4 Programme production .................................................................................... 11
3.5 Distribution ...................................................................................................... 12
3.5.1 DTT .......................................................................................................... 12
3.5.2 Video-on-demand ..................................................................................... 13

iv
3.6 Consumption .................................................................................................... 15
3.7 Emission factors ............................................................................................... 16
4 Results ..................................................................................................................... 16
4.1 Input data ......................................................................................................... 16
4.1.1 Audience Data .......................................................................................... 17
4.1.2 Production Data ........................................................................................ 17
4.1.3 Distribution data ....................................................................................... 18
4.1.4 Consumption data ..................................................................................... 19
4.1.5 Emission factors ....................................................................................... 19
4.2 Production ........................................................................................................ 20
4.3 Distribution ...................................................................................................... 20
4.3.1 DTT distribution ....................................................................................... 20
4.3.2 Video-on-demand distribution .................................................................. 23
4.3.3 Comparing DTT and IP distribution ......................................................... 23
4.4 Consumption .................................................................................................... 25
4.5 Overall results .................................................................................................. 26
4.6 Sensitivity analysis .......................................................................................... 27
4.7 Uncertainty of data ........................................................................................... 29
5 Discussion ............................................................................................................... 30
6 Conclusions ............................................................................................................. 33
7 References ............................................................................................................... 35
v
List of Figures
Figure 1: Power consumption as a function of television screen size. ............................. 2 Figure 2: GHG emissions from the use phase and production phase of three television
types. ................................................................................................................................. 7 Figure 3: A simplified television service .......................................................................... 9 Figure 4: The system in detail ........................................................................................ 10 Figure 5: The video-on-demand distribution chain in detail .......................................... 13 Figure 6: Carbon footprint for production per viewer-hour ........................................... 20
Figure 7: Emissions from DTT (not using an aerial amplifier). ..................................... 21 Figure 8: Emissions from DTT (not using an aerial amplifier). ..................................... 21
Figure 9: Emissions from DTT when using an aerial amplifier. .................................... 22 Figure 10: Emissions from DTT when using an aerial amplifier. .................................. 22 Figure 11: Emissions from video-on-demand. ............................................................... 23 Figure 12: Comparison of the carbon footprint per viewer-hour of DTT broadcast
channels with IP distribution, when not using an aerial amplifier ................................. 24
Figure 13: Comparison of the carbon footprint per viewer-hour of DTT broadcast
channels with IP distribution, when using an aerial amplifier. ...................................... 24 Figure 14: Comparison of different consumer devices. ................................................. 25 Figure 15: Overall comparison of the four different scenarios. ..................................... 26
Figure 16: The relationship between carbon footprint per viewer-hour for DTT and
video-on-demand and the size of the audience ............................................................... 32
List of Tables
Table 1: Input data related to audiences ......................................................................... 17
Table 2: Input data related to production........................................................................ 17
Table 3: Input data related to distribution ...................................................................... 18
Table 4: Input data related to consumer equipment ....................................................... 19
Table 5: Input data related to emission factors ............................................................... 19
Table 6: Results of sensitivity testing by halving and doubling each parameter ........... 28
Table 7: Sensitivity testing, making large changes to parameters .................................. 28
Table 8: Results of Uncertainty analysis ........................................................................ 30

vi
List of Abbreviations ADSL Asymmetric Digital Subscriber Line CDN Content Delivery Network or Content Distribution Network CO2e Carbon dioxide equivalent CRT Cathode Ray Tube DSLAM Digital Subscriber Line Access Multiplexer DTT Digital Terrestrial Television EuP Energy using Products GHG Greenhouse Gases HD High Definition ICT Information and Communication Technology IP Internet Protocol IPTV Internet Protocol Television ISDN Integrated Services Digital Network ISP Internet Service Provider LCA Life Cycle Assessment LCD Liquid Crystal Display MTP Market Transformation Programme OLED Organic Light Emitting Diode PAS 2050 PAS 2050 ―Specification for the assessment of the life cycle greenhouse gas
emissions of goods and services‖ See BSI (2008) PC Personal Computer PDP Plasma Display Panel RoHS Restriction of Hazardous Substances RP Rear Projection SD Standard definition SED Surface-conduction Electron-emitter Displays STB Set-Top Box TV Television VOD Video-on-Demand WEEE Waste Electrical and Electronic Equipment

1
1 Introduction
1.1 Background
A 2007 study for Ofcom (Forster et al) estimated that television and related peripherals
account for around 1.8% of global greenhouse gas (GHG) emissions. The International
Energy Agency (2009) forecast that, without technology improvements, global
electricity consumption from television sets will grow at approximately 5% per year
until 2030.
Television technology is always evolving. Starting from analogue terrestrial
broadcasting of a single channel of black and white television with mono sound nearly
eighty years ago, today we have a multitude of channels, high definition colour pictures
with surround sound, accessibility and interactivity features.
The consumer also has considerable choice in the way they receive television pictures.
Along with analogue terrestrial broadcasting, there is digital terrestrial broadcasting (the
main UK service is branded Freeview), satellite television, cable television and Internet
Protocol television (IPTV). In addition, the ability to transfer video over the Internet has
led to the launch of ‗video-on-demand‘ (VOD) services such as BBC iPlayer which
allow the viewer to watch a programme at a time of their choosing, free from the
constraints of the television channel schedulers, on their personal computer (PC) or
games console. Increasing numbers of handheld devices such as smart phones and tablet
PCs can also be used for viewing video-on-demand using Internet Protocol (IP)
delivery.
The UK is currently going through a process known as ‗digital switchover‘ where
analogue transmitters are being turned off and analogue television is being replaced
with digital terrestrial television (DTT). The existing DTT network is being converted
from its current low power network to a high power network which will increase
coverage from around 74% of households to at least 98.5% (BBC, 2009). The digital
switchover process started in 2008 and is scheduled to be completed in 2012, as one
region at a time is switched over. In order to convert analogue television sets to receive
DTT signals, an adaptor known as a DTT set-top box (STB) is required.
As well as changes to the broadcasting technology, there have also been changes to the
display technology. Cathode ray tube (CRT) televisions have been superseded by liquid
crystal display (LCD) televisions, plasma display panels (PDP) and rear projection (RP)
televisions which offer the viewer the possibility of larger screen sizes as well as being
much flatter and lighter than CRTs. As Figure 1 from the International Energy Agency
(2009) shows, the power consumption of a television display when switched on
increases with screen size. While CRTs and LCD displays have similar power
consumption, plasma displays have a higher power consumption both in absolute terms
and also relative to LCD displays of a similar size.

2
Figure 1: Power consumption as a function of television screen size. Source: International Energy Agency.
Note that axis labels for the screen area are from 2 000 – 12 000 square cm.
As television screen sizes have increased, the resolution of television pictures in what is
now known as standard definition (SD) is not sufficient. This has led to the introduction
of high definition (HD) pictures which have more pixels per frame.
Television technology will undoubtedly change in the future too. Already on the
horizon are 3D television and new display technologies such as organic light emitting
diode (OLED) displays and surface-conduction electron-emitter displays (SED).
While all of these innovations have clearly brought benefits to the viewer, such as better
picture and sound quality, a greater choice of channels etc., there has been little
discussion of the environmental impacts of the industry.
Potential environmental impacts of the television industry include greenhouse gas
emissions, resource use and water use in manufacturing, toxic pollutant emissions from
manufacturing and disposal, landfill, land use of the transmitter network etc.
A preparatory study (Fraunhofer IZM and PE Europe, 2007) for the EU Energy Using
Products (EuP) directive (EC, 2005) considered all environmental impacts from a
television display and found that power consumption in on-mode is the single most
significant environmental aspect of a television set. The EuP directive for televisions
(EC, 2009) states that ―Annual electricity consumption related to televisions was
estimated to be 60 TWh in 2007 in the Community, corresponding to 24 Mt CO2
emissions. If no specific measures are taken to limit this consumption, it is predicted
that electricity consumption will increase to 132 TWh in 2020.‖
3
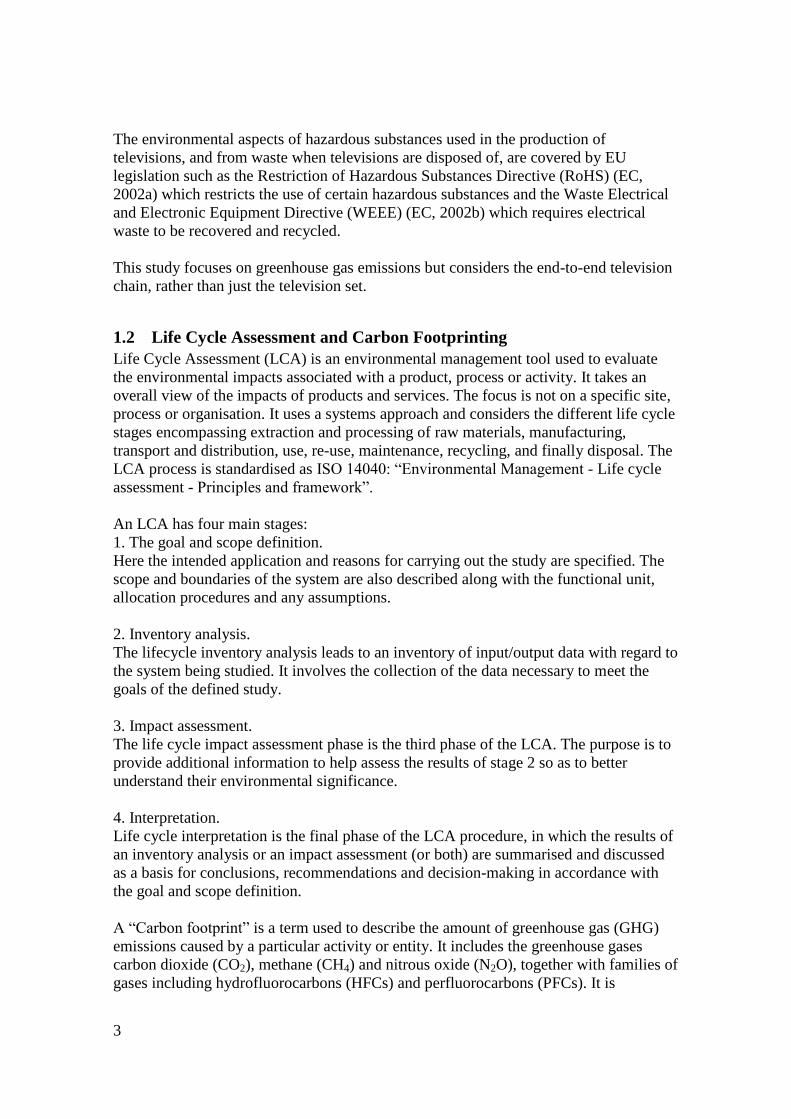
The environmental aspects of hazardous substances used in the production of
televisions, and from waste when televisions are disposed of, are covered by EU
legislation such as the Restriction of Hazardous Substances Directive (RoHS) (EC,
2002a) which restricts the use of certain hazardous substances and the Waste Electrical
and Electronic Equipment Directive (WEEE) (EC, 2002b) which requires electrical
waste to be recovered and recycled.
This study focuses on greenhouse gas emissions but considers the end-to-end television
chain, rather than just the television set.
1.2 Life Cycle Assessment and Carbon Footprinting
Life Cycle Assessment (LCA) is an environmental management tool used to evaluate
the environmental impacts associated with a product, process or activity. It takes an
overall view of the impacts of products and services. The focus is not on a specific site,
process or organisation. It uses a systems approach and considers the different life cycle
stages encompassing extraction and processing of raw materials, manufacturing,
transport and distribution, use, re-use, maintenance, recycling, and finally disposal. The
LCA process is standardised as ISO 14040: ―Environmental Management - Life cycle
assessment - Principles and framework‖.
An LCA has four main stages:
1. The goal and scope definition.
Here the intended application and reasons for carrying out the study are specified. The
scope and boundaries of the system are also described along with the functional unit,
allocation procedures and any assumptions.
2. Inventory analysis.
The lifecycle inventory analysis leads to an inventory of input/output data with regard to
the system being studied. It involves the collection of the data necessary to meet the
goals of the defined study.
3. Impact assessment.
The life cycle impact assessment phase is the third phase of the LCA. The purpose is to
provide additional information to help assess the results of stage 2 so as to better
understand their environmental significance.
4. Interpretation.
Life cycle interpretation is the final phase of the LCA procedure, in which the results of
an inventory analysis or an impact assessment (or both) are summarised and discussed
as a basis for conclusions, recommendations and decision-making in accordance with
the goal and scope definition.
A ―Carbon footprint‖ is a term used to describe the amount of greenhouse gas (GHG)
emissions caused by a particular activity or entity. It includes the greenhouse gases
carbon dioxide (CO2), methane (CH4) and nitrous oxide (N2O), together with families of
gases including hydrofluorocarbons (HFCs) and perfluorocarbons (PFCs). It is

4
generally measured in tonnes of carbon dioxide equivalent (CO2e) which converts the
impact of all other GHGs into the equivalent impact of carbon dioxide. General
convention has been to use a 100 year timescale for this – using different timescales
gives different equivalence factors (IPCC, 2006).
Carbon footprinting can be considered a subset of LCA. Rather than evaluating all
potential environmental impacts of a system, it focuses exclusively on GHG emissions.
It does not consider any other potential environmental impacts e.g. biodiversity, water
use nor any other potential social and economic impacts e.g. labour standards, financial
cost.
Carbon footprinting has been formalised in the UK in PAS 2050 (BSI, 2008):
―Specification for the assessment of the life cycle greenhouse gas emissions of goods
and services‖. As it is a specification, it is subject to review and modification and its use
is not obligatory.
1.2.1 The Functional Unit
In order to compare systems, LCA characterises a system according to its function. The
functional unit is defined as ―the measure of performance which the system delivers‖. It
has to be clearly defined, measurable and relevant to input and output data.
1.3 Research aim, objectives and questions
The objectives of the study are:
To estimate the carbon footprint of an end-to-end television service.
To compare digital terrestrial television (DTT) broadcasting e.g.
Freeview with online delivery of video-on-demand e.g. BBC iPlayer.
To compare different types of consumer equipment in the home.
The study will be used:
To inform future strategy and decision making.
To focus environmental efforts on the areas of largest environmental
impact.
To uncover where more knowledge and research is required.
To develop a better understanding of the analysis techniques applicable.
1.4 The scope of the research
This research uses the BBC‘s television services as a case study. It compares one hour
of television from an average BBC television channel on DTT with one hour of
television from the BBC‘s video-on-demand service, BBC iPlayer. Other means of
distribution such as satellite television, cable television and live television on IPTV are
out of scope. The study considers several scenarios for consumer equipment used to
receive these services. Mobile phones, other handheld devices and games consoles are
out of the scope of this study.
5
It has been assumed that the entire infrastructure needed to provide a television service
is already in place and that it will remain in place afterwards. Therefore, manufacturing,
distribution, installation and disposal of the equipment required have not been
considered.
The structure of this paper is as follows: Section 2 reviews the existing literature in this
area, Section 3 describes the techniques used to calculate the carbon footprint, and
Section 4 presents the results. These are discussed in Section 5 and the concluding
remarks are in Section 6.
2 Literature review The main work considering the environmental impact of distributing and consuming
television content in the UK is a 2007 study for Ofcom (Forster et al, 2009). They
estimated the global GHG emissions from television and related equipment as
700 MtCO2e a year which is about 1.8% of global GHG emissions. Their case study on
DTT considered the main impacts of transmission and consumption and found that
energy in the use phase was the dominant impact. They concluded that energy
consumption in the use phase was the dominant environmental impact of the transmitter
network and estimated that its operating power is 2% of the national power
consumption of the consumer equipment. Their study did not consider television
production or internet distribution.
During planning for digital switchover, Ofcom commissioned a report (Karger et al,
2005) that found that the extra electricity consumption necessary to power ‗non-
voluntary conversion‘ set-top boxes (i.e. STBs for people who were forced to convert to
digital) was almost offset by the reduced transmission power required.
One of the most influential papers looking at the environmental impact of information
and communication technology (ICT) was the Smart 2020 report by the Climate Group
(2008) which found that 2% of global GHG emissions in 2007 were due to ICT and are
forecast to grow at 6% per year until 2020. They also found that materials and
manufacturing contribute around 25% of the overall ICT carbon footprint, with the rest
coming from its use.
Data on the energy use of the Internet is uncertain. Joseph Romm (2002) disputed Mills
and Huber‘s claims that 8% of US electricity consumption in 1999 was due to the
Internet as being based on flawed assumptions and says that 3% is a better estimate. In
2006, Taylor and Koomey estimated the energy intensity of the Internet to be 9–16
kWh1/GB of data transferred and this was updated by Weber et al (2008) to 7 kWh/GB
and by Teehan et al (2010) to 3.6 kWh/GB due to energy efficiency improvements.
Taylor and Koomey (2006) note that ―this increasing efficiency in terms of kWh/GB
does not come with declining total energy use, because it is largely the result of
1 1kWh = 3 600 000J

6
installing new equipment that uses more energy to deliver higher bandwidth‖.
The work of Baliga et al (2009a) models the Internet in order to estimate its energy
consumption. They show that, with current technology, energy consumption is
dominated by the access technology and uses 75 µJ/bit transferred2 (0.167 kWh/GB). In
future, as access through optical fibre networks increases, it is expected that users will
benefit from a greater bandwidth to the home and the energy used per bit transferred
will decrease to 2–4 µJ/bit. However, the additional traffic will result in greater energy
use in the core and metro/edge network.
There have been many studies (e.g. Gupta and Singh, 2003) looking at various
techniques to reduce energy consumption of the Internet. Feldmann (2010) summarises
the main approaches to saving energy used for the Internet as turning off unused
devices; aggregating traffic streams; adapting rates; network planning and
configuration; and consolidated usage. While these will improve energy intensity, it is
likely that the large growth in traffic that is forecast could cancel out any reduction in
total energy consumption.
Teehan et al (2010) found that much of the growth in Internet traffic in the future will
be due to online video. Their analysis shows that the energy requirements for online
video will grow and that the majority of it will be due to the network.
Baliga et al (2009b) consider the energy implications of two different network
architectures for VOD – a large number of data centres located close to customers and a
smaller number of data centres with a more extensive transmission network. They found
that replicating popular content in multiple data centres close to customers minimises
the total energy consumption and that rarely accessed material should be restricted to a
few data centres. This implies that a content distribution network, which caches popular
content in locations near customers, uses less energy than centrally hosting content.
Feldmann et al (2010) investigated three different approaches to distributing content
over the Internet – using centralised servers, a content distribution network and a peer-
to-peer network. They found that a content distribution network used the least energy
overall, while a peer-to-peer network minimises the energy cost to the service provider
by pushing it onto their customers.
There have been several studies investigating the benefits of ICT for dematerialisation
and comparing digital delivery with physical delivery e.g. books (Kozak and Keoleian,
2003), academic journals (Gard and Keoleian, 2002), music (Turk et al, 2003; Weber et
al, 2010). In all cases, there are environmental advantages to the digital delivery
methods. However, the overall results are highly dependent on the assumptions made
about consumer behaviours.
A Philips case study (Intellect, 2008) considers the reduction in GHG emissions by
substituting DVDs with VOD. Philips estimated that 6.6 million kg CO2 would be saved
2 1 Byte(B) = 8 bits(b)

7
a year in Europe through not travelling to buy or rent DVDs, 181 900 kg CO2 a year
from manufacturing fewer DVDs and 113.5 million kg CO2 emissions per year from the
energy use of a DVD player. The case study does not mention what the impacts of VOD
are.
There have been many studies looking at the energy use of consumer equipment
(International Energy Agency, 2009). One aspect that has been the subject of much
attention is standby power (International Energy Agency, 2001; Rosen and Meier,
2000). Rosen and Meier (2000) found that 23% of the energy use of television is while
the devices are not active i.e. when they are in standby.
The EU commissioned preparatory studies for each product category for the Energy
using Products (EuP) directive (EC, 2005).
The study for television sets (Fraunhofer IZM and PE Europe, 2007) includes an
assessment of different television types and shows that energy when on is the single
biggest environmental impact and that production also had a significant impact. All
other life cycle phases have only minor impact. Figure 2 shows the GHG emissions
from the use phase and production phase for a 32-inch LCD television, a 42-inch
plasma television and 29-inch CRT television as estimated by this study.
Figure 2: GHG emissions from the use phase and production phase of three television types. Source of data:
Fraunhofer IZM and PE Europe (2007)
Feng and Ma‘s LCA study (2009) of television sets in China found that the 68% of
GHG emissions throughout the lifecycle were due to the use phase and 21% due to
production of manufacturing materials.
Hischier and Baudin (2010) conducted an LCA study of a plasma television and found
that the impact of the use phase is about two times higher than in the production phase.
However, this is very dependent on the electricity mix used. If there is more renewable
electricity in the mix, such as that used in Switzerland, the impact of the use phase is
about three times lower, so only about half of that in the production phase.
0
500
1000
1500
2000
2500
32" LCD TV 42" PDP TV 29" CRT TV
GH
G E
mis
sio
ns
in k
g C
O2
e
Use
Production

8
Berners-Lee (2010) gives the carbon footprint of watching an hour‘s television as
ranging from 34 g CO2e for a 15-inch LCD TV to 220 g CO2e for a 42-inch plasma TV.
These figures are based solely on the energy consumption of the television set and do
not include embodied emissions of the TV set or emissions from producing and
distributing the content.
The EuP preparatory study for simple set-top boxes (Harrison and Jehle, 2007) (i.e.
those without conditional access) shows that their biggest environmental impact derives
from the power consumption in the use phase.
Williams (2004) considered the lifecycle energy use of a desktop computer with a 17-
inch CRT monitor and found that 83% was due to production compared to 17% for
operation. For LCD monitors, Socolof et al (2001) found that sulphur hexafluoride used
in LCD module manufacturing is the largest contributor to LCD global warming
impacts (29%), followed by CO2
emissions from electricity generation during use
(28%). In contrast, the EuP study for computers and monitors (IVF Industrial Research
and Development Corporation, 2007) shows that energy in the use phase is the largest
environmental impact although production is also significant.
O‘Connell and Stutz (2010) calculated a carbon footprint of a Dell laptop and
considered its use in three different world regions by using the relevant distribution
route and region-specific grid mix for the use phase. They found that for use in the US
or in China, GHG emissions were slightly higher in the use phase than for
manufacturing, and that for the EU, emissions due to manufacturing were slightly
higher than the use phase.
The overall consensus from all these studies is that the energy in the use phase and
production are the largest contributors to the carbon footprint of consumer devices.
It is worth noting that the results of studies will vary for a number of reasons. As
different countries will have different GHG emission factors for their electricity supply,
the location of manufacture and location of use of the product will affect the resulting
GHG emissions (Hischier and Baudin, 2010).
Over time, as the power consumption of products decreases due to technology
improvements, the impact due to the use phase will decrease and therefore the relative
importance of the life cycle phases will change.
The lifetime of products may also change with time e.g. due to availability of new
technology. Fraunhofer IZM and PE Europe (2007) say that the lifetime of a television
used to be approximately 15 years. They assume 10 years for the purposes of their study
and suggest that the introduction of new technology along with falling sales prices will
lead to a further drop in the product lifetime.
Andrae & Andersen (2010) discuss the consistency of different LCA studies of
consumer products and found that subjective choices such as product lifetime and
system boundaries lead to inconsistencies. For example, different choices about the

9
number of hours each day that a product is used for will affect the relative importance of
the use phase in the analysis.
3 Method This study uses the principles of LCA and carbon footprinting as described in Section
1.2 and uses a bottom-up analysis of the system.
3.1 The system
A simplified representation of a television service is shown in Figure 3. It shows the
main components of a television service as production, distribution and consumption.
Production is the process of making a television programme and encompasses the
planning (pre-production), shooting (production) and editing (post-production) of the
programme. The output of this process is usually a final edit of the programme either on
tape or as a file on disk.
Distribution refers to the formatting, packaging and delivery of the programme to
viewers‘ homes. There are several methods to distribute a television service – terrestrial
broadcasting, satellite broadcasting, cable television and most recently over the Internet
using IPTV and video-on-demand services such as BBC iPlayer.
The consumption component refers to the process of receiving the programme from an
aerial, satellite, cable modem or broadband modem, decoding the signal and displaying
it on a screen to watch. There are several types of television receiver available e.g.
terrestrial, satellite, cable or IPTV. Some of these are standalone receivers known as set-
top boxes; others are built into the television set.
In this study, two different methods of distribution and their associated receivers will be
compared in terms of their carbon footprint: digital terrestrial television broadcasting
and video-on-demand over the Internet.
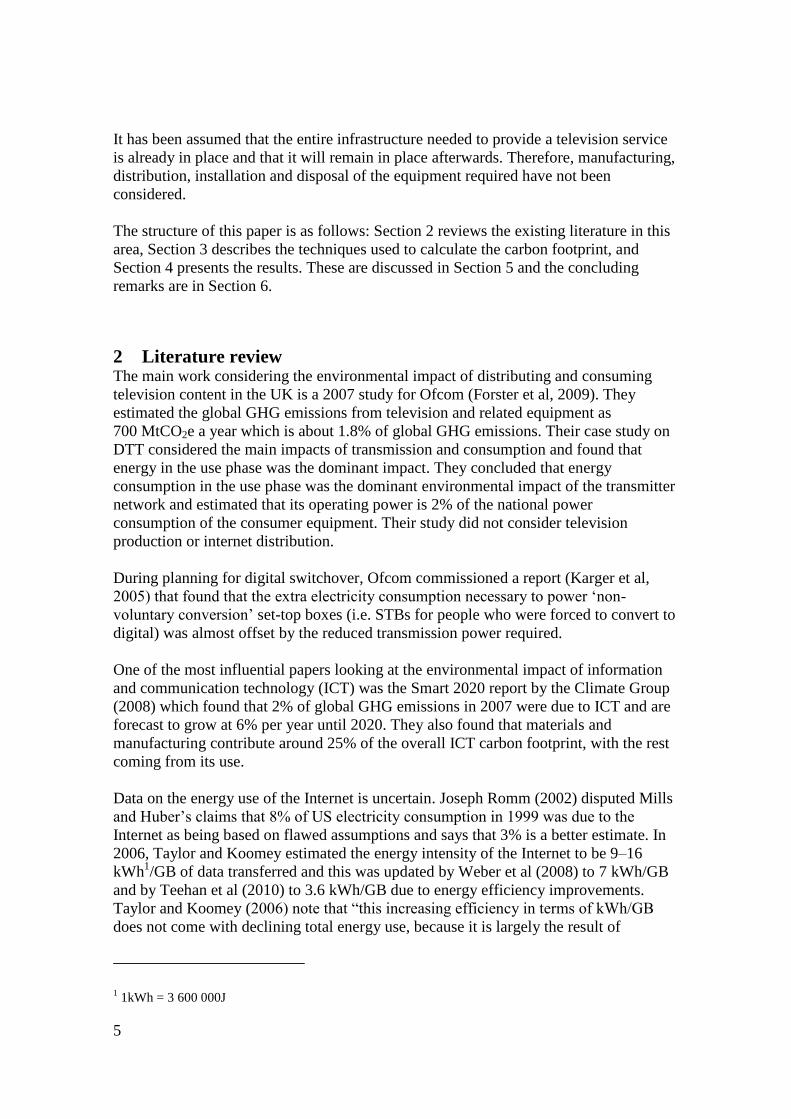
Figure 4 shows a more detailed breakdown of the system and the different equipment
combinations used in four different scenarios:
1. Watching DTT using a set-top box and television
2. Watching video-on-demand via an IP-connected set-top box and
television
3. Watching video-on-demand via a desktop PC and monitor
4. Watching video-on-demand via a laptop
Production Distribution Consumption
Figure 3: A simplified television service
10
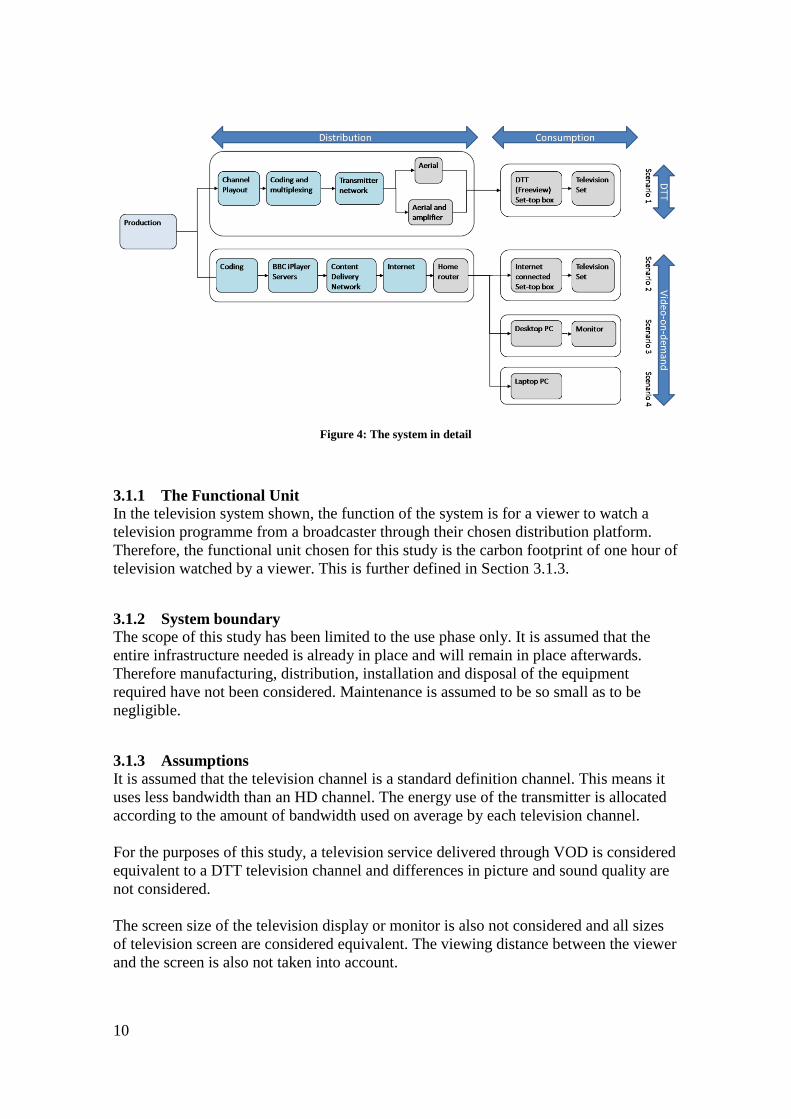
Figure 4: The system in detail
3.1.1 The Functional Unit
In the television system shown, the function of the system is for a viewer to watch a
television programme from a broadcaster through their chosen distribution platform.
Therefore, the functional unit chosen for this study is the carbon footprint of one hour of
television watched by a viewer. This is further defined in Section 3.1.3.
3.1.2 System boundary
The scope of this study has been limited to the use phase only. It is assumed that the
entire infrastructure needed is already in place and will remain in place afterwards.
Therefore manufacturing, distribution, installation and disposal of the equipment
required have not been considered. Maintenance is assumed to be so small as to be
negligible.
3.1.3 Assumptions
It is assumed that the television channel is a standard definition channel. This means it
uses less bandwidth than an HD channel. The energy use of the transmitter is allocated
according to the amount of bandwidth used on average by each television channel.
For the purposes of this study, a television service delivered through VOD is considered
equivalent to a DTT television channel and differences in picture and sound quality are
not considered.
The screen size of the television display or monitor is also not considered and all sizes
of television screen are considered equivalent. The viewing distance between the viewer
and the screen is also not taken into account.

11
Because the UK is currently switching from analogue to digital terrestrial broadcasting,
the energy consumed by the DTT network is changing as the process happens. As this
process is fully planned and committed to, the carbon footprint after switchover is
estimated and used in all calculations.
It is assumed that the viewer accesses the Internet using an asymmetric digital
subscriber line (ADSL) connection.
It is assumed that if an aerial amplifier is used, that it feeds only one television.
3.2 Data requirements
In order to calculate the carbon footprint, the main sources of greenhouse gas emissions
were identified for the use phase. The average carbon footprint of programme
production was supplied by the BBC and was already in terms of carbon dioxide
equivalent.
For all other components, estimates of electricity usage from the grid were required
which were then converted to carbon dioxide equivalent.
3.3 Data sources
This study is based on data from the BBC and its partners and suppliers, along with
publicly available data.
Several sources of data have been used. For programme production, results have been
obtained from the BBC‘s in-house production carbon calculator – see Section 3.4 for
more details. For coding and multiplexing, transmission and the BBC‘s web servers,
data was obtained from the BBC and its partners. Data for the content delivery network
and Internet was estimated from the literature. Data for the home appliances is from
Defra‘s Market Transformation Programme (MTP, 2009). As this dataset did not
include the home router and aerial amplifier, some typical values based on
measurements were used.
GHG emission factors for grid electricity came from Defra – see Section 3.7 for more
details.
3.4 Programme production
Production incorporates many different activities depending on the type of programme
being produced and this leads to large variability in its environmental impacts. For
example, a wildlife programme filmed on location around the world would be expected
to have much higher direct impacts than a studio-based panel show filmed in front of a
live audience. The BBC has developed a Production Carbon Calculator to estimate the
carbon footprint of making television programmes. It takes into account everything
from transport and accommodation to running office space and television studios.
An average figure for greenhouse gas emissions arising from producing an hour of
television was provided. This was converted into an equivalent figure per hour
broadcast by dividing by the number of times a programme is broadcast on average. The
12
carbon footprint per viewer-hour was estimated by dividing the carbon footprint per
hour broadcast by the average number of viewers per hour using all distribution
methods. The resulting value was also used for programme production for video-on-
demand.
3.5 Distribution
Two different methods of distribution are considered in this study – broadcasting using
DTT and VOD delivery over IP.
3.5.1 DTT
The DTT chain takes the channels as played out, encodes and formats the video in the
coding and multiplexing facility and transmits them across the UK. The coding and
multiplexing facility and transmitters are on 24 hours a day, every day of the year and
draw a constant amount of energy. The energy consumption of the channel playout
system is considered to be negligible.
3.5.1.1 Coding and multiplexing
In very simple terms, the coding and multiplexing facility takes individual television
channels and radio stations as an input, encodes them and bundles them into
‗multiplexes‘ of suitably formatted data, ready for transmission on DTT and satellite
television. The total emissions were halved as approximately half the equipment is used
for DTT and half for satellite television.
3.5.1.2 Transmitter network
The BBC‘s two DTT multiplexes are used to broadcast a mixture of standard definition
and high definition television channels along with radio stations. Emissions were
allocated by share of overall bandwidth.
The emissions from the DTT transmitters were estimated for the network after digital
switchover. The network consists of a number of main transmitters with many smaller
relay transmitters. Their total emissions were summed. The emissions were then
normalised by the number of hours of television transmitted in a year and the size of the
audience watching using DTT.
3.5.1.3 Aerials and amplifiers
The transmitted DTT signal is received in the home using an aerial. As these are
passive, they do not require power. However, many aerial installations also have a
power amplifier to boost the signal. Whilst aerial amplifiers could be switched off when
not watching or recording television, in practice this is not a habit that viewers have. For
the purpose of this study they are assumed to always be on and are considered part of
the distribution chain. The total energy use of the power amplifiers has been adjusted to
account for the number of hours the television is on.

13
3.5.2 Video-on-demand
Figure 5 shows a more detailed view of the video-on-demand distribution chain. The
power consumption of the coding equipment is considered to be negligible.
Figure 5: The video-on-demand distribution chain in detail
3.5.2.1 BBC’s servers
The BBC has around 1500 servers which are used to support a variety of websites
including BBC iPlayer. As these servers are shared, it is not possible to say how many
are used for the BBC iPlayer service. For this study, it has been estimated that 40
servers would be needed to provide an equivalent video-on-demand service including
playout, content, metadata and authentication servers.
Actual meter readings were available for the power consumption of the BBC‘s 1500
servers. The energy consumption of the number of servers needed to provide an
equivalent video-on-demand service was calculated as a proportion of the total.
3.5.2.2 CDN
A content delivery network (CDN) is used to reduce the load on the BBC‘s content
servers by caching content. The BBC‘s servers are peered (privately connected) with the
CDN‘s origin servers. The CDN has many ‗edge servers‘ that cache copies of the
content. When users request content from the BBC‘s servers they are redirected to their
nearest CDN edge server. If this does not already hold a copy of the content in its cache,
it will request it from the origin server.
The internal infrastructure of a CDN is proprietary information and considered
commercially sensitive, as is their energy consumption. Therefore, it is necessary to
make a rough estimate by making some rather crude assumptions.
The number of edge servers that a CDN has is very large. For example, Huang et al
(2008) estimate that one CDN, Akamai, has 27,000 content servers and that another,
Limelight, has 4,100 servers. Qureshi et al (2009) gives the number of Akamai servers
as 40,000. The exact number is dependent on the configuration of the CDN and the
number is likely to be growing as more capacity is added over time.

14
The BBC is one of many users of a CDN and so it is difficult to calculate what
proportion of a CDN‘s energy usage should be allocated to the BBC iPlayer service.
The approach taken here is to estimate the equivalent number of edge servers required
to serve the peak edge bandwidth used by the BBC‘s content and to estimate their
power consumption. The peak bandwidth rather than average bandwidth is used, as the
CDN is provisioned to cope with peak demand each day; the rest of the time there is
excess capacity. The estimate is based on a Sun T5240 server which can serve 5 Gbits/s
and draws around 1kW, depending on its actual configuration.
The power consumption of the CDN‘s routers is not included here as by the nature of
the CDN, the most popular programmes will already have been cached by the edge
servers and therefore traffic through the routers is likely to be small.
3.5.2.3 Internet
From the content server, the video data is transferred across the Internet to the viewer‘s
home. The Internet is a global network of interconnected networks that transmits data
using the Internet Protocol (IP). Home users typically use a service from an Internet
Service Provider (ISP) to connect to the Internet.
Baliga et al (2009a) describe the Internet as consisting of three parts – the core network,
the metropolitan/edge network and the access network. The core network consists of a
small number of high-capacity routers situated in major population centres. These
routers connect the main nodes of the network together.
The metro/edge network connects the core network to the access network.
Depending on the structure of the CDN, their edge servers could be directly peered with
the ISP‘s metro/edge network, they could be connected though a large exchange such as
the London Internet Exchange or could connect to an Internet provider that is in turn a
provider to the end user‘s ISP.
The access network connects users‘ homes with the edge switch in the ISP‘s network.
There are various technologies for this e.g. dial up, asymmetric digital subscriber line
(ADSL), cable modem, integrated services digital network (ISDN). This study assumes
that the home user is connecting via ADSL. ADSL uses the copper wires originally
installed for the telephone service and uses a higher frequency band to transmit IP data.
The ISP uses a digital subscriber line access multiplexer (DSLAM) to connect a group
of customers to their network.
Due to the distributed nature of the Internet, it is difficult to obtain reliable estimates of
its energy consumption. As discussed in Section 2, there is a large variation in
estimates. Teehan et al (2010) estimate the energy intensity of the Internet as
3.6 kWh/GB (1.6 x 10⁻³
J/bit) which contrasts with Baliga et al (2009a)‘s estimate of
7.5 x 10⁻⁵
J/bit.
This study uses the findings from Baliga et al (2009a) on the basis of expert opinion.

15
They have shown that, at low access speeds, energy consumption is dominated by
access technology, in this case ADSL. Therefore, the energy consumption of the core
and metro/edge networks is deemed to be negligible.
ADSL access requires a DSLAM in the distribution chain and an ADSL modem in the
viewer‘s home. From the data in Baliga et al (2009a), a DSLAM is assumed to support
1008 customers and have a power consumption of 1.7 kW. The energy use of the
DSLAM is divided by the number of customers sharing the same DSLAM.
The Internet is used to transfer many kinds of data of which one part will be the video
data used to deliver VOD programmes to viewers. The proportion of video data to other
data is not known when both are being delivered simultaneously, so in order to make a
conservative estimate, all the energy use of the DSLAM per household per hour is
allocated to the VOD service.
3.5.2.4 Home router
In order to receive an ADSL service, viewers will have an ADSL router in their home.
Whilst home routers could be switched off when not in use, in practice most consumers
do not do so, so for the purpose of this study they are assumed to always be on. The
total daily energy use of the home router has been adjusted by the number of hours of
actual use (which is assumed to be the same as the desktop PC is on) to get the hourly
energy consumption doing useful work. As the proportion of video data to other data is
not known, all the energy use of the home router is allocated to the VOD service, when
the VOD service is being used.
As most of the infrastructure needed to deliver video over the Internet is already in
place for general use, it could be argued that the marginal impact is small. For example,
a viewer is likely to have their home router on all the time, whether or not they watch
video-on-demand over the Internet. For this study, the approach throughout has been to
estimate the average impact, rather than the marginal impact.
3.6 Consumption
Defra‘s Market Transformation Programme (MTP, 2009) provides data about the
energy consumption of many types of domestic appliance. This study has used their
data on television sets, terrestrial set-top boxes, desktop and laptop PCs and computer
monitors. The data includes on-power, standby power and the number of hours switched
on each day. It also takes account of existing and new stock, and the technology mix of
the stock and provides an overall weighted average for the annual energy consumption.
As this dataset did not include the home router and aerial amplifier, measurements were
made to obtain typical values.
The power consumption of an Internet-connected set-top box was assumed to be the
same as a Freeview set-top box.
It was estimated that an average of 1.46 people watch each television set, based on BBC
internal data. For laptops and computer monitors, it is assumed that only one person is
16
watching the display.
3.7 Emission factors
The BBC Production calculator uses GHG conversion factors provided by Defra for
grid electricity, gas consumption, transport etc. For consistency, the same emission
factors from Defra (2009) were used in this study.
A GHG emission factor of 0.54418 kgCO2e / kWh for grid electricity was used to
convert to CO2e. This is for electricity at the point of consumption and includes
transmission and distribution losses. It includes direct emissions of carbon dioxide,
methane and nitrous oxide but not indirect emissions such as those from production and
distribution of fuels.
Grid electricity is generated from a variety of fuel sources including coal, gas and
nuclear power. As these vary in the amount of greenhouse gas emissions they produce
when used to generate electricity, the greenhouse gas intensity of the grid varies
depending on the combination of fuels used. Therefore, the emission factor used is an
average figure for the UK for the last 5 years.
It is noted that the emission factors used in this study from 2009 only include direct
emissions. The emission factors released by Defra in 2010 include indirect emissions
but only became available during the study.
4 Results
4.1 Input data
The following tables show the input data used. No uncertainty values were available
from the data sources so these were estimated using expert opinion based on values in
Wiltshire et al (2009). Parameters with large natural variability or which have required
large assumptions to be made were assigned larger uncertainty factors. The uncertainty
factor used throughout is the coefficient of variation, i.e. standard deviation divided by
the mean. The uncertainty analysis is described in Section 4.7.

17
4.1.1 Audience Data
Table 1: Input data related to audiences
Source Uncertainty
factor
Total number of
hours of BBC TV*
watched by entire
population/year
26,000,000,000 viewer-hours BBC
Internal 5%
Proportion of
population whose
main TV viewing is
Freeview
36%
Derived
from
Ofcom
(2009)
10%
Average numbers of
viewers per UK
household
1.46 people BBC 10%
Average weekly
minutes of TV
streamed on BBC
iPlayer, per user, per
week
71 mins/user/week BBC iStats
(2010) 10%
BBC iPlayer TV
users per day 4,000,000 viewers
BBC iStats
(2010) 25%
* refers to BBC1, 2, 3, 4, CBBC, CBeebies and BBCHD so is equivalent to 5 24
hours/day channels since BBC3/CBBC and BBC4/CBeebies timeshare bandwidth.
From the above audience data relating to BBC iPlayer, the total number of viewer-hours
per year is calculated to be 246,000,000 viewer-hours/year.
4.1.2 Production Data
Table 2: Input data related to production
Source Uncertainty
factor
CO2e for production, average per
hour of programme produced. 10 tonnes CO2e
BBC
Internal 30%
Number of times a programme is
broadcast on average* 2
BBC
Internal 20%
*Note, this varies greatly depending on the channel and programme genre

18
4.1.3 Distribution data
Table 3: Input data related to distribution
Source Uncertainty
factor
Total power used by coding and
multiplexing facilities 400 kW BBC Internal 5%
Total power used by entire high
power DTT transmitter network per
multiplex
2000 kW BBC Internal 10%
Aerial amplifier – Unit energy
consumption 5 W
From
measurements 25%
Aerial amplifier – No of hours on
and being used 4.54 hrs/day
From no of
hours on of
Television 5%
Total power used by BBC servers 750 kW BBC Internal 10%
Overhead factor, to take account of
overhead from air-conditioning and
uninterruptible power supply
2 Expert
opinion 5%
Number of BBC servers 1500 approx BBC Internal 5%
Number of servers needed to provide
a service equivalent to BBC iPlayer 40 approx
Expert
opinion 50%
1 Sun T5240 can serve 5 Gb/s Expert
opinion 25%
Unit Energy Consumption of 1 Sun
T5240 server 1000 W Oracle (2010) 25%
Peak edge bandwidth 100 Gb/s BBC Internal 50%
Unit Energy Consumption of
DSLAM 1.7 kW
Baliga et al
(2009a) 15%
Number of people sharing one
DSLAM 1008
Baliga et al
(2009a) 5%
Home Router – Unit Energy
Consumption 5 W
From
measurements 25%
Home Router – No of hours on and
being used 10.79 hrs/day
From no of
hours on of
Desktop PC 15%

19
4.1.4 Consumption data
Table 4: Input data related to consumer equipment
Source
Uncertainty
factor
Terrestrial STBs – Unit
Energy Consumption 57.82 kWh/yr MTP (2009) 5%
Terrestrial STBs – No of
hours on 15.57 hrs/day MTP (2009) 5%
Televisions – Unit Energy
Consumption 240.31 kWh/yr MTP (2009) 15%
Televisions – No of hours on 4.54 hrs/day MTP (2009) 5%
Desktop PCs – Unit Energy
Consumption 313.83 kWh/yr MTP (2009) 10%
Desktop PCs – No of hours
on 10.79 hrs/day MTP (2009) 5%
Monitors – Unit Energy
Consumption 146.30 kWh/yr MTP (2009) 10%
Monitors – No of hours on 9.26 hrs/day MTP (2009) 5%
Laptop PCs – Unit Energy
Consumption 59.79 kWh/yr MTP (2009) 10%
Laptop PCs – No of hours on 8.07 hrs/day MTP (2009) 5%
4.1.5 Emission factors
Table 5: Input data related to emission factors
Source
Uncertainty
factor
Emission factor for grid
electricity 0.54418 kgCO2e/kWh
Defra
(2009) 1%
20
4.2 Production
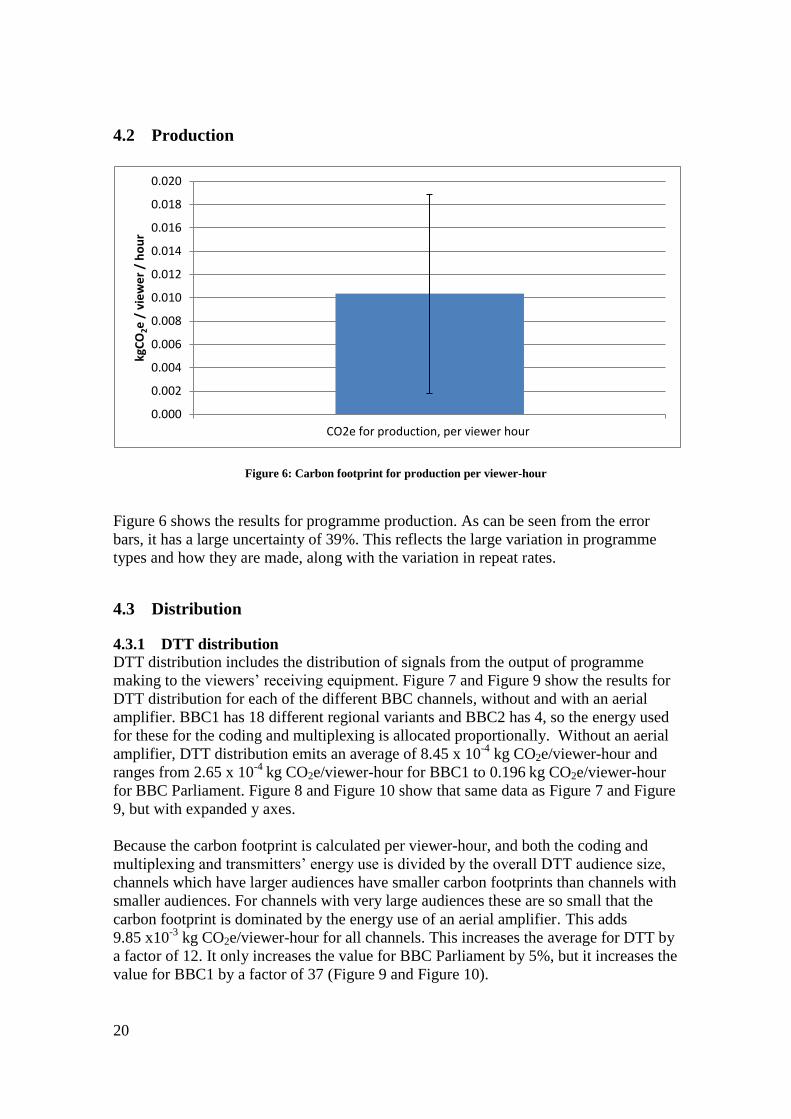
Figure 6: Carbon footprint for production per viewer-hour
Figure 6 shows the results for programme production. As can be seen from the error
bars, it has a large uncertainty of 39%. This reflects the large variation in programme
types and how they are made, along with the variation in repeat rates.
4.3 Distribution
4.3.1 DTT distribution
DTT distribution includes the distribution of signals from the output of programme
making to the viewers‘ receiving equipment. Figure 7 and Figure 9 show the results for
DTT distribution for each of the different BBC channels, without and with an aerial
amplifier. BBC1 has 18 different regional variants and BBC2 has 4, so the energy used
for these for the coding and multiplexing is allocated proportionally. Without an aerial
amplifier, DTT distribution emits an average of 8.45 x 10⁻⁴
kg CO2e/viewer-hour and
ranges from 2.65 x 10⁻⁴ kg CO2e/viewer-hour for BBC1 to 0.196 kg CO2e/viewer-hour
for BBC Parliament. Figure 8 and Figure 10 show that same data as Figure 7 and Figure
9, but with expanded y axes.
Because the carbon footprint is calculated per viewer-hour, and both the coding and
multiplexing and transmitters‘ energy use is divided by the overall DTT audience size,
channels which have larger audiences have smaller carbon footprints than channels with
smaller audiences. For channels with very large audiences these are so small that the
carbon footprint is dominated by the energy use of an aerial amplifier. This adds
9.85 x10⁻³
kg CO2e/viewer-hour for all channels. This increases the average for DTT by
a factor of 12. It only increases the value for BBC Parliament by 5%, but it increases the
value for BBC1 by a factor of 37 (Figure 9 and Figure 10).
0.000
0.002
0.004
0.006
0.008
0.010
0.012
0.014
0.016
0.018
0.020
CO2e for production, per viewer hour
kgC
O2e
/ v
iew
er
/ h
ou
r

21
Figure 7: Emissions from DTT (not using an aerial amplifier). The error bar shows the 95% confidence
interval.
As the results for BBC Parliament dominate the graph, it is shown again with a different
vertical axis in Figure 8.
Figure 8: Emissions from DTT (not using an aerial amplifier), using the same data as Figure 7, but with an
expanded y axis. The error bar shows the 95% confidence interval.
0
0.05
0.1
0.15
0.2
0.25kg
CO
2e
/ v
iew
er
/ h
ou
r
Transmitter network
Coding and multiplexing
0
0.002
0.004
0.006
0.008
0.01
kgC
O2e
/ v
iew
er
/ h
ou
r
Transmitter network
Coding and multiplexing
0.196

22
For viewers using an aerial amplifier:
Figure 9: Emissions from DTT when using an aerial amplifier. The error bar shows the 95% confidence
interval.
With a different vertical axis:
Figure 10: Emissions from DTT when using an aerial amplifier, using the same data as Figure 9 but with an
expanded y axis. The error bar shows the 95% confidence interval.
0
0.05
0.1
0.15
0.2
0.25
0.3kg
CO
2e /
vie
we
r /
ho
ur
Aerial amplifier
Transmitter network
Coding and multiplexing
0
0.005
0.01
0.015
0.02
0.025
kgC
O2e
/ v
iew
er
/ h
ou
r
Aerial amplifier
Transmitter network
Coding and multiplexing
0.206

23
4.3.2 Video-on-demand distribution
Figure 11: Emissions from video-on-demand. The error bars show the 95% confidence interval.
Figure 11 shows the results for IP distribution of video-on-demand. It has a carbon
footprint of 0.009 kg CO2e/viewer-hour. As can be seen, the greenhouse gas emissions
are dominated by those of the home router.
4.3.3 Comparing DTT and IP distribution
Figure 12 and Figure 13 show a comparison between different broadcast channels and
video-on-demand over IP. The channels with the largest audience sizes have the
smallest carbon footprint. BBC Parliament which has the smallest audience has a
significantly larger carbon footprint than all the other channels.
How IP delivery of video-on-demand compares to a DTT channel depends on the
audience of the DTT channel and whether or not an aerial amplifier is used.
0.000
0.002
0.004
0.006
0.008
0.010
0.012
0.014
0.016
IP distribution
kgC
O2e
/ v
iew
er
/ h
ou
r
Home router
DSLAM
CDN
BBC's servers

24
Figure 12: Comparison of the carbon footprint per viewer-hour of DTT broadcast channels with IP
distribution, when not using an aerial amplifier
Figure 13: Comparison of the carbon footprint per viewer-hour of DTT broadcast channels with IP
distribution, when using an aerial amplifier.
0
0.005
0.01
0.015
0.02
0.025
0.03
0.035
0.04
0.045
0.05kg
CO
2e
/ v
iew
er
/ h
ou
r
0
0.005
0.01
0.015
0.02
0.025
0.03
0.035
0.04
0.045
0.05
kgC
O2e
/ v
iew
er
/ h
ou
r
0.206
0.196

25
4.4 Consumption
Figure 14 shows a comparison of the carbon footprint of the consumer equipment used
in the following four different scenarios, as shown previously in Figure 4.
1. Watching DTT using a set-top box and television
2. Watching video-on-demand via an IP-connected set-top box and
television
3. Watching video-on-demand via a desktop PC and monitor
4. Watching video-on-demand via a laptop
These results assume that 1.46 people are watching the television set on average and 1
person is watching the computer. The effect of changing this assumption is discussed in
Section 4.6.
Scenarios 1-3 have a carbon footprint of 0.067 kg CO2e/viewer-hour and Scenario 4 has
a carbon footprint of 0.011 kg CO2e/viewer-hour. This is because of the lower average
energy consumption of laptops, due to their smaller screen size and energy efficient
design.
Figure 14: Comparison of different consumer devices. The error bars show the 95% confidence interval.
0
0.01
0.02
0.03
0.04
0.05
0.06
0.07
0.08
0.09
0.1
Scenario 1: DTT-STB + TV
Scenario 2: IP-STB + TV
Scenario 3:Desktop PC +
Monitor
Scenario 4:Laptop
kgC
O2
e /
vie
we
r /
ho
ur
Laptop PC
Monitor
Desktop PC
Television set
STB
26
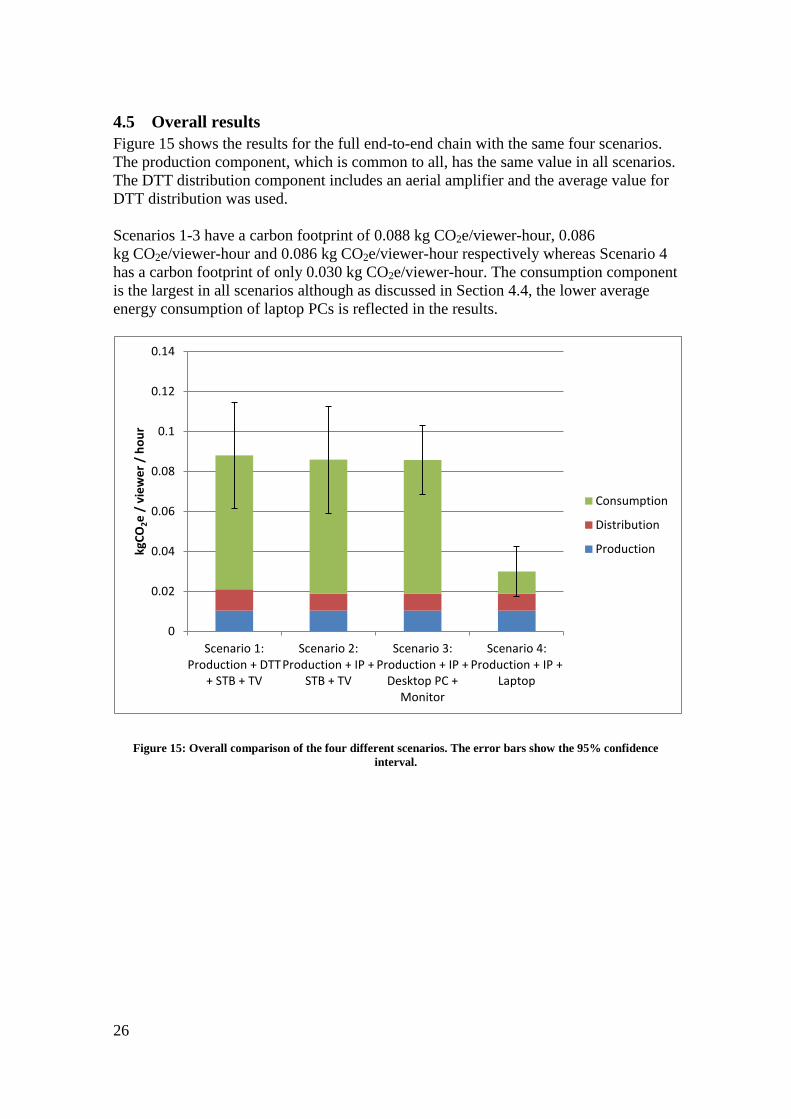
4.5 Overall results
Figure 15 shows the results for the full end-to-end chain with the same four scenarios.
The production component, which is common to all, has the same value in all scenarios.
The DTT distribution component includes an aerial amplifier and the average value for
DTT distribution was used.
Scenarios 1-3 have a carbon footprint of 0.088 kg CO2e/viewer-hour, 0.086
kg CO2e/viewer-hour and 0.086 kg CO2e/viewer-hour respectively whereas Scenario 4
has a carbon footprint of only 0.030 kg CO2e/viewer-hour. The consumption component
is the largest in all scenarios although as discussed in Section 4.4, the lower average
energy consumption of laptop PCs is reflected in the results.
Figure 15: Overall comparison of the four different scenarios. The error bars show the 95% confidence
interval.
0
0.02
0.04
0.06
0.08
0.1
0.12
0.14
Scenario 1:Production + DTT
+ STB + TV
Scenario 2:Production + IP +
STB + TV
Scenario 3:Production + IP +
Desktop PC +Monitor
Scenario 4:Production + IP +
Laptop
kgC
O2e
/ v
iew
er
/ h
ou
r
Consumption
Distribution
Production

27
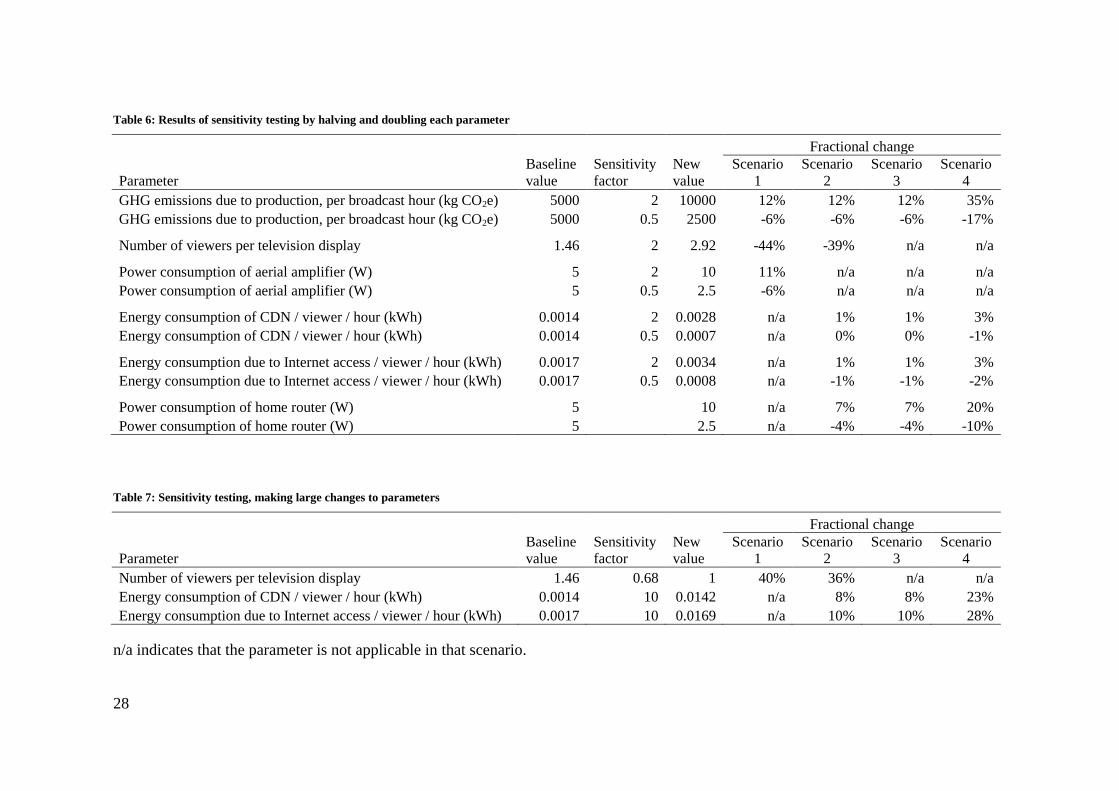
4.6 Sensitivity analysis
For the sensitivity analysis, a number of key variables were multiplied by a sensitivity
factor, while all other parameters were held constant, in order to see the effect on the
overall calculated results. The parameters chosen were selected to test assumptions
made about the model. Table 6 shows the results of sensitivity testing by halving and
doubling each of the parameters.
The quantity of GHG emissions due to production per broadcast hour was selected for
sensitivity analysis because both the emissions arising from production and the number
of times a programme is broadcast are very variable depending on the type of
programme.
A change to the GHG emissions from production affects all four scenarios but has the
greatest effect on Scenario 4 as the production component is relatively large. Halving
this parameter results in reductions of between 6% and 17% and doubling it increases
the result by 12–35%.
Doubling the average number of viewers per display decreases the carbon footprint of
Scenario 1 by 44% and of Scenario 2 by 39%. Since the consumption component forms
such a large part of the overall footprint, the result is very sensitive to this parameter.
As the estimates of energy consumed by the CDN and Internet are very uncertain, these
were selected for sensitivity testing. Halving and doubling each of these produced
changes from 0–3% on the carbon footprints of Scenarios 2–4.
The data on power consumption of the home router and aerial amplifier was from
measurements, as they were not part of the MTP dataset. As these are therefore more
uncertain, they were selected for sensitivity analysis. Doubling the power consumption
of the aerial amplifier increases the carbon footprint of Scenario 1 by 11% and halving
it decreases the carbon footprint by 6%. Doubling the power consumption of the home
router increases the carbon footprints of Scenarios 2–4 by 7–20% and halving it
decreases them by 4–10%.
Some of these variables were then changed by large amounts in order to test how much
they influenced the overall result. Table 7 shows the effect of making these large
changes.
The number of viewers per television display was reduced to 1 person – the same
number as has been assumed to be watching a PC. It has a very large effect on Scenarios
1 and 2, increasing the carbon footprints by 40% and 36% respectively, so that both
their carbon footprints are much higher than in Scenario 3. Therefore, it can be seen that
the overall results are very dependent on this parameter.
The results were shown not to be very sensitive to small changes in estimates of energy
consumed by the CDN and Internet. Increasing these by a factor of 10 i.e. 900% leads to
increases in total emissions from Scenarios 2, 3 and 4 of 8–23% for the CDN and10–
28% for the Internet element. Therefore, it can be seen that they do not have a large
effect on the overall results.
28
Table 6: Results of sensitivity testing by halving and doubling each parameter
Parameter Baseline
value Sensitivity
factor New
value
Fractional change Scenario
1 Scenario
2 Scenario
3 Scenario
4
GHG emissions due to production, per broadcast hour (kg CO2e) 5000 2 10000 12% 12% 12% 35%
GHG emissions due to production, per broadcast hour (kg CO2e) 5000 0.5 2500 -6% -6% -6% -17% Number of viewers per television display 1.46 2 2.92 -44% -39% n/a n/a Power consumption of aerial amplifier (W) 5 2 10 11% n/a n/a n/a
Power consumption of aerial amplifier (W) 5 0.5 2.5 -6% n/a n/a n/a Energy consumption of CDN / viewer / hour (kWh) 0.0014 2 0.0028 n/a 1% 1% 3%
Energy consumption of CDN / viewer / hour (kWh) 0.0014 0.5 0.0007 n/a 0% 0% -1% Energy consumption due to Internet access / viewer / hour (kWh) 0.0017 2 0.0034 n/a 1% 1% 3%
Energy consumption due to Internet access / viewer / hour (kWh) 0.0017 0.5 0.0008 n/a -1% -1% -2% Power consumption of home router (W) 5 10 n/a 7% 7% 20%
Power consumption of home router (W) 5 2.5 n/a -4% -4% -10%
Table 7: Sensitivity testing, making large changes to parameters
Parameter Baseline
value Sensitivity
factor New
value
Fractional change Scenario
1 Scenario
2 Scenario
3 Scenario
4
Number of viewers per television display 1.46 0.68 1 40% 36% n/a n/a
Energy consumption of CDN / viewer / hour (kWh) 0.0014 10 0.0142 n/a 8% 8% 23%
Energy consumption due to Internet access / viewer / hour (kWh) 0.0017 10 0.0169 n/a 10% 10% 28%
n/a indicates that the parameter is not applicable in that scenario.

29
4.7 Uncertainty of data
There are a number of causes of uncertainty in the data. Some processes have natural
variability – for example, as described in Section 3.4, different television programmes
vary greatly in their carbon footprint. Another example is the variation in energy
consumption of television sets. As shown in Figure 1, they vary greatly, and even for
those of the same technology and screen size, there is some variation. The energy
consumption of other consumer devices will also have natural variability. The GHG
emissions due to global Internet infrastructure will vary depending on its location as this
affects the electricity mix used.
Other sources of uncertainty are due to incorrect assumptions, an incomplete system
model and the quality of the data used. There are a number of sources of such
uncertainty in the data.
Firstly, the data for production is taken from the BBC‘s production carbon calculator.
As it is a new tool, the data is based on a small sample of programmes which may not
be representative of all productions.
Secondly, the data for the DTT transmitter is based on a forecast of power consumption
after digital switchover is complete. As it is a forecast, the actual power consumption
may be different, as changes take place during the switchover process.
The greatest source of uncertainty is in the IP distribution chain. As CDN providers do
not provide information about the structure or energy consumption of the CDN, it has
been necessary to make large assumptions in order to estimate the BBC‘s share of
energy use. Due to the distributed nature of the Internet, no reliable power consumption
data is available and therefore only an estimate is possible.
Both natural variability and other sources of uncertainty are taken into account by using
a mean estimate and a measure of the uncertainty.
Uncertainty is calculated by assigning a probability distribution to each input with the
mean being set to the input value used in the model and then using proprietary Monte
Carlo simulation software to produce a probability distribution for the output carbon
footprint. This calculates the mean and standard deviation of the overall carbon
footprint.
In this study, all inputs were assumed to have a normal probability distribution. Values
for the uncertainty factor (which is the coefficient of variation,
) were not provided with any of the source data so were
estimated. Table 1 – Table 5 show the estimated uncertainty factors for each input
parameter.
The 95% confidence interval is given by the mean ± 2 standard deviations. This is
shown by the error bars in Figure 15. The output value for each scenario is significantly
different from another if the uncertainties are independent and if the error bars do not
30
overlap.
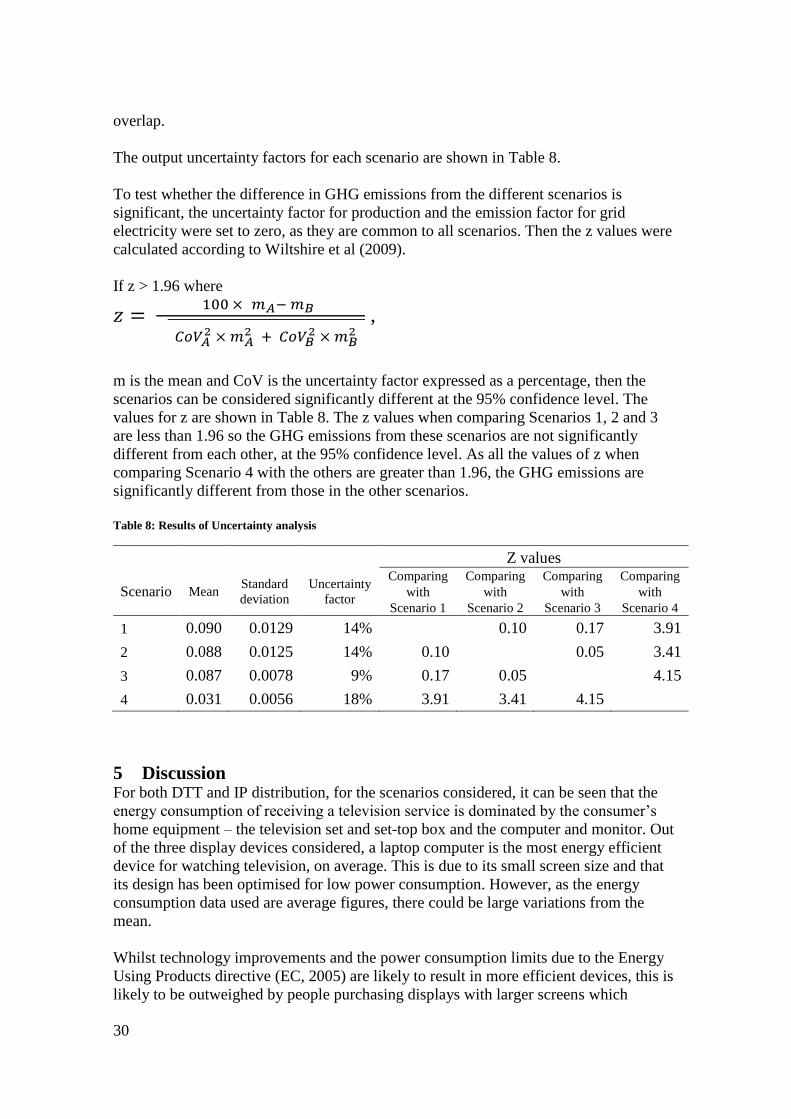
The output uncertainty factors for each scenario are shown in Table 8.
To test whether the difference in GHG emissions from the different scenarios is
significant, the uncertainty factor for production and the emission factor for grid
electricity were set to zero, as they are common to all scenarios. Then the z values were
calculated according to Wiltshire et al (2009).
If z > 1.96 where
,
m is the mean and CoV is the uncertainty factor expressed as a percentage, then the
scenarios can be considered significantly different at the 95% confidence level. The
values for z are shown in Table 8. The z values when comparing Scenarios 1, 2 and 3
are less than 1.96 so the GHG emissions from these scenarios are not significantly
different from each other, at the 95% confidence level. As all the values of z when
comparing Scenario 4 with the others are greater than 1.96, the GHG emissions are
significantly different from those in the other scenarios.
Table 8: Results of Uncertainty analysis
Z values
Scenario Mean Standard
deviation
Uncertainty
factor
Comparing
with
Scenario 1
Comparing
with
Scenario 2
Comparing
with
Scenario 3
Comparing
with
Scenario 4
1 0.090 0.0129 14% 0.10 0.17 3.91
2 0.088 0.0125 14% 0.10 0.05 3.41
3 0.087 0.0078 9% 0.17 0.05 4.15
4 0.031 0.0056 18% 3.91 3.41 4.15
5 Discussion For both DTT and IP distribution, for the scenarios considered, it can be seen that the
energy consumption of receiving a television service is dominated by the consumer‘s
home equipment – the television set and set-top box and the computer and monitor. Out
of the three display devices considered, a laptop computer is the most energy efficient
device for watching television, on average. This is due to its small screen size and that
its design has been optimised for low power consumption. However, as the energy
consumption data used are average figures, there could be large variations from the
mean.
Whilst technology improvements and the power consumption limits due to the Energy
Using Products directive (EC, 2005) are likely to result in more efficient devices, this is
likely to be outweighed by people purchasing displays with larger screens which

31
consume more power. However, a parallel trend for increased viewing on low power
handheld devices such as mobile phones and tablet PCs could reduce power
consumption/viewer-hour. Further work is needed to determine the carbon footprint of
watching television on mobile and handheld devices and how they compare to
televisions and computers. More research is also needed to understand whether
consumers are using these handheld devices instead of, or in addition to, watching
content on televisions and computers.
As technology changes, set-top boxes are likely to be replaced with digital video
recorders and HD set-top boxes that consume more power, although any increase in
overall power consumption will be dwarfed by that of the display.
The EU energy label regulation (EC, 1992) will soon include energy labels for
televisions and will help inform viewers when making purchasing decisions.
The results show that broadcast distribution is very efficient compared to video-on-
demand, in terms of GHG emissions per viewer per hour, when not using an aerial
amplifier. However, a channel with a small audience can have a much bigger carbon
footprint when broadcast than with Internet distribution.
The two are very different distribution mechanisms. Broadcast has a fixed energy cost,
irrespective of the size of the audience, whereas the energy cost of IP distribution
increases roughly linearly with audience size, as extra capacity needs to be added to the
network. This relationship is described in the diagram in Figure 16. It shows that for
programmes with large audiences, broadcasting is more efficient than IP distribution.
This is shown in Figure 12 where BBC Parliament has a larger carbon footprint per
viewer hour than IP distribution, due to its small audience. Figure 13 indicates that the
use of an aerial amplifier changes the crossover point, so that IP distribution has a
smaller carbon footprint per viewer-hour than all the DTT channels. This shows that
better data on the power consumption and the percentage of homes using an aerial
amplifier is needed. However, even if 75% of homes had an aerial amplifier, broadcast
delivery would still be more efficient than IP delivery, on average.
The same diagram in Figure 16 could be used per transmitter or relay to show that for
programmes with small audiences per transmitter e.g. in a sparsely populated area, IP
distribution may be more efficient.
Combining the two concepts, broadcasting a niche channel in a rural area may have a
higher carbon footprint/viewer-hour than IP distribution. Currently, audience data per
transmitter is not available, so this is difficult to calculate.

32
Figure 16: The relationship between carbon footprint per viewer-hour for DTT and video-on-demand and the
size of the audience
With IP distribution, the energy consumption of BBC iPlayer servers is small and
although their energy consumption may vary with utilisation, it will not have a large
effect overall. As demand for the service increases, the load on the CDN and network
increases, as does the energy cost.
A question for further investigation is whether viewers‘ digital video recorders
automatically recording the most popular programmes when they are broadcast, so that
they can be watched ‗on-demand‘ – a concept known as push video-on-demand (or
pushVOD) – would use less energy than requesting them on-demand over the IP
connection.
As only energy consumption in use has been considered in this study, the embodied
carbon of devices has been ignored. For devices such as set-top boxes which have a
relatively short lifetime, this could be significant.
Although the lack of data available on CDN and Internet energy consumption means
that there is a lot of uncertainty in the results, they still show where the biggest
environmental impacts are in the television service and where to focus environmental
efforts in the future.
In this study, it has been assumed that video-on-demand is equivalent to broadcast
television. In practice, most video-on-demand services such as BBC iPlayer are
marketed as a ‗catch-up‘ service for missed programmes. More information is needed as
to whether video-on-demand is being used instead of or in addition to broadcast
television and whether users find the experience equivalent.
Carb
on
footp
rin
t /
vie
wer
-hou
r
Size of audience
DTT
IP
Average Sized
Audience

33
If there was no growth in power consumption related to watching television, the carbon
footprint would decrease as the UK‘s electricity supply is ‗decarbonised‘ i.e. the GHG
intensity of it decreases. GHG emissions related to grid electricity have fallen from
0.78kg CO2e/kWh in 1990 to 0.54kg CO2e/kWh in 2007 (Defra, 2009).
It can be estimated from the MTP data (2009), that around 100,000 million viewer-
hours of TV are watched each year in the UK. By making a number of assumptions it is
possible to make a rough estimate of the UK national carbon footprint associated with
watching television.
This study estimates CO2e per viewer-hour for DTT. As equivalent figures are not
available for other means of distribution, it is assumed that they have the same carbon
footprint. Given that the largest element of the DTT carbon footprint is the television
set, this is reasonable.
If 1.46 viewers per display are assumed, then 88g/viewer-hour for DTT gives a national
carbon footprint of 8.8Mt CO2e. UK total GHG emissions3 are around 600Mt CO2e
(DECC, 2010), so this gives an estimate of 1.5% of UK national GHG emissions.
While this is a very rough calculation, and only considers the use phase, it does give an
indication of the order of magnitude associated with television watching. These figures
are similar to the 1.8% estimate from Forster et al (2009) for the fraction of global GHG
emissions.
While this study has used the principles of LCA and carbon footprinting, it is not a PAS
2050 compliant study. The emission factors used only take account of direct emissions
and not indirect emissions associated with producing and distributing fuel. PAS 2050
specifies that all emissions associated with the entire life cycle of the energy input be
taken into account. In addition, not all the data sources used in this study are from
primary sources and good quality secondary sources such as peer-reviewed publications
and published national guidelines e.g. the calculations for energy consumption of the
CDN are based on large assumptions and estimates. Further research would be needed
to produce a PAS 2050 compliant study.
6 Conclusions This study has estimated the carbon footprint of watching broadcast television using
digital terrestrial television and online delivery of video-on-demand. This was based on
the energy consumption in the use phase.
The carbon footprint for digital terrestrial television was found to be 0.088
kg CO2e/viewer-hour and for online delivery of video-on-demand ranges from 0.030–-
0.086 kg CO2e/viewer-hour.
3 It should be noted that these are the UK production emissions (e.g. energy use,
refrigerants, nitrous oxide from soils) and does not account for our total consumption,
which includes imported commodities.

34
It was found that the largest environmental impact from watching television is due to
the power consumption of the consumer equipment. This is 76% for digital terrestrial
television and 78% and 37% for video-on-demand using desktop and laptop computers
respectively.
Programme production contributes 12% to 35% and distribution contributes 10–28%.
Comparing the two distribution methods, it was found that the audience size of a digital
terrestrial channel and whether or not an aerial amplifier was used have a large effect on
which method appears to be the most energy efficient.
The overall results were found to be very sensitive to the number of viewers per display.
Doubling the number of viewers per display reduces the carbon footprint by 44% for
digital terrestrial television.
The trend for larger television screens which have higher power consumption could
increase the carbon footprint of watching television. EU regulations on power
consumption of televisions and labelling of televisions at point of sale may influence
their performance along with technology improvements.
While distribution is a small component of the overall carbon footprint, large growth in
the use of Internet distribution will lead to increases in energy consumption. Further
work is required to investigate whether techniques such as push video-on-demand,
where a viewer‘s digital video recorder automatically records programmes so that they
are available ‗on-demand‘, would reduce greenhouse gas emissions compared to online
delivery of video-on-demand.
The data on energy consumption of content delivery networks and the Internet is very
uncertain and more research is needed, particularly as large growth is forecast.
However, the sensitivity testing shows that the effect on the results is small.
Overall, the impact of watching television is around 1–2% of the UK national carbon
footprint, but is expected to grow.

35
7 References
Andrae A.S.G. and Andersen O., 2010. Life cycle assessments of consumer electronics
— are they consistent? The International Journal of Life Cycle Assessment, vol. 15, no.
8, pp 827-836
Baliga, J., Ayre, R., Hinton, K., Sorin, W.V., Tucker, R.S. , 2009a. Energy
Consumption in Optical IP Networks. Journal of Lightwave Technology, vol.27, no.13,
pp.2391-2403, July1, 2009
Baliga, J., Ayre, R., Hinton, K., Tucker, R.S., 2009b. Architectures for energy-efficient
IPTV networks. In Proceedings of Conference on Optical Fiber Communication 2009.
OFC 2009, pp.1-3, 22-26 March 2009
BBC, 2009. Available at www.bbc.co.uk/digital/tv/switchover.shtml (Last accessed 9th
August 2010)
BBC iStats, 2010. BBC iPlayer press pack: June 2010. Available at
www.bbc.co.uk/blogs/bbcinternet/2010/07/bbc_iplayer_press_pack_june_20.html (Last
accessed 23rd August 2010)
Berners-Lee M., 2010. How Bad Are Bananas?: The carbon footprint of everything,
Green Profile, London. ISBN: 978-1846688911
BSI, 2008. PAS 2050 - Assessing the life cycle greenhouse gas emissions of goods and
services. ISBN 978 0 580 50978 0
The Climate Group, 2008. SMART2020: Enabling the low carbon economy in the
information age. Available at www.smart2020.org (Last accessed on 24th
August 2010)
DECC, 2010. UK emissions statistics, 2009 provisional UK figures. Available at
http://decc.gov.uk/en/content/cms/statistics/climate_change/gg_emissions/uk_emissions
/uk_emissions.aspx (Last accessed 29th August 2010)
Defra, 2009. 2009 Guidelines to Defra / DECC‘s GHG Conversion Factors for
Company Reporting: Methodology Paper for Emission Factors. Available at
www.defra.gov.uk/environment/business/reporting/pdf/091013-guidelines-ghg-
conversion-factors-method-paper.pdf (Last accessed 9th August 2010)
EC, 1992. Council Directive 92/75/EEC of 22 September 1992 on the indication by
labelling and standard product information of the consumption of energy and other
resources by household appliances. Official Journal of the European Union L297,
13.10.1992, pp16–19.
EC, 2002a. Directive 2002/95/EC of the European Parliament and of the Council of 27
January 2003 on the restriction of the use of certain hazardous substances in electrical
and electronic equipment, Official Journal L37 , 13.02.2003, pp 19-23
36
EC, 2002b. Directive 2002/96/EC of the European Parliament and of the Council of 27
January 2003 on waste electrical and electronic equipment (WEEE). Official Journal of
the European Union L37, 13.2.2003, pp 24-38
EC, 2005. Council Directive 2005/32/EC of 6 July 2005 establishing a framework for
the setting of ecodesign requirements for energy-using products. Official Journal of the
European Union L191, 22.7.2005, pp 29-58
EC, 2009. Commission Regulation No 642/2009 of 22 July 2009
implementing Directive 2005/32/EC of the European Parliament and of the Council
with regard to ecodesign requirements for televisions. Official Journal of the European
Union L191, 23.7.2009 , pp 42-52
Feldmann A., Gladisch A., Kind M., Lange C., Smaragdakis G. and Westphal F.
Energy, 2010. Trade-offs among Content Delivery Architectures. In Proceedings of 9th
Conference of Telecommunications, Media and Internet Techno-Economics (CTTE
2010), Ghent, Belgium, June 2010.
Feng C., Ma X.Q., 2009. The energy consumption and environmental impacts of a color
TV set in China, Journal of Cleaner Production, vol. 17, issue 1, January 2009, pp 13-25
Forster C., Dickie I., Maile G., Smith H. and Crisp M. (2009) Understanding the
Environmental Impact of Communication Systems. Report for Ofcom. Available from
http://stakeholders.ofcom.org.uk/binaries/research/technology-research/environ.pdf
(Last accessed on 24th
August 2010)
Fraunhofer IZM and PE Europe, 2007. EuP Preparatory Studies ―Televisions‖ (Lot 5):
Final Report on Task 5 ―Definition of Base Cases‖ Available at www.ecotelevision.org
(Last accessed 9th August 2010)
Gard, D. L. and Keoleian, G. A., 2002. Digital versus Print: Energy Performance in the
Selection and Use of Scholarly Journals. Journal of Industrial Ecology, vol. 6, issue 2,
pp 115–132, April 2002
Gupta, M. and Singh, S. 2003. Greening of the internet. In Proceedings of the 2003
Conference on Applications, Technologies, Architectures, and Protocols For Computer
Communications (Karlsruhe, Germany, August 25 - 29, 2003). SIGCOMM '03. ACM,
New York, NY, pp 19-26.
Harrison R. and, Jehle C., 2007. Preparatory studies for Eco-design Requirements of
EuPs: Simple Digital TV Converters (Simple Set Top Boxes) Available at
www.ecostb.org (Last accessed 9th August 2010)
Hischier R, and Baudin I., 2010. LCA study of a plasma television device. The
International Journal of Life Cycle Assessment vol. 15, no.5, pp 428-438
Huang, C., Wang, A., Li, J. and Ross, K. W., 2008. Measuring and evaluating large-
scale CDNs. In Proceedings of the 8th ACM SIGCOMM Conference on internet
37
Measurement (Vouliagmeni, Greece, October 20 - 22, 2008). IMC '08.
Intellect, 2008. High Tech: Low Carbon The role of technology in tackling climate
change. Available at www.intellectuk.org/content/view/4464/84/ (Last accessed on 24th
August 2010)
International Energy Agency, 2001. Things that go blip in the night. Standby Power and
How to Limit it. OECD/IEA, Paris. ISBN 92-64-18557-7 2001
International Energy Agency, 2009. Gadgets and Gigawatts, OECD/IEA, Paris. ISBN
978-9264059535
IPCC, 2006. 2006 IPCC Guidelines for National Greenhouse Gas Inventories.
Intergovernmental Panel on Climate Change (IPCC), IPCC/OECD/IEA/IGES, Hayama,
Japan.
IVF Industrial Research and Development Corporation. 2007. EuP preparatory study
Lot 3, Personal Computers (desktops and laptops) and Computer Monitors Final Report
(Task 1-8) Available at www.ecocomputer.org (Last accessed on 24th
August 2010)
Karger S., Klein J., Reynolds M. and Sales B. 2005. Cost and power consumption
implications of digital switchover Report for Ofcom. Available at
http://stakeholders.ofcom.org.uk/binaries/research/tv-research/cost_power.pdf (Last
accessed on 24th
August 2010)
Kozak, G.L. and Keoleian, G.A., 2003. Printed Scholarly Books and E-book Reading
Devices: A Comparative Life Cycle Assessment of Two Book Options.In Proceedings
of IEEE International Symposium on Electronics and the Environment, 19-22 May
2003, pp 291 – 296
MTP, 2009. What-if? tool http://whatif.mtprog.com/ (Last accessed 9th
December 2009)
O'Connell, S., Stutz, M., 2010. Product carbon footprint (PCF) assessment of Dell
laptop - Results and recommendations. In Proceedings of 2010 IEEE International
Symposium on Sustainable Systems and Technology (ISSST), 17-19 May 2010
Ofcom, 2009. Ofcom Technology Tracker - Quarter 4 2009. Available at:
http://stakeholders.ofcom.org.uk/binaries/research/statistics/tech_Tracker_Q4_2009.pdf
(Last accessed on 24th
August 2010)
ONS, 2009. Social Trends No. 39 – 2009 edition. Office for National Statistics.,
Palgrave Macmillan, Basingstoke. ISBN 978-0-230-22050-8
Oracle, 2010. Sun SPARC Enterprise T5240 Server Power Calculator
www.oracle.com/us/products/servers-storage/sun-power-calculators/calc/t5240-power-
calc-153276.html (Last accessed on 24th
August 2010)
Qureshi, A., Weber, R., Balakrishnan, H., Guttag, J., and Maggs, B., 2009. Cutting the

38
electric bill for internet-scale systems. In Proceedings of the ACM SIGCOMM 2009
Conference on Data Communication (Barcelona, Spain, August 16 - 21, 2009).
SIGCOMM '09. ACM, New York, NY, 123-134.
Romm, J., 2002, The Internet and the New Energy Economy, in Pamlin D. (editor),
Sustainability at the speed of light, WWF Sweden pp 30-51. ISBN 91-89272-08-0
Rosen, K. and Meier A., 2000. Power Measurements and national energy consumption
of televisions and video cassette recorders in the USA. Journal of Energy, vol. 25, issue
3, March 2000, pp 219-232.
Socolof M.L., Overly J.G., Kincaid L.E. and Geibig J.R., 2001. Desktop Computer
Displays: A Life-Cycle Assessment. Center for Clean Products and Clean Technologies,
Pennsylvania. Available at www.epa.gov/dfe/pubs/comp-dic/lca/ (Last accessed on 24th
August 2010)
Taylor, C. and Koomey, J., 2008. Estimating energy use and greenhouse gas emissions
of Internet advertising. Working paper for IMC2. Available at
www.imc2.com/Documents/CarbonEmissions.pdf (Last accessed on 24th
August 2010)
Teehan, P., Kandlikar, M. and Dowlatabadi, H., 2010. Estimating the changing
environmental impacts of ICT-based tasks: A top-down approach, In Proceedings of
2010 IEEE International Symposium on Sustainable Systems and Technology (ISSST),
17-19 May 2010
Turk V., Alakeson V., Kuhndt M. and Ritthoff M., 2003. The environmental and social
impacts of digital music - A case study with EMI, 2003. Available at
www.forumforthefuture.org/files/DigitaleuropeMusiccasestudy.pdf. (Last accessed on
24th
August 2010)
Weber, C. L., Koomey, J. G. and Matthews, H. S., 2010. The Energy and Climate
Change Implications of Different Music Delivery Methods. Journal of Industrial
Ecology, In Press. doi: 10.1111/j.1530-9290.2010.00269.x
Williams, E.D., 2004. Revisiting energy used to manufacture a desktop computer:
hybrid analysis combining process and economic input-output methods, In Proceedings
of 2004 IEEE International Symposium on Electronics and the Environment, pp. 80- 85,
10-13 May 2004
Wiltshire, J., Tucker, G., Williams, A.G., Foster, C., Wynn, S., Thorn, R. and Chadwick
D., 2009. Scenario building to test and inform the development of a BSI method for
assessing GHG emissions from food. Defra research report FO0404. Appendix 1.