bb&t annual transportation conference
TRANSCRIPT

BB&T Annual Transportation ConferenceFebruary 10, 2010
James A. Squires
Executive Vice President Finance and
Chief Financial Officer

Overview
• 2009 Financial Results
• Markets and Outlook
• 2010 Capital Expenditures Plan

Overview
• 2009 Financial Results
• Markets and Outlook
• 2010 Capital Expenditures Plan

Railway Operating Revenue2009 vs. 2008
Revenue $ MillionsRevenue
Total - $8.0 Billion
Down $2.7 Billion, 25% vs. 2008
Volume ($2,020)
Fuel Revenue ($1,253)
Price/Mix $581
Total Change ($2,692)
Merchandise
$4,175
(24%)
Coal
$2,264
(27%)
Intermodal
$1,530
(26%)

Operating Results2009 vs. 2008 ($ Millions)
Favorable
(Unfavorable)
2009 2008 $ %
Railway Operating Revenues $ 7,969 $ 10,661 $ (2,692) (25%)
Railway Operating Expenses 6,007 7,577 (1,570) 21%
Income From Railway Operations $ 1,962 $ 3,084 $ (1,122) (36%)
Railway Operating Ratio 75.4 71.1 (4.3) (6%)
5

Operating Plan TrendsAugust 2008 – December 2009
5200
5500
5800
6100
6400
6700
7000
7300
0.0
0.5
1.0
1.5
2.0
2.5
3.0
3.5
We
ek
ly T
rain
Sta
rts
Da
ys
/Ca
r -
Ha
nd
lin
gs
/Ca
r -
10
0's
Mil
es
/Da
y
Days/Car Handlings/Car 100's Miles/Day Train Starts
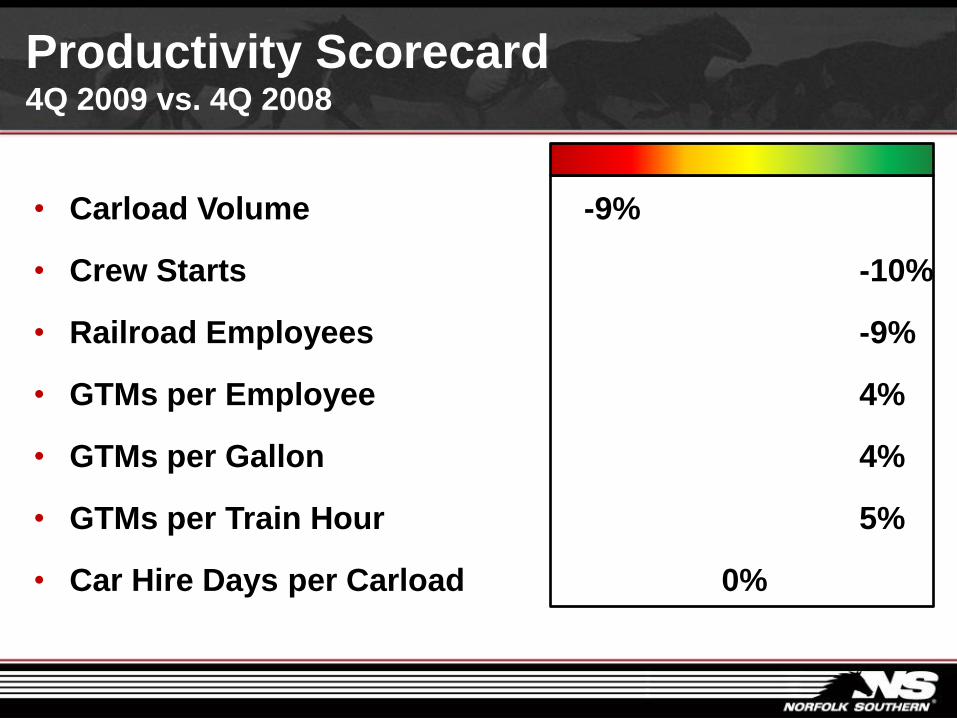
Productivity Scorecard4Q 2009 vs. 4Q 2008
• Carload Volume -9%
• Crew Starts -10%
• Railroad Employees -9%
• GTMs per Employee 4%
• GTMs per Gallon 4%
• GTMs per Train Hour 5%
• Car Hire Days per Carload 0%

Overview
• 2009 Financial Results
• Markets and Outlook
• 2010 Capital Expenditures Plan

Outlook – Business Portfolio
Chemicals
Agriculture
Export Coal
Domestic Intermodal
-Rebound in basic chemicals markets & project growth
-Increase in agri-fuels, export soybeans, and fertilizer
-Global demand for steel – China’s exit from coke market
-Truckload conversions

Chemicals - Fly Ash

Export Grain Opportunities
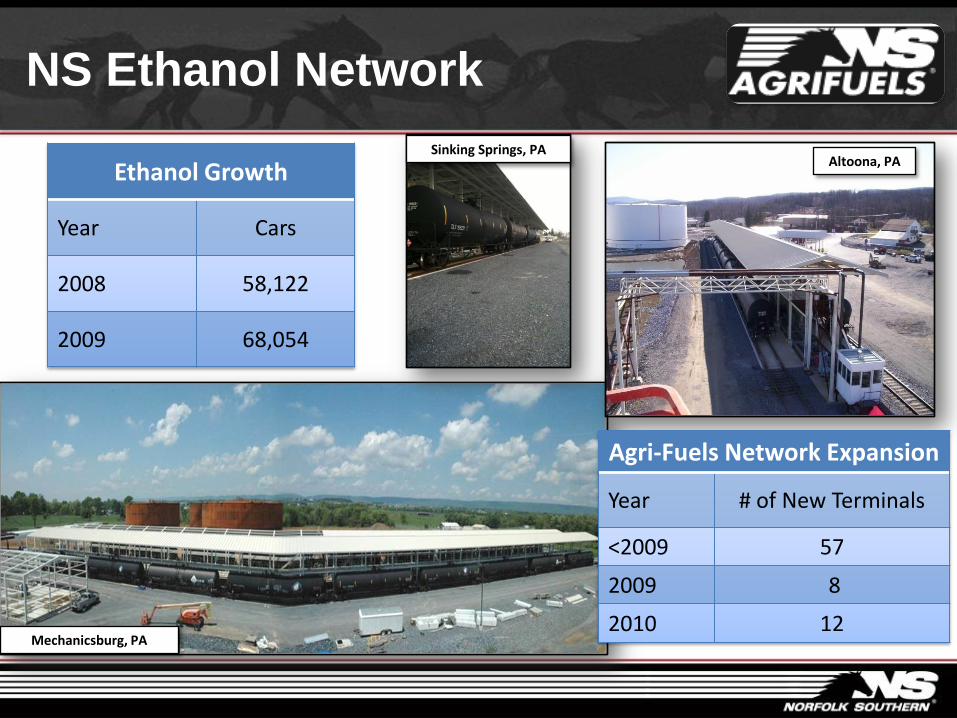
NS Ethanol Network
Mechanicsburg, PA
Altoona, PASinking Springs, PA
Ethanol Growth
Year Cars
2008 58,122
2009 68,054
Agri-Fuels Network Expansion
Year # of New Terminals
<2009 57
2009 8
2010 12
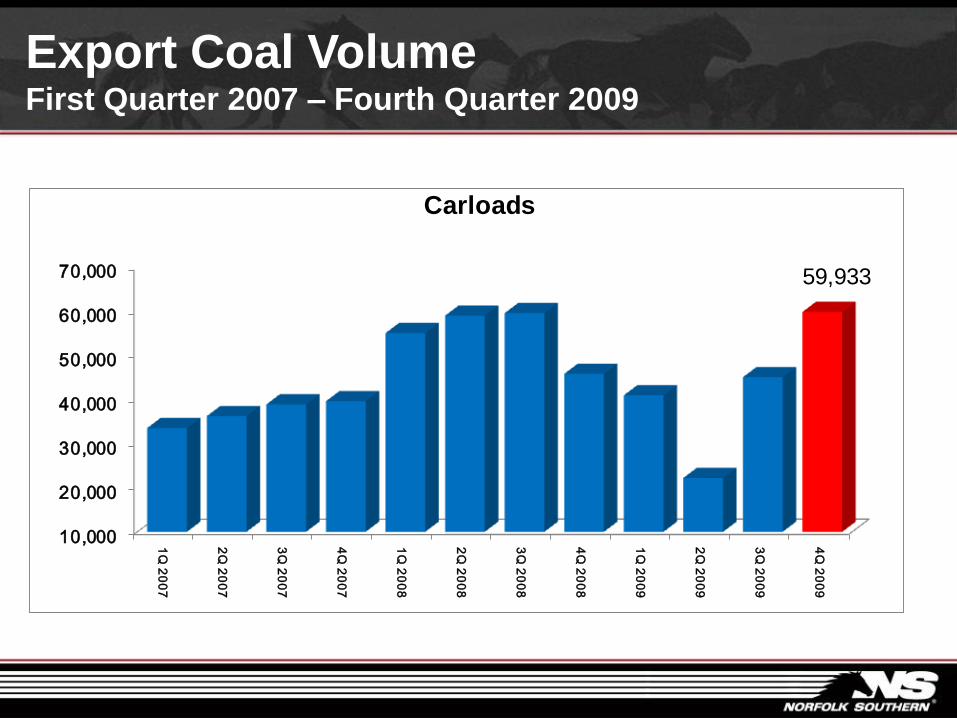
Export Coal VolumeFirst Quarter 2007 – Fourth Quarter 2009
10,000
20,000
30,000
40,000
50,000
60,000
70,000
1Q
20
07
2Q
20
07
3Q
20
07
4Q
20
07
1Q
20
08
2Q
20
08
3Q
20
08
4Q
20
08
1Q
20
09
2Q
20
09
3Q
20
09
4Q
20
09
59,933
Carloads

Export Coal Opportunities
• Strong Demand for Metallurgical
Coal Exports China - Strong Steel Production; Tight
Global Metallurgical Coal Supply
Brazil & Europe - Steel Production
Continues to Slowly Rebound
• Coal Business Group’s 2010
Business Plan Fueled Mainly by
Export Growth

Domestic Intermodal Market Drivers
• Ongoing Highway Conversions
• Continue to launch new products
& services
• Flat volume 2009 vs. 2008
despite recession
4Q 2009 volume up 5%
December 2009 volume up
13%

Charlotte
Birmingham
Memphis
Heartland Corridor
Meridian Speedway
MidAmericaCorridor
Crescent Corridor
Pan Am Southern
Titusville
NS’ 6 Corridor Strategy
Includes joint ventures with other carriers

Outlook – Business Portfolio
Chemicals
Agriculture
Export Coal
Domestic Intermodal
-Rebound in basic chemicals markets & project growth
-Increase in agri-fuels, export soybeans, and fertilizer
-Global demand for steel – China’s exit from coke market
-Truckload conversions
Steel
Domestic Met Coal
Utility Coal
Paper & Forest Products
Automotive
-Slowly improving domestic steel demand
-Lower stockpiles – second half recovery
-Improving housing market – project growth in paper
-Mixing Center redesign, increased auto production, and sales

Steel Market Drivers
• 2010 steel production
capacity at 65%, up from
40% in 2009
• 16,000 annualized carloads
of new steel business
• Domestic metallurgical coal
volume improving due to
increased coke production
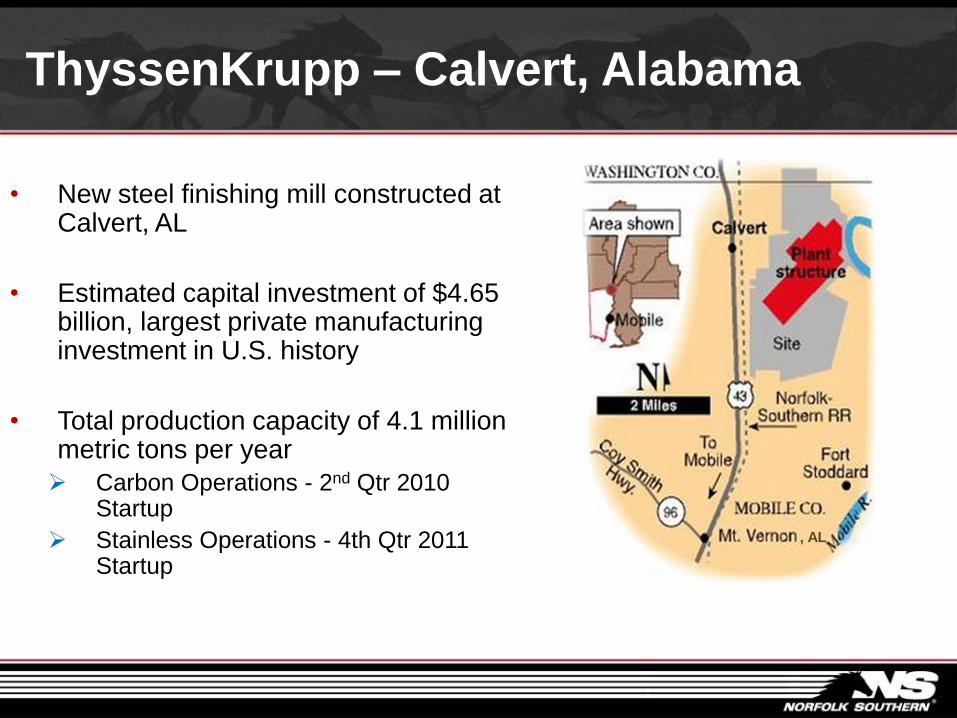
ThyssenKrupp – Calvert, Alabama
• New steel finishing mill constructed at Calvert, AL
• Estimated capital investment of $4.65 billion, largest private manufacturing investment in U.S. history
• Total production capacity of 4.1 million metric tons per year
Carbon Operations - 2nd Qtr 2010 Startup
Stainless Operations - 4th Qtr 2011 Startup
, AL

Utility Coal Market Drivers

Automotive Market Drivers
• North American Production
increases 28% to 10.9 million
• U.S. Sales increase 17% to
12.0 million
• Mixing Center Redesign
33,000 carload decline
• Impact of Toyota recall
uncertain

Outlook – Business Portfolio
Chemicals
Agriculture
Export Coal
Domestic Intermodal
-Rebound in basic chemicals markets & project growth
-Increase in agri-fuels, export soybeans, and fertilizer
-Global demand for steel – China’s exit from coke market
-Truckload conversions
Steel
Domestic Met Coal
Utility Coal
Paper & Forest Products
Automotive
-Slowly improving domestic steel demand
-Lower stockpiles – second half recovery
-Improving housing market – project growth in paper
-Mixing Center redesign, increased auto production, and sales
International Intermodal - Slow recovery in domestic and global economy

2010- A Snapshot
Gradual economic
improvement leads to
continued growth in core
markets
Strong project growth
Strong customer service
Continued pricing
improvement
70% of Book of Business
repriced for 2010
Price gains in excess of
rail inflation for the year
4Q 2008 – 4Q 2009 Units
Overview
• 2009 Financial Results
• Markets and Outlook
• 2010 Capital Expenditures Plan

Capital Expenditures($ Millions)
$1,178
$1,341
$1,558
$1,299$1,442
2006 2007 2008 2009 2010
budget
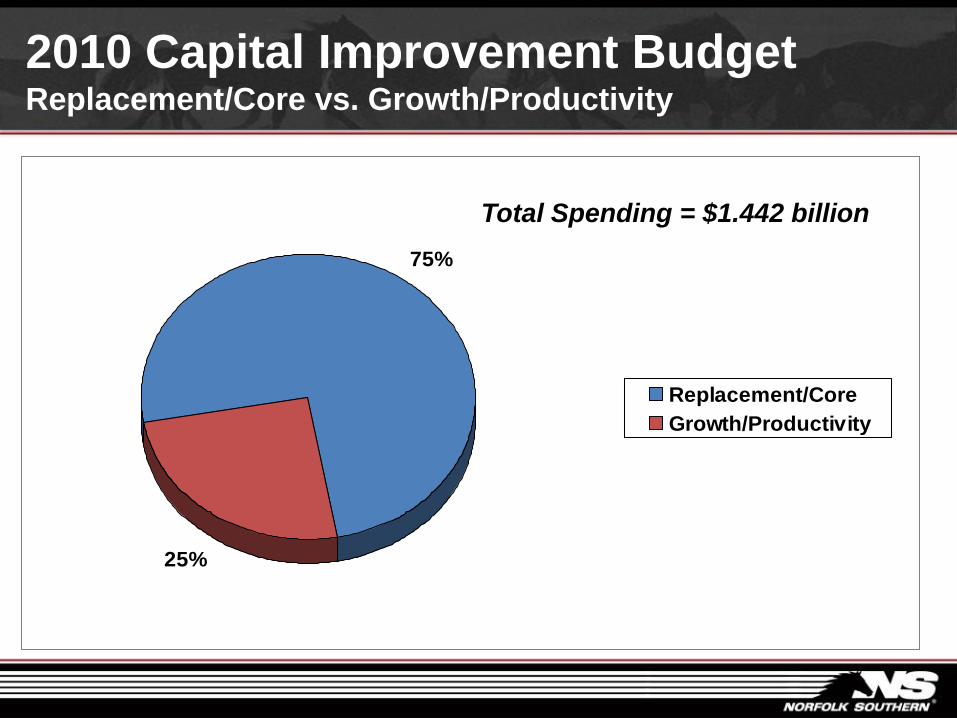
2010 Capital Improvement Budget Replacement/Core vs. Growth/Productivity
75%
25%
Replacement/Core
Growth/Productivity
Total Spending = $1.442 billion

2010 Capital Improvement Budget ($ Millions)
$140
$110$81
$221
$706
$184
Roadway
Facilities/Terminals
Technology
Infrastructure
Rolling Stock
Other Projects
Total Spending = $1.442 billion

2010 Capital Improvement Budget ($ Millions)
$140
$110$81
$221
$184
$706Roadway
Facilities/Terminals
Technology
Infrastructure
Rolling Stock
Other Projects
Total Spending = $1.442 billion

2010 Capital Improvement Budget (millions)
$140
$110$81
$221
$706
$184
Roadway
Facilities/Terminals
Technology
Infrastructure
Rolling Stock
Other Projects
Total Spending = $1.442 billion

2010 Capital Improvement Budget(millions)
$110$81
$221$140
$706
$184
Roadway
Facilities/Terminals
Technology
Infrastructure
Rolling Stock
Other Projects
Total Spending = $1.442 billion

2010 Expense Drivers
• Increased Volumes
• Higher Fuel Prices
• Higher Pay Rates and Medical Costs
31

Locomotive Diesel Fuel2008-2010 Average Price per Gallon
32
Actual Projected

Pay Rates and Medical Costs
Year-Over-Year Change ($ Millions)
33

Proposed Legislation – Risks
• Dampen returns
• Drive up costs
• Degrade service
• Deter investment

Proposed Legislation – Goals
• Promote adequate returns
• Protect service
• Preserve capacity
• Prepare for growth

BB&T Annual Transportation ConferenceFebruary 10, 2010
James A. Squires
Executive Vice President Finance and
Chief Financial Officer