tolling: the changing landscape of … the changing landscape of transportation finance texas...
TRANSCRIPT

J U N E 2 0 0 6
T O L L I N G : T H E C H A N G I N G L A N D S C A P E O FT R A N S P O R T A T I O N F I N A N C E
Texas Transportation Conference

T E X A S T R A N S P O R T A T I O N C O N F E R E N C E
The current landscape of transportation funding
While demands for transportation funding persist, funding sources increasingly lag
18% of major roads nationwide are in poor or mediocre condition1
In 2003, urban areas with 3+ million people experienced 32 hoursof delay & $524 per capita in congestion costs2
The purchasing power of motor fuel revenues is decreasing
American Society of Civil Engineers Report Card 2005
Key sectors 2001 grade
2005 grade Comment
Roads D+ D Poor road conditions cost motorists $54 billion annually Americans spend 3.5 billion hours pa stuck in traffic ($63.2 billion) Total spending of $59.4 billion pa is well below the $94 billion required
Transit C- D+ Transit use increased 21& from 1993 – 2002 The FTA estimates $20.6 billion annually to improve to “good” condition In 2002, total capital outlays were $12.3 billion
1 US DOT Bureau of Transportation Statistics, National Transportation Statistics 2005, June 2005, TABLE 1-26: Condition of U.S. Roadways by Functional System.
2 Texas Transportation Institute, The 2005 Annual Urban Mobility Report (College Station, TX: 2005)
1

T E X A S T R A N S P O R T A T I O N C O N F E R E N C E
Inflation, improved vehicle efficiency and rising construction costs have weakened the purchasing power of federal gas tax revenues, despite increased rates
Nominal vs. Real Value of the Federal Gas TaxNominal vs. Real Value of the Federal Gas Tax
Source: ARTBA
0
2
4
6
8
10
12
14
16
18
20
'70 '75 '80 '85 '90 '95 '00
Nominal Value of the Federal Gas Tax
Real Value of the Federal Gas Tax
cent
s
The nominal rate has increased 4.5 times between 1970 and 2000. It was worth just over 3.1 cents per gallon in real terms in 2000
The gas tax has not been increased by more than .1 cent since 1993
2

T E X A S T R A N S P O R T A T I O N C O N F E R E N C E
As vehicle miles traveled increases 2.8% annually, road miles only expand .14% annually, on average…
-2%
-1%
0%
1%
2%
3%
4%
5%
6%
'81 '86 '91 '96 '01
Annual Change in Vehicle Distance Traveled
Annual Change in Public Road Length
Growth of Vehicle Miles Traveled vs. Growth of Public Road Lengths NationallyGrowth of Vehicle Miles Traveled vs. Growth of Public Road Lengths Nationally
Source: FHWA Highway Statistics
3

T E X A S T R A N S P O R T A T I O N C O N F E R E N C E
…Traffic congestion increasingly plagues the nation’s roadways
0
5
10
15
20
25
1983 1990 1995 2001
Travel TimeTravel Time Trip LengthTrip Length
0
2
4
6
8
10
12
14
1983 1990 1995 2001
(minutes) (miles)
1 Source: FHWA
Average Commute SpeedsAverage Commute Speeds
0
5
10
15
20
25
30
35
40
45
Not MSA Less than 250,000 250,000-499,000 500,000-999,999 1-2.99 Million 3 Million +
1983 1990 1995 2001
After showing modest improvement in the 1990s, average commute speeds have begun to worsen
(mph)
4

T E X A S T R A N S P O R T A T I O N C O N F E R E N C E
However, toll roads can provide potential relief for increased transportation needs that lack the necessary funding
Traditional and innovative funding sources haven’t filled the gap
Conversion from indirect user fees to direct user fees
Recent US Federal legislation has supported innovative financing initiatives
There are more than 5,100 miles (8,200 km) of toll infrastructure in the United States
Approximately 3,000 miles (4,800 km) are rural and 2,100 miles (3,400 km) are urban
Vast majority of this infrastructure is operated solely by public authorities
Public private partnerships have been limited in the United States to date
However, reluctance to increase transportation funding has led to an increased interest in public private partnerships
1 US DOT Bureau of Transportation Statistics, National Transportation Statistics 2005, June 2005, TABLE 1-26: Condition of U.S. Roadways by Functional System.2 Texas Transportation Institute, The 2005 Annual Urban Mobility Report (College Station, TX: 2005)
5

T E X A S T R A N S P O R T A T I O N C O N F E R E N C E
US Toll Road Timeline
1800 1900 Future2000
1790’s – One of the first US toll roads in Lancaster, PA
Turn of 20th Century - Most toll roads taken over by state highway departments
1940 - The Pennsylvania Turnpike opens starting a resurgence of tolls
1990’s – California permits private concessions and the SR91 express lanes are built
2004 – Chicago Skyway sold to private investors
Source: Caltrans
1956 – National Interstate Highway System Act
1800’s – More than 2,500 private toll road companies operate more than 30,000 miles of toll raods in the US
1907 – Long Island Motor Parkway (private) opens as first toll road for motorcars
2000’s – Trans Texas Corridor Announced. TTC I-35 awarded. Return of private capital.
6

T E X A S T R A N S P O R T A T I O N C O N F E R E N C E
Despite having a long history, US toll roads remain underleveraged
Annual US Transportation Spending Sources
Source: The Brookings Institution, 2003
7

T E X A S T R A N S P O R T A T I O N C O N F E R E N C E
Toll Roads will play a vital role in expanding the transportation infrastructure in congested areas
Based on a list of currently proposed projects, we estimate more than $50 billion of additional capital will be added to the national transportation
system through new toll road construction in the next few years
= location of a major toll road
= toll road opened or under construction since 1990
= anticipated toll road project
8

T E X A S T R A N S P O R T A T I O N C O N F E R E N C E
Toll roads offer several political and economic advantages
Electronic Tolling
Increased traffic efficiency with more advanced ETC technologies
Toll increases are viewed more favorable by the public than increased taxes
Availability of User Fees
Less political costs than tax increases
As shown in table below, a relatively untapped resource
Type of Revenue 1995 1999 ChangePercent Change
($ in millions)
State Borrowing $4,316 $ 8,298 $3,982 92Other Local Taxes Includes Sales Taxes $ 4,487 $ 7,079 $ 2,592 58
Other State Taxes $ 6,565 $ 8,560 $ 1,995 30
Local General Funds $ 12,326 $ 15,857 $ 3,531 29
Local Property Taxes $ 5,220 $ 6,384 $ 1,164 22
State User Fees $36,200 $42,730 $6,530 18Source: Surface Transportation Policy Project, 2002
9

T E X A S T R A N S P O R T A T I O N C O N F E R E N C E
In addition to new & proposed toll road construction, sales & leases of current toll roads potentially provide additional capital with which to fund future projects
$1.83 billion
$3.85 billion
Toll road privatizations also provide significant resources that may help alleviate government funding shortfalls
10

T E X A S T R A N S P O R T A T I O N C O N F E R E N C E
Private capital can add additional value to toll facilities and provide value to transportation agencies
Aggressive use of capital to maximize value of road or the most road that may be built given a projected stream of tolls
Private capital structure using both debt and equity
Equity demands a higher rate of return, but may in fact be much more flexible during ramp up states
Use of debt in a way that optimizes its use and assumes key risks
May allow for upfront payments to sponsoring government, even in a new construction project
Can be used to extract significant value from existing roads
We estimate a total infrastructure purchasing power (from Private Sources) to be in excess of $200 billion
11

T E X A S T R A N S P O R T A T I O N C O N F E R E N C E
Why invest in infrastructure?
Rapid Shift to Funded Pension Systems
Incentives for Private Sector Participation
Long-Term Stable Investment Returns
Infrastructure Assets are Attractive to Investors
Highly Predictable Distribution
Stream
Diversification Capital Appreciation Tax Benefits
Unique
Class
Broad AppealInvestment
12

T E X A S T R A N S P O R T A T I O N C O N F E R E N C E
“Striking the Right Balance”
Objective of Public Sector Entity Objective of Private Partner
MaximizeNet Income
Maximize Traffic Flow & Economic
Development
Good Public Policy Profitability
Enhance user mobilityPromote economic developmentMaximize financial resources
Maximize return on investmentGenerate stable equity returnsBuild projects/ improvements that make financial sense
13

T E X A S T R A N S P O R T A T I O N C O N F E R E N C E
What are the alternatives and monetization options?
Status Quo -Leverage Assets with
Additional Debt
Asset Transfer to Public Authority
Initial Public Offeringof Equity
Public-Private Concessions:
- 35 years- 50 years- 75 years- 99 years
Direct Asset Sale
Private Investment/Public Regulation
Full Public Ownership & Control Limited Public Ownership
14

T E X A S T R A N S P O R T A T I O N C O N F E R E N C E
Potential Transportation Investors: Who may want to invest…
Australasia Europe / UKNorth America
Pass
ive
/ Fi
nanc
ial
Act
ive
/ A
sset
Man
ager
s
Access Economics
Macquarie Infrastructure Group
Developing Market
The list of well credentialed, well capitalized buyers is expanding rapidly
15
T E X A S T R A N S P O R T A T I O N C O N F E R E N C E
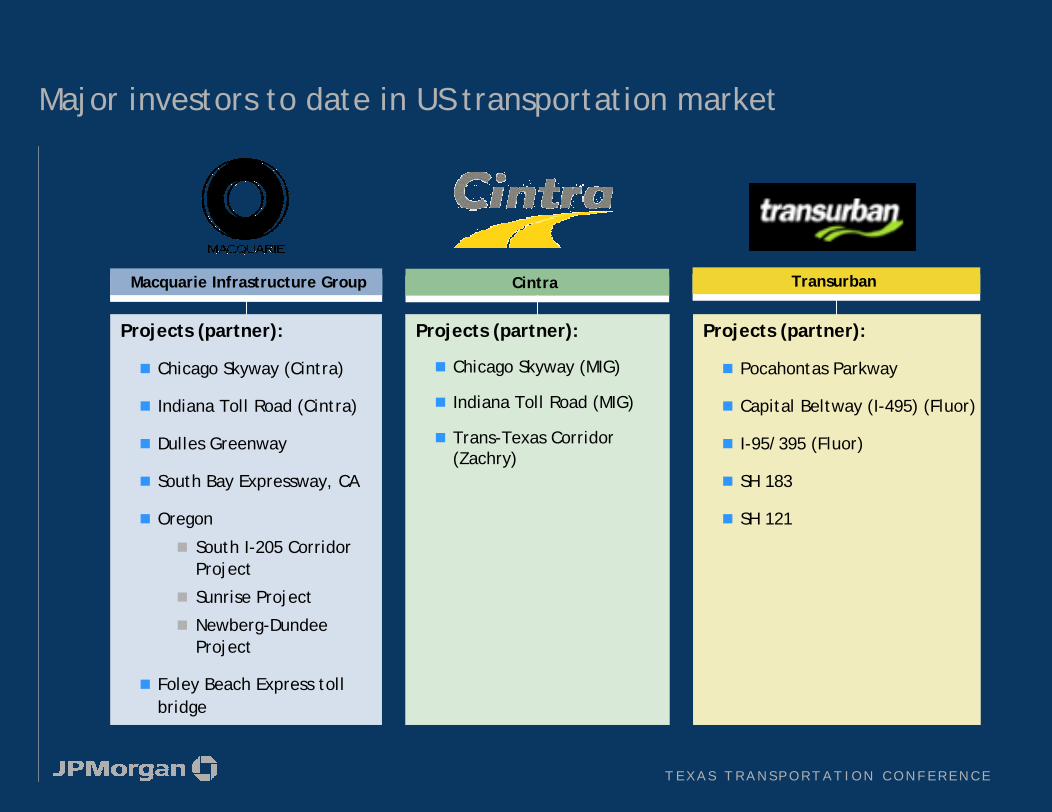
Major investors to date in US transportation market
Projects (partner):
Pocahontas Parkway
Capital Beltway (I-495) (Fluor)
I-95/395 (Fluor)
SH 183
SH 121
TransurbanTransurbanMacquarie Infrastructure GroupMacquarie Infrastructure Group CintraCintra
Projects (partner):
Chicago Skyway (Cintra)
Indiana Toll Road (Cintra)
Dulles Greenway
South Bay Expressway, CA
Oregon
South I-205 Corridor Project
Sunrise Project
Newberg-Dundee Project
Foley Beach Express toll bridge
Projects (partner):
Chicago Skyway (MIG)
Indiana Toll Road (MIG)
Trans-Texas Corridor (Zachry)
16
T E X A S T R A N S P O R T A T I O N C O N F E R E N C E
Conclusions
Toll roads and private capital are not new, but will be very influential going forward
The changing transportation environment renders toll facilities increasingly attractive
Lack of federal funding
No increases to gas taxes at federal or state levels
New federal programs that encourage and enable use of private capital and tolling
Significant amounts of private capital available
17