basware q1/2009/media/files/b/basware-ir-v2/docu… · sita: invoice processing solution extension:...
TRANSCRIPT

1
Basware Q1/2009
CEO Ilkka Sihvo and CFO Mika Harjuaho
April 16, 2009
Contents
• Q1/2009 in Brief
• Business Review of Q1/2009
• Financial Review of Q1/2009
• Future Outlook
2

Basware in Brief
• Headquarters in Espoo, Finland and ten subsidiaries in Europe and in the US
• 850,000 users globally in 1500+ large organizations
• Net sales 21.7 million at the end of March 2009 (18.2 million)
• 730 employees at the end of March2009 (665)
Breakthrough to Global Leader
3
Q1/2009 in Brief
4
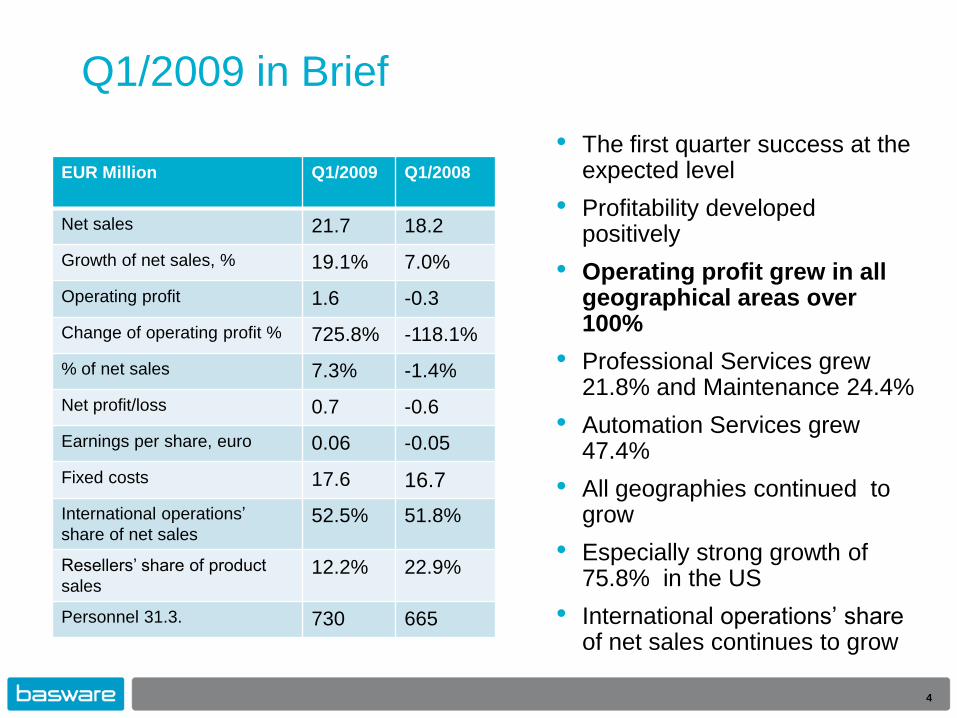
EUR Million Q1/2009 Q1/2008
Net sales 21.7 18.2
Growth of net sales, % 19.1% 7.0%
Operating profit 1.6 -0.3
Change of operating profit % 725.8% -118.1%
% of net sales 7.3% -1.4%
Net profit/loss 0.7 -0.6
Earnings per share, euro 0.06 -0.05
Fixed costs 17.6 16.7
International operations’
share of net sales52.5% 51.8%
Resellers’ share of product
sales12.2% 22.9%
Personnel 31.3. 730 665
• The first quarter success at the expected level
• Profitability developed positively
• Operating profit grew in all geographical areas over 100%
• Professional Services grew 21.8% and Maintenance 24.4%
• Automation Services grew 47.4%
• All geographies continued to grow
• Especially strong growth of 75.8% in the US
• International operations’ share of net sales continues to grow
Highlights of Q1/2009
5
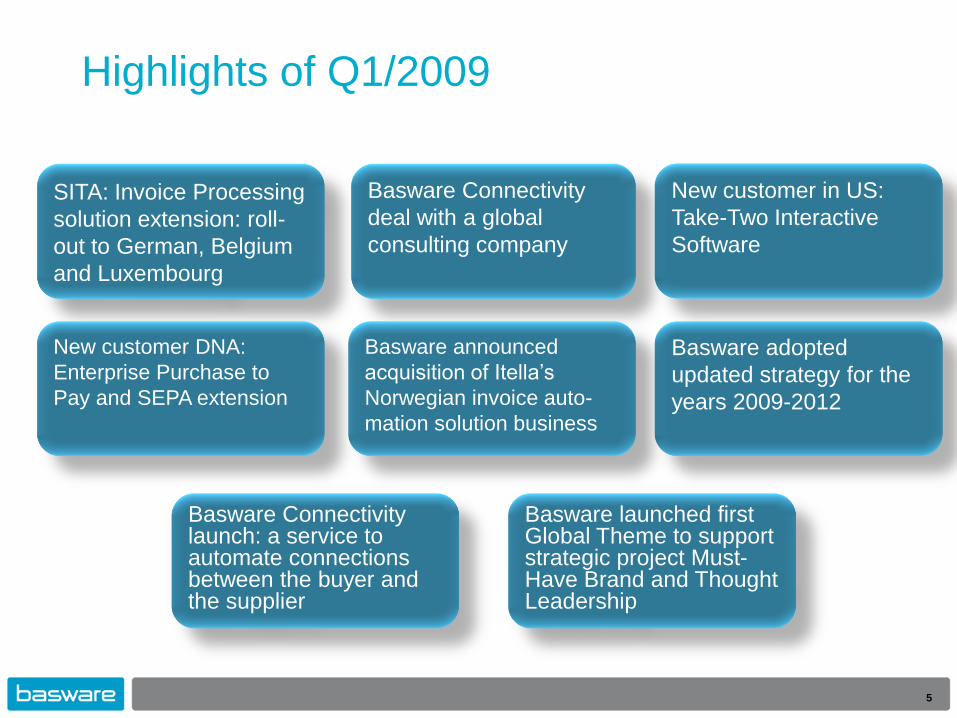
SITA: Invoice Processing
solution extension: roll-
out to German, Belgium
and Luxembourg
Basware adopted
updated strategy for the
years 2009-2012
New customer in US:
Take-Two Interactive
Software
Basware Connectivity
deal with a global
consulting company
Basware launched first Global Theme to support strategic project Must-Have Brand and Thought Leadership
New customer DNA:
Enterprise Purchase to
Pay and SEPA extension
Basware Connectivity launch: a service to automate connections between the buyer and the supplier
Basware announced
acquisition of Itella’s
Norwegian invoice auto-
mation solution business
6
Business Review of Q1/2009
CEO Ilkka Sihvo
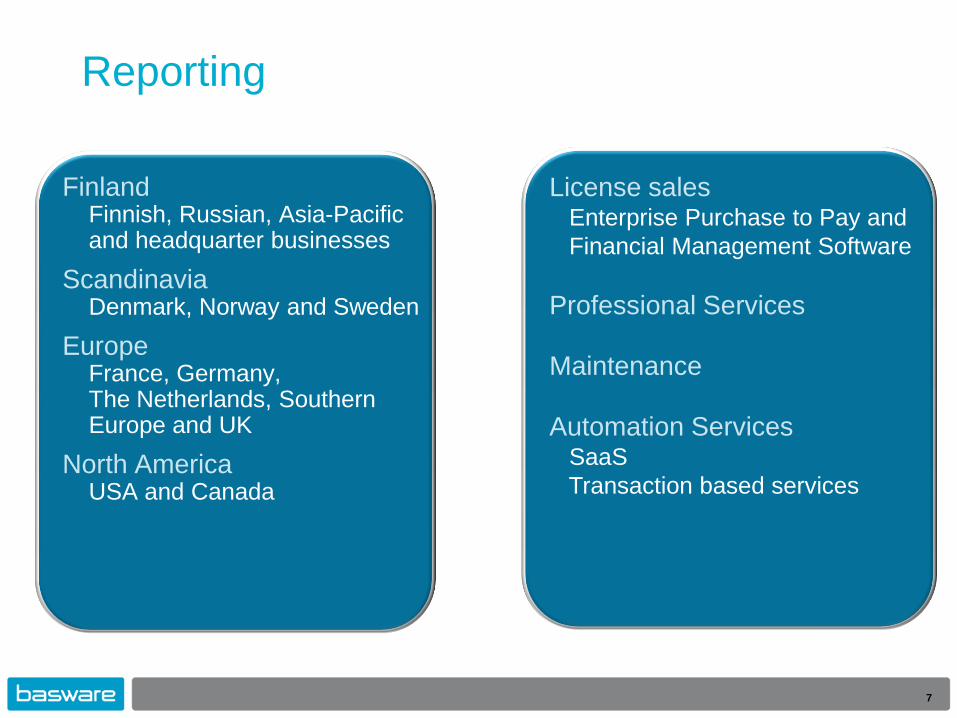
Reporting
7
FinlandFinnish, Russian, Asia-Pacificand headquarter businesses
ScandinaviaDenmark, Norway and Sweden
EuropeFrance, Germany, The Netherlands, Southern Europe and UK
North AmericaUSA and Canada
License salesEnterprise Purchase to Pay and
Financial Management Software
Professional Services
Maintenance
Automation ServicesSaaS
Transaction based services

Finland Segment Q1/2009
EUR thousand Q1/08 Q2/08 Q3/08 Q4/08 Q1/09
Net sales 10 493 13 091 10 604 15 329 11 331
Growth of net sales,% -13.0% 6.6% 3.6% 7.4% 8.0%
Operating profit -93 1 926 1 679 4 385 849
Number of personnel 416 421 422 426 439
0
3 000
6 000
9 000
12 000
15 000
Q1/08Q2/08Q3/08Q4/08Q1/09
Net sales
-500
500
1 500
2 500
3 500
4 500
Q1/08Q2/08Q3/08Q4/08Q1/09
Operating profit
0
100
200
300
400
500
Q1/08Q2/08Q3/08Q4/08Q1/09
Personnel

Finland Segment Q1/2009
9
New customers
Cargotec, DNA, Meira,
Maskun Kalustetalo
and Are Oy
Highlights
Growth of Finland and
Russia net sales of
23.3%
New partner in Russia:
LANIT (Laboratory of
New Information
Technologies)
Profile
Segment consists of
Finnish, Russian, Asia-
Pacific and headquarter
businesses.
Altogether 14 resellers in
the segment
Number of personnel 439
(416)
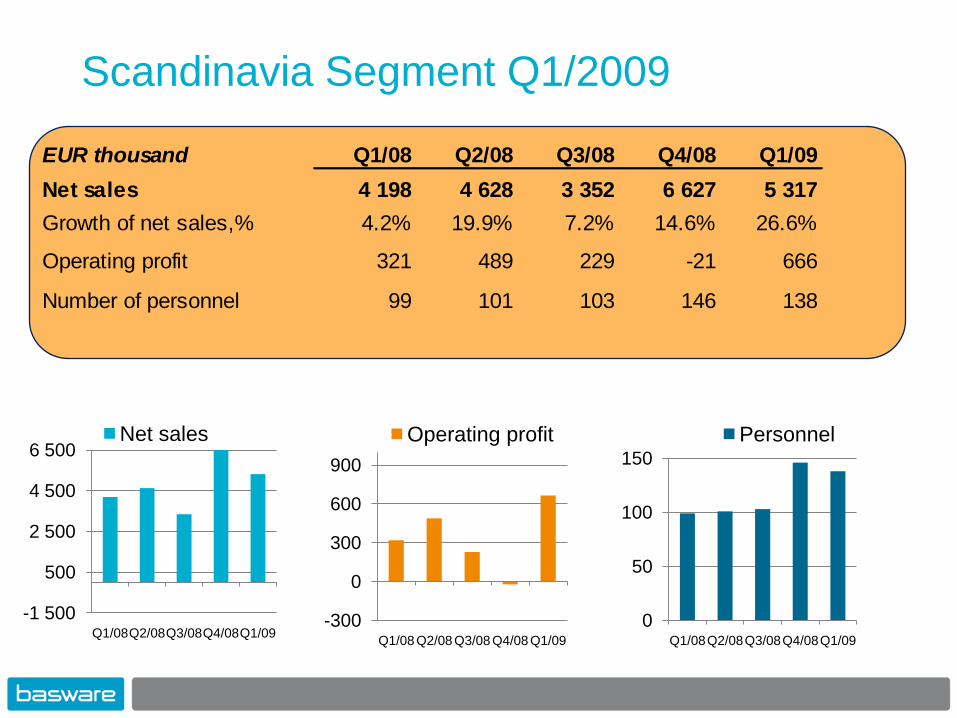
EUR thousand Q1/08 Q2/08 Q3/08 Q4/08 Q1/09
Net sales 4 198 4 628 3 352 6 627 5 317
Growth of net sales,% 4.2% 19.9% 7.2% 14.6% 26.6%
Operating profit 321 489 229 -21 666
Number of personnel 99 101 103 146 138
Scandinavia Segment Q1/2009
-1 500
500
2 500
4 500
6 500
Q1/08Q2/08Q3/08Q4/08Q1/09
Net sales
0
50
100
150
Q1/08Q2/08Q3/08Q4/08Q1/09
Personnel
-300
0
300
600
900
Q1/08 Q2/08 Q3/08 Q4/08 Q1/09
Operating profit
Scandinavia Segment Q1/2009
11
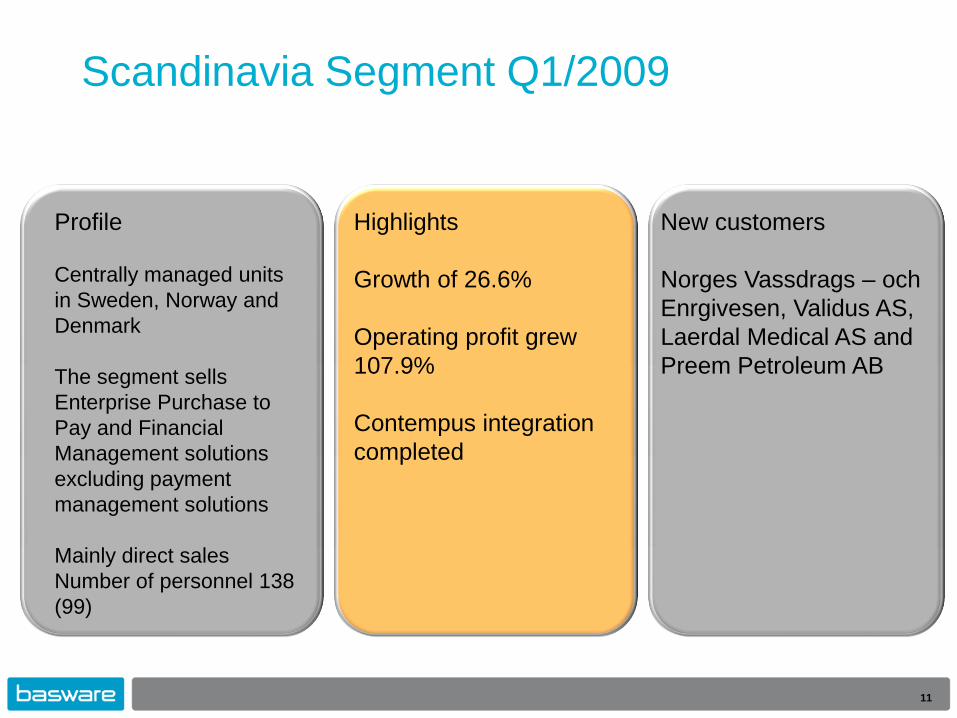
Profile
Centrally managed units
in Sweden, Norway and
Denmark
The segment sells
Enterprise Purchase to
Pay and Financial
Management solutions
excluding payment
management solutions
Mainly direct sales
Number of personnel 138
(99)
New customers
Norges Vassdrags – och
Enrgivesen, Validus AS,
Laerdal Medical AS and
Preem Petroleum AB
Highlights
Growth of 26.6%
Operating profit grew
107.9%
Contempus integration
completed
Europe Segment Q1/2009
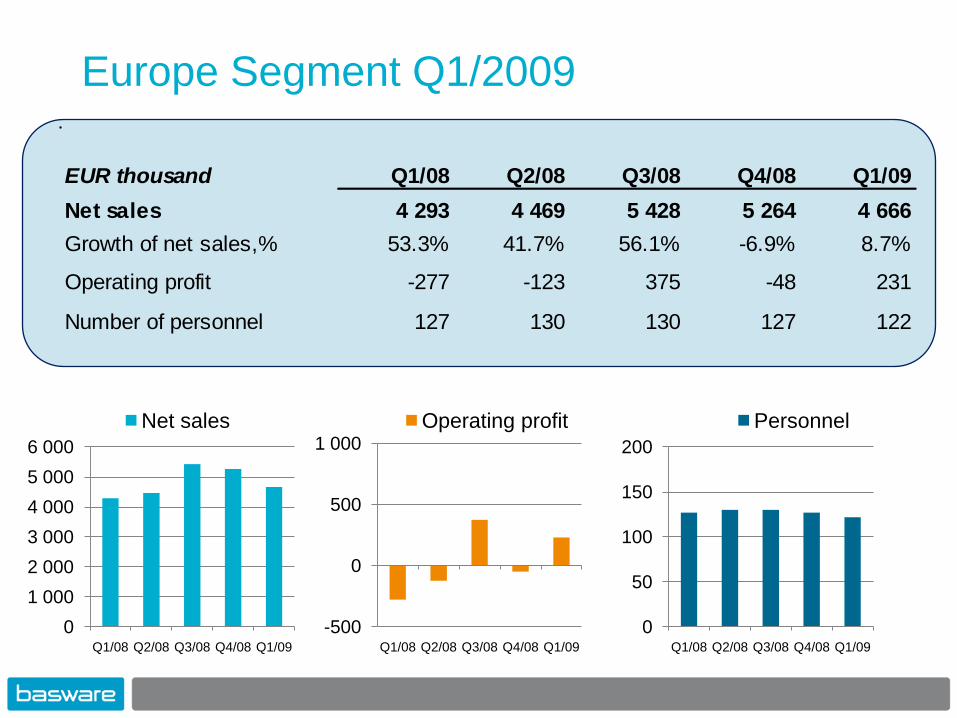
EUR thousand Q1/08 Q2/08 Q3/08 Q4/08 Q1/09
Net sales 4 293 4 469 5 428 5 264 4 666
Growth of net sales,% 53.3% 41.7% 56.1% -6.9% 8.7%
Operating profit -277 -123 375 -48 231
Number of personnel 127 130 130 127 122
0
1 000
2 000
3 000
4 000
5 000
6 000
Q1/08 Q2/08 Q3/08 Q4/08 Q1/09
Net sales
-500
0
500
1 000
Q1/08 Q2/08 Q3/08 Q4/08 Q1/09
Operating profit
0
50
100
150
200
Q1/08 Q2/08 Q3/08 Q4/08 Q1/09
Personnel
Europe Segment Q1/2009
13
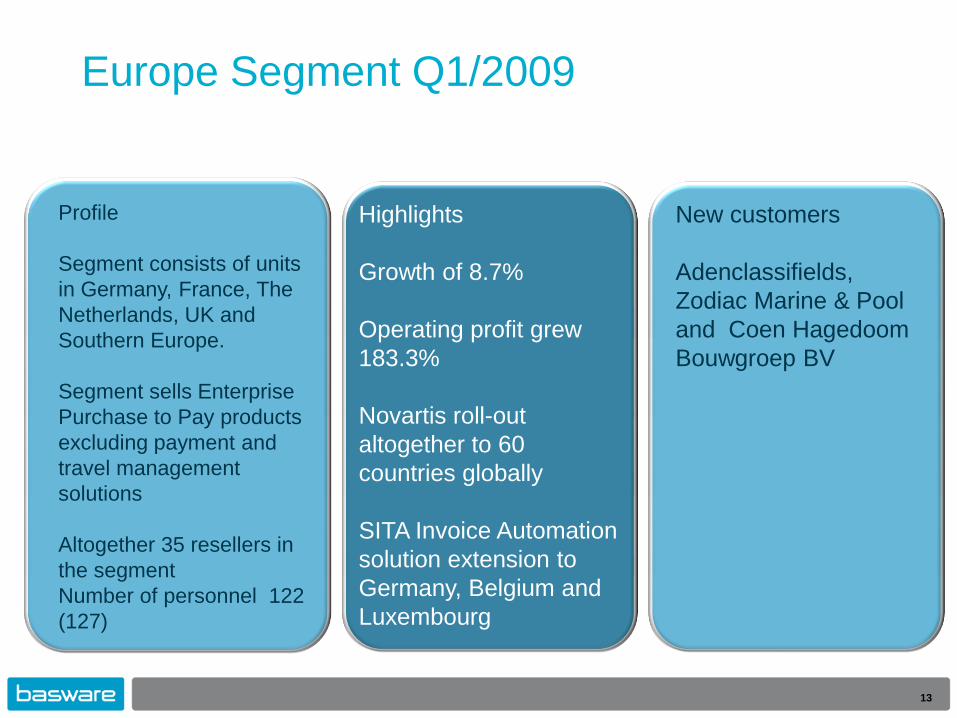
Profile
Segment consists of units
in Germany, France, The
Netherlands, UK and
Southern Europe.
Segment sells Enterprise
Purchase to Pay products
excluding payment and
travel management
solutions
Altogether 35 resellers in
the segment
Number of personnel 122
(127)
Highlights
Growth of 8.7%
Operating profit grew
183.3%
Novartis roll-out
altogether to 60
countries globally
SITA Invoice Automation
solution extension to
Germany, Belgium and
Luxembourg
New customers
Adenclassifields,
Zodiac Marine & Pool
and Coen Hagedoom
Bouwgroep BV
North America Segment Q1/2009
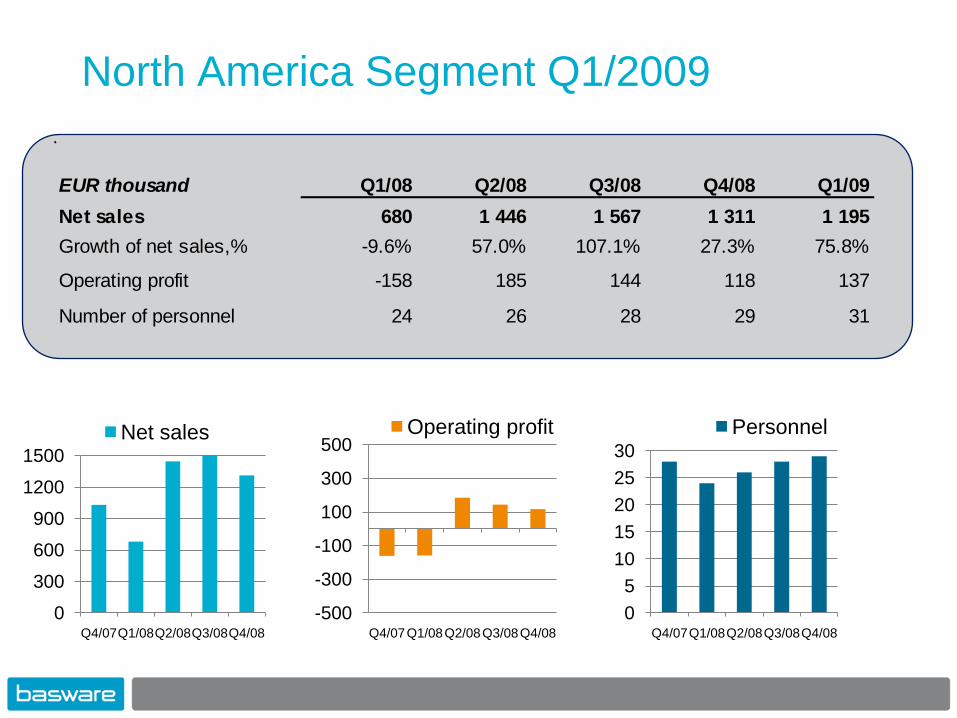
EUR thousand Q1/08 Q2/08 Q3/08 Q4/08 Q1/09
Net sales 680 1 446 1 567 1 311 1 195
Growth of net sales,% -9.6% 57.0% 107.1% 27.3% 75.8%
Operating profit -158 185 144 118 137
Number of personnel 24 26 28 29 31
0
300
600
900
1200
1500
Q4/07Q1/08Q2/08Q3/08Q4/08
Net sales
-500
-300
-100
100
300
500
Q4/07Q1/08Q2/08Q3/08Q4/08
Operating profit
0
5
10
15
20
25
30
Q4/07Q1/08Q2/08Q3/08Q4/08
Personnel
North America Segment Q1/2009
15
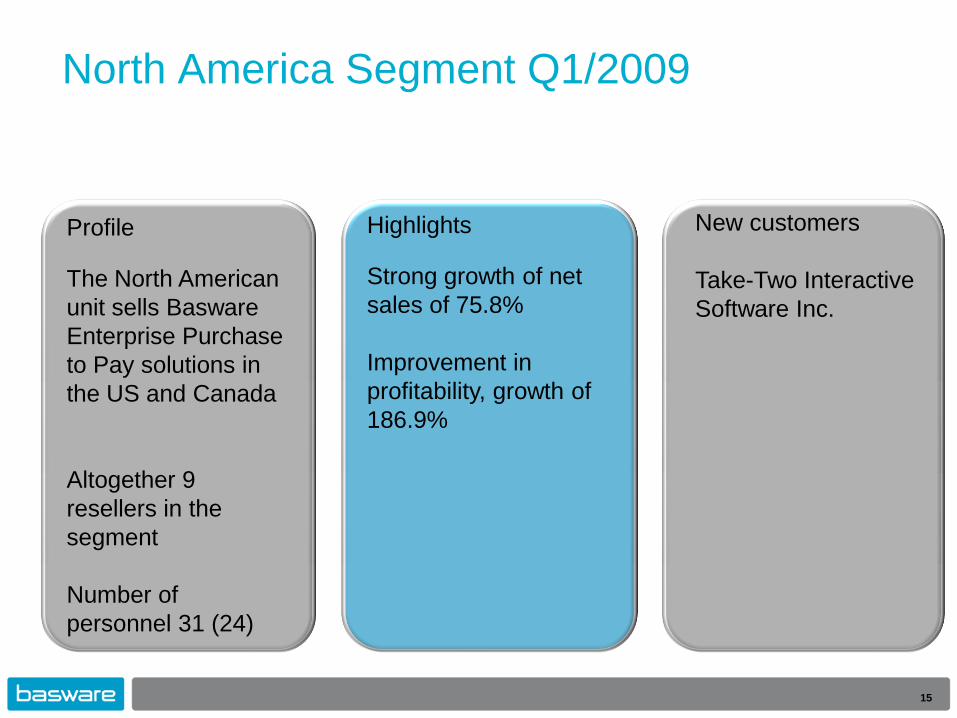
Highlights
Strong growth of net
sales of 75.8%
Improvement in
profitability, growth of
186.9%
New customers
Take-Two Interactive
Software Inc.
Profile
The North American
unit sells Basware
Enterprise Purchase
to Pay solutions in
the US and Canada
Altogether 9
resellers in the
segment
Number of
personnel 31 (24)
Basware Strategy presentation 4/16/2009 16
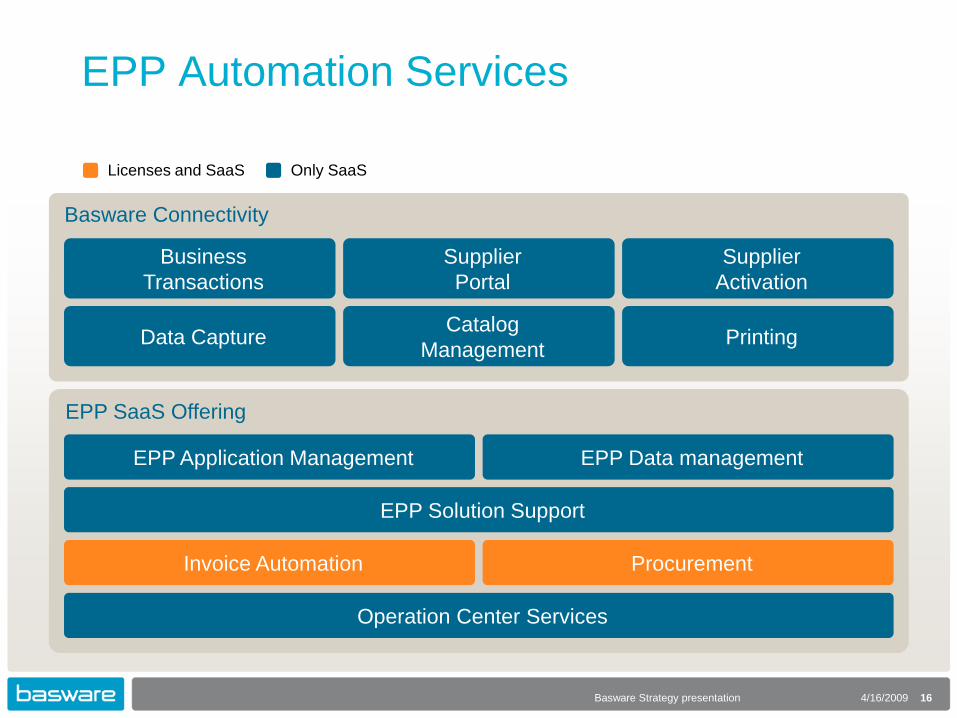
EPP SaaS Offering
EPP Application Management EPP Data management
EPP Solution Support
Invoice Automation Procurement
Operation Center Services
Basware Connectivity
Business
Transactions
Supplier
Portal
Supplier
Activation
Data CaptureCatalog
ManagementPrinting
EPP Automation Services
Licenses and SaaS Only SaaS
Basware Connectivity
17
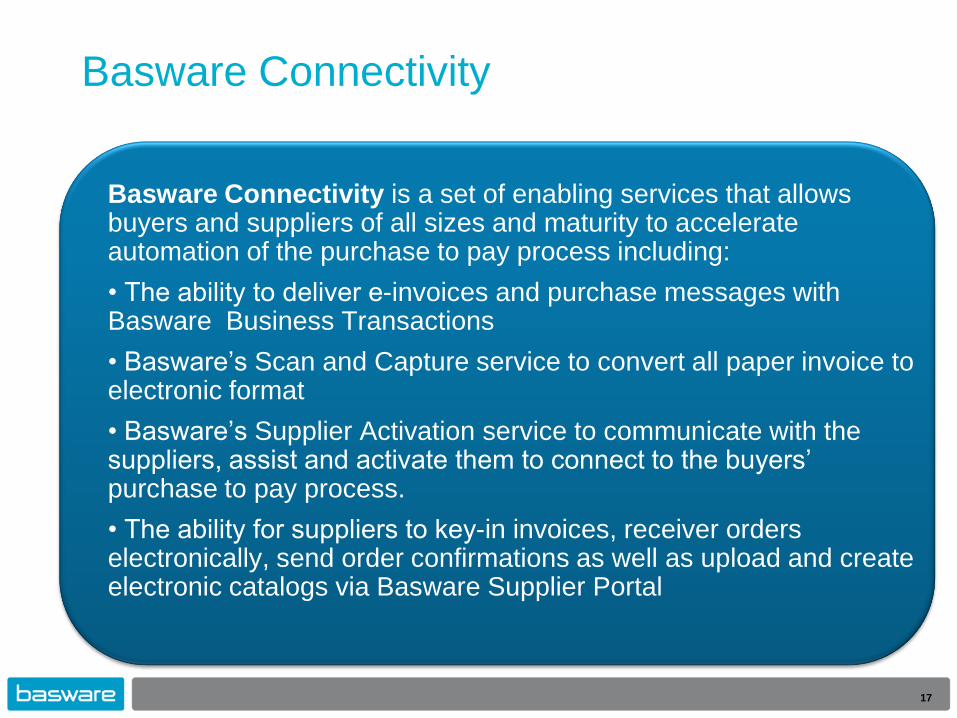
Basware Connectivity is a set of enabling services that allows buyers and suppliers of all sizes and maturity to accelerate automation of the purchase to pay process including:
• The ability to deliver e-invoices and purchase messages with Basware Business Transactions
• Basware’s Scan and Capture service to convert all paper invoice to electronic format
• Basware’s Supplier Activation service to communicate with the suppliers, assist and activate them to connect to the buyers’ purchase to pay process.
• The ability for suppliers to key-in invoices, receiver orders electronically, send order confirmations as well as upload and create electronic catalogs via Basware Supplier Portal
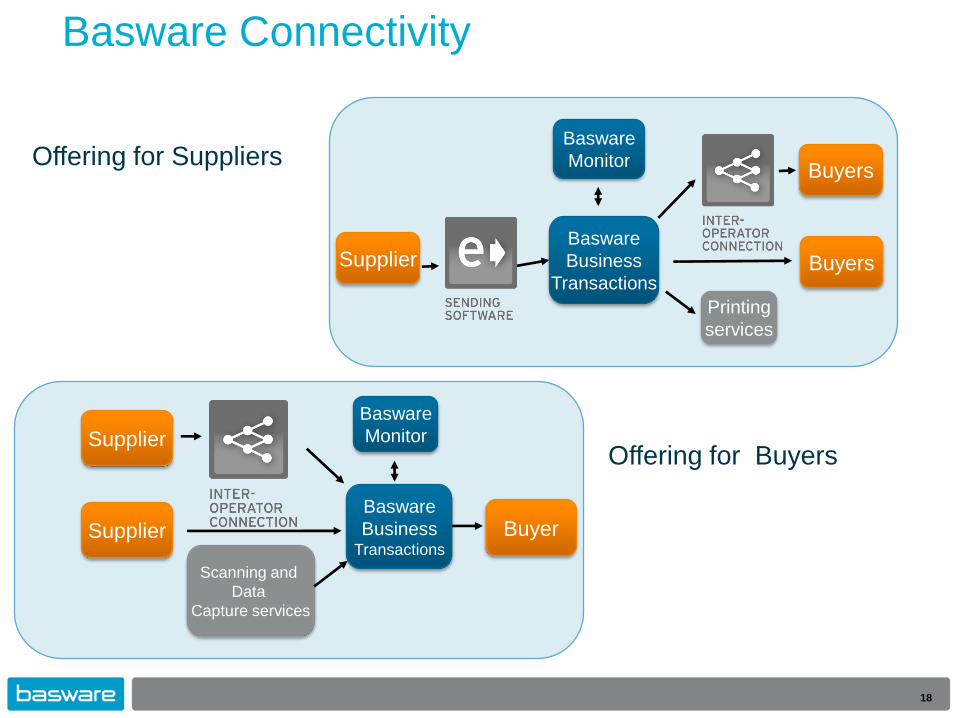
Basware Connectivity
18
SupplierBasware
Business
Transactions
Basware
Monitor
Buyers
Printing
services
Buyers
Basware
BusinessTransactions
Basware
Monitor
Buyer
Supplier
Supplier
Scanning and
Data
Capture services
Offering for Buyers
Offering for Suppliers
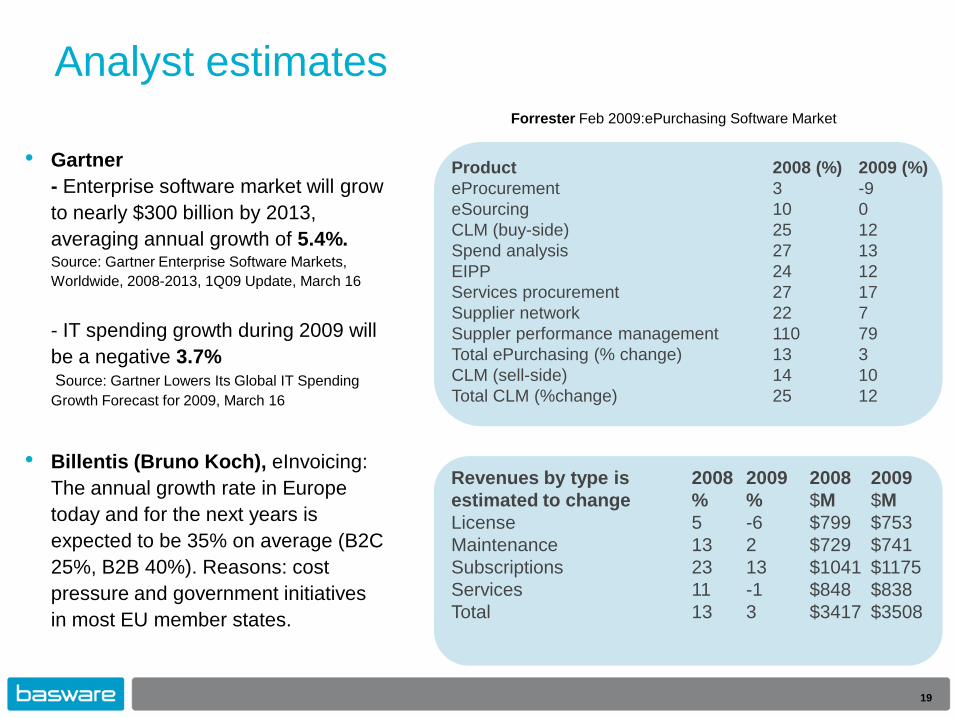
Analyst estimates
• Gartner
- Enterprise software market will grow
to nearly $300 billion by 2013,
averaging annual growth of 5.4%. Source: Gartner Enterprise Software Markets,
Worldwide, 2008-2013, 1Q09 Update, March 16
- IT spending growth during 2009 will
be a negative 3.7%Source: Gartner Lowers Its Global IT Spending
Growth Forecast for 2009, March 16
• Billentis (Bruno Koch), eInvoicing:
The annual growth rate in Europe
today and for the next years is
expected to be 35% on average (B2C
25%, B2B 40%). Reasons: cost
pressure and government initiatives
in most EU member states.
19
Product
eProcurement
eSourcing
CLM (buy-side)
Spend analysis
EIPP
Services procurement
Supplier network
Suppler performance management
Total ePurchasing (% change)
CLM (sell-side)
Total CLM (%change)
2008 (%)
3
10
25
27
24
27
22
110
13
14
25
2009 (%)
-9
0
12
13
12
17
7
79
3
10
12
Forrester Feb 2009:ePurchasing Software Market
Revenues by type is
estimated to change
License
Maintenance
Subscriptions
Services
Total
2008
%
5
13
23
11
13
2009
%
-6
2
13
-1
3
2008
$M
$799
$729
$1041
$848
$3417
2009
$M
$753
$741
$1175
$838
$3508
20
Financial Review of Q1/2009
CFO Mika Harjuaho
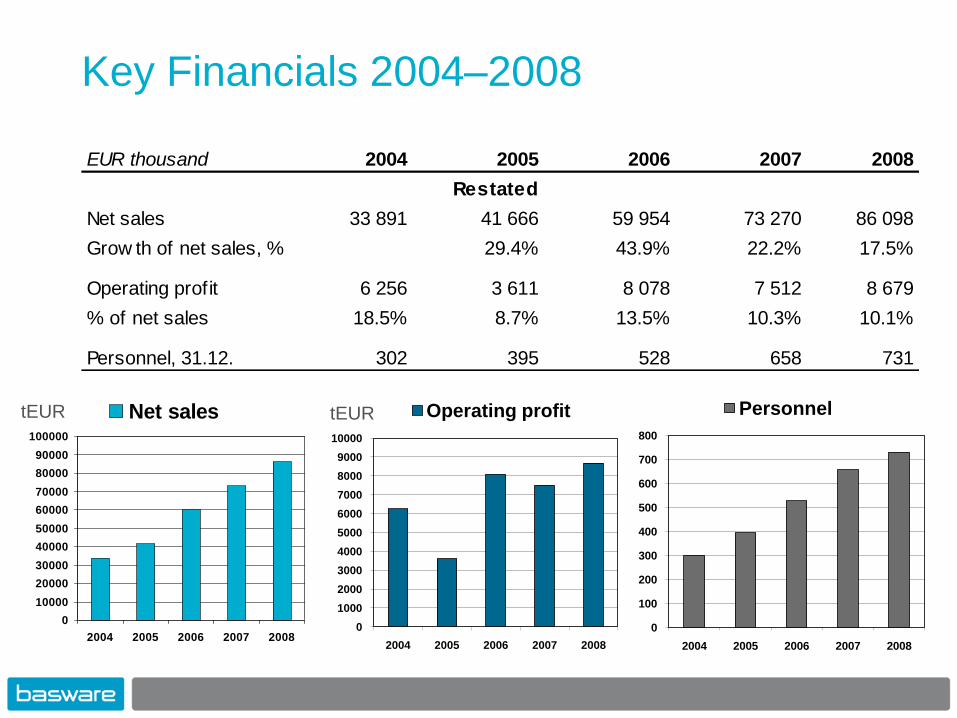
Key Financials 2004–2008
EUR thousand 2004 2005 2006 2007 2008
Restated
Net sales 33 891 41 666 59 954 73 270 86 098
Grow th of net sales, % 29.4% 43.9% 22.2% 17.5%
Operating profit 6 256 3 611 8 078 7 512 8 679
% of net sales 18.5% 8.7% 13.5% 10.3% 10.1%
Personnel, 31.12. 302 395 528 658 731
0
10000
20000
30000
40000
50000
60000
70000
80000
90000
100000
2004 2005 2006 2007 2008
Net sales
0
1000
2000
3000
4000
5000
6000
7000
8000
9000
10000
2004 2005 2006 2007 2008
Operating profit
0
100
200
300
400
500
600
700
800
2004 2005 2006 2007 2008
PersonneltEUR tEUR
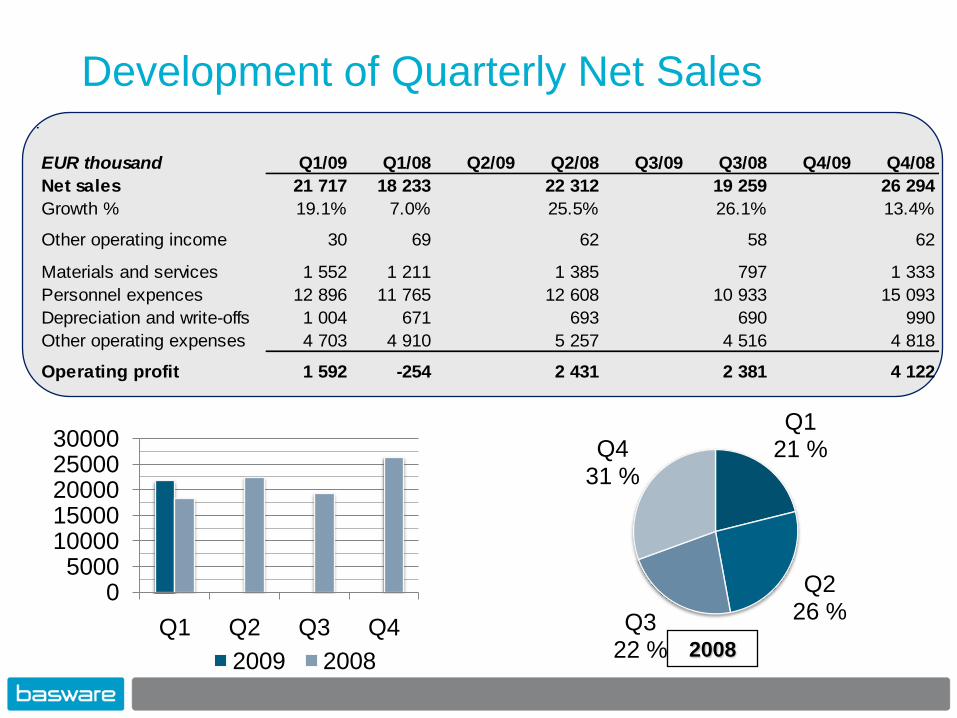
Development of Quarterly Net Sales
05000
1000015000200002500030000
Q1 Q2 Q3 Q4
2009 2008
EUR thousand Q1/09 Q1/08 Q2/09 Q2/08 Q3/09 Q3/08 Q4/09 Q4/08
Net sales 21 717 18 233 22 312 19 259 26 294
Growth % 19.1% 7.0% 25.5% 26.1% 13.4%
Other operating income 30 69 62 58 62
Materials and services 1 552 1 211 1 385 797 1 333
Personnel expences 12 896 11 765 12 608 10 933 15 093
Depreciation and write-offs 1 004 671 693 690 990
Other operating expenses 4 703 4 910 5 257 4 516 4 818
Operating profit 1 592 -254 2 431 2 381 4 122
2008
Q121 %
Q226 %Q3
22 %
Q4 31 %
Q1-3 %
Q226 %
Q326 %
Q4 45 %
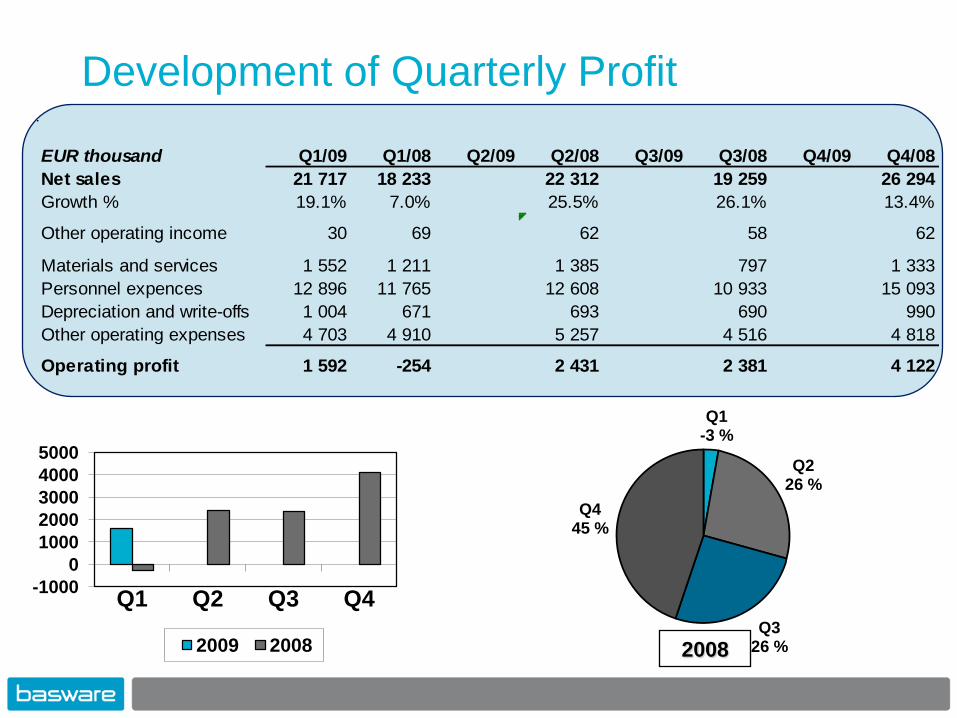
Development of Quarterly Profit
-1000
0
1000
2000
3000
4000
5000
Q1 Q2 Q3 Q4
2009 2008 2008
EUR thousand Q1/09 Q1/08 Q2/09 Q2/08 Q3/09 Q3/08 Q4/09 Q4/08
Net sales 21 717 18 233 22 312 19 259 26 294
Growth % 19.1% 7.0% 25.5% 26.1% 13.4%
Other operating income 30 69 62 58 62
Materials and services 1 552 1 211 1 385 797 1 333
Personnel expences 12 896 11 765 12 608 10 933 15 093
Depreciation and write-offs 1 004 671 693 690 990
Other operating expenses 4 703 4 910 5 257 4 516 4 818
Operating profit 1 592 -254 2 431 2 381 4 122
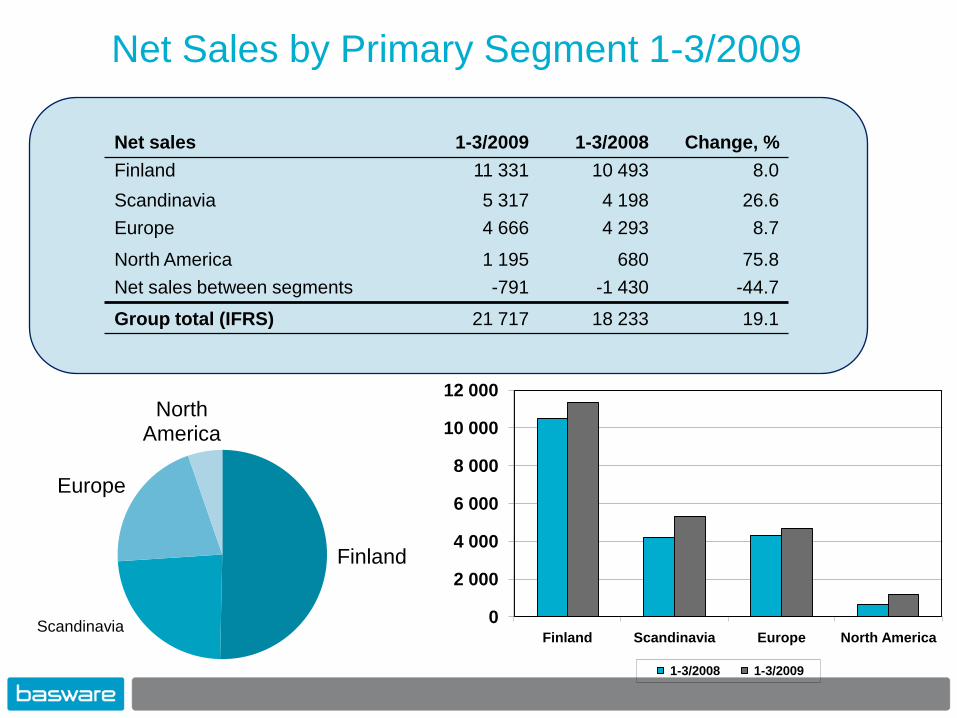
Net Sales by Primary Segment 1-3/2009
0
2 000
4 000
6 000
8 000
10 000
12 000
Finland Scandinavia Europe North America
1-3/2008 1-3/2009
Finland
Scandinavia
Europe
North America
Net sales 1-3/2009 1-3/2008 Change, %
Finland 11 331 10 493 8.0
Scandinavia 5 317 4 198 26.6
Europe 4 666 4 293 8.7
North America 1 195 680 75.8
Net sales between segments -791 -1 430 -44.7
Group total (IFRS) 21 717 18 233 19.1
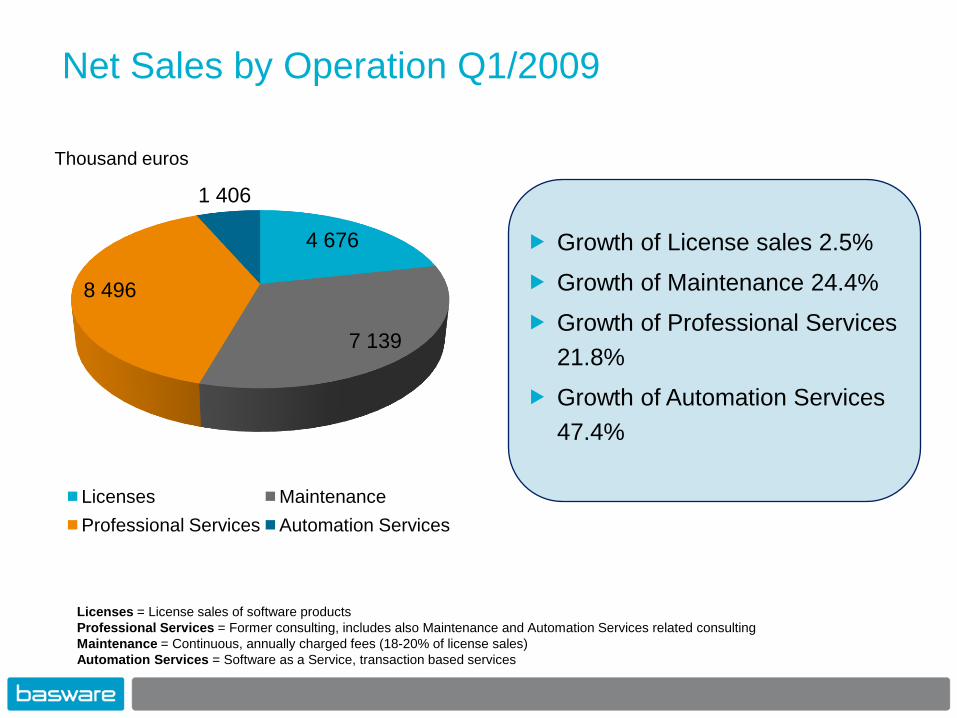
Net Sales by Operation Q1/2009
Licenses = License sales of software products
Professional Services = Former consulting, includes also Maintenance and Automation Services related consulting
Maintenance = Continuous, annually charged fees (18-20% of license sales)
Automation Services = Software as a Service, transaction based services
Growth of License sales 2.5%
Growth of Maintenance 24.4%
Growth of Professional Services
21.8%
Growth of Automation Services
47.4%
Thousand euros
4 676
7 139
8 496
1 406
Licenses Maintenance
Professional Services Automation Services
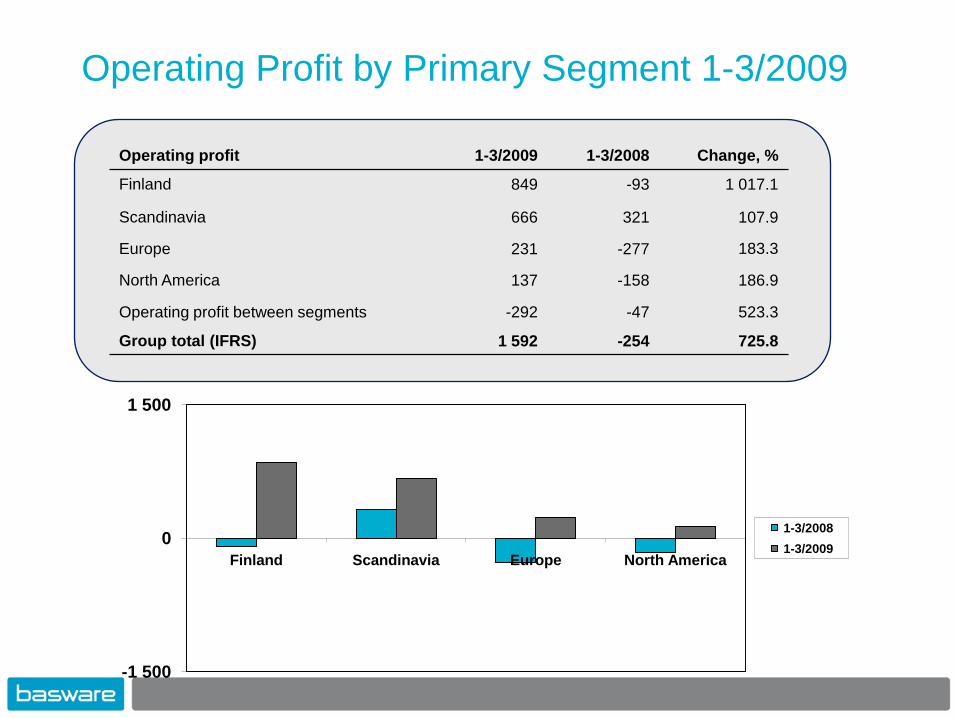
Operating Profit by Primary Segment 1-3/2009
-1 500
0
1 500
Finland Scandinavia Europe North America
1-3/2008
1-3/2009
Operating profit 1-3/2009 1-3/2008 Change, %
Finland 849 -93 1 017.1
Scandinavia 666 321 107.9
Europe 231 -277 183.3
North America 137 -158 186.9
Operating profit between segments -292 -47 523.3
Group total (IFRS) 1 592 -254 725.8
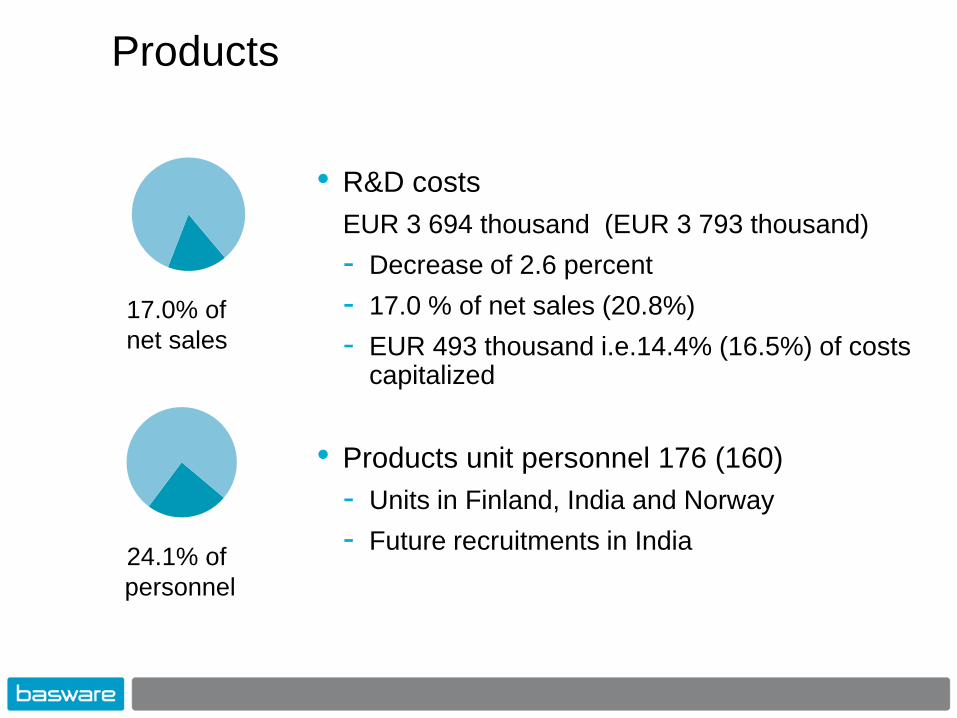
Products
• R&D costs
EUR 3 694 thousand (EUR 3 793 thousand)
- Decrease of 2.6 percent
- 17.0 % of net sales (20.8%)
- EUR 493 thousand i.e.14.4% (16.5%) of costs capitalized
• Products unit personnel 176 (160)
- Units in Finland, India and Norway
- Future recruitments in India24.1% of
personnel
17.0% of
net sales
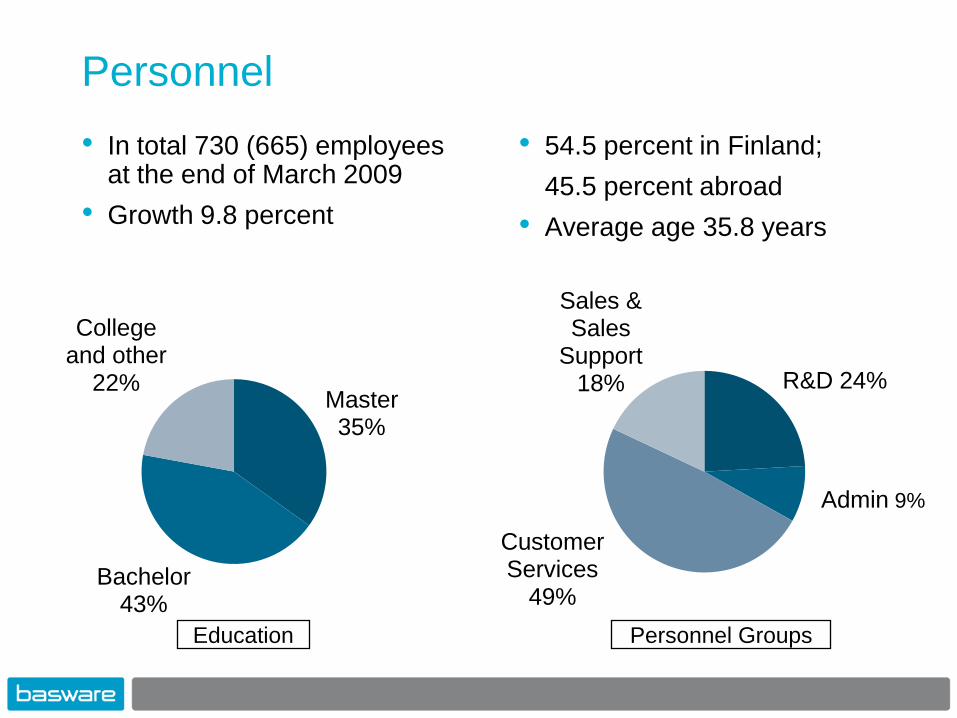
Personnel
• In total 730 (665) employees at the end of March 2009
• Growth 9.8 percent
• 54.5 percent in Finland;
45.5 percent abroad
• Average age 35.8 years
R&D 24%
Admin 9%
Customer Services
49%
Sales & Sales
Support 18%
Personnel GroupsEducation
Master35%
Bachelor 43%
College and other
22%
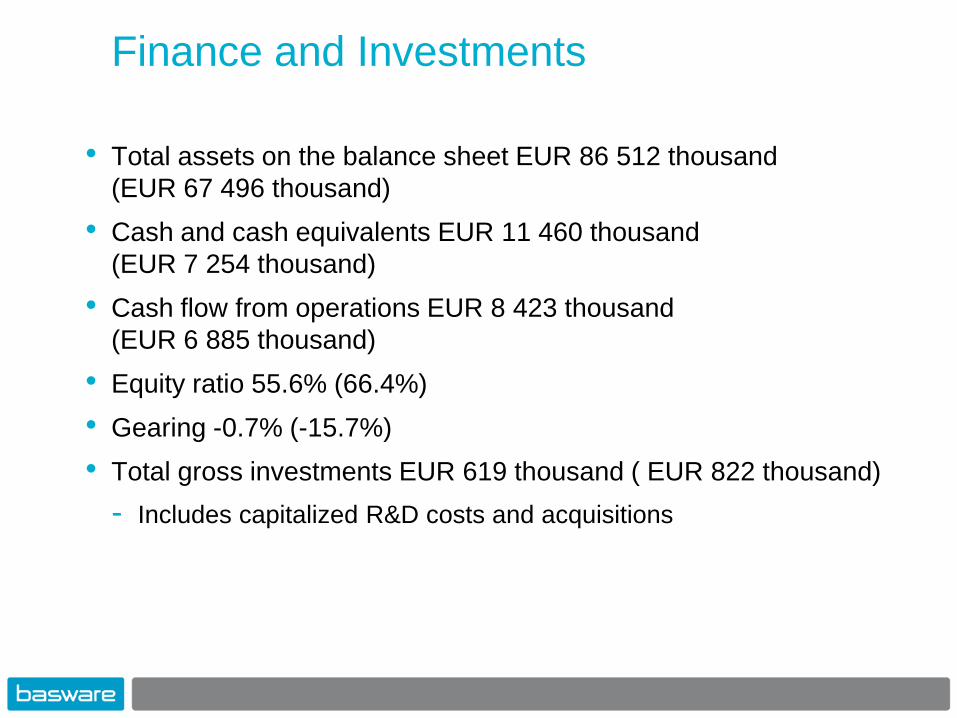
Finance and Investments
• Total assets on the balance sheet EUR 86 512 thousand
(EUR 67 496 thousand)
• Cash and cash equivalents EUR 11 460 thousand
(EUR 7 254 thousand)
• Cash flow from operations EUR 8 423 thousand
(EUR 6 885 thousand)
• Equity ratio 55.6% (66.4%)
• Gearing -0.7% (-15.7%)
• Total gross investments EUR 619 thousand ( EUR 822 thousand)
- Includes capitalized R&D costs and acquisitions
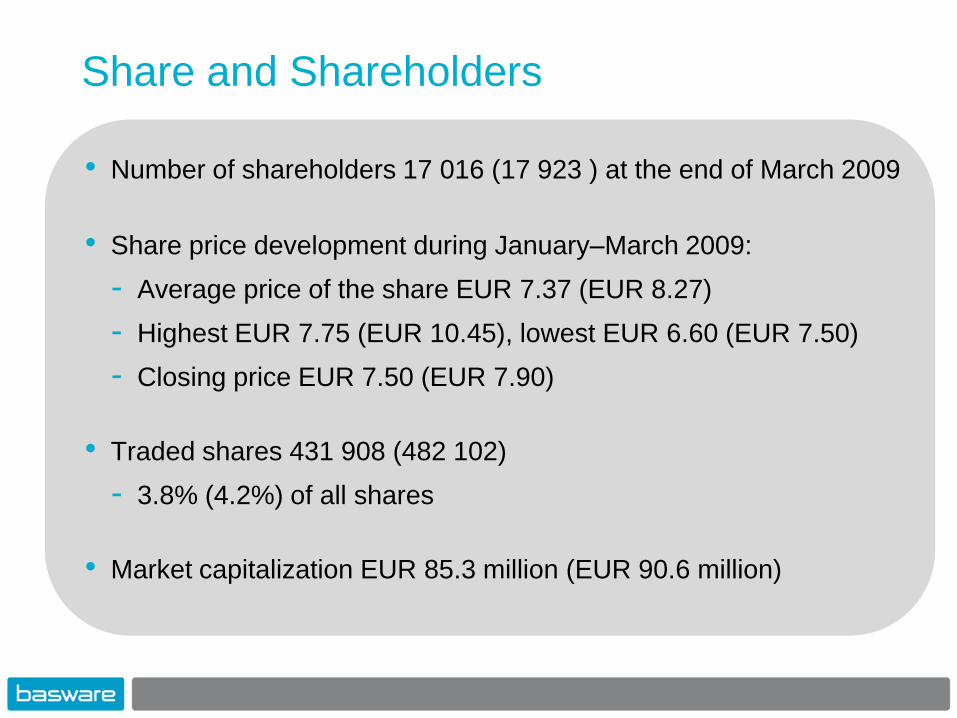
Share and Shareholders
• Number of shareholders 17 016 (17 923 ) at the end of March 2009
• Share price development during January–March 2009:
- Average price of the share EUR 7.37 (EUR 8.27)
- Highest EUR 7.75 (EUR 10.45), lowest EUR 6.60 (EUR 7.50)
- Closing price EUR 7.50 (EUR 7.90)
• Traded shares 431 908 (482 102)
- 3.8% (4.2%) of all shares
• Market capitalization EUR 85.3 million (EUR 90.6 million)
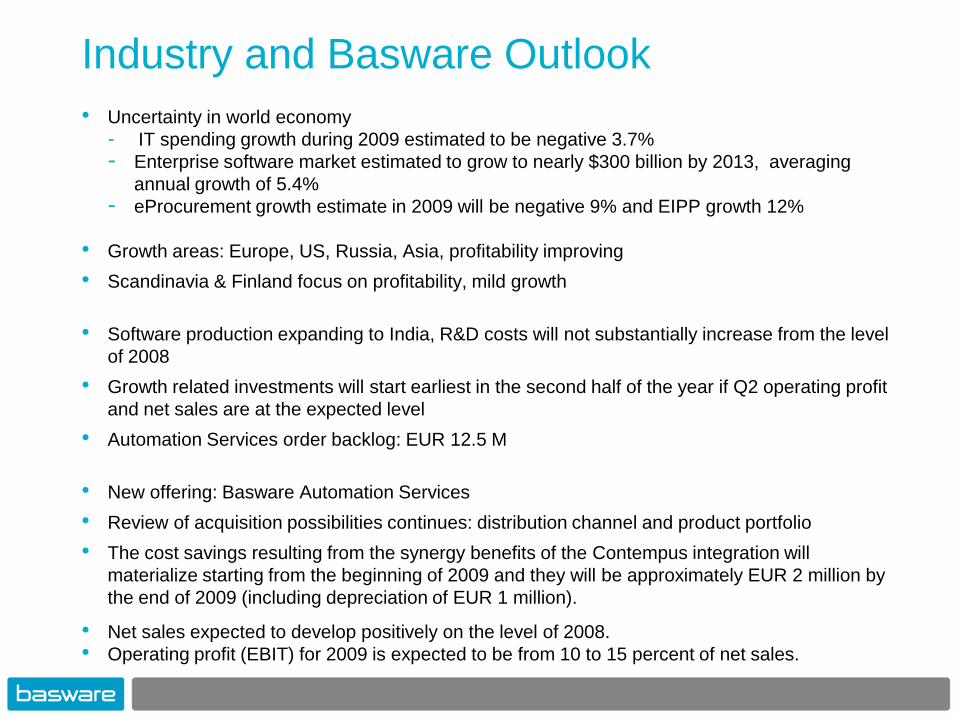
Industry and Basware Outlook
• Uncertainty in world economy
- IT spending growth during 2009 estimated to be negative 3.7%
- Enterprise software market estimated to grow to nearly $300 billion by 2013, averaging
annual growth of 5.4%
- eProcurement growth estimate in 2009 will be negative 9% and EIPP growth 12%
• Growth areas: Europe, US, Russia, Asia, profitability improving
• Scandinavia & Finland focus on profitability, mild growth
• Software production expanding to India, R&D costs will not substantially increase from the level
of 2008
• Growth related investments will start earliest in the second half of the year if Q2 operating profit
and net sales are at the expected level
• Automation Services order backlog: EUR 12.5 M
• New offering: Basware Automation Services
• Review of acquisition possibilities continues: distribution channel and product portfolio
• The cost savings resulting from the synergy benefits of the Contempus integration will
materialize starting from the beginning of 2009 and they will be approximately EUR 2 million by
the end of 2009 (including depreciation of EUR 1 million).
• Net sales expected to develop positively on the level of 2008.
• Operating profit (EBIT) for 2009 is expected to be from 10 to 15 percent of net sales.
Next interim report on July 10, 2009
Analyst and press briefing takes place on July 10, 2009 at
11.00 in Hotel Kämp, Pohjoisesplanadi 29, Helsinki,
Finland.
Welcome!