basics of photon detection and statistics -...
TRANSCRIPT

Basics of photon detection and statistics
Beam Diagnostics Using Synchrotron Radiation:
Theory and PracticeUS Particle Accelerator School
University of California, Santa Cruz
San Francisco — 2010 January 18 to 22
Jeff Corbetta, Alan Fishera, Walter Moka, Weixing Chengb
a - SLAC National Accelerator Laboratoryb - Brookhaven National Laboratory

Outline
• Pulsed LED to simulate the synchrotron radiation light
• Photodiode used as sensor to detect the light
• Statistics basics
Jan/18/2010 2Basics of photon detection and statistics

Synchrotron Radiation Pulse
Jan/18/2010 3Basics of photon detection and statistics
• Several ps to 100ps pulse lenth (RMS) from most of third generation light sources
• Broadband from IR to x-ray
• Huge number of photons per pulse (depends on current, magnet field strength, aperture, filters etc)
• Spatial distribution (s, p –mode from dipole) These broadband spectrum are average
effect of many electrons’ radiation, or one
electron radiation for many photons in long
time scale.

Radiation Theory (time-domain)
Jan/18/2010 4Basics of photon detection and statistics
• One electron (j-th) in the bunch radiates an electromagnetic pulse e(tj)
• Total radiated field is
N
j
jttetE1
)()(
5 0 52
1
0
1
22
2
F x( )
55 x
~10 fs 0 2000 4000 6000 8000 1 104
1000
500
0
500483.063
541.862
Rad_Field_Gaussi
1 104
0 ibunch length
( ~ps)
Single electron: Lots of electron from the bunch:
e(t) E(t)
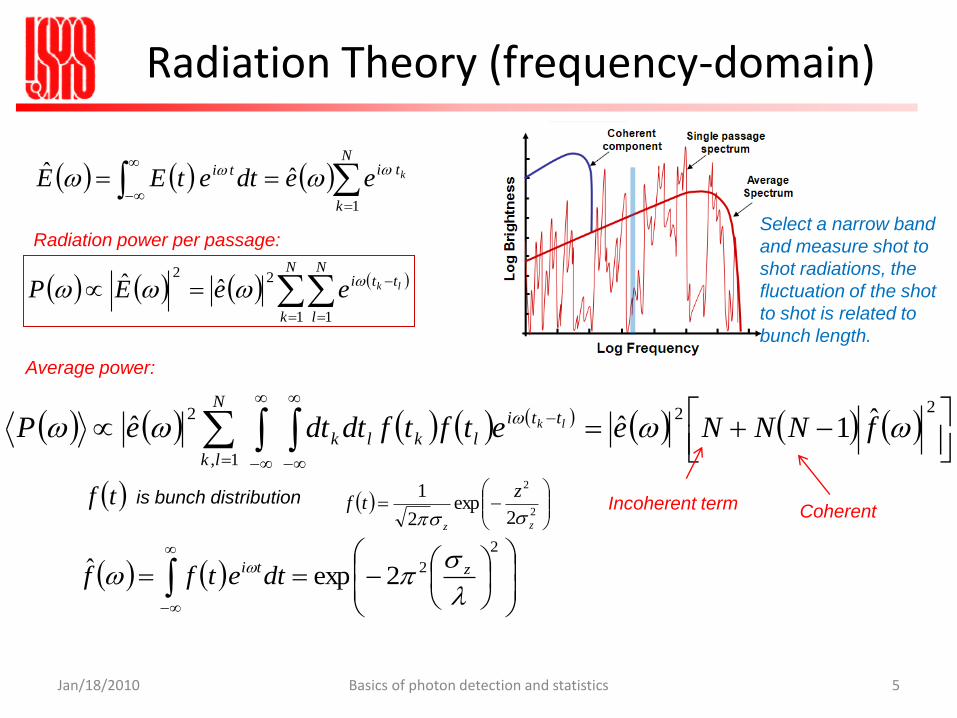
Radiation Theory (frequency-domain)
Jan/18/2010 5Basics of photon detection and statistics
N
k
titi keedtetEE1
ˆˆ
N
k
N
l
tti lkeeEP1 1
22
ˆˆ
Radiation power per passage:
22
1,
2 ˆ1ˆˆ fNNNeetftfdtdteP
N
lk
tti
lklklk
Average power:
tf is bunch distribution
2
22expˆ
sp zti dtetff
2
2
2exp
2
1
zz
ztf
sspIncoherent term Coherent
Select a narrow band
and measure shot to
shot radiations, the
fluctuation of the shot
to shot is related to
bunch length.

Simulated pulse from LED
Jan/18/2010 6Basics of photon detection and statistics
ton
T
Pulse driver
50ps FWHM minimum laser pulse
Repetition rate 31.25kHz to 80MHz
Pulse energy adjustable
Laser heads from 375nm to 1550nm
LED heads from 255nm to 600nm
External trigger / sync output
LED – Light Emitting Diode
Semiconductor light source
Visible, UV, IR wavelength
High brightness

Pulse LED with DG535
Jan/18/2010 7Basics of photon detection and statistics
Typical rise time 2-3ns,
hard to get pulse less than
1ns
With fast rise time option,
could get 100ps (20% -
80% amplitude)
Use ~10ns minimum due to
LED limitations

Photodiode
Jan/18/2010 8Basics of photon detection and statistics
• Convert light to current/voltage signal
• Similar to regular semiconductor diode
• Photon hit the diode => create electron/hole pair
• Positive charge collected at P-layer, negative charge in the N-layer
LED symbol
Photodiode symbol

APD principle
Jan/18/2010 9Basics of photon detection and statistics
Diode operates in reverse bias mode
Electrons drift to N-layer with large
kinetic energy, holes drift to P-layer
Impact ionization will generate mode
electron-hole pair
Avalanche of impact ionization
Internal gain (typical gain 100 ~1000)
A single electron entering the p-layer can
generate a large number of electron-hole pairs
which contribute to an observed photocurrent

SPAD (Single Photon Avalanche Diode)
Jan/18/2010 10Basics of photon detection and statistics
• SPAD is APD working in Geiger mode
• Reverse bias voltage well above the breakdown voltage. (APDs operate at a bias lesser than the breakdown voltage)
• Able to detect low intensity signals (down to the single photon)
• APD a single photon produces only tens or few hundreds of electrons, but in a SPAD a single photon triggers a current in the mAregion (billions of billions of electrons per second) that can be easily "counted".
• APD is a linear amplifier for the input optical signal with limited gain (~hundreds), the SPAD is a trigger device so the gain concept is meaningless.
• SPAD used for bunch purity monitoring

APD Examples
Jan/18/2010 11Basics of photon detection and statistics
Hamamatsu Photonics S5343
PerkinElmer C30902
200nm – 1000nm, peak at
620nm

Photomultiplier tube
Jan/18/2010 12Basics of photon detection and statistics
Photodiode Photomultiplier
Good linearityWide response spectralLow noiseLow cost
High gain (~10^8)Fast response timeHigh sensitivity (detecting low level light, 30 photons per second)
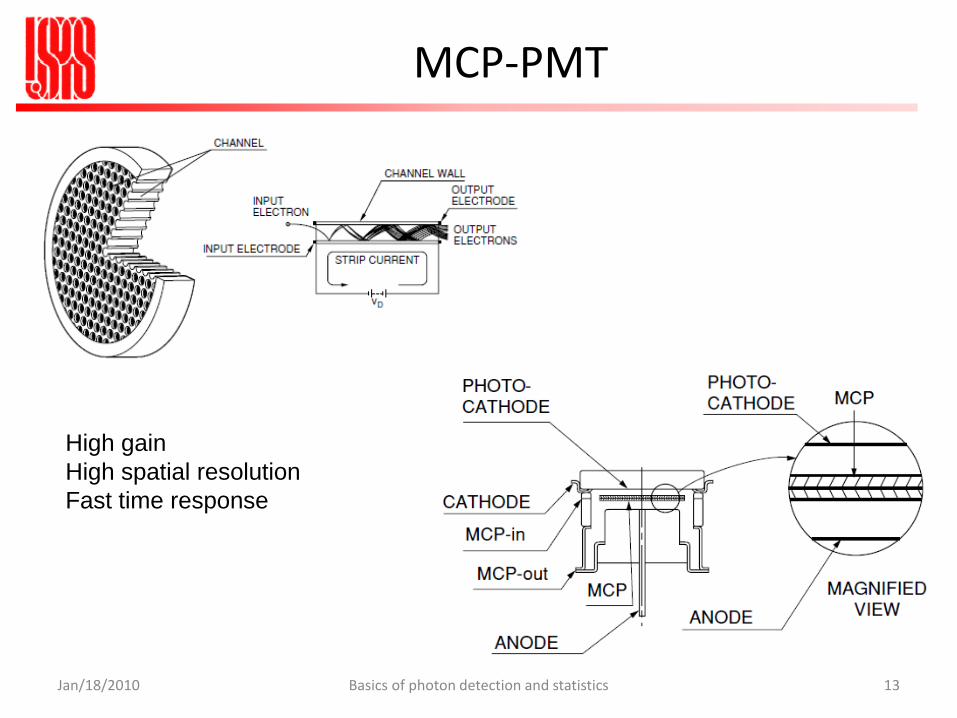
MCP-PMT
Jan/18/2010 13Basics of photon detection and statistics
High gain
High spatial resolution
Fast time response

Jan/18/2010 14Basics of photon detection and statistics
Hamamatsu R2809U-06 (or R3809U-52), used
at PF, Spring-8, Diamond, ESRF etc. for the
bunch purity and filling pattern monitor
Transit Time Spread = 25ps, 160nm to 650nm
peak at 400nm
Time Correlated Single Photon Counting (TCSPC)
MCP-PMT used for bunch purity and filling pattern measurement

Statistic of sampled data
Jan/18/2010 15Basics of photon detection and statistics
Gaussian distribution
N samples,
Mean:
Std:
Std of the mean:
Random error
Systematic
error
N – number of samples 22
sysrandtotal
meanrand
mean
xxx
x
N
s
ss

Statistics in the fluctuation bunch length measurement
Jan/18/2010 16Basics of photon detection and statistics
ALS Fluctuation Bunch Length
Measurement
(1nm FWHM band pass filter at 632.8nm)
APD output signal
Ns – number of sample, > 5000
to get <2% measurement error of
2
One trigger trace
5000 sample
histogram
W – radiation energy of per passage,
represented by APD pulse amplitude or area