banking risk analysis in tunisia: a case study of bte bank
TRANSCRIPT

http://bmr.sciedupress.com Business and Management Research Vol. 8, No. 4; 2019
Published by Sciedu Press 8 ISSN 1927-6001 E-ISSN 1927-601X
Banking Risk Analysis in Tunisia: A Case Study of BTE Bank Hanen Khanchel1
1 Institute of Advanced Business Studies, Carthage, Tunisia Correspondence: Hanen Khanchel, Institute of Advanced Business Studies, Carthage, Tunisia. Received: November 4, 2019 Accepted: November 28, 2019 Online Published: January 15, 2020 doi:10.5430/bmr.v8n4p8 URL: https://doi.org/10.5430/bmr.v8n4p8 Abstract The banking activity represents a strategic sector of sustainable economic development in Tunisia. Hence, Tunisian banks have the status of financial institutions that earn profits by providing financial services to customers by dealing with risks. Therefore, lending decisions for these establishments are strategic as they can avoid the risk of loan recourse. However, the assessment of borrowing sanctions in Tunisian banks is based on credit rating models. Consequently, it is important to assess the riskiness of the banking sector in Tunisia. Indeed, Tunisian banks have kept voluminous data concerning their clienteles which can be considered as critical knowledge assets which can be processed via underwritten credit management tools. This tools denote a recent development of statistical techniques and promising tools of data mining and data processing. The current study attempts to develop the rating model as a decision support system to credit approval evaluation at Tunisian banks based on applicant’s characteristics; the proposed model is mainly based on quantitative and qualitative criteria can be used to help credit officers make better decisions when evaluating future loan applications. A real-world credit application of cases of both granted and rejected applications from BTE bank was employed to develop the rating model. The experimental outcomes showed that this approach area promising addition to the existing classification methods. It therefore requires a high responsibility and commitment of managers in the process of evaluation and decision-making to reduce both the risk of default and the risk of debt distress. Keywords: risk management, credit, scoring, profitability, BTE Bank 1. Introduction The role of bank regulators in macroeconomic stability is a key issue for both researchers and policy makers. The global financial crisis of 2007-2009 was the most serious crisis since the Great Depression, affecting the banking systems of many countries. Many authors have suggested that the main contributor to the financial crisis was a regulatory framework unwise, as weak regulatory frameworks and supervision contributed to the crisis and that measures such as strengthening incentives for monitoring private can reduce the likelihood of a new crisis (Zi-Yi Guo, 2017). In response to the recent financial crisis, the regulatory reform program represented by Basel III as proposed by the Basel Committee on Banking Supervision has increased the level of complexity of the global regulatory landscape. There are a variety of different regulatory and banking supervisory structures and some may be better suited to improving the development, performance and stability of banks. It is important to note that the new regulatory requirements will likely have a fundamental impact on the shape of the business models that will be used by banks in the future. Banking regulation is always evolving to ensure continuity and survival since banks play an important role in the economy. This regulation, that it is national or international, allows the strengthening of assets and bank capital so they can withstand shocks or financial crises. Banks should therefore adapt whenever regulations change or if the new standards to be observed. They pay more attention to new laws to end to avoid sanctions imposed by the Tunisian central bank or to avoid harming the reputation and the bank's brand image. The country's economy is not in favor of banks. Indeed, regulation becomes more stringent and severe. The increased regulation by the authorities seeks primarily to secure the financial market and prevent potential sources of crisis for banks. The lack of free banking has directly influenced the profitability and performance of banks. The annual changes in regulations destabilizes these companies and can create a confused level of management methods and the banking process. The Central Bank also seeks to reduce the granted loans, especially consumer loans, by the pressures she has made to the rate of the financial market as part of its Monetary Policy to control inflation. Banks are required to manage multiple banking risks that require a lot of human and financial resources. All these elements, with the

http://bmr.sciedupress.com Business and Management Research Vol. 8, No. 4; 2019
Published by Sciedu Press 9 ISSN 1927-6001 E-ISSN 1927-601X
importance of recognition of provisions, have a direct impact on the result of the banks in which the pressures continue to grow in a competitive sector. One of the most important risks and on which the memory gate is the credit risk. This risk is defined by Philip Thomas (2016) as: “Credit risk is the emerging specific risk of a lending operation. It is the probability that a negative event affects the debt service that the debtor has committed. “It is also called counterparty risk or credit risk. It corresponds to the debtor's inability to meet its obligations to the bank. It can also be caused by the deterioration of the financial situation of the borrower during the credit repayment period which reduces the credit repayment probability. It is considered the most serious banking risk and regulators the gave more importance in recent years. It can have a direct financial impact on banks by the loss of unreturned capital or non direct consequences of the devaluation of the bank's image or loss of customer confidence. Budget allocation is the main business of a bank. It is also the largest and has more impact on the profitability of each credit institution. In addition, the rapid expansion of the level of non-performing loans showed interest to understand the determinants of credit risk. Proper management of risk associated with this activity thus directly influences the profitability and net banking income. Banks usually choose between two credit management strategies is one volume and one is in quality. But given regulatory pressures that continue to increase each year, these strategies continue to merge and converge to a single joint strategy. Counterparty risk has always been the focus of research established by practitioners and theorists who have developed several approaches and methods of evaluation and management of this risk. One of the most important tools that we gave the most importance is the credit scoring .It an essential tool for each bank for granting a score to borrowers of the bank according to risk category. The focus of this paper is on financial regulation and supervision, principally the latter, with a view to recommending new approaches that could strengthen the effectiveness of financial supervision and reduce the chances that financial supervisors would miss or fail to deal with the emerging symptoms of another such crisis. In order to discuss improvements, it will be necessary to discuss some of the more important causes, but this paper is not intended to provide a comprehensive analysis of the manifold ways in which financial regulation and supervision contributed to the financial crisis. Given the aforementioned variables in our analysis, we ask to find out what should Tunisian bank to properly manage credit risk. We can ask: What is the approach used by the Tunisian bank to assess counterparty risk and how this approach can enjoy a bank Scoring Model to assess this risk? To address this problem we first must meet several secondary issues in the same subject: How the national and international regulation can affect the management of credit risk? What are the preventive management tools of credit risk? From these issues we can make assumptions. Indeed, the evolution of risk estimation tools continue to evolve each year. Sometimes treatment and integration of new standards in these models generate dysfunctions in banking. According to this case study, which follows three steps: As a first step, we will evaluate the credit risk management process. Then we will see all the rules to follow and credit risk management practices. Second, we will analyze credit management techniques and see their contributions to profitability. Finally, we will study the rating model of the BTE bank and the precision to detect the risk by analyzing two competitors. We will then propose recommendations to improve this model. 2. Literature review Credit institutions have always sought to acquire or develop tools for management and risk detection seen the tremendous impact they have on the profitability of a bank and their impact on the continuity of banking. The survival of a bank in a competitive modern economy rests primarily on its expertise in the risk management field. It is imperative that the bank gives enough resources to this function to minimize the consequences of the contingency. 2.1 Risk Type: 2.1.1 Definition of Bank Risk Risk is an identified hazard associated with the occurrence of an event or series of events, perfectly describable, which we do not know if they will happen but we know they are likely to occur in a exhibiting situation. It is easy to understand why the concept of risk, thus defined, does not describe the situations of uncertainty and report the terms of

http://bmr.sciedupress.com Business and Management Research Vol. 8, No. 4; 2019
Published by Sciedu Press 10 ISSN 1927-6001 E-ISSN 1927-601X
decision-making in such contexts. We know what we do not know but that's about all we know: there is no better definition of uncertainty. Knowing how to anticipate, track down potential overflows, set up a monitoring system and systematic collection of data to trigger alerts when unusual events occur: Risk-Type 2 The banking financial institutions are subject to the various categories of risk which are quoted credit risk, operational risk, market risk and liquidity risk. 2.1.2 Credit Risk The credit risk or counterparty risk is defined as: The risk resulting from the uncertainty that the ability or willingness of counterparties or customers to meet their obligations. Prosaically, there is therefore a risk to the bank if it goes into position to wait an inflow from a customer or a market counterparty. Credit risk is the risk that a borrower defaults or economic or financial situation deteriorates resulting from devaluation of the debt that the bank holds on him. This risk depends on the probability of counterparty default whether a country, an individual, a company or a credit institution with which the bank is engaged. This is the biggest risk that threatens the well being of financial institutions. It represents between 75% to 85% of total bank risk. 2.1.3 Operational Risk Operational risk is defined “as the risk of loss resulting from inadequate or failed internal processes, people and systems or from external events” according to the Basel Committee. Operational risk is the potential loss arising from shortcomings or defects attributable to material and human resources procedures failed internal systems, external triggers, fraud, etc. That is the risk resulting from an external event that disrupts the objectives of the institution (natural disasters, changes in law or regulations) or human error (fraud). 2.1.4 The Market Risk It corresponds to the decrease in the value of the asset portfolio in bonds and securities held by the bank following the unfavorable change in the market, the risk comes from the uncertainty of gains resulting from changes in market conditions. This type of risk mainly arises from changes in market parameters (interest rates, stock indices ...), where market volatility, liberalization, and new technologies that are accompanied by a remarkable increase in the risk of walk. 2.1.5 Liquidity Risk Liquidity risk is the inability that can have either a market to absorb the volumes of transactions expanded without significant impact on the price of the asset, or is an economic agent, to meet its immediate commitments. For a bank, the liquidity risk is to not be able to take on large withdrawals of short-term deposits. Liquidity risk may result from an inability to refinance a bank while, it will have achieved a strong transformation of its short-term deposits into long-term loans. 2.2 Legislative Framework for Credit Risk at the National and International 2.2.1 Legislative Framework internationally: Credit risk is regarded internationally as the most significant risk due to the impact of losses that can result on the economy. International entities have sought to find ways to minimize the occurrence of these losses. One of these international organizations is the Basel Committee that an international organization with a significant reputation since 1974 and seeks to facilitate the management of this risk by banks. 2.2.2 Basel Committee The Basel Committee is a forum which is held 4 times a year and which are treated regularly matters relating to banking supervision. This committee provides:
• Strengthening the security and stability of banks.

http://bmr.sciedupress.com Business and Management Research Vol. 8, No. 4; 2019
Published by Sciedu Press 11 ISSN 1927-6001 E-ISSN 1927-601X
• The establishment ratios to be maintained to ensure the bank's survival (eg. Solvency ratio, structural ratio of long-term liquidity ...)
• The issuance of bank compliance standards • The promotion of international cooperation on prudential supervision.
Following the continuous and rapid development of the banking business and customer demand, the Basel Committee seeks to find appropriate solutions to ensure the continuity and the bank's survival. The Committee acts as an informal forum for the exchange of information on transformations in regulations and supervisory practices as well as on current events in the financial field. It therefore aims to prevent the occurrence of financial crises caused by bank failures (eg subprime crisis) 2.3 The Agreement of Basel and Its Impact on Credit Risk The first agreement of Basel was focused on credit risk. The committee sought to minimize the credit because that's the most important risk for banks and responsibility for the failure of banks like Herslatt bank in 1974. The committee took place in 1988. The members agreed on several points concerning credit risk. Indeed, the Basel Committee has communicated at the end of its course this risk depends on the nature of the applicant to be an individual, a company, a government or a country. Applicants do not have the same risk even those in the same sector. This has led to the use of different interest rates for different customers of a bank, as well as the use of a new ratio limiting this risk is the Cooke ratio. This ratio takes this name Peter Cooke, the CEO of the Bank of England. He had been the first president who proposes the creation of Basel Committee. Cooke ratio is calculated using the formula: Cooke Ratio = equity of a bank / the sum of weighted credit exposures
- The capital is calculated the share capital and disclosed reserves and other components such as undisclosed reserves, revaluation reserves, unrealized gains from revaluation of portfolio securities and provisions.
- The sum of the weighted credit exposure is the sum of risks to which the bank is exposed. It is calculated as a sum of various loans granted by weights being 50% for loans secured by a mortgage, 20% for loans to international organizations or States. The short-term liabilities (repayable within one year) are not included. This ratio is compared to the 8% level.
For banks with equity representing more than 8%: it is low-risk banks through long-term capital detainees could cover the bank in case of risk realization and customer default. According to this ratio, these banks have the ability to give more credit to improve their performance. For banks with equity representing less than 8%: these are banks with high bankruptcy risk in case of default of their customers for their commitments. These banks should seek to improve the quality of their own capital as well as stopping agree on new loans. The committee also result in recommendations on credit risk management including the approval procedures are cited and loan administration, the appropriate documentation to credit and continuous risk assessment. Also, the committee recommended to banks to ensure ongoing monitoring of credit, financial statements and other information to customers. 2.4 The Agreement of Basel II and Its Impact on the Credit Risk The second Basel Committee was held in 2004. The Basel Committee members introduced new changes in credit risk. The biggest change was in the methods of calculation of commitments and the weights used by a bank. Indeed, the weights that were used in Basel I have been replaced by two approaches that are standardized and the approach based on internal ratings approach. - The standardized approach is a risk estimation method for the liabilities of a bank by using specialized third party risk assessment. These third parties are essentially the rating agencies.They are recognized by their reliability and efficiency when it comes to estimating the risk through the use of advanced statistical scoring models and access to information in the market financial or were still present. It cites among these agencies essentially STANDARD AND POOR, Fitch Ratings, Moody's Corporations ... The role of agencies is then the classification of assets by credit rating granted. This helped to create new weights that replaced the weights Basel I.

http://bmr.sciedupress.com Business and Management Research Vol. 8, No. 4; 2019
Published by Sciedu Press 12 ISSN 1927-6001 E-ISSN 1927-601X
The weights can take the values 20%, 50%, 100% or 150% in the case of a company. Then they take the values 0%, 20%, 50% or 100% in the case of an asset held by a country. The rating given by the agency to the country depends on an essentially economic analysis, financial and state policy. The weights used for banks depend either the collective risk of the country or the exercise banking activities is an analysis of the individual risk of the bank. It dealt in particular the calculation of capital requirements for credit risk. Unlike Basel I, which applies a weighting of single risk, the new agreement provides two methods of calculation, which have an increasing sensitivity to risk and establish several degrees of weighting. Basel II admits to the standard approach, a wide range of techniques to reduce credit risk. -The second approach is the approach based on internal ratings. This method involves introducing into the credit institution an internal system to the rating of the bank's clients. This system, despite the cost that it generates either when creating or costs required to maintain and update, provide the bank continued monitoring of credit risk. It measures the probability of customer default by statistical models based on ratios and to assess the credit risk of each customer. The standard method known as it existed, is to use the analysis performed by third parties, including rating agencies, which once validated by the prudential regulation, as a basis for the implementation of the capital requirements own in the case of a bank loan granted to the borrower subject to evaluation. The use of external evaluators work is based on several logical arguments:
• “Agencies are better equipped historical and important data on major borrowers.” • “These agencies with broad access to information from issuers which makes the standard approach more
rational and less expensive than that of assessing separately by each lender.” • “If applicable, the approach has the advantage of providing quantified data on the risk of borrowers on
comparable bases.” Commitments are divided into different asset classes, which are classified in risk classes based on ratings provided by external rating agencies. Thus a new weighting on commitments is in place: - For States : The weighting ratio takes the following values: 0%, 20%, 50%, 100%, 150% and is based on the ratings of specialized agencies (rating agencies, rating BoF ...). -For banks : The Basel Committee has yet to choose between two options: - a unique and collective risk to the risk of the country - an individual risk dissociated country risk. - For public authorities : The risk is identical to the banks but with a special weight given by the authorities of the country can be taken into account. -For companies : The weighting factor takes the following values: 20%, 50%, 100%, 150%. For example, for 50% weighted risk class, all credits in this class have a higher risk or, conversely, will have less covered by 4% equity. The outstanding innovation of the reform is the introduction and generalization of internal rating systems. This is an approach that increased accountability of institutions (transfer of accountability in terms of method and means) and reflecting the complexity and sophistication of the banking business, the difference between the types activity and the types of establishment, but also enhanced difficulty to understand risk monitoring through an essentially legal approach and / or by the application of simple and universal ratios. The purpose of this approach leads banks to develop methodologies for measuring the probability of failure. Therefore it could be very different from one bank to another. This is what proves the flexible nature of the new device. Integration and contribution of regulators persist as erect and agree to other parameters such as the amount of loss and recovery after failure, especially the treatment of guarantees and collateral. The internal rating is therefore a complete system as it deals with all counterparties regardless of their weight. In addition, it studied not only the probability of default but also the impact after failure.
http://bmr.sciedupress.com Business and Management Research Vol. 8, No. 4; 2019
Published by Sciedu Press 13 ISSN 1927-6001 E-ISSN 1927-601X
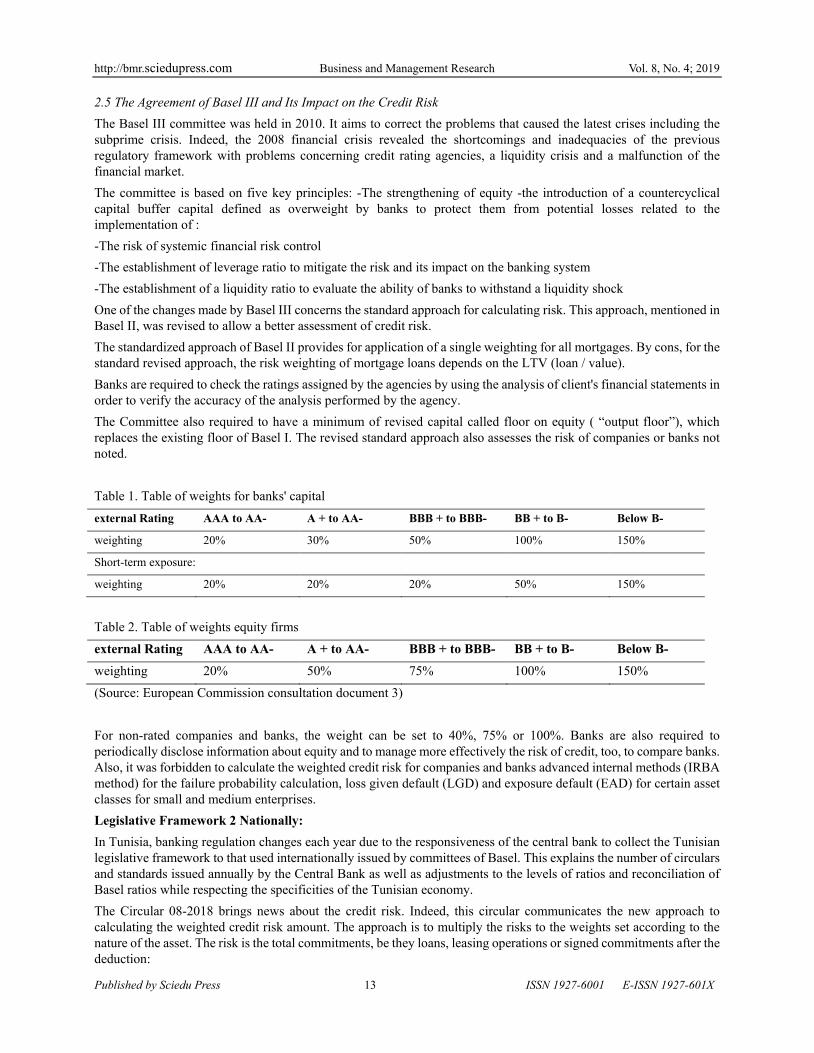
2.5 The Agreement of Basel III and Its Impact on the Credit Risk The Basel III committee was held in 2010. It aims to correct the problems that caused the latest crises including the subprime crisis. Indeed, the 2008 financial crisis revealed the shortcomings and inadequacies of the previous regulatory framework with problems concerning credit rating agencies, a liquidity crisis and a malfunction of the financial market. The committee is based on five key principles: -The strengthening of equity -the introduction of a countercyclical capital buffer capital defined as overweight by banks to protect them from potential losses related to the implementation of : -The risk of systemic financial risk control -The establishment of leverage ratio to mitigate the risk and its impact on the banking system -The establishment of a liquidity ratio to evaluate the ability of banks to withstand a liquidity shock One of the changes made by Basel III concerns the standard approach for calculating risk. This approach, mentioned in Basel II, was revised to allow a better assessment of credit risk. The standardized approach of Basel II provides for application of a single weighting for all mortgages. By cons, for the standard revised approach, the risk weighting of mortgage loans depends on the LTV (loan / value). Banks are required to check the ratings assigned by the agencies by using the analysis of client's financial statements in order to verify the accuracy of the analysis performed by the agency. The Committee also required to have a minimum of revised capital called floor on equity ( “output floor”), which replaces the existing floor of Basel I. The revised standard approach also assesses the risk of companies or banks not noted. Table 1. Table of weights for banks' capital external Rating AAA to AA- A + to AA- BBB + to BBB- BB + to B- Below B-
weighting 20% 30% 50% 100% 150%
Short-term exposure:
weighting 20% 20% 20% 50% 150%
Table 2. Table of weights equity firms external Rating AAA to AA- A + to AA- BBB + to BBB- BB + to B- Below B- weighting 20% 50% 75% 100% 150% (Source: European Commission consultation document 3) For non-rated companies and banks, the weight can be set to 40%, 75% or 100%. Banks are also required to periodically disclose information about equity and to manage more effectively the risk of credit, too, to compare banks. Also, it was forbidden to calculate the weighted credit risk for companies and banks advanced internal methods (IRBA method) for the failure probability calculation, loss given default (LGD) and exposure default (EAD) for certain asset classes for small and medium enterprises. Legislative Framework 2 Nationally: In Tunisia, banking regulation changes each year due to the responsiveness of the central bank to collect the Tunisian legislative framework to that used internationally issued by committees of Basel. This explains the number of circulars and standards issued annually by the Central Bank as well as adjustments to the levels of ratios and reconciliation of Basel ratios while respecting the specificities of the Tunisian economy. The Circular 08-2018 brings news about the credit risk. Indeed, this circular communicates the new approach to calculating the weighted credit risk amount. The approach is to multiply the risks to the weights set according to the nature of the asset. The risk is the total commitments, be they loans, leasing operations or signed commitments after the deduction:
http://bmr.sciedupress.com Business and Management Research Vol. 8, No. 4; 2019
Published by Sciedu Press 14 ISSN 1927-6001 E-ISSN 1927-601X
-Of provisions and interest reserve for asset impairmen. -Of guarantees received from the state or insurance companies: these are the guarantees having a safe or cash value. -Of security deposits or liquid financial assets. The net assets is due to the fact that it is non-risky secure commitments for the bank. The weighting value ratios have the values of 0%, 20%, 50% or 100% depending on the type of engagement that either on- or off-balance. The balance sheet commitments represent the financial situation of the business assets it has and liabilities that it faces. By cons, off-balance sheet commitments concern the rights and obligations that they can improve the financial situation in the event of their achievements: these reciprocal commitments such as leasing or discount operations. Weighting 0% is used for non-risky assets such as claims on the central bank of Tunisia, direct competition to the state, guarantees issued by the Tunisian state and the values crate. Weighting 20% regarding balance sheet commitments such as loans to local and regional administrations or loans to foreign governments or loans to banks based abroad and off-balance sheet commitments such as guarantees or bonds for institutions subject settled in Tunisia, documentary credits to banks or financial institutions based abroad. This weighting is given to assets with low risk. While the 50% quota is used for liabilities with a moderate risk assets such as housing loans, real estate leasing transactions (balance sheet exposure) customs bonds or downstream. The percentage of 100% is used for customer loans (unpaid loans, furniture leasing) debt to financial institutions with a duration greater than one year (balance sheet commitments), securities or guarantees in favor of customers or commitments funding given in favor of customers. The 100% quota is used for risky commitments generally to individuals because of the difficulty of accurate estimation of credit risk and the problem of moral hazard. 3. Scoring Model Used by the BTE Bank Risk management traditionally has two components: a quantitative component (rating, scoring) that is based on calculations and financial data and a qualitative component that is based on information which is based on information which reflect the intrinsic position and the company's quality. Generally, the qualitative component complements the quantitative part of the decision on a credit application. Scoring is used as an essential tool for credit management. Banks place the most importance to this tool because it classifies borrowers according to their risk and choose the appropriate rate of interest on each risk class. When the credit scoring model is combined with a relevant qualitative analysis for a company the bank should be able to minimize these potential losses they are by no refund customers or bad choices in the interest rate facing the risk. In this paper we will detail the credit scoring mechanisms used in BTE Bank and compare two companies that hold two credit portfolios to be able to testify the importance of this model for the classification of risk. 3.1 Description of the Risk Department The risk department was introduced at the inception of the BTE Bank in 1982. His role was the risk assessment of the potential of each investment for the bank. Following the change in typology of the bank in 2004 as an universal bank, the risk department has evolved in terms of activity and introduced in these activities the management of various banking risks. The department gives more importance to the credit risk by providing more financial and human resources to closely monitor this risk. Indeed, the bank has allocated 4 positions breasts risk department that assess counterparty risk customers by making analysis based on quantitative and qualitative elements of the bank's corporate customers. These analyzes are based on several tools we cites the exchange Central bank data system that contains all historical data to learn about customer payments incidents and to make statistical studies to have a more adequate judgment of the customer risk quality. Another tool that is the most used and most important in the bank that is the model of Scoring for granting a score to each company to be classified according to risk. The persons responsible for monitoring credit risk is based on a score called credit score that contains qualitative data of a company. These data are important when it comes to the decision on a request received credit. 3.2 Definition of the Scoring Model in BTE Bank The statistical method used to predict the likelihood that a potential or existing borrower will default on a given horizon is called the Credit Scoring. This method estimates the risk of credit loans. To do this, it uses historical data and statistical techniques to try to isolate the specific characteristics of borrowers experiencing an event of default / failure.

http://bmr.sciedupress.com Business and Management Research Vol. 8, No. 4; 2019
Published by Sciedu Press 15 ISSN 1927-6001 E-ISSN 1927-601X
Following the changes in banking regulations, BTE have changed in the end of 2018 its scoring model to adapt to the regulatory requirements. In 2019, the granting of credit BTE requires a complex model to minimize the risk of customer default. Indeed, this model is composed of several sub-models that we found: the logistic regression model, the score AFDCC ... Each sub model is created in a database formed corporate customers in the bank and covers a range of ratios. Each model therefore seeks to give a note to clients based on historical data and on that note the banker can judge if he agrees to grant, withhold or limit the client's funding. The model is made on the basis of data collected from client companies of BTE. Selected companies are SMEs since the main segment of the BTE customers consists of small and medium enterprises. The following diagram shows the distribution of defects per sector for SMEs in a year:
(Source: National Institute of Statistics).
According to this diagram each sector is characterized by a different average probability profitability and the development of each sector. In fact, even within each sector each bank has a different probability of default prompting banks to find the tools to estimate the fault of companies. This shows the importance of using the scoring model allows banks to use historical data to test the future solvency of companies. The creation of a scoring model requires several stages:
• The collection of information: the bank collects financial statements and accounting records of the companies that could be included in the sample
• Creating database: consolidation of companies selected in the sample according to its financial health • The selection of parameters and ratios: choice of ratios that we consider relevant for the comparison of
companies • The construction of the model : These models are used only on legal persons (companies).
For individuals, loans are granted following a personal analysis of the bankers of the BTE checking several customer data as its payment incidents, history in terms of appropriations and income. Each model uses several ratios that can be of financial ratios, profitability ratios ...

http://bmr.sciedupress.com Business and Management Research Vol. 8, No. 4; 2019
Published by Sciedu Press 16 ISSN 1927-6001 E-ISSN 1927-601X
4. Logistic Regression Model 4.1 Definition of the Logistic Regression Model Logistic regression or logit is a highly variable multi-model used by banks for customers' selection. This model is used when the dependent variable is qualitative. The explanatory variables can be against by either qualitative or quantitative. The dependent variable is usually the occurrence or not of an event and the independent variables are those that may influence the occurrence of the event that is to say, the variables measuring exposure to a risk factor or a factor protective or variable representing a confounder. The ratios used by banks in this model are: Ratios Management Setting the ratio Weight Ratio R1 Fixed assets / Permanent Capital (Equity & Debt MLT) -2.896 R2 financial autonomy ratio = Shareholders' equity /
permanent equity (Equity & Debt MLT) -2.766
R3 cost of debt = Financial Expense / Liabilities Short term Banking
26.827
R4 Time payment of suppliers = payables x 360 / Purchase Costs of goods sold -COGS
-0.001
R5 Time payment from customers = Customers x 360 / Sales HT
-0.005
R6 Operating profit / Permanent Shareholders -7.32 R7 Operating income / fixed assets + working capital -0.634 Constant 1,791
• Fixed assets / Permanent Shareholders: weight is an indicator of capital relative to the company's capital structure.
• Equity ratio: The debt-equity ratio is an indicator for determining the level of dependence of a company to external financing, including bank loans. Indeed, this indicator assesses the percentage of equity in the capital structure and or deduct the weight of long-term debt in the company's balance sheet. The higher the ratio, the higher a company is independent of banks. For a company to be considered autonomous this ratio should not exceed the 50% threshold: If the equity account for more than half of the capital structure, this means that the debts make up less than half of the permanent capital. The company can cover its debts with equity. The financial strength of the cost of debt ratio measures the financial burden of the total banking competition.
• Time payment of suppliers: It is an indicator of the average payment to suppliers, taking into account the time they give. This ratio is always expressed in number of days.
Over this period, the shorter the company's bargaining power with its suppliers is low and the Treasury suffering because of regulations rapides. En hand, if this ratio is high it can be interpreted that the company would have problems.
• Customer payment period: It is an indicator of the average collection period of customer regulations, taking into account the time themselves granted by the company. This ratio is always expressed in number of days. Over this period, the shorter the company's bargaining power with its customers is strong. Over this period, the higher the company's bargaining power with its customers is low and the Treasury suffers because of early settlements. (Add firms selling prompt cash). According to the calculation of different ratios, we calculate the score S1 by multiplying the ratio by weight it has.
The formula E score S1 is: S1 = 2896 * R1-2.766 * R2 + 26 827 * * R3-0.001 R4-0.005 R5-7.32 * * * R6-0.634 R7 + 1.791
Note according to the formula of the score that the greatest weight is the ratio of R3.

http://bmr.sciedupress.com Business and Management Research Vol. 8, No. 4; 2019
Published by Sciedu Press 17 ISSN 1927-6001 E-ISSN 1927-601X
The BTE attaches highest importance to this ratio as it indicates the weight of the financial burden of the company short-term debts and this allows to interpret the indebtedness of the company in the short, the importance of financial charges and interest it must pay and his ability to repay in the event of new lending. Second, the bank grants the R7 ratio that also according to this score we can calculate the customer's probability of default, which is a quantitative measure of customer default and its failure to honor its commitments. This probability is calculated using the following formula:
Pdd = 1 / (1+ e ^ (- b)) With: b: the score obtained by the model Indeed this formula follows the following distribution and to calculate the company's probability of default:
(Source: Raschka, S., Machine Learning, 2016).
According to the score and the probability of default the bank is able to classify the company into classes depending on the model of Standard and Poors.
Standard loans Non-standard loans
classroom 1 2 3 4 5 6 7 8 Standard and Poors AAA AA AT BBB BB B CCC CC-C Probability of default in a year 0.06% 0.17% 0.40% 2.11% 7.95% 19.81% 33.02% 47.75%
Probability of default within 5 years 0.38% 0.76% 1.48% 5.92% 20.59% 40.66% 48% 66.41%
According to the ranking, the bank may choose whether or not to grant loans to the company. If the probability of default 47.75% exceeds the loan rejection is systematic prudence standard issued by the Central Bank.

http://bmr.sciedupress.com Business and Management Research Vol. 8, No. 4; 2019
Published by Sciedu Press 18 ISSN 1927-6001 E-ISSN 1927-601X
The probability of default within 5 years is calculated using the estimates of the company and can give an indication of the company's ability to meet its future commitments. More the calculated probability of default is remote in time, the greater the default risk. The Hazard Class Risks notes The class “Risk excellent” it relates to companies rated 1 or 2 The class “risk good” it relates rated companies 3 The class “moderate risk” it is on customers rated 4 “adequate risk” or 5 “medium risk” The “high risk” class it relates rated companies 6 “fragile”. The class “very high risk” it refers to the 7 companies rated “very fragile” or 8 “extremely fragile” The class “risk of probable loss” it relates to companies rated 9 “doubtful”. Companies rated 1 and 2 have a very low default risk and are considered as safe as classes. Undertakings in 3rd class have a low risk of default, but the bank must ensure their repayment capacity. Undertakings in 4th and 5th grade have a moderate risk or the bank must decide to accept or not their credits. Classes 6 and 7 are risky and the bank must limit lending to these companies unless she expects a high return or is covered for liquid sureties. Class 9 is questionable companies with a very high risk and the bank must avoid granting loans to these companies. The ratios for this model covers several aspects of the business to a more relevant assessment. Indeed, it takes into account the operating result, which is a measure of value creation for the company. Also, it takes into account debts to suppliers and customers credit for the company and its debt capacity. The variability of ratios allows to give a better score. The score obtained by this model does not give a final decision for the decision for the credit but a tool for the banker that can go wrong in making the decision. Presentation of the companies: To demonstrate the importance of scoring at the selection of funds, we will compare two companies in the same sector that are ECONOMIC AURES AUTO and AUTO. They belong to the same sector but one is characterized by a good performance, while the other is in financial difficulties. 4.2 Comparison of Two Companies: AURES AUTO and AUTO ECONOMIC According to the Logistic Regression Model Ratios Management Setting the ratio
Ratio of value for the company AURES AUTO
Ratio of value for the company ECONOMIC AUTO
R1 coverage of fixed values = Fixed assets / permanent equity (Equity & Debt MLT) 4.268885367 0.690600459
R2
Ratio of financial autonomy =Shareholders' equity / permanent equity (Equity & Debt MLT) 0.800845219 0.823674362
R3 cost of debt = Financial Expense / Liabilities Short term Banking 0.179086647 0.501333276
R4 Time payment of suppliers =Trade payables x 360 / Purchase Costs of goods sold -COGS 218.0043348 208.5051248
R5 Payment deadline clients =Customers x 360 / Sales HT 62.52465233 52.28922959
http://bmr.sciedupress.com Business and Management Research Vol. 8, No. 4; 2019
Published by Sciedu Press 19 ISSN 1927-6001 E-ISSN 1927-601X
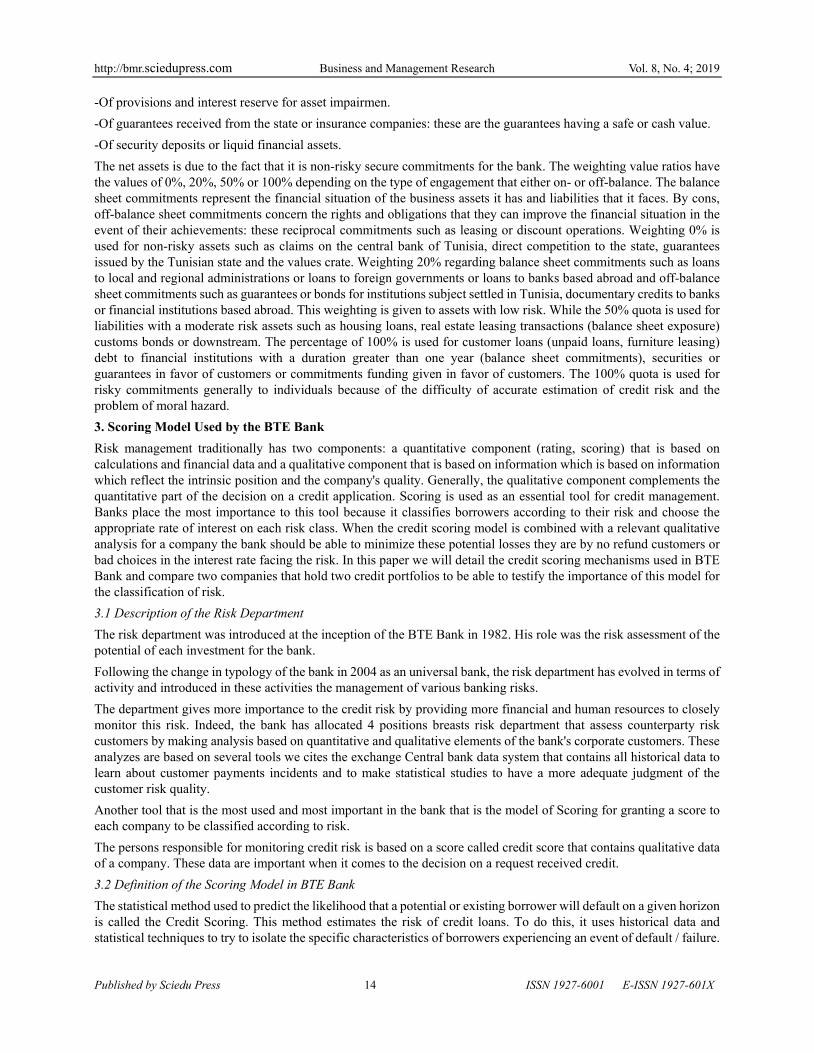
R6 ratio of financial independence = EBIT / Capital Permanent 0.525979081 0.230907697
R7 Operating profit / Fixed assets + working capital 0.525979081 0.230907697
Constant 1791 1791
-The assets of the company AURES AUTO represent 4 times the capital structure. This results in a deficiency in working capital as equity and long- and medium-term debt does not cover assets. But this situation can be caused by a massive investment phase that should be regulated as soon as the business begins to make profitable investments. For the company ECONOMIC AUTO, fixed assets cover only 69% of capitalization. The working capital is positive. This shows an equilibrium situation for the company as long-term investments are covered by long-term capital. According to the working capital, the financial situation of the company ECONOMIC AUTO is more favorable than its competitor AURES AUTO. -Concerning R2 ratio is financial independence, the equity of the company AURES AUTO is 80% capitalization indicating financial stability of the company's capital. The company is not dependent in the medium and long term, the banking system as these debt represents only 20% of equity. The company is thus able to borrow more to improve its level of activity by new investment and thus benefit from a positive leverage effect if the receivables are used to value creation. The situation is similar for the company ECONOMIC AUTO with equity representing more than 82% of equity. The company is independent and able to borrow more to improve further its profitability following the use of debts for investments. Both companies are therefore considered independent due to the importance of capital relative to their capitalization. -For R3 ratio which is the cost of debt, financial expenses represented 18% of total debt. This rate is relatively high, mainly due to the high level of short-term debt required for the company because of the failure of the cash. Indeed, it refinances the cash deficit by recourse to bank loans that are costly to the bank with a generally higher interest rate payable by the company. The high short-term debt is used to pay suppliers and to fund operations. The company should seek to regulate this situation by increasing the level of sales and a more adequate cash management. For cons, the cost of debt for the company ECONOMIC AUTO or higher financial expenses represent 50% of bank loans but this is actually due a low level of bank lending (6797544 TND for the year 2018) and seeks to quickly repay that debt through the cash surplus it has. Given the solvency ECONOMIC AUTO, it should seek more favorable terms if they need short-term debt. The cost of debt for the company ECONOMIC AUTO is high relative to the company AURES AUTO. It must manage more efficiently its financial burdens. -For supplier payment period (R4), the company AURES AUTO has an average of 218 days. This shows the high debt to suppliers compared to the cost of purchasing goods and insolvency towards them. It may also indicate the strong bargaining power it has with its suppliers. Similarly to AUTO ECONOMIC having an average of 208 days of settlement providers. This indicates a strong power of negotiation for the business with these suppliers that provide important deadlines for the company. The importance of supplier payment terms for both companies relates primarily to the type of activity of the two companies is the automotive sector. -For customer payment period (R5), clients have an average of 62 days to repay the receivables AURES AUTO. This indicates that the company has several payment terms for customers. By cons, it may indicate a weak bargaining power with customers. For AURES AUTO customer payment period is less than the supplier payment time indicating proper time management for the company. For the company ECONOMIC AUTO, customer payment period is lower than the company AURES AUTO (52 days). It therefore has a higher bargaining power with customers.

http://bmr.sciedupress.com Business and Management Research Vol. 8, No. 4; 2019
Published by Sciedu Press 20 ISSN 1927-6001 E-ISSN 1927-601X
-Concerning R6 ratio, operating results for AURES AUTO represents 52% capitalization. The company is creating value and this ratio can be deduced that the company is financially independent thanks to the importance of gross profit compared to equity and long- and medium-term debts. For cons, the ratio of financial independence for ECONOMIC AUTO is equal to 23%. Operating income covers only 1/4 of permanent capital. This shows a problem of value creation by the company that is dependent on the medium and long term debt and equity. The difference between financial independence AURES AUTO (52%) and ECONOMIC AUTO (23%) essentially amounts to the difference in operating profit (7177603 9956784 TND compared TND). 4.3 Comparison of the Scores Obtained by the Logistic Regression Model For now AURES AUTO and the ratios calculated according to the financial statements of the company in 2018 the score is equal to S1 = 2896 * R1-2.766 * R2 + 26 827 * * R3-0.001 R4-0.005 R5-7.32 * * * R6-0.634 R7 + 1.791 = -12.7% The probability of default is equal to: P = 1 / (e ^ - (- 12.7)) = 0.0003061% According to the risk classification table according to the probability of default of Standard and Poors, the company is classified in the risk category 1 on AAA rated companies. The company's default probability is low and based on historical data and financial statements of the year 2018, it is not a risky business. Solvency is almost sure the bank remains that it must take additional precautions to ensure the repayment of loans by AURES AUTO. For the company ECONOMIC AUTO, the score is equal to S1 = 2896 * R1-2.766 * R2 + 26 827 * * R3-0.001 R4-0.005 R5-7.32 * * * R6-0.634 R7 + 1.791 = 8.66% The probability of default is equal to: P = 1 / (e ^ - (- 8.66)) = 99 983% The resulting higher score shows a high risk of failure. Similarly to the probability of default, according to which the company is classified in Class 9 on very risky business. Loans granted to the company ECONOMIC AUTO are considered impaired. The bank must avoid such loans unless they are fully covered by guarantees that it is safe for their values and it provides for improving the situation of the company or its following sector studies advances it has established. 4.4 AFDCC Model Another model that uses the BTE at the same time that the logistic regression model is the model AFDCC. It is a model established in accordance with the standards and regulations of the French Association of Managers and Credit Tips. This association has recently established a scoring model that BTE chose to adapt by making changes to allow its use in the Tunisian economic framework that is AFDCC score 3. The final score AFDCC 3 was built on a sample of 369,000 businesses of all legal forms of income greater than 300 K € and owned 43 Developed by Michel Dietsch, professor at IEP Strasbourg in collaboration with the AFDCC. 202 different sectors: industry, transport, wholesale trade, retail trade and building services. The methodology used to calculate the score 3 AFDCC follows the following principles: - The ratios are weighted with respect to the median of each sector; - Each ratio is bounded (allocation of a number of points); - The sum of ratios allows a mark out of 20; - The notation is made in increments of 0.5; - According to the rating, there is a division into several risk categories. The AFDCC score is calculated through the equation: AFDCC Score = Σ (Coefn × XBN) + C With XBN: borné44 ratio

http://bmr.sciedupress.com Business and Management Research Vol. 8, No. 4; 2019
Published by Sciedu Press 21 ISSN 1927-6001 E-ISSN 1927-601X
C: constant Coefn: predefined coefficient by AFDCC and which corresponds to the ratio Xn (X1, X2 ... X6) Ratios Management Setting the ratio Weight
Ratio R1 Interest expenses in the BWR = Financial Expenses / Gross Economic result -1.255 R2 Blankets on capital = stable Resources / Capital employed 2,003 R3 debt repayment ratio = Cash flow / total debt -0.824 R4 Ratio of gross operating margin = Economic result / turnover HT 5,221 R5 Time credit providers = Commercial Debts / Purchases tax (days) -0.689 R6 Rate of change of the VA (value added) -1.164
R7 Customers found time =(Current inventory - Customer Advances + operating receivables) / Production (days) 0.706
R8 Physical investment rate =physical investments / VA 1,408
Constant -0.85444
R1: Share of financial expenses in the BWR: it is a measure of the financial burden in the gross result of the company R2: Covers of invested capital: it is an indicator of the weight of stable resources which are the capital structure and financial debt in the capital invested. R3: debt repayment ratio: This ratio measures the ratio between the debt level of the company and the amount of the CAF. It provides an estimate in years, the company's ability to generate internal resources to meet its deadlines. A multiple of 3 or 4 means that 3 or 4 years of company profits will be required to repay long-term debt. R4: Ratio of the operating margin: Measures profitability only from the company's activity. R5: credit period (days): it is a measure of debt in the total purchases for a company and gives an idea about the use of financial debts R6: VA Percentage Change: This is an activity growth indicator related to material and human resources. A7: Customers discovered (days): this ratio gives an idea about the change in assets for the company's activity and allows to deduce the value creation for the company. R8: physical investment rate: it is the value added accruing to investment: this is the part of the added value used to finance new financing. The importance of risk presented ratios is presented by the following diagram that represents the risk related to each ratio depending on its value. The formula of the score becomes: Z = -1.255 * 2.003 * R1 + R3 + R2-0.824 * 5.221 * * R4-0.689 R5-1.164 * R6 + R7 + 0.706 * 1.408 * R8-0.85444 The BTE gives more importance to the ratio R4 that gross margin since it is an important indicator to measure the company's power to create value through operational activity outside of all financial policies or tax. Score Category 0125 <Z healthy business: low credit risk -0.25 <Z <0.125 uncertain business: the presence of a moderate credit risk Z <-0.25 gamble This model does not take into account the added value that is important measure that gives an idea about creating value for the company. The weights used for each ratio are very close and the bank attaches importance to all the ratios used.

http://bmr.sciedupress.com Business and Management Research Vol. 8, No. 4; 2019
Published by Sciedu Press 22 ISSN 1927-6001 E-ISSN 1927-601X
4.5 Comparison of Ratios Ratios Management
Setting the ratio Values of ratios for the firm AURES AUTO
Value ratios for the company ECONOMIC AUTO
R1 Interest expenses in the BWR = Financial Expenses / Gross Economic result 0.3280298 0.06143106
R2 Coverage of invested capital = stable Resources / Capital employed 0.42244443 0.09064990
R3 debt repayment ratio = Cash flow / total debt 0.16971693 0.18638094
R4 Ratio of gross operating margin = Economic result / turnover HT 0.07074033 0.04520504
R5 Time credit providers = Commercial Debts / Purchases tax (days) 0.50888033 0.59501913
R6 Rate of change of the VA (value added) 0.20853481 0.13312368
R7 Customers found time = (current inventory - Customer Advances + operating receivables) / Production (days) 1.20 0.19866299
R8 physical investment rate = physical Investing / VA 0 0.01 - For the company AURES AUTO financial costs are high and represents 32.8% of the gross economic result. This essentially amounts to the repayment of short debts with high interest rates. These fillers have a direct impact on the profitability of the company. Financial expenses for the company ECONOMIC AUTO represent only 6% of the gross economic result with low debt it is long, medium or short term. AURES AUTO should seek to develop a strategy for limiting the high costs generated by debt, especially short-term debt. By cons, financial charges of ECONOMIC AUTO allows the company to borrow more and to make new investments to improve its profitability and performance. -The stable resources of AURES AUTO cover 42% of the capital invested by the ratio R2 covers the capital invested. If failure of the company it can not afford to honor its obligations and repay its investments related debts. The situation of ECONOMIC AUTO is even more difficult as the stable resources cover only 10% of the company's investments. The company's situation makes it unfavorable for the granting of new loans due to a low level of stable resources against a high level of investment. The risk of default is important and if the two companies do not realize their expectations in sales they will be unable to repay their investment-related liabilities. - Operating cash flow represents only 17% of the overall debt to AURES AUTO as the R3 ratio gives an indication of the company's ability to pay its debts by the value created in a year. The company is unable to pay its debts with all internal resources generated in the course of its business. The situation is similar to ECONOMIC AUTO with a cash flow which represents only 18.6% of debts. The internal resources generated by the two companies do not cover 1/4 of the debts which make them unfavorable for granting new loans. -Concerning the ratio of operating margin R4, the AURES AUTO operating income represents only 7% of turnover. This is due to the importance of the company's costs mainly expenses related to purchases and personnel expenses. Similarly for ECONOMIC AUTO with operating profit representing 4% of sales. The situation is similar for both companies because of an inadequate management of expenses relating to the operation. The remaining share of the turnover after deduction of these charges and can not cover the fiscal or financial burdens. -The trade payables cover 50% of purchases for the company AURES AUTO according to the ratio R5. The company finances its operations in half through debt. So for ECONOMIC AUTO, 60% of its purchases are covered by debt.

http://bmr.sciedupress.com Business and Management Research Vol. 8, No. 4; 2019
Published by Sciedu Press 23 ISSN 1927-6001 E-ISSN 1927-601X
The companies therefore use debt to finance the company's business. This basically amounts to the kind of activity that is the automobile. -The change in the value R6 gives an indication of the evolution of the business and business sales. The added value of AURES AUTO and AUTO ECONOMIC increased 20% and 13% respectively in 2018 compared to 2017. This indicates an increase in the level of sales to businesses and a Master of purchases. For cons, the signs of improvement are insufficient because of the importance of financial charges. - For AURES AUTO inventory levels and accounts receivable is important and 120% more than the actual production. This indicates a problem slump because of the importance of the stock. The company also has problems in the negotiations made with customers given the importance of deadlines for trade receivables. ECONOMIC AUTO, by cons, manages more efficiently its inventory and receivables, which represent only 20% of the production of the company. -According to the R8 ratio AURES AUTO has not made new investments in 2018 since it has difficulties to repay the debts relating to previous investments. ECONOMIC CAR also trying to limit the investment levels that represent only 1% of added value since it is still trying to repay its long and medium-term debts. -According to the results obtained by the model AFDCC ratios, the financial situation of both companies is similar. They including difficulties due to a high level of debt. We can also infer that this is a sectoral problem because the automobile sector has been severely hit by the devaluation of the dinar and a tax problem following the new regulations announced in 2018. But finance law, the improving the level of added value indicates a potential correction of the problem of corporate debt. 4.6 Comparison of AFDCC Scores of Both Companies The score now AFDCC AURES AUTO equals: Z = -1.255 * 2.003 * R1 + R3 + R2-0.824 * 5.221 * * R4-0.689 R5-1.164 * R6 + R7 + 0.706 * 1.408 * R8-0.85444 = -1.255 *0.3280298+ 2.003 *0.42244443-0824 *0.16971693+ 5.221 *0.07074033-0689 *0.508880331164 *0.20853481+ 0.706 *1.20+ 1,408 * 0-0.85444 =0.062466001 -According model AFDCC 3, the company's score is between -0.25 and 0125: it is considered uncertain business with a moderate risk. The bank must take preventive measures to reduce the risk of failure. The risk essentially amounts to the importance of debt and the high level of long and medium debts. For the company ECONOMIC AUTO AFDCC the score is equal to: Z = -1.255 * 2.003 * R1 + R3 + R2-0.824 * 5.221 * * R4-0.689 R5-1.164 * R6 + R7 + 0.706 * 1.408 * R8-0.85444 = -1.255 *0.06143106+ 2.003 *0.09064990-0824 *0.18638094+ 5.221 *0.04520504-0689 *0.595019131164 *0.13312368+ 0.706 *0.19866299+ 1.408 *0.01= -0.8544-0.951394668 The ECONOMIC AUTO score is lower than -0.25. The company is considered risky and the bank must consider his repayment capacity and solvency before accepting new loan applications. The risk is mainly generated by the high level of debt and its inability to generate a high profit level to meet its commitments. According to the score AFDCC, AURES AUTO is considered less risky then ECONOMIC AUTO. By cons, take other considerations in analyzing the risk. The AFDCC score takes into account the quantitative measures. The BTE bank must also analyze the qualitative factors that may influence future repayment capacity of the company as the attractiveness of the sector or the company's governance arrangements. 4.7 Probabilistic Model of the Linear Discriminant Analysis This is a multidimensional analysis of the anticipated failure using several ratios. Basically, this model allows the classification of enterprises in two defined groups: a group devoted to failing firms and another for non-failing firms. The model therefore facilitates credit decision simply by assigning the borrower to one of two groups. This analysis allows to construct a score according to a linear function by the combination of several independent variables. The score is obtained by the formula: Z = ( I * R) + x with have: weights

http://bmr.sciedupress.com Business and Management Research Vol. 8, No. 4; 2019
Published by Sciedu Press 24 ISSN 1927-6001 E-ISSN 1927-601X
Ri: constituent ratios x: constant The ratios used in the design of this model are:
Aspect Ratio Entitled Formula Weight Ratio
Ratios of structure
R1 equity ratio Equity / permanent capital 2,071 R2 instant cash ratio Availability / current liabilities -0.036
R3 financial balance Ratio Capital permanent / fixed net assets 0,070
Ratios of activity
R4 Share of financial costs in value added Financial expenses / added value 1,662
R5 Credit Ratio suppliers in months
(Payables / purchase tax + other external expenses TTT) * 12 0.706
R6 Credit Ratio customers in months
(Accounts receivable / sales tax) * 12 -1.219
profitability ratio R7 financial profitability Net income for the year / equity 8.224 Constant
-2.772
Ratios structure: R1: financial autonomy ratio: This ratio provides an indication of the dependence of the business of the banking system and debt for the realization of its activities. R2: The Quick Ratio: provides information on the ability of a company to meet its short-term commitments without recourse to non-liquid short-term assets. R3: financial balance ratio: Coverage measurement of investments by the company's stable resources. This ratio also allows to deduce the level of working capital. This is an indicator of the financial situation of the company. Ratios of activity: R4: Share of financial costs in value added measures the part of the added value used to repay financial burden for the company. The ratio therefore gives an indication of the significance of financial costs as expenses of the company and the implementation of debt policy. A5: Ratio credit providers in months: measures the average number of months it takes for the company to pay its suppliers and gives an indication of the effectiveness of credit and collection policies in the company. This ratio helps determine the bargaining power and the solvency of the company to its suppliers. R6: Credit Ratio customers in months: measures the average number of months it takes for customers to pay their bills and gives an indication of the effectiveness of credit and collection policies in the company. The result allows the bargaining power and payment facilities granted to customers. Profitability ratio : The financial profitability or “Return on Equity” measure profitability equity of a company. It helps to know if the company manages to generate profitability with its own funds. For this situation, the financial profitability compares the operating profit with the equity of the company. The indicator does not include the debt of the company. Leverage is therefore not included in the calculation of profitability.

http://bmr.sciedupress.com Business and Management Research Vol. 8, No. 4; 2019
Published by Sciedu Press 25 ISSN 1927-6001 E-ISSN 1927-601X
The score Z is calculated using the formula: Z = 2.071 * R1-0.036 * 0.0070 * R2 + R3 + R4 + 1.662 * 0.706 * * R5-1.219 R6 + 8.224 * R7-2.772
Diagnostic Category Score
normal & healthy business Z≥0 (positive score) & uncertain failing firm Z <0 (negative score) The diagnosis is explained by the nature of the model to classify companies into two groups: a group of non-failing firms composed by borrowers with a positive score and a group of failing companies composed by defaulting borrowers with a negative score. For this model:
• The higher the score, the higher the risk is low. • The higher the score is negative, the risk is high.
The model puts the value on the operating profit as the gross result of the company's business outside of all political whether financial or tax. But this model does not attach importance to qualitative component. Indeed, the ratios used are quantitative in nature and there is no strategic or organizational analysis of the company. Also, both R5 and R6 ratios which are respectively the settlement period suppliers and receivables settlement deadlines were given very low weights while both ratios have significant weight and allows to judge the creditworthiness of the company to its suppliers and its bargaining power in the market. 4.8 Comparison of Ratios Model of Both Companies
Ratio Formula Value ratios of the company AURES AUTO
Value of the company's ratios ECONOMIC AUTO
R1 Ratio of financial autonomy = equity / capitalization 0.801 0.82367436
R2 Ratio = Stock instant cash / short-term debt 0.415 0.20016878
R3 financial balance ratio = Capital permanent / fixed net assets 0.234 1.44801526
R4 Interest expenses in the added value = Financial expenses / added value 0.388 0.24119024
R5 Credit Ratio suppliers in months = (Accounts payable / purchases tax + other external expenses TTT) * 12
6,994 6.57960185
R6 Credit Ratio customers in months = (Accounts receivable / sales tax) * 12 2,084 1.74297432
R7 Financial profitability = Net profit for the year / equity 0.169 0.11708345
- Shareholders' equity represent 80% and 82% for both companies and AURES AUTO ECONOMIC AUTO. This indicates the importance of stable resources of the company in relation to medium and long term debt. Both companies are therefore considered autonomy as the medium and long term debts represent only 20% of permanent capital.

http://bmr.sciedupress.com Business and Management Research Vol. 8, No. 4; 2019
Published by Sciedu Press 26 ISSN 1927-6001 E-ISSN 1927-601X
-For the R2 ratio, cash in cash AURES AUTO represents 41.5% of short-term debt. The company is able to pay almost half of bank loans using only cash surplus. By cons, cash only cover 20% of short-term debts ECONOMIC AUTO. The company is unable to cover 1/4 of short debts by cash. This is due to the importance of short-term debt and the inability of the company to generate enough cash to repay short-term loans. According to this ratio, AURES AUTO is more solvent in the short term since it has availability that cover a greater portion of current liabilities. -The permanent capital cover only 23.4% of assets for AURES AUTO according to the ratio R3. The company's stable resources do not cover the investments resulting in a negative working capital. The working capital deficiency indicates that it does not have sufficient financial resources to bear all of its investments. For ECONOMIC AUTO equity cover assets thus resulting a positive working capital. The company is therefore able to cover all of its investments through its financial resources. - According to the ration R4 financial expenses represent 40% of added value. An important part of the result of the company is used to pay finance charges. This then indicates poor financial policy and an inadequate management of these charges that occupy almost half of the gross income. The situation is easier for ECONOMIC AUTO seen that the costs represent only 24% of added value. -The months in supplier payment time, presented in R5 ratio is 7 months AURES AUTO and 6 months and 15 days ECONOMIC AUTO. This indicates the strong bargaining power of the two companies with suppliers. By cons, it can also be indicative of their inability to repay trade payables. The importance of this time essentially amounts to the nature of the activity and the automobile industry for which providers give a significant delay seen the slow process of the sale. - The client payment deadline is 2 months and 1 month 22 days respectively for AURES AUTO and AUTO ECONOMIC. This period is considered low scoring a strong bargaining power for companies with customers and customer creditworthiness. Also the difference between supplier payment time and customer payment period shows adequate business strategy used by the two companies. Last R7 ratio that is financial profitability is the most important ratio as the weights used for the foundation of this model. This ratio has been given the greatest weight (8224) showing the weight of that profitability for this score. This ratio measures the company's ability to create value and generate profits for its shareholders. It allows to have an idea about the financial health in its corporate whole. The profitability of the AURES AUTO is equal to 16.9%. It therefore creates value for its donors. This profitability also helps attract new shareholders who expect to recoup their investments because it is a healthy and successful company. This profitability is higher than that of ECONOMIC AUTO which equals 11.7%. ECONOMIC AUTO is also considered as a profitable business that enables the creation of wealth for shareholders through the distribution of divendes. Both companies are profitable but for different degrees. AURES AUTO is healthier and profitable for lenders. 4.9 Comparison of Scores by Both Companies According to the Probabilistic Model of Discriminant Analysis For now AURES AUTO, the score is equal to: S02 = 2.071 * R1-0.036 * 0.0070 * R2 + R3 + R4 + 1.662 * 0.706 * * R5-1.219 R6 + 8.224 * R7-2.772 = 3.32 The resulting positive score indicates that the company is healthy and that the credit risk is low. Indeed, all companies with a score above 3 is considered safe. The results of 2018 show that this is a business with great potential and should be solvent to creditors. For the company ECONOMIC AUTO, the score is equal to: S02 = 2.071 * R1-0.036 * 0.0070 * R2 + R3 + R4 + 1.662 * 0.706 * * R5-1.219 R6 + 8.224 * R7-2.772 = 2.92 The score is positive shows that the company is solvent AURES AUTO and not risky. Companies with a score between 0 and 3 are still considered low-risk borrowers. According to the probabilistic model by discriminant analysis, AURES AUTO is less risky than AUTO ECONOMIC although the 2 companies are considered creditworthy by the results.

http://bmr.sciedupress.com Business and Management Research Vol. 8, No. 4; 2019
Published by Sciedu Press 27 ISSN 1927-6001 E-ISSN 1927-601X
5. Comparison of Scores of by Scoring Models The following table summarizes the scores of the 3 models for both companies: AURES AUTO ECONOMIC SELF Comparison of risk
logistic regression model -12.7 8.66 AURES AUTO is not risky versus ECONOMIC AUTO which is highly risky
model AFDCC
.0624
-0.9514
AURES AUTO is considered uncertain ECONOMIC is considered risky business
probabilistic model of the linear discriminant analysis 3.32 2.92
The two businesses are not risky but the company is less risky AURES AUTO then ECONOMIC AUTO
The models lead to different results. Indeed, when compared logistic regression model with discriminant analysis model, first consider the company ECONOMIC AUTO as very risky and insolvent and the second considered healthy. The differences in results primarily reside in the use of different ratios and weights that can result in different scores. The ratios are selected according to the judgment of the developer of the models and they cover many aspects of a company with different weights. The differences for each model allow banker to verify several aspects of the business and to have a clear judgment on the health of the company and its repayment capacity because the three models use ratios that cover different aspects of the company. Indeed, the first model that the logistic regression model is focused on the debt of the company in the banking system and repayment capacity while the second model is the AFDCC score assesses the profitability of the operation of company and its ability to create value through the main activity of the company. For cons, the discriminant analysis model seeks to primarily evaluate the financial profitability. The weights for each model ratios allow to know what the model focuses appearance. The banker at the BTE must check each score that allows him to have a complete idea about several aspects of the business enabling better judgment regarding the decision. Generally, the models produce consistent results to confirm the results. They are seen as complementary, despite the priority given to the logistic regression model considered the most important since the priority of the bank is checking the creditworthiness of the company and its ability to repay its debts. 6. Reviews to Model Scoring Scoring models used by the BTE do not incorporate qualitative elements of credit risk analysis. Indeed, the qualitative component in the bank basically amounts to the experience of bankers and information on the quality of the managers of the borrower or industry. This information is generally not abundant market fund and its hard-won. This is one of the major problems concerning the selection of credits. There is therefore a problem of adverse selection on the Tunisian financial market related to information asymmetry. Information can be hidden by the bank's borrowers who have no access to the company from the financial statements. The industry is another important qualitative element that each bank must consult before the decision for credits. Indeed, a company can not be risky but the industry decline in future may make it unable to pay its debts. Bankers are therefore required to make estimates and analyzes the evolution of the borrower's sector which can be costly and difficult in case of the unavailability of information. The simultaneous use of several models Scoring can be beneficial for the bank since it provides a risk assessment from multiple perspectives. By cons, each model can result in a different score and you get conflicting data that can induce the banker at a higher risk of error.

http://bmr.sciedupress.com Business and Management Research Vol. 8, No. 4; 2019
Published by Sciedu Press 28 ISSN 1927-6001 E-ISSN 1927-601X
The bank must seek to reduce the number of models or use a score determined by the average of three scores of each model. This may facilitate the work of the banker and allows a better selection of funds by the bank. Following recent technological developments, it is recommended to use the most recent and accurate models like artificial neural network. It has been proven that this type of model is more efficient in terms of credit risk management for the bank. Indeed, the NAS are flexible and non-parametric tools inspired neural biological systems. They consist of simplified mathematical formulas for calculating any arithmetic or logic function. The special feature of this model is its ability to learn and evolve according to the economic context of the bank and the customer allowing a more accurate assessment of risk and the ability to use the same model with changes in the economic fabric from the country. Even this type of model is expensive and difficult to develop it is recommended for credit institutions Tunisian especially with the unstable economic environment. 7. Recommendations for Scoring Model BTE The scoring model of BTE Bank is an important and essential tool for risk assessment of potential borrowers. It consists of several sub models that seek to evaluate the different functions of a company and its ability to repay bank debt. By cons, this model is likely to improvements to ensure better risk coverage and not to lose competitiveness of the bank because of an overvalued risk. Several other tools can be used to complement the scoring for the detection of borrower default and the score is unable to estimate. These include among its tools histogram normative ratios or sustension polygon. Using multiple models simultaneously that can give conflicting results may lead decision makers to error because of confusion created by the different results. The complexity of the model can affect the decision making quality borrowers. Scoring model can be visualize graphically using a tool that is the histogram of normative ratios. IT is a graphical representation of each ratio on a graduated axis to assess the relative risk for each ratio by comparing it with the standard. If the ratio approaches 0, the risk is considered high and the risk tends to 2, the risk is low. The histogram thus classifies ratios according to the risk related to each ratio. The arrangement allows the overall visualization of risks and for representing the relative risk to the score and facilitates comparison of companies. The histogram has a lot of utility for credit risk managers in a bank. If the banker uses only the final score resulting model, the ratios with high weight tend to cover or hide the risk caused by the failure of ratios with low weights. This problem can be solved by the histogram of normative ratios for a clear layout of each ratio and facilitating the detection and analysis of business failures. The histogram makes it possible to highlight the strengths and weaknesses of a company through the ratios used to create a model of Scoring. It allows the detection of failure that the score can not be detected. It can also detect the strengths of a potential borrower. It may therefore affect the decision of banks refusing loans to borrowers that considered healthy if it uses only the score when we revealed their shortcomings through the histogram of normative ratios. 7.1 Comparison of Histograms Ratios of Discriminant Analysis Model of Both Companies By placing the values of the ratios on an axis according to the risk with respect to the standard, the following histograms are obtained:

http://bmr.sciedupress.com Business and Management Research Vol. 8, No. 4; 2019
Published by Sciedu Press 29 ISSN 1927-6001 E-ISSN 1927-601X
Note for the company AURES AUTO, which is considered a healthy company and not risky based on the score obtained by the discriminant analysis model, the risk is moderate for ratios R3 and R4 financial balance which for the share of financial costs in the value added. This amounts, as mentioned in the comparative analysis ratios in the working capital deficiency and the importance of financial expenses related to business debts. For other ratios, the risk is low thus resulting in a positive score.

http://bmr.sciedupress.com Business and Management Research Vol. 8, No. 4; 2019
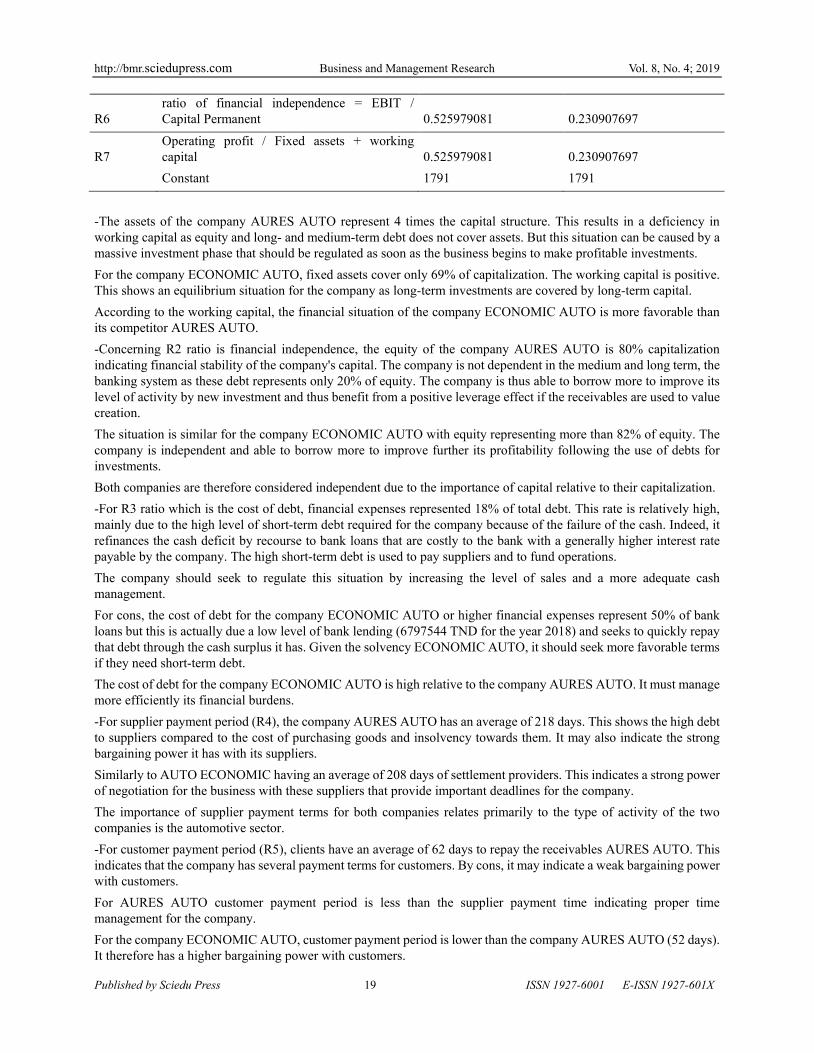
Published by Sciedu Press 30 ISSN 1927-6001 E-ISSN 1927-601X
For the company ECONOMIC AUTO, all ratios are considered according to the histogram as not risky. For cons, the score is lower than AURES AUTO because of the importance of ratios with the highest weights. The histogram is therefore possible to detect the failure of R3 and R4 AURES AUTO ratios that the risk manager could not detect if it is based only on the score. This tool, once integrated risk analysis process can help the bank of Tunisia and the UAE to reduce credit risk and to detect the failure of potential borrowers that can not reveal using only scores. 7.2 Polygon A Stand Another tool can be used by the BTE and can be complementary to the Scoring is the A stand polygon. It is an instrument similar to the histogram of normative ratios. This is a graphical representation of a polygon that traces the relative risk for each ratio as a vector. Thus joingant points of each vector graphical representation is obtained, which gives an idea about the financial health of the company and the risk involved. Scoring the model ratios are thus represented on graduated axes illustrating the value of ratio relative to the standard. It is a tool which thus ensures reading visibility, analysis and interpretation by risk managers of a bank. Polygon also facilitates comparaisson between companies. The arrangement obtained by polygons ensures easy and quick comparasion by bankers and to help decision making when it comes to a borrower choice. It also helps to know the strengths and weaknesses of the company according to the results obtained by the ratios to standard. As against the final score obtained by the model is sometimes unable to show failure of a borrower and risks related to the different functions of a company and only gives an average score of the company that can induce taker decision to error if one or more healthy ratios covers a major failure explained by another ratio. 7.2.1 Comparison of polygons sustension companies AURES AUTO and AUTO ECONOMIC for the model AFDCC Scoring To demonstrate the utility of sustension polygons, we will compare the 2 companies AURES AUTO and AUTO ECONOMIC according to the results of ratios constituting the model Scoring AFDCC. This model consists of 8 ratios and the results are listed on page 52. The polygon now AURES AUTO is:
The graph shows a clear failure of the company to the ratios R1, R3 and R8. So there are problems in the company to the levels of: - High financial expenses which constitute 32% of the economic result for the ratio R1
http://bmr.sciedupress.com Business and Management Research Vol. 8, No. 4; 2019
Published by Sciedu Press 31 ISSN 1927-6001 E-ISSN 1927-601X
- From the inability of the company to repay debts by the results achieved for R3 -The absence of investment and expansionist policy of the company for R8 The score obtained by the model which is equal to 0.06246 does not show the existence of such failures. Diagnosis far-score is that the company is uncertain with a moderate risk without explaining the cause of this uncertainty. The polygon tool is complementary to score to explain the existence of the business risks AURES AUTO. For the company ECONOMIC AUTO, the polygon A stand is:
The AUTO ECONOMIC failures lie in the ratios R2, R4 and R8. There are problems for the company at: - stable resources of the company that cover only 9% of the capital invested for the ratio R2 - lower operating margin and the inability of the company to create value through the main business for the ratio R4 - A low investment rate for R8 The failure of these ratios reflect the negative score obtained by the model which is equal to -0.9514. Indeed, the diagnosis on the score that the business is risky and should be avoided to extend credit. The polygon shows the causes of the failure of this score for the risk manager to facilitate its decision. The areas covered by the two polygons obtained allow the comparison of the two companies. Indeed, the area covered for business AURES AUTO is much higher than the company ECONOMIC AUTO indicating that the second company is riskier. The bank may also integrated in this tool a function for the area calculation covered by the polygon. The existence of such representations allow an initial interpretation on which borrowers are riskier. By cons, this tool does not take into account the weight ratios. The bank is interested ratios and business functions more than others. Generally, these ratios of profitability and solvency of the borrower. Using a score: The use of 3 models simultaneously can make the decision more difficult decision because of the contradictions of the results, different probabilities and diagnostics for each score. The bank must choose to be based on a model more than others or use a score that uses the results from each model with a weighting that depends on the relevance and importance of each model.

http://bmr.sciedupress.com Business and Management Research Vol. 8, No. 4; 2019
Published by Sciedu Press 32 ISSN 1927-6001 E-ISSN 1927-601X
The score formula is: Z m = x1Z1 X2Z2 + + + ... + x3Z3 xnZn with: xn: the weighting of each model Z1: the score of each model This score allows to assist risk managers in decision making given the scores. It is therefore complementary to other scores and the role of facilitating financial health analysis of borrowers by streamlining the results. 8. Conclusion The results of this research are in accordance with other studies (Zi-Yi Guo, 2017). However the results of each model differ for the two companies studied. Indeed, the score of the logistic regression model is equal to-12.7 for AURES AUTO shows that the company healthy and should be solvent, while AFDCC score is equal to 0.0624 indicates that the company is uncertain. The score of equal discriminant analysis model3.32 allows us to see that the same company is healthy. Thus, there are conflicting results considerate of the difference between the AFDCC model and the other 2 models. The situation is similar for the ECONOMIC AUTO company for which the score of the logistic regression model, equal to8.66Shows that risky and faulty. Likewise for the AFDCC model with a score of -0.9514. The score of the discriminant analysis model against being equal2.92 to be inferred that the company is healthy. The difference lies in the diagnosis of discriminant analysis model compared with other models. Bankers BTE generally gives more importance to the logistic regression model and considers it as the most relevant. Decision making depends score resulting from the logistic regression model to use because this model covers several aspects for better risk analysis. The discriminant analysis model is considered complementary to the first model and is a financial health check tool of the borrower. The AFDCC model is considered the least important because it was created by a French association that isthe French association of credit managers and advice and can have gaps relating to market specificities Tunisian against the French market. According to the importance of each model, we can create a score that cover the three models. therefore gives the greatest weight to the logistic regression model, followed by the discriminant analysis model and the lowest weight is given to AFDCC score. The establishment of this score should also follow the same steps listed for the establishment of a score and must be followed by tests of relevance and back-tests to have relevant score to assist risk managers for taking decisions on credit applications. References Altman Ei, S. A. (1998). Credit risk measurement: Developments over the last 20 years (pp. 1718-1739). Barthez, A., & Houtcieff, D. (2010). The personal guarantees (LGDJ ed., pp. 59-61) Bessis, J. (2015). Risk management in banking (4th ed., pp. 213-214). Wiley edition. Bruslerie, H. (2010). Financial analysis and credit risk (DUNOD ed., pp. 440-441) Coussergues, S. (2007). Bank management, (DUNOD ed., pp. 174-178) Dumontier, P. Dupre, D., & Cyril, M. (2008). Management and risk control Banking intake of IFRS and Basel II
(DUNOD ed., pp. 41-47). Ferroniere, J., & Chillaz, E. (1980). The banking (DUNOD ed., pp. 191-221).
https://doi.org/10.1007/978-1-349-05769-6_12 Glyn, A. H. (2003). Value at Risk: Theory and Practice (older version Academic Press, pp. 5-7) Gourieroux, C., & Tiomo, A. (2007). Credit risk: an advanced approach (Economica edition, pp. 18-21, 49). Hassid, O. (2008). Risk management, risk measurement instruments (2nd ed., pp. 56-59). Kharoubi, C., & Thomas, P. (2016). The analysis of credit risk: banking & Markets. (2nd ed., pp. 71-77). The
scoring: the Rating. Modrik, K. (2016). The assessment of credit risk of internationalized French SMEs. Economies and finances (thesis,
pp. 33-36).

http://bmr.sciedupress.com Business and Management Research Vol. 8, No. 4; 2019
Published by Sciedu Press 33 ISSN 1927-6001 E-ISSN 1927-601X
Roncalli, T. (2004). The financial risk management (ECONOMICA Edition, p. 147). Servigny, A., & Renault, O. (2004). Measuring and managing credit risk, 73-107 page (scoring) Thomasphilippe, C., & Kharoubi. (2016). Credit risk analysis (RB Ed.) Verboomen, A., & De Bel, L. (2011). Basel II and the credit risk: principles and rules of calculation (Larcier edition,
pp. 26-32). Zi-Yi, G. (2017). Heavy-tailed Distributions and Risk Management of Equity Market Tail Events. Journal of Risk &
Control, 4(1), 31-41. https://doi.org/10.2139/ssrn.3013749