bank behavior in regional finance and the development of ... · bank panics, a serious financial...
TRANSCRIPT

CIRJE Discussion Papers can be downloaded without charge from:
http://www.cirje.e.u-tokyo.ac.jp/research/03research02dp.html
Discussion Papers are a series of manuscripts in their draft form. They are not intended for
circulation or distribution except as indicated by the author. For that reason Discussion Papers
may not be reproduced or distributed without the written consent of the author.
CIRJE-F-972
Bank Behavior in Regional Finance and the Development of Regional Industries: The Case of Prewar Fukushima, Japan
Tetsuji Okazaki
The University of Tokyo
May 2015

Bank Behavior in Regional Finance and the Development of
Regional Industries: The Case of Prewar Fukushima, Japan
Tetsuji Okazaki (The University of Tokyo)*
Abstract
Because of the unstable financial market after World War I, the Japanese financial
system experienced a wave of bank mergers, which resulted in an increase in bank scale
and the development of branch banking. In this paper, we explored the implications of
the expansion of branch banking, using bank-office-level data for Fukushima Prefecture.
We found that branch offices that belonged to banks headquartered in other cities,
counties, or prefectures tended to have a lower propensity to loan compared with the
offices of banks headquartered in the same cities and counties as the offices. We also find
that concentration of deposits on bank offices headquartered in other cities, counties, or
prefectures had a substantial negative impact on the development of the weaving
industry. The structural change in the banking industry after World War I altered the
spatial allocation of funds and thereby affected the development of regional industries.
JEL Classification: G2, N2, N9
Keywords: bank, branch banking, bank merger, regional economy, economic history,
Japan
1
1. Introduction
After World War I, the financial system in Japan experienced substantial change
during a period of instability in the financial markets. In this period, after a few small
bank panics, a serious financial crisis occurred in 1927, the so called Showa Financial
Crisis, where forty-five banks closed following runs on their deposits, and the
government declared a three-week bank moratorium. The cause of the financial crisis
was the large number of nonperforming loans that had accumulated, because the
banking industry included numerous small banks and banks with close bank–firm
relationships. There were also negative macroeconomic impacts, such as the collapse of
an asset bubble in 1920 and the Great Kanto Earthquake in 1923 (Kato 1957; Okazaki,
Sawada and Yokoyama 2005; Okazaki, Sawada and Wang 2007). The instability of the
financial system and the consequent policies of the financial authorities caused a surge
in bank mergers in the 1920s (Goto 1985; Okazaki and Sawada 2007). This wave of bank
mergers brought about an important change in the structure of the banking industry,
namely the expansion of branch banking. The large banks that emerged from these
mergers had broad branch networks across cities, counties, and prefectures.
This paper explores the implications of the development of branch banking in
1920s Japan. The impact of the increase in the banks’ scale and the expansion of branch
banking have been extensively investigated in the context of the present financial
system and the increasing dominance of “megabanks.” Through those studies, the
following view (the “conventional paradigm”) has been well established, at least
concerning the US financial market until the early 2000s (Berger and Udell 2002;
Berger et al. 2005; Berger, Goulding and Rice 2014; Stein 2002). That is, as Berger et al.
(2014) summarize, “opaque small businesses would be best served by small,
single-market, local banks, while large, multimarket, nonlocal institutions would tend
to serve more transparent firms,” and hence “(t)he large banks, multimarket banks, and
nonlocal banks created by consolidation may be disadvantageous in relationships based
on soft information and may be more likely to sever relationships or withdraw credit
than the small, single-market, and local institutions they replace” (ibid., pp. 264–5).
If this view is valid for the prewar Japanese financial market, the
above-mentioned changes in the 1920s would have a substantial impact on bank lending
and businesses, and as we will see later, the Japanese government indeed had a similar
view and concern about bank lending to small local businesses. This paper is, to our
knowledge, the first attempt at a systematic examination of the impact of bank mergers
and branch banking on bank lending in prewar Japan from the standpoint of the
“conventional paradigm.” In addition, we intend to contribute to this strand of literature

2
by using bank-office-level deposit and loan data, obtained from various issues of the
Statistical Yearbook of Fukushima Prefecture (Fukushima-ken Tokeisho). Unlike the
existing literature, based on bank-level or firm-level data, this paper directly observes
the activities of each bank office.
In the context of Japanese economic history, this paper is related to a broad
hypothesis that Takafusa Nakamura proposed in his classic book (Nakamura 1971). His
basic idea is that the prewar Japanese economy experienced a shift of growth patterns in
the early 1910s. While indigenous industries, as well as modern industries based on
Western technologies and institutions, achieved “balanced growth,” supporting each
other before World War I, after the war indigenous industries stagnated and the “dual
structure” of modern large firms and small indigenous firms emerged. From our
viewpoint, it is remarkable that as evidence for this view, Nakamura (1971) mentioned
the difficulties local small businesses faced accessing finance due to bank mergers (pp.
199–200). By exploring the change in bank behavior and its implications for industries,
we intend to contribute to a better understanding of the long-term growth patterns of
the Japanese economy.
This paper is organized as follows. Section 2 provides an overview of bank
mergers and the development of branch banking after World War I. In section 3, we
investigate the implications of branch banking for deposits and loans, using
bank-office-level data for Fukushima Prefecture. In section 4, we explore the impact of
branch banking on the development of the weaving industry in Fukushima Prefecture.
Section 5 concludes the paper.
2. Development of branch banking in prewar Japan: an overview
The history of the modern banking system in Japan dates back to 1872, when the
National Bank Act provided the legal framework for national banks, that is, private
banks that were privileged to issue bank notes. According to the Act, 153 national banks
were founded by 1879, when the total amount of national bank notes that the national
banks were allowed to issue reached its upper limit. In 1882, the Bank of Japan was
established as the central bank, and it began to issue Bank of Japan notes in 1885.
National banks were then closed or transformed into private banks without the privilege
of issuing bank notes within 20 years from the date when each national bank was
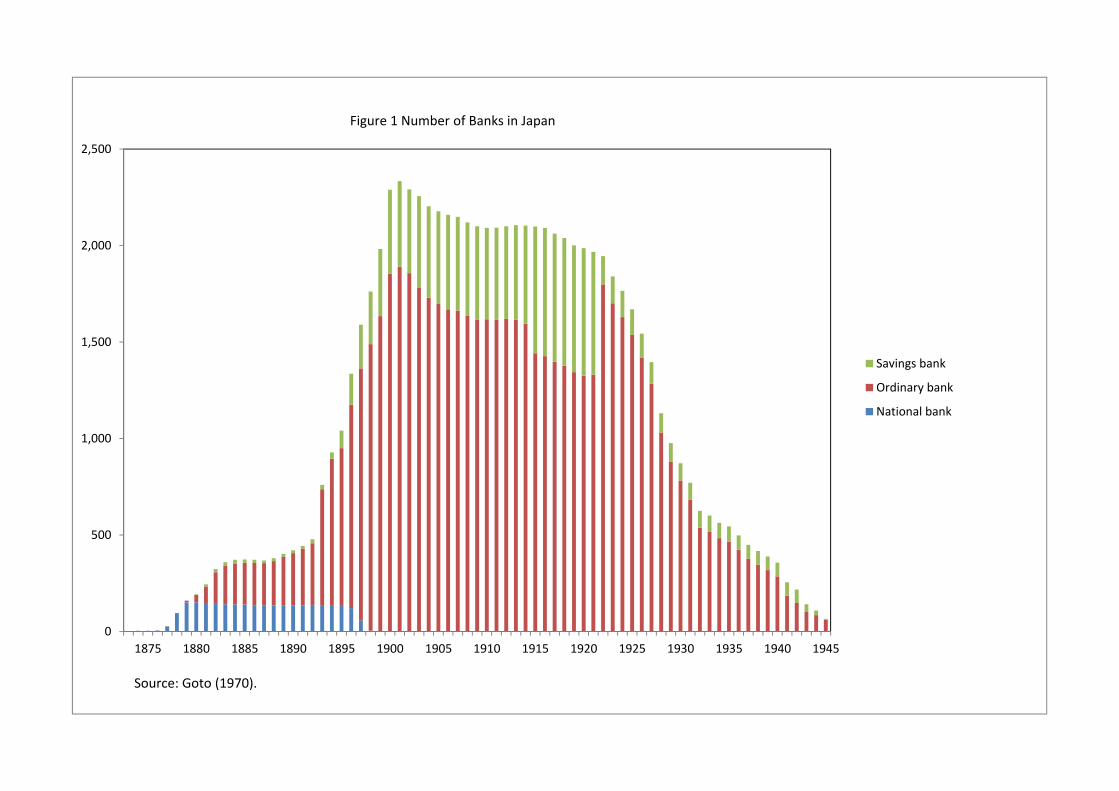
licensed. In 1893, the Bank Act was legislated as the legal framework for private banks,
which resulted in a sharp increase in the number of private banks (Figure 1). The
number of private banks reached a peak of 2,334 in 1901, comprising 1,890 ordinary
banks and 444 savings banks.

3
Figure1
The private banks had some distinctive features, including close ties with
industrial firms (Okazaki, Sawada and Yokoyama 2005; Okazaki, Sawada and Wang
2007). First, the scale was basically small. The average amount of paid-up capital of
ordinary banks was 134,000 yen in 1901 (Goto 1970), or US$264,0001. Second, related to
the first feature, each bank had few branches. Figure 2 indicates the total number of
branches of ordinary banks2. As shown in the figure, the average number of branches
was less than 1 in the early 1900s. In other words, branch banking was underdeveloped
in Japan in this period.
Figure 2
From the early 1900s, the number of banks declined steadily, which reflected a
shakeout of banks. As Figure 3 shows, a substantial number of banks exited the market
each year, mainly through dissolution, bankruptcy, or closure. As a result of this process,
the average scale of banks gradually increased, and branch banking developed. In the
1920s, especially in the latter part of the decade, the decline in bank numbers
accelerated. The number of ordinary banks and savings banks declined from 1,987 in
1920 to 872 in 19303. The major factor in this decline was mergers and acquisitions,
promoted by government regulation. In 1928, after the Showa Financial Crisis, the
Bank Law was enacted, which introduced a lower limit on capital, that is, an ordinary
bank was required to have capital of not less than one million yen (Asakura 1988, pp.
159–61; Okazaki and Sawada 2007)4. When the law was enacted, 807 of 1407 ordinary
banks failed to meet this criterion. These banks were given five years to meet the
criterion, but as the Ministry of Finance did not allow these small banks to increase
their capital by themselves, they were obliged to either merge with other banks or close.
1 Converted at the average of the highest and lowest exchange rates between Yen and the US dollar in 1901 (Yamazawa and Yamamoto 1979, p. 256). 2 The data include sub-branches (shucchojo). We include both branches and sub-branches, for simplicity. 3 The Savings Bank Law enacted in 1922 imposed strict restrictions on the business of savings banks (Asakura pp. 141–2), and consequently 515 savings banks converted to ordinary banks (Bureau of Banks, Ministry of Finance 1925, p. 515). A discontinuity of the diagram in Figure 1 reflects this wave of conversions. 4 If the headquarters of a bank was located in Tokyo or Osaka, the minimum capital was two million yen, while it was five hundred thousand yen if the headquarters was located in a town or village whose population was not larger than ten thousand people.

4
As a result, from the late 1920s to the early 1930s, a huge wave of bank mergers
occurred (Figure 2). Following this wave of mergers, branch banking developed
substantially. The average number of branches of an ordinary bank was 2.1 in 1920, but
it had risen to 8.6 by 1930 (Figure 3).
Figure 3
It is notable that during this process of development of branch banking, branch
networks expanded across regions. Table 1 classifies bank branches into two types; those
that belonged to banks in the same prefectures, and those that belonged to banks in
other prefectures. The data include a small number of special banks, as well as ordinary
and savings banks5. In 1910, the share of bank branches in a prefecture other than that
of their headquarters (headquarters and branches are called offices hereafter) was just
8.7%. In other words, financial markets were segmented within each prefecture.
However, this share subsequently increased, and had become 19.0% by 1930. This
implies that the financial market of a prefecture came to be influenced more by banks
headquartered in other prefectures. As we will see in the next section on Fukushima
Prefecture, a similar change occurred within each prefecture. That is, banks’ branch
networks expanded across cities and counties within a prefecture.
The development of branch banking aroused concerns that it might concentrate
funds on metropolitan areas. Indeed, this was one of the major issues in the discussion of
bank merger policy in the 1920s. We can see this in the records of the Financial System
Research Council (Kin’yu Seido Chosakai) established under the Ministry of Finance
from 1926 to 1927. Concerning the bank merger promotion policy, Rhuichiro Nagaoka, a
council member and the Chief of the Social Bureau of the Ministry of Home Affairs,
submitted the following memorandum to the council 6 (Financial System Research
5 Special banks were private banks founded for policy purposes by special laws. Special banks include Yokohama Shokin Ginko (Yokohama Species Bank), Nihon Kogyo Ginko (Industrial Bank of Japan), Nihon Kangyo Ginko (Hypothec Bank of Japan), Hokkaido Takushoku Ginko, Taiwan Ginko (The Bank of Taiwan), Chosen Ginko (The Bank of Chosen), and the agricultural and industrial bank for each prefecture. For example, in 1930, the number of headquarters (A), branches of the banks in the same prefecture (B1), and branches of the banks in the other prefectures (B2) of the special banks were 25, 95 and 75, respectively. 6 “Minutes of the Special Committee on the System of Ordinary Banks,” third meeting
(October 25, 1926), reprinted in the Research Bureau of Bank of Japan, ed. Kin’yu-shi
Shiryo, series of Meiji and Taisho Eras, vol. 18, Tokyo: Printing Bureau of the Ministry of
Finance, 1956.

5
Council 1926, p. 162).
“If small lots loaned in rural areas tend to decline and they are shifted to large
lots loaned to large-sized commercial and industrial firms in urban areas as a
result of bank mergers, it is concerning that this trend might dry up regional
finance to impoverished agricultural areas. I want to have appropriate measures
taken to prevent this problem.”
Nagaoka’s serious concern about the negative consequences of bank mergers is
significant because the Ministry of Home Affairs was in charge of administering rural
regions. This concern was shared by the bureaucrats in the Ministry of Finance, who
were in charge of the financial system. For example, the Chief of the Bank Bureau of the
Ministry of Finance, Osamu Matsumoto, said in a press interview in 1925, “the merger
in which an urban bank merges rural banks to make them branches will cause a
concentration of rural industrial funds in urban areas and dry up local finance. Also, as
the urban bank and its rural branches have little information about the rural industries,
they will be too cautious about loans and bring about undesirable consequences.”7
3. Branch banking and bank behavior in Fukushima Prefecture
As mentioned in section 1, detailed office-level data on loans and deposits are
available for Fukushima Prefecture in the Statistical Yearbook of Fukushima Prefecture
(Fukushima-ken Tokeisho) annually until 1928. Here, we focus on the period from 1914
to 1928, when branch banking developed. During this period, Fukushima Prefecture
comprised two cities (Fukushima and Wakamatsu) and seventeen counties. Although
Koriyama Town and Koharada Village in Asaka County were reorganized into a new city,
Koriyama City and became independent from Asaka County in 1924, we assume that
Koriyama City remained in Asaka County for continuity of the data.
Figure 4 shows the number of offices of ordinary banks and savings banks in
Fukushima Prefecture, including branches of the banks whose headquarters were
located in other prefectures. We can see that the number increased substantially from
the late 1910s to the early 1920s. In 1920, for example, there were 112 offices, which is
1.6% of the total number of offices of ordinary banks and savings banks. Associated with
the increase in the number of offices, the amount of loans and deposits also increased
from the late 1910s to the early 1920s. It is notable that the growth rate of loans was
higher than that of deposits, which implies that the loan–deposit ratio rose.
7 Osaka Asahi Shinbun, February 26, 1925.

6
Figure 4
In Figure 5, we classified bank offices into three types; (a) those that belonged to
banks headquartered in the same cities or counties, (b) those that belonged to banks
headquartered in the other cities or counties in Fukushima Prefecture, and (c) those
that belonged to banks headquartered in other prefectures. This figure indicates that
while all three types increased from the 1910s to the 1920s, the growth rate of type (b)
was the highest. This reflects the aggressive expansion of branch networks of some
major regional banks in Fukushima Prefecture.
Figure 5
Let us look briefly at the case of Dai Hyaku-shichi Bank, the largest regional bank
in Fukushima Prefecture. This bank was founded as a national bank in 1878 based on
capital raised mainly from wealthy landowners in Fukushima Prefecture, in particular
in Shinobu County and Date County8. The headquarters was in Fukushima Town in
Shinobu County, which became Fukushima City in 1907 (Dai Hyaku-shichi Bank 1924,
p. 30; Fukushima Prefecture 1971, pp. 813–4). When the bank was founded in 1878, it
established Tokyo Branchi9, but its first branch in Fukushima Prefecture was Hobara
Branchi in Date County, established in 1879. Then, it expanded its branch network to
Nihonmatsu in Adachi County in 1899 and to Shirakawa in Nishishirakawa County in
1906 (Dai Hyaku-shichi Bank 1924, pp. 359–60). By 1914, Dai Hyaku-shichi Bank had
eight branches in seven different counties in Fukushima Prefecture, and by 1921 its
branch network in Fukushima Prefecture had expanded to one city (Wakamatsu City)
and ten counties.
An important point in the context of this paper is that the change in the branch
network depicted in Figure 4 had an impact on the flow of funds. Because of the
increasing number of branches of banks headquartered in other cities or counties, the
proportion of funds collected by these banks increased. As shown in Figure 5, the share
of deposits in offices headquartered in other cities or counties increased substantially in
the early 1920s, while the share of offices that belonged to banks headquartered in the
same city or county declined. This change was significant, because the functions of the
different types of bank office differed. This is clearly indicated in Figure 6, which shows
8 It was converted into an ordinary bank in 1897 (Dai Hyaku-shichi Bank 1924, p. 37). 9 Tokyo Branch was abolished in 1887 (Dai Hyaku-shichi Bank 1924, p. 357).
7
the loan–deposit ratios by type of office. The offices that belonged to banks
headquartered in the same county or city, including the headquarters themselves, had a
higher propensity to make loans, while the offices that belonged to the banks
headquartered in other cities or counties in Fukushima Prefecture had a lower
propensity to make loans. We confirmed this observation by regression analyses.
Figure 6
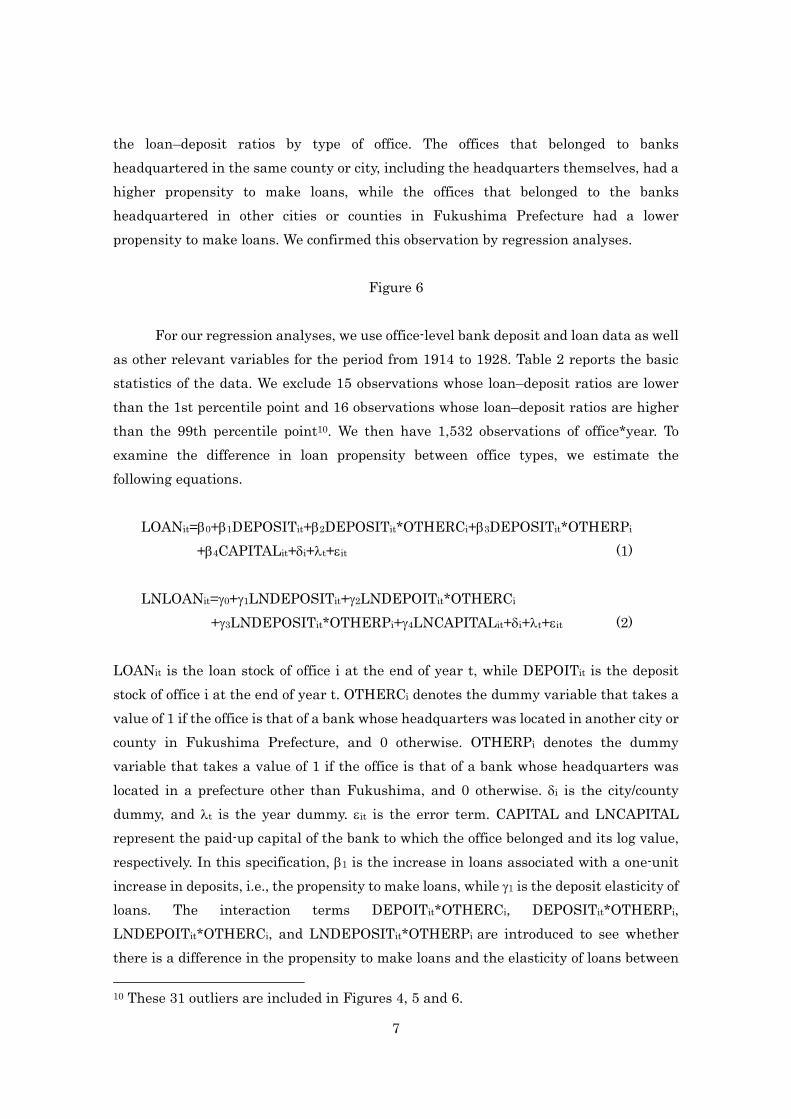
For our regression analyses, we use office-level bank deposit and loan data as well
as other relevant variables for the period from 1914 to 1928. Table 2 reports the basic
statistics of the data. We exclude 15 observations whose loan–deposit ratios are lower
than the 1st percentile point and 16 observations whose loan–deposit ratios are higher
than the 99th percentile point10. We then have 1,532 observations of office*year. To
examine the difference in loan propensity between office types, we estimate the
following equations.
LOANit=0+1DEPOSITit+2DEPOSITit*OTHERCi+3DEPOSITit*OTHERPi
+4CAPITALit+i+t+it (1)
LNLOANit=0+1LNDEPOSITit+2LNDEPOITit*OTHERCi
+3LNDEPOSITit*OTHERPi+4LNCAPITALit+i+t+it (2)
LOANit is the loan stock of office i at the end of year t, while DEPOITit is the deposit
stock of office i at the end of year t. OTHERCi denotes the dummy variable that takes a
value of 1 if the office is that of a bank whose headquarters was located in another city or
county in Fukushima Prefecture, and 0 otherwise. OTHERPi denotes the dummy
variable that takes a value of 1 if the office is that of a bank whose headquarters was
located in a prefecture other than Fukushima, and 0 otherwise. i is the city/county
dummy, and t is the year dummy. it is the error term. CAPITAL and LNCAPITAL
represent the paid-up capital of the bank to which the office belonged and its log value,
respectively. In this specification, 1 is the increase in loans associated with a one-unit
increase in deposits, i.e., the propensity to make loans, while 1 is the deposit elasticity of
loans. The interaction terms DEPOITit*OTHERCi, DEPOSITit*OTHERPi,
LNDEPOITit*OTHERCi, and LNDEPOSITit*OTHERPi are introduced to see whether
there is a difference in the propensity to make loans and the elasticity of loans between
10 These 31 outliers are included in Figures 4, 5 and 6.

8
types of offices.
The estimation results are reported in Table 3. It is clear that the offices that
belonged to the banks headquartered in other cities, counties or prefectures had a lower
propensity to make loans and lower elasticity of loans to deposits. For example, given
the result in column (2), where the office that belonged to a bank in the same city or
county applied 1.334 yen to loans there when it collected deposits of 1 yen, the office
headquartered in another city/county in Fukushima Prefecture applied 0.875 yen there
and the office headquartered outside Fukushima Prefecture applied 0.782 yen there.
These results are robust, whether we include city/county dummies or exclude them and
add the banks’ paid-up capital. These results are consistent with the observation in
Figure 6. We can conclude that the offices that belonged to banks in the other cities,
counties, or prefectures applied a smaller portion of funds they collected through
deposits to loans there.
4. Impact on industrial development
From our findings in the previous section, we can infer that if the deposit share of
offices headquartered outside the city or county increased, it would have a negative
impact on the industrial development in that area. This is what the Ministry of Finance
was concerned about in promoting bank mergers in the 1920s. We now examine whether
this concern was justified or not.
For this purpose, we use the city- and county-level data of the weaving industry in
Fukushima Prefecture, as well as the bank deposit and loan data aggregated at the city
and county level. The weaving industry, especially the silk weaving industry, as well as
the silk reeling industry, was one of the major industries in Fukushima Prefecture from
the nineteenth century onwards. The weaving industry was distributed across most of
the cities and counties in Fukushima Prefecture, which allows us to identify the impact
of the change in deposit share by type of bank office.
We collected city- and county-level production and employment data for the
weaving industry in Fukushima Prefecture from 1914 to 1928. The weaving industry
includes silk, cotton, flax, wool and special weaving industries. We focus on the impact of
changes in the flow of funds caused by the expansion of branch banking on the activities
of the weaving industry. In order to capture the effect of branch banking, we use the
deposit share of the offices headquartered in other cities or counties, DSHAREOTHERC,
and the deposit share of the offices headquartered in other prefectures,
DSHAREOTHERP, for each city or county. We also use the sum of these two variables,
DSHAREOTHER. It is expected that the increase in these variables had a negative

9
impact on the industrial activities through decline of funds supplied. The equation to be
estimated is as follows.
Xit=0+1DSHAREOTHERCit+2DSHAREOTHERPit+δi+λt+it (3)
Xit is the output or employment of the weaving industry in city or county i in year t, in
log form (LNPROD and LNWORKER, respectively).δi and λt are the city/county dummy
and year dummy, respectively. Because we include city/county fixed effects, we avoid the
potential correlation between the explanatory variables and the error term that might
originate from the time-invariant portion of the error term. In addition, to take account
of the remaining potential endogeneity, we estimate the equation with lagged
explanatory variables.
Xit=0+1DSHAREOTHERCit-1+2DSHAREOTHERPit-1+δi+λt+it (4)
The basic statistics of the observations are reported in Table 4, and the estimation
results are presented in Table 5.
The coefficients of the deposit-share variables are negative and statistically
significant for both the one-year lagged and unlagged estimates. The magnitudes of the
coefficients are not negligible. For example, in column (5) the coefficient of
DSHAREOTHERCt-1 is –1.627, which means that the weaving industry’s output would
be about 15.0% smaller if the deposit share of the bank offices headquartered in other
cities and counties was 10% larger. Similarly, in column (7) the coefficient of
DSHAREOTHERCt-1 is –0.672, which means that employment in the weaving industry
would be about 6.5% smaller if the deposit share of bank offices headquartered in other
cities and counties was 10% larger. Absorption of the funds of a city or county into banks
headquartered in other cities, counties, or prefectures had a substantial negative impact
on regional industrial production.
5. Concluding remarks
Because of the unstable financial market after World War I, the Japanese
financial system experienced a wave of bank mergers, which resulted in an increase in
bank scale and the development of branch banking. In this paper, we explored the
implications of the expansion of branch banking, using bank-office-level data for
Fukushima Prefecture. We found that branch offices that belonged to banks
headquartered in other cities, counties, or prefectures tended to have a lower propensity

10
to loan compared with the offices of banks headquartered in the same cities and counties
as the offices. The contemporary financial authorities were concerned that bank mergers
might result in a concentration of funds in metropolitan areas and consequent
restriction of access to finance for small local businesses. Our findings indicate that this
concern was justified. We also find that concentration of deposits on bank offices
headquartered in other cities, counties, or prefectures had a substantial negative impact
on the development of the weaving industry. The structural change in the banking
industry after World War I altered the spatial allocation of funds and thereby affected
the development of regional industries.
References
Asakura, Kokichi. Shinpen Nihon Kin’yu Shi (Financial History of Japan: A New
Edition), Tokyo: Nihon Keizai Hyoronsha, 1988
Berger, Allen, N., William Goulding, and Tara Rice, “Do Small Businesses still Prefer
Community Banks ?” Journal of Banking and Finance, 44: 264-78, 2014.
Berger, Allen N., Nathan H. Miller, Mitchell A. Petersen, Raghuram G, Rajan, and
Jeremy C. Stein. “Does Function Follow Organizational Form?: Evidence from
Lending Practices of Large and Small Banks,” Journal of Financial Economics,
76(2): 237-69, 2005.
Berger, Allen, and Gregory F. Udell. “Small Business Credit Availability and
Relationship Lending: The Importance of Bank Organizational Structure,”
Economic Journal, 112: 32-53, 2002.
Bureau of Banks, Ministry of Finance. Okura Sho Ginko Kyoku Nenpo (Yearbook of the
Bank Bureau of the Ministry of Finance), 1922 issue, reprinted in Research
Bureau of Bank of Japan ed., Nihon Kin’yushi Shiryo (Materials on Japanese
Financial History) Meiji and Taisho edition, vol.7-2, , Printing Bureau of Ministry
of Finance, 1960.

11
Dai Hyaku-shichi Bank. Dai Hyaku-shichi Ginko Shi (History of Dai Hyaku-shichi
Bank), Fukushima: Dai Hyaku-shichi Bank, 1924.
Editorial Committee of the History of Fukushima Prefecture ed.. Fukushima Ken Shi
(History of Fukushima Prefecture), Industries and Economy 2, Fukushima
Prefecture, 1971
Goto, Shinichi. Nihon no Kiun’yu Tokei (Financial Statistics of Japan), Tokyo: Toyo
Keizai Shinposha, 1970.
Goto, Shinichi. Ginko Godo no Jisshoteki Kenkyu (Empirical Studies on Bank Mergers),
Tokyo: Nihon Keizai Hyoronsha, 1991.
Kato, Toshihiko. Honpo Ginko-shi Ron (History of Banks in Japan), Tokyo: The
University of Tokyo Press, 1957.
Nakamura, Takafusa. Senzen-ki Nihon Keizai Seicho no Bunseki (Analysis of the
Japanese Economic Growth in the Prewar Period), Tokyo: Iwanami Shoten, 1971.
Okazaki, Tetsuji, and Michiru Sawada. “Effects of Bank Merger Promotion Policy:
Evaluating Bank Law in 1927, Japan”, Financial History Review 14-1, 29-61,
2007.
Okazaki, Tetsuji, and Michiru Sawada. “Interbank Networks in Prewar Japan:
Structure and Implications,” Industrial and Corporate Change, April: 463-506,
2012.
Okazaki, Tetsuji, Michiru Sawada, and Ke Wang. “The Fall of ‘Organ Bank’
Relationships during the Wave of Bank Failures and Consolidations: Experience
in Pre-war Japan,” Corporate Ownership and Control, 4-4, 19-38, 2007.
Okazaki, Tetsuji, and Michiru Sawada, and Kazuki Yokoyama. “Measuring the extent
and implications of director interlocking in the pre-war Japanese banking
industry” Journal of Economic History 65-4, 1082-1115, 2005.

12
Research Bureau of Bank of Japan ed.. Kin’yu-shi Shiryo, Meiji and Taisho edition, vol.
18, Tokyo: Printing Bureau of the Ministry of Finance, 1956
Stein, Jeremy C.. “Information Production and Capital Allocation: Decentralized vs.
Hierarchical Firms,” Journal of Finance, 57: 1891–1921, 2002.
Yamazawa, Ippei and Yuzo Yamamoto. Boeki to Kokusai Shushi (International Trade
and Balance of Payments), Tokyo: Toyo Keizai Shinposha, 1979
0
500
1,000
1,500
2,000
2,500
1875 1880 1885 1890 1895 1900 1905 1910 1915 1920 1925 1930 1935 1940 1945
Savings bank
Ordinary bank
National bank
Figure 1 Number of Banks in Japan
Source: Goto (1970).

0
50
100
150
200
250
300
350
Dissolution, bankruptcy and closure
M&A
Entry
Figure 2 Entry and exit of ordinary banks (excluding those through category change)
Source: Goto(1970).

0.0
2.0
4.0
6.0
8.0
10.0
12.0
14.0
16.0
18.0
0
1,000
2,000
3,000
4,000
5,000
6,000
7,000
8,000
9,000
1895 1900 1905 1910 1915 1920 1925 1930 1935 1940
Number of branches
Number of branches
Figure 3 Development of branch network of ornary banks
Source: Goto(1970).

0
10
20
30
40
50
60
70
1914 1915 1916 1917 1918 1919 1920 1921 1922 1923 1924 1925 1926 1927 1928
Same city or county
The other cites or counties in Fukushima
The other prefectures
Figure 4 Number of bank offices in Fukushima Prefecture by affiliation
Source: Fukushima‐ken Tokeisho, various issues.

0.0
10.0
20.0
30.0
40.0
50.0
60.0
70.0
80.0
1914 1915 1916 1917 1918 1919 1920 1921 1922 1923 1924 1925 1926 1927 1928
Same city or county
The other cites or counties in Fukushima
The other prefectures
Figure 5 Share of each headquarters and branch category in terms of deposit amount %
Source: Fukushima‐ken Tokeisho, various issues.

0.0
20.0
40.0
60.0
80.0
100.0
120.0
140.0
160.0
1914 1915 1916 1917 1918 1919 1920 1921 1922 1923 1924 1925 1926 1927 1928
Same city or county
The other cites or counties in Fukushima
The other prefectures
% Figure 6 Loan deposit ratio by category of headquarters and branch
Source: Fukushima‐ken Tokeisho, various issues.

Table 1 Expantion of branch network across prefectures
A Headquarters B. Branches
B1 Banks in thesame prefecture
B2 Banks in theother prefectures
B2/(A+B1+B2) (%)
1910 2,141 2,324 427 8.71920 2,040 4,008 1,005 14.21930 891 4,158 1,188 19.0
Note: The data include special banks as well as ordinary banks and savings banks.Source: Bureau of Banks, Ministry of Finance eds. Ginko Soran (Handbook of Banks), various issues.

Table 2 Basic statistics
Obs. Mean Sedev. Max MinDEPOSIT 1,532 579,613 859,671 6,138,310 2,211LNDEPOSIT 1,532 12.594 1.164 16.028 7.701LOAN 1,532 670,961 1,313,542 14,324,348 1,525LNLOAN 1,532 12.515 1.324 16.477 7.33LNCAPITAL 1,532 13.200 1.554 18.345 9.616

Table 3 Propensity for loan by type of office
(1) (2) (3) (4) (5) (6)Dependent variable LOAN LOAN LOAN LNLOAN LNLOAN LNLOANDEPOSIT 1.394 (18.58) *** 1.334 (18.52) ***DEPOSIT*OTHERC -0.479 (-5.58) *** -0.459 (-4.73) ***DEPOSIT*OTHERP -0.556 (-5.19) *** -0.552 (-5.12) ***LNDEPOSIT 1.337 (18.52) *** 0.913 (53.18) *** 0.892 (45.92) *** 0.904 (41.46) ***LNDEPOSIT*OTHERC -0.459 (-4.73) *** -0.036 (-11.88) *** -0.035 (-10.67) *** -0.031 (-7.14) ***LNDEPOSIT*OTHERP -0.583 (-4.29) *** -0.029 (-6.44) *** -0.029 (-6.51) *** -0.021 (-3.06) ***CAPITAL 0.001 ( 0.47)LNCAPITAL -0.031 (-1.58)Const. -142,582 (-2.61) *** 227,227 ( 0.43) 229,712 (1.44) 0.898 (3.92) *** 1.288 (4.42) *** 1.515 (4.88) ***City/County dummies NO YES YES YES YES YESYear dummies YES YES YES YES YES YES
R2 0.762 0.768 0.770 0.762 0.763Obs. 1,532 1,532 1,532 1,532 1,532
Note: Heteroschedasticity robust t-values are in parentheses. *** Statistically significant at 1% level.

Table 4 Basic statistics
Obs. Mean Sedev. Max MinDSHAREOTHERC 256 0.340 0.335 1.912 0.000DSHAREOTHERP 256 0.128 0.184 1.226 0.000DSHAREOTHER 256 0.469 0.371 1.917 0.000LNPROD 256 10.636 2.845 16.275 4.043LNWORKER 255 4.555 1.986 8.459 0.693

Table 5 Impact of branch banking on the weaving industry
(1) (2) (3) (4)Dependent variable LNPROD LNPROD LNWORKER LNWORKERDSHAREOTHERCt -1.287 (-2.54) *** -0.581 (-2.05) **
DSHAREOTHERPt -1.790 (-1.66) * -0.510 (-0.88)
DSHAREOTHERt -1.454 (-2.85) *** -0.557 (-2.06) **Const. 13.440 (38.44) *** 13.374 (43.72) *** 6.246 (25.51) *** 6.256 (27.27) ***City/County dummies YES YES YES YESYear dummies YES YES YES YES
R2 0.842 0.842 0.877 0.877Obs. 256 255 256 255
(5) (6) (7) (8)Dependent variable LNPROD LNPROD LNWORKER LNWORKERDSHAREOTHERCt-1 -1.627 (-2.98) *** -0.672 (-2.31) **
DSHAREOTHERPt-1 -0.145 (-0.12) * -0.020 (-0.03)
DSHAREOTHERt-1 -1.197 (-2.13) ** -0.482 (-1.78) *Const. 14.59 (32.10) *** 13.418 (41.45) *** 5.486 (26.72) *** 5.6 (34.83) ***City/County dummies YES YES YES YESYear dummies YES YES YES YES
R2 0.839 0.837 0.881 0.88Obs. 238 238 237 237
Note: Heteroschedasticity robust t-values are in parentheses. *** Statistically significant at 1% level. ** Statistically significant at 5% level. * Statistically significant at 10% level.