banco itaÚ bba s.a. to our stockholders: central bank of...
TRANSCRIPT

BANCO ITAÚ BBA S.A.
MANAGEMENT REPORT
To our Stockholders: We present the Management Report and the financial statements of Banco Itaú BBA S.A. (Itaú BBA) for the period from January 1 to December 31, 2011 and 2010, in accordance with the regulations established by the Central Bank of Brazil (BACEN) and the National Monetary Council (CMN). NET INCOME AND STOCKHOLDERS' EQUITY Itaú BBA net income totaled R$ 2,219 million in the period and stockholders' equity totaled R$ 6,832 million. Net income per share was R$ 209.99, whereas its book value per share was R$ 646.40. ASSETS AND FUNDS RAISED Assets totaled R$ 211,164 million and were substantially made up of R$ 111,082 million of Interbank Investments and Securities and Derivative Financial Instruments, and R$ 82,983 million of Loan, Lease, Other Credit Operations and Foreign Exchange Portfolio. Raised and Managed Funds represented R$ 194,550 million. CIRCULAR LETTER No. 3,068/01 OF BACEN Itaú BBA hereby represents to have the financial capacity and the intention to hold to maturity securities classified under the line “held-to-maturity securities” in the balance sheet, in the amount of R$ 54 million, corresponding to only 0.10% of total securities held. ACKNOWLEDGEMENTS We thank our shareholders for their support and trust which have been indispensable for the continuous development achieved by Itaú BBA. To our employees, we express our recognition for their determination and commitment. To our clients, our thanks for their trust and loyalty, which we try to repay with differentiated products and services. São Paulo, February 15, 2012. Executive Board

MANAGEMENT REPORT DirectorsADRIANO LIMA BORGES
Chairman ALBERTO ZOFFMANN DO ESPÍRITO SANTOROBERTO EGYDIO SETUBAL ALEXANDRE ENRICO SILVA FIGLIOLINO
ÁLVARO DE ALVARENGA FREIRE PIMENTELVice-Chairmen ANDRÉ CARVALHO WHYTE GAILEY
FERNÃO CARLOS BOTELHO BRACHER ANDRÉ DEL BEL CURYPEDRO MOREIRA SALLES ANDRÉ FERRARI
ANTONIO JOSÉ CALHEIROS RIBEIRO FERREIRAMembers ANTONIO SANCHEZ JUNIOR
ALFREDO EGYDIO SETUBAL EDUARDO CARDOSO ARMONIAANTONIO CARLOS BARBOSA DE OLIVEIRA EDUARDO CORSETTI CANDIDO BOTELHO BRACHER EMERSON SAVI JUNQUEIRAEDUARDO MAZZILLI DE VASSIMON FABIO MASSASHI OKUMURAHENRI PENCHAS FERNANDO HENRIQUE MEIRA DE CASTROJOÃO DIONÍSIO FILGUEIRA BARRETO AMOÊDO FLÁVIO DELFINO JÚNIORSÉRGIO RIBEIRO DA COSTA WERLANG GILBERTO FRUSSA
GUSTAVO HENRIQUE PENHA TAVARESEXECUTIVE BOARD HENRIQUE RUTHER
ILAN GOLDFAJN Chief Executive Officer JOÃO CARLOS DE GÊNOVA
CANDIDO BOTELHO BRACHER JOÃO MARCOS PEQUENO DE BIASEJORGE BEDRAN JETTAR
Executive Vice-Presidents JOSÉ AUGUSTO DURANDALBERTO FERNANDES LILIAN SALA PULZATTO KIEFERDANIEL LUIZ GLEIZER MARCELLO PECCININI DE CHIAROJEAN-MARC ROBERT NOGUEIRA BAPTISTA ETLIN MARCELO ARIEL ROSENHEKRODOLFO HENRIQUE FISCHER MARCELO DA COSTA LOURENÇO
MARCELO MAZIEROMARCO ANTONIO SUDANO
Executive Directors MARCOS AUGUSTO CAETANO DA SILVA FILHOALEXANDRE JADALLAH AOUDE MÁRIO LÚCIO GURGEL PIRESANDRÉ LUÍS TEIXEIRA RODRIGUES MÁRIO LUÍS BRUGNETTIELAINE CRISTINA ZANATTA RODRIGUES VASQUINHO PAULO DE PAULA ABREUFERNANDO FONTES IUNES PAULO ROBERTO SCHIAVON DE ANDRADE MARCELO TREVISAN MARANGON RODERICK SINCLAIR GREENLEESMILTON MALUHY FILHO SOLANGE PAIVA VIEIRA
THALES FERREIRA SILVA
AccountantCARLOS ANDRÉ HERMESINDO DA SILVACRC - 1SP281528/O-1
Head Office: Av. Brigadeiro Faria Lima, 3.400 - 3° ao 8°, 11° e 12° andares - Itaim Bibi - São Paulo - SP
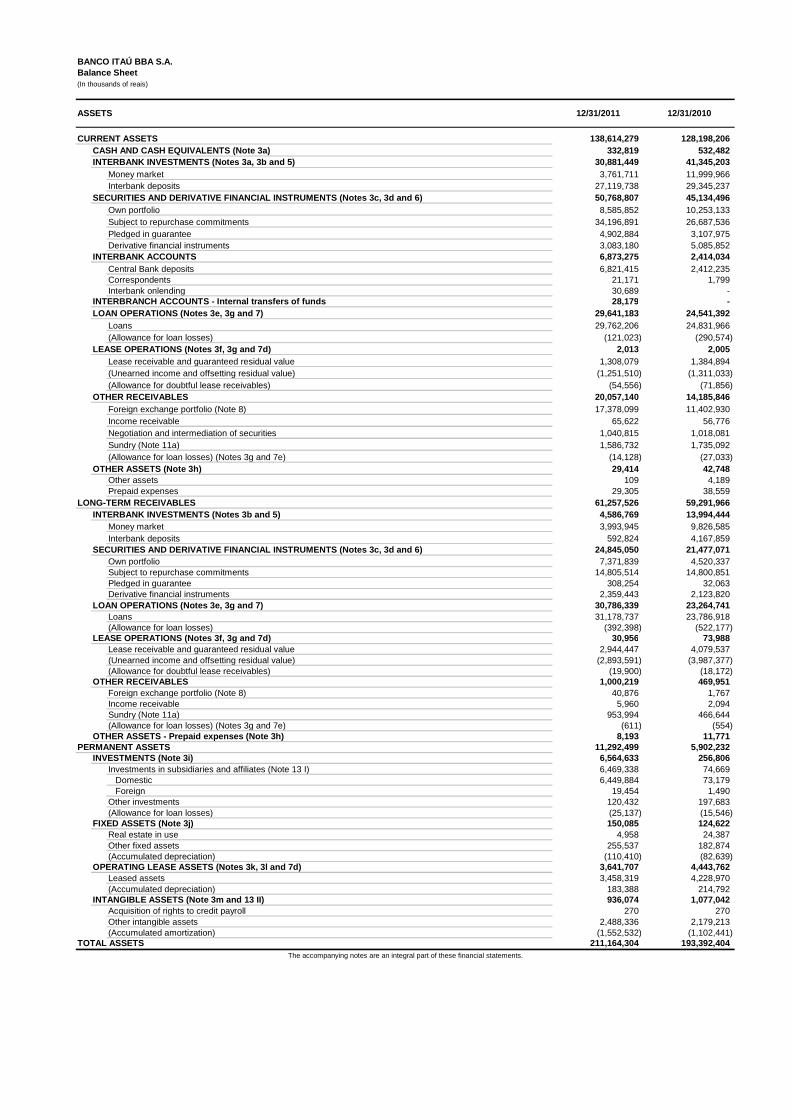
138,614,279 128,198,206 332,819 532,482
30,881,449 41,345,203 Money market 3,761,711 11,999,966 Interbank deposits 27,119,738 29,345,237
50,768,807 45,134,496 Own portfolio 8,585,852 10,253,133 Subject to repurchase commitments 34,196,891 26,687,536 Pledged in guarantee 4,902,884 3,107,975 Derivative financial instruments 3,083,180 5,085,852
6,873,275 2,414,034 Central Bank deposits 6,821,415 2,412,235 Correspondents 21,171 1,799 Interbank onlending 30,689 -
28,179 - 29,641,183 24,541,392
Loans 29,762,206 24,831,966 (Allowance for loan losses) (121,023) (290,574)
2,013 2,005 Lease receivable and guaranteed residual value 1,308,079 1,384,894 (Unearned income and offsetting residual value) (1,251,510) (1,311,033) (Allowance for doubtful lease receivables) (54,556) (71,856)
20,057,140 14,185,846 Foreign exchange portfolio (Note 8) 17,378,099 11,402,930 Income receivable 65,622 56,776 Negotiation and intermediation of securities 1,040,815 1,018,081 Sundry (Note 11a) 1,586,732 1,735,092 (Allowance for loan losses) (Notes 3g and 7e) (14,128) (27,033)
29,414 42,748 Other assets 109 4,189 Prepaid expenses 29,305 38,559
61,257,526 59,291,966 4,586,769 13,994,444
Money market 3,993,945 9,826,585 Interbank deposits 592,824 4,167,859
24,845,050 21,477,071 Own portfolio 7,371,839 4,520,337 Subject to repurchase commitments 14,805,514 14,800,851 Pledged in guarantee 308,254 32,063 Derivative financial instruments 2,359,443 2,123,820
30,786,339 23,264,741 Loans 31,178,737 23,786,918 (Allowance for loan losses) (392,398) (522,177)
30,956 73,988 Lease receivable and guaranteed residual value 2,944,447 4,079,537 (Unearned income and offsetting residual value) (2,893,591) (3,987,377) (Allowance for doubtful lease receivables) (19,900) (18,172)
1,000,219 469,951 Foreign exchange portfolio (Note 8) 40,876 1,767 Income receivable 5,960 2,094 Sundry (Note 11a) 953,994 466,644 (Allowance for loan losses) (Notes 3g and 7e) (611) (554)
8,193 11,771 11,292,499 5,902,232 6,564,633 256,806
Investments in subsidiaries and affiliates (Note 13 I) 6,469,338 74,669 Domestic 6,449,884 73,179 Foreign 19,454 1,490 Other investments 120,432 197,683 (Allowance for loan losses) (25,137) (15,546)
150,085 124,622 Real estate in use 4,958 24,387 Other fixed assets 255,537 182,874 (Accumulated depreciation) (110,410) (82,639)
3,641,707 4,443,762 Leased assets 3,458,319 4,228,970 (Accumulated depreciation) 183,388 214,792
936,074 1,077,042 Acquisition of rights to credit payroll 270 270 Other intangible assets 2,488,336 2,179,213 (Accumulated amortization) (1,552,532) (1,102,441)
211,164,304 193,392,404
BANCO ITAÚ BBA S.A.Balance Sheet(In thousands of reais)
12/31/2011
TOTAL ASSETS
LOAN OPERATIONS (Notes 3e, 3g and 7)
OTHER RECEIVABLES
OTHER ASSETS - Prepaid expenses (Note 3h)
INVESTMENTS (Note 3i)
FIXED ASSETS (Note 3j)
PERMANENT ASSETS
OPERATING LEASE ASSETS (Notes 3k, 3l and 7d)
12/31/2010
LONG-TERM RECEIVABLES
LEASE OPERATIONS (Notes 3f, 3g and 7d)
INTERBANK INVESTMENTS (Notes 3a, 3b and 5)
INTERBRANCH ACCOUNTS - Internal transfers of funds
OTHER RECEIVABLES
LOAN OPERATIONS (Notes 3e, 3g and 7)
CURRENT ASSETS
ASSETS
CASH AND CASH EQUIVALENTS (Note 3a)
SECURITIES AND DERIVATIVE FINANCIAL INSTRUMENTS (No tes 3c, 3d and 6)
INTERBANK ACCOUNTS
The accompanying notes are an integral part of these financial statements.
OTHER ASSETS (Note 3h)
INTERBANK INVESTMENTS (Notes 3b and 5)
INTANGIBLE ASSETS (Note 3m and 13 II)
LEASE OPERATIONS (Notes 3f, 3g and 7d)
SECURITIES AND DERIVATIVE FINANCIAL INSTRUMENTS (No tes 3c, 3d and 6)

145,093,180 123,478,268 61,519,015 46,818,715
Demand deposits 3,332,519 1,723,371 Interbank deposits 29,050,762 26,282,801 Time deposits 29,135,734 18,811,239 Other deposits - 1,304
35,358,656 40,357,979 Own portfolio 29,004,509 28,226,574 Third-party portfolio 6,354,147 12,107,733 Free portfolio - 23,672
8,663,649 4,036,276 Real estate, mortgage, credit and similar notes 1,403,486 2,618,816 Foreign borrowings through securities 7,260,163 1,417,460
8,699 8,740 1,273,281 938,480
Third-party funds in transit 1,273,281 938,415 Internal transfer of funds - 65
11,372,882 8,262,837 Foreign 11,372,882 8,262,837
4,830,626 4,515,265 National Treasury 559 544 BNDES 1,211,854 1,427,538 CEF 16,383 14,265 FINAME 3,482,630 2,994,083 Other institutions 119,200 78,835
3,699,667 4,616,599 18,366,705 13,923,377
Collection and payment of taxes and contributions 28,649 20,842 Foreign exchange portfolio (Note 8) 14,280,126 9,593,301 Social and statutory 969,233 1,149,029 Tax and social security contributions (Notes 3o, 3p and 12c) 1,409,627 1,565,350 Negotiation and intermediation of securities 873,168 856,666 Advances for guaranteed residual values (Notes 3f and 7d) 574,447 523,387 Sundry (Note 11b) 231,455 214,802
59,106,640 61,763,710 19,251,916 25,474,239
Interbank deposits 1,755,453 20,361,141 Time deposits 17,496,463 5,113,098
20,111,496 20,391,710 Own portfolio 19,997,735 14,267,278 Third-party portfolio - 3,366,644 Free portfolio 113,761 2,757,788
3,099,889 1,632,621 Real estate, mortgage, credit and similar notes 1,849,740 113,992 Foreign borrowings through securities 1,250,149 1,518,629
8,625 17,250 2,115,929 1,101,600
Domestic – Other institutions 1,575 1,555 Foreign 2,114,354 1,100,045
11,080,089 10,003,959 National Treasury 1,678 2,119 BNDES 4,590,914 4,030,871 CEF 50,625 62,470 FINAME 6,391,680 5,870,665 Other institutions 45,192 37,834
1,711,838 1,492,825 1,726,858 1,649,506
Foreign exchange portfolio (Note 8) 41,388 1,855 Social and statutory 84,985 23,861 Tax and social security contributions (Notes 3o, 3p and 12c) 35,912 26,297 Advances for guaranteed residual values (Notes 3f and 7d) 1,383,554 1,538,474 Sundry (Note 11b) 181,019 59,019
132,693 97,966 6,831,791 8,052,460
Capital 4,224,086 4,224,086 Capital reserves 15,372 16,907 Revenue reserves 2,471,291 3,734,468 Asset valuation adjustment (Notes 3c and 6a) 121,042 76,999
211,164,304 193,392,404
DEPOSITS RECEIVED UNDER SECURITIES REPURCHASE AGREEMENTS (Notes 3b and 9)
TOTAL LIABILITIES AND STOCKHOLDERS’ EQUITY
BORROWINGS (Notes 3b and 9)
DERIVATIVE FINANCIAL INSTRUMENTS (Notes 3d and 6b)
The accompanying notes are an integral part of these financial statements.
INTERBANK ACCOUNTS – Onlending
FUNDS FROM ACCEPTANCE AND ISSUANCE OF SECURITIES (N otes 3b and 9)
STOCKHOLDERS’ EQUITY (Note 14)
12/31/201012/31/2011
BORROWINGS (Notes 3b and 9)
DEPOSITS (Notes 3b and 9)
DEFERRED INCOME (Note 3q)
DOMESTIC ONLENDING (Notes 3b and 9)
INTERBANK ACCOUNTS – Onlending
DOMESTIC ONLENDING (Notes 3b and 9)
OTHER LIABILITIES
LONG-TERM LIABILITIES
OTHER LIABILITIESDERIVATIVE FINANCIAL INSTRUMENTS (Notes 3d and 6b)
BANCO ITAÚ BBA S.A.Balance Sheet (In thousands of reais)
DEPOSITS (Notes 3b and 9)
CURRENT LIABILITIES
INTERBRANCH ACCOUNTS
LIABILITIES AND STOCKHOLDER'S EQUITY
DEPOSITS RECEIVED UNDER SECURITIES REPURCHASE AGREEMENTS (Notes 3b and 9)
FUNDS FROM ACCEPTANCE AND ISSUANCE OF SECURITIES (N otes 3b and 9)

2nd half 01/01 to 01/01 to2011 12/31/2011 12/31/2010
7,951,432 15,776,699 15,809,451 3,128,090 5,295,507 4,447,532
545,887 1,239,241 1,731,622 5,074,799 8,401,134 7,352,686
(1,053,715) 282,660 1,984,555 (9,777) 111,476 196,217
Compulsory deposits 266,148 446,681 96,839 (6,172,007) (12,213,724) (10,958,431) (5,565,475) (10,580,192) (9,467,540)
(394,073) (821,598) (884,145) (412,102) (914,433) (1,267,486) 199,643 102,499 660,740
1,779,425 3,562,975 4,851,020
(412,723) (926,401) (1,293,761) 547,867 1,033,874 830,156
(321,798) (687,675) (977,667) (343,109) (595,896) (405,861) (76,683) (211,180) (314,358) 80,056 76,484 33,753 36,111 93,554 81,556
(335,167) (635,562) (541,340)
1,366,702 2,636,574 3,557,259
109,031 142,917 12,310
1,475,733 2,779,491 3,569,569 4,207 (485,796) (1,271,806)
(17,866) (538,059) (604,813) 22,073 52,263 (666,993)
(31,802) (74,254) (101,759)
1,448,138 2,219,441 2,196,004
10,569,053 10,569,053 209.99 207.78 646.40 761.89
Derivative financial instruments (Note 6b IV)
BANCO ITAÚ BBA S.A.
(In thousands of reais)
Statement of income
Lease operations (Note 3f)Securities
INCOME FROM FINANCIAL OPERATIONSLoans (Note 3e)
Foreign exchange operations
Lease operations (Note 3f)Borrowings and onlendingMoney market
GROSS INCOME FROM FINANCIAL OPERATIONS
NON-OPERATING INCOME (EXPENSES) (Note 11f)
OPERATING INCOME
Other administrative expenses (Note 11d)Personnel expenses
PROFIT SHARING (Note 15b)
INCOME TAX AND SOCIAL CONTRIBUTION (Notes 3p and 12 a l)
INCOME BEFORE TAXES ON INCOME AND PROFIT SHARING
Related to temporary differencesDue on operations for the period
(Reversal) Allowance for loan losses (Notes 3g and 7e)
OTHER OPERATING REVENUES (EXPENSES)Banking service fees (Note 11c)
EXPENSES ON FINANCIAL OPERATIONS
The accompanying notes are an integral part of these financial statements.
Other operating expenses (Note 11e)
BOOK VALUE PER SHARE - R$NET INCOME PER SHARE - R$ NUMBER OF SHARES (Note 14a)
NET INCOME
Other operating revenues Equity in earnings of subsidiaries and affiliates (Notes 3i and 13 I)Tax expenses (Notes 3p and 12a II)

BANCO ITAÚ BBA S.A.
Capital Capital reserves Revenue reserves Equity valuation
adjustmentRetained earnings Total
BALANCES AT JULY 1, 2011 4,224,086 15,372 1,605,771 36,415 - 5,881,644 Change in adjustment to market value - - - 84,627 - 84,627 Net Income - - - - 1,448,138 1,448,138 Appropriations: Legal reserve - - 72,407 - (72,407) - Statutory reserve - - 793,113 - (793,113) -
Dividends - - - - (212,618) (212,618) Interest on capital - - - - (370,000) (370,000)
BALANCES AT DECEMBER 31, 2011 4,224,086 15,372 2,471,291 121,042 - 6,831,791 CHANGES IN THE PERIOD - - 865,520 84,627 - 950,147
BALANCES AT JANUARY 1, 2010 4,224,086 15,372 2,104,444 42,762 - 6,386,664 Change in adjustment to market value - 1,134 - 34,237 - 35,371 Granting of stock options recognized by subsidiaries - 401 - - - 401 Dividends – Year 2009 - - (4,829) - - (4,829) Net Income - - - - 2,196,004 2,196,004 Appropriations:
Legal reserve - - 109,800 - (109,800) - Statutory reserve - - 1,525,053 - (1,525,053) - Dividends - - - - (297,151) (297,151) Interest on capital - - - - (264,000) (264,000)
BALANCES AT DECEMBER 31, 2010 4,224,086 16,907 3,734,468 76,999 - 8,052,460 CHANGES IN THE PERIOD - 1,535 1,630,024 34,237 - 1,665,796 BALANCES AT JANUARY 1, 2011 4,224,086 16,907 3,734,468 76,999 - 8,052,460 Change in adjustment to market value - - - 44,043 - 44,043 Granting of stock options recognized by subsidiaries - (1,535) - - - (1,535) Dividends – (Note 14b) - - (2,900,000) - - (2,900,000) Net Income - - - - 2,219,441 2,219,441 Appropriations:
Legal reserve - - 110,972 - (110,972) - Statutory reserve - - 1,525,851 - (1,525,851) - Dividends - - - - (212,618) (212,618) Interest on capital - - - - (370,000) (370,000)
BALANCES AT DECEMBER 31, 2011 4,224,086 15,372 2,471,291 121,042 - 6,831,791 CHANGES IN THE PERIOD - (1,535) (1,263,177) 44,043 - (1,220,669)
Statement of Changes in Stockholders’ Equity (Note 14)(In thousands of reais)
The accompanying notes are an integral part of these financial statements.
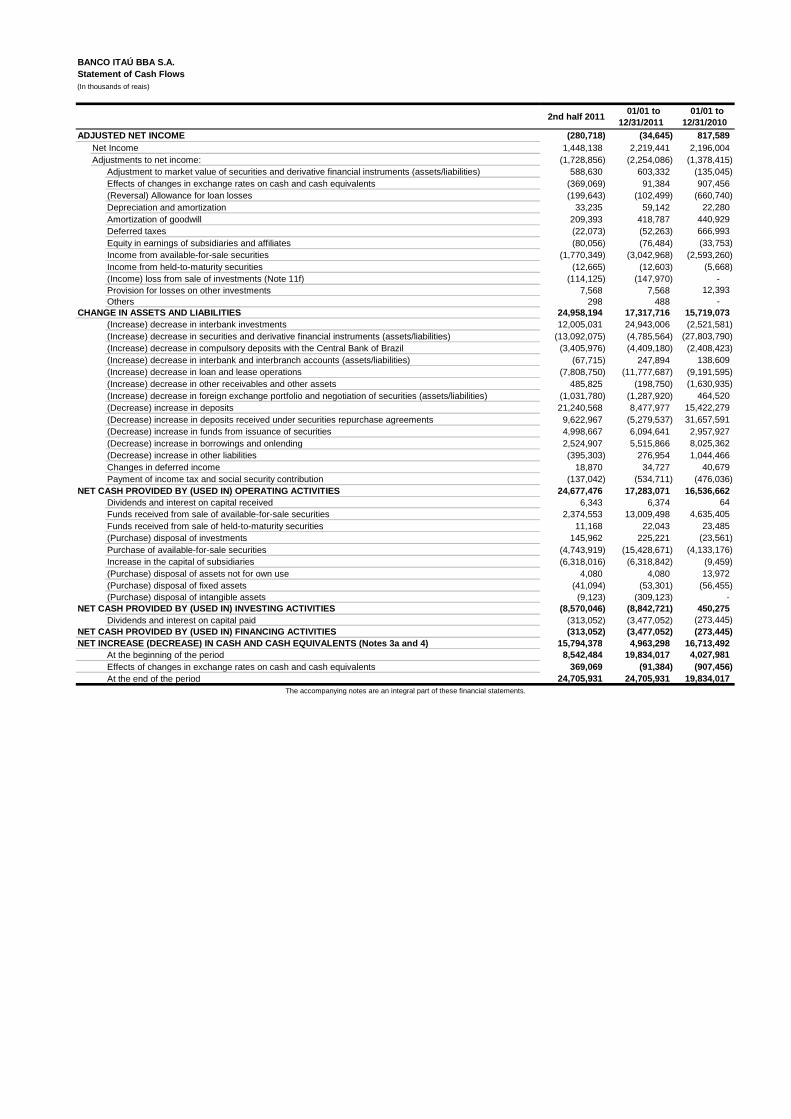
Statement of Cash Flows(In thousands of reais)
2nd half 2011 01/01 to
12/31/2011 01/01 to
12/31/2010 ADJUSTED NET INCOME (280,718) (34,645) 817,589
Net Income 1,448,138 2,219,441 2,196,004Adjustments to net income: (1,728,856) (2,254,086) (1,378,415)
Adjustment to market value of securities and derivative financial instruments (assets/liabilities) 588,630 603,332 (135,045)Effects of changes in exchange rates on cash and cash equivalents (369,069) 91,384 907,456 (Reversal) Allowance for loan losses (199,643) (102,499) (660,740)Depreciation and amortization 33,235 59,142 22,280Amortization of goodwill 209,393 418,787 440,929Deferred taxes (22,073) (52,263) 666,993Equity in earnings of subsidiaries and affiliates (80,056) (76,484) (33,753)Income from available-for-sale securities (1,770,349) (3,042,968) (2,593,260)Income from held-to-maturity securities (12,665) (12,603) (5,668)(Income) loss from sale of investments (Note 11f) (114,125) (147,970) -Provision for losses on other investments 7,568 7,568 12,393Others 298 488 -
CHANGE IN ASSETS AND LIABILITIES 24,958,194 17,317,716 15,719,073 (Increase) decrease in interbank investments 12,005,031 24,943,006 (2,521,581)(Increase) decrease in securities and derivative financial instruments (assets/liabilities) (13,092,075) (4,785,564) (27,803,790)(Increase) decrease in compulsory deposits with the Central Bank of Brazil (3,405,976) (4,409,180) (2,408,423)(Increase) decrease in interbank and interbranch accounts (assets/liabilities) (67,715) 247,894 138,609(Increase) decrease in loan and lease operations (7,808,750) (11,777,687) (9,191,595)(Increase) decrease in other receivables and other assets 485,825 (198,750) (1,630,935)(Increase) decrease in foreign exchange portfolio and negotiation of securities (assets/liabilities) (1,031,780) (1,287,920) 464,520(Decrease) increase in deposits 21,240,568 8,477,977 15,422,279(Decrease) increase in deposits received under securities repurchase agreements 9,622,967 (5,279,537) 31,657,591(Decrease) increase in funds from issuance of securities 4,998,667 6,094,641 2,957,927(Decrease) increase in borrowings and onlending 2,524,907 5,515,866 8,025,362(Decrease) increase in other liabilities (395,303) 276,954 1,044,466Changes in deferred income 18,870 34,727 40,679Payment of income tax and social security contribution (137,042) (534,711) (476,036)
NET CASH PROVIDED BY (USED IN) OPERATING ACTIVITIES 24,677,476 17,283,071 16,536,662 Dividends and interest on capital received 6,343 6,374 64Funds received from sale of available-for-sale securities 2,374,553 13,009,498 4,635,405Funds received from sale of held-to-maturity securities 11,168 22,043 23,485(Purchase) disposal of investments 145,962 225,221 (23,561)Purchase of available-for-sale securities (4,743,919) (15,428,671) (4,133,176)Increase in the capital of subsidiaries (6,318,016) (6,318,842) (9,459)(Purchase) disposal of assets not for own use 4,080 4,080 13,972(Purchase) disposal of fixed assets (41,094) (53,301) (56,455) (Purchase) disposal of intangible assets (9,123) (309,123) -
NET CASH PROVIDED BY (USED IN) INVESTING ACTIVITIES (8,570,046) (8,842,721) 450,275 Dividends and interest on capital paid (313,052) (3,477,052) (273,445)
NET CASH PROVIDED BY (USED IN) FINANCING ACTIVITIES (313,052) (3,477,052) (273,445) NET INCREASE (DECREASE) IN CASH AND CASH EQUIVALENT S (Notes 3a and 4) 15,794,378 4,963,298 16,713,492
At the beginning of the period 8,542,484 19,834,017 4,027,981Effects of changes in exchange rates on cash and cash equivalents 369,069 (91,384) (907,456) At the end of the period 24,705,931 24,705,931 19,834,017
BANCO ITAÚ BBA S.A.
The accompanying notes are an integral part of these financial statements.

BANCO ITAÚ BBA S.A.
NOTES TO THE FINANCIAL STATEMENTS
FROM JANUARY 1 TO DECEMBER 31, 2011 AND 2010
(In thousands of reais)
NOTE 1 - OPERATIONS The purpose of Banco Itaú BBA S.A. (Itaú BBA) is to develop banking activities, including the foreign exchange operations that are authorized for full service banks, with commercial, investment, leasing, real estate loan, and financing and investment portfolios. The Financial Statements prepared for the period from January 1 to December 31, 2011 and 2010, were approved by the Executive Board on February 15, 2012. NOTE 2 - PRESENTATION OF THE FINANCIAL STATEMENTS The financial statements of Itaú BBA have been prepared in accordance with accounting principles established by the Brazilian Corporate Law, in conformity, when applicable, with instructions issued by the Central Bank of Brazil (BACEN) and the National Monetary Council (CMN), which include the use of estimates necessary to calculate accounting provisions. As set forth in paragraph 1, article 2, of BACEN Circular No. 2,804, of February 11, 1998, the financial statements of Itaú BBA comprise the consolidation of its foreign branches and subsidiaries (Note 16d). As set forth in the sole paragraph of article 7 of BACEN Circular No. 3,068, of November 8, 2001, securities classified as trading securities (Note 6a) are presented in the Balance Sheet under Current Assets regardless of their maturity dates. NOTE 3 - SUMMARY OF THE MAIN ACCOUNTING PRACTICES a) Cash and cash equivalents – For purposes of the Statement of Cash Flows, they include cash and current
accounts in banks (considered in the heading cash and cash equivalents), interbank deposits and securities purchased under agreements to resell – funded position that have original maturities of up to 90 days or less.
b) Interbank investments, remunerated restricted cr edits – Brazilian Central Bank, remunerated deposits, deposits received under securities repurc hase agreements, funds from acceptance and issuance of securities, borrowings and onlending an d other receivables and payables – Transactions subject to monetary correction and foreign exchange variation and operations with fixed charges are recorded at present value, net of the transaction costs incurred, calculated "pro rata die" based on the effective rate of transactions, according to CVM Resolution No. 556 of November 12, 2008.
c) Securities – Recorded at cost of acquisition restated by the index and/or effective interest rate and
presented in the Balance Sheet, according to BACEN Circular No. 3,068, of November 8, 2001. Securities are classified into the following categories:
• Trading securities – acquired to be actively and frequently traded, and adjusted to market value, with a
contra-entry to the results for the period;
• Available-for-sale securities – securities that can be negotiated but are not acquired to be actively and frequently traded. They are adjusted to their market value with a contra-entry to an account disclosed in stockholders’ equity;
• Held-to-maturity securities – securities, except for non-redeemable shares, for which the bank has the
financial condition and intends or is required to hold them in the portfolio up to their maturity, are recorded at cost of acquisition, or market value, whenever these are transferred from another category. The securities are adjusted up to their maturity date, not being adjusted to market value.
Gains and losses on available-for-sale securities, when realized, are recognized at the trading date in the statement of income, with a contra-entry to a specific stockholders’ equity account.

Decreases in the market value of available-for-sale and held-to-maturity securities below their related cost, resulting from non-temporary reasons, are recorded in results as realized losses. The effects of the application of the procedures described above in the affiliated and subsidiary companies of Itaú BBA and reflected in their respective stockholders’ equity or income and expense accounts, were likewise recorded in stockholders’ equity or in the equity in earnings of the parent company in proportion to Itaú BBA’s ownership percentage.
d) Derivative financial instruments - these are classified on the date of their acquisition, according to
management's intention of using them either as a hedge or not, according to BACEN Circular No. 3,082, of January 30, 2002. Transactions involving financial instruments, carried out upon the client's request, for their own account, or which do not comply with the hedging criteria (mainly derivatives used to manage the overall risk exposure), are stated at market value, including realized and unrealized gains and losses, which are recorded directly in the statement of income.
The derivatives used for protection against risk exposure or to modify the characteristics of financial assets and liabilities, which have changes in market value highly associated with those of the items being protected at the beginning and throughout the duration of the contract, and which are found effective to reduce the risk related to the exposure being protected, are classified as hedges, in accordance with their nature:
Market Risk Hedge – Financial assets and liabilities, as well as their related financial instruments, are accounted for at their market value plus realized and unrealized gains and losses, which are recorded directly in the statement of income. Cash Flow Hedge - the effective amount of the hedge of financial assets and liabilities, as well as their related financial instruments, are accounted for at their market value plus realized and unrealized gains and losses, net of tax effects, when applicable, and recorded in a specific account in stockholders’ equity. The ineffective portion of the hedge is recorded directly in the statement of income.
e) Loan, Lease and Other Credit Operations (Operati ons with credit granting characteristics) - These
transactions are recorded at present value and calculated “pro rata die” based on the variation of the contracted index and interest rate, and are recorded on the accrual basis until the 60th day overdue. After the 60th day, income is recognized upon the effective receipt of installments. The income arising from the recovery of operations that had been previously written off is classified in Income from Loan Operations and fees contracted in these operations are classified in Banking Service Fees.
f) Lease receivable and guaranteed residual value - recorded at the contractual amount, with a contra–entry
to unearned income accounts and offsetting residual value at the contracted conditions. The guaranteed residual value received in advance is recorded in Other Liabilities – Advances for Guaranteed Residual Values until the date of the contract termination. The adjustment to present value of installments and guaranteed residual value receivable from lease operations is recognized as excess/insufficient depreciation in lease assets so as to make the accounting practices compatible with BACEN Circular No. 1,429 of January 20, 1989. Lease operations are recorded on the accrual basis until the 60th day overdue. After the 60th day overdue, income is recognized upon the effective receipt of installments, and the income arising from the recovery of operations that had been previously written off is classified in Income from Lease Operations. The fees from contracting these operations are recorded in Income from bank charges and operating lease results are appropriated to income on the date the installment is payable.
g) Allowance for Loan Losses – the balance of the allowance for loan losses was recorded based on the
credit risk analysis, at an amount considered sufficient to cover loan losses according to the rules determined by CMN Resolution No. 2,682 of December 21, 1999, amended by article 2 of resolution No. 2,697 of February 24, 2000, among which are:
• Provisions are recorded from the date loans are granted, based on the client’s risk rating and on the
periodic quality evaluation of clients and industries, and not only in the event of default;
• Based exclusively on delinquency, write-offs may be carried out 360 days after the due date of the credit or 540 days for operations that mature after a period of 36 months.
h) Other assets – these assets are mainly comprised by assets held for sale relating to real estate available for
sale, own real estate not in use and real estate received as payment in kind, which are adjusted to market value through the set-up of a provision, according to current regulations; and prepaid expenses, corresponding to disbursements, the benefit of which will occur in future periods, and commissions paid to dealers upon the granting of vehicle financing or leasing.

i) Investments - Investments are accounted for under the equity method. The consolidated financial statements of foreign subsidiaries are adapted to comply with Brazilian accounting practices and converted into Reais. Other investments are recorded at cost and adjusted to market value by setting up a provision in accordance with current standards. The goodwill arising from the acquisitions of investments is amortized based on the expected future profitability (10 years) or upon their realization.
j) Fixed assets - These assets are stated at cost of acquisition or construction, less accumulated depreciation.
They correspond to rights related to tangible assets intended for maintenance of the company's operations or exercised for such purposes, including assets arising from transactions that transfer to the company their benefits, risks and control. The items acquired through lease contracts are recorded according to CVM Resolution No. 554, of November 12, 2008, with a contra-entry to Lease obligations. Depreciation is calculated using the straight-line method, based on monetarily restated cost, at the following annual rates:
Real estate in use 4% to 8%Leasehold improvements From 10%Installations, furniture, equipment and security, transportation and communication systems 10% to 25%EDP systems 20% to 50% k) Operating leases – Leased assets are recorded in property, plant and equipment at cost of acquisition. The
depreciation of leased assets is recognized under the straight-line method, based on their usual useful lives, taking into account that the useful life shall be decreased by 30% should they meet the conditions provided for by Ordinance No. 113/1988, issued by the Ministry of Finance. The annual depreciation rates, without taking into consideration said reduction, are: buildings, 4%, furniture, fixtures and installations, 10%, machinery and equipment, from 10% to 50%, vehicles and related assets, from 20% to 25%, and other assets, from 10% to 20%.
l) Unamortized lease losses – The difference determined at the end of the contract between the attributed
residual value and the guaranteed residual value, when it is owed, is debited to deferred charges for amortization over the remaining useful life of the asset. For publication purposes, the balance of deferred charges is classified in Operating Leases.
m) Intangible assets – Correspond to acquired rights over nonphysical assets intended for maintenance of the
company or which are exercised for such purpose, according to CMN Resolution No. 3,642, of November 26, 2008. They are composed of goodwill upon the acquisition of companies, which is transferred to intangible assets when the subsidiaries are merged into the Company, as determined by Law No. 9,532/97, and are amortized over the terms determined in appraisal reports, as well as rights acquired to credit payrolls, amortized over the agreement terms.
n) Impairment of assets – A loss is recognized when there is clear evidence that assets are stated at a non-
recoverable value. This procedure is performed every six months. o) Contingent assets and liabilities and legal liab ilities – tax and social security - assessed, recognized
and disclosed according to the provisions set forth in CMN Resolution No. 3,823 of December 16, 2009, and BACEN Circular Letter No. 3,429 of February 11, 2010.
I - Contingent Liabilities - basically arise from administrative proceedings and lawsuits, inherent in the normal course of business, filed by third parties, former employees and governmental bodies, in connection with civil, labor, tax and social security matters and other risks. These contingencies are calculated based on conservative practices, being usually recorded based on the opinion of legal advisors and considering the probability that financial resources shall be required for settling the obligation, the amount of which may be estimated with sufficient certainty. Contingencies are classified either as probable, for which provisions are recognized; possible, which are disclosed but not recognized; and remote, for which recognition or disclosure are not required. Any contingent amounts are measured through the use of models and criteria which allow their adequate measurement, in spite of the uncertainty of their term and amounts. Escrow deposits are restated in accordance with the current legislation.
II - Legal liabilities - tax and social security - represented by amounts payable related to tax liabilities, the legality or constitutionality of which are subject to judicial defense, recognized at the full amount under discussion.
Liabilities and related escrow deposits are adjusted in accordance with the current legislation.
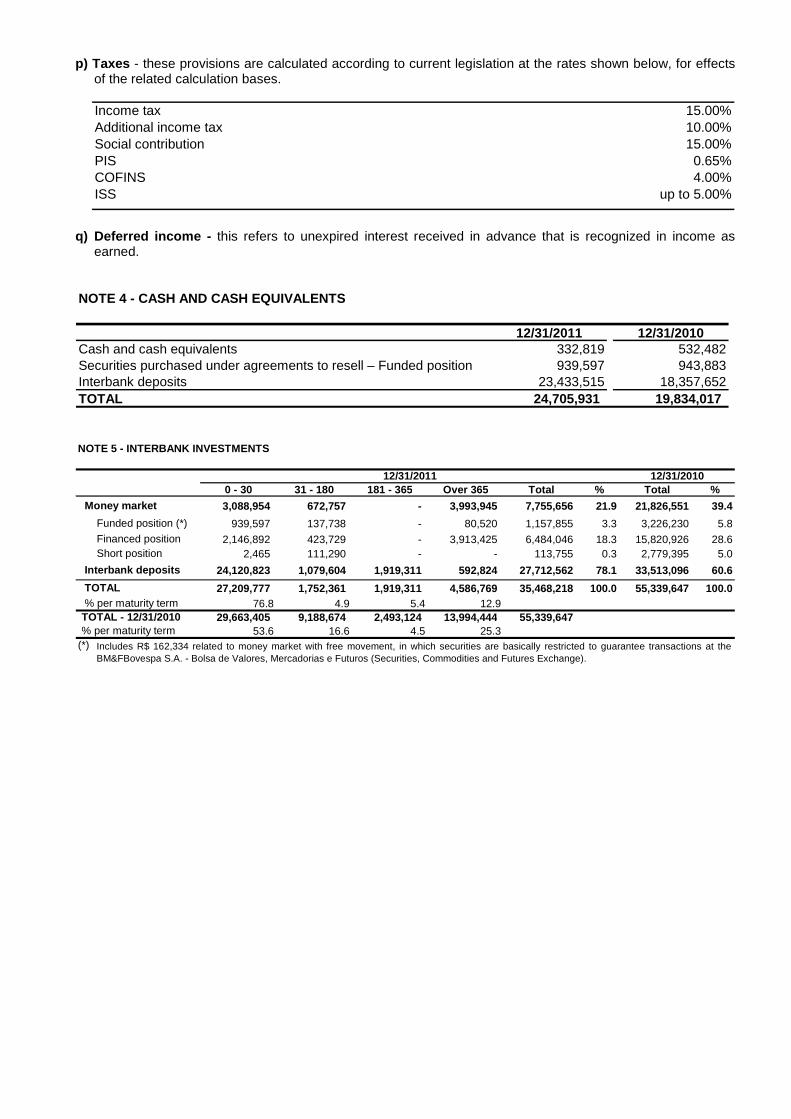
p) Taxes - these provisions are calculated according to current legislation at the rates shown below, for effects of the related calculation bases.
Income tax 15.00%Additional income tax 10.00%Social contribution 15.00%PIS 0.65%COFINS 4.00%ISS up to 5.00%
q) Deferred income - this refers to unexpired interest received in advance that is recognized in income as
earned. NOTE 4 - CASH AND CASH EQUIVALENTS
12/31/2011 12/31/2010Cash and cash equivalents 332,819 532,482 Securities purchased under agreements to resell – Funded position 939,597 943,883 Interbank deposits 23,433,515 18,357,652 TOTAL 24,705,931 19,834,017 NOTE 5 - INTERBANK INVESTMENTS
0 - 30 31 - 180 181 - 365 Over 365 Total % Total %
3,088,954 672,757 - 3,993,945 7,755,656 21.9 21,826,551 39.4
939,597 137,738 - 80,520 1,157,855 3.3 3,226,230 5.8
2,146,892 423,729 - 3,913,425 6,484,046 18.3 15,820,926 28.62,465 111,290 - - 113,755 0.3 2,779,395 5.0
24,120,823 1,079,604 1,919,311 592,824 27,712,562 78.1 33,513,096 60.6
27,209,777 1,752,361 1,919,311 4,586,769 35,468,218 100.0 55,339,647 100.076.8 4.9 5.4 12.9
29,663,405 9,188,674 2,493,124 13,994,444 55,339,647 53.6 16.6 4.5 25.3
(*)
TOTAL % per maturity term
Includes R$ 162,334 related to money market with free movement, in which securities are basically restricted to guarantee transactions at theBM&FBovespa S.A. - Bolsa de Valores, Mercadorias e Futuros (Securities, Commodities and Futures Exchange).
12/31/2010
TOTAL - 12/31/2010% per maturity term
12/31/2011
Money market
Funded position (*)
Financed positionShort position
Interbank deposits

NOTE 6 - SECURITIES AND DERIVATIVE FINANCIAL INSTRU MENTS (ASSETS AND LIABILITIES)
See below the composition by Securities and Derivatives type, maturity and portfolio already adjusted to their respective market values.
12/31/2010
ResultsStockholders’
equityGOVERNMENT SECURITIES - DOMESTIC 21,555,333 15,433 64 21,570,830 28.5 80,146 - 107,291 8,629,731 4,631,090 8,122,572 8,622,496
Financial Treasury Bills 2,888 - - 2,888 - - - - - 2,888 - 2,586 National Treasury Bills 11,681,359 (26,046) - 11,655,313 15.4 - - 107,270 7,907,067 1,752,101 1,888,875 1,085,162 National Treasury Notes 9,870,411 41,479 4 9,911,894 13.1 80,146 - 21 722,382 2,875,648 6,233,697 7,532,994 Other 675 - 60 735 - - - - 282 453 - 1,754
GOVERNMENT SECURITIES - ABROAD 2,662,505 - 1 2,662,506 3.5 590,143 1,518,535 344,806 209,022 - - 16,313 Denmark 1,949,128 - 1 1,949,129 2.6 171,778 1,432,545 344,806 - - - - Spain 418,365 - - 418,365 0.6 418,365 - - - - - - Korea 295,012 - - 295,012 0.3 - 85,990 - 209,022 - - - Uruguay - - - - - - - - - - - 16,313
CORPORATE SECURITIES 45,731,423 (2,431) 208,906 45,937,898 60.8 4,783,138 319,192 368,753 767,395 1,953,159 37,746,261 50,763,086 Eurobonds and other 1,234,160 32 41,903 1,276,095 1.7 6,400 101,535 71,001 37,871 520,273 539,015 9,414,485 Shares 1,451,633 (1,067) 8,584 1,459,150 1.9 1,459,150 - - - - - 1,833,209 Debentures (1) 36,615,574 652 71,034 36,687,260 48.5 1,935 - - 484,903 1,195,060 35,005,362 33,009,426 Promissory Notes 645,791 - 34 645,825 0.9 - 115,687 297,752 232,386 - - 1,264,832 Quotas of Funds 3,319,124 (3,471) - 3,315,653 4.4 3,315,653 - - - - - 2,293,657
Fixed income 2,369,810 - - 2,369,810 3.1 2,369,810 - - - - - 1,442,620 Credit rights 755,322 - - 755,322 1.0 755,322 - - - - - 692,624 Other 193,992 (3,471) - 190,521 0.3 190,521 - - - - - 158,413
Securitized real estate loans 2,218,681 1,423 86,960 2,307,064 3.1 - - - - 232,466 2,074,598 2,947,477 Others 246,460 - 391 246,851 0.3 - 101,970 - 12,235 5,360 127,286 -
SUBTOTAL - SECURITIES 69,949,259 13,004 208,971 70,171,234 92.8 5,453,427 1,837,727 820,850 9,606,148 6,584,249 45,868,833 59,401,895 Trading securities 39,963,143 13,004 - 39,976,147 52.9 1,250,980 2 107,269 8,650,421 4,596,376 25,371,099 32,656,835 Available-for-sale securities 29,932,179 - 208,971 30,141,150 39.9 4,202,175 1,837,489 713,581 954,239 1,953,638 20,480,028 26,681,683
Held-to-maturity securities (2) 53,937 - - 53,937 - 272 236 - 1,488 34,235 17,706 63,377 DERIVATIVE FINANCIAL INSTRUMENTS 5,077,596 365,027 - 5,442,623 7.2 1,431,854 566,559 433,698 651,069 640,405 1,719,038 7,209,672
75,026,855 378,031 208,971 75,613,857 100.0 6,885,281 2,404,286 1,254,548 10,257,217 7,224,654 47,587,871 66,611,567
(88,734) 805
ADJUSTMENT TO MARKET VALUE - SECURITIES – STOCKHOLD ERS’ EQUITY 121,042 (4,752,696) (658,809) - (5,411,505) - (1,104,747) (684,491) (646,614) (1,263,815) (798,377) (913,461) (6,109,424)
(1) Basically includes securities issued by Dibens Leasing S.A. - Arrendamento Mercantil and by BFB Leasing S.A. Arrendamento Mercantil;(2) Securities classified in this category, if stated at market value, would present a positive adjustment of R$ 4,052 (R$ 8,038 at 12/31/2010).
DERIVATIVE FINANCIAL INSTRUMENTS (LIABILITIES)
Deferred taxes Adjustment of subsidiaries and affiliates
366 - 7200 - 30 31 - 90 181 - 365Over 720
days
TOTAL SECURITIES AND DERIVATIVE FINANCIAL INSTRUMEN TS (ASSETS) – 12/31/2011
91 - 180
a) Summary per maturity
12/31/2011
Cost
Provision for adjustment to market value with impact on: Market value %
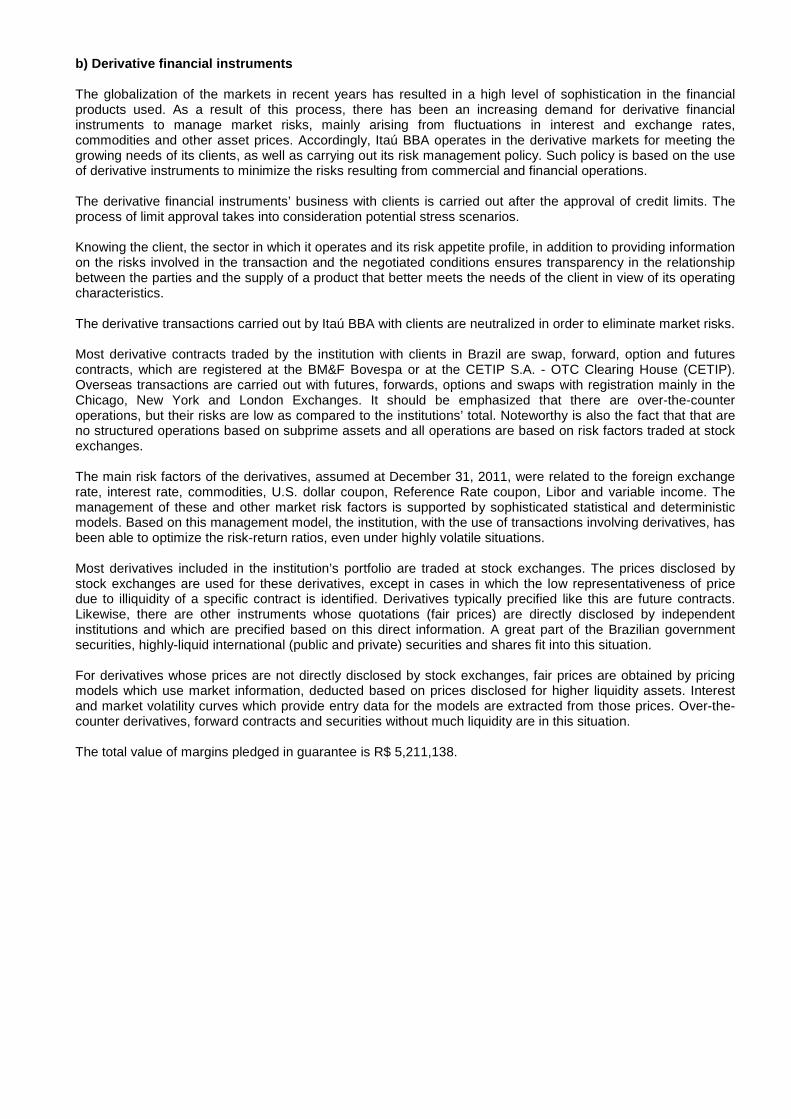
b) Derivative financial instruments The globalization of the markets in recent years has resulted in a high level of sophistication in the financial products used. As a result of this process, there has been an increasing demand for derivative financial instruments to manage market risks, mainly arising from fluctuations in interest and exchange rates, commodities and other asset prices. Accordingly, Itaú BBA operates in the derivative markets for meeting the growing needs of its clients, as well as carrying out its risk management policy. Such policy is based on the use of derivative instruments to minimize the risks resulting from commercial and financial operations. The derivative financial instruments’ business with clients is carried out after the approval of credit limits. The process of limit approval takes into consideration potential stress scenarios. Knowing the client, the sector in which it operates and its risk appetite profile, in addition to providing information on the risks involved in the transaction and the negotiated conditions ensures transparency in the relationship between the parties and the supply of a product that better meets the needs of the client in view of its operating characteristics. The derivative transactions carried out by Itaú BBA with clients are neutralized in order to eliminate market risks. Most derivative contracts traded by the institution with clients in Brazil are swap, forward, option and futures contracts, which are registered at the BM&F Bovespa or at the CETIP S.A. - OTC Clearing House (CETIP). Overseas transactions are carried out with futures, forwards, options and swaps with registration mainly in the Chicago, New York and London Exchanges. It should be emphasized that there are over-the-counter operations, but their risks are low as compared to the institutions’ total. Noteworthy is also the fact that that are no structured operations based on subprime assets and all operations are based on risk factors traded at stock exchanges. The main risk factors of the derivatives, assumed at December 31, 2011, were related to the foreign exchange rate, interest rate, commodities, U.S. dollar coupon, Reference Rate coupon, Libor and variable income. The management of these and other market risk factors is supported by sophisticated statistical and deterministic models. Based on this management model, the institution, with the use of transactions involving derivatives, has been able to optimize the risk-return ratios, even under highly volatile situations. Most derivatives included in the institution’s portfolio are traded at stock exchanges. The prices disclosed by stock exchanges are used for these derivatives, except in cases in which the low representativeness of price due to illiquidity of a specific contract is identified. Derivatives typically precified like this are future contracts. Likewise, there are other instruments whose quotations (fair prices) are directly disclosed by independent institutions and which are precified based on this direct information. A great part of the Brazilian government securities, highly-liquid international (public and private) securities and shares fit into this situation. For derivatives whose prices are not directly disclosed by stock exchanges, fair prices are obtained by pricing models which use market information, deducted based on prices disclosed for higher liquidity assets. Interest and market volatility curves which provide entry data for the models are extracted from those prices. Over-the-counter derivatives, forward contracts and securities without much liquidity are in this situation. The total value of margins pledged in guarantee is R$ 5,211,138.

Balance sheet account
receivable / (received) payable
/ (paid)
Adjustment to market value (in
results)
12/31/2011 12/31/2010 12/31/2011 12/31/2011 12/31/2011 12/31/2010107,741,317 127,766,264 17,187 12,160 29,347 11,210 107,727,085 101,029,842 17,187 (15,761) 1,426 71,854
Commodities 1,111,711 70,414 111 (15,585) (15,474) 32,945 Indices 21,880,714 5,718,104 19,524 499 20,023 1,526 Foreign currency 17,205,186 3,174,856 (2,537) 2,338 (199) 36,984 Interbank market 67,299,248 92,066,468 89 (5) 84 399 Securities 230,226 - - (3,008) (3,008) -
14,232 26,736,422 - 27,921 27,921 (60,644) Foreign currency - 3,792,800 - - - (110) Interbank market - 6,412,847 - - - (2,574) Indices - 16,291,703 - - - (3,541) Securities - 33,324 - - - (177) Commodities 14,232 205,748 - 27,921 27,921 (54,242)
204,009,761 214,767,123 (920,105) 194,933 (725,172) 610,188 101,544,828 107,668,915 1,795,698 455,765 2,251,463 2,825,471
Foreign currency 18,921,585 20,120,543 889,492 (11,279) 878,213 87,087 Interbank market 47,056,664 47,120,933 341,333 50,573 391,906 1,444,190 Fixed rate 24,841,398 30,606,986 315,449 294,646 610,095 879,170 Floating rate 5,611,164 3,066,245 991 (582) 409 3,740 Indices 5,061,924 6,409,993 248,433 122,407 370,840 402,443 Securities 49,093 125,524 - - - 3,736 Commodities 3,000 218,691 - - - 5,105
102,464,933 107,098,208 (2,715,803) (260,832) (2,976,635) (2,215,283) Foreign currency 33,142,420 26,879,061 (1,456,744) 124,065 (1,332,679) (118,915) Interbank market 31,793,923 45,246,773 (228,258) (2,150) (230,408) (754,322) Fixed rate 20,445,851 19,750,914 (466,975) (222,779) (689,754) (842,403) Floating rate 7,251,911 3,739,464 (133,161) 1,674 (131,487) (4,391) Indices 9,603,772 11,084,806 (343,501) (191,718) (535,219) (453,217) Securities 118,595 195,645 (86,165) 34,120 (52,045) (10,133) Commodities 108,461 201,545 (999) (4,044) (5,043) (31,902)
756,239,076 1,955,657,010 808,467 (611,568) 196,899 405,753 218,534,817 576,472,751 414,401 (198,099) 216,302 878,606
Foreign currency 12,010,148 21,512,687 243,903 (104,505) 139,398 261,926 Interbank market 36,294,363 519,563,114 63,287 (34,657) 28,630 454,020 Floating rate 278,388 314,295 1,417 (1,173) 244 1,637 Indices 169,447,671 33,646,694 90,828 (57,808) 33,020 91,145 Securities 1,241 793,924 742 366 1,108 19,722 Commodities 501,299 642,037 14,173 (310) 13,863 50,156 Other 1,707 - 51 (12) 39 -
249,053,852 450,683,960 1,639,487 1,425 1,640,912 1,122,666 Foreign currency 7,521,343 11,290,979 145,141 (39,095) 106,046 442,982 Interbank market 27,406,479 388,623,480 251,401 (16,001) 235,400 97,428 Floating rate 218,024 282,438 606 (260) 346 917 Indices 211,972,223 48,681,339 588,915 (7,311) 581,604 6,479 Securities 1,168,129 1,253,690 639,281 64,384 703,665 572,618 Commodities 767,654 552,034 14,143 (292) 13,851 2,242
106,159,554 419,694,373 (549,003) (65,366) (614,369) (806,640) Foreign currency 10,311,349 21,358,633 (442,336) (106,213) (548,549) (437,941) Interbank market 18,701,642 367,609,819 (36,931) 14,720 (22,211) (255,570) Indices 76,907,732 29,912,254 (63,243) 24,595 (38,648) (56,942) Securities 2,163 197,037 (297) 152 (145) (10,308) Commodities 236,668 616,630 (6,196) 1,380 (4,816) (45,879)
182,490,853 508,805,926 (696,418) (349,528) (1,045,946) (788,879) Foreign currency 10,470,652 14,731,230 (295,961) 114,557 (181,404) (408,187) Interbank market 35,673,305 431,171,934 (173,161) (226,827) (399,988) (184,223) Floating rate 224,776 282,438 (695) 342 (353) (917) Indices 134,942,982 61,535,497 (54,641) (125,650) (180,291) (5,749) Securities 844,110 932,590 (160,793) (107,329) (268,122) (187,032) Other 1,650 - (48) (14) (62) - Commodities 333,378 152,237 (11,119) (4,607) (15,726) (2,771)
15,877,915 1,459,620 234,719 (27,551) 207,168 - 8,275,894 1,459,620 629,464 (61,341) 568,123 1,459,620
Foreign currency 7,883,317 - 623,365 (61,547) 561,818 - Interbank market 349,985 - - - - Fixed rate 5,761 1,235,831 5,503 258 5,761 1,235,831 Floating rate - 223,789 - - - 223,789 Commodities 36,831 - 596 (52) 544 -
1,351,234 - (68,100) (8,397) (76,497) - Foreign currency 1,218,300 - (43,312) (7,514) (50,826) - Floating rate - - (5,503) (258) (5,761) - Commodities 130,857 - (19,081) (631) (19,712) - Others 2,077 - (204) 6 (198) -
1,285,869 - 72,103 11,110 83,213 (1,459,620) Foreign currency 1,181,390 - 24,352 9,067 33,419 - Interbank market 47,169 - - - - - Fixed rate 46,928 - 44,783 2,145 46,928 (1,235,831) Floating rate - - - - - (223,789) Commodities 10,382 - 2,968 (102) 2,866 -
4,964,918 - (398,748) 31,077 (367,671) - Foreign currency 4,905,297 - (341,957) 32,400 (309,557) - Interbank market - - - (8) (8) - Floating rate - - (44,783) (2,145) (46,928) - Commodities 59,621 - (12,008) 830 (11,178) -
Commitments to sell - short position
Market value
�Futures contractsPurchase commitments
Memorandum account Notional amount
Liability position
Sales deliverable
Forward contractsPurchase receivable
Purchase payable
Sales receivable
Purchase commitments – short position
Option contractsPurchase commitments – long position
Commitments to sell – long position
I- See below the composition of the Derivative Financial Instruments portfolio (assets and liabilities) by type of instrument and reference ratio, stated at their notionalamounts, cost and market value.
Commitments to sell
Swap contractsAsset position

Balance sheet account
receivable / (received) payable
/ (paid)
Adjustment to market value (in
results)
12/31/2011 12/31/2010 12/31/2011 12/31/2011 12/31/2011 12/31/20103,690,064 3,000,836 210,658 136,109 346,767 186,588 2,882,474 1,976,141 231,192 139,566 370,758 209,637
Fixed rate 1,694,776 1,976,141 214,942 129,885 344,827 209,637 Floating rate - - 4,955 11,278 16,233 - Indices - - 11,144 (1,446) 9,698 - Securities 1,187,698 - 151 (151) - -
807,590 1,024,695 (20,534) (3,457) (23,991) (23,049) Fixed rate 798,528 600,165 (20,534) (3,121) (23,655) (22,218) Securities 9,062 424,530 - (336) (336) (831)
25,485,272 29,130,244 (25,852) - (25,852) (113,484) 12,603,633 14,275,354 278,064 - 278,064 713,672
Foreign currency 12,603,633 14,077,286 278,064 - 278,064 666,456 Commodities - 198,068 - - - 47,216
12,881,639 14,854,890 (303,916) - (303,916) (827,156) Foreign currency 12,881,639 14,790,938 (303,916) - (303,916) (808,873) Commodities - 63,952 - - - (18,283)
101,920 12,048 (174) (2,306) (2,480) - 50,873 6,020 - - - -
Interbank market 50,873 6,020 - - - - 51,047 6,028 (174) (2,306) (2,480) -
Interbank market 51,047 6,028 (174) (2,306) (2,480) - 53,488 25,384 - 4,441 4,441 - 53,488 25,384 - 4,441 4,441 -
Foreign currency 53,488 25,384 - 4,441 4,441 - - 8,750 - - - (7) - 8,750 - - - (7)
Foreign currency - 8,750 - - - (7) ASSETS 5,077,596 365,027 5,442,623 7,209,672
LIABILITIES (4,752,696) (658,809) (5,411,505) (6,109,424) TOTAL 324,900 (293,782) 31,118 1,100,248
Derivative contracts mature as follows (in days): 0 - 30 31 - 180 181 - 365 Over 365 12/31/2011 12/31/201057,107,635 16,775,940 12,618,963 21,238,779 107,741,317 127,766,264 13,933,117 27,205,681 17,213,803 41,396,529 99,749,130 104,980,405
529,122,259 50,734,768 150,981,614 25,400,435 756,239,076 1,955,657,010 2,760,252 7,653,679 3,625,230 1,838,754 15,877,915 1,459,620
88,449 1,677,283 9,379 1,914,953 3,690,064 3,000,836 9,821,024 8,560,510 2,494,539 4,609,199 25,485,272 29,130,244
- - - 50,873 50,873 6,020 - - - 53,488 53,488 25,384 - - - - - 8,750
Liability position
Memorandum Account Notional Amount
Market value
Asset positionForward operations
Asset positionCredit derivatives
Liability position
Target flow of swapOther
Clearing
Forwards
ForwardsCredit derivatives
Futures
Swaps with target flow
SwapsOptions
Liability position
Swap with target flowAsset position
Liability position
Target flow of swap – foreign currencyAsset position
Other derivative financial instruments (*)

II -
Futures Swaps Options ForwardsCredit
derivativesForwards
Swap with target flow
Target flow of swap
Other
97,329,554 12,905,296 712,542,728 397,154 - - - - - 10,411,763 86,843,834 43,696,348 15,480,761 3,690,064 25,485,272 50,873 53,488 - 1,137,255 66,820,861 39,043,297 1,782,172 2,755,447 23,977,318 - - - 9,274,508 20,014,529 4,653,051 13,698,589 934,617 1,507,954 50,873 53,488 -
Individuals - 8,444 - - - - - - - 107,741,317 99,749,130 756,239,076 15,877,915 3,690,064 25,485,272 50,873 53,488 - 127,766,264 104,980,405 1,955,657,010 1,459,620 3,000,836 29,130,244 6,020 25,384 8,750
III-
12/31/2011 12/31/2010(2,882,474) (1,976,141)
(1,694,775) (1,976,141)
(1,187,699) -
807,590 1,024,695798,528 600,165
9,062 424,530
Total (2,074,884) (951,446)
Securities
Transferred
Received
See below the composition of Credit Derivatives (assets and liabilities) portfolio stated at notional amount:
SecuritiesTotal return swaps whose underlying assets are:
Credit risk amount
Credit swaps whose underlying assets are:
See below the composition of the Derivative Financial Instruments portfolio by type of instrument, stated at their notional amounts, per trading location (organized or over-the-counter market)and counterparties:
Total
Credit derivatives
12/31/2011
BM&F/BovespaOver-the-counter market
Financial institutionsCompanies
Total 12/31/2010
During the period, there was no credit event as set forth in the agreements.
SecuritiesCredit swaps whose underlying assets are:
SecuritiesTotal return swaps whose underlying assets are:
IV -
01/01 to 12/31/2011
01/01 to 12/31/2010
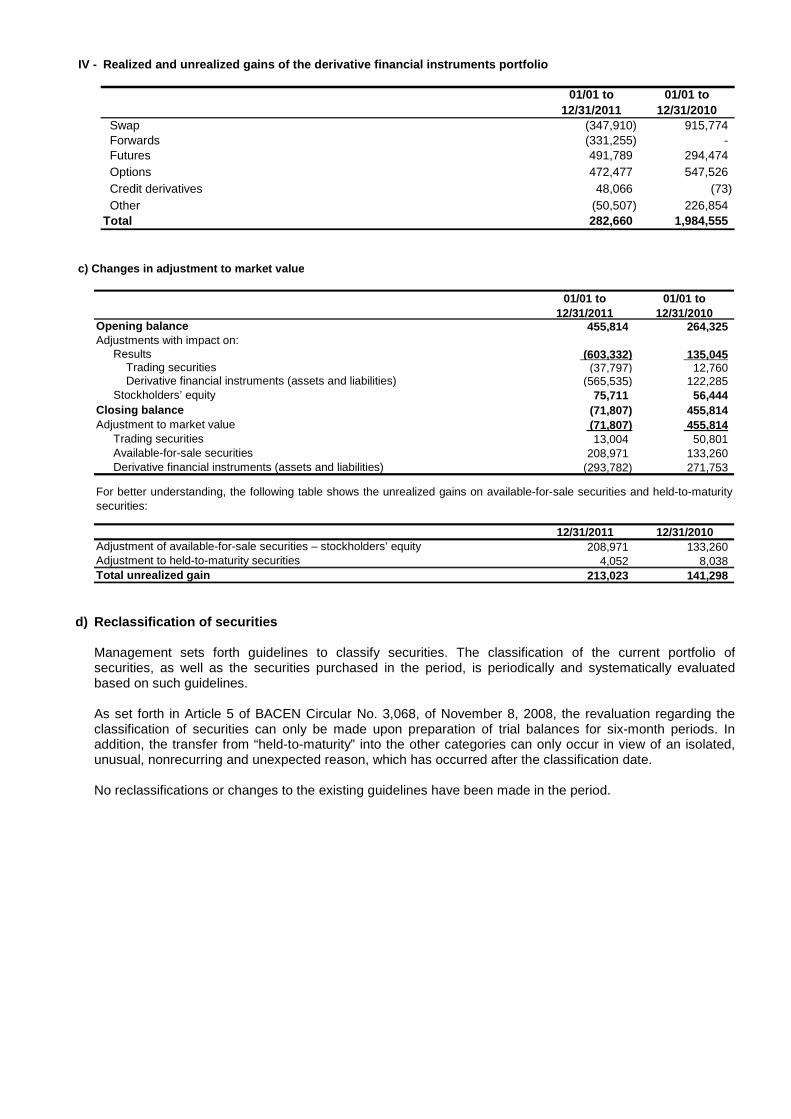
Swap (347,910) 915,774 Forwards (331,255) - Futures 491,789 294,474 Options 472,477 547,526 Credit derivatives 48,066 (73) Other (50,507) 226,854 Total 282,660 1,984,555
Realized and unrealized gains of the derivative fin ancial instruments portfolio
455,814 264,325
(603,332) 135,045(37,797) 12,760
(565,535) 122,285 75,711 56,444
(71,807) 455,814 (71,807) 455,814
13,004 50,801 208,971 133,260
(293,782) 271,753
12/31/2011 12/31/2010208,971 133,260
4,052 8,038 213,023 141,298
c) Changes in adjustment to market value
01/01 to 12/31/2011
Adjustments with impact on:Results
Derivative financial instruments (assets and liabilities)
Opening balance
Adjustment to held-to-maturity securities
Derivative financial instruments (assets and liabilities)
Total unrealized gain
Adjustment of available-for-sale securities – stockholders’ equity
For better understanding, the following table shows the unrealized gains on available-for-sale securities and held-to-maturitysecurities:
01/01 to 12/31/2010
Trading securitiesAvailable-for-sale securities
Adjustment to market value
Trading securities
Stockholders’ equityClosing balance
d) Reclassification of securities
Management sets forth guidelines to classify securities. The classification of the current portfolio of securities, as well as the securities purchased in the period, is periodically and systematically evaluated based on such guidelines. As set forth in Article 5 of BACEN Circular No. 3,068, of November 8, 2008, the revaluation regarding the classification of securities can only be made upon preparation of trial balances for six-month periods. In addition, the transfer from “held-to-maturity” into the other categories can only occur in view of an isolated, unusual, nonrecurring and unexpected reason, which has occurred after the classification date. No reclassifications or changes to the existing guidelines have been made in the period.

12/31/2010
AA A B C D E F G H �Total �Total
46,931,834 9,794,275 2,647,524 757,348 364,342 2,091 260,362 24,853 158,314 60,940,943 48,618,884
Loans and discounted trade receivables 19,117,922 6,711,280 2,233,625 713,157 322,524 1,133 230,219 24,853 141,042 29,495,755 23,139,166
Financing 24,399,970 2,752,293 377,578 34,476 28,161 958 30,143 - 17,272 27,640,851 22,119,988
Farming and agribusiness financing 3,413,942 330,702 36,321 9,715 13,657 - - - - 3,804,337 3,359,730
Lease operations (Note 7d) 103,519 1,307,591 153,018 94,491 43,062 24,107 17,104 15,156 33,192 1,791,240 2,548,031
2,010,859 755,139 100,176 1,221 13,253 2,255 - - 7,169 2,890,072 2,061,216
- 500 - - 7,518 - - - - 8,018 8,057
49,046,212 11,857,505 2,900,718 853,060 428,175 28,453 277,466 40,009 198,675 65,630,273 53,236,188
- - - - - - - - - 36,794,457 23,602,140
49,046,212 11,857,505 2,900,718 853,060 428,175 28,453 277,466 40,009 198,675 102,424,730 76,838,328
25,120,505 21,569,695 3,621,534 1,313,849 804,291 95,855 406,584 141,407 162,468 53,236,188 (1)
(2)
(3)
Loan operations
Advance on exchange contracts (1)
Other sundry receivables (2)
Total operations with credit granting characteristi cs
NOTE 7 - LOAN, LEASE AND OTHER CREDIT OPERATIONS
a) Composition of loan operations by type and risk l evel
Risk levels12/31/2011
Includes Securities and Credits Receivable, Debtors for Purchase of Assets and Endorsements and Sureties paid (Note 11a);
Recorded in Memorandum Accounts.
Endorsements and sureties (3)
Total with endorsements and sureties
Grand total 12/31/2010Includes Advances on Exchange Contracts and Income Receivable from Advances Granted, accounted for in Other Receivables/Liabilities - Foreign Exchange Portfolio (Note 8);

b) Composition of loan operations by maturity and risk l evel
AA A B C D E F G H Total %Falling due installments - - 113,724 358,729 92,613 16,126 69,134 8,104 93,437 751,867 1.15%
01 to 60 - - 8,274 20,111 5,384 1,549 3,940 822 4,934 45,014 0.07%
61 to 90 - - 4,276 7,292 1,880 748 1,907 404 2,315 18,822 0.03%
91 to 180 - - 12,436 17,378 5,822 2,207 22,772 1,176 6,265 68,056 0.10%
181 to 365 - - 25,747 35,661 11,073 4,224 11,318 2,284 14,107 104,414 0.16%
Over 365 - - 62,991 278,287 68,454 7,398 29,197 3,418 65,816 515,561 0.79%
Overdue installments - - 12,891 19,424 51,999 9,158 30,578 28,632 59,276 211,958 0.32%
01 to 60 - - 12,891 8,856 4,956 1,593 25,436 850 23,824 78,406 0.12%
61 to 90 - - - 9,336 43,972 774 1,639 413 2,865 58,999 0.09%
91 to 180 - - - 1,232 3,071 5,702 2,143 26,172 9,556 47,876 0.07%
181 to 365 - - - - - 1,089 1,360 1,197 19,989 23,635 0.04%
Over 365 - - - - - - - - 3,042 3,042 0.00%
SUBTOTAL - - 126,615 378,153 144,612 25,284 99,712 36,736 152,713 963,825 1.47%
AA A B C D E F G H Total %Falling due installments 48,833,026 11,811,062 2,768,4 40 474,601 283,240 3,123 165,186 3,241 45,713 64,387,632 98.11%
01 to 60 8,368,680 1,371,676 685,462 45,387 13,463 202 2,265 168 5,077 10,492,380 15.99%
61 to 90 3,011,463 965,697 198,138 6,812 5,272 105 1,116 87 2,064 4,190,754 6.39%
91 to 180 6,346,986 1,355,583 226,822 105,077 54,058 318 2,307 261 732 8,092,144 12.33%
181 to 365 7,642,302 1,979,914 407,854 50,784 32,597 653 13,508 521 1,058 10,129,191 15.43%
Over 365 23,463,595 6,138,192 1,250,164 266,541 177,850 1,845 145,990 2,204 36,782 31,483,163 47.97%
Overdue up to 14 days 213,186 46,442 5,664 306 323 47 12,5 67 32 249 278,816 0.42%SUBTOTAL 49,046,212 11,857,504 2,774,104 474,907 283,563 3,170 177,753 3,273 45,962 64,666,448 98.53%GRAND TOTAL 12/31/2011 49,046,212 11,857,504 2,900,719 853,060 428,175 28,454 277,465 40,009 198,675 65,630,273 100.00%
Required Allowance - (59,288) (29,007) (25,592) (42,817) (8,536) (138,733) (28,006) (198,675) (530,654)
Additional Allowance - - - - - (4,498) (55,465) (11,999) - (71,962)EXISTING ALLOWANCE - (59,288) (29,007) (25,592) (42,817) (13,034) (194,198) (40,005) (198,675) (602,616)
GRAND TOTAL 12/31/2010 25,120,505 21,569,695 3,621,534 1,313,849 804,291 95,855 406,584 141,407 162,468 53,236,188
Required Allowance - (107,848) (36,215) (39,415) (80,429) (28,757) (203,292) (98,985) (162,468) (757,409)
Additional Allowance - - - - (30,112) (19,161) (81,276) (42,408) - (172,957)EXISTING ALLOWANCE - (107,848) (36,215) (39,415) (110,541) (47,918) (284,568) (141,393) (162,468) (930,366) (*) Operations with overdue installments for more than 14 days or under responsibility of companies in bankruptcy or in process of bankruptcy.
Overdue Operations (*)
Non-Overdue Operations

12/31/2011 12/31/2010
Public Sector 1,475,061 385,875
Private Sector 64,155,212 52,850,313 Companies 62,410,203 50,309,111
Industry and Commerce 33,821,644 26,918,741 Services 19,112,144 15,123,207 Primary Sector 8,833,465 8,164,277 Other 642,950 102,886
Individuals 1,745,009 2,541,202
65,630,273 53,236,188
d) Composition of the present value of lease operat ions
12/31/2011 12/31/2010Lease operations 107,534 166,130 Lease receivable and guaranteed residual value 4,252,526 5,464,431 (Unearned income and offsetting residual value) (4,145,101) (5,298,410) Other assets – Reinstated assets 109 109 Lease assets 3,641,707 4,443,762 Leased assets 3,458,319 4,228,970 Vehicles 3,458,319 4,228,970 Accumulated depreciation 183,388 214,792 (Accumulated depreciation) (2,219,221) (2,033,241) Depreciation in excess 2,402,609 2,248,033 (Advances for guaranteed residual values) (1,958,001) (2,061,861)
Total 1,791,240 2,548,031
Total
c) By sector of debtor
e) Changes in allowance for loan losses
01/01 to 12/31/2011
01/01 to 12/31/2010
Opening balance (930,366) (1,925,888) Net reversal (increase) for the period 102,499 660,740 Required by Resolution No. 2,682/99 102,499 (273,303) Additional - 934,043 Write-Off 225,251 334,782 Closing balance (602,616) (930,366) Required allowance (Note 3g) (530,654) (757,409) Additional allowance (*) (71,962) (172,957)
f) Recovery and renegotiation of credits
I -
II -
g) Credit assignment
At 12/31/2011, the balance of renegotiated credits totaled R$ 90,749 (R$ 74,961 at 12/31/2010) and therelated allowance for loan losses totaled R$ 39,711 (R$ 33,939 at 12/31/2010).
In the year, credits amounting to R$ 1,178,744 (R$ 959,551 at 12/31/2010), the book value of which totaled R$
1.080,967 (R$ 964,748 at 12/31/2010), were assigned without joint obligation in accordance with the provision
in CMN Resolution No. 2,836, of May 30, 2001. The gross result was (R$ 295) (R$ 5,197 at 12/31/2010).
(*) Refers to the provision in excess of the minimum percentage required by CMN Resolution No. 2,682 of December 21, 1999, based onthe expected loss methodology, adopted in the institution’s credit risk management, which also considers the potential losses onrevolving credit.
In the period, credits amounting to R$ 141,329 (R$ 186,232 at 12/31/2010) that had been written-off to theallowance for loan losses account were recovered and are recorded in Income from Loan Operations.
At December 31, 2011, the balance of the allowance in relation to the loan portfolio is equivalent to 0.92%(1.75% at 12/31/2010).

0 - 30 31 - 180 181 - 365 TotalIncome
(expenses)
Loan operations 480 110,569 26,261 137,310 22,740
Foreign borrowings through securities 480 110,569 26,261 137,310 (22,715)
25
h) Restricted operations on assets
We present below information related to the restricted operations on assets, in accordance with CMN Resolution No. 2,921, of January 17, 2002.
Net revenue from restricted operations
Restricted operations on assets
Restricted operations on liabilities
12/31/201101/01 to
12/31/2011
12/31/2011 12/31/2010
17,418,975 11,404,697 Exchange purchase pending settlement - foreign currency 11,385,064 6,569,739 Exchange sale rights - local currency 6,185,773 4,898,986 (-) Advances received – local currency (217,758) (102,242) Income receivable from advances granted 65,896 38,214
14,321,514 9,595,156 Exchange sales pending settlement - foreign currency 6,132,515 4,971,585 Liabilities from purchase of foreign currency - local currency 11,015,420 6,645,821 (-) Advances on exchange contracts and Import financing – exchange rate contracted (2,826,890) (2,023,002) Other 469 752
884,712 326,826 Outstanding import credits - foreign currency 880,820 301,732 Confirmed export credits - foreign currency 3,892 25,094
NOTE 8 - FOREIGN EXCHANGE PORTFOLIO
ASSETS - OTHER RECEIVABLES
LIABILITIES - OTHER LIABILITIES
MEMORANDUM ACCOUNTS

12/31/20100 - 30 31 - 180 181 - 365 Over 365 days Total Total
Deposits 45,211,316 10,638,824 5,668,875 19,251,916 80,770,931 72,292,954 Deposits received under securities repurchase agree ments 21,415,377 7,442,735 6,500,544 20,111,496 55,470,152 60,749,689 Funds from acceptances and issuance of securities 2,929,482 3,569,841 2,164,326 3,099,889 11,763,538 5,668,897 Funds from credit related to agribusiness 251,769 888,401 263,316 1,849,740 3,253,226 2,732,808 Foreign borrowings and securities 2,677,713 2,681,440 1,901,010 1,250,149 8,510,312 2,936,089 Euro Certificates of Deposits 2,653,804 2,239,327 1,871,241 37,874 6,802,246 1,331,555 Brazil Risk Note Programme - - - - - 919,813 Euro Medium-term Note Programme - - - - - 417,680 Medium Term Note 23,103 24,594 21,210 43,481 112,388 125,798 Structure Note Issued - 417,519 8,559 1,168,794 1,594,872 114,943 Euronotes - - - - - 14,546 Other 806 - - - 806 11,754 Borrowings and onlending (*) 1,637,342 7,382,500 7,183,666 13,196,018 29,399,526 23,883,661 TOTAL 71,193,517 29,033,900 21,517,411 55,659,319 177,404,147 162,595,201
(*) Foreign borrowings are basically represented by foreign exchange transactions related to export pre-financing and import financing.
NOTE 9 - FUNDING AND BORROWINGS AND ONLENDING
12/31/2011

NOTE 10 - CONTINGENT LIABILITIES AND LEGAL LIABILIT IES – TAX AND SOCIAL SECURITY Itaú BBA is involved in contingencies in the ordinary course of its business, as follows: a) Contingent Liabilities: these are calculated and classified as follows:
- Calculation criteria:
Civil lawsuits: calculated upon judicial notification, and adjusted monthly:
- Individual (lawsuits related to claims considered unusual and the amounts of which are considered significant): at the claimed indemnity amount, based on the evidence presented and on the evaluation of legal advisors which considers case law, legal opinions raised, evidence produced in the records and the judicial decisions to be issued – relating to the risk level of loss of lawsuits.
These are adjusted to the amounts deposited as guarantee for their execution or to the definitive execution amount (indisputable amount) when the claim is awarded a final and unappealable judgment.
Labor claims: these are calculated based on the individual analysis of the potential amount of probable loss for lawsuits with significant amounts.
Tax and social security: calculated upon judicial notification of administrative proceedings based on their monthly adjusted amounts.
- Contingencies classified as probable: are recognized in the accounting books and mainly comprise
civil lawsuits, labor claims and tax and social security lawsuits.
The table below shows the changes in the respective provisions for contingent liabilities and the respective escrow deposits balances:
01/01 to 12/31/2010
Civil Labor Tax and social
security Total Total
Opening balance 68,256 14,746 72,281 155,283 114,831 Restatement/Charges 8,427 9,354 161 17,942 9,933 Changes in the period reflected in results 180 20,071 27,398 47,649 31,333
Increase 548 20,071 27,405 48,024 34,866 Write-offs through reversal (368) - (7) (375) (3,533)
Payments - (52) - (52) (814) Closing balance at 12/31/2011 76,863 44,119 99,840 220,822 155,283 Closing balance at 12/31/2010 75,135 20,615 59,533 155,283 Escrow deposits at 12/31/2011 5,151 8,304 3,177 16,632 Escrow deposits at 12/31/2010 4,677 4,615 3,042 12,334
Provisions for contingent liabilities 01/01 to 12/31/2011
- Contingencies classified as possible: not recognized in the accounting books and comprise Tax and Social Security Lawsuits amounting to R$ 343,766 mainly related to:
• IRPJ, CSLL, PIS and COFINS – Request for offset dismissed - R$ 96,062: cases in which the credit
has expired;
• IRPJ and CSLL – Equity Recomposition – R$ 49,855: assessment notice requiring Income Tax and Social Contribution on the amount received from government authorities for equity recomposition. The amounts received arise from the privatization of Banco Bemge S.A. The State of Minas Gerais (Parent company and seller) reimbursed Banco Bemge S.A. (later called Banco Itaú BBA S.A.) for amounts related to tax convictions against Banco Bemge S.A. with respect to tax events that occurred prior to privatization;
• Income Guarantees – R$ 48,812: Activities originated from financial operations. This is income earned by the promise of credit transaction under suspensive condition: the implementation of the condition causes the financial institution to become obligated to pay the debt of the contractor, finalizing the extension of the credit. As with guarantees with cost, there is no service being provided.

• INSS – Non-compensatory amounts – R$ 38,749: we defend the non-taxation of these amounts, mainly profit sharing, transportation vouchers and on-time bonus;
• Amnesty noncompliance – R$ 34,209: Declassification of the benefits of amnesty.
• IRPJ, CSLL, PIS and COFINS – Usufruct of quotas and shares - R$ 25,818: we discuss the
adequate accounting and tax treatment for the amount received due to the onerous recognition of usufruct.
b)
Change in legal liabilities 12/31/2011 12/31/2010Opening balance 30,584 17,646 Charges on taxes 1,109 1,099
- 11,839
Closing balance (Note 12c) 31,693 30,584
Change in escrow deposits 12/31/2011 12/31/2010Opening balance 453,678 426,602 Appropriation of income 26,756 28,856
Deposited 28,526 -
Conversion into income (65,925) (1,780)Closing balance 443,035 453,678
The main legal liabilities are described below:
-
Legal Liabilities - Tax and Social Security and Escrow Depos its for Filing Legal Processes – recognized at the full amountbeing questioned and respective escrow deposits, as follows:
Changes in the period reflected in results – Reversal from favorable outcome
PIS – R$ 27,210: Principles of anteriority over 90 days and non-retroactivity: we request the rejection of constitutional Amendments No. 10/96 and No. 17/97 in view of the principles of anteriority and nonretroactivity,seeking authorization to make payment based on Supplementary Law No. 07/70. The corresponding escrow deposit balance totals R$ 18,876.
In the opinion of the legal advisors, ITAÚ BBA is not party to any other administrative proceedings or legal lawsuits that couldsignificantly impact the results of their operations.
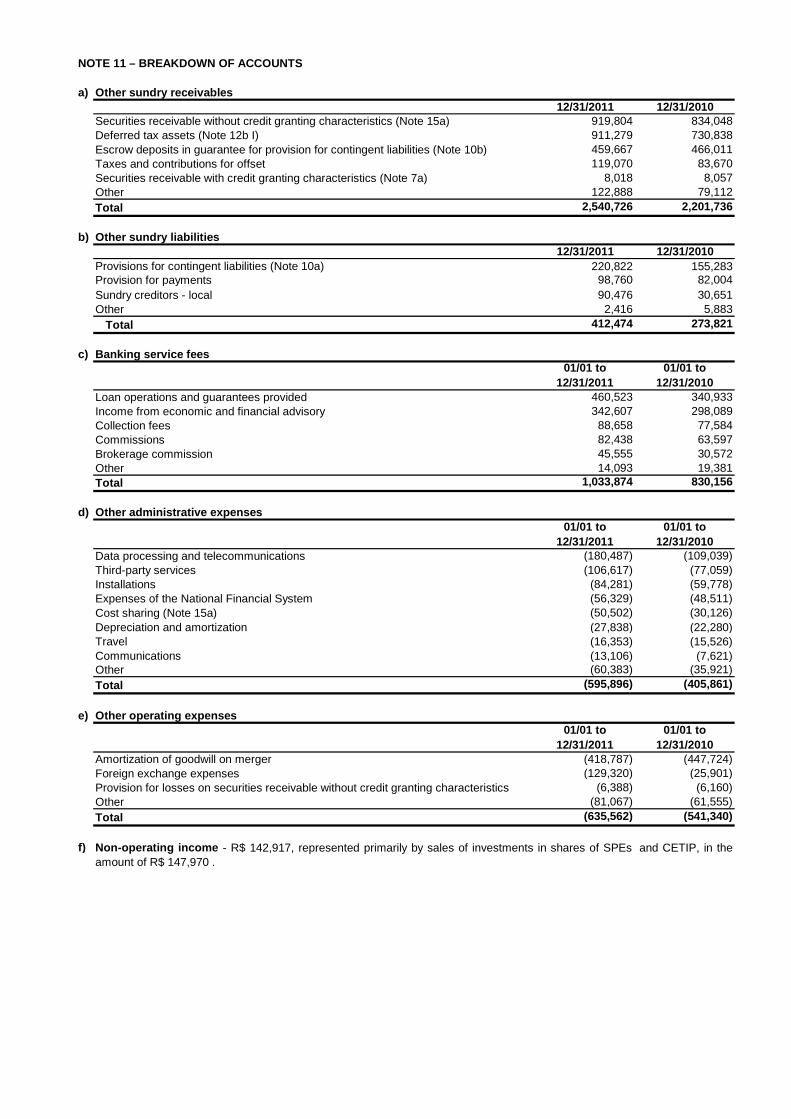
NOTE 11 – BREAKDOWN OF ACCOUNTS
a) Other sundry receivables12/31/2011 12/31/2010
Securities receivable without credit granting characteristics (Note 15a) 919,804 834,048 Deferred tax assets (Note 12b I) 911,279 730,838 Escrow deposits in guarantee for provision for contingent liabilities (Note 10b) 459,667 466,011 Taxes and contributions for offset 119,070 83,670 Securities receivable with credit granting characteristics (Note 7a) 8,018 8,057 Other 122,888 79,112 Total 2,540,726 2,201,736
(2,201,736) ok b) Other sundry liabilities 4%
12/31/2011 12/31/2010Provisions for contingent liabilities (Note 10a) 220,822 155,283 Provision for payments 98,760 82,004 Sundry creditors - local 90,476 30,651 Other 2,416 5,883 Total 412,474 273,821
(206,918) okc) Banking service fees 3%
01/01 to 12/31/2011
01/01 to 12/31/2010
Loan operations and guarantees provided 460,523 340,933 Income from economic and financial advisory 342,607 298,089 Collection fees 88,658 77,584 Commissions 82,438 63,597 Brokerage commission 45,555 30,572 Other 14,093 19,381 Total 1,033,874 830,156
(830,156) ok d) Other administrative expenses 6%
01/01 to 12/31/2011
01/01 to 12/31/2010
Data processing and telecommunications (180,487) (109,039)Third-party services (106,617) (77,059)Installations (84,281) (59,778)Expenses of the National Financial System (56,329) (48,511)Cost sharing (Note 15a) (50,502) (30,126)Depreciation and amortization (27,838) (22,280)Travel (16,353) (15,526)Communications (13,106) (7,621)Other (60,383) (35,921)Total (595,896) (405,861)
405,861 ok e) Other operating expenses 15%
01/01 to 12/31/2011
01/01 to 12/31/2010
Amortization of goodwill on merger (418,787) (447,724)Foreign exchange expenses (129,320) (25,901)Provision for losses on securities receivable without credit granting characteristics (6,388) (6,160)Other (81,067) (61,555)Total (635,562) (541,340)
541,340 ok f) Non-operating income - R$ 142,917, represented primarily by sales of investments in shares of SPEs and CETIP, in the
amount of R$ 147,970 .

NOTE 12 - TAXES
a) Composition of expenses for taxes and contributi ons
I -
Due on operations for the period01/01 to
12/31/201101/01 to
12/31/2010
Income before income tax and social contribution 2,779,491 3,569,569 Charges (Income tax and social contribution) at the rates in effect (Note 3p) (1,111,796) (1,427,828)
Increase/decrease to income tax and social contribu tion charges arising from:Permanent (additions) exclusions 737,747 150,032
Investments in subsidiaries and affiliates 30,594 (1,346)Foreign exchange variation on investments abroad 215,422 (67,072)
Interest on capital 148,000 105,600
Interest on external debt bonds and dividends 128,620 118,636 Other (*) 215,111 (5,786)
Temporary (additions) exclusions (248,643) 561,059 Allowance for loan losses 58,808 369,715 Excess of depreciation of leased assets 49,674 239,857 Adjustment to market value of trading securities and derivative financial instruments and adjustments from operations in futures markets (233,293) 3,159 Legal liabilities - tax and social security, contingent liabilities and restatement of escrow deposits (12,257) 6,957 Profit sharing provisions (84,935) - Other non-deductible provisions (26,640) (58,629)
(Increase) offset of tax losses 84,633 111,924
Expenses for income tax and social contribution (538,059) (604,813)
Related to temporary differences – for the period
Increase (reversal) for the period 164,010 (672,983)Prior periods increase (reversal) (111,747) 5,990
Income (expenses) from deferred taxes 52,263 (666,993)Total income tax and social contribution (485,796) (1,271,806)(*) Basically include the effect due to Payment Program or Installment Payment of Federal Taxes - Law 11.941/09 and adjust prior period.
II -Tax expenses are represented mainly by PIS, COFINS and ISS.
We show below the Income Tax and Social Contribution due on the operations for the period and on temporary differences arising fromadditions and exclusions:
b) Deferred taxes
I -
Tax loss/social contribution loss carryforwards 61 - 581 642 Allowance for loan losses 357,478 (287,657) 228,850 298,671 Adjustment to market value of securities and derivative financial instruments 24,705 (24,705) 256,431 256,431 Legal liabilities - tax and social security and contingent liabilities 49,073 (640) 16,367 64,800 Adjustments of operations carried out in futures settlement market 31,276 (28,258) 1,000 4,018 Other non-deductible provisions 268,245 (175,808) 194,281 286,718
Profit sharing 154,406 (154,406) 175,929 175,929 Other 113,839 (21,402) 18,352 110,789
Total 730,838 (517,068) 697,510 911,280
The deferred tax asset balance and its changes, segregated based on its origin and disbursements incurred, are represented as follows:
12/31/2010 Realization Increase 12/31/2011

II-
34%
2012 492,123 2013 188,052 2014 46,467 2015 32,490 2016 61,118
After 2016 91,029 Total 911,279
Present value (1) 733,668
III- At December 31, 2011, there are no unrecorded deferred taxes.
The estimate of realization and present value of deferred tax assets and social contribution for offset, arising fromProvisional Measure No. 2,158-35 of August 24, 2001 and from the Provision for Deferred Income Tax and SocialContribution existing at December 31, 2011, in accordance with the expected generation of future taxable income,based on the history of profitability and technical feasibility studies, are:
The projections of future taxable income include estimates related to macroeconomic variables, exchange rates,interest rates, volume of financial operations and services fees and others, which can vary in relation to actual dataand amounts.
Net income in the financial statements is not directly related to taxable income for income tax and social contribution,due to differences between accounting criteria and tax legislation, besides corporate aspects. Accordingly, werecommend that the trend of the realization of deferred tax assets arising from temporary differences, income tax andsocial contribution loss carryforwards not to be used as an indication of future net income.
Realization year Temporary differences
(1) The average funding rate was used to determine the present value.
c) Tax and social security contributions
12/31/2011 12/31/2010 Taxes and contributions on income payable 424,748 385,563
Taxes and contributions payable 55,665 367,774
Provision for deferred income tax and social contribution (1) 933,433 807,726
Legal Liabilities - tax and social security (Note 10b) 31,693 30,584
Total 1,445,539 1,591,647 (1) Mainly represented by excess depreciation of lease assets.
The balance of taxes and social security contributions is composed as follows:
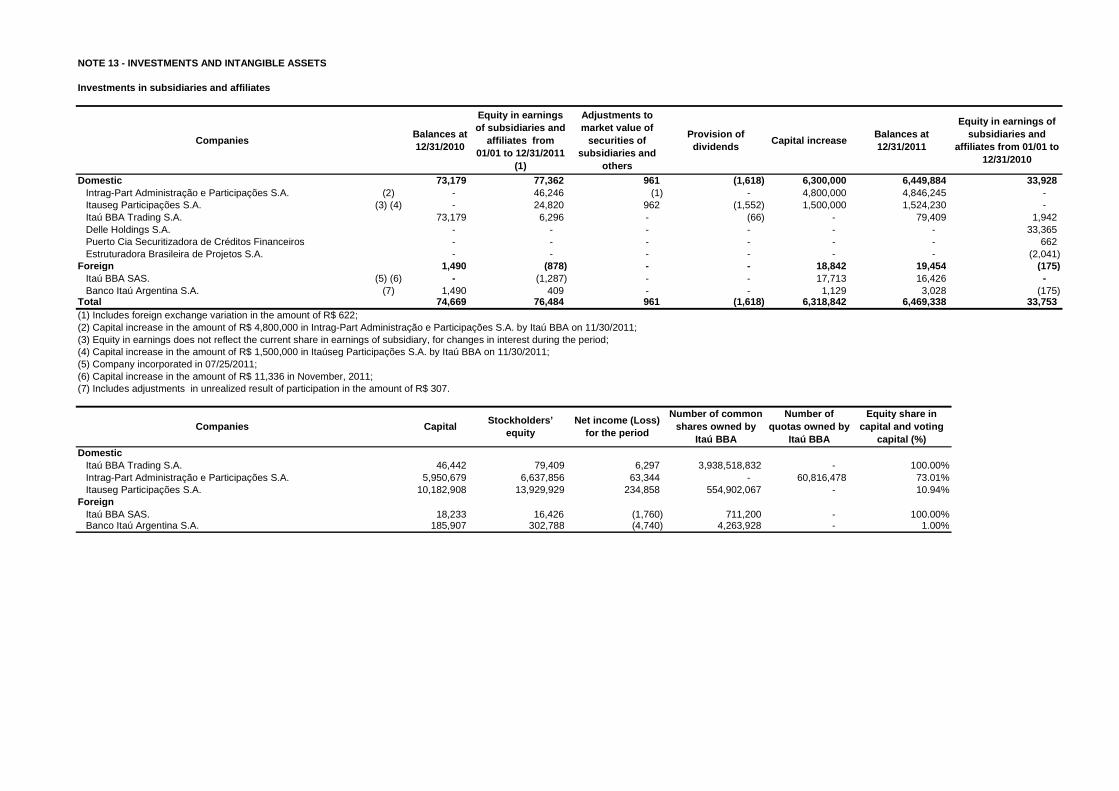
NOTE 13 - INVESTMENTS AND INTANGIBLE ASSETS
Investments in subsidiaries and affiliates
CompaniesBalances at 12/31/2010
Equity in earnings of subsidiaries and
affiliates from 01/01 to 12/31/2011
(1)
Adjustments to market value of
securities of subsidiaries and
others
Provision of dividends
Capital increase Balances at 12/31/2011
Equity in earnings of subsidiaries and
affiliates from 01/01 to 12/31/2010
Domestic 73,179 77,362 961 (1,618) 6,300,000 6,449,884 33,928 Intrag-Part Administração e Participações S.A. (2) - 46,246 (1) - 4,800,000 4,846,245 - Itauseg Participações S.A. (3) (4) - 24,820 962 (1,552) 1,500,000 1,524,230 - Itaú BBA Trading S.A. 73,179 6,296 - (66) - 79,409 1,942 Delle Holdings S.A. - - - - - - 33,365 Puerto Cia Securitizadora de Créditos Financeiros - - - - - - 662 Estruturadora Brasileira de Projetos S.A. - - - - - - (2,041)
Foreign 1,490 (878) - - 18,842 19,454 (175) Itaú BBA SAS. (5) (6) - (1,287) - - 17,713 16,426 - Banco Itaú Argentina S.A. (7) 1,490 409 - - 1,129 3,028 (175)
Total 74,669 76,484 961 (1,618) 6,318,842 6,469,338 33,753
DomesticItaú BBA Trading S.A. 46,442 79,409 6,297 3,938,518,832 - 100.00%Intrag-Part Administração e Participações S.A. 5,950,679 6,637,856 63,344 - 60,816,478 73.01%Itauseg Participações S.A. 10,182,908 13,929,929 234,858 554,902,067 - 10.94%
Foreign Itaú BBA SAS. 18,233 16,426 (1,760) 711,200 - 100.00%Banco Itaú Argentina S.A. 185,907 302,788 (4,740) 4,263,928 - 1.00%
(6) Capital increase in the amount of R$ 11,336 in November, 2011;
(1) Includes foreign exchange variation in the amount of R$ 622;
(5) Company incorporated in 07/25/2011;
(7) Includes adjustments in unrealized result of participation in the amount of R$ 307.
(2) Capital increase in the amount of R$ 4,800,000 in Intrag-Part Administração e Participações S.A. by Itaú BBA on 11/30/2011;(3) Equity in earnings does not reflect the current share in earnings of subsidiary, for changes in interest during the period;(4) Capital increase in the amount of R$ 1,500,000 in Itaúseg Participações S.A. by Itaú BBA on 11/30/2011;
Equity share in capital and voting
capital (%)Companies Capital
Stockholders’ equity
Net income (Loss) for the period
Number of common shares owned by
Itaú BBA
Number of quotas owned by
Itaú BBA

II- Intangible assets
12/31/2011 12/31/2010
Cost (Accumulated amortization)
Net position Net position
2,179,213 (1,521,141) 658,072 1,076,859 Banco Único 1,163,514 (659,324) 504,190 736,892 Itaúsaga 760,905 (715,578) 45,327 181,310 Itaú 254,794 (146,239) 108,555 158,657
270 (141) 129 183 309,123 (31,250) 277,873 -
2,488,606 (1,552,532) 936,074 1,077,042 (1)(2) Contract with Tele Norte Leste Participacoes which guarantees the right to receive interest on capital/dividends of Telemar Norte Leste S.A.
Aquisition of rigths to credit payroll
Goodwill on purchase of investments (1)
Refers mainly to goodwill on purchase of investments concerning the association of Itau Unibanco, which were merged in 2009.
Other intangible assets (2)
Total

NOTE 14 - STOCKHOLDERS' EQUITY a) Shares - Capital comprises 10,569,053 book-entry shares with no par value, of which 5,284,526 are common
class A shares, 1 is common class B share and 5,284,526 are preferred shares. b) Dividends and interest on capital - Stockholders are entitled to a mandatory dividend of not less than 25%
of annual net income, which is adjusted according to the rules set forth in Brazilian Corporate Law.
At the Board Meeting held on 05/09/2011, Additional Dividends were approved, amounting to R$ 2,900,000, and paid on the same date, at the proportion of R$ 274.39 per share. At December 30, 2011, credit related to Interest on Capital was approved, amounting to R$ 314,500, comprising R$ 370,000 gross and R$ 55,500 Withholding Tax.
At December 31, 2011, a provision amounting to R$ 212,618 at the proportion of R$ 20.117 per share, which is equivalent to the mandatory minimum dividend was recognized, and recorded in Other Liabilities – Social and Statutory.
c) Reserves
12/31/2011 12/31/2010CAPITAL RESERVES – RESTATEMENT OF EQUITY SECURITIES 15,372 16,907 REVENUE RESERVES 2,471,291 3,734,468 Legal 622,815 511,843 Statutory (*) 1,848,476 3,222,625 (*) Recognized to ensure to the company the proper operating margin, as provided in its By-laws.
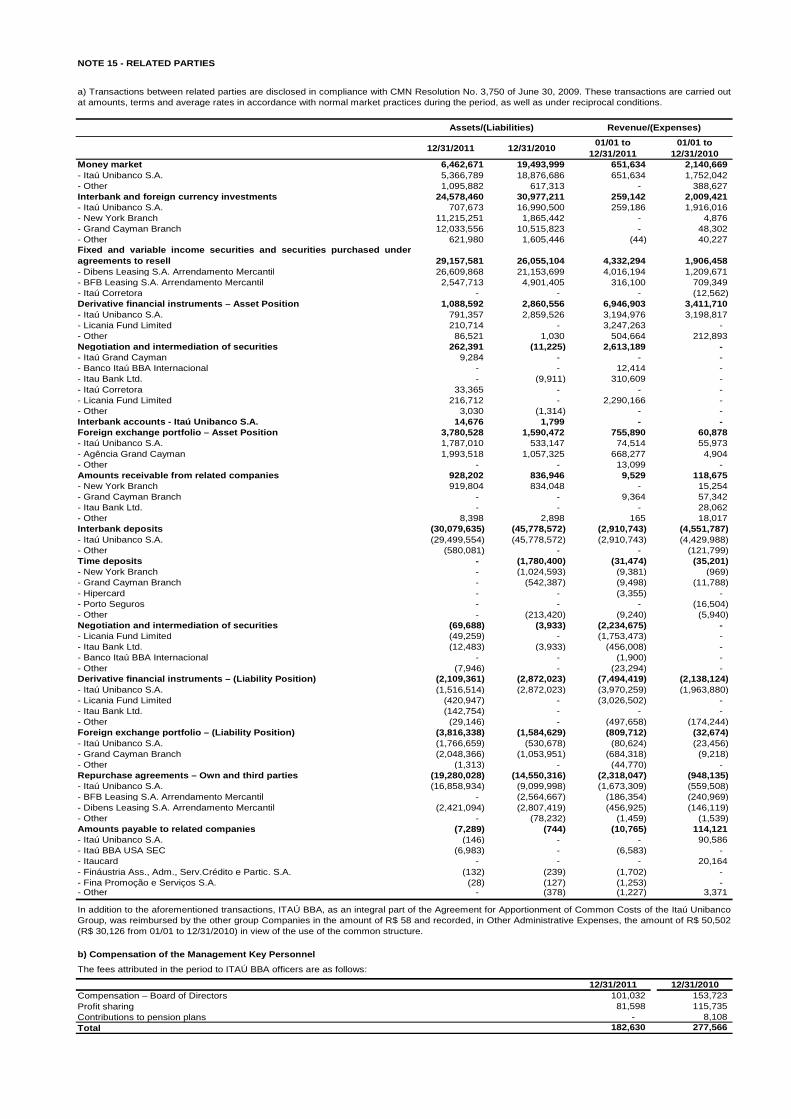
12/31/2011 12/31/201001/01 to
12/31/201101/01 to
12/31/2010Money market 6,462,671 19,493,999 651,634 2,140,669 - Itaú Unibanco S.A. 5,366,789 18,876,686 651,634 1,752,042 - Other 1,095,882 617,313 - 388,627 Interbank and foreign currency investments 24,578,460 30,977,211 259,142 2,009,421 - Itaú Unibanco S.A. 707,673 16,990,500 259,186 1,916,016 - New York Branch 11,215,251 1,865,442 - 4,876 - Grand Cayman Branch 12,033,556 10,515,823 - 48,302 - Other 621,980 1,605,446 (44) 40,227 Fixed and variable income securities and securities purchased underagreements to resell 29,157,581 26,055,104 4,332,294 1,906,458 - Dibens Leasing S.A. Arrendamento Mercantil 26,609,868 21,153,699 4,016,194 1,209,671 - BFB Leasing S.A. Arrendamento Mercantil 2,547,713 4,901,405 316,100 709,349 - Itaú Corretora - - - (12,562)Derivative financial instruments – Asset Position 1,088,592 2,860,556 6,946,903 3,411,710 - Itaú Unibanco S.A. 791,357 2,859,526 3,194,976 3,198,817 - Licania Fund Limited 210,714 - 3,247,263 - - Other 86,521 1,030 504,664 212,893 Negotiation and intermediation of securities 262,391 (11,225) 2,613,189 - - Itaú Grand Cayman 9,284 - - - - Banco Itaú BBA Internacional - - 12,414 - - Itau Bank Ltd. - (9,911) 310,609 - - Itaú Corretora 33,365 - - - - Licania Fund Limited 216,712 - 2,290,166 - - Other 3,030 (1,314) - - Interbank accounts - Itaú Unibanco S.A. 14,676 1,799 - - Foreign exchange portfolio – Asset Position 3,780,528 1,590,472 755,890 60,878 - Itaú Unibanco S.A. 1,787,010 533,147 74,514 55,973 - Agência Grand Cayman 1,993,518 1,057,325 668,277 4,904 - Other - - 13,099 - Amounts receivable from related companies 928,202 836,946 9,529 118,675 - New York Branch 919,804 834,048 - 15,254 - Grand Cayman Branch - - 9,364 57,342 - Itau Bank Ltd. - - - 28,062 - Other 8,398 2,898 165 18,017 Interbank deposits (30,079,635) (45,778,572) (2,910,743) (4,551,787)- Itaú Unibanco S.A. (29,499,554) (45,778,572) (2,910,743) (4,429,988)- Other (580,081) - - (121,799)Time deposits - (1,780,400) (31,474) (35,201)- New York Branch - (1,024,593) (9,381) (969)- Grand Cayman Branch - (542,387) (9,498) (11,788)- Hipercard - - (3,355) - - Porto Seguros - - - (16,504)- Other - (213,420) (9,240) (5,940)Negotiation and intermediation of securities (69,688) (3,933) (2,234,675) - - Licania Fund Limited (49,259) - (1,753,473) - - Itau Bank Ltd. (12,483) (3,933) (456,008) - - Banco Itaú BBA Internacional - - (1,900) - - Other (7,946) - (23,294) - Derivative financial instruments – (Liability Posit ion) (2,109,361) (2,872,023) (7,494,419) (2,138,124)- Itaú Unibanco S.A. (1,516,514) (2,872,023) (3,970,259) (1,963,880)- Licania Fund Limited (420,947) - (3,026,502) - - Itau Bank Ltd. (142,754) - - - - Other (29,146) - (497,658) (174,244)Foreign exchange portfolio – (Liability Position) (3,816,338) (1,584,629) (809,712) (32,674)- Itaú Unibanco S.A. (1,766,659) (530,678) (80,624) (23,456)- Grand Cayman Branch (2,048,366) (1,053,951) (684,318) (9,218)- Other (1,313) - (44,770) - Repurchase agreements – Own and third parties (19,280,028) (14,550,316) (2,318,047) (948,135)- Itaú Unibanco S.A. (16,858,934) (9,099,998) (1,673,309) (559,508)- BFB Leasing S.A. Arrendamento Mercantil - (2,564,667) (186,354) (240,969)- Dibens Leasing S.A. Arrendamento Mercantil (2,421,094) (2,807,419) (456,925) (146,119)- Other - (78,232) (1,459) (1,539)Amounts payable to related companies (7,289) (744) (10,765) 114,121 - Itaú Unibanco S.A. (146) - - 90,586 - Itaú BBA USA SEC (6,983) - (6,583) - - Itaucard - - - 20,164 - Fináustria Ass., Adm., Serv.Crédito e Partic. S.A. (132) (239) (1,702) - - Fina Promoção e Serviços S.A. (28) (127) (1,253) - - Other - (378) (1,227) 3,371
b) Compensation of the Management Key Personnel
The fees attributed in the period to ITAÚ BBA officers are as follows:
12/31/2011 12/31/2010Compensation – Board of Directors 101,032 153,723 Profit sharing 81,598 115,735 Contributions to pension plans - 8,108 Total 182,630 277,566
In addition to the aforementioned transactions, ITAÚ BBA, as an integral part of the Agreement for Apportionment of Common Costs of the Itaú UnibancoGroup, was reimbursed by the other group Companies in the amount of R$ 58 and recorded, in Other Administrative Expenses, the amount of R$ 50,502(R$ 30,126 from 01/01 to 12/31/2010) in view of the use of the common structure.
NOTE 15 - RELATED PARTIES
a) Transactions between related parties are disclosed in compliance with CMN Resolution No. 3,750 of June 30, 2009. These transactions are carried outat amounts, terms and average rates in accordance with normal market practices during the period, as well as under reciprocal conditions.
Assets/(Liabilities) Revenue/(Expenses)

NOTE 16 – ADDITIONAL INFORMATION a) Risk Management – Itaú BBA, by means of the leading institution, Itaú Unibanco Holding S.A. (ITAÚ
UNIBANCO) adopted the operational and market risk management structure in compliance with CMN Resolutions No. 3,380, of June 29, 2006, and No. 3,464, of June 26, 2007. The descriptions of these risk management structures are available on the website of the leading institution (www.itau-unibanco.com.br/ri) under: Corporate Governance/Risk Management.
b) Arrangements for clearing and settlement of obli gations under the National Financial System - Certain agreements were signed for clearing and settlement of obligations under CMN Resolution No. 3,263 of February 24, 2005, through public instruments aimed at allowing compensation of credits and debits held with a single counterparty, where the maturity of the receivables and obligations can be anticipated to the date of the event of default by either party or in case of bankruptcy of the debtor.
c) Single Audit Committee – In accordance with CMN Resolution No. 3,198 of May 27, 2004, Itaú BBA
adopted the Single Audit Committee established by the Itaú Unibanco Financial Group by way of the leading institution Itaú Unibanco Holding S.A. The summary of the report of said Committee was disclosed together with the financial statements of the leading institution Itaú Unibanco Holding S.A.
d)
12/31/2010 12/31/200967,006,489 51,075,762
Cash and cash equivalents 134,430 481,017 Interbank investments 25,458,549 17,295,712 Securities and derivative financial instruments 7,903,150 12,979,685 Loan, lease and other credit operations 21,609,745 10,440,260 Foreign exchange portfolio 9,968,274 8,162,908 Other assets 1,932,341 1,716,180
22,838 27,351 Other investments 21,984 27,338 Fixed assets 854 13
67,029,327 51,103,113
60,811,439 46,760,384 Deposits 26,777,183 16,985,766
Demand deposits 3,250,646 1,653,744 Interbank deposits 1,982,479 - Time deposits 21,544,058 15,332,022
Deposits received under securities repurchase agreements 1,123,076 9,374,878 Funds from acceptances and issuance of securities 8,397,924 2,798,537 Borrowings 12,480,022 7,658,085 Derivative financial instruments 1,296,741 1,119,252 Foreign exchange portfolio 9,975,979 8,188,956 Other liabilities 760,514 634,910
40,944 34,987 6,176,944 4,307,742
Capital and reserves 4,967,590 3,747,542 Net income 1,209,354 560,200
67,029,327 51,103,113
Income from financial operations 1,035,233 937,499 Expenses on financial operations 64,467 (431,449)
Gross income from financial operations 1,099,700 506,050 Other operating revenues/expenses 117,249 66,088
Operating income 1,216,949 572,138 Non-operating income (7,487) (11,778) Income before tax on income and profit sharing 1,209,462 560,360 Income tax and social contribution (108) (160)
1,209,354 560,200
AssetsCurrent assets and long-term receivables
Information on foreign subsidiaries – Itaú BBA carries out operations by means of its branches in Nassau, Bahamas, and Montevideo,Uruguay. Their consolidated financial information, after the elimination of interbranch transactions, follows:
Current and long-term liabilities
Deferred income
Permanent assets
Net income
Statement of income
Total
Liabilities and equity
Stockholders’ equity
Total
Independent Auditor’s Report To the Management and Stockholders Banco Itaú BBA S.A. We have audited the accompanying financial statements of Banco Itaú BBA S.A. (the “Bank”), which comprise the balance sheet as at December 31, 2011 and the statements of income, changes in equity and cash flows for the six-month period and for the year then ended, and a summary of significant accounting policies and other explanatory information. Management’s responsibility for the financial statements of the Bank Management is responsible for the preparation and fair presentation of these financial statements in accordance with accounting practices adopted in Brazil, applicable to institutions authorized to operate by the Brazilian Central Bank (BACEN), and for such internal control as management determines is necessary to enable the preparation of financial statements that are free from material misstatement, whether due to fraud or error. Auditor’s responsibility Our responsibility is to express an opinion on these financial statements based on our audit. We conducted our audit in accordance with Brazilian and International Standards on Auditing. Those standards require that we comply with ethical requirements and plan and perform the audit to obtain reasonable assurance about whether the financial statements are free from material misstatement. An audit involves performing procedures to obtain audit evidence about the amounts and disclosures in the financial statements. The procedures selected depend on the auditor’s judgment, including the assessment of the risks of material misstatement of the financial statements, whether due to fraud or error. In making those risk assessments, the auditor considers internal control relevant to the Bank’s preparation and fair presentation of the financial statements in order to design audit procedures that are appropriate in the circumstances, but not for the purpose of expressing an opinion on the effectiveness of the Bank’s internal control. An audit also includes evaluating the appropriateness of accounting policies used and the reasonableness of accounting estimates made by management, as well as evaluating the overall presentation of the financial statements. We believe that the audit evidence we have obtained is sufficient and appropriate to provide a basis for our qualified audit opinion. Basis for qualified opinion The Bank records its operations and prepares its financial statements in accordance with the accounting guidelines established by the Brazilian Central Bank (BACEN), which require that the adjustment to present value of the finance lease portfolio be classified in permanent assets as excess/insufficient depreciation. These guidelines do not require the reclassification of leases, which remain recorded in accordance with Law 6099/74, to current assets and long-term receivables and income/expenses from financial intermediation –finance leases, but they result in the presentation of the net income and equity in accordance with accounting practices adopted in Brazil. Qualified opinion In our opinion, except for the non-reclassification described in the paragraph above, the financial statements present fairly, in all material respects, the financial position of Banco Itaú BBA S.A. as at December 31, 2011, and its financial performance and cash flows for the six-month period and for the year then ended, in accordance with accounting practices adopted in Brazil, applicable to institutions authorized to operate by the Brazilian Central Bank (BACEN). São Paulo, February 15, 2012 PricewaterhouseCoopers Paulo Sérgio Miron Auditores Independentes Contador CRC 1SP173647/O CRC 2SP000160/O-5