baltic ice lake levels and a lidar/dem-based estimate of
TRANSCRIPT

Bulletin of the Geological Society of Finland, Vol. 91, 2019, pp 119–137, https://doi.org/10.17741/bgsf/91.1.005
Baltic Ice Lake levels and a LiDAR/DEM-based estimate of the glacio-isostatic uplift gradient of the Salpausselkä zone, SE Finland
Juha Pekka Lunkka1*, Tiina Nikarmaa1 and Niko Putkinen2
1 Oulu Mining School, Geoscience Research Unit P.O. Box 3000, FI-90014 University of Oulu, Finland2 Geological Survey of Finland, P.O. Box 97, FI-67101 Kokkola, Finland
Abstract
Glaciofluvial ice-contact deltas were mapped and altitudes of the highest shorelines defined in the eastern arc of the Salpausselkä zone, southern Finland, using Light Detection and Ranging (LiDAR)-based digital elevation models and GIS tools. Mapping of deltas and the highest shorelines in the Salpausselkä zone were undertaken in order to calculate and define the glacio-isostatic uplift palaeo-isobases, uplift gradients and equidistant diagrams (distance diagrams) for the Salpausselkä zone. The results indicate that the glacio-isostatic uplift palaeo-isobases were orientated NE-SW (50°–230°) and the uplift gradients for both the First and the Second Salpausselkä in the eastern arc, are virtually the same, namely 0.6 mkm-1. This suggests that both Salpausselkä ridge complexes, which were originally laid down in front of the Finnish Lake District Ice Lobe (FLDIL) in relatively shallow water, were deposited within a short time period during the Late Weichselian Younger Dryas Stadial. The results also suggest that the Baltic Ice Lake water level regressed 7.5 metres from Baltic Ice Lake level B I to level B III as the ice retreated in its eastern arc from the First to the Second Salpausselkä.
Keywords: Younger Dryas Stadial, Salpausselkä end moraines, equidistant diagram (distance diagram), glacioisostatic uplift gradient, southern Finland, LiDAR, Digital elevation model (DEM), glaciofluvial delta, highest shoreline, palaeo-isobase
*Corresponding author (e-mail: [email protected] )
Editorial handling: Antti E.K. Ojala ([email protected])

120 J. P. Lunkka, T. Nikarmaa and N. Putkinen
1. Introduction
The Younger Dryas Stadial (c. 12 800–11 700 years ago; Muscheler et al. 2008) is a chronozone within the Late Weichselian Substage when deglaciation slowed and glaciers advanced worldwide as a result of global climate cooling. The Younger Dryas Stadial lasted over 1000 years, and it was during this time-period when the major end moraine complexes that run across Fennoscandia were formed at the margin of the Scandinavian Ice Sheet (SIS) (Fig. 1a). These end moraines can be traced for more than 2500 kilometres and they are the most prominent geomorphological glacigenic landforms in Fennoscandia (cf. Lundqvist & Saarnisto, 1995; Putkinen et al., 2011).
During the last deglaciation the SIS was composed of ice dome areas and attached ice lobes that hosted ice streams. The ice dome areas of the SIS were situated in the Scandinavian mountain range and six major ice lobes were operating time-transgressively in the eastern flank of the SIS (Boulton et al., 2001). The behaviour of these ice lobes (hosting ice streams) was complex and to date there is only a limited amount of detailed knowledge of how the ice lobes behaved in space and time (Nikarmaa et al., 2017; Putkinen et al., 2017).
Geomorphological and glacial geological evidence indicates that the Baltic Sea Ice Lobe (BSIL) and the Finnish Lake District Ice Lobe (FLDIL) covered southern Finland during the Younger Dryas Stadial time (cf. Johansson et al., 2011; Putkinen et al., 2017; Fig. 1b) and terminated in the Baltic Ice Lake (cf. Punkari, 1980; Donner, 1995; Lunkka et al., 2004; Johansson et al., 2011; Fig. 1b). The most prominent glacial landforms of Finland, i.e. the Salpausselkä end moraines, formed at the ice margin of the BSIL and the FLDIL, mainly as ice contact sub-aquatic fans or ice-contact glaciofluvial deltas. Only in small highland areas in southeastern Finland, where the FLDIL terminated on land, were sandurs composed of gravel and sand and end moraines mainly composed of till formed.
The water level history of the Baltic Basin during Younger Dryas interval is, to a large extent,
based on observations of flat, glaciofluvial deltaic-type landforms (often interpreted as Gilbert-type deltas) and the beach morphology of glaciofluvial deposits that occur in the Salpausselkä zone (cf. Donner, 1995). According to the generally accepted model, the First Salpausselkä was deposited into the Baltic Ice Lake when the water level stood at the so-called B I-level (cf. Donner, 1995; Donner, 2010). Subsequently, the water level in the Baltic Ice Lake regressed, stabilising at the B III-level when the Second Salpausselkä was formed. As the ice sheet retreated north of the lowland area in Närke, Central Sweden, a passage to the North Atlantic Ocean opened and the Baltic Ice Lake level suddenly dropped c. 26–28 metres from the B III-level to the Yoldia Sea Y I-level. This water-level fall is thought have taken place at around 11 600–11 700 years ago (Saarnisto & Saarinen, 2001; Swärd et al., 2018) when the ice margin in southern Finland was just north of the Second Salpausselkä end moraine ridge complex.
Age estimations of the First and the Second Salpausselkä end moraines are mainly based on the Finnish varved-clay chronology, palaeomagnetic secular variation data and 14C-dates (cf. Saarnisto & Saarinen, 2001; Donner, 2010). In addition to these dating methods, cosmogenic exposure dating of boulders from the top of the Salpausselkä ridges have also been used to determine the age of the Salpaus-selkä end moraines (Tschudi et al., 2000; Rinter-knecht et al., 2004, 2006; Cuzzone et al., 2016).
The revised Finnish varve chronology combined with palaeomagnetic and 14C-dates indicate that the First and the Second Salpausselkäs were formed between 12 200 to 11 600 years ago (Saarnisto & Saarinen, 2001; Donner, 2010). Cosmogenic isotope exposure dates show a greater variability. Cuzzone et al. (2016) obtained new cosmogenic isotope exposure dates from the Salpausselkä zone and revised the previously published cosmogenic ages of Rinterknecht et al. (2004). Cuzzone et al. (2016) came to the conclusion that the western arc of the First Salpausselkä at Hikiä (Fig. 1), once deposited at the margin of the BSIL, was formed at 13 400 +/- 600 years ago. According to Cuzzone

Baltic Ice Lake levels and a LiDAR/DEM-based estimate of the glacio-isostatic uplift gradient of the Salpausselkä zone, SE Finland 121
NKIL
FLDIL
NJIL
BSIL
CFIMF
SS ISS II
30° E25° E20° E64
° N62
° N60
° N
¯
100 Km
Oulu
Helsinki
Lahti
Joensuu
A
B
H
A
Figure 1. Location map A (inset map) showing the most prominent Younger Dryas-age end moraines in Fennoscandia (thick black lines) modified after Putkinen (2011) and Putkinen et al. (2011). The blue box on the inset map shows the area on figure 1B where an approximate configuration and ice-flow directions (arrows) of the Scandinavian Ice Sheet’s ice lobes in southern Finland during the Younger Dryas Stadial are shown, after Boulton et al. (2001). The lines and stippled lines indicate the location of the First (SS I) and the Second Salpausselkä ridges (SS II) and the Central Finland Ice-Marginal Formation (CFIMF). BSIL = Baltic Sea Ice Lobe; FLDIL = Finnish Lake District Ice Lobe; NJIL = Näsijärvi Ice Lobe; NKIL = North Karelian Ice Lobe. The location of two sites mentioned in the text are H = Hikiä and A = Anttilankangas. The study area (black box on map B) is located in SE Finland, extending across the First and the Second Salpausselkä end-moraine ridges. Base map: National Land Survey of Finland © and Geological Survey of Finland ©.
et al. (2016), the age of the Second Salpausselkä at Anttilankangas (Fig. 1), originally deposited in front of the FLDIL, is 11 400 +/- 600 years. Despite the older mean age obtained from Hikiä (Cuzzone et al., 2016), the current view remains that the First and the Second Salpausselkä were deposited at the
ice margin of the BSIL and the FLDIL during the Younger Dryas Stadial.
The main purpose of the present work is to reconstruct the palaeo-isobases of the glacio-isostatic uplift, to create an equidistant diagram (also termed a distance diagram) (cf. Pirazzoli &

122 J. P. Lunkka, T. Nikarmaa and N. Putkinen
Pluet, 1991), to define its direction, and finally to calculate the glacio-isostatic uplift gradients for the Younger Dryas chronozone-age eastern arc of the Salpausselkä zone. This is achieved by using LiDAR digital elevation models and GIS tools.
2. Study area and methods
The study area is located in the Salpausselkä zone in southeastern Finland (Figs. 1 and 2). Its southern limit extends from Lahti to Imatra in the First Salpausselkä and its northern limit from Asikkala to Ruokolahti in the Second Salpausselkä. The altitudes of the highest shorelines of glaciofluvial deltas in the First and the Second Salpausselkä end moraines were mapped in the study area. In
addition, the highest shorelines on the deltas in the area between the First and the Second Salpausselkäs were also mapped. Recently, an extensive Ancient Shore Line Database (ASD) has been introduced for the whole of Finland (Ojala et al., 2013; Åberg, 2013). However, here a detailed analysis of the selected mean shoreline altitudes on ice-contact deltas was carried out better to suit the aims of the present work. Therefore, the definition of the highest shoreline used in this work is based on different criteria adopted by Ojala et al. (2013).
Herein shoreline indicators used to estimate the highest mean shoreline (i.e. mean water level) on glaciofluvial landforms in the Salpausselkä zone were mapped using digital elevation models (DEM) with 25 m and 10 m resolution, and available high-resolution Light Detection and Ranging (LiDAR)
Figure 2. Location of the study area (box indicated on Fig. 1B) in the First and Second Salpausselkä zone. The glaciofluvial deltas used to reconstruct the palaeo-isobases and the base-line are indicated as black circles. The First (SS I) and the Second Salpausselkä (SS II) end-moraine ridges are shown in green coloured polygons. Base map: National Land Survey of Finland ©.
¯
40 km
SS I
SS IIAnttilankangas
Ruokolahti Tuomalankangas
AsikkalaVesivehmaankangas
Utti
ImatraVuoksenniska
LahtiMetsäkangas
RUSSIAFIN
LAND
Gulf of Finland

Baltic Ice Lake levels and a LiDAR/DEM-based estimate of the glacio-isostatic uplift gradient of the Salpausselkä zone, SE Finland 123
DEMs. On the First and the Second Salpausselkä ridges, planar ground surfaces composed of sand and gravel were mapped and glaciofluvial deltas were separated from other flat glaciofluvial terrains (i.e. subaquatic ice-contact fans subsequently levelled by littoral processes). Planar glaciofluvial landform surfaces that contained: 1) a proximal input feeding esker(s) and a fan/cone proximal apex area(s), 2) melt-water channel-features, and 3) fossil kettle holes, were mapped as glaciofluvial ice-contact deltas with topset facies (Fig. 3). The altitude where meltwater channels disappear on delta surfaces was considered as an indication of the highest mean shoreline i.e. the most accurate estimate of the water-level altitude (cf. Fyfe, 1990). In many areas, particularly along the Second Salpausselkä end moraine, there are distinct but less than 1.5 metre high beach ridges. These features are generally composed of gravel and coarse sand, and run for several kilometres on the distal part of delta surfaces adjacent to the high-angle delta slope. The altitudes at the tops of these beach ridges are considered to represent the maximum highest water level formed by storm waves. The mean highest water-levels have stood at a slightly lower altitude compared to the altitude at the top of a beach ridge, a characteristic also noted by Ojala et al. (2013) for example. In this study, the disappearance altitude of the melt-water channels was defined and considered as the primary indication of the mean highest shoreline altitude of the deltas mapped. In the areas where beach ridges next to the delta slope hamper observations of channel disappearance, the altitude value at the foot of a beach ridge was considered to represent the most accurate altitude estimate of the highest mean shoreline. Several altitude measurements of each melt-water channel disappearance zone along each distal delta/delta slope brink points were recorded. At least tree altitude values from the LiDAR-data of the National Land Survey of Finland were listed from each site on an individual delta where features indicative for the highest mean shoreline were observed. It must be noted that since glaciofluvial ice-contact deltas are several kilometres to more
than ten kilometres in length, the highest shoreline altitude, even within each individual glaciofluvial delta, ranges between 1 to 3 metres. This height difference results from the orientation of a delta front in relation to a glacio-isostatic uplift direction. However, the shoreline altitude to represent the mean highest shoreline (i.e. mean highest water-level altitude) has been selected and used for calculations only at one representative and most reliable site on each glaciofluvial delta, unlike in the ASD database (Ojala et al., 2013).
Based on 164 altitude measurements taken from the disappearance points of melt-water channels, delta plain/slope break points and beach ridge foot points on deltas, the error of the mean highest shoreline estimation at the selected sites studied is ±1 m on average.
The highest mean shoreline (water-level) alti-tudes defined on the deltas were used to reconstruct equidistant diagrams (i.e. distance diagrams) across the Salpausselkä zone in its eastern arc, i.e. along the margin of the former FLDIL. In the equidistant diagram, the altitudes of the highest mean shoreline sites across the area studied are plotted against the distance between the highest mean shoreline sites along the line at right angles to the isobases (cf. Donner, 1995). The reconstruction of the equidistant diagrams is based on the assumption that the highest mean shorelines (i.e. the mean water-level altitudes) in the First Salpausselkä deltas along its eastern arc, from the Metsäkängas delta, Lahti (altitude 151 m a.s.l.) to the Vuoksenniska delta, Imatra (altitude 100 m a.s.l.), were formed more or less contemporaneously, i.e. during the time when the mean water-level of the Baltic Ice lake stood at the B I-level (cf. Donner, 1995). A similar assumption was made for the highest mean shorelines (i.e. mean water-level altitudes) identified on the marginal deltas of the Second Salpausselkä from Asikkala (Vesi vehmaankangas delta, altitude 151 m a.s.l.) to Ruokolahti (Tuomalankangas delta, altitude 105 m a.s.l.) when the Baltic Ice Lake water level was at the B III-level (cf. Donner, 1995).
Reconstruction of the equidistant diagram began with a selection of three separate highest

124 J. P. Lunkka, T. Nikarmaa and N. Putkinen
26°50'0"E26°49'0"E26°48'0"E26°47'0"E26°46'0"E26°45'0"E
61°5
'0"N
61°4
'0"N
ANTTILANKANGAS DELTA
¯
1 km
123 m asl
AIRFIE
LD
Melt water channel
! Kettle holeFeeding eskerBeach ridge & bermsLake
Lidar DEM140 m asl
76 m asl
Figure 3. A LiDAR image of the Anttilankangas delta where the diagnostic geomorphological features used to define ice-contact deltas and the highest mean shoreline in the Salpausselkä deltas are shown. The geomorphological features defining deltas are based on the occurrence of fossil kettle holes (blue circles), melt-water channels on delta plains (yellow arrows), beach ridges and berms (red line) and proximal sediment input apices. The primary estimate of the highest mean shoreline on the Salpausselkä ice-contact deltas is based on the disappearance altitude of melt-water channels and the definition of a delta distal plain/delta slope brink point altitude. Secondarily, the highest mean shoreline estimate was approximated defining a beach ridge foot altitude. Only a few melt-water channels are indicated on the Anttilankangas delta surface. The highest shoreline altitude 123 m a.s.l. at the Anttilankangas delta reference point (see text) is also shown. The green arrows indicate eskers, i.e. subglacial tunnels that brought meltwater and sediment to the ice margin and into the Baltic Ice Lake. Base map: National Land Survey of Finland ©.
mean shoreline altitudes from both the First and the Second Salpausselkä deltas. In order to define the palaeo-isobases with a three-point method (Figs. 4 and 5) the following steps were made:
1) three delta locations with well-identifiable highest mean shorelines from the western, central and eastern parts of the study area were selected
covering the entire study area, 2) a triangle between the highest mean shoreline altitude reference points of three deltas located in different parts of the study area was made, 3) a distance value (metres/kilometres) of each side of the triangle was divided by a respective height (highest mean shoreline altitude) difference (m), 4) altitude (height) points

Baltic Ice Lake levels and a LiDAR/DEM-based estimate of the glacio-isostatic uplift gradient of the Salpausselkä zone, SE Finland 125
(m) were calculated along each side of the triangle and 5) palaeo-isobases were formed by drawing lines between the equal altitude (height) values on the sides of the triangle.
The highest mean shoreline altitudes chosen were taken from the western (Lahti, Metsäkangas delta, 151 m asl), central (Utti delta, 120 m asl) and eastern (Imatra, Vuoksennniska delta 100 m asl) parts of the First Salpausselkä (Figs. 2 and 4). Similarly, the three highest mean shoreline altitudes were chosen from the western (Vesivehmaankangas delta, 151 m asl), central (Anttilankangas delta, 123 m asl) and eastern (Tuomalankangas delta, 105 m asl) parts of the Second Salpausselkä (Figs. 2 and 5). Based on the altitudes and the distance of the three shoreline points on the First Salpausselkä and the three shoreline points on the Second Salpausselkä, palaeo-isobases were reconstructed and the base line, perpendicular to the palaeo-isobases, were defined (Figs. 4 and 5). Subsequently, all the remaining DEM- and LiDAR- observations of the shoreline altitudes on the delta surfaces (i.e.
a disappearance altitude of melt-water channels and /or an altitude of delta slope and delta-plain break point or foot altitude of a beach ridge) along the First and Second Salpausselkä and on the deltas between the First and the Second Salpausselkä were plotted on the map and on the equidistant diagram (Fig. 7). This was done in order to check the validity of the defined palaeo-isobase direction and consequently the orientation of the base line.
3. Results
3.1. The First Salpausselkä
In the eastern arc of the First Salpausselkä, the deltas at Vuoksenniska (the highest mean shoreline 100 m a.s.l.), at Utti (the highest mean shoreline 120 m a.s.l.) and at Metsäkangas (highest mean shoreline 151 m a.s.l.) were selected for reconstruc-tion of a distance diagram (Fig. 4 and Table 1). All the highest shoreline features on these deltas were
Table 1. A list of nine highest shorelines from the lowest to the highest altitude defined from delta surfaces of the First Salpausselkä between Lahti and Imatra. The three highest shore lines, Metsäkangas delta, Lahti (151 m a.s.l.), Utti delta (120 m a.s.l.) and Vuoksenniska delta (100 m a.s.l.) were used to define the palaeo-isobases and the base line for the First Salpausselkä phase. The last column shows the previous highest shore line altitudes estimates from the same delta complexes. Note that the exact locations (i.e. coordinates) from where previous workers’ altitude estimates have been made are not the same as the localities presented here / or are not known.
Locality nameCoordinates
LatitudeLongitude
Base line distance km
Altitudem a.s.l.
Altitude (m asl) and site reference elsewhere
VuoksenniskaN 61° 13.9428’E 28° 50.5643’
1.0 100104 (Hellaakoski, 1934)100 (Donner, 1977; Saarnisto 1982); 102.3 (Ojala et al. 2013)
JoutsenonkangasN 61° 06.5284’E 28° 29.1229’
2.0 102 102 (Hellaakoski, 1934)
KokkoharjuN 61° 00.9628’E 27° 59.8406’
10.4 105
TaavettiN 60° 55.2926’E 27° 31.7064’
18.2 110
Kaipiainen IN 60° 54.6561’E 27° 17.5423’
25.2 113
Kaipiainen IIN 60° 54.3146’E 27° 12.5842’
27.7 116 117 (Donner, 1977)
UttiN 60° 54.1437’E 26° 58.3255’
36.0 120120 (Leiviskä, 1920; Sauramo, 1958; Donner, 1977)
NastolaN 60° 56.5010’E 25° 56.0620’
75.1 142146 (Ramsay, 1931)144 (Donner, 1977)
Lahti-MetsäkangasN 60° 58.7407’E 25° 34.5986’
89.9 151150 (Donner, 1977)154.4 (ASD – database)

126 J. P. Lunkka, T. Nikarmaa and N. Putkinen
formed when the water level of the Baltic Ice Lake was at the B I-level (cf. Sauramo, 1958; Donner, 1969; Donner, 1977).
The Vuoksenniska delta is located in the northeastern part of the study area (Fig. 4 and Table 1 for location). A flat delta surface with braided melt-water flow channels and fossil kettle holes is more than 6 kilometres long and 0.4 to 2 kilometres wide in the Vuoksennniska area. Based on the present observations from three different areas along the delta plain/delta slope brink-point area, the highest shoreline ranges from 100.3 m to 101.2 m (LiDAR-altitude values). A reference point close to a gravel pit at an altitude of 100 m in the northeastern part of the delta (for the precise location: Fig. 6a and Table 1) was selected for palaeo-isobase and equidistant diagram calculations.
As a consequence of gravel and sand exploita-tion, the Utti delta area of the First Salpaus selkä ridge is rather small today (Fig. 6b). However, the highest mean shoreline at the Utti delta could be defined based on the occurrence of dead-ice kettle holes, minor melt-water channels and the highest altitude of beach cusps (Fig. 6b). These observations indicate that the highest mean shoreline in different parts of the Utti delta ranges from 119.7 m to 121.4 m (LiDAR-altitude values). A mean highest shoreline reference point at an altitude of 120 m in the eastern part of the delta (for the precise location: Fig. 6b and Table 1) was selected for palaeo-isobase and equidistant diagram calculations.
The Metsäkangas delta, east of Lahti, is morphologically well preserved but the area is densely built up (Fig. 6c). Despite the urban infra-
Figure 4. A map showing a triangle (three-point method) reconstruction of the palaeo-isobases and the base-line using the highest mean shoreline data from three localities (Vuoksenniska delta, 100 m; Utti delta, 120 m and Metsäkangas delta, 151 m) in the First Salpausselkä. The palaeo-isobases (black stippled lines) created indicate graphically calculated equivalent altitudes in between three highest shoreline altitudes in the triangle (see text for the use of the three-point method in palaeo-isobase reconstruction). The base line (red line) is drawn perpendicular to the palaeo-isobases. The red dots show the highest mean shorelines and their altitude along the First Salpausselkä. The Salpausselkä ridges (SS I, SS II) are indicated in the green colour. Base map: National Land Survey of Finland ©.
!
!
!
!!!!
!
!
Salpausselkä I
150 m
140 m
130 m
120 m
110 m
100 m
¯20 km
SS I
SS II
UTTI 120 mLAHTI 1
51 m
VUOKSENNISKA 100 m
Joutsenonkangas 1
02 m
Kokkoharju
105 m
Taavetti 1
10 m
Kaipiainen I
113 m
Kaipiainen II
116 m
Nastola 142 m
! Delta SS IBase line SS IPalaeoisobase SS ITriangle SS I

Baltic Ice Lake levels and a LiDAR/DEM-based estimate of the glacio-isostatic uplift gradient of the Salpausselkä zone, SE Finland 127
structures, a flat delta surface with braided melt-water channels, kettle holes and beach ridges can be identified on the delta plain. Subglacially formed lineations also occur in the proximal part of the delta, probably indicating minor ice-front oscillations on the proximal side of the delta (Fig. 6c). The highest mean shoreline in different parts of the Metsäkangas delta ranges from 148.6 m to 152.1 m (LiDAR-altitude values). A mean highest shoreline reference point at an altitude of 151 m in the southwestern part of the delta (for the precise location: Fig. 6b and Table 1) was selected for palaeo-isobase and equidistant diagram calculations.
Based on these three deltas and their highest mean shoreline altitude estimates (i.e. water-level estimates), a triangle was created to define the palaeo-isobases and the base line for the area
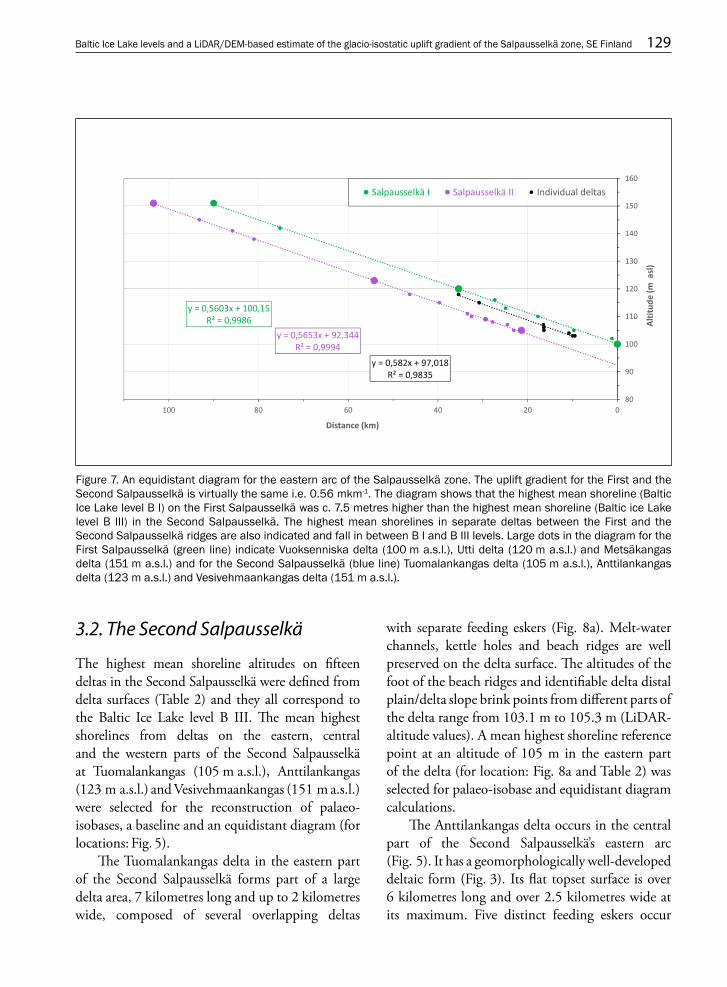
(Methods section above and Fig. 4). The strike of the baseline defined, perpendicular to the palaeo-isobases, for the First Salpausselkä is 320˚–140˚. The altitudes of the six other deltas in the First Salpausselkä and their highest mean shorelines levels defined (shown in Fig. 4 and listed in Table 1) were subsequently plotted on the equidistant diagram (Fig. 7). The results show that the highest mean shorelines defined for each individual deltas along the eastern arc of the First Salpausselkä from Vuoksenniska to Metsäkangas delta, Lahti fit almost perfectly to the defined palaeo-isobases and the baseline having a high positive correlation of 0.9986. The equidistant diagram shows that the glacio-isostatic uplift gradient along the baseline since the formation of the highest mean shoreline in the First Salpausselkä is 0.565 mkm-1 that is rounded to 0.60 m/km (Fig. 7).
Figure 5. A map showing a triangle reconstruction of the palaeo-isobases and the base-line using the highest mean shoreline reference point data from three delta localities (Tuomalankangas delta, 105 m: Anttilankangas delta, 123 m and Vesivehmaankangas delta 151 m) in the Second Salpausselkä. The palaeo-isobases (black stippled lines) created indicate graphically calculated equivalent altitudes in between three highest mean shoreline altitudes in the triangle. The base-line (red line) is drawn perpendicular to the palaeo-isobases. The red dots show the highest shorelines and their altitude along the Second Salpausselkä. The Salpausselkä ridges (SS I, SS II) are indicated in a green colour. Base map: National Land Survey of Finland©.
!
!
!!
!!!
!
!
!
!!!
!
!
Salpausselkä II
150 m
140 m
130 m
120 m
110 m
105 m ¯20 km
SS I
SS II
ANTTILANKANGAS 123 m
Kivikorve
nkangas 1
05 m
TUOMALANKANGAS 105 m
VESIVEHMAANKANGAS 151 m
Syväniemi 1
07 mSarv
iniemi 109 m
Kulopa
lonkangas 1
09 m
Halkos
upankangas 1
10 m
Selkäka
ngas 111
m
Siilikan
gas 115 m
Sudenhauda
nkangas
118 m
Hyrtiälä
nkangas 1
45 m
Urheiluopistonka
ngas 141 m
Vuolenkoski
138 m
Rastin
kangas 1
08 m
! Delta SS IIBase line SS IIPalaeoisobase SS IITriangle SS II

128 J. P. Lunkka, T. Nikarmaa and N. Putkinen
Figure 6. LiDAR-images of three deltas in the First Salpausselkä and their highest mean shoreline reference point and altitude (red dot) defined according to criteria presented in text, a) Vuoksenniska delta, b) Utti delta c) Metsäkangas delta.
Baltic Ice Lake levels and a LiDAR/DEM-based estimate of the glacio-isostatic uplift gradient of the Salpausselkä zone, SE Finland 129
3.2. The Second Salpausselkä
The highest mean shoreline altitudes on fifteen deltas in the Second Salpausselkä were defined from delta surfaces (Table 2) and they all correspond to the Baltic Ice Lake level B III. The mean highest shorelines from deltas on the eastern, central and the western parts of the Second Salpausselkä at Tuo malankangas (105 m a.s.l.), Anttilankangas (123 m a.s.l.) and Vesivehmaankangas (151 m a.s.l.) were selected for the reconstruction of palaeo- isobases, a baseline and an equidistant diagram (for locations: Fig. 5).
The Tuomalankangas delta in the eastern part of the Second Salpausselkä forms part of a large delta area, 7 kilometres long and up to 2 kilometres wide, composed of several overlapping deltas
with separate feeding eskers (Fig. 8a). Melt-water channels, kettle holes and beach ridges are well preserved on the delta surface. The altitudes of the foot of the beach ridges and identifiable delta distal plain/delta slope brink points from different parts of the delta range from 103.1 m to 105.3 m (LiDAR-altitude values). A mean highest shoreline reference point at an altitude of 105 m in the eastern part of the delta (for location: Fig. 8a and Table 2) was selected for palaeo-isobase and equidistant diagram calculations.
The Anttilankangas delta occurs in the central part of the Second Salpausselkä’s eastern arc (Fig. 5). It has a geomorphologically well-developed deltaic form (Fig. 3). Its flat topset surface is over 6 kilometres long and over 2.5 kilometres wide at its maximum. Five distinct feeding eskers occur
y = 0,5603x + 100,15R² = 0,9986
y = 0,5653x + 92,344R² = 0,9994
y = 0,582x + 97,018R² = 0,9835
80
90
100
110
120
130
140
150
160
020406080100
Alt
itud
e (m
asl
)
Distance (km)
Salpausselkä I Salpausselkä II Individual deltas
Figure 7. An equidistant diagram for the eastern arc of the Salpausselkä zone. The uplift gradient for the First and the Second Salpausselkä is virtually the same i.e. 0.56 mkm-1. The diagram shows that the highest mean shoreline (Baltic Ice Lake level B I) on the First Salpausselkä was c. 7.5 metres higher than the highest mean shoreline (Baltic ice Lake level B III) in the Second Salpausselkä. The highest mean shorelines in separate deltas between the First and the Second Salpausselkä ridges are also indicated and fall in between B I and B III levels. Large dots in the diagram for the First Salpausselkä (green line) indicate Vuoksenniska delta (100 m a.s.l.), Utti delta (120 m a.s.l.) and Metsäkangas delta (151 m a.s.l.) and for the Second Salpausselkä (blue line) Tuomalankangas delta (105 m a.s.l.), Anttilankangas delta (123 m a.s.l.) and Vesivehmaankangas delta (151 m a.s.l.).

130 J. P. Lunkka, T. Nikarmaa and N. Putkinen
on the proximal side of the delta. The delta top is characterised by melt-water channels, kettle holes and a distinct beach ridge running close to the distal delta slope (Fig. 3). The altitudes of identifiable channel disappearance points, beach ridge feet and delta distal plain/delta slope brink points from different parts of the delta range from 121.5 m to 124.1 m (LiDAR-altitude values). The
mean highest shoreline reference point selected for palaeo-isobase and equidistant diagram calculations is located in the eastern part of delta adjacent to the delta front at an altitude of 123 m (for the precise location: Fig. 3 and Table 2).
The Vesivehmaankangas delta is located in the western part of the study area (Fig. 5). This delta is well developed with a number of kettle holes,
Locality nameCoordinatesLatitude /Longitude
Base line distance
km
Altitude m a.s.l.
Altitude (m asl) and site reference
elsewhere
TuomalankangasN 61° 22.1969’E 28° 31.3511’
0105
105.2 (ASD-database)
KivikorvenkangasN 61° 20.3340’E 28° 23.6729’
1.7105
105 (Hellaakoski, 1934)
SyväniemiN 61° 18.3179’E 28° 16.0701’
3.1107
RastinkangasN 61° 17.1261’E 28° 07.3734’
6.4 108
108 (Hellaakoski, 1934)
KulopalonkangasN 61° 13.0807’E 27° 54.4616’
7.9109
113 (Saarnisto, 1982)
SarviniemiN 61° 16.4924’E 28° 03.2421’
8.0109
110 (Saarnisto, 1982)
HalkosupankangasN 61° 13.3401’E 27° 49.7186’
11.1110
SelkäkangasN 61° 10.5586’E 27° 41.4118’
12.0111
111 (Saarnisto, 1982)
SiilikangasN 61° 06.4518’E 27° 20.4561’
18.4115
115 (Saarnisto, 1982)
SudenhaudankangasN 61° 05.4991’E 27° 06.8912’
25.0118
117 (Saarnisto, 1982)
AnttilankangasN 61° 03.5548’E 26° 48.9499’
32.8123
123 (Saarnisto, 1982)125.3 / 123.6 (ASD-database)
VuolenkoskiN 61° 05.1060’E 26° 07.3060’
59.6138
UrheiluopistonkangasN 61° 05.6835’E 26° 00.7143’
64.4141
145 (Ramsay, 1931)141 (Saarnisto, 1982)
HyrtiälänkangasN 61˚ 06.9160’E 25˚ 51.0347’
71.9145
145 (Saarnisto, 1982)
VesivehmaankangasN 61˚ 09.0056’E 25˚ 38.9523’
82.0151
151 (Leiviskä 1920; Ramsay, 1931; Sauramo, 1958)155.4 (ASD-database)
Table 2. A list of fifteen highest mean shoreline altitudes from the lowest to the highest altitude defined from the Second Salpausselkä between the Tuomalankangas delta and the Vesivehmaankangas delta. The three highest mean shorelines at Vesivehmaankangas delta (151 m a.s.l.), Anttilankangas delta (123 m a.s.l.) and Tuomalankangas delta (105 m a.s.l.) were used for defining palaeo-isobases and the base-line for the Second Salpausselkä phase. The last column shows some previous estimates of the highest shoreline altitudes. Note that the exact locations (i.e. coordinates) from where previous workers’ altitude estimates have been made are not the same as localities presented here / or are not known.
Baltic Ice Lake levels and a LiDAR/DEM-based estimate of the glacio-isostatic uplift gradient of the Salpausselkä zone, SE Finland 131
meltwater channels, distinct beach ridges and a well-developed delta front (Fig. 8b). These features can be clearly seen in the western part of the delta top but not in the eastern part of the delta top where an airfield has been built. Glacial lineations occur north of delta proper indicating an ice-flow direction from the north. The altitudes of identifiable channel disappearance points along the distal delta plain/delta front brink point area range from 151.4 m to 152.8 m (LiDAR-altitude values). The mean highest shoreline reference point selected for palaeo-isobase and equidistant diagram calculations is located in the central part of delta at an altitude of 151 m (for precise location: Fig. 3 and Table 2).
Based on these three deltas and their highest mean shoreline altitude estimates (i.e. water-level estimates), a triangle was created to define the palaeo-isobases and the base line for the area (Methods chapter above and Fig. 5). The strike of the baseline for the Second Salpausselkä is the same as for the First Salpausselkä, i.e. 320˚–140˚. Additional highest mean shoreline altitudes on twelve additional deltas mapped in the Second Salpausselkä (Table 2) were plotted on the equidistant diagram (Fig. 7 and Table 2). As in the
case of the First Salpausselkä, the highest mean shorelines on delta surfaces along the eastern arc of the Second Salpausselkä fit almost perfectly to the defined palaeo-isobases and the baseline having a high positive correlation of 0.9994. The equidistant diagram shows that the uplift gradient of the ground surface along the baseline since the formation of the Second Salpausselkä has been 0.60 mkm-1. This uplift gradient is the same as that for the First Salpausselkä area.
In addition to these reconstructions, the highest mean shoreline altitudes from eight deltas located in the area between the First and the Second Salpausselkäs were also defined and plotted on the equidistant diagram (Table 3 and Fig. 7). Although it cannot be assumed that the water level was the same during formation of individual deltas in the area between the First and the Second Salpausselkä, the uplift gradient of 0.6 mkm-1 (Fig. 7) is also almost the same as that obtained for Salpausselkäs. The results also show that the water-level difference between the Baltic Ice Lake B I-level and the B III-level was 7.5 metres (Fig. 7).
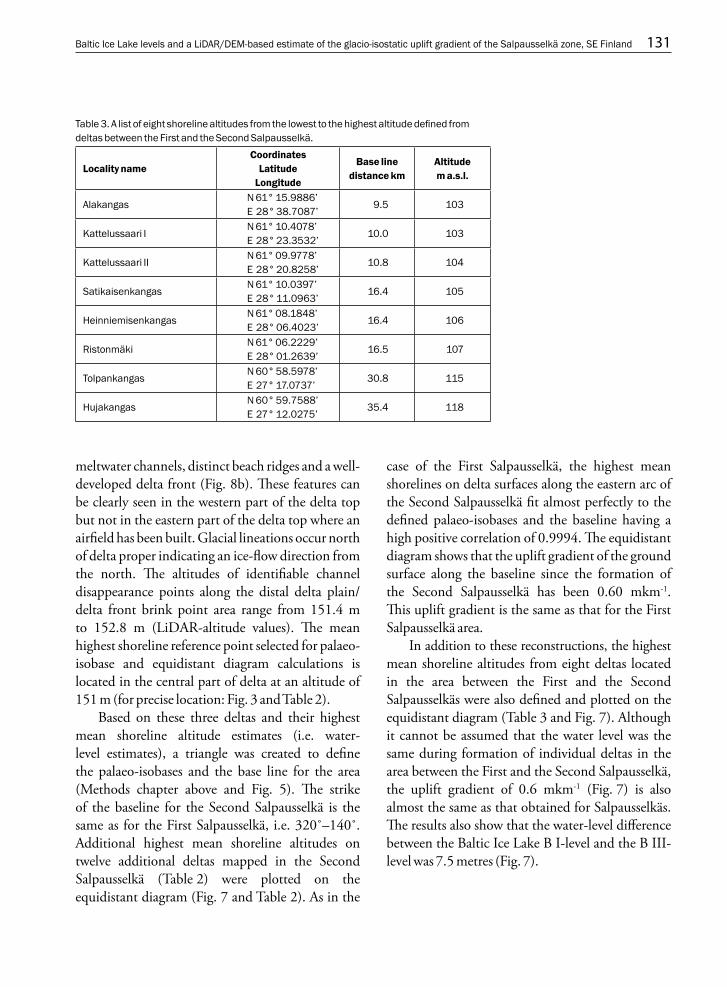
Table 3. A list of eight shoreline altitudes from the lowest to the highest altitude defined from deltas between the First and the Second Salpausselkä.
Locality nameCoordinates
LatitudeLongitude
Base line distance km
Altitudem a.s.l.
AlakangasN 61° 15.9886’E 28° 38.7087’
9.5 103
Kattelussaari IN 61° 10.4078’E 28° 23.3532’
10.0 103
Kattelussaari IIN 61° 09.9778’E 28° 20.8258’
10.8 104
SatikaisenkangasN 61° 10.0397’E 28° 11.0963’
16.4 105
HeinniemisenkangasN 61° 08.1848’E 28° 06.4023’
16.4 106
RistonmäkiN 61° 06.2229’E 28° 01.2639’
16.5 107
TolpankangasN 60° 58.5978’E 27° 17.0737’
30.8 115
HujakangasN 60° 59.7588’E 27° 12.0275’
35.4 118

132 J. P. Lunkka, T. Nikarmaa and N. Putkinen
Figure 8. LiDAR-images of two deltas in the Second Salpausselkä and their highest mean shoreline altitudes defined according to criteria presented in text, a) Tuomalankangas delta b) Vesivehmaankangas delta. See Figure 3 for the Anttilankangas delta, the third delta used for the equidistant diagram reconstruction for the Second Salpausselkä.

Baltic Ice Lake levels and a LiDAR/DEM-based estimate of the glacio-isostatic uplift gradient of the Salpausselkä zone, SE Finland 133
4. Discussion It is generally assumed that the First and the Second Salpausselkä ridge complexes were formed at the margin of the Scandinavian Ice Sheet during the Younger Dryas Stadial (cf. Rainio et al., 1995; Donner 2010; Johansson et al. 2011). The western arc of the First and the Second Salpausselkä was deposited at the margin of the BSIL, while its eastern arc was deposited at the margin of the FLDIL (cf. Punkari 1980; Fig. 1). Both of these ice lobes terminated in the Baltic Ice Lake (cf. Lunkka et al., 2004; Johansson et al., 2011). The water depth at the ice margin and subglacial hydrological conditions affected the depositional style of glaciofluvial sediments on the proximal and distal sides of an ice grounding line (cf. Fyfe, 1990). It has been assumed that the deposition of the western and eastern arcs of the Salpausselkä ridges was asynchronous (cf. Saarnisto, 1982), but the time lapse between the formation of the eastern and western arcs is still not precisely known.
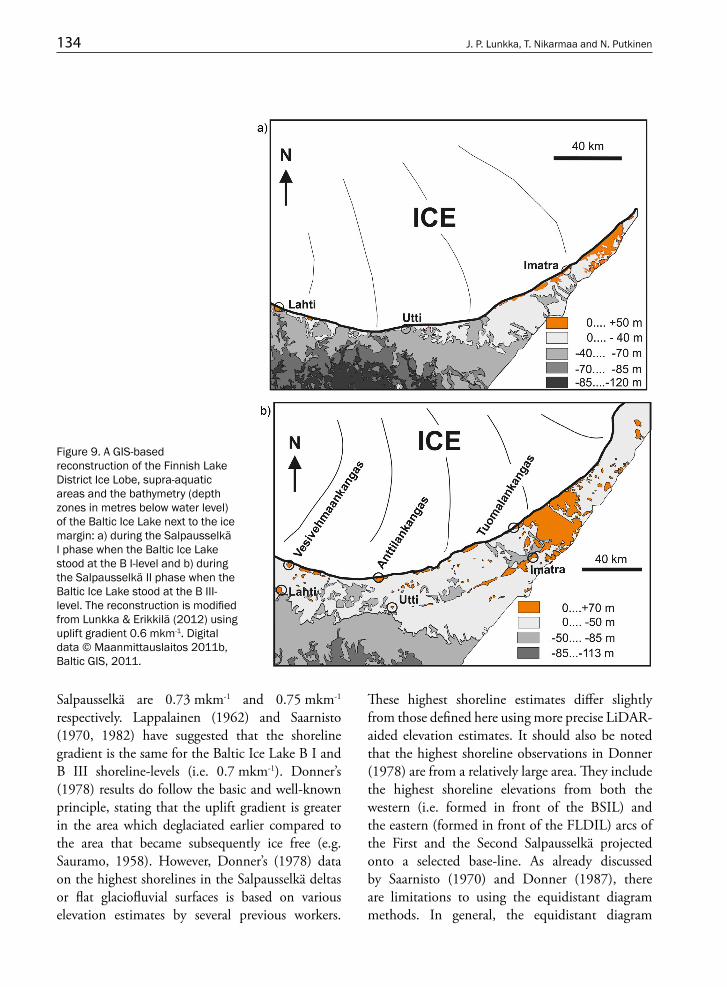
At the time when the highest shoreline features of the First Salpausselkä were formed, the water depth in front of the FLDIL was less than 70 metres (Lunkka & Erikkilä, 2012; Fig. 9a). The water level stood at the so-called BI-level (cf. Donner, 1995) and the mean shoreline features were formed at 100 m a.s.l. at Vuoksenniska, 120 m a.s.l. at Utti and at 151 m a.s.l. at Lahti. There are also the highest mean shoreline marks at six other sites that were formed when the water level of the Baltic Ice Lake was at the BI-level (Table 1). Similarly, at the time when the highest shoreline features in the Second Salpausselkä were formed, the water depth in front of the FLDIL was less than 50 metres (Lunkka & Erikkilä, 2012; Fig. 9b) and the water level stood at the so-called BIII-level (Table 2) along the Second Salpausselkä (cf. Saarnisto, 1982).
Previous estimates of the highest shoreline altitudes vary in the literature (Tables 1 and 2). This variation results from a number of factors including, for example misinterpretation of delta and shore morphology, and the accuracy of levelling and positioning. It has also been common to give
only one altitude value for the highest shoreline of a glaciofluvial ice-contact delta although the delta itself may be several kilometres wide. This has led to an assumption that a highest shoreline altitude value is the same throughout the delta distal plain, although it can vary a few metres depending on the shorelines orientation to the uplift gradient. Therefore, the main reason for different highest shoreline altitude values of the extensive Salpausselkä deltas presented in literature and the databases seem to be the location from where the altitude recording was made.
Based on the highest mean shoreline observa-tions and determination of palaeo-isobases for the eastern arc of the First and the Second Salpausselkä area, the calculated base-line direction is NW-SE (i.e. 320°–140°). Previous workers (e.g. Donner, 1978; Saarnisto, 1982) have determined the base-line direction perpendicular to a modern land uplift isobases, obtained using precise levelling (Kääriäinen, 1966). The base-line direction of Donner (1978), using the modern land uplift isobases, is 324°–144° and that of Saarnisto (1982) 327°–147°. These base-line directions correspond closely to the direction of the present glacio-isostatic uplift in southeastern Finland (Poutanen & Ivins, 2010). However, it differs slightly from that defined here which is based on the palaeo-isobase determination for the study area.
The uplift gradients calculated are 0.560 mkm-1 and 0.565 mkm-1 for the First and the Second Salpausselkä areas respectively. The calculated three digit values are both rounded to 0.6 mkm-1, which, therefore, adds to error of the calculated values ca. 4 cmkm-1 along the base-line defined. Previously, Donner (1978) and Saarnisto (1982), for example, have obtained slightly different uplift gradients. The recalculated uplift gradients along the base-line across the First and the Second Salpausselkä, based on the highest shoreline observations of Salpausselkä area used in Donner (1978) are 0.69 mkm-1 for the B I-shoreline on the First Salpausselkä and 0.51 mkm-1 for the B III-shoreline on the Second Salpausselkä. The recalculated uplift gradients of Saarnisto (1982) for the First and Second
134 J. P. Lunkka, T. Nikarmaa and N. Putkinen
Figure 9. A GIS-based reconstruction of the Finnish Lake District Ice Lobe, supra-aquatic areas and the bathymetry (depth zones in metres below water level) of the Baltic Ice Lake next to the ice margin: a) during the Salpausselkä I phase when the Baltic Ice Lake stood at the B I-level and b) during the Salpausselkä II phase when the Baltic Ice Lake stood at the B III-level. The reconstruction is modified from Lunkka & Erikkilä (2012) using uplift gradient 0.6 mkm-1. Digital data © Maanmittauslaitos 2011b, Baltic GIS, 2011.
Salpausselkä are 0.73 mkm-1 and 0.75 mkm-1 respectively. Lappalainen (1962) and Saarnisto (1970, 1982) have suggested that the shoreline gradient is the same for the Baltic Ice Lake B I and B III shoreline-levels (i.e. 0.7 mkm-1). Donner’s (1978) results do follow the basic and well-known principle, stating that the uplift gradient is greater in the area which deglaciated earlier compared to the area that became subsequently ice free (e.g. Sauramo, 1958). However, Donner’s (1978) data on the highest shorelines in the Salpausselkä deltas or flat glaciofluvial surfaces is based on various elevation estimates by several previous workers.
These highest shoreline estimates differ slightly from those defined here using more precise LiDAR-aided elevation estimates. It should also be noted that the highest shoreline observations in Donner (1978) are from a relatively large area. They include the highest shoreline elevations from both the western (i.e. formed in front of the BSIL) and the eastern (formed in front of the FLDIL) arcs of the First and the Second Salpausselkä projected onto a selected base-line. As already discussed by Saarnisto (1970) and Donner (1987), there are limitations to using the equidistant diagram methods. In general, the equidistant diagram

Baltic Ice Lake levels and a LiDAR/DEM-based estimate of the glacio-isostatic uplift gradient of the Salpausselkä zone, SE Finland 135
method should only be used in a restricted area. However, an estimation of a size of an area in which the equidistant diagram method is applicable has not been defined. It seems that Donner´s (1978) equidistant diagram projections include shoreline altitude data that are partially inaccurate and a number of shoreline projections accepted are located too far from the base-line and therefore differ from the uplift gradients presented here.
In the present work, projections of the highest mean shorelines identified using LiDAR DEM are performed in a restricted area. The study area (i.e. the FLDIL) of Saarnisto (1982) is virtually the same as in the present work and the uplift gradient results presented by Saarnisto (1982) show almost equal uplift gradients for both the First and the Second Salpausselkä areas as those obtained here. There is a slight difference, however, in the direction of the base-line and the values of the uplift gradient. Saarnisto’s (1982) baseline direction differs by 7° from that obtained here where the baseline calculations are defined from calculated palaeo-isobases and not from the present isobases, as in Saarnisto (1982). The uplift gradient of c. 0.56–0.57 mkm-1 (c. 0.6 mkm-1) calculated here is less than 0.73 to 0.75 mkm-1 reported by Saarnisto (1982). The reason for this is that the LiDAR DEMs enable a better characterisation of features that define the highest mean shoreline and therefore more accurate, albeit not exact, estimation of the highest B I and B III shoreline altitudes on the Salpausselkä deltas.
The calculated uplift gradient results of 0.6 mkm-1 are virtually the same across the Salpaus-selkä area of the former FLDIL. Since older shorelines normally have a higher uplift gradient than younger shorelines (cf. Fjeldskaar, 1997; Donner, 1995), it implies that both Salpausselkä ridges in front of the LDIL were deposited within a short time interval during the latter part of the Younger Dryas Stadial, perhaps within a few hundred years or less. The deglaciation dynamics of the FLDIL were different in comparison to the BSIL (cf. Lunkka et al. 2018). It is, therefore, highly probable that the ages of the western and eastern arcs of the Salpausselkäs differ significantly from each other.
5. ConclusionsBased on this research the following conclusions can be drawn:
1) LiDAR DEMs enable a more precise geo-morphological interpretation of glaciofluvi-al ice-contact delta environments and also a more precise estimation of the highest Baltic Ice Lake B I and B III mean shoreline altitudes of the Younger Dryas-age Salpaus-selkä zone than hitherto.
2) Reconstructed palaeo-isobases for the eastern arc of the First and the Second Salpausselkä complexes presented in this work are aligned SW-NE (240°–050°), whilst the baseline NW-SE (320°–140°) perpendicular to it differs only slightly from the present isobases.
3) Based on the criteria of the highest mean shoreline altitude defined herein, the calculated uplift gradient for the Salpausselkä zone is c. 0.6 mkm-1 for both the Baltic Ice Lake B I and B III shoreline levels.
4) The shoreline gradient is the same for both the Baltic Ice lake B I and B III levels demonstrating a 7.5 metre regression of the water level as ice receded from the First Salpausselkä to the Second Salpausselkä.
5) The FLDIL terminated in relatively shallow, 50–70 m deep, Baltic Ice Lake during the Younger Dryas Stadial.
Acknowledgements
The authors would like to thank Prof. M. Saarnisto for fruitful discussions on the topic and Dr J.-P. Palmu and an anonymous reviewer for their helpful and constructive feedback and comments on the earlier version of the manuscript. Dr P. L. Gibbard is thanked for checking the English.

136 J. P. Lunkka, T. Nikarmaa and N. Putkinen
ReferencesÅberg, A., 2013. Itämeren ylin ranta Suomessa. Unpublished
M.Sc.-thesis. University of Helsinki 2013. 84 pp.Boulton, G.S., Dongelmans, P., Punkari, M. & Broadgate, M.,
2001. Palaeoglaciology of an ice sheet through a glacial cycle: the European ice sheet through the Weichselian. Quaternary Science Reviews 20, 591–625.
https://doi.org/10.1016/S0277-3791(00)00160-8Cuzzone, J. K., Clark, P. U., Carlson, A. E., Ullman, D.
J., Rinterknecht, V. R., Milne, G. A., Lunkka, J.-P., Wohlfarth, B., Marcott, S. A. & Caffee, M., 2016. Final deglaciation of the Scandinavian Ice sheet and implications for the Holocene global sea-level budget. Earth and Planetary Science Letters 448, 34–41.
https://doi.org/10.1016/j.epsl.2016.05.019Donner, J., 1969. Land/sea level changes in southern Finland
during the formation of the Salpausselkä end moraines. Bulletin of the Geological Society of Finland 41, 135–150. https://doi.org/10.17741/bgsf/41.015
Donner, J., 1977. Suomen kvartäärigeologia. Moniste N:o 1. Helsingin yliopisto, Geologian laitos, Geologian ja paleontologian osasto, Helsinki. 264 pp.
Donner, J. 1978. The dating of the levels of the Baltic Ice Lake and the Salpausselkä moraines in South Finland. Societas Scientarum Fennica, Commentationes Physico-Mathematicae 48:11–38.
Donner, J., 1987. Some aspects of the nature of the late Weichselian and Holocene land uplift in Finland. In: Perttunen, M. (ed.). Fennoscandian land uplift: Proceedings of a symposium at Tvärminne, April 10–11, 1986 arranged by the Finnish national Committee for Quarternary Research. Geological Survey of Finland. Special paper 2, 9–12.
Donner, J., 1995. The Quaternary history of Scandinavia. Cambridge University Press. 200 pp.
Donner J., 2010. The Younger Dryas age of the Salpausselkä moraines in Finland. Bulletin of the Geological Society of Finland 82, 69–80.
https://doi.org/10.17741/bgsf/82.2.001Fjeldskaar, W., 1997. Flexural rigidity of Fennoscandia inferred
from the postglacial uplift. Tectonics 16, 596–608.Fyfe, G.J., 1990. The effect of water depth on ice-proximal
glaciolacustrine sedimentation: Salpausselkä I, southern Finland. Boreas 19: 2, 147–164.
https://doi.org/10.1111/j.1502-3885.1990.tb00576.xHellaakoski, A., 1934. Die Eisstauseen des Saimaa-Gebietes.
Fennia 59, 1–102Johansson, P., Lunkka, J. P. & Sarala, P., 2011. The Glaciation
of Finland. In Ehlers J., Gibbard, P. L. & Hughes, P. D. (Eds), Developments in Quaternary Science vol. 15, p. 105–116. Elsevier, Amsterdam, The Netherlands.
Kääriäinen, E., 1966. The Second Levelling of Finland in 1935–1955. Publications of the Finnish Geodetic Institute 61, 313 pp.
Lappalainen, V., 1962. The shore-line displacement on southern lake Saimaa. Acta Botanica Fennica 64, 1–125. http://hdl.handle.net/10138/36639
Leiviskä, I., 1920. Der Salpausselkä. Fennia 41, 388 pp.Lundqvist, J. & Saarnisto, M., 1995. Summary of project
IGPC-253. Quaternary International 28, 9–18.Lunkka, J.P. & Erikkilä, A., 2012. Behaviour of the Lake
District Ice Lobe of the Scandinavian Ice Sheet During the Younger Dryas Chronozone (ca. 12 800–11 500 years ago). Posiva Working Report 2012–2017. 54 p.
Lunkka, J. P., Johansson, P., Saarnisto, M. & Sallasmaa, O. 2004. Glaciation of Finland. In Ehlers J. & Gibbard, P. L. (Eds), Quaternary Glaciations – Extent and Chronology, Part I: Europe, p. 93–100. Elsevier, Amsterdam – Tokyo.
Lunkka, J. P., Putkinen, N. & Seppänen, A. 2018. Deglaciation patterns of the Lake District Ice Lobe of the Scandinavian Ice Sheet in SE Finland during the Younger Dryas. 33rd Nordic Geological Winter Meeting 2018, January 10–12. Abstracts, p. 159.
Muscheler, R., Kromer, B., Bjorck, S., Svensson, A., Friedrich, M., Kaiser, K. F. & Southon, J., 2008. Tree rings and ice cores reveal (super 14) C calibration uncertainties during the Younger Dryas. Nature Geoscience 1, 263–267. https://doi.org/10.1038/ngeo128
Nikarmaa, T., Lunkka, J. P. & Putkinen, N., 2017. Factors affecting the dynamics of the North Karelian/Oulu Ice Lobe, Central Finland, during the last deglaciation – a LiDAR and DEM interpretation of subglacial lineation patterns. Bulletin of the Geological Society of Finland 89, 100–120. https://doi.org/10.17741/bgsf/89.2.003
Ojala, A.E.K, Palmu, J.P., Åberg, A., Åberg, S. & Virkki, A., 2013. Development of an ancient shoreline database to reconstruct the Litorina Sea maximum extension and the highest shoreline of the Baltic Sea basin in Finland. Bulletin of the Geological Society of Finland 85, 127–144. https://doi.org/10.17741/bgsf/85.2.002
Pirazzoli, P. A. & Pluet, J., 1991. World atlas of Holocene sea-level change. Elsevier Oceanography Series 58, 299 pp.
Poutanen, M. & Ivins, E. R., 2010. Upper mantle dynamics and quaternary climate in cratonic areas (DynaQlim)—Understanding the glacial isostatic adjustment. Journal of Geodynamics 50, 2–7.
https://doi.org/10.1016/j.jog.2010.01.014Punkari, M., 1980. The ice lobes of the Scandinavian ice sheet
during the deglaciation in Finland. Boreas 9, 307–310. https://doi.org/10.1111/j.1502-3885.1980.tb00710.x
Putkinen, N., 2011. Late Weichselian deglaciation chronology and palaeoenvironments in northern Karelia, NW Russia. Academic Dissertation, Ph.D.-thesis. Department of Geology, Faculty of Science, University of Oulu 2011. Geological Survey of Finland, Espoo. 21 pp.
Putkinen, N., Lunkka, J. P., Ojala, A.E.K. & Kosonen, E., 2011. Deglaciation history and age estimate of the

Baltic Ice Lake levels and a LiDAR/DEM-based estimate of the glacio-isostatic uplift gradient of the Salpausselkä zone, SE Finland 137
Younger Dryas end moraines in the Kalevala region, NE Russia. Quaternary Science Reviews 30, 3812–3822. https://doi.org/10.1016/j.quascirev.2011.09.023
Putkinen N., Eyles N., Putkinen S., Ojala A.E.K., Palmu J.-P., Sarala P., Väänänen T., Räisänen J., Saarelainen J., Ahtonen N., Rönty H., Kiiskinen A., Rauhaniemi T. and Tervo T., 2017. High-resolution LiDAR mapping of glacial landforms and ice stream lobes in Finland. Bulletin of the Geological Society of Finland 89, 64–81.
https://doi.org/10.17741/bgsf/89.2.001Rainio, H., Saarnisto, M. & Ekman, I., 1995. Younger Dryas
end moraines in Finland and NW Russia. Quaternary International 28, 179–192.
https://doi.org/10.1016/1040-6182(95)00051-JRamsay, W., 1931. Material zur Kenntnis der Spätglazialen
Niveauverschiebungen in Finnland. Fennia 54, 1–145.Rinterknecht, V. R., Clark, P. U., Raisbeck, G. M., Yiou,
F., Brook, E. J., Tschudi, S. & Lunkka, J. P., 2004. Cosmogenic 10Be dating of the Salpausselkä I Moraine in southwestern Finland. Quaternary Science Reviews 23, 2283–2289.
https://doi.org/10.1016/j.quascirev.2004.06.012Rinterknecht, V. R., Clark, P. U., Raisbeck, G. M., Yiou, F.,
Bitinas, A., Brook, E. J., Marks, L., Zelcs, V., Lunkka, J. P., Pavlovskaya, I. E., Pietrowski, J. A. & Raukas, A., 2006. The Last Deglaciation of the Scandinavian Ice Sheet in
Central and Eastern Europe. Science 311, 1449–1452. https://doi.org/10.1126/science.1120702
Saarnisto, M., 1970. The Late Weichselian and Flandrian history of the Saimaa Lake. Commentationes Physico-Mathematicae. Societas Scientiarum Fennica 37, 107 pp.
Saarnisto, M., 1982. Ice retreat and the Baltic Ice Lake in the Salpausselkä zone between Lake Päijänne and Lake Saimaa. Annales Academiae Scientiarum Fennicae, Series A. III, Geologica – Geographica 134, 61–79.
Saarnisto, M. & Saarinen, T., 2001. Deglaciation chronology of the Scandinavian ice sheet from the Lake Onega basin to the Salpausselkä end moraines. Global and Planetary Change 31, 387–405.
https://doi.org/10.1016/S0921-8181(01)00131-XSauramo, M., 1958. Die Geschichte der Ostsee. Annales
Academiae Scientiarum Fennicae A III, 51, 522 pp.Swärd, H., O’Regan, M., Björck, S., Greenwood, S. L.,
Kylander, M. E., Mörth, C.-M., Pearche, C. & Jakobsson, M. 2018. A chronology of environmental changes in the Lake Vättern basin from deglaciation to its final isolation. Boreas 47, 609–624. https://doi.org/10.1111/bor.12288
Tschudi, S., Ivy-Ochs, S., Schlücter, C., Kubik, P. W. & Rainio, H., 2000. 10Be dating of Younger Dryas Salpausselkä I Formation in Finland. Boreas 29, 287–293.
https://doi.org/10.1111/j.1502-3885.2000.tb01211.x