ballistic waves in high-speed water entrylongoria/research/papers/lee1997.pdf · agreement with the...
TRANSCRIPT

Journal of Fluids and Structures (1997) 11, 819-844
BALLISTIC WAVES IN HIGH-SPEED WATER ENTRY
M. LEE*, R. G. LONGORIA? AND D. E. WILSON~
*Department of Mechanical Engineering, Naval Postgraduate School Monterey, CA, 93943, U. S.A.
?Department of Mechanical Engineering, The University of Texas at Austin Austin, TX, 78712, U.S.A.
(Received 5 November 1996 and in revised form 25 March 1997)
The generation and propagation of pressure waves (ballistic waves) by a body impacting and penetrating into water at high speed are investigated both analytically and numerically. An analytical model is, in principle, applicable for predicting ballistic waves by any projectiles of practical interest. The theory is general enough to handle oblique and/or multiple penetrations, and is valid for impacts at subsonic and supersonic velocities with respect to water. The ballistic waves radiated by a projectile are expressed as a convolution between the vertical component, which represents the response of a moving point source, and the horizontal component. which represents the response of the cross-section of the source. Diffraction effects resulting from the finite size are accounted for by including the horizontal pressure component. A time inversion phenomenon which can occur during supersonic penetration is also considered. The approach provides valuable insight into the pressure field generated by the penetration mechanisms. Numerical results are obtained by using a nonlinear wave-code, and these are in good agreement with the analytical predictions. 0 1997 Academic Press Limited.
1. I N T R O D U C T I O N
WHENSINGLE OR MULTIPLE PROJECTILES penetrate into water a t high-speed, a pressure wave is generated through the kinetic energy transfer and propagates underwater. Research on the water entry phenomena, published in the open literature, has been motivated primarily by an interest in the forces during water impact (Korobkin & Pukhnachov 1988; Zhao & Faltinsen 1993) and the shape of the cavity formed behind the body (Lee et al. 1977). Only a few experimental studies have investigated the generation and propagation of the ballistic waves into the fluid (McMillen 1945; McMillen & Harvey 1946; McMillen et al. 1950; Leslie 1964; Hoover & Dawson 1966).
Early experiments of McMillen & Harvey (1946) using a spark shadow-graph of the shock waves for high-speed entry of spheres into water showed that the sphere is quickly decelerated by drag, while the impact shock wave propagates from the impact point a t the sound speed of water, thus being detached from the sphere. They also found that mechanical resonant oscillation of the sphere caused significant radiation of high-frequency waves into the water. In 1964 Leslie measured the underwater sound produced by firing bullets into water a t the relatively low velocity of 230 m/s. Leslie was interested in the measurements of ballistic waves radiated by a bullet as well as the collapse waves created by the bubble oscillations in the late stage of the penetration. I t is of interest to note that the shock and secondary collapse waves are similar t o what is seen in underwater explosions. His tests showed that most of the sound energy from the low speed bullet entry is produced primarily
0889-9746/97/070879 + 26 %25.00/fl970103 0 1997 Academic Press Limited

820 M. LEE ET AL
by the oscillatory collapse of the bubbles formed by the bullet wake cavity. However, this is true only for relatively low entry velocity (Lee 1995).
Theoretical studies for calculating ballistic waves began in the late sixties with the work of Bristow & Lundeberg (1969) and Yurkovich (1969). Yurkovich used potential theory to describe the fluid motion, by placing a moving point source along the projectile trajectory in the fluid. Lundstrom (1971) presented a method based on Yurkovich's theory for modelling the pressure field generated by a subsonic tumbling projectile in a fuel tank. Lundstrom was interested in the "ram" pressure created in the fluid during penetration of a fuel tank, since it can cause catastrophic failure of the tank structure (Ball 1976). Lundstrom adopted an energy balance equation which relates the loss of the kinetic energy of a projectile to kinetic and potential energy stored in the medium. The energy balance equation was originally developed by Birkhoff & Zarantonello (1957). This theory was substantiated by a large body of experimental data. Stepka & Morse (1963, 1966) investigated experimentally the response of liquid-filled tanks impacted by subsonic and supersonic particles. Lundstrom's analysis, however, was restricted to subsonic impacts, although in 1988 he proposed an extension of the method for supersonic impacts with respect to the fluid, without providing results.
Until now no comprehensive analytical or numerical studies have been reported on the ballistic radiation of pressure waves by a projectile undergoing high-speed water penetra- tion, particularly at supersonic velocities. For the far-field solution, a computational approach that solves nonlinear fluid flow is not reliable, because of the large three- dimensional fluid medium surrounding the structure. Hence a goal of this paper is to develop a model for predicting the formation, interaction and propagation of the ballistic waves generated by single or multiple projectiles penetrating into water at a normal or oblique angle. The model is valid for impact at subsonic and supersonic velocities with respect to water. To investigate the ballistic waves, we restrict our attention to the specific characterization of the pressure signatures at selected locations in the fluid. Comparisons of numerical simulations using a finite difference code, which solves the full nonlinear Euler equations, with the analytical results of the acoustic radiation from a moving source are provided. Another application of this theory is ballistic impact on fuel cells and micro- meteorite impact on rocket propellant tanks. For micro-meteorite impact on propellant tanks the supersonic entry problem is a critical one.
2. THEORY
2.1. PROJECTILE DYNAMICS
Consider a projectile impulsively accelerated at t = 0 to an impact velocity of V l , penetrat- ing into a compressible fluid with a straight trajectory in the + z direction. To predict the ballistic waves, a knowledge of the dynamics of the projectile which is governed by kinetic energy loss during the penetration is required. The deceleration from the impact velocity can be described by Newton's second law,
where m, is the projectile mass, z is the penetration axis, p , is the fluid density, A, is the projected area of the projectile, and Cd is the velocity-dependent drag coefficient. Equation (1) is valid for a rigid projectile, which generally limits the impact velocity to less than
BALLISTIC WAVES IN HIGH-SPEED WATER ENTRY 821
2 km/s. Using the velocity decay constant, b = p,,CdA,/2m,, the rate of change of kinetic energy with respect to depth, dE,/dZb, is related to the penetration velocity by
where E, = +m,v; and Zb is the penetration distance. Most low velocity impact studies use a constant drag coefficient. For higher velocities the drag coefficient becomes a strong function of Mach number, M, especially in the transonic regime. In order to describe the variation of drag coefficient with Mach number, we must select a projectile geometry. For the purpose of this study a spherical geometry is chosen. The correlation of the drag coefficient for spheres measured by Charters & Thomas (1945) shows that there are three ranges of velocity, roughly "subsonic" up to M = 0.5, "transonic" from 0.5 to 1.4, and "supersonic" beyond M = 1.4.
By integrating equation (1) numerically with a variable drag coefficient, the velocity decay and kinetic energy loss of a projectile in the fluid can be evaluated along the penetration depth. With the results, an analytical formation for ballistic waves radiated by a body will be provided in the next section. As would be expected, an accurate estimation of the kinetic energy loss of a projectile is always important in determining the ballistic waves.
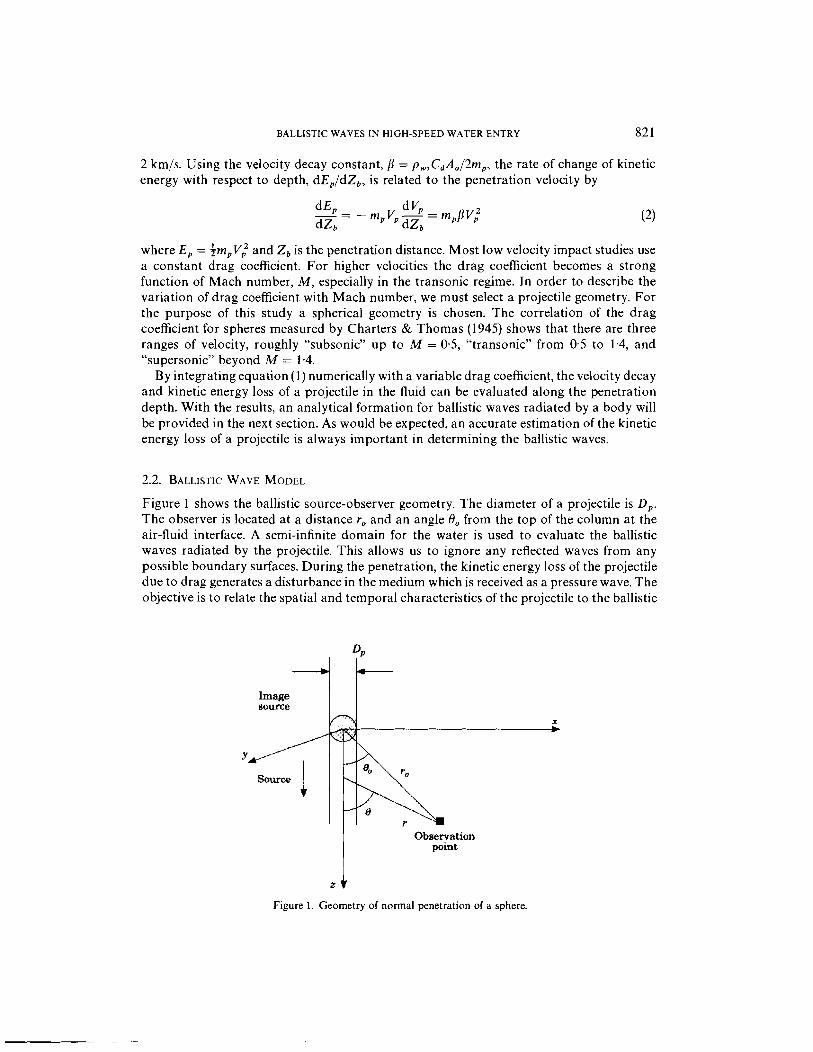
Figure 1 shows the ballistic source-observer geometry. The diameter of a projectile is D,. The observer is located at a distance r, and an angle 8, from the top of the column at the air-fluid interface. A semi-infinite domain for the water is used to evaluate the ballistic waves radiated by the projectile. This allows us to ignore any reflected waves from any possible boundary surfaces. During the penetration, the kinetic energy loss of the projectile due to drag generates a disturbance in the medium which is received as a pressure wave. The objective is to relate the spatial and temporal characteristics of the projectile to the ballistic
Observation point
2 i Figure 1. Geometry of normal penetration of a sphere.

822 M. LEE ET AL
waves observed at any location in the medium. The pressure field radiated by a ballistic source (BS) is assumed to be a convolution of the response of its horizontal component (in the x-y plane, as shown in Figure 1) and that of its vertical response (in the x-z plane), which enables us to consider a moving finite volume source. Such a method was developed by Berthelot & Busch-Vishniac (1987), who studied the generation of underwater sound by a moving high-power laser source. Berthelot & Busch-Vishniac proposed that the laser source can be described by the convolution of the response of the vertical component and horizontal component accounting for the narrow long laser beam with finite laser beam diameter.
In this study, the vertical component represents the response of a moving point source (D, + 0) with a pressure release boundary, such as an air-water interface. On the other hand, the horizontal component represents the response of the cross-section of the source. If P,(t) and PH(t) denote the vertical and horizontal responses of a source of arbitrary velocity, respectively, then we have,
where P(t) is the acoustic pressure generated by the penetration mechanisms. The separabil- ity of the horizontal component from the vertical component is only an approximation, which is reasonable provided that the observer is located several diameters away from the source (Berthelot & Busch-Vishniac 1987). In order to predict the pressure waveform radiated by a BS, it is now necessary to evaluate Pv(t) and PH(t) individually.
2.2.1. Vertical component
The vertical component is obtained by using the analysis of a moving point source. This is a reasonable approximation when the projectile size is so small that disturbances coming from an entire cross-section are received simultaneously by the observer. However, the theory becomes complicated when we attempt to analyse the pressure waveform radiated by a supersonic BS since the Doppler factor can take a negative value, which is referred to as time inversion. This effect occurs when a BS moves toward the observer faster than the disturbances it generates. The time inversion phenomenon, which is observer-location- dependent, again disappears at an arbitrary depth since the projectile velocity decreases continuously.
An inviscid and non-conducting model is assumed for the flow field. The problem is linearized by the small disturbance approximation. The fluid can then be described in terms of a potential function, cp, which satisfies the wave equation (Yurkovich 1969),
where c is the speed of sound in the fluid. The fluid velocity is given by: u = Vcp. The pressure generated by a BS is then obtained using Bernoulli's equation, given by
acp Pv(t) = P o - P., - t p , u 2
where Po is ambient pressure and U is the speed at the fluid. At larger distances the dynamic pressure term in equation (5) is negligible, and the pressure field in the fluid is often

BALLISTIC WAVES IN HIGH-SPEED WATER ENTRY 823
calculated using only the unsteady potential term. At first glance, using the compressible wave equation and the incompressible Bernoulli equation may seem inconsistent. Firstly, the wave equation is valid everywhere expect for a very small region (typically less than one sphere diamteter) where the disturbances propagate at a finite velocity and are described by the linearized wave equation. The density changes are also small outside this region, and hence the incompressible form of the Bernoulli equation is reasonable. The approach of using the wave equation and the incompressible Bernoulli equation is thus valid and is consistent with other investigations (Cook 1993).
The problem is further simplified by approximating the effect of a projectile and subsequent cavity by the action of distributed point sources along a trajectory with suitable time delay, corresponding to the motion of the projectile. Figure 2 shows the geometry for ballistic wave generation in the fluid by a moving source. For an arbitrary velocity source the potential, which is the total radiation summed over a line source distribution along the z-axis, can now be partitioned into two similar integrals (Lundstrom 1988),
where r is the distance between the source and observer location, Z,(.r) is the distance for the period of time inversion, 5 is a penetration index, and ( is the source strength at 5. The source strength and integration limits should be calculated at the retarded time, t - rlc, since the potential function satisfies the wave equation. The second integral allows the prediction of the pressure waveform radiated by a supersonic BS. Although equation (6) is not restricted to far-field radiation, it is assumed that the projectile diameter is very small compared to the wavelength of pressure waves. This assumption will be relaxed later in this paper. Since the free surface is a pressure-release boundary, a line sink is placed above the fluid and 180" out of phase with the source in the fluid. This line sink is referred to as an image line source. This image contributes to the ballistic waves received after time r , /c .
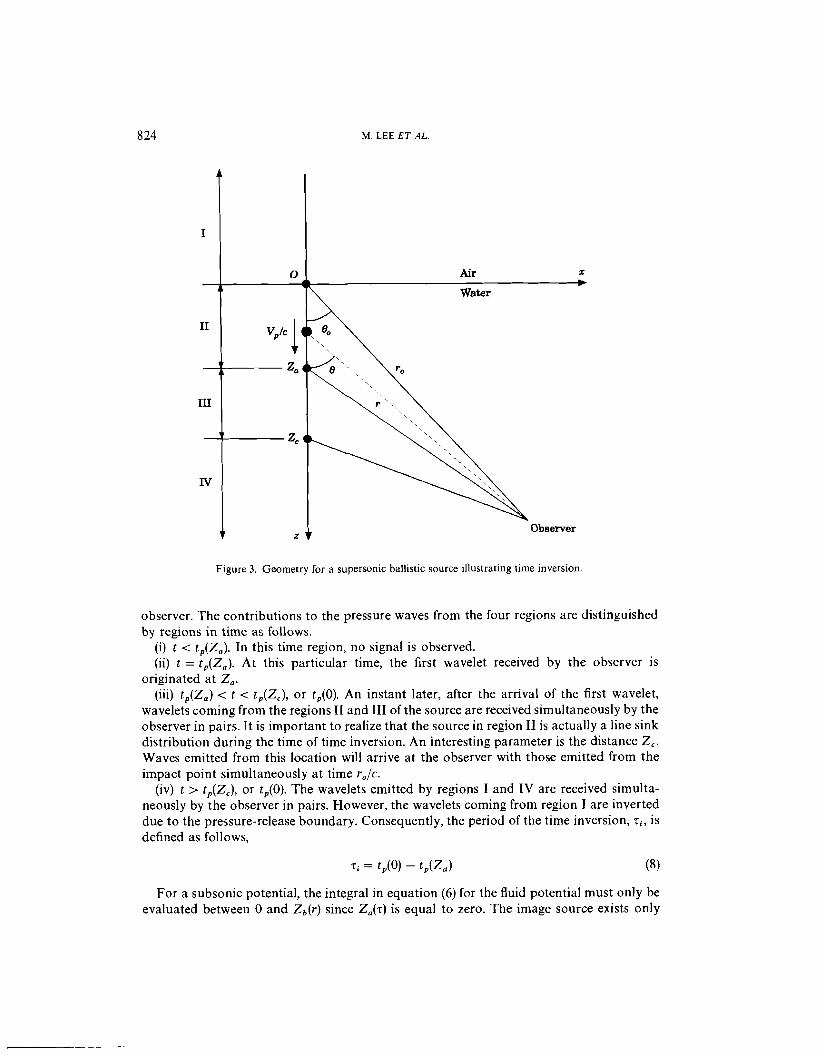
For the period between the time of impact up to when the projectile reaches Z.(.r), a time inversion exists. In this case the source can be divided into the four regions shown in Figure 3. If we denote t,(z) as the time of arrival to the observer of a wavelet emitted when the source is at a distance z from the impact point, then t,(z) can be expressed as follows:
In this expression the first term on the right hand side, t,(z) represents the projectile time of arrival at point z, and the second term represents the travelling time of a wavelet to the
Line source
Figure 2. Geometry for ballistic wave generation.
M. LEE ET AL.
Figure 3. Geometry for a supersonic ballistic source illustrating time inversion.
observer. The contributions to the pressure waves from the four regions are distinguished by regions in time as follows.
(i) t < t,(Zo). In this time region, no signal is observed. (ii) t = t,(Z,). At this particular time, the first wavelet received by the observer is
originated at 2,. (iii) t,(Z,) < t < t,(Zc), or t,(O). An instant later, after the arrival of the first wavelet,
wavelets coming from the regions I1 and 111 of the source are received simultaneously by the observer in pairs. It is important to realize that the source in region I1 is actually a line sink distribution during the time of time inversion. An interesting parameter is the distance 2,. Waves emitted from this location will arrive at the observer with those emitted from the impact point simultaneously at time r,/c.
(iv) t > t,(Zc), or t,(O). The wavelets emitted by regions I and IV are received simulta- neously by the observer in pairs. However, the wavelets coming from region I are inverted due to the pressure-release boundary. Consequently, the period of the time inversion, .s i , is defined as follows,
For a subsonic potential, the integral in equation (6) for the fluid potential must only be evaluated between 0 and Zb(r) since Zo(r) is equal to zero. The image source exists only

BALLISTIC WAVES IN HIGH-SPEED WATER ENTRY 825
above the free surface. In this case, the time derivative of the potential becomes (Lundstrom 1971)
aV 1 BA, Vp z + r , -= --- at 2 R, v p Z - zb 1 Z - Zb + Rb
c Rb
where
Here, Rb denotes the distance between the source and observer, Ab is the value of A, estimated at Z,(r), PC is the cavity pressure and N = ln(O/a) is a geometric dimensionless parameter that accounts for the range of influence of the divergence of the flow, as discussed by Birkhoff & Zarantonello (1957), and a is the cavity radius. A value of N = 110.43 is used for the subsonic calculations and N = 110.3 for the supersonic calculations. In these relations the rate of the projectile kinetic energy loss, (dEP/dZb)lS, is determined from a numerical integration of the projectile dynamics using a velocity-dependent drag coeffic- ient. For high-speed water impact, the cavity pressure can be assumed to be equal to the vapour pressure of water (Wolfe & Gutierrez 1988), with no variations in the + z-direction (Abelson 1970). They velocity components in the z- and w-direction were also given by (Lundstrom 1971):
Using equations (9), (10) and (1 1) in equation (5) leads to numerical calculations of the vertical component received at specified. locations as a function of time.
For a supersonic source the integrals of equation (6) are identical to the subsonic one, so that equations (9), (10) and (1 1) are also applicable. However, there is a singularity in these expressions. This is resolved artificially by imposing the limit,
In acoustics, MA = Vp(z - Zb)/cRb) is a convected Mach number which represents the velocity component along a line connecting a source and an observer at (z, w). Thus, there is a distinction (Berthelot & Busch-Vishniac 1987) between a supersonic source and a source which is seen as supersonic by the observer. In the first case, M is greater than one, whereas in the second case, which induces time inversion at the observer, M, is greater than one. The interpretation of the first case is that the moving source does not induce a time inversion on the observer regardless of the source speed if the observer is located in the backward hemisphere, since (1 - Mc) is always positive. Thus the time gap between two wavelets is accentuated because the later wavelet has so much farther to travel. As a final note, the

826 M. LEE ET AL.
singularity discussed above does not arise in the numerical simulations in which the full nonlinear wave equation is solved.
As mentioned previously, the effects of the projectile diameter become significant if the wavelength of the pressure wave is comparable to the projectile diameter. This is always the case when the source is moving at transonic velocities. In this case the approximation of small diffraction effects breaks down. For the purpose of having a model valid for any source velocity, it is necessary to include the projectile size effects in the model. This is the topic of the next section.
2.2.2. Horizontal component
The analysis was simplified by decomposing the acoustic pressure into the vertical and horizontal components. For the horizontal component we assume that the pressure is due solely to the response of the cross-section of the source. Under this condition, we can construct the horizontal pressure by taking advantage of the analysis of Morse (1976) for transient radition from a disk as shown in Figure 4, and are able to take the projectile size effects into account. If the source distribution is assumed to be constant across the cross-section of radius m (Berthelot & Busch-Vishniac 1987), the impulse respose of the disk is,
2J(m sin 8)2 - y2 6[t - (r + y)/c)] dy
when (r - m sin 8)lc < t < (r + m sin 8)lc; otherwise the integral is zero. Similarly, using the same method with a Gaussian source distribution across the cross-section of radius m, (Berthelot & Busch-Vishniac 1987) the impulse response of the disk is
C exp [ ( ~ E I ) ~ ] = A m sin 8 m sin 8) (14)
when (r - m sin 8)lc < t < (r + m sin 8)lc; otherwise the integral is zero. Equations (13) and (14) provide expressions for the horizontal response in analytical form for either a uniform or a Gaussian intensity distribution across the cross-section of the source. In all calcu- lations, a Gaussian intensity distribution was assumed. When a BS is moving at transonic
0 (observer)
Figure 4. Transient radiation from a disk.

B A L L ~ S T ~ C WAVES IN HIGH-SPEED WATER ENTRY 827
velocities in water, the Doppler-shifted wavelength of the acoustic radiation shrinks to a very small value compared to the projectile size, in which case very significant diffraction effects are generated. The effect of the finite diameter of the projectile may be thought of as introducing many infinitesimally thin line sources of the vertical components. Mathemat- ically these effects can be included by convoluting the cross-sectional components with the vertical components. By considering the cross-section impulse response, the diffraction effect which represents the time gap between the arrival of the waves coming from different points of the cross-section can be resolved. Thus the pressure pulse is actually stretched out due to the horizontal cross-section diffraction time. The greater the angle 8, the greater the stretch.
The objective of this section is to outline the procedure employed in constructing the pressure waveform radiated by a BS (ballistic source) moving at subsonic or supersonic velocities. The four basic steps are as follows.
(a) First, the motion of a projectile is decomposed in time into constant time interval At, and the momentum equation is solved to determine the projectile dynamics.
(b) Second, the existence of the time inversion at a specified observer location is esti- mated by calculating numerically the arrival time of each wavelet emitted by each part of a line source.
(c) Third, if there is no time inversion, the pressure Pv(t) received at the observer is obtained by adding the elementary pressure wavelet emitted by each part of the line source with a suitable time delay corresponding to the motion of the source. In this case equation (5) can be used to determine the elementary pressure wavelet. On the other hand, if there is time inversion, Z,(T) should be estimated. The first wavelet received by an observer always originates at Z,(T). PY(t) can be obtained numerically by adding the wavelets emitted from each part of the source. It is important to realize that the elementary wavelet is a function of the position of the source since the distance and the angle between the source and the observer are time-dependent in the case of a moving source.
(d) The final step in the analysis is to construct the continuous pressure waveforms received at the observer by performing a convolution of the vertical and horizontal components.
3. NUMERICAL MODELLING
We solve the compressible, time-dependent, inviscid conservation equations for mass density, momentum, and energy which are in differential form (Anderson 1987)
Lagrangian Eulerian

828 M. LEE ET AL
where e is the specific total energy, aij stress tensor, and J external body forces per unit mass. To complete this system of equations, an equation of state (EOS) and constitutive equation for both projectile and water are required. The EOS for water is assumed to follow the Mie-Gruneisen approximation, and the parameters used in the numerical simulations are given by Weingarten et al. (1992). The projectile is assumed to be rigid, and the water is modelled as a fluid with no strength. Water is sometimes modelled as a linear elastic-plastic material (Janzon et al. 1993) with low yield strength (10 MPa) and low elastic modulus (2000 M Pa).
An important and difficult phenomenon to capture by a finite difference approximation is the shock wave, which produces a discontinuity in the velocity, pressure and density. There are generally two approaches to handle the shocks. The first is using the Rankine-Hugoniot jump conditions. The second employs a discretization procedure of the differential equa- tions in conjunction with the "artificial viscosity" concept devised by von Neumann & Richtmyer (1950) to spread shocks smoothly over several meshes. Although the shock front is smeared over several meshes, a steep shock front can be resolved by using finer zoning.
In order to save computational time and memory, an absorbing (transmitting) boundary condition which allows the pressure wave to continue "through" the physical boundary of the mesh without reflection was used for most simulations. This is useful in modelling infinite and semi-infinite spaces (e.g. the earth and the ocean). The transmitting boundary condition is only active for flow out of a mesh and can be calculated as follows:
P = PI,, + (U, - U,,,)I for U, > 0
P = PI,' for U, < 0
where U,, is normal velocity at the boundary and is positive for outward flow, I is material impedance (pc); U,,, and P,,, are reference velocity and reference pressure, respectively. However this transmitting boundary condition is still not exact, and is the subject of continuing research (Weingarten et al. 1992).
The set of governing equations is solved using wave-codes, AUTODYN, of an explicit and finite-difference algorithm. Wave-codes are computer programs that numerically simu- late highly dynamic events, particularly those that include shocks (Anderson 1987). Gener- ally, an Eulerian mesh was generated for water, and a Lagrangian one was used for the projectile. This mesh generation technique is useful for solid and fluid interaction problems. In this study, two-dimensional axisymmetric calculations were performed for normal impacts and three-dimensional calculations for the oblique and multiple impacts.
4. RESULTS
In this section we present results obtained by using the model previously discussed for predicting the pressure waveform radiated by ballistic sources. The analytical predictions are also compared with numerical simulations. The results are grouped into three catego- ries: (i) normal penetration, (ii) oblique penetration, and (iii) multiple penetrations.
4.1.1. Subsonic
Consider a spherical projectile of 1 cm diameter (used in most of the calculations). The impact velocity is 1.2 km/s (M, = 0.8), where MI is the impact Mach number. By integrating

BALLISTIC WAVES IN HIGH-SPEED WATER ENTRY
Figure 5. Comparison of velocity decay. The results are obtained by conducting a numerical simulation (A) and by integrating a momentum equation, equation 5, with a variable drag oefficient (B): 1 cm sphere, V i = 1.2 km/s.
(- . . -) A; (-ap) B.
equation (1) with a velocity-dependent drag coefficient, we can obtain the velocity decay history of the sphere. As shown in Figure 5, this approach gives excellent agreement with the numerical simulations. Notice that the sphere has lost 50% of its initial kinetic enery when the penetration velocity drops by 25%, which occurs within 55 ps after an impact.
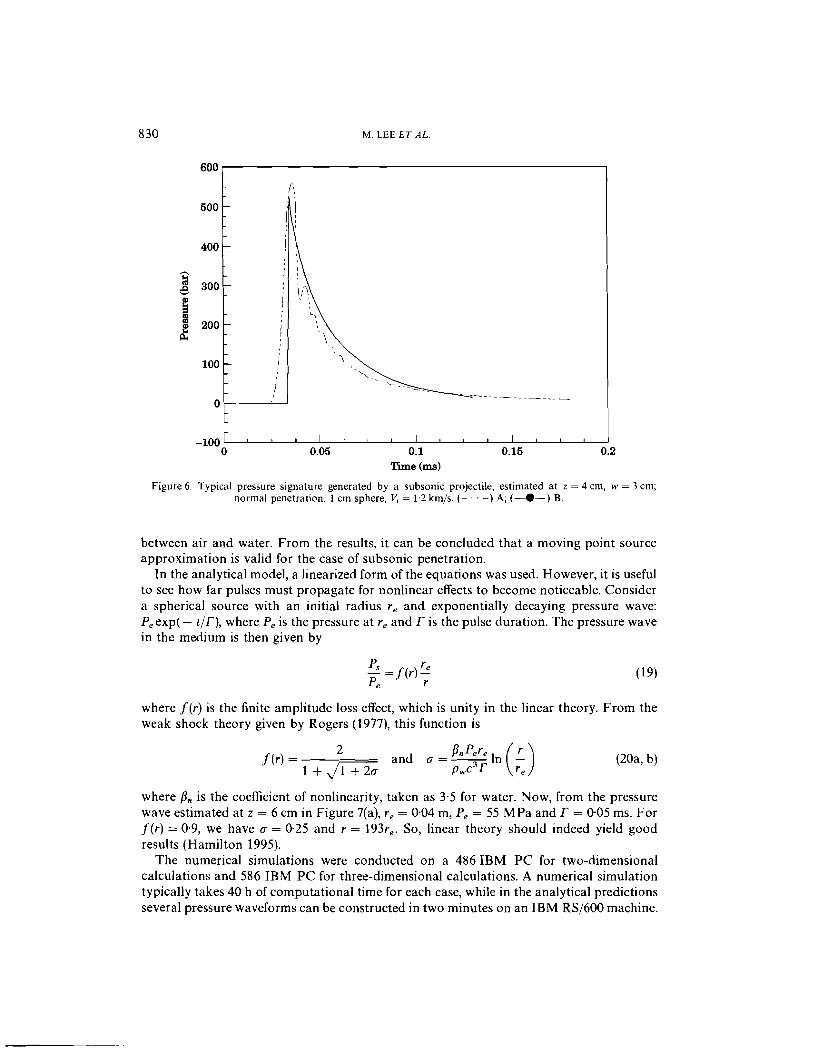
Figure 6 displays a plot of a typical pressure waveform radiated by a subsonic BS. The signature is calculated at z = 4 cm, w = 3 cm with an impact velocity of 1.2 km/s from the numerical simulation and analytical method. The signature shows an initial peak corres- ponding to the impact shock and decays as an exponential function. The analytical and numerical predictions are in excellent agreement for the amplitude of the ballistic pressure, its pulse duration and the wave arrival time. For the case of subsonic penetration, the pressure signature at the observer is always seen to begin at the retarded time, r,/c, since the impact shock propagates with the sound of speed in water as a hemispherical shape from theimpact point. It is of interest to note that several secondary pulses are observed from the numerical simulations. A possible explanation for the existence of these pulses is the pressure wave from the cavity wall, which is not included in the analytical model. In most numerical simulations, the transmitting boundary is specified 25 and 50 sphere diameters in the radial and penetration directions, respectively. Thus, the possible contamination of the solution due to reflections was eliminated.
Figure 7 shows the evolution of the predicted pressure waveform received at w = 3 cm along the penetration depth. The signatures are estimated at the depths of 2 cm, 4 cm, and 8 cm. The increase in the pulse duration with depth is also observed in both the numerical and analytical solutions. The results have the same feature, namely that the amplitude of the peak ballistic pressure pulse first increases near the free surface and then decreases with increased depth. This can be explained by the effect of the pressure-release boundary
830 M. LEE ET AL.
Time (ms)
Figure 6. Typical pressure signature generated by a subsonic projectile, estimated at z = 4 cm. w = 3 cm; normal penetration, 1 cm sphere, Vi = 1.2 km/s. ( - . . -) A; (-0-) B.
between air and water. From the results, it can be concluded that a moving point source approximation is valid for the case of subsonic penetration.
In the analytical model, a linearized form of the equations was used. However, it is useful to see how far pulses must propagate for nonlinear effects to become noticeable. Consider a spherical source with an initial radius re and exponentially decaying pressure wave: Peexp(- t / T ) , where Pe is the pressure at re and r is the pulse duration. The pressure wave in the medium is then given by
where f (r) is the finite amplitude loss effect, which is unity in the linear theory. From the weak shock theory given by Rogers (1977), this function is
where j3, is the coefficient of nonlinearity, taken as 3.5 for water. Now, from the pressure wave estimated at z = 6 cm in Figure 7(a), re = 0.04 m, P, = 55 MPa and r = 0.05 ms. For f (r) = 0-9, we have a = 0.25 and r = 193re. So, linear theory should indeed yield good results (Hamilton 1995).
The numerical simulations were conducted on a 486 IBM PC for two-dimensional calculations and 586 IBM PC for three-dimensional calculations. A numerical simulation typically takes 40 h of computational time for each case, while in the analytical predictions several pressure waveforms can be constructed in two minutes on an IBM RS/600 machine.

BALLISTIC WAVES IN HIGH-SPEED WATER ENTRY
-100 1 I I I I I
0 0.05 0.1 0.15 0.2 Time (ms)
Figure 7. Evolution of the pressure signatures obtained from (a) analytical method, (b) numerical simulation. The signatures are estimated along the depth of z = 2 cm (A), z = 4 cm (B), z = 6 cm (C), and z = 8 cm (D) at radial distance of 3 cm. The peak ballistic pressure initially increases with depth and then decreases with increased depth
due to the pressure-release boundary condition.
The efficiency of the analytical methods compared to the numerical simulations is over- whelming.
4.1.2. Supersonic
Figure 8 shows the pressure waveform generated by a sphere penetrating water at an arbitrary supersonic impact velocity of 2.07 km/s ( M , = 1.4). The waveforms are predicted

832 M. LEE ET A L .
0 0.02 0.04 0.06 0.08 0.1 Time (ms)
Figure 8. Typical pressure signature generated by a supersonic projectile, estimated a t z = 5 cm, w = 2 cm; normal penetration, 1 cm sphere, Vi = 2.07 km/s; (--) analytical; (------) numerical.
at z = 5 cm, w = 2 cm from the numerical and analytical solutions. The results show overall agreement; however, the agreement for the pulse duration is not as close, with the numerical pulse duration being a little larger than the analytical one. A possible explanation of this discrepancy is a time compression of the signal received at the observer, i.e. a decrease in pulse duration, even though the diffraction effects are included in the analytical model. To a first approximation, the pulse duration from the numerical result is predicted to be 7 ps.
Then the wavelength which can be obtained by multiplying the pulse duration by the sound speed of water is 1.03 cm. This value is close to the diameter of the sphere, which indicates the occurrence of significant diffraction effects at this location. The angle (Or,), measured from the penetration axis, within which the time inversion exists can be deter- mined by setting (1 - M i cos Oti) equal to zero, so that at M , = 1.4, & equals 44.4". Thus, if an observer is located within this angle in the fluid, time inversion occurs. The initial angle, do, is 21.8", which indicates that there is a time inversion. It should be noted that this waveform is much different from the subsonic one, with a rarefaction wave following a compression wave. This signature is a typical near-field waveform generated by a super- sonic BS. From the signature, we see that the rarefaction wave gives a negative pressure of several hundreds of atmospheres. Thus, a matter to be addressed is the tensile behaviour of water. As discussed by Temperley & Trevena (1979,1987), even though the amplitude of the rarefaction wave is hundreds of atmospheres, if the pulse has a duration of only a few microseconds then the water may stand the rarefaction wave without cavitation.
A plot of the peak ballistic pressure versus impact velocity is shown in Figure 9. The predictions were obtained by computing for several values of sphere diameters D, the pressure signatures at the observer using the analysis described in Section 2 of this paper. I t is found that the peak pressure varies approximately as the 2.9 power of the impact velocity

BALLISTIC WAVES IN HIGH-SPEED WATER ENTRY
Impact velocity (km/s)
Figure 9. Peak ballistic pressure versus impact velocity from normal penetration, estimated at z = 5 cm, rr = 5 cm. The peak pressure varies as the 2.9 power of the impact velocity from the analytical results, 2-4 from the numerical results. In the incompressible theory, the pressure is proportional to the square of the impact velocity, however, due to the unsteady potential term and compressible effect at high velocity; the pressure is found to vary with a slightly larger power of the impact velocity. Diameter D,: analytical (---) 1 cm, (-) 2 cm; numerical
(--Ap) 1 cm, ( -@-) 2 cm.
from the analytical results and 2.4 from the numerical results, while McMillen (1946) measured 2.17 from his experiments. A rough estimate can be made to predict the peak pressure versus impact velocity by using the unsteady Bernoulli equation and Tait's equation of state for water. The maximum pressure is given by
where n = 7.15. At the instant of impact, 4 J V 4 I 2 = - 4 V : and cp, = - cp,. Thus we can write equation (21) as
For the blunt body impact, cp, = V : f (geometry) z V: constant, and equation (22) becomes
Ps n - 1 M ? constant
For high impact velocity, P,/~,C~ z M?"""-'). If n equals 7.15,
834 M. LEE ET AL
From equation (24), it can be concluded that, due to the unsteady pressure and compressible effect, the peak ballistic pressure is found to behaviour 2.33 power of the impact velocity at high impact Mach number, while in the incompressible theory the pressure varies as the square of the impact velocity.
In this section we analyse the pressure waveforms radiatede by a projectile during oblique penetration. The waveform can be constructed in a three-step procedure as follows. Firstly, the observation location, impact point and the direction of penetration are specified in (x, y, z) coordinates. These coordinates are transformed in (z, w ) coordinates, and dynamic and unsteady pressures are estimated in these coordinates. The dynamic pressures are again transformed into (x, y, z) coordinates. The second step is to obtain the vertical pressure by adding the dynamic and unsteady pressures in the (x, y, z) coordinates. The coordinate transformation technique was discussed by Lundstrom (1971). The final step in the analysis is to construct the continuous pressure waveform by performing the convolution of the vertical and horizontal components.
4.2.1. Subsonic
Consider a spherical projectile with an impact velocity of 1.2 km/s. The impact angle is 30°, measured from the vertical. Figure 10 shows the pressure waveforms estimated at z = 3 cm, x = 4 cm, z = 3 cm, x = - 4 cm, and z = 4 cm, x = 4 cm. Although the waveform esti- mated at z = 3 cm, x = 4 cm and z = 3 cm, x = - 4 cm is similar, the amplitude of the peak ballistic pressure estimated at the location in which the source is moving is greater than that estimated at the other location. This is attributed to the Doppler effect, since the angle 0 between the direction of motion of the source and the direction of the observation point is an important factor in determining the amplitude of the signal. The signature shown in Figure 10(c) is predicted at z = 4 cm, x = 4 cm, which is much closer to the penetration axis. This waveform, with two ballistic pulses, is different from the previous ones shown in Figure 10(a, b). The first peak is due to the spherical impact pulse which decays at a rate of between l/r and l/r2, while the second peak comes from the ballistic pulse. Although the source strength decreases as it moves in the fluid due to the kinetic energy loss, if the observation location is close to the penetration axis but also sufficiently deep so that the spherical impact shock has attenuated enough, the second ballistic pulse can be observed. The two pulses are observed in both the numerical and analytical solutions. The signature shown in Figure 10(c) is a typical waveform at a deep location close to the penetration axis, which was also measured in the experiments of Leslie (1964).
Figure 11 shows a plot of the peak ballistic pressure versus penetration angle. The im- pact velocity of the sphere is 1.0 km/s. The results were obtained by computing the pressure signatures at several locations in the medium. For target points in the same direction as the motion of the source (+ x plane), the peak pulse increases with 0. That is, the smaller the angle, 0, the larger the Doppler factor. The inverse is true for the direction opposite to the motion of the source (- x plane). This is the Doppler shift which occurs for a moving source. In Figure 11, it can be observed that the amplitude of the ballistic wave increases by a factor of two for a 35" oblique penetration compared with the normal penetration.

BALLISTIC WAVES IN HIGH-SPEED WATER ENTRY
Figure 10. Pressure signatures generated by a subsonic ballistic source, estimated a t (a) z = 3 cm, x = 4 cm, (b) z = 3 cm, x = - 4 cm, (c) z = 4 cm, x = 4 cm; (--) analytical; (-----) numerical. The peak pressures estimated at (a) and (b) locations are different due to the Doppler effect. In (c), two pulses are observed because the observer is located close to the penetration axis. The first peak is due to the spherical impact pulse, while the second
peak comes from the ballistic pulsse; oblique penetration (303), 1 cm sphere, Vi = 1.2 km/s.
4.2.2. Supersonic
Figure 12 shows the pressure waveforms predicted at z = 2 cm, x = 4 cm, z = 2 cm, x = - 4 cm for a supersonic impact (Mi = 1.4). The impact angle is 30". The solid line represents the prediction obtained from the analytical theory, and the dashed line repres- ents the prediction obtained from the numerical simulations. At z = 2 cm, x = 4 cm the angle between the direction of the observer and the penetration axis equals 34.4", which

M. LEE ET AL.
- 2 0 0 ~ ' " ~ " ' ~ " ' ~ " ' ~ " ' ~ " ' ~ 0 0.02 0.04 0.06 0.08 0.1 0.12
Time (ma)
Figure 10. (Continued)
0 10 20 30 40 Angle C')
Figure 11. Normalized peak ballistic pressure versus penetration angle (measured from the vertical). For target points in the same direction as the motion of the source (+ x plane), the peak pulse increases with 8. That is, the smaller 0 is, the larger the Doppler factor is. The inverse is true for the direction opposite to the motion of the source ( - x plane). The peak pressure increases by a factor of two at 35" oblique penetration compared with that at normal penetration; 1 cm sphere, Vi = 1.0 km/s. (-0-) z = 3 cm, x = 5 cm; (-A-) z = 3 cm, x = 7 cm;
( - - 0--) z = 3 cm, x = - 5 cm; (--V--) z = 3 cm, x = - 7 cm.

BALLISTIC WAVES IN HIGH-SPEED WATER ENTRY
' ' ' l ' ' ' ~ ' ' ' ~ ' ' ' ~ ' ' ' ~ ' ' ' ~ L ' ' 0 0.02 0.04 0.06 0.08 0.1 0.12 0.14
Time (ms) Figure 12. Pressure signatures generated by a supersonic ballistic source, estimated at (a) z = 2 crn, x = 4 cm,
(b) z = 2 cm, x = - 4 cm; (-) analytical; (-----) numerical. The signature in (b) looks like the waveform radiated by a subsonic BS. This is because a t this location 8, equals 93.4", so the observer is located in the rear
hemisphere; oblique penetration (30°), 1 cm sphere, & = 2.07 km/s.
indicates the existence of a time inversion. This is because the observer is located within the time inversion angle (44.4"). The typical nearfield pressure waveform is predicted with a small discrepancy on the pulse duration. Now consider the amplitude of the peak ballistic pulses at the two locations. Due to the Doppler factor associated with the moving direction of the source, the amplitude of the peak pressure is much different, although r , at both locations is the same. Also of interest is that the waveform at z = 2 cm, x = - 4 cm looks like the waveform radiated by a subsonic BS. This is due to the fact that, at this location,

838 M. LEE ET AL
8 equals 93.4", and thus the observer is located in the rear hemisphere. Again, these results confirm the validity of the analytical model for the case of the supersonic oblique penetration.
In this section, the pressure waveforms radiated by two projectiles during subsonic normal and supersonic oblique penetration are investigated. The pressure waveform is constructed by the superposition technique. The geometry of the oblique multiple penetration is displayed in Figure 13.
4.3. I . Subsonic
Consider two spheres at normal impact with an impact velocity of 1.2 km/s. The distance (L) between them is 8 cm. Figure 14 shows the pressure waveforms estimated at z = 3 cm, x = 2, 3, and 4 cm. In Figure 14(a), the waveform calculated at z = 3 cm, x = 2 cm shows that the first ballistic pulse radiated by a left BS is followed by a second ballistic pulse coming from the right BS. The amplitude of the first pulse is significantly greater than the second pulse due to the geometry of the sources and observer. In Figure 14(b), the waveform obtained from the numerical simulation is nearly one pulse, while the waveform from the analytical solution is composed of two pulses radiated by two sources. This can be attributed to the shock smearing effect which is not included in the analytical model: due to the slow shock rise time, the second pulse is smeared with the first pulse. However, good agreement in the total pulse duration is obtained.
4.3.2. Supersonic
The predictions are made for Vi = 2.07 km/s, L = 10 cm, and an impact angle of 30" from vertical. Figure 15 shows the pressure waveform predicted at z = 2 cm, x = 4 cm displayed as A, being closer to the left source, and at z = 2 cm, x = 6 cm as B in Figure 13. In both the analytical and numerical simulation results, two pressure pulses are predicted at A, as discussed in the subsonic calculations. Compared to the subsonic waveform, the first pulse should have a rarefaction wave following a compression wave. However, the second pulse
Image so.... v /
z S Figure 13. Geometry of oblique multiple penetrations of finite spheres.

BALLISTIC WAVES IN HIGH-SPEED WATER ENTRY
Figure 14. Pressure signatures generated by subsonic ballistic sources, estimated a t (a) z = 3 cm, x = 2 cm, (b) z = 3 cm, x = 3 cm, (c) z = 3 cm, x = 4 cm; (--) analytical; (-----) numerical. In (b), one pulse is observed from the numerical simulation. This can be attributed to the shock smearing effect, which is not included in the analytical model. However, the agreement with the analytical results for the total pulse duration is favourable;
normal multiple penetration, 1 cm sphere, Vi = 1.2 km/s, the distance between the impact points is 8 cm.
emitted by the right source is received at this location a small time later and added to the first pulse, which eliminates the rarefaction wave from the first pulse. Two pulses are also observed at B. However, the first pressure pulse is a small compression wave radiated by the right source since this point is seen to be located in the backward hemisphere of the right source. On the other hand, the second pulse emitted by the left source is a large compression wave which must be followed by a rarefaction wave. Because of the addition of these pulses, as shown in the figure, the rarefaction wave disappears from the second pulse. The

M. LEE ET AL.
- l o o ~ " ' ~ l " ~ " ' ~ ' l l ~ l l l " ' ~ I
0 0.02 0.04 0.06 0.08 0.1 0.12 Time (ms)
Figure 14. (Continued)
characteristics of the pressure waveform at C,D in Figure 13 is expected to be nearly the same as the results described in the previous section. An interesting point to be considered is that the cavity created by a right source can be another free surface which gives rise to reflection waves. However, if the depth of C is larger than the cavity, left pressure waves could be received at C. This is also true for D.
5. SUMMARY AND CONCLUSIONS
The ballistic waves generated by a projectile penetrating into water at subsonic and/or supersonic velocities with respect to water has been studied both analytically and numer- ically. Although we have restricted our analysis to the case of high-speed impact of a sphere, the model presented here can be extended for any body shape. This study was based on the work of Lee (1995), and the following conclusions can be drawn.
The analytical model is based on the linear potential wave equation describing the generation of ballistic waves by a moving source for an inviscid and irrotational medium. The projectile is described as a moving point source whose strength is determined by the kinetic energy loss of the projectile. Using the energy balance principle, this energy goes into the kinetic and potential energy stored in the fluid. A time-domain analysis is developed in order to predict the ballistic waves radiated by a projectile. The impact Mach number of the projectile ranged from 0.4 to 1.4, with special interest in the case of transonic velocities.
The moving point source approximation has been found to be good for the sources moving at subsonic velocity. For the case of supersonic source velocities, the wavelength of the ballistic wave is comparable to the size of a projectile, in which case the approxima- tion of small diffraction effects breaks down. For the purpose of having a model valid for any source velocity, the pressure radiated by a supersonic source is expressed as a convolu- tion type summation between the horizontal component and vertical component. The vertical component represents the response of a moving point source, and the horizontal

BALLISTIC WAVES IN HIGH-SPEED WATER ENTRY
' ' ' ~ ' ' ' ~ ' ' ' ~ L ' ' ' ' ' 0 0.02 0.04 0.06 0.08 0.1
Time (ma)
Figure 15. Pressure signatures generated by a supersonic ballistic source, estimated at (a) z = 2 cm, x = 4 cm, (b) z = 2 cm, x = 6 cm; (~--) analytical; (-----) numerical. The rarefaction waves have disappeared due to the addition of the other wave; oblique ( 3 0 ) multiple penetration, 1 cm sphere, & = 2.07 km/s, the distance
between the impact points is 10 cm.
component represents the response of the projected area of the source. Also of importance for the case of a supersonic source is the time inversion phenomenon which occurs when a source is moving faster than the disturbances it generates. It has been shown that the time inversion quickly disappears during the penetration in water due to the decay of the projectile velocity. In order to account for the time inversion effect, the potential function has been partitioned into two similar integrals: one for the source during the time inversion period, the other for the source with no time inversion.

842 M. LEE ET AL
The results from the analysis of the ballistic waves reported in this study show that, for the subsonic case, the analytical predictions are in good agreement with the numerical simulations, especially for the amplitude of the peak pressure, the pulse duration and the projectile dynamics. For the supersonic case, the pulse duration from the analytical prediction is a little shorter than that from the numerical results, even though diffraction effects are considered in the model. In general, the analytically predicted waveform is in reasonable agreement with the numerically simulated waveform. By taking the time inver- sion into account, the analytical model is able to predict the rarefaction wave following the compression wave. Limitations of the numerical modelling were identified, such as relative- ly poor shock front resolution because of the dispersion effects. For the far-field solution, a numerical simulation that solves nonlinear fluid flow is not reliable because of the large three-dimensional fluid medium containing the projectile.
ACKNOWLEDGMENTS
The authors thank the Applied Research Laboratory at the University of Texas at Austin for support throughout this project, and the Institute for Advanced Technology for use of computing facilities.
REFERENCES
ABELSON, H. I. 1970 Pressure measurements in the water-entry cavity. Journal of Fluid Mechanics 44, 129-144.
ANDERSON, C. E. JR. 1987 An overview of the theory of hydrocodes. International Journal of Impact Engineering 5 , 33-59.
BALL, R. E. 1976 Structural response of fluid-containing-tanks to penetrating projectiles (hydraulic r a m F a comparison of experimental and analytical results. NPS-57 Bp 7605, May, Naval Postgraduate School, Monterey, CA, U.S.A.
BERTHELOT, Y. H. & BUSCH-VISHNIAC, I. J. 1987 Thermoacoustic radiation of sound by a moving laser source. The Journal of the Acoustical Society of America 81, 317-327.
BIRKHOFF, G . & ZARANTONELLO, F. H. 1957 Jets, Wakes, and Cavities. New York: Academic Press. BRISTOW, R. J. & LUNDENBERG, J. F. 1969 Hydraulic Ram. FADS-66, Feb., Boeing Co., Seattle,
Washington, U.S.A. CHARTERS, A. C. & THOMAS, R. N. 1945 The aerodynamic performance of small spheres from subsonic
to high supersonic velocities. Journal of the Aeronautical Science, 468-476. COOK, J. A. 1993 Interaction of multiple spark-generated bubbles in a compressible liquid. Ph.D.
Dissertation. The University of Texas at Austin, U.S.A. HAMILTON, M. F. 1995 Personal communication. HOOVER, W. R. & DAWSON, V. C. D. 1966 Hydrodynamic pressure measurements of the vertical water
entry of a sphere. U.S. Naval Ordnance Laboratory, White Oak, MD, U.S.A., Tech. Report 66-70.
JANZON, BO S. G., CHICK, M. & BUSSEL, T. 1993 Penetration and failure of explosively formed penetrators in water-an experimental and computational study. Proceedings 14th International Symposium on Ballistics, Quebec, Canada, pp. 611-617.
KOROBKIN, A. A. & PUKHNACHOV, V. V. 1988 Initial stage of water impact. Annual Review Fluid Mechanics 20, 159-185.
LEE, M. 1995 Generation of shock waves by a body during high-speed water entry. Ph.D. Dissertation, The University of Texas at Austin, U.S.A.
LEE, M., LONGORIA, R. G. & WILSON, D. E. 1997 Cavity dynamics in high-speed water entry. Physics of Fluids 9 , 540-550.
LESLIE, C. B. 1964 Underwater noise produced by bullet entry. The Journal of the Acoustical Society of America 36, 1138- 1144.
LUNDSTROM, E. A. 1971 Fluid dynamic analysis of hydraulic ram. NWC TP 5227, Naval Weapons Center, China Lake, Calif., U.S.A.

BALLISTIC WAVES IN HIGH-SPEED WATER ENTRY 84 3
LUNDSTROM, E. A. 1988 Fuel cell structural response to hydraulic ram. In: Shock and Wave Propaga- tion, PVP-Vol. 134, pp. 39-51. New York: ASME.
MCMILLEN, J. H. 1945 Shock wave pressures in water produced by impact of small spheres. Physical Review 68, No. 9, 198-209.
MCMILLEN, J. H. & HARVEY, E. N., 1946 A spark shadow graphic study of body waves in water. Journal of Applied Physics 17, 541-555.
MCMILLEN, J. H., KTAMER, R. L., ALLMAND, D. E. & MARCH, R. S. 1950 Pressure fields surrounding high-speed spheres in water. U.S. Naval Ordnance Laboratory, White Oak, MD, U.S.A., Memorandum 10712.
MORSE, P. M. 1976 Vibration and Sound. Published by the American Institute of Physics for the Acoustical Society of America; Chapter 7, pp. 344-346.
NEUMANN, J. VON & RICHTMYER, R. D. 1950 A method for the numerical calculation of hydrodynamic shocks. Journal of Applied Physics 21, 232-237.
ROGERS, P. H. 1977 Weak-shock solution for underwater explosive shock waves. The Journal of the Acoustical Society of America 62, 1412-1419.
STEPKA, F. S. & MORSE, C. R. 1963 Preliminary investigation of catastrophic fracture of liquid-filled tanks Impacted by high-velocity particles. NASA TN D-1537, May, NASA.
STEPKA, F. S. 1966 Projectile-impact induced fracture of liquid-filled, filamented-reinforced plastic or aluminum tanks. NASA TN D-3456, June, NASA.
TEMPERLEY, H. N. V. & TREVENA, D. H. 1979 Metastable effects associated with the reflection of a pressure pulse at the free surface of water. Journal of Physics D: Applied Physics 12,1887- 1894.
TEMPERLEY, H. N. V. & TREVENA, D. H. 1987 Why is the tensile strength of water measured dynamically less than that measured statically? Journal of Physics D: Applied Physiocs 24, 1080-1081.
WEINGARTEN, L. I., HORSTEMEYER, M. F. & TRENTO, W. P. 1992 Modeling underwater explosions with an Eulerian code. Proceedings of the 63rd Shock and Vibration Symposiutn, pp. 269-277.
WOLFE, W. P. & GUTIERREZ, W. T. 1988 Experimental measurements of pressure in water-entry cavities. A S M E Cavitation and Polyphase Flow Forum, FED-Vol-135, pp. 104-107. New York: AS M E.
YURKOVICH, R. 1969 Hydraulic Ram: a fuel tank vulnerability study. Report No. G964, Sep., McDon- nell Douglas Corp., St. Louis, Mo, U.S.A.
ZIIAO, R. & FALTINSEN, 0 . 1993 Water entry of two-dimensional bodies. Journal of Fluid Mechanics 246. 593-612.
APPENDIX: NOTATION
A and B A,, a c d
C
DP EP e
constants, defined by equation (9) projected area of the projectile cavity radius drag coefficient speed of sound in the fluid projectile diameter kinetic energy of the projectile specific total energy external body forces per unit mass finite amplitude loss effect material impedance, pc Mach number convected Mach number Mach number at impact radius of the cross section of the projectile projectile mass constant, In(Q/a) coefficient in Tait's equation of state for water total pressure magnitude of peak pressure at re magnitude of peak pressure at r cavity pressure

M. LEE ET AL.
horizontal pressure component ambient pressure vertical pressure component distance between the projectile and observer distance between the line source and observer location initial radius of a spherical source distance between the impact and observer locations projectile radius time arrival time of projectile at point z time of arrival to the observer of a wavelet emitted at a distance z magnitude of fluid particle velocity impact velocity moving velocity penetration distance for the period of time invesion total penetration distance penetration axis radial distance velocity decay constant coefficient of nonlinearity and 3-5 for water pulse duration source strength at 5 angle between the direction from impact to observer and moving direction penetration index density of water stress tensor retarded time, t - r/c period of time inversion velocity potential distance of radial velocity field