ballarpur international graphic paper holdings b.v
TRANSCRIPT

CONFIDENTIAL
Ballarpur International Graphic Paper Holdings B.V.(A private company with limited liability organized under the laws of the Netherlands)
US$200,000,000 Subordinated Perpetual Capital SecuritiesThe US$200,000,000 subordinated perpetual capital securities (the “Securities”) will be unsecured subordinated obligations of BallarpurInternational Graphic Paper Holdings B.V. (the “Issuer”). The Securities confer a right to receive interest (“Interest”) at the applicablerate described below for the period from and including August 11, 2011 or from and including the most recent Interest Payment Date(defined below) to (but excluding) the next Interest Payment Date or any redemption date. Subject to the provisions of the Securitiesrelating to deferral of Interest (see “Description of the Perpetual Capital Securities — Deferral of Interest”), Interest accrues (i) from(and including) August 11, 2011 (the “Issue Date”) to (but excluding) August 11, 2016 (the “First Call Date”) at a rate of 9.75% perannum, payable semi-annually on February 11 and August 11 in each year commencing on February 11, 2012; (ii) from (and including)the First Call Date to (but excluding) August 11, 2021 (the “Second Call Date”), unless previously redeemed, at a rate equal to 8.57%per annum above the then current 5-year US Treasury rate, payable semi-annually on February 11 and August 11 in each year up to (andincluding) the Second Call Date; (iii) from (and including) the Second Call Date, unless previously redeemed, to (but excluding) thefollowing Reset Date (as defined herein) at a rate equal to 8.57% per annum above the then current 5-year US Treasury rate plus 100basis points, payable semi-annually on February 11 and August 11 in each year up to (and including) the Reset Date falling immediatelyafter the Second Call Date; and (iv) from (and including) each Reset Date falling after the Second Call Date, unless previouslyredeemed, to (but excluding) the immediately following Reset Date at a rate equal to 8.57% per annum above the then current 5-year USTreasury rate plus 100 basis points, payable semi-annually on February 11 and August 11 each year.The Issuer may, at its sole discretion, elect to defer (in whole or in part) payment of Interest which would otherwise have become dueand payable on an Interest Payment Date by giving notice (which notice shall be irrevocable) to the holders of the Securities and theTrustee not more than 10 nor less than five New York Business Days prior to a scheduled Interest Payment Date. Any Interest deferredpursuant to the terms of the Securities shall constitute “Arrears of Interest”. The Issuer may, at its sole discretion, elect to defer furtherany Arrears of Interest by complying with the foregoing notice requirement applicable to any deferral of any accrued Interest. The Issueris not subject to any limit as to the number of times Interest and Arrears of Interest can or shall be deferred pursuant to the terms of theSecurities, except that the provisions described under “Description of the Perpetual Capital Securities — Restrictions in the case ofDeferral” shall be complied with until all outstanding Arrears of Interest have been paid in full. Each amount of arrears of Interest shallaccrue Interest as if it constituted the principal of the Securities at the applicable rate described above and the amount of such accruedInterest with respect to arrears of Interest shall be due and payable on the following Interest Payment Date, unless further deferred inaccordance with the terms of the Securities. See “Description of the Perpetual Capital Securities — Deferral of Interest” for details.The Securities are perpetual securities and have no fixed final redemption date. The Issuer may elect to redeem the Securities (in wholebut not in part) at par plus accrued Interest, Arrears of Interest and Additional Interest Amounts, if any, on the First Call Date, theSecond Call Date or on any Interest Payment Date thereafter (each such redemption an “Optional Redemption”). In addition, upon theoccurrence of an Accounting Event, Capital Event or Tax Deduction Event (each as defined herein), the Issuer may elect to redeem theSecurities at (1) their Early Redemption Amount (as defined herein), if such redemption occurs before (but excluding) August 11, 2021or (2) if such redemption occurs after (or on) August 11, 2021, at their principal amount, in each case together with Interest accrued,including any Arrears of Interest and any Additional Interest Amounts, up to (but excluding) the redemption date. Upon the occurrenceof a Withholding Tax Event or Squeeze Out Event (as defined herein), the Issuer may elect to redeem the Securities at par plus accruedInterest and Arrears of Interest, if any. Upon the occurrence of a Change of Control (as defined herein), the Issuer may elect to redeemthe Securities at their principal amount plus accrued Interest and Arrears of Interest, if any, or suffer a 5% step-up to the prevailingInterest rate of the Securities. For a more detailed description of the Securities, see “Description of the Perpetual Capital Securities”beginning on page 179.
Offering Price for the Securities: 100% plus accrued Interest, if any, from August 11, 2011
Investing in the Securities involves certain risks. You should read “Risk Factors” beginning on page 31 before investing in theSecurities.
Approval in-principle has been received for the listing and quotation of the Securities on the Official List of the Singapore ExchangeSecurities Trading Limited (the “SGX-ST”). Approval to list the Securities will be granted when the Securities have been admitted to theOfficial List of the SGX-ST. The SGX-ST assumes no responsibility for the correctness of any statements made, opinions expressed orreports contained in this Offering Circular. Admission for the listing and quotation of the Securities on the SGX-ST is not to be taken asan indication of the merits of the Securities or of the Issuer or its respective subsidiaries or associated companies (if any). The Securitieswill be traded on the SGX-ST in a minimum board lot size of US$200,000 for so long as the Securities are listed on the SGX-ST.
The Securities have not been, and will not be, registered under the U.S. Securities Act of 1933, as amended (the “Securities Act”),or any U.S. state securities laws. Accordingly, the Securities being offered and sold only (i) in the United States to qualifiedinstitutional buyers (“QIBs”) (as defined in Rule 144A under the Securities Act (“Rule 144A”)) in reliance on the exemption fromthe registration requirements of the Securities Act provided by Rule 144A and (ii) to persons outside the United States incompliance with Regulation S. Prospective purchasers are hereby notified that the sellers of the Securities may be relying on theexemption from the provisions of Section 5 of the Securities Act provided by Rule 144A. For a description of certain restrictionson resales and transfers, see “Transfer Restrictions”, beginning on page 222.
Joint Lead Managers and Joint Bookrunners
HSBC The Royal Bank of ScotlandThe date of this Offering Circular is August 4, 2011.

NOTICE TO INVESTORS
The Issuer, as well as The Hongkong and Shanghai Banking Corporation Limited (“HSBC”) and TheRoyal Bank of Scotland plc (“RBS”) (together, the “Initial Purchasers”), reserve the right to withdrawthe offering of the Securities at any time or to reject any offer to purchase, in whole or in part, for anyreason, or to sell less than all of the Securities offered hereby.
This Offering Circular is personal to the prospective investor to whom it has been delivered by theInitial Purchasers and does not constitute an offer to any other person or to the public in general tosubscribe for or otherwise acquire the Securities. Distribution of this Offering Circular to any personother than the prospective investor and those persons, if any, retained to advise that prospectiveinvestor with respect thereto is unauthorized, and any disclosure of its contents without the Issuer’sprior written consent is prohibited. The prospective investor, by accepting delivery of this OfferingCircular, agrees to the foregoing and agrees not to make any photocopies of this Offering Circular.
This Offering Circular is intended solely for the purpose of soliciting indications of interest in theSecurities from qualified investors and does not purport to summarize all of the terms, conditions,covenants and other provisions contained in any transaction documents described herein. Theinformation provided is not all-inclusive. The market information in this Offering Circular has beenobtained by the Issuer from publicly available sources deemed by it to be reliable. Notwithstanding anyinvestigation that the Initial Purchasers may have conducted with respect to the information containedherein, the Initial Purchasers do not accept any liability in relation to the information contained in thisOffering Circular or its distribution or with regard to any other information supplied by or on theIssuer’s behalf.
The Issuer confirms that, after having made all reasonable inquiries, this Offering Circular contains allinformation with regard to the Issuer and the Securities which is material to the offering and sale of theSecurities, that the information contained in this Offering Circular is true and accurate in all materialrespects and is not misleading in any material respect and that there are no omissions of any other factsfrom this Offering Circular which, by their absence herefrom, make this Offering Circular misleadingin any material respect. The Issuer accepts responsibility accordingly.
Prospective investors in the Securities should rely only on the information contained in this OfferingCircular. None of the Issuer or the Initial Purchasers have authorized the provision of informationdifferent from that contained in this Offering Circular. The information contained in this OfferingCircular is accurate in all material respects only as of the date of this Offering Circular, regardless ofthe time of delivery of this Offering Circular or of any sale of the Securities. Neither the delivery ofthis Offering Circular nor any sale made hereunder shall under any circumstances imply that there hasbeen no change in the Issuer’s affairs and those of each of its respective subsidiaries or that theinformation set forth herein is correct in all material respects as of any date subsequent to the datehereof.
Prospective investors hereby acknowledge that (i) they have not relied on the Initial Purchasers or anyperson affiliated with the Initial Purchasers in connection with any investigation of the accuracy ofsuch information or their investment decision, and (ii) no person has been authorized to give anyinformation or to make any representation concerning the Issuer or the Securities (other than ascontained herein and information given by the Issuer’s duly authorized officers and employees, as
— i —

applicable, in connection with investors’ examination of the Issuer, and the terms of this offering) and,if given or made, any such other information or representation should not be relied upon as havingbeen authorized by the Issuer or the Initial Purchasers.
The Securities have not been approved or recommended by the United States Securities andExchange Commission (“SEC”) or any other federal or state regulatory authority in the UnitedStates. Furthermore, the foregoing authorities have not passed upon or endorsed the merits of theoffering or confirmed the accuracy or determined the adequacy of this Offering Circular. Anyrepresentation to the contrary is a criminal offense in the United States.
The Hongkong and Shanghai Banking Corporation Limited (the “Stabilizing Manager”) or any of itsaffiliates (or any person acting on behalf of any of them) may, to the extent permitted by applicablelaws and regulations, over-allot or effect transactions with a view to supporting the market price of theSecurities at a level higher than that which might otherwise prevail for a limited period after the issuedate. In doing so, the Stabilizing Manager acts as principal and not as agent of the Issuer and any lossresulting from over-allotment or stabilization will be borne, and any profit arising from them shall beretained, by the Initial Purchasers, as applicable, in equal proportion. However, there is no assurancethat the Stabilizing Manager or any of its affiliates (or persons acting on behalf of any StabilizingManager) will undertake any stabilizing action. Any stabilizing action may begin on or after the dateon which adequate public disclosure of the terms of the offer of the Securities is made and, if begun,may be ended at any time, but will end no later than 30 days after the issue date of the Securities and60 days after the date of the allotment of the Securities, whichever is the earlier. The Issuer authorizeseach Initial Purchaser to make such public disclosure of information relating to stabilization of theSecurities as is required by applicable law, regulation and guidance.
None of the Initial Purchasers, the Issuer or their respective affiliates or representatives ismaking any representation to any offeree or purchaser of the Securities offered hereby regardingthe legality of any investment by such offeree or purchaser under applicable legal investment orsimilar laws. The Initial Purchasers have not separately verified the information contained in thisOffering Circular. None of the Initial Purchasers makes any representation, warranty orundertaking, express or implied, or accepts any responsibility, with respect to the accuracy orcompleteness of any of the information in this Offering Circular. To the fullest extent permittedby law, none of the Initial Purchasers accepts any responsibility for the contents of this OfferingCircular or for any other statement made or purported to be made by the Initial Purchasers or ontheir behalf in connection with the Issuer or the issue and offering of the Securities. Each of theInitial Purchasers accordingly disclaims all and any liability whether arising in tort or contractor otherwise which it might otherwise have in respect of this Offering Circular or any suchstatement.
Each prospective investor contemplating purchasing any Securities should make its ownindependent investigation of the financial condition and affairs, and its own appraisal of thecreditworthiness of the Issuer, and the terms of the Securities being offered, including the meritsand risks involved and its purchase of the Securities should be based upon such investigationswith its own tax, legal and business advisers as it deems necessary. See section, “Risk Factors” for
— ii —

a discussion of certain factors to be considered. Any prospective investor in the Securities shouldbe able to bear the economic risk of an investment in the Securities for an indefinite period oftime.
This Offering Circular does not constitute an offer to sell, or a solicitation of an offer to buy, anySecurities offered hereby by any person in any jurisdiction in which it is unlawful for such person tomake an offer or solicitation in such jurisdiction.
The distribution of this Offering Circular and the offer and sale of the Securities may, in certainjurisdictions, be restricted by law. Neither the Issuer nor the Initial Purchasers represent that thisOffering Circular may be lawfully distributed, or that any Securities may be lawfully offered, incompliance with any applicable registration or other requirements in any such jurisdiction, or pursuantto an exemption available thereunder, or assume any responsibility for facilitating any suchdistribution or offering. In particular, no action has been taken by any of the Issuer or the InitialPurchasers which would permit a public offering of any Securities or distribution of this OfferingCircular in any jurisdiction where action for that purpose is required. Accordingly, no Securities maybe offered or sold, directly or indirectly, and neither this Offering Circular nor any advertisement orother offering material may be distributed or published in any jurisdiction, except under circumstancesthat will result in compliance with any applicable laws and regulations.
Each purchaser of the Securities must comply with all applicable laws and regulations in force in eachjurisdiction in which it purchases, offers or sells the Securities or possesses or distributes this OfferingCircular, and must obtain any consent, approval or permission required for the purchase, offer or saleby it of the Securities under the laws and regulations in force in any jurisdiction to which it is subjector in which it makes purchases, offers or sales. Persons into whose possession this Offering Circular orany Securities may come must inform themselves about, and observe, any such restrictions on thedistribution of this Offering Circular and the offering and sale of Securities. In particular, there arerestrictions on the offer and sale of the Securities, and the circulation of documents relating thereto, incertain jurisdictions including the United States and the European Economic Area and to personsconnected therewith. See “Plan of Distribution”.
U.S. INFORMATION
This Offering Circular is being submitted on a confidential basis in the United States to a limitednumber of QIBs for informational use solely in connection with the consideration of the purchase ofthe Securities. Its use for any other purpose in the United States is not authorized. It may not be copiedor reproduced in whole or in part nor may it be distributed or any of its contents disclosed to anyoneother than the prospective investors to whom it is originally submitted.
For this offering, the Issuer and the Initial Purchasers are relying upon exemptions from registrationunder the Securities Act for offers and sales of securities which do not involve a public offering,including Rule 144A under the Securities Act. Prospective investors are hereby notified that sellersof the Securities may be relying on the exemption from the provision of Section 5 of the Securities
— iii —

Act provided by Rule 144A. The Securities are subject to restrictions on transferability and resale.Purchasers of the Securities may not transfer or resell the Securities except as permitted under theSecurities Act and applicable state securities laws. See “Transfer Restrictions”.
NOTICE TO NEW HAMPSHIRE RESIDENTS
NEITHER THE FACT THAT A REGISTRATION STATEMENT OR AN APPLICATION FOR ALICENSE HAS BEEN FILED UNDER CHAPTER 421-B OF THE NEW HAMPSHIRE REVISEDSTATUTES WITH THE STATE OF NEW HAMPSHIRE NOR THE FACT THAT A SECURITYIS EFFECTIVELY REGISTERED OR A PERSON IS LICENSED IN THE STATE OF NEWHAMPSHIRE CONSTITUTES A FINDING BY THE SECRETARY OF STATE OF NEWHAMPSHIRE THAT ANY DOCUMENT FILED UNDER RSA 421-B IS TRUE, COMPLETE ANDNOT MISLEADING. NEITHER ANY SUCH FACT NOR THE FACT THAT AN EXEMPTIONOR EXCEPTION IS AVAILABLE FOR A SECURITY OR A TRANSACTION MEANS THATTHE SECRETARY OF STATE HAS PASSED IN ANY WAY UPON THE MERITS ORQUALIFICATIONS OF, OR RECOMMENDED OR GIVEN APPROVAL TO, ANY PERSON,SECURITY, OR TRANSACTION. IT IS UNLAWFUL TO MAKE, OR CAUSE TO BE MADE,TO ANY PROSPECTIVE PURCHASER, CUSTOMER, OR CLIENT ANY REPRESENTATIONINCONSISTENT WITH THE PROVISIONS OF THIS PARAGRAPH.
NOTICE TO PROSPECTIVE INVESTORS IN INDIA
Each of the Initial Purchasers acknowledges that (a) this Offering Circular has not been and will not beregistered, produced or published as an offer document (whether a prospectus in respect of a publicoffer or information memorandum or other offering material in respect of any private placement underthe Companies Act, 1956 or any other applicable Indian laws) with the Registrar of Companies or theSecurities and Exchange Board of India or any other statutory or regulatory body of like nature inIndia, (b) the Securities will not be offered or sold, and have not been offered or sold to any person inIndia by means of any document, other than to persons permitted to acquire the Securities under Indianlaw, whether as a principal or agent, and (c) this Offering Circular or any other offering document ormaterial relating to the Securities will not be circulated or distributed and have not been circulated ordistributed, directly or indirectly, to any person or the public or any member of the public in India orotherwise generally distributed or circulated in India. The Securities have not been offered or sold andwill not be offered or sold in India in circumstances which would constitute an offer of securities(whether to the public or by way of placement) within the meaning of the Companies Act, 1956, or anyother applicable Indian law for the time being in force.
AVAILABLE INFORMATION
To permit compliance with Rule 144A in connection with any resales or other transfers of Securities thatare “restricted securities” within the meaning of the Securities Act, the Issuer has undertaken to furnish,upon the request of a holder of such Securities or any beneficial interest therein, to such holder or to aprospective purchaser designated by him, the information required to be delivered under Rule 144A(d)(4)under the Securities Act if, at the time of the request, any of the Securities remain outstanding as“restricted securities” within the meaning of Rule 144(a)(3) of the Securities Act and the Issuer is neithera reporting company under Section 13 or 15(d) of the U.S. Securities Exchange Act of 1934, as amended,(the “Exchange Act”) nor exempt from reporting pursuant to Rule 12g3-2(b) thereunder.
— iv —

ENFORCEMENT OF CIVIL LIABILITIES
The Issuer is incorporated as a private company with limited liability under the laws of theNetherlands. The agreements entered into with respect to the issue of the Securities are governed bythe laws of the State of New York, except for certain provisions of the Indenture, which are governedby Dutch law. As the United States and The Netherlands currently do not have a treaty providing forthe reciprocal recognition and enforcement of judgments (other than arbitral awards) in civil andcommercial matters, a final judgment for the payment of money rendered by any federal or state courtin the United States which is enforceable in the United States, whether or not predicated solely uponU.S. federal securities laws would not be recognized and enforced by the Dutch courts. However, if aperson has obtained a final and conclusive judgment for the payment of money rendered by a court inthe State of New York which is enforceable in the State of New York and files his claim with thecompetent Dutch court, the Dutch court will generally give binding effect to the judgment of the courtin the State of New York insofar as it finds that the jurisdiction of the court in the State of New Yorkhas been based on grounds which are internationally acceptable and that proper legal procedures havebeen observed and unless the foreign judgment contravenes Dutch public policy.
Subject to the foregoing and service of process in accordance with applicable treaties, investors may beable to enforce in The Netherlands, judgments in civil and commercial matters obtained fromU.S. federal or state courts. However, no assurance can be given that such judgments will beenforceable. In addition, it is doubtful whether a Dutch court would accept jurisdiction and imposecivil liability in an original action commenced in The Netherlands and predicated solely upon U.S.federal securities laws.
BILT and BGPPL are incorporated with limited liability under the laws of India, many of the Group’sDirectors are residents of India and the assets of the Group are substantially located in India. Most ofthe senior management employed by the Group are residents of India. As a result, it may not bepossible for investors to effect service of process upon the Issuer or the Group or such persons outsideIndia, or to enforce judgments obtained against such parties outside India predicated upon the laws ofjurisdictions other than India, including the civil liability provisions of the United States federal orstate securities laws.
In India, recognition and enforcement of foreign judgments is provided for under Section 13 andSection 44A of the Civil Code on a statutory basis. Section 13 of the Civil Code provides that foreignjudgments shall be conclusive regarding any matter directly adjudicated upon, except:
Š where the judgment has not been pronounced by a court of competent jurisdiction;
Š where the judgment has not been given on the merits of the case;
Š where it appears on the face of the proceedings that the judgment is founded on an incorrectview of international law or a refusal to recognize the law of India in cases to which such lawis applicable;
Š where the proceedings in which the judgment was obtained were opposed to natural justice;
— v —

Š where the judgment has been obtained by fraud; or
Š where the judgment sustains a claim founded on a breach of any law then in force in India.
Under the Civil Code, a court in India shall, upon the production of any document purporting to be acertified copy of a foreign judgment, presume that the judgment was pronounced by a court ofcompetent jurisdiction, unless the contrary appears on record.
India is not a signatory to the “Convention on the recognition and enforcement of foreign judgments incivil and commercial matters” or any other international treaty in relation to the recognition orenforcement of foreign judgments. Section 44A of the Civil Code provides that where a foreignjudgment has been rendered by a superior court, within the meaning of such section, in any country orterritory outside India which the Government has by notification declared to be a reciprocatingterritory, it may be enforced in India by proceedings in execution as if the judgment had been renderedby the relevant court in India. However, Section 44A of the Civil Code is applicable only to monetarydecrees not being of the same nature as amounts payable in respect of taxes, other charges of a likenature or of a fine or other penalties and does not include arbitration awards. Furthermore, theexecution of the foreign decree under Section 44A of the Civil Code is also subject to the exceptionsunder Section 13 of the Civil Code, as discussed above.
The United Kingdom, Singapore and Hong Kong have been declared by the Government of India to bereciprocating territories for the purposes of Section 44A of the Civil Code, but the United States hasnot been so declared. A judgment of a court of a country which is not a reciprocating territory may beenforced only by a new proceeding suit instituted in a court of India and not by proceedings inexecution. Such a suit has to be filed in India within three years from the date of the judgment in thesame manner as any other suit filed to enforce a civil liability in India. It is unlikely that a court inIndia would award damages on the same basis as a foreign court if an action was brought in India.Furthermore, it is unlikely that an Indian court would enforce foreign judgments if that court were ofthe view that the amount of damages awarded was excessive or inconsistent with Indian public policy.A party seeking to enforce a foreign judgment in India is required to obtain approval from the ReserveBank of India (the “RBI”) to repatriate outside India any amount recovered pursuant to the executionof such a judgment and such amount may be subject to income tax in accordance with applicable laws.In addition, any judgment in a foreign currency would be converted into Indian Rupees on the date ofthe judgment and not on the date of payment.
PRESENTATION OF FINANCIAL AND OTHER INFORMATION
Financial Data
All historical financial information in this Offering Circular is that of the Issuer, its consolidatedsubsidiaries (including the Issuer) and subsidiary undertakings (together, the “Group”). In this OfferingCircular, unless otherwise specified, all financial information is of the Group.
— vi —

The audited consolidated financial information of the Issuer, as at and for the fiscal years endedJune 30, 2008, 2009 and 2010 (the “Historical Consolidated Financial Information”) has been preparedin accordance with International Financial Reporting Standards as adopted by the European Union(“IFRS-EU”).
The Historical Consolidated Financial Information has been prepared for the proposed offering of theSecurities by the Issuer. This financial information is different from the historical statutory financialstatements of the Issuer because it does not include certain disclosures relating to the Dutch civil code,including a director’s report and other information and because it applies predecessor basis ofaccounting for the year ended June 30, 2008.
The unaudited consolidated interim financial information of the Issuer for the nine months endedMarch 31, 2010 and 2011 (the “Unaudited Consolidated Interim Financial Information”), includedelsewhere in this Offering Circular, has been prepared in accordance with IAS 34 Interim FinancialReporting, as adopted by the European Union (“IAS 34”).
Independent Third Party Report
This Offering Circular includes information from a report dated February 10, 2011 prepared by Pöyry,an independent third party. The report is included as an annexure to this Offering Circular. Pöyry hasprovided written consent to this report being included in the Offering Circular.
Non-GAAP Financial Measures
As used in this Offering Circular, a non-GAAP financial measure is one that purports to measurehistorical or future financial performance, financial position or cash flows, but excludes or includesamounts that would not be so adjusted in the most comparable IFRS-EU measures. From time to time,reference is made in this Offering Circular to such “non-GAAP financial measures”, primarilyEBITDA, which comprises operating profit adjusted for depreciation charges. Information regardingEBITDA or similar measures is sometimes used by investors to evaluate the efficiency of a company’soperations and its ability to employ its earnings toward repayment of debt, capital expenditures andworking capital requirements. There are no generally accepted principles governing the calculation ofEBITDA or similar measures and the criteria upon which EBITDA or similar measures are based canvary from company to company. EBITDA, by itself, does not provide a sufficient basis to compare theGroup’s performance with that of other companies and should not be considered in isolation or as asubstitute for operating profit or any other measure as an indicator of operating performance, or as analternative to cash generated from operating activities as a measure of liquidity.
— vii —

The reconciliation of Group results from operating activities to EBITDA is as follows:
For the year ended June 30Nine months ended
March 31
2008 2009 2010 2010 2011
(unaudited)US$
millionUS$
millionUS$
millionUS$
millionUS$
million
Operating profit . . . . . . . . . . . . . . . . . . . . . . . . . . . . . . . . . . . . . . . . 69.06 51.50 95.33 66.06 65.04Add back depreciation . . . . . . . . . . . . . . . . . . . . . . . . . . . . . . . . . . 32.07 31.74 39.38 28.68 33.58
EBITDA . . . . . . . . . . . . . . . . . . . . . . . . . . . . . . . . . . . . . . . . . . . . . . 101.13 83.23 134.71 94.74 98.62
The Issuer uses EBITDA in the management reporting of its segments and in assessing the Group’sgrowth and operational efficiencies. The Issuer’s management believes that EBITDA and othernon-GAAP financial measures provide investors with additional information about the Group’sperformance, as well as ability to incur and service debt and make capital expenditures, and aremeasures commonly used by investors. The non-GAAP financial measures described herein are not asubstitute for IFRS-EU measures of earnings and may not be comparable to similarly titled measuresreported by other companies due to differences in the way these measures are calculated.
Rounding
Certain data in this document, including financial, statistical, and operating information has beenrounded. As a result of the rounding, the totals of data presented in this document may vary slightlyfrom the actual arithmetic totals of such data. Percentages in tables have been rounded and accordinglymay not add up to 100%.
Currency presentation
Unless otherwise indicated, all references to “US dollars” or “US$” are to the lawful currency of theUnited States. All references to the “rupee” or “INR” are to the lawful currency of India. All referencesto the “euro”, “EUR” or “€” are to the currency introduced at the start of the third stage of Europeaneconomic and monetary union pursuant to the Treaty establishing the European Community, asamended. All references to “ringgits” or “MYR” are to the lawful currency of Malaysia.
— viii —

Exchange rate information
The average exchange rates of the Group’s main trading currencies, other than US dollars, are shownrelative to US dollars below. The average rates in the table below are daily weighted averages, but theyare not necessarily the rates used to translate the Group’s results due to the seasonality of its earnings.These exchange rates should not be construed as representations that the relevant currency could beconverted into US dollars at the rate indicated or at any other rate:
Average rate against US dollars on rupee euro ringgit
June 30, 2008 . . . . . . . . . . . . . . . . . . . . . . . . . . . . . . . . . . . . . . . . . . . . . . . . . . . . . . . . 43.0051 0.6336 3.2659June 30, 2009 . . . . . . . . . . . . . . . . . . . . . . . . . . . . . . . . . . . . . . . . . . . . . . . . . . . . . . . . 47.9450 0.7102 3.5216June 30, 2010 . . . . . . . . . . . . . . . . . . . . . . . . . . . . . . . . . . . . . . . . . . . . . . . . . . . . . . . . 46.5425 0.8173 3.2519January 31, 2011 . . . . . . . . . . . . . . . . . . . . . . . . . . . . . . . . . . . . . . . . . . . . . . . . . . . . . 45.9556 0.7323 3.0600February 28, 2011 . . . . . . . . . . . . . . . . . . . . . . . . . . . . . . . . . . . . . . . . . . . . . . . . . . . . 45.2400 0.7255 3.0520March 31, 2011 . . . . . . . . . . . . . . . . . . . . . . . . . . . . . . . . . . . . . . . . . . . . . . . . . . . . . . 44.6287 0.7055 3.0256April 30, 2011 . . . . . . . . . . . . . . . . . . . . . . . . . . . . . . . . . . . . . . . . . . . . . . . . . . . . . . . 44.3450 0.6738 2.9697May 31, 2011 . . . . . . . . . . . . . . . . . . . . . . . . . . . . . . . . . . . . . . . . . . . . . . . . . . . . . . . . 45.0325 0.6970 3.0093June 30, 2011 . . . . . . . . . . . . . . . . . . . . . . . . . . . . . . . . . . . . . . . . . . . . . . . . . . . . . . . . 44.7197 0.6905 3.0218
Average rate against US dollars for the year ended rupee euro ringgit
June 30, 2008 . . . . . . . . . . . . . . . . . . . . . . . . . . . . . . . . . . . . . . . . . . . . . . . . . . . . . . . . 40.3653 0.6814 3.3158June 30, 2009 . . . . . . . . . . . . . . . . . . . . . . . . . . . . . . . . . . . . . . . . . . . . . . . . . . . . . . . . 47.6558 0.7310 3.5156June 30, 2010 . . . . . . . . . . . . . . . . . . . . . . . . . . . . . . . . . . . . . . . . . . . . . . . . . . . . . . . . 46.6745 0.7215 3.3842
Average rate against US dollars for the nine months ended rupee euro ringgit
March 31, 2010 . . . . . . . . . . . . . . . . . . . . . . . . . . . . . . . . . . . . . . . . . . . . . . . . . . . . . . 47.0109 0.6997 3.4313March 31, 2011 . . . . . . . . . . . . . . . . . . . . . . . . . . . . . . . . . . . . . . . . . . . . . . . . . . . . . . 45.5388 0.7472 3.1058
Average rate against US dollars for the month ended rupee euro ringgit
January 31, 2011 . . . . . . . . . . . . . . . . . . . . . . . . . . . . . . . . . . . . . . . . . . . . . . . . . . . . . 45.4095 0.7480 3.0610February 28, 2011 . . . . . . . . . . . . . . . . . . . . . . . . . . . . . . . . . . . . . . . . . . . . . . . . . . . . 45.4390 0.7320 3.0445March 31, 2011 . . . . . . . . . . . . . . . . . . . . . . . . . . . . . . . . . . . . . . . . . . . . . . . . . . . . . . 44.9783 0.7133 3.0355April 30, 2011 . . . . . . . . . . . . . . . . . . . . . . . . . . . . . . . . . . . . . . . . . . . . . . . . . . . . . . . 44.3649 0.6910 3.0110May 31, 2011 . . . . . . . . . . . . . . . . . . . . . . . . . . . . . . . . . . . . . . . . . . . . . . . . . . . . . . . . 44.9289 0.6982 3.0148June 30, 2011 . . . . . . . . . . . . . . . . . . . . . . . . . . . . . . . . . . . . . . . . . . . . . . . . . . . . . . . . 44.8441 0.6944 3.0287
Source: Bloomberg
As at June 30, 2011 the exchange rate of the rupee per US dollar was 44.7197 and the euro per USdollar was 0.6905 and the Ringgit per US dollar was 3.0218.
Weight presentation
Unless otherwise indicated, all references in this document to “Mt” or “tonnes” are to metric tonnes(approximately 2,204.6 pounds or 1.1 short tons). All references to “tpa” are to metric tonnesper annum.
— ix —

Definitions and Glossary
Certain terms used in this document, including all capitalized terms and certain technical and otherterms, are defined and explained in the section entitled “Definitions and Glossary”.
Information regarding forward-looking statements
Certain statements in this Offering Circular are not historical facts and are “forward-lookingstatements” within the meaning of Section 27A of the Securities Act and Section 21E of the ExchangeAct. This Offering Circular may contain words such as “believe”, “could”, “may”, “will”, “target”,“estimate”, “project”, “predict”, “forecast”, “guideline”, “should”, “plan”, “expect” and “anticipate”and similar expressions that are intended to identify forward-looking statements, but are not theexclusive means of identifying these statements. All statements regarding the Issuer’s or the Group’sexpected financial condition and results of operations and business plans and prospects are forward-looking statements. In particular, “Summary”, “Management’s Discussion and Analysis of FinancialCondition and Results of Operations” and “Business” contain forward-looking statements, includingrelating to market trends, capital expenditure and other factors affecting the Group that are nothistorical facts.
Forward-looking statements are subject to certain risks and uncertainties, including, but not limited to:
Š changes in global economic, political and social conditions;
Š changes in economic and political conditions and increases in regulatory burdens in India andother countries in which the Group operates, transacts business or has interests;
Š accidents and natural disasters in India, Malaysia or in other countries in which the Groupoperates or globally, including specifically India’s neighboring countries;
Š increased competition in the Indian paper industry;
Š effects of a decrease in the level of tariffs imposed on paper imported into India;
Š effects of fluctuations in interest rates and changes in credit ratings upon the cost of borrowing;
Š changes in customer preferences;
Š effects of insufficient insurance;
Š high compliance or clean-up costs under environmental and health and safety laws andregulations;
Š increased labor costs and/or labor disruptions.
Š the Group’s business and operating strategies and its ability to implement such strategies;
— x —

Š the Group’s ability to successfully implement its growth and expansion plans, technologicalchanges, exposure to market risks and foreign exchange risks that have an impact on itsbusiness activities;
Š the Group’s ability to ensure continuity of senior management and ability to attract and retainkey personnel;
Š the availability and terms of external financing;
Š cost overruns or delays in commencement of production from the Group’s new projects;
Š changes in the Group’s relationship with the governments of the countries in which the Groupoperates;
Š changes in exchange controls, import controls or import duties, levies or taxes in the countriesin which the Group operates;
Š changes in laws, regulations, taxation or accounting standards or practices that affect theGroup;
Š changes in prices or demand for the goods and services provided by the Group;
Š the risks of increased costs in technologies related to the Group’s operations and theuncertainty of such technologies producing expected results;
Š changes in the value of the Indian Rupee or Malaysian Ringgit against the US dollar and othermajor global currencies and other currency changes;
Š the ability of third parties to perform in accordance with contractual terms and specifications;
Š acquisitions and divestitures which the Group may undertake; and
Š other factors, including those discussed in “Risk Factors”.
Forward-looking statements involve inherent risks and uncertainties. If one or more of these or otheruncertainties or risks materialize, actual results may vary materially from those estimated, anticipatedor projected. Specifically, but without limitation, capital costs could increase, projects could bedelayed, and anticipated improvements in capacity, performance or profit levels might not be fullyrealized. Although the Issuer believes that the expectations of its management as reflected by suchforward-looking statements are reasonable based on information currently available to it, no assurancescan be given that such expectations will prove to have been correct. Accordingly, you are cautioned notto place undue reliance on the forward-looking statements, which speak only as of the date they aremade. The Issuer does not undertake any obligation to update or revise any of them, whether as a resultof new information, future developments or otherwise.
— xi —

CONTENTS
Section Page
NOTICE TO INVESTORS . . . . . . . . . . . . . . . . . . . . . . . . . . . . . . . . . . . . . . . . . . . . . . . . . . . . . . . . . . . . . . . i
U.S. INFORMATION . . . . . . . . . . . . . . . . . . . . . . . . . . . . . . . . . . . . . . . . . . . . . . . . . . . . . . . . . . . . . . . . . . . iii
NOTICE TO NEW HAMPSHIRE RESIDENTS . . . . . . . . . . . . . . . . . . . . . . . . . . . . . . . . . . . . . . . . . . . . . . iv
NOTICE TO PROSPECTIVE INVESTORS IN INDIA . . . . . . . . . . . . . . . . . . . . . . . . . . . . . . . . . . . . . . . . iv
AVAILABLE INFORMATION . . . . . . . . . . . . . . . . . . . . . . . . . . . . . . . . . . . . . . . . . . . . . . . . . . . . . . . . . . . iv
ENFORCEMENT OF CIVIL LIABILITIES . . . . . . . . . . . . . . . . . . . . . . . . . . . . . . . . . . . . . . . . . . . . . . . . . v
PRESENTATION OF FINANCIAL AND OTHER INFORMATION . . . . . . . . . . . . . . . . . . . . . . . . . . . . . vii
DEFINITIONS AND GLOSSARY . . . . . . . . . . . . . . . . . . . . . . . . . . . . . . . . . . . . . . . . . . . . . . . . . . . . . . . . 2
SUMMARY . . . . . . . . . . . . . . . . . . . . . . . . . . . . . . . . . . . . . . . . . . . . . . . . . . . . . . . . . . . . . . . . . . . . . . . . . . 7
SUMMARY CONSOLIDATED FINANCIAL DATA OF THE GROUP . . . . . . . . . . . . . . . . . . . . . . . . . . 20
THE OFFER . . . . . . . . . . . . . . . . . . . . . . . . . . . . . . . . . . . . . . . . . . . . . . . . . . . . . . . . . . . . . . . . . . . . . . . . . . 23
RISK FACTORS . . . . . . . . . . . . . . . . . . . . . . . . . . . . . . . . . . . . . . . . . . . . . . . . . . . . . . . . . . . . . . . . . . . . . . . 31
USE OF PROCEEDS . . . . . . . . . . . . . . . . . . . . . . . . . . . . . . . . . . . . . . . . . . . . . . . . . . . . . . . . . . . . . . . . . . . 57
CAPITALIZATION . . . . . . . . . . . . . . . . . . . . . . . . . . . . . . . . . . . . . . . . . . . . . . . . . . . . . . . . . . . . . . . . . . . . 58
SELECTED CONSOLIDATED FINANCIAL DATA OF THE GROUP . . . . . . . . . . . . . . . . . . . . . . . . . . . 59
MANAGEMENT’S DISCUSSION AND ANALYSIS OF FINANCIAL CONDITION AND RESULTSOF OPERATIONS . . . . . . . . . . . . . . . . . . . . . . . . . . . . . . . . . . . . . . . . . . . . . . . . . . . . . . . . . . . . . . . . . . . 62
BUSINESS . . . . . . . . . . . . . . . . . . . . . . . . . . . . . . . . . . . . . . . . . . . . . . . . . . . . . . . . . . . . . . . . . . . . . . . . . . . 94
INDUSTRY AND MARKET OVERVIEW . . . . . . . . . . . . . . . . . . . . . . . . . . . . . . . . . . . . . . . . . . . . . . . . . . 153
RELATIONSHIP WITH THE BALLARPUR GROUP AND THE AVANTHA GROUP . . . . . . . . . . . . . . 162
MANAGEMENT AND CORPORATE GOVERNANCE . . . . . . . . . . . . . . . . . . . . . . . . . . . . . . . . . . . . . . . 165
DESCRIPTION OF INDEBTEDNESS . . . . . . . . . . . . . . . . . . . . . . . . . . . . . . . . . . . . . . . . . . . . . . . . . . . . . 170
DESCRIPTION OF THE PERPETUAL CAPITAL SECURITIES . . . . . . . . . . . . . . . . . . . . . . . . . . . . . . . . 179
TAXATION . . . . . . . . . . . . . . . . . . . . . . . . . . . . . . . . . . . . . . . . . . . . . . . . . . . . . . . . . . . . . . . . . . . . . . . . . . 205
PLAN OF DISTRIBUTION . . . . . . . . . . . . . . . . . . . . . . . . . . . . . . . . . . . . . . . . . . . . . . . . . . . . . . . . . . . . . . 215
TRANSFER RESTRICTIONS . . . . . . . . . . . . . . . . . . . . . . . . . . . . . . . . . . . . . . . . . . . . . . . . . . . . . . . . . . . . 222
LEGAL MATTERS . . . . . . . . . . . . . . . . . . . . . . . . . . . . . . . . . . . . . . . . . . . . . . . . . . . . . . . . . . . . . . . . . . . . 225
INDEPENDENT AUDITORS . . . . . . . . . . . . . . . . . . . . . . . . . . . . . . . . . . . . . . . . . . . . . . . . . . . . . . . . . . . . 225
GENERAL INFORMATION . . . . . . . . . . . . . . . . . . . . . . . . . . . . . . . . . . . . . . . . . . . . . . . . . . . . . . . . . . . . . 226
INDEX TO CONSOLIDATED FINANCIAL INFORMATION . . . . . . . . . . . . . . . . . . . . . . . . . . . . . . . . . . F-1
PÖYRY REPORT . . . . . . . . . . . . . . . . . . . . . . . . . . . . . . . . . . . . . . . . . . . . . . . . . . . . . . . . . . . . . . . . . . . . . . A-1
— 1 —

DEFINITIONS AND GLOSSARY
Definitions
The following definitions apply throughout this document unless the context requires otherwise:
“AIA” . . . . . . . . . . . . . . . . . . . . . . . . . . . Avantha International Asset BV
“Avantha” . . . . . . . . . . . . . . . . . . . . . . . . Avantha Holdings Limited
“Avantha Group” . . . . . . . . . . . . . . . . . . . Avantha Holdings Limited and its subsidiaries and subsidiaryundertakings, excluding for these purposes the Ballarpur Group
“Avantha Power” . . . . . . . . . . . . . . . . . . . Avantha Power & Infrastructure Limited and its subsidiaries andsubsidiary undertakings, a part of the Avantha Group
“Ballarpur Group” . . . . . . . . . . . . . . . . . . BILT and its subsidiaries and subsidiary undertakings, excluding forthese purposes the Group
“Ballarpur unit” . . . . . . . . . . . . . . . . . . . . the manufacturing unit located in Ballarpur in District Chandrapur,Maharashtra in Central India
“BGPPL” . . . . . . . . . . . . . . . . . . . . . . . . . BILT Graphic Paper Products Limited
“Bhigwan unit” . . . . . . . . . . . . . . . . . . . . the manufacturing unit located in Bhadalwadi, Maharashtra inWestern India
“BIGPH” . . . . . . . . . . . . . . . . . . . . . . . . . Ballarpur International Graphic Paper Holdings B.V., the Issuer
“BIH” . . . . . . . . . . . . . . . . . . . . . . . . . . . Ballarpur International Holdings B.V., the direct parent company ofthe Issuer
“BILT” . . . . . . . . . . . . . . . . . . . . . . . . . . Ballarpur Industries Limited, the indirect majority shareholder of theIssuer
“BIPH” . . . . . . . . . . . . . . . . . . . . . . . . . . Ballarpur International Paper Holdings B.V., formerly a direct 100%owned subsidiary of BPH. On June 30, 2011, BIPH was merged intoBPH and ceased to exist.
“Board” . . . . . . . . . . . . . . . . . . . . . . . . . . the board of directors of the Issuer
“Bombay Stock Exchange” . . . . . . . . . . . Bombay Stock Exchange Limited
— 2 —
“BPH” . . . . . . . . . . . . . . . . . . . . . . . . . . . Ballarpur Paper Holdings B.V., a directly owned 100% subsidiary ofthe Issuer
“BTTL” . . . . . . . . . . . . . . . . . . . . . . . . . . BILT Tree Tech Limited
“CAGR” . . . . . . . . . . . . . . . . . . . . . . . . . compound annual growth rate
“Civil Code” . . . . . . . . . . . . . . . . . . . . . . The Code of Civil Procedure of India, 1908 as amended
“Code” . . . . . . . . . . . . . . . . . . . . . . . . . . . The U.S. Internal Revenue Code of 1986, as amended
“CCDs” . . . . . . . . . . . . . . . . . . . . . . . . . . compulsory convertible debentures
“EU” . . . . . . . . . . . . . . . . . . . . . . . . . . . . the European Union
“FSC-COC” . . . . . . . . . . . . . . . . . . . . . . . Forest Stewardship Council — Chain of Custody
“Group” . . . . . . . . . . . . . . . . . . . . . . . . . . The Issuer and its consolidated subsidiaries and subsidiaryundertakings
“IAS 34” . . . . . . . . . . . . . . . . . . . . . . . . . International Accounting Standard 34 Interim Financial Reporting asadopted by the European Union
“IFRS-EU” . . . . . . . . . . . . . . . . . . . . . . . International Financial Reporting Standards, as adopted by theEuropean Union
“India” . . . . . . . . . . . . . . . . . . . . . . . . . . . Republic of India
“Indian Stock Exchanges” . . . . . . . . . . . . Bombay Stock Exchange and National Stock Exchange
“Issuer” . . . . . . . . . . . . . . . . . . . . . . . . . . Ballarpur International Graphic Paper Holdings B.V.
“ITC” . . . . . . . . . . . . . . . . . . . . . . . . . . . . Integrated Timber Complex
“J.P. Morgan Mauritius” . . . . . . . . . . . . . J.P. Morgan Mauritius Holdings VII Ltd
“Joint Bookrunners” . . . . . . . . . . . . . . . . HSBC and RBS
“Joint Lead Managers” . . . . . . . . . . . . . . HSBC and RBS
“Kamalapuram unit” . . . . . . . . . . . . . . . . the manufacturing unit located in District Warangal, Andhra Pradeshin Southern India
— 3 —

“Lathe Investment” . . . . . . . . . . . . . . . . . Lathe Investment Pte Ltd
“Managing Directors” . . . . . . . . . . . . . . . the managing directors of the Issuer identified in “Management andCorporate Governance” of this document
“National Stock Exchange” . . . . . . . . . . . National Stock Exchange of India Limited
“Offer” . . . . . . . . . . . . . . . . . . . . . . . . . . . the offer of Securities by the Issuer as described in “The Offer”
“Offering Price” . . . . . . . . . . . . . . . . . . . the price at which each Security is to be issued or sold under the Offer
“Official List” . . . . . . . . . . . . . . . . . . . . . the Official List of the Singapore Stock Exchange
“PwC” . . . . . . . . . . . . . . . . . . . . . . . . . . . PricewaterhouseCoopers Accountants N.V.
“qualified institutional buyers” or“QIBs” . . . . . . . . . . . . . . . . . . . . . . . . . has the meaning given by Rule 144A
“Regulation S” . . . . . . . . . . . . . . . . . . . . . Regulation S under the US Securities Act
“Rule 144A” . . . . . . . . . . . . . . . . . . . . . . Rule 144A under the US Securities Act
“Securities” . . . . . . . . . . . . . . . . . . . . . . . the Issuer’s US$200,000,000 Subordinated Perpetual CapitalSecurities
“Securities Holders” . . . . . . . . . . . . . . . . the holders of Securities
“Senior Managers” . . . . . . . . . . . . . . . . . the Senior Managers identified in “Management and CorporateGovernance” of this document
“SFI” . . . . . . . . . . . . . . . . . . . . . . . . . . . . Sabah Forest Industries Sdn. Bhd., an indirect 97.8% ownedsubsidiary of the Issuer
“SFI unit” . . . . . . . . . . . . . . . . . . . . . . . . the SFI manufacturing unit located in the Malaysian State of Sabah
“Singapore Stock Exchange” . . . . . . . . . Singapore Exchange Securities Trading Limited
“SMI” . . . . . . . . . . . . . . . . . . . . . . . . . . . SMI NewQuest (India) Private Limited
“UK” . . . . . . . . . . . . . . . . . . . . . . . . . . . . the United Kingdom of Great Britain, Northern Ireland, Guernsey,Jersey and the Isle of Man
“Underwriting Agreement” . . . . . . . . . . . the underwriting agreement expected to be entered into between theIssuer, the Directors and the Joint Lead Managers.
— 4 —

“United States” or “US” . . . . . . . . . . . . . the United States of America, its territories and possessions, any Stateof the United States of America, and the District of Columbia
“units” . . . . . . . . . . . . . . . . . . . . . . . . . . . the Group’s manufacturing facilities consisting of the Ballarpur unit,the Bhigwan unit, the Kamalapuram unit and the SFI unit
“US Exchange Act” . . . . . . . . . . . . . . . . . United States Securities Exchange Act of 1934, as amended
“US Securities Act” . . . . . . . . . . . . . . . . . United States Securities Act of 1933, as amended
Glossary
BCB . . . . . . . . . . . . . . . . . . . . . . . . . . . . . black centered board
BCTMP . . . . . . . . . . . . . . . . . . . . . . . . . . bleached chemi-thermomechanical pulp
coated paper board . . . . . . . . . . . . . . . . . thick paper-based material with a coating to improve whiteness,smoothness or gloss
Creamwove . . . . . . . . . . . . . . . . . . . . . . . uncoated wood-free paper that has been made on a woven wire mesh
Depot . . . . . . . . . . . . . . . . . . . . . . . . . . . . a transportation hub for the distribution of goods
GDP . . . . . . . . . . . . . . . . . . . . . . . . . . . . . gross domestic product, the total value of goods and servicesproduced by a country
Gsm . . . . . . . . . . . . . . . . . . . . . . . . . . . . . grams per square meter
Hi-bright . . . . . . . . . . . . . . . . . . . . . . . . . paper with an ISO brightness above 88%
low bright . . . . . . . . . . . . . . . . . . . . . . . . paper with an ISO brightness below 88%
m3/tonne . . . . . . . . . . . . . . . . . . . . . . . . . cubic meters per tonne
Mt . . . . . . . . . . . . . . . . . . . . . . . . . . . . . . metric tonnes (approximately 2,204.6 pounds or 1.1 short tons)
MW . . . . . . . . . . . . . . . . . . . . . . . . . . . . . megawatts
non surface sized . . . . . . . . . . . . . . . . . . . paper that has not been treated with starch or other sizing material atthe size process of the paper machine
paper grade pulp . . . . . . . . . . . . . . . . . . . pulp of quality suitable for the production of paper
PBS . . . . . . . . . . . . . . . . . . . . . . . . . . . . . premium business stationery
— 5 —

pulp . . . . . . . . . . . . . . . . . . . . . . . . . . . . . the principal raw material used for the manufacture of paper. Thesuitability of specific types of pulp for the required end use dependsboth on the type of wood used to make the pulp and on the woodpulping process. Hardwood trees are used to produce hardwood pulpwhich has short fibers and is generally better suited to manufacturingcoated packaging boards, coated and uncoated wood-free paper andtissues
rayon grade pulp . . . . . . . . . . . . . . . . . . . pulp chemically treated in order to regenerate pure cellulose fiber
surface sized . . . . . . . . . . . . . . . . . . . . . . paper that has been treated with starch or other sizing material at thesize press of the paper machine
tonnes . . . . . . . . . . . . . . . . . . . . . . . . . . . metric tonnes (approximately 2,204.6 pounds or 1.1 short tons)
tpa . . . . . . . . . . . . . . . . . . . . . . . . . . . . . . metric tonnes per annum
virgin grade packaging board . . . . . . . . . paperboard for folding cartons and other packaging produced fromnon-recycled sources
wood-free paper . . . . . . . . . . . . . . . . . . . . paper that is based on chemical pulp rather than mechanical pulp.Chemical pulp is normally made from pulpwood, which is timbergrown with the principal purpose of making wood pulp for paperproduction. Pulpwood is not considered wood as most of the lignin isremoved and separated from the cellulose fibers in the processing
— 6 —

SUMMARY
This overview highlights certain information contained in this Offering Circular. This overview doesnot contain all the information you should consider before investing in the Securities. You should readthis entire Offering Circular carefully, including the sections entitled “Information RegardingForward-Looking Statements”, “Risk Factors”, “Management’s Discussion and Analysis of FinancialCondition and Results of Operations” and “Business” included elsewhere in this Offering Circular andthe financial information and the Issuer’s US$200,000,000 Subordinated Perpetual Capital Securities(the “Securities”) thereto set forth herein. To understand the terms of the Securities, you shouldcarefully read the section of this Offering Circular entitled “Description of the Perpetual CapitalSecurities”.
Information on the Group
The Group is India’s largest producer of writing and printing paper and Malaysia’s largest producer ofuncoated wood-free paper products, as measured by volume of paper produced. The Group has a66 year history in India, and SFI, which was acquired by the Group in March 2007, has a 29 yearhistory in Malaysia. The Group is a part of the Avantha Group, which is a diversified business groupwith a portfolio spanning paper and pulp, power equipment and services, energy and infrastructure,food processing, chemicals and information technology and services. The Group is also the leadingproducer and seller of market rayon grade pulp in India. The Group’s paper, hardwood pulp and rayongrade pulp manufacturing operations span across four production units: the Ballarpur unit, the Bhigwanunit and the Kamalapuram unit in India and the SFI unit in Malaysia.
As of the year ended December 31, 2009, the Group had a 24% market share in the Hi-bright uncoatedwood-free paper segment in India (as compared to a market share of 13% for the Issuer’s parentcompany, BILT, and a market share of 12% for Tamil Nadu Newsprint and Papers Limited (“TNPL”), acompetitor of the Group) and a 51% market share in the blade coated wood-free paper segment in India(as compared to a market share of 11% for its next closest Indian competitor, JK Paper), as reported byPöyry.
The Group’s business model is based on vertical integration where it seeks to achieve control over thecost of key inputs and operating flexibility to maximize value across the entire value chain. The Groupmaintains its own forest plantations, power facilities, facilities for the production of chemicals requiredfor the paper and hardwood pulp production and extensive hardwood pulp production capacity, all ofwhich provides a high degree of vertical integration.
The Group’s operations have grown significantly since 2008. Since June 30, 2008, the Group’s annualpaper production capacity has increased by 88%, from 403,710 tpa to 758,710 tpa as at March 31,2011. The Group is also currently expanding its hardwood pulp production capacity at both the SFIunit and the Ballarpur unit. The SFI expansion is intended to create a total net increase in hardwoodpulp capacity of 120,000 tpa and the Ballarpur expansion is expected to create a total net increase of170,000 tpa (with new capacity at the Ballarpur unit totalling 300,000 tpa, replacing existing capacityof 130,000 which is being retired). The Issuer expects its total hardwood pulp production capacity tobe 540,000 tpa by the end of 2012 (excluding capacity of 98,550 tpa at the Kamalapuram unit which is
— 7 —

intended to produce rayon grade pulp). The increased hardwood pulp production will reduce theGroup’s cost of hardwood pulp for paper production, secure a source for the Group’s key raw materialinput and reduce exposure to the volatility in market prices for hardwood pulp.
The Group’s production capacity with respect to paper, hardwood pulp and rayon grade pulp as atMarch 31, 2011 is shown below:
At March 31, 2011
Unit (tpa) PaperHardwood
Pulp
RayonGradePulp
Ballarpur . . . . . . . . . . . . . . . . . . . . . . . . . . . . . . . . . . . . . . . . . . . . . . . . . . . . . . . . . . 299,500 130,000 —Bhigwan . . . . . . . . . . . . . . . . . . . . . . . . . . . . . . . . . . . . . . . . . . . . . . . . . . . . . . . . . . 315,000 — —Kamalapuram . . . . . . . . . . . . . . . . . . . . . . . . . . . . . . . . . . . . . . . . . . . . . . . . . . . . . . — — 98,550SFI . . . . . . . . . . . . . . . . . . . . . . . . . . . . . . . . . . . . . . . . . . . . . . . . . . . . . . . . . . . . . . . 144,210 120,000
Total . . . . . . . . . . . . . . . . . . . . . . . . . . . . . . . . . . . . . . . . . . . . . . . . . . . . . . . . . . . . . 758,710 250,000 98,550
Due to the low level of per capita paper consumption in India, the Issuer believes that there issignificant room for growth in demand and, according to Pöyry, the average per capita consumption ofpaper in India is expected to grow from 8.4 kg in 2009 to 13.9 kg by 2020. Pöyry estimates that thesize of the Indian paper market will rise from 10.1 million tonnes in 2009 to 19.2 million tonnes by2020. Consequently, Pöyry anticipates that the compound annual growth rate of paper demand in Indiafrom 2009 to 2020 will be 6.0%, which is higher than China (4.5%), the rest of Asia (excluding Chinaand India) (2.6%) and significantly higher than Western Europe (0.6%), North America (0.5%) andJapan (-0.2%). Indian demand for coated and uncoated wood free paper products is expected to grow9.3% and 6.4%, respectively, per year between 2009 and 2020. Furthermore, with respect to theGroup’s primary products, blade coated wood free paper and Hi bright uncoated wood free paper,demand is expected to grow 10.2% and 8.1%, respectively, per year between 2009 and 2020 (Source:Pöyry).
Competitive strengths
The Issuer believes its competitive strengths include the following:
Operations in high growth markets
The primary drivers of demand for wood-free paper are GDP growth and increased per capita income.These factors, in turn, provide a foundation for other drivers of demand for wood-free paper, includingincreased spending in the marketing industry, disposable income, government spending on educationand literacy rates. India’s GDP is projected to grow at an annual growth rate of approximately 8% until2020 and is projected to be the 3rd largest global economy by 2050 moving up from its current positionof 5th. India’s share of global GDP is expected to rise to 13% by 2050, from the current share of 2%.This growth is expected to have significant positive effects on increased per capita income, disposableincome and customer purchasing power in India. A shift in discretionary spending in India is projected
— 8 —

to rise from 52% of total private spending to 70% between 2005 and 2025 and a substantial increase inIndia’s middle class are key drivers of increases in per capita disposable income. India’s middle classis expected to increase by approximately 60 million households by 2020, with an increase in the urbanpopulation from 29% in 2005 to 37% in 2025 while India’s population of a working age is projected tobe the largest by 2050. Further, government spending on education was estimated to total US$10.7billion from 2002 through the end of 2011 of which US$6 billion is on paper related products. TheGroup believes that this increased expenditure, along with other social and demographic trends, willimpact literacy rates significantly and the demand for paper products such as books and notebooksduring the next decade.
As a result, per capita consumption of paper and paperboard (including coated and uncoated wood-freepaper) from 2009 to 2020 is expected to increase by approximately 66% from approximately 8.4 kg peryear to approximately 13.9 kg per year. Pöyry estimates that total consumption will increase from10.1 million tonnes in 2009 to 19.2 million tonnes in 2020, representing a compound annual growthrate of 6.0%, as compared to 4.5% in China, 0.5% in North America. The projection for demand inIndia is based primarily on the projection of sustained economic growth at approximately 8%, as wellas population growth of 1.3% per year through 2020.
According to Pöyry, as the Indian middle class and paper consumption grows, there is likely to be ashift to higher quality, such as coated paper. Consumption of coated wood-free paper as a percentageof writing and printing wood-free paper globally was 32% in 2009, similar consumption in India was13%. In addition, according to Pöyry, consumption of blade coated wood-free paper (generallyconsidered higher quality coated paper) has grown by 14% from 2009 through 2010, whileconsumption of knife coated and other coated wood-free paper has declined as a percentage of totalconsumption during this period. As such, demand for coated and uncoated wood-free paper in India isexpected to grow by 9.3% and 6.4%, respectively per year from 2009 through 2020, while the growthrates for the Group’s primary products, blade coated wood-free paper and Hi-bright uncoated wood-free paper are expected to reach 10.2% and 8.1% during this period, respectively (source: Pöyry).
Market leadership
For over 50 years, the Group (together with its predecessors) has been a leading writing and printingpaper producer in India. The Group holds a dominant position in the blade coated wood-free papersegment in India with a 51% market share for the year ended December 31, 2009, as compared to amarket share of 11% for the year ended December 31, 2009 for its closest domestic competitor (source:Pöyry). The Group holds a leading share of the high quality Hi-bright uncoated wood-free papermarket with a share of 24%, as compared to a market share of 13% held by the Issuer’s parentcompany, BILT, and a market share of 12% for TNPL, a competitor of the Group, for the year endedDecember 31, 2009. The Issuer believes that the Group’s ability to service customers with bothuncoated and coated wood-free products results in a distinct advantage as the Group is able to bundleits products, resulting in pricing flexibility and benefits for its customers with respect to product rangeand product size.
— 9 —

In addition, the Group is the largest producer of market rayon grade pulp in India, with total productionof 85,345 tonnes and total capacity of 98,550 tonnes for the year ended June 30, 2010 at theKamalapuram unit.
The Group is also the largest domestic producer of surface sized and non-surfaced size uncoated wood-free paper in Malaysia. It held a market share of 22% in the surface sized uncoated wood-free papermarket for 2009 and a 73% market share in the non-surfaced sized uncoated wood-free paper segment.The majority of the remaining demand in Malaysia is met by imports from Indonesia, Thailand andChina.
In addition, as a result of the Group’s high quality products, market recognition of the BILT brand andits market leading customer service, BILT (including the Group) has been recognized as a“Superbrand” by the Superbrand Organization each year since 2004. This market leadership and brandawareness provides the opportunity for the Group to charge a premium for its products as compared toits principal competitors.
Vertical integration
The Group’s business model is based on vertical integration where it seeks to achieve control over thecost of key inputs and flexibility to maximize value across the entire value chain. The Group maintainsits own forest plantations, power facilities (two of which are wholly owned and two of which areowned by Avantha Power & Infrastructure Limited (“Avantha Power”) from which the Group procuresa part of its requirements for power), facilities for the production of chemicals (through arrangementswith related parties such as Imerys Newquest (India) Private Limited (“Imerys”) and SMI Newquest(India) Private Limited (“SMI”) and third parties such as Specialty Minerals Malaysia Sdn. Bhd.(“SMM”) required for the paper and hardwood pulp production and extensive hardwood pulpproduction capacity, all of which provide a high degree of vertical integration.
The Group remains focused on improving each component of its vertical integration business model inorder to take advantage of the anticipated market growth in the coated and uncoated wood-free papermarkets and has almost doubled its paper production capacity from 403,710 tpa at June 30, 2008 to758,710 tpa at March 31, 2011.
The Group expects that the paper production capacity at the Ballarpur unit, Bhigwan unit and SFI unitis expected to be increased, with a total additional paper production capacity of 685,000 tpa by the yearended June 30, 2014. Of this additional 685,000 tpa, the Group expects 75,000 tpa to be the result ofsmall improvement investments at the Ballarpur unit and Bhigwan unit (with capacity expansion of40,000 tpa and 35,000 tpa, respectively) to be completed by September 2012. The Group expects60,000 tpa to be the result of small improvement investments at the SFI unit to be completed by June2014. The Group expects the remaining 550,000 tpa to be the result of the introduction of a newuncoated paper machine at the Ballarpur unit and a new paper board machine at the Bhigwan unit withproduction commencing in July 2014, which will broaden the Group’s product portfolio to includecoated paper board. The new machine at the Ballarpur unit is expected to have a capacity of
— 10 —

250,000 tpa and the machine at the Bhigwan unit is expected to have capacity of 300,000 tpa. Theadditional 685,000 tpa in capacity will result in total paper production capacity across all units beingincreased to approximately 1,443,710 tpa by June 30, 2014.
In addition to the forest and plantation at the SFI unit during the nine months ended March 31, 2011,the Group procured a portion of its total hardwood fiber requirements from farmers under the farmforestry programs supported by BILT Tree Tech Limited (“BTTL”) and located near the Group’sBallarpur and Kamalapuram units in India. BTTL is an affiliated company of the Group but is not amember of the Group. Although the farmers may sell the wood to other purchasers, the quantitypurchased by the Group and the proximity to the Group’s units results in a consistent source ofhardwood fiber.
In 2004, BILT and the regional government in Maharashtra entered into a contract whereby theGovernment of Maharashtra agreed to provide bamboo from the government forests to the Ballarpurunit for the production of pulp, paper, paper board and other pulp products. The Ballarpur unit wassubsequently transferred to BGPPL, and the Group now benefits from this contract between BILT andthe government in Maharashtra. The Ballarpur unit currently extracts bamboo and BGPPL pays aroyalty and other dues in relation to this extraction. This contract runs until 2014. During the yearended June 30, 2010, the Group purchased 55% of its total hardwood fiber requirements from thirdparties. Increased harvesting at the SFI unit will help the Group maintain a significant level of woodintegration.
The Group meets most of the SFI unit’s wood requirement through its own plantations, and part of thewood requirements for the Ballarpur unit and Kamalapuram unit is purchased through the farm forestryprogram supported by BTTL. This reduces the Group’s exposure to hardwood fiber price volatility andtransportation costs. Additionally, the Group intends to increase planting and harvesting within theplantation at the SFI unit, which is intended to increase the wood supplied by the plantation to theGroup’s hardwood pulp production capacity, thereby increasing the Group’s vertical integration. TheGroup procured approximately 42% of its hardwood fiber requirements from its own sources during thenine months ended March 31, 2011 and intends to increase this to 52% by the year ending June 30,2013 through this planned increase in planting and harvesting.
In order to maximize the benefit of its access to hardwood fiber and the expansion of paper productioncapacity which has already been completed, the Group is focusing on expanding its hardwood pulpproduction and paper production capacity further. The Group believes that the ongoing expansion ofhardwood pulp production at both the SFI unit and the Ballarpur unit will reduce the Group’s exposureto volatile market prices for hardwood pulp and reduce the Group’s cost of hardwood pulp purchases asthe production cost of pulp is substantially lower than the prevailing market price for hardwood pulp.
With respect to the Ballarpur unit, net production capacity of pulp is intended to be expanded to300,000 tpa by March 2012. Of this capacity, 300,000 tpa will be new capacity provided by a newlyacquired hardwood pulpmill which is currently being installed using equipment acquired from anexisting pulpmill in Finland, while the existing facility with capacity of 130,000 tpa will be retired.This increased net capacity of 170,000 tpa, along with the additional capacity discussed below at the
— 11 —

SFI unit, is intended to satisfy the increased pulp requirements resulting from the increased paperproduction capacity expected at the Ballarpur unit and the Bhigwan unit (excluding the 300,000 tpapaper board machine to be installed at the Bhigwan unit the 250,000 tpa uncoated paper machine to beinstalled at the Ballarpur unit and the 60,000 tpa at the SFI unit).
The hardwood pulp production expansion project at the SFI unit is intended to increase hardwood pulpproduction by over 120,000 tpa by September 2011, with wood sourced from the Group’s own forestsand plantations in Malaysia. The Group has leasehold rights to approximately 288,138 hectares offorest and plantation land. The wood fiber available from these forest and plantation lands is expectedto be sufficient to meet the hardwood fiber requirements of the increased hardwood pulp productioncapacity at the SFI unit. This additional hardwood pulp production capacity is intended to be used forthe expanded paper capacities in India.
For the nine months ended March 31, 2011, the Group produced approximately 50% and 56% of itstotal pulp and hardwood pulp requirements, respectively, from its own units and intends to produce90% of its total pulp and 100% of its hardwood pulp by the year ending June 30, 2013.
With this additional hardwood pulp production capacity, the Issuer believes the Group will be fullyintegrated with respect to the hardwood pulp required to maximize its paper production capacity by theend of 2012-2013 (excluding the 300,000 tpa paper board machine to be installed at the Bhigwan unit,the 250,000 tpa uncoated paper machine at the Ballarpur unit and the 60,000 tpa at the SFI unit). TheGroup will continue to purchase its softwood pulp and bleached chemi-thermomechanical pulp(“BCTMP”) from the market. Hardwood pulp made up approximately 88% of the Group’s total pulprequirements during the nine months ended March 31, 2011.
Further, the Group’s units contain captive energy production with on-site facilities at each unit,including two that are owned by Avantha Power. Three of the facilities produce approximately 96% ofthe relevant unit’s energy requirements, while the Kamalapuram unit produces 83% of that unit’srequirements during the year ended June 30, 2010. Historically, Avantha Power has increased powergeneration capacity in parallel with growing paper/pulp operations and the Issuer believes that AvanthaPower will continue this approach for the foreseeable future. The Ballarpur unit’s chemical plantcomplex produces caustic soda (total capacity of 14,400 tpa), chlorine (total capacity of 12,775 tpa),chlorine dioxide (total capacity of 1,095 tpa) and sulphur dioxide (total capacity of 444 tpa), all ofwhich are vital chemicals for the paper process. The Ballarpur unit sells any excess caustic sodaproduced at the Plant on the market. The Group’s other units purchase all chemical requirements fromthe market.
The Group has previously furthered its vertical integration through acquisitions (such as through theacquisition of the Bhigwan unit, previously known as Sinar Mas Pulp and Paper (India) Ltd (“SinarMas India”), in May 2001, and the SFI unit in March 2007). In addition to its pursuit of organic growthas described above, the Group intends to focus future vertical integration upon the pursuit of bothorganic growth and further acquisitions. The Issuer believes that, in line with its previous successfulpaper and hardwood pulp production projects, the current projects will significantly increase theGroup’s ability to capitalize upon the expected growth in the Indian market along with the growing
— 12 —

demand for coated and uncoated wood-free paper products. Further, given the 88% expansion of theGroup’s paper production from July 2008 to March 2011 (from 403,710 tpa to 758,710 tpa) and theintegration of the SFI unit in 2007, the Group has extensive experience in expanding the verticalintegration across the entire value chain. The Issuer believes increased vertical integration willcontinue to improve the Group’s profitability.
Among the most extensive Indian and Malaysian distribution networks
The Indian paper market is characterized by customer fragmentation with respect to the number ofcustomers, average order size and geographic distribution. The Issuer believes that being able to fulfilla large number of client orders of specific size and paper quality is a key differentiator of the Group.The location of certain of the Group’s manufacturing facilities in proximity to major consumer markets(such as Mumbai), as well as to sources of raw materials (such as the plantations at the SFI unit and thehardwood fiber farms near certain Indian units) gives the Group a significant advantage in terms ofmanufacturing, sales and distribution logistics and access to its customers. With what the Issuerbelieves is the largest paper distribution network in India, including distributors which workexclusively for the Group, through which the Group distributed approximated 54% of its sales in theyear ended June 30, 2010, it maintains extensive sales, customer service and distribution coverageacross India. This network allows the Group to reach the approximately 15,000 customers in Indiaserved by the Group, with an order to delivery time of under 30 days.
The Group’s distribution network allows the Group to service both coated and uncoated wood-freepaper customers from the same network and for all order sizes. For example, in the nine months endedMarch 31, 2011, while 81% and 73% of its coated and Hi-bright uncoated paper production was sold toits large and medium and small sized customers, respectively, the top 10 customers accounted for only14% and 6% of its sales in India, respectively and 88% and 85% of orders for its coated and Hi-brightuncoated wood-free paper, respectively, were for 10 tonnes or less during the period. Average ordersize during this period for coated wood-free and Hi-bright uncoated wood-free paper was 7.3 tonnesand 7.7 tonnes.
In addition, for the nine months ended March 31, 2011, the Group sold over 54% of its products tocustomers through exclusive distributors. The Group plans to increasingly utilize exclusive distributorsfor its sales to customers. The Group’s ability to respond and fulfill small, medium and large ordersthroughout the network reinforces the Group’s ability to charge a premium for its products. This isfurther supported by the Group’s focus on customer interaction at all levels of production, marketing,sales and management. Such interaction enhances the Group’s knowledge of its customer base, therebyenabling it to customize its relationships and products.
Creating a distribution network of similar size and scope would be time-consuming and expensive,which the Issuer believes imposes a significant barrier to entry for foreign companies as well as newand existing competitors in the Indian market. The Group’s access to its customers has enabled it toserve a wider market, better understand the position of its products in relation to those of itscompetitors and increasingly diversify its product range, receive high quality feedback from itscustomers, increase the market’s awareness of the Group’s brand and provide a higher level of
— 13 —

customer service than that provided by its competitors. The Issuer also believes its access to customersand sales of its coated and uncoated paper under the Group’s “BILT” brand has increased the strengthand market awareness of this brand.
The Group also maintains an extensive distribution network in Malaysia, which can be divided to fivemajor zones: Sabah (East Malaysia), Sarawak (East Malaysia), Northern area of West Malaysia,Central area of West Malaysia and Southern area of West Malaysia. The vast majority of paperconsumption in Malaysia occurs in West Malaysia where major commercial activities are located. TheGroup maintains two regional sales offices (“RSOs”) in Malaysia, one of which is located in theCentral area of West Malaysia (focused on the West Malaysian market) and the other in Sabah (focusedon the East Malaysian market).
Operational strength
The Group’s facilities produce coated and uncoated wood-free paper of international standard whichthe Issuer believes are comparable to other major international paper companies and generally regardedas above the quality of products produced by its Indian competitors. Additionally, the Group hassought to increase production and improve quality while also increasing efficiency as evidenced by thewinning of the PPI International Award (RISI) for mill efficiency improvements in 2010 for changes atthe Bhigwan unit. One of the means through which the Group increases efficiency is by adopting thevertical integration business model described above.
The Group’s search for improvements in its processes has resulted in significant reductions in water,steam and fiber consumption (decreases of 15%, 9% and 3%, respectively, during the three years endedJune 30, 2010). These reductions are coupled with an increase in the overall productivity of theGroup’s production operations from 66 Mt per employee in the year ended June 30, 2008 to 81 Mt peremployee in the year ended June 30, 2010.
The Group intends to pursue further operational improvements through its sustainability programs. Forexample, the new hardwood pulp production facility at the SFI unit will be using primarily bio-fuelwhile reducing reliance on oil-fuel. Further, the Group’s farm forestry plantations in India, whilesupported and operated by BTTL and not controlled by the Group, are cost effective and sustainableoptions of wood sourcing.
The Ballarpur, Bhigwan and SFI units are Forest Stewardship Council — Chain of Custody (“FSC-COC”) certified and the Kamalapuram unit is in advanced stages of this certification. The Group hasbeen upgrading its facilities from an environmental perspective. After the completion of the expansionsof the Ballarpur unit and the SFI unit, the Issuer believes that both of these units are expected toproduce Elemental Chlorine Free (“ECF”) pulp (thereby using much less chlorine in the bleachingprocess and reducing dioxins from mill effluents and with it reducing the threat to water courses and tothe ozone layer).
The Group is focused on strengthening all aspects of paper production, from captive and sustainableforestry operations, to hardwood pulp and paper production, through to distribution and marketing. As
— 14 —

a result of its market leading position, the Group’s size and scale results in significant purchasingpower and a strong negotiating position with respect to both sales and, in particular, purchases of pulpand other raw materials. This strength played a significant role in the manner in which the separationof the Group and the Ballarpur Group was executed in 2008 as both parties (as well as the privateequity investors) recognized that the ability to leverage the Group’s strength into increased purchasingpower would be an operational asset.
Stable balance sheet and cash flows together with a proven financial track record
The Group observes conservative financial policies and maintains stable cash balances in order to beable to complete projects on a timely basis, capitalize on opportunities and carry out capital investmentprograms through industry cycles. The Group has historically generated steady cash flows and hastraditionally maintained a stable balance sheet. The Group believes that its integrated operations alongwith the purchasing power resulting from the Group’s size and scale allow it to mitigate the impact ofdeclines in commodity prices and to access capital at attractive terms.
The Group’s net debt to EBITDA ratio was 4.67 for the 12 months ended March 31, 2011 compared to3.70 for the year ended June 30, 2010. The Group believes that the net debt to EBITDA ratio hasimproved since March 31, 2011 mainly due to the conversion of CCDs into equity in June 2011,reducing net debt by approximately US$81 million. Net debt includes all of the Group’s secured andunsecured debt and represents total borrowings less cash and cash equivalents and less restricteddeposits as of the end of the applicable time period. In addition, the Group had cash and cashequivalents (excluding bank overdraft) of US$21.0 million as at March 31, 2011 and US$29.1 millionas of the year ended June 30, 2010. Further, strong revenue growth and controlled operating expenseshave resulted in strong sustained cash flow (US$68.0 million in the nine months ended March 31, 2011and US$88.6 million in the year ended June 30, 2010 from operating activities). In addition, the Groupintends to use the proceeds of the offer to retire some of its capital instruments held by BIH, for capitalexpenditure and generally to reduce debt.
The ability to charge a premium for its products above that which is charged by other producers alongwith operational strength and efficiencies have helped drive strong EBITDA margins of 18% during thenine months ended March 31, 2011 and 22% in the year ended June 30, 2010. The Group has been ableto maintain profitability despite significantly expanding its production capacity. In order to continue tomaintain stable EBITDA margins going forward, the Group will seek to become fully integrated withrespect to its hardwood pulp production by the year ended June 30, 2013 (with hardwood pulpconstituting approximately 85% of the Group’s pulp requirements during the year ending June 30,2013).
Experienced management team
The Group has an experienced management team, and several members of the Board and seniormanagement team have decades of experience in the pulp and paper industry. Other members of theBoard and senior management team have significant experience in other areas, such as chemical and
— 15 —

business management. The Issuer’s executive management team is supported by strong in-housetechnical capabilities, provided by a highly experienced team of experts. The Group also has a proventrack record of attracting and retaining talent throughout the organization.
Strategy
The Issuer’s business strategy is focused on four major areas:
Š grow market leadership;
Š increase vertical integration to improve profitability;
Š cost management to maintain best in class profitability; and
Š produce world class products which enjoy premium pricing.
Grow market leadership
The Group remains focused on taking advantage of the anticipated market growth in the coated anduncoated wood-free paper markets and has increased its paper production capacity from 403,710 tpa atJune 30, 2008 to 758,710 tpa at March 31, 2011. The Group intends to leverage its current leadingmarket positions and increase paper production capacity further from 758,710 tpa at March 31, 2011 to1,443,710 tpa in the year ending June 30, 2014 in order to take advantage of the expected increaseddemand for coated and uncoated paper products that it anticipates will result from India’s projectedsignificant economic growth from 2010 through 2020 (Source: Pöyry).
As the Group expands its production capacity and seeks to increase sales to its customers, it must alsoensure that its extensive distribution networks throughout India and Malaysia continue to be able todistribute the additional volume that is anticipated. The Group intends to grow its market share in itscore markets and maintain its position as the leading supplier for customers demanding coated anduncoated wood-free paper products, in part through enhancing its information technology (“IT”)capabilities and other customer service oriented systems in order to ensure a positive and consistentcustomer experience. The Issuer believes that this distribution system and customer service capabilitywill help drive the Group’s market share in certain regions where domestic regional competition hasbeen relatively strong.
Further, as the Indian economy and the Group expands, it will seek to grow further in the coated anduncoated wood-free paper markets while also selectively filling gaps it sees in the market by bringing anew range of products to its customers. The Group is considering the selective expansion into targetedmarket segments and is currently preparing to broaden its product portfolio to the virgin gradepackaging board with folding box board (“FBB”) and solid bleached sulphate (“SBS”) products. Thesenew offerings will be facilitated by a new paper machine at the Bhigwan unit, which is expected to
— 16 —

commence production in 2014. The Issuer may offer these new products along with others goingforward as the Indian market continues to develop, providing opportunities to capture synergies withexisting paper operations and amplify cross-selling opportunities.
Increasing vertical integration
In order to support the anticipated increase in paper production from 758,710 tpa at March 31, 2011 to1,443,710 tpa in the year ending June 30, 2014, the Group intends to increase its hardwood pulpproduction capacity to 540,000 tpa (excluding production capacity at the Kamalapuram unit which iscurrently and has historically produced rayon grade pulp) by the end of 2012.
Following completion of the hardwood pulp production expansion projects at SFI and Ballarpur, theGroup expects to be fully integrated in the production of hardwood pulp by the year ending June 30,2013. Although the Group has significantly improved its cost profiles, the Group expects this verticalintegration to enable it to further reduce its costs related to purchases of pulp as the Group will be ableto supply all of its own hardwood pulp requirements from internally produced hardwood pulp by 2013.Additionally, the Group will continue to leverage its size and scale in order to maximize its purchasingpower with respect to other raw materials. The Group believes that these actions, along with the benefitreceived by the Group as a result of its secure wood fiber sources at the SFI unit (which itself isfurthered by the Group’s sustainable forestry and wood management programs), will result in theGroup having one of the lowest cost structures in the Indian market and allow the Issuer to continue tofocus on profitable growth.
Cost Management
Additionally, the Group seeks to manage its costs to maintain its strong profitability as compared to itscompetitors in India and Malaysia. The Group believes that the use of capital, both for the existingcapacity as well as for the increased capacity that is being developed, has been efficiently employed byuse of effective planning, flexibility and efficient utilization of the units. The Group has recentlyexpanded several of its paper machines (“PM”). The expansion of the Group’s PM-2 at the Bhigwanunit and PM-7 at the Ballarpur unit in March 2009 and December 2009 has increased the Group’s paperproduction capacity of coated and uncoated wood-free paper by 88%. The new machines are of a highquality and perform at international standards. Although the Group believes the cost per tonne of paperwill be higher during the ramp-up phase, the Group believes that the scale of expansion and theimproved technology now employed by the Group will result in a significant decrease in costs pertonne of paper over time.
Produce world class products which enjoy premium pricing
Historically, the Group has sought to achieve premium pricing through the quality of its products andits ability to meet client requirements through constant benchmarking of its competitors. It also seeksto achieve premium pricing by targeting small and medium sized accounts, and orders which will allowfor utilization of its paper machines. Additionally, the Group offers a high level of customer service,
— 17 —
after sales service and cross selling opportunities along with a long running and consistent pricingstrategy with limited discounts. Despite its extensive use of distributors for sales, the Group is able tomaintain premium pricing because of its quality, diversity of products and strong brand name, withdistributors ultimately passing these prices onto end customers. The Group intends to maintain thepursuit of premium pricing and to build upon and advance its leading position in the markets it serves.
History
The Ballarpur Group was established in 1945 by Mr. Karam Chand Thapar as part of the Thapar Group,which was one of India’s largest business houses. The first public offer of shares by the BallarpurGroup was achieved through an initial public offering in 1968 in the name of Ballarpur IndustriesLimited. Control of the Ballarpur Group was passed to Mr. Gautam Thapar with his appointment asmanaging director of BILT in 1999. Following a redefinition of its corporate strategy in 1998 wherebyit focused on its core paper and pulp businesses, the Ballarpur Group acquired Sinar Mas India, thenthe largest Indian producer of coated paper in 2001 and merged it into the Ballarpur Group in 2003. In2006 Mr. Gautam Thapar was appointed chairman of BILT and the following year the group ofcompanies run by Mr. Gautam Thapar (which included the Ballarpur Group, Avantha Power andCompton Greaves Limited amongst others) were rebranded as the Avantha Group. The Ballarpur Groupalso acquired SFI in 2007. In order to facilitate the raising of capital and to attract investmentinternationally, in 2007, the Ballarpur Group transferred its production units and assets (at Ballarpur,Bhigwan and Kamalapuram) into BILT Graphic Paper Products Limited (“BGPPL”), which itself isheld in an offshore subsidiary (Ballarpur Paper Holdings B.V. (“BPH”)). These three assets representedapproximately half of the revenue of the Ballarpur Group for the year ended June 30, 2008 and havebeen the focus of the production expansion projects that the Ballarpur Group has been undertakingsince 2005. The Issuer was incorporated on April 29, 2008 in Amsterdam, The Netherlands.
In March 2008, J.P. Morgan Mauritius and Lathe Investment (a wholly-owned subsidiary ofGovernment of Singapore Investment Corporation (Ventures) Pte Ltd) invested in BPH and in July2008 their ownership in BPH was exchanged for shares of the Issuer. Currently, J.P. Morgan Mauritiusand Lathe Investment together hold 18.61% of the shares in the Issuer. Avantha International AssetsB.V. (“AIA”), an Avantha Group company, owns 9.09% of those shares, with the balance held byBallarpur through its wholly-owned subsidiary Ballarpur International Holdings B.V. (“BIH”).
The Ballarpur Group has retained three manufacturing units, a retail business and farm forestrybusiness of the Ballarpur Group. These three units focus on the production of copy paper, specialtypaper (including décor, insulating, grease proof, carbon, check and security paper), black centeredboard (“BCB”) packaging containing both recycled corrugated board and recycled carton board, hardand soft tissue, kraft paper and sack kraft paper. In addition, the Ballarpur Group will continue tomanufacture premium business stationery paper (including bond paper), super printing paper and BILTclassic paper.
— 18 —

Recent Developments
Š In 2009, BPH issued US$100 million CCDs to AIA, convertible to cumulative preference sharesof BPH. In June 2011, AIA converted these CCDs to cumulative preference shares of BPH.These shares in BPH were then transferred to the Issuer and a US$100 million receivable wascreated in favor of AIA. The Issuer then issued shares in its capital to AIA against thisreceivable, leaving AIA with a 9.09% equity interest in the Issuer.
Š BPH formerly held INR 5 billion of CCDs issued by BGPPL, which were convertible intoequity shares of BGPPL. In June 2011, INR 2 billion of the CCDs were converted by BGPPLinto equity. In June 2011, BIPH was merged into BPH. Because BPH held nearly the entireshare capital of BGPPL after the merger, this conversion of CCDs did not result in any increasein BPH’s interest in BGPPL, nor did it impact the Issuer’s consolidated financial information.
Š BIPH was a 100% subsidiary of BPH. However, subsequent to the repayment of US$145million borrowed by the Issuer from Axis Bank and a syndicate of other banks, the Groupelected to simplify its corporate structure by merging BIPH into BPH, making BGPPL and SFIdirectly held by BPH. The merger between BIPH and BPH did not impact the Issuer’sconsolidated financial information.
Corporate Structure Chart of the Group
— 19 —

SUMMARY CONSOLIDATED FINANCIAL DATA OF THE GROUP
The summary consolidated financial data for the Issuer for each of the fiscal years ended June 30,2008, 2009 and 2010 and for the nine months ended March 31, 2010 and 2011 set forth below havebeen derived or calculated from the Consolidated Historical Financial Information and the UnauditedConsolidated Interim Financial Information included elsewhere in this Offering Circular and isqualified thereby. The Consolidated Historical Financial Information has been prepared in accordancewith International Financial Reporting Standards as adopted by the European Union (“IFRS-EU”).The Unaudited Consolidated Interim Financial Information has been prepared in accordance with IAS34 Interim Financial Reporting as adopted by the European Union (“IAS 34”). The summaryconsolidated financial data for the Issuer set forth below should be read in conjunction with “SelectedConsolidated Financial Data of the Group,” “Management’s Discussion and Analysis of FinancialCondition and Results of Operations” and the Consolidated Historical Financial Information and theUnaudited Consolidated Interim Financial Information set forth in this Offering Circular.
The Historical Consolidated Financial Information has been prepared for the proposed offering of theSecurities by the Issuer. This financial information is different from the historical statutory financialstatements of the Issuer because it does not include certain disclosures relating to the Dutch civil code,including a director’s report and other information, and because it applies predecessor basis ofaccounting for the year ended June 30, 2008.
Between March 19, 2008 and June 30, 2008, BPH acquired virtually the entire shareholdings anddebentures of BGPPL. Pursuant to a scheme of arrangement and reorganization between BILT andBPH, three undertakings at Bhigwan, Ballarpur and Kamalapuram were transferred to BGPPL duringthe financial year ended June 30, 2008. Under the same agreement, BPH issued additional shares forcash to two investors, J.P. Morgan Mauritius and Lathe Investments, thereby diluting BILT’s effectiveownership of BGPPL to 78.79%. Contractual arrangements put in place as part of this agreementresulted in BGPPL becoming a joint venture between BILT, J.P. Morgan Mauritius and LatheInvestments. This agreement was amended on May 29, 2009 for no consideration and from that datethe Group became a subsidiary of the Ballarpur Group again.
In the determination of the management of the Group, the reorganization that introduced theadditional funding from the two additional investors, J.P. Morgan Mauritius and Lathe Investments, inreturn for issue of shares is outside the scope of IFRS 3 ‘Business Combinations’ (“IFRS3”) as it doesnot meet the definition of a business combination. For the year ended June 30,, 2008, the Group’smanagement applied predecessor accounting to the reorganization, thereby recording BGPPL and SFIat the carrying amounts they were previously carried at, in the financial statements of the BallarpurGroup. The consolidated historical financial information setting out the Group’s financial position asof June 30, 2008, 2009 and 2010 and results of operations and cash flows for the three years are onthis basis.
Until July 14, 2008, BPH was the holding company of the Group , whose majority shares were held byBIH. At that time, the Issuer was wholly owned by BIH. On July 14, 2008, BPH became a wholly owned
— 20 —

subsidiary of the Issuer, and BIH became a 78.79% owner of the Issuer, with 13.33% held by LatheInvestments and 7.88% by J.P. Morgan Mauritius.
As the Issuer is substantially a new company, the acquisition of BPH by the Issuer has been treated inthese consolidated financial statements as a group reorganization. The consolidated assets andliabilities of the Issuer immediately after the effective time of the group reorganization are the same asthe consolidated assets and liabilities of BPH immediately prior thereto.
This consolidated financial information has been prepared in the name of the Issuer, but continuity inthe Group accounting applies to the consolidated financial information of BPH. The information forthe period prior to July 14, 2008 in these consolidated financial statements has been extracted from theBPH consolidated financial statements. Moreover, the financial results for the year ended June 30,2008 include the financial results of BGPPL as if the acquisition of BGPPL had occurred on July 1,2007. See “Presentation of Financial and Other Data” for further information regarding thepresentation of financial information and “Management’s Discussion and Analysis of FinancialCondition and Results of Operations” for a description of certain line items in the Income Statement.
Summary income statement
Years endedJune 30
Nine months endedMarch 31
2008 2009 2010 2010 2011
(Unaudited)(US$ ‘000)
Revenue . . . . . . . . . . . . . . . . . . . . . . . . . . . . . . . . . . . . . . . . . 514,388 408,158 613,164 434,545 557,334Operating profit . . . . . . . . . . . . . . . . . . . . . . . . . . . . . . . . . . . 69,062 51,495 95,329 66,060 65,036Profit for the year/period (after tax) . . . . . . . . . . . . . . . . . 15,648 (7,060) 46,439 37,141 13,533EBITDA* . . . . . . . . . . . . . . . . . . . . . . . . . . . . . . . . . . . . . . . . 101,133 83,230 134,713 94,738 98,619
* EBITDA is a non-GAAP financial measure. Please see “Non GAAP Financial Measures”.
Summary balance sheet
As at June 30 As at March 31
2008 2009 2010 2011
(Unaudited)(US$ ‘000)
Non-current assets . . . . . . . . . . . . . . . . . . . . . . . . . . . . . . . . . 837,981 959,502 1,050,265 1,202,475Current assets . . . . . . . . . . . . . . . . . . . . . . . . . . . . . . . . . . . . . 176,389 151,418 255,275 287,535Total assets . . . . . . . . . . . . . . . . . . . . . . . . . . . . . . . . . . . . . . 1,014,370 1,110,920 1,305,540 1,490,010
Current liabilities . . . . . . . . . . . . . . . . . . . . . . . . . . . . . . . . . . 179,560 138,467 242,889 318,959Non-current liabilities . . . . . . . . . . . . . . . . . . . . . . . . . . . . . . 440,722 603,840 512,902 573,022Total liabilities . . . . . . . . . . . . . . . . . . . . . . . . . . . . . . . . . . . 620,282 742,307 755,791 891,981
Total equity and liabilities . . . . . . . . . . . . . . . . . . . . . . . . . . 1,014,370 1,110,920 1,305,540 1,490,010
— 21 —

Summary cash flow statement
Years endedJune 30
Nine months endedMarch 31
2008 2009 2010 2010 2011
(Unaudited)(US$ ‘000)
Net cash generated from operating activities . . . . . . . . . . . 96,615 128,599 88,612 76,961 67,998Net cash used in investing activities . . . . . . . . . . . . . . . . . . (158,486) (271,427) (52,607) (57,645) (165,256)Net cash flows generated from/(used in) financing
activities . . . . . . . . . . . . . . . . . . . . . . . . . . . . . . . . . . . . . . 72,507 136,363 (24,295) (1,998) 87,941
— 22 —

THE OFFER
The following is a brief summary of the term of this offering and is qualified in its entirety by theremainder of this Offering Circular. This summary is derived from, and should be read in conjunctionwith, the full text of the “Description of the Perpetual Capital Securities”. Terms used in this summaryand not otherwise defined shall have the meanings given to them in “Description of the PerpetualCapital Securities”.
Issuer . . . . . . . . . . . . . . . . . . . . . . . . . . . Ballarpur International Graphic Paper Holdings B.V.
Securities Offered . . . . . . . . . . . . . . . . . US$200,000,000 Subordinated Perpetual Capital Securities
Offering Price . . . . . . . . . . . . . . . . . . . . 100%
Issue Size . . . . . . . . . . . . . . . . . . . . . . . . US$200,000,000
Interest . . . . . . . . . . . . . . . . . . . . . . . . . . The Securities confer a right to receive Interest at the applicable ratedescribed below subject to the provisions under “Description of thePerpetual Capital Securities — Deferral of Interest”.
(i) Interest from and including the Issue Date to butexcluding August 11, 2016 (the “First Call Date”) shallaccrue on the outstanding principal amount of theSecurities (and any Arrears of Interest) at 9.75% perannum and shall be paid on each Interest Payment Datein such period and on the First Call Date.
(ii) Interest from and including the First Call Date to butexcluding August 11, 2021 (the “Second Call Date”)shall accrue on the outstanding principal amount of theSecurities (and any Arrears of Interest) at the TreasuryRate plus 8.57% per annum (the “Initial Spread”) andshall be paid on each Interest Payment Date in suchperiod and on the Second Call Date.
(iii) Interest from and including the Second Call Date to butexcluding the following Reset Date (as defined below)shall accrue on the outstanding principal amount of theSecurities (and any Arrears of Interest) at the TreasuryRate plus the Initial Spread plus 1% (the “Step-UpMargin”) and shall be paid on each Interest PaymentDate in such period.
— 23 —

(iv) Interest from and including each Reset Date falling afterthe Second Call Date to but excluding the immediatelyfollowing Reset Date shall accrue on the outstandingprincipal amount of the Securities (and any Arrears ofInterest) at the Treasury Rate with respect to the relevantReset Date plus the Initial Spread plus the Step-UpMargin and shall be paid on each Interest Payment Datein such period.
“Reset Date” means the First Call Date, the Second Call Date and theday falling every five calendar years after the Second Call Date.
Status of the Securities; Set-Off . . . . . . The Securities (together with accrued Interest thereon, including anyArrears of Interest and Additional Interest Amounts) will constitutethe Issuer’s direct, unsecured and subordinated obligations, which inthe event of a Winding-Up rank:
(a) junior to the claims of all senior and other subordinatedobligations of the Issuer, except for the loans andsecurities referred to in (b) below;
(b) pari passu with any loans and securities expressed torank pari passu with the Securities; and
(c) senior to the Issuer’s ordinary and preferred sharecapital,
except as otherwise required by mandatory provisions of law.
In the event of a Winding-Up, the rights and claims of the holders inrespect of the Securities will be subordinated in right of payments tothe claims of all senior and subordinated creditors of the Issuerreferred to in (a) above shall have been satisfied in full. The holdersof the Securities irrevocably waive any right to be treated equallywith such creditors of the Issuer in such circumstances. For a moredetailed description, see “Description of the Perpetual CapitalSecurities — Status and Subordination; Set-Off”.
Subject to applicable law, no holder of a Security may exercise anyright of set-off in respect of any amount owed to it by the Issuer andeach holder of a Security shall be deemed to have waived all suchrights of set-off. This term of the Securities is an irrevocablestipulation for the benefit of the creditors referred to in (a) above andeach such creditor may rely on and enforce this term of the Securitiesunder Section 6:253 of the Dutch Civil Code.
— 24 —

Deferral of Interest . . . . . . . . . . . . . . . . The Issuer may, at its sole discretion, elect to defer (in whole or inpart) any Interest which is otherwise scheduled to be paid on anInterest Payment Date to the next Interest Payment Date by givingtimely notice (a “Deferral Election Notice”) to the holders of theSecurities and the Trustee not more than 10 nor less than five NewYork Business Days prior to a scheduled Interest Payment Date (a“Deferral Election Event”). The Issuer shall have no obligation topay any Interest (including any Arrears of Interest and any AdditionalInterest Amounts) on any Interest Payment Date.
Any Interest deferred pursuant to the terms of the Securities shallconstitute “Arrears of Interest”. The Issuer may, at its solediscretion, elect to defer further any Arrears of Interest by complyingwith the notice requirement applicable to any deferral of any accruedInterest. The Issuer is not subject to any limit as to the number oftimes Interest and Arrears of Interest can or shall be deferred pursuantto the terms of the Securities.
For a more detailed description, see “Description of the PerpetualCapital Securities — Deferral of Interest”.
Restrictions on Deferral . . . . . . . . . . . . If on any Interest Payment Date, payment of all Interest paymentsscheduled to be made on such date is not made by reason of the Issuerdeferring such Interest in accordance with the terms of the Securities:
(a) prior to a public offering, neither the Issuer nor BILTshall:
(i) declare or pay any dividends or distributions, ormake any other payment on, and will procure that nodividend, distribution or other payment is made onany of their respective junior obligations or parityobligations (except in relation to parity obligations,on a pro-rata basis with any Securities), save thatsuch restriction shall not apply to payments inrespect of an employee benefit plan or similararrangement with or for the benefit of employees,officers, directors or consultants; or
(ii) redeem, reduce, cancel, buy-back or acquire for anyconsideration any of their respective juniorobligations or parity obligations unless (i) the Issuerhas satisfied in full all outstanding Arrears ofInterest and any Additional Interest Amounts or(ii) approved by the holders of at least a simple
— 25 —

majority in aggregate principal amount of theSecurities then outstanding or other than (iii) as aresult of the exchange or conversion of parityobligations of the Issuer or, as the case may be,BILT for the junior obligations of the Issuer or, asthe case may be, BILT or (iv) in connection with anemployee benefit plan or similar arrangement with orfor the benefit of employees, officers, directors orconsultants; and
(b) on or after a public offering, none of the Issuer, therelevant entity used to effect the listing (the “RelevantListco”) nor, if the public offering is not a QualifyingPublic Offering (as defined in the Indenture), BILT shall:
(i) declare or pay any dividends or distributions, ormake any other payment on, and will procure that nodividend, distribution or other payment is made onany of their respective junior obligations or parityobligations (except in relation to parity obligations,on a pro-rata basis with any Securities), save thatsuch restriction shall not apply (i) to payments inrespect of an employee benefit plan or similararrangement with or for the benefit of employees,officers, directors or consultants or (ii) to paymentsmade (X) if the Relevant Listco is a subsidiary of theIssuer, by the Relevant Listco to the Issuer or (Y) ifthe Relevant Listco is not a subsidiary of the Issuer,by the Relevant Liscto to the Issuer or by the Issuerto the Relevant Listco; or
(ii) redeem, reduce, cancel, buy-back or acquire for anyconsideration any of their respective juniorobligations or parity obligations unless (i) the Issuerhas satisfied in full all outstanding Arrears ofInterest and any Additional Interest Amounts or(ii) approved by the holders of at least a simplemajority in aggregate principal amount of theSecurities then outstanding or other than (iii) as aresult of the exchange or conversion of parityobligations of the Issuer, the Relevant Listco or, asthe case may be, BILT for the junior obligations ofthe Issuer, Relevant Listco or, as the case may be,BILT or (iv) in connection with an employee benefitplan or similar arrangement with or for the benefit ofemployees, officers, directors or consultants.
— 26 —

For a more detailed description, see “Description of the PerpetualCapital Securities — Restrictions in the Case of Deferral”.
Settlement of Arrears of Interest . . . . . The Issuer may satisfy any Arrears of Interest and any AdditionalInterest Amounts (in whole or in part) at any time by giving notices ifsuch election to the holders of the Securities and the Trustee.
In any event, the Issuer shall satisfy any outstanding Arrears ofInterest and any Additional Interest Amounts (in whole but not inpart) on the earliest of the following:
(1) the date of a Compulsory Interest Settlement Event;
(2) the date of redemption of the Securities at the option ofthe Issuer; and
(3) the date of any substitution or variation pursuant to aSpecial Event,
it being understood that if none of the events referred to in (1) to (3)above take place prior to the fifth anniversary of the Interest PaymentDate on which the outstanding Arrears of Interest would, if notdeferred pursuant a Deferral Election Notice, have fallen due for thefirst time, it is the intention, though not an obligation, of the Issuer topay outstanding Arrears of Interest (in whole but not in part) on thenext Interest Payment Date following such fifth anniversary.
For a more detailed description, see “Description of the PerpetualCapital Securities — Settlement of Arrears of Interest”.
Optional Redemption . . . . . . . . . . . . . . On any Call Date, the Issuer may redeem the Securities, in whole butnot in part, at a redemption price equal to the principal amount thereoftogether with any Interest accrued to (but excluding) the date fixed forredemption.
Special Event Redemption . . . . . . . . . . The Securities may be redeemed, in whole but not in part, at theIssuer’s option, by reason of a Withholding Tax Event, TaxDeduction Event, Accounting Event, Capital Event or Squeeze-OutEvent. For a more detailed description, see “Description of thePerpetual Capital Securities — Redemption”.
— 27 —

Change of Control . . . . . . . . . . . . . . . . . The Securities may be redeemed, in whole but not in part, at theIssuer’s option, by reason of a Change of Control. If the Issuer doesnot elect to redeem the Securities within 60 days of the occurrence ofthe Change of Control then the prevailing Interest Rate applicable tothe Securities shall be increased by 5% per annum.
Substitution and Variation . . . . . . . . . . If either a Withholding Tax Event, a Tax Deduction Event, anAccounting Event or a Capital Event has occurred and is continuing,then the Issuer may (without any requirement for the consent orapproval of the holders of the Securities) either (i) substitute all, butnot some only, of the Securities for, or (ii) vary the terms of theSecurities with the effect that they remain or become, QualifyingSecurities. For a more detailed description, see “Description of thePerpetual Capital Securities — Substitution and Variation”.
Substitution of the Issuer . . . . . . . . . . . The Indenture contains provisions under which either (a) anysuccessor in business of the Issuer or (b) any Relevant Listco may,without the consent of the holders of the Securities, assume theobligations of the Issuer as principal debtor under the Indenture andthe Securities provided that certain conditions specified in theIndenture are fulfilled.
Initial Public Offering . . . . . . . . . . . . . . In the event that on a public offering, the Relevant Listco is either(i) a subsidiary of the Issuer or (ii) a Sideco (as defined in theIndenture), and in either cash is not substituted as principal debtorunder the Indenture and the Securities, the Issuer shall procure that (a)such Relevant Listco enters into an indenture supplemental to theIndenture pursuant to which such Relevant Listco shall guarantee on asubordinated basis (as described below) the payment of any amountspayable under the Securities or the Indenture (the “Relevant ListcoGuarantee”) and (b) any sale or transfer of the assets held directly orindirectly by the Issuer or any of its subsidiaries to an entity which isnot a subsidiary of the Issuer is made on arm’s length terms for fairmarket value consideration.
Non-Payment and Enforcement . . . . . . If:
(a) a default is made for a period of more than seven days inthe payment of any amount in respect of the Securities;or
(b) the Issuer or the Relevant Listco (where the RelevantListco Guarantee has been provided) is subject to aWinding-Up,
— 28 —

(each, an “Enforcement Event”) then, in the case of paragraph (a),the Trustee may, at its discretion, and shall, if instructed pursuant to ameeting of holders, institute proceedings for the Winding-Up of theIssuer in The Netherlands or the Relevant Listco (where the RelevantListco Guarantee has been provided) in the place of incorporation ofthe Relevant Listco and/or prove in any Winding-Up of the Issuer orthe Relevant Listco (where the Relevant Listco Guarantee has beenprovided), and, in the case of paragraph (b), the Securities willimmediately become due and payable at their principal amounttogether with accrued Interest and any Arrears of Interest andAdditional Interest Amounts).
The Trustee may refuse to follow any direction that it determineswould involve the Trustee in personal liability, unless it receivessecurity and/or indemnity satisfactory to it against any loss, liabilityor expense.
No remedy against the Issuer, other than as referred to in thisparagraph, shall be available to the Trustee or the Holders.
For more detailed description, see “Description of the PerpetualCapital Securities — Non-Payment and Enforcement”.
Replacement Intention . . . . . . . . . . . . . The Issuer intends (but is not obliged to ensure) that, to the extentthat the Securities provide the Issuer with “equity credit” for ratingpurposes by Fitch immediately prior to any redemption, it will (exceptin certain circumstances) repay the principal amount of suchSecurities to be so redeemed with the net proceeds received by theIssuer from the issuance of securities for which the Issuer will receivethe same, or higher amount of, “equity credit” by Fitch. For a moredetailed description, see “Description of the Perpetual CapitalSecurities — Replacement Intention”.
Calculation Agent . . . . . . . . . . . . . . . . . The Calculation Agent shall initially be The Bank of New YorkMellon.
Transfer Restrictions . . . . . . . . . . . . . . The Securities (including beneficial interests in the global securitiesrepresenting the Securities) will be subject to certain restrictions ontransfer set forth therein and in the Indenture and will bear a legendregarding such restrictions as set forth under “Transfer Restrictions”.
Risk Factors . . . . . . . . . . . . . . . . . . . . . . See “Risk Factors” and the other information in this Offering Circularfor a discussion of factors that should be carefully considered beforedeciding to invest in the Securities.
— 29 —

Use of Proceeds . . . . . . . . . . . . . . . . . . . The Issuer estimates that the gross proceeds to it from its sale of theSecurities pursuant to this Offering Circular will be approximatelyUS$200 million before deducting the underwriting discount and itsoffering expenses in connection with the issue of the Securities. Ofthe net proceeds from the offering, the Issuer intends to useapproximately US$97.75 million for the repayment of profitcertificates and US$97.75 million for capital expenditurerequirements of its subsidiaries.
Denominations . . . . . . . . . . . . . . . . . . . . The Securities will be issued in minimum denominations ofUS$200,000 and integral multiples of US$1,000 above that amount.
Governing Law . . . . . . . . . . . . . . . . . . . The Securities and the Indenture will be governed by and construed inaccordance with the laws of the State of New York, save for theprovisions described under “Description of the Perpetual CapitalSecurities — Status and Subordination; Set-Off” and the provisions ofthe Indenture relation to subordination and set-off, which will begoverned by and construed in accordance with the laws of TheNetherlands.
Ratings . . . . . . . . . . . . . . . . . . . . . . . . . . Not rated.
Listing . . . . . . . . . . . . . . . . . . . . . . . . . . . Approval in-principle has been received for the listing and quotationof the Securities on the Official List of the Singapore ExchangeSecurities Trading Limited.
Trustee, Paying Agent, Registrar andTransfer Agent . . . . . . . . . . . . . . . . . . The Bank of New York Mellon
— 30 —

RISK FACTORS
Any investment in the Securities would be subject to a number of risks. Prior to investing in theSecurities, prospective investors should carefully consider risk factors associated with any investmentin the Securities, the Group’s business and the industry in which it operates, together with all otherinformation contained in this document including, in particular, the risk factors described below. Thefollowing factors do not purport to be a complete list or explanation of all the risk factors involved ininvesting in the Securities, and additional risks and uncertainties relating to the Group that are notcurrently known to the Group, or that it currently deems immaterial, may also have an adverse effecton the Group’s business, financial condition and/or results of operations. Investors should considercarefully whether an investment in the Securities is suitable for them in light of the information in thisdocument and their personal circumstances. Some of the following information has been extracted fromthird party sources and has not been independently verified by the Issuer.
Risks relating to the Group’s business
The Group’s growth strategies and expansion projects will require substantial capital expenditureand other risks associated with major projects that may adversely affect the Group’s business andresults of operations
As part of the Group’s growth strategy, it has expanded its paper production capacity and is makingsubstantial investments to increase its hardwood pulp and paper production capacity (see “Business —Strategy” for further details). The Issuer expects that the capital expenditure in relation to the currentlyproposed increased hardwood pulp production capacity, once completed, will be approximatelyUS$330 million. The Issuer expects that further capital expenditures of US$77 million will be requiredfor improving capacity through efficiency improvement. The capital expenditure in relation to newpaper capacity at Ballarpur unit and Bhigwan unit, once completed, will be approximately US$489million. The Group’s success in further expanding its production capacity depends, in large part, ongenerating sufficient cash flow and financing to finance such projects. Any delay could result in adelay in the Group’s expected increased production capacity.
As a result of these substantial capital expenditures, the Group will seek to increase production andsales. With this increased production, the Group intends to increase sales to current customers andexpand its customer base through initiatives in product distribution, diversification and branding. If theGroup is unable to increase sales to current customers or expand its customer base, it may have excessproduction capacity which could result in decreased prices, increased exports, idle capacity ordecreased financing for further expansion.
Therefore, the Group’s success in increasing its production capacity and sales will depend on, amongother things, its ability to secure required financing, access potential markets, time capital investmentswith the price and demand cycle, control input costs, attract new customers, maintain and enhance itsposition in the Indian and international paper markets and maintain sufficient operational controls.
In the event that, for example, there is a recession or financial crisis, as began in 2007, either in Indiaor globally, the Group may be unable to access the financing necessary for the expansion of its
— 31 —

operations. Further, in the event that the Group is unable to secure hardwood fiber on a consistent basisand on economical terms or if the Group is unable to expand or is delayed in expanding its hardwoodpulp production capacity (which is intended to allow the Group to exploit its expanded paperproduction capacity), the Group may be unable to increase profitably its paper production, paper salesand/or market share. Any inability to expand, or delay in expanding, could adversely affect the Group’sprospects.
In the near term, a material increase in the Group’s finance costs or cost of borrowing may also requirethe Group to scale back or delay discretionary capital expenditure or to divert funds from otherprojects to satisfy these increased capital expenditure requirements which could result in delays to, orthe postponement of, the Group’s planned production and development activities. In the longer term, amaterial increase in the Group’s finance costs or cost of borrowing may require the Group to obtainadditional funds which it may not be able to secure on reasonable commercial terms, or at all, to scaleback or delay discretionary capital expenditure and/or to divert funds from other projects to satisfy theincreased requirements.
Any of the foregoing could have a material adverse effect on the Group’s business, results ofoperations, financial condition or prospects.
The Group’s growth strategies require successful management of major projects
The Group has adopted certain growth strategies through new projects and programs, and each of theseprojects and programs involves risks and challenges. There can be no assurance that the Group will beable to complete its plans on schedule or within budget or that, once completed, the projects will bemanaged properly such that the expansion projects and programs will deliver as anticipated. Theoccurrence of such delays or failures to manage and/or operate the projects and programs could have amaterial adverse effect on the Group’s prospects or results of operations.
The Group’s growth strategies and expansion projects anticipate further significant increases indemand for the Group’s products
The Group’s growth strategies and expansion projects assume further significant increases in demandfor the Group’s products in the domestic Indian market with no publicly announced and confirmedincreases in production or production capacity by the Group’s competitors in India coming on line after2012 (although projects intended to increase capacity prior to 2012 may commence production beyond2012). The Group, however, also faces competition in its primary Indian markets from non-Indianpaper producers which are likely to increase production capacity, primarily in China and Indonesia,and from competitors in Western Europe that may seek to increase their sales in India (either throughdirect sales or by buying a producer in India).
In addition, approximately 39% of the sales from PM-7 for the nine months ended March 31, 2011were made in the form of exports in order to avoid increasing supply in India too significantly, whichcould damage its ability to charge a premium for its products. Increased production capacity withoutthe anticipated significantly increased demand could force the Group to either lower prices in India,increase exports (which may not be feasible given a competitive international market) or reduceproduction.
— 32 —

If demand does not increase as expected, domestic production increases significantly and/or one ormore international competitors focus on increasing sales in India, there may be oversupply in theIndian markets, with little opportunity for export, which could have a material adverse effect on theGroup’s ability to charge a premium for its products as well as its prospects and results of operations.
The Group’s indebtedness may adversely affect the Group’s business and results of operations
The Group has incurred significant indebtedness and maintains a relatively high level of leverage as aresult of the increased capital expenditure in relation to the expansion of its paper and pulp productioncapacity, which was primarily financed by bank facilities and other debt. The Group’s net debt toEBITDA ratio was 4.67 for the 12 months ended March 31, 2011 compared to 3.70 for the year endedJune 30, 2010. The Group may also incur additional indebtedness in the future, subject to limitationsimposed by the Group’s financing arrangements and applicable law. Although the Group believes thatits current levels of cash flows from operations and working capital borrowings are sufficient toservice its existing debt, the Group may not be able to generate sufficient cash flow from operations inthe future and future working capital borrowings may not be available in an amount sufficient to enablethe Group to do so. The Group services this debt through cash flow generated from its operations.Moreover, the Group’s cost of borrowing could be affected by the credit ratings awarded to its variousdebt instruments.
In addition, certain of the Group’s loan agreements contain covenants which restrict certain activitiesand require the Group to obtain lenders’ consent before, among other things, undertaking new projects,declaring or paying dividends in the event of any non-payment under the respective relevantagreements and making certain investments beyond certain thresholds so long as it is in default. Theseagreements also allow those lenders to sell assets of a certain value in the event of non-payment oftheir dues. Such provisions are standard in loan agreements with lenders and are imposed onborrowers, including the Group, with little or no variation.
The Group’s loan agreements also require it to maintain certain financial ratios, and in the past it hasbreached one of these ratios. For the year ended June 30, 2009, the Group did not maintain a debt toEBITDA ratio on a loan from a consortium of lenders, triggering a 2% increase in interest rate on theloan and giving the consortium the right to recall the loan. While the consortium were willing to waivethe breach, the Group refinanced the loan through new borrowings and equity infusion.
If in the future the Group is in breach of any financial or other covenants contained in any of itsfinancing agreements, it may be required to immediately repay its borrowings either in whole or inpart, together with any related costs. The Group may be forced to sell some or all of the assets in itsportfolio if it does not have sufficient cash or credit facilities to make repayments.
Furthermore, the Group’s financing arrangements contain cross-default provisions which couldautomatically trigger defaults under other financing arrangements, in turn magnifying the effect of anindividual default.
A significant portion of the Group’s borrowings are on a floating rate basis and increases in marketinterest rates can have a significant adverse impact on the Group’s results. Interest rates havefluctuated in the past in response to the expansion or contraction of the Indian or global economy,inflation, government policies and other factors.
— 33 —

The Group’s failure to comply with any of the covenants contained in its financing arrangements couldresult in a default thereunder which would permit the acceleration of the maturity of the indebtednessunder such agreements and, if the Group is unable to refinance in a timely fashion or on acceptableterms, would have a material adverse effect on the Group’s business, prospects, financial condition andresults of operations.
Product prices in the Group’s industry fluctuate and a period of low product prices could negativelyaffect its profitability
The Group’s products are largely commoditised and, with the exception of rayon grade pulp, the priceof which is influenced by the price of cotton which is an alternative to rayon, the prices the Group isable to charge for its products are affected by changes in capacity, production and the demand for itsproducts. Prices also differ between products and where the products will be sold, for example withinIndia, Malaysia or exported. Generally, demand is influenced by general economic conditions,competition among producers and inventory levels maintained by the Group’s customers. Changes inthese factors have resulted in fluctuations in the prices for the Group’s products both within itsdomestic and export markets. The timing and magnitude of changes in product prices over time havebeen unpredictable. While the Group is a significant participant in most of the markets in which itcompetes, its actions have only limited influence on changes in product prices. A material reduction inprices could adversely affect the Group’s results of operations.
For additional information concerning the prices charged by the Group for its primary products, see“Business — Products — The paper products”.
The Group’s operations require substantial capital and the Group may not have adequate capitalresources to provide for all of its capital requirements
The Group’s business is capital intensive and requires regular capital expenditure in order to maintainits equipment, increase its operating efficiency and comply with environmental laws. In addition,significant amounts of capital may be required to modify the Group’s equipment to produce alternativegrades or to make significant improvements to the characteristics of the Group’s current products. If,over the longer term, the Group’s available cash resources and cash generated from operations are notsufficient to fund the Group’s capital expenditures, the Group would have to obtain additional fundsfrom borrowings or other available sources or reduce or delay capital expenditures. The Group may notbe able to obtain additional funds on favorable terms or at all. If the Group cannot maintain or upgradeits equipment as it requires, the Group may become unable to manufacture products that competeeffectively. An inability to execute required capital expenditures in a timely fashion could have amaterial adverse effect on the Group’s growth, business, financial condition and results of operations.
The Group sells all of the rayon grade pulp it produces to a single purchaser
The Group’s Kamalapuram unit produces rayon grade pulp for sale outside the Group. During the yearended June 30, 2010, the Group sold nearly all the rayon grade pulp it produced to a single customer,Grasim Industries Limited (and its group companies), generating approximately 98% of the totalrevenue of the Kamalapuram unit for that year. Under an agreement between BGPPL and this
— 34 —
purchaser, BGPPL is obligated to supply approximately 75,000 Mt of rayon grade pulp per annumsubject to minimum amounts per month. See “Business — rayon grade pulp” for further details. Due toexport restrictions, the Group is not currently able to sell rayon grade pulp outside India. If demand forthis product dropped in the international market, leading to increased supply into India as internationalproducers sought new customers, supply increased for other reasons (including supply by the Group’spurchaser, which produces a portion of its own rayon grade pulp), or the Group’s major customerstopped purchasing the Group’s rayon grade pulp, the Group may be unable to find another purchaserwilling to buy at similar prices, or at all. In such circumstances, the Group may be forced todiscontinue rayon grade pulp production operations at Kamalapuram. For example, in 2009, theGroup’s purchaser of rayon grade pulp significantly decreased its order size of rayon grade pulp due todecreased demand for its products resulting from the economic recession and financial crisisinternationally. As a result, and due to the lack of a long term off-take agreement, the Group largelyhalted operations at the Kamalapuram unit for approximately six months. However, the Kamalapuramunit is able to switch to the production of paper grade pulp if required. Such a conversion to papergrade pulp production would take approximately 24 hours and it would then take approximately48 hours to convert back to rayon grade pulp production. During the year ended June 30, 2009, theKamalapuram unit produced 26,428 tonnes of rayon grade pulp and 14,095 tonnes of paper grade pulp,compared to 92,148 tonnes and 85,345 tonnes of rayon grade pulp for the years ended June 30, 2008and 2010, respectively. However, while production of paper grade pulp reduces the Group’s costs byreducing its purchases of pulp in the market, it does not generate any revenue. Further, a decrease inrayon grade pulp prices or demand often accompanies a similar drop in demand and prices for paper(due to the fact that demand for both products is driven in part by the economic climate generally) anda switch, therefore, to pulp production may not be useful due to decreased internal demand foradditional hardwood pulp. If, as a result of market or other factors, production at Kamalapuram isceased temporarily or permanently, or is switched to the production of paper grade pulp, there could bea material adverse effect on the Group’s results of operations.
Prolonged interruptions at the Group’s paper or pulp manufacturing facilities would have anadverse impact on its ability to meet customer demands
Interruptions in production occur occasionally, for example as a result of planned maintenance orbreakdowns. If any interruptions in the Group’s pulp production were prolonged and, as a result, theGroup was forced to purchase additional pulp on the market, it may be forced to do so at higher pricesthan it would normally incur by producing pulp at its own facilities. The Group sets its productionlevels based on customer orders and carries limited stock. Consequently, if any interruptions in theGroup’s paper production were prolonged, the Group may be unable to fulfill customer orders fromstock and the Group may be forced to deliver products from another facility causing orders to bedelayed or may not be profitable. In addition, any failure to meet customer expectations may result in aloss of business from such customers in the future. Any such interruptions could have a materialadverse effect on the Group’s results of operations.
In addition, if the operations of the Group were interrupted for any significant length of time becauseof, for example, a natural disaster (such as earthquake, flooding or fire), man-made disruptions (suchas labor strikes), a failure to obtain raw materials or any other reason, it could have a material adverseeffect on the Group’s financial position and results of operations.
— 35 —

The Group may be unable to increase its hardwood pulp production capacity without material delaysor at a commercially reasonable cost, which could have a negative impact on its raw material costs,its ability to increase production integration and improve its operating profit margins
The principal raw material required in the manufacture of paper products is pulp, which, as producedby the Group, is made from wood (though other companies may also use recovered fiber). Differenttypes of paper products are produced using the appropriate pulp and chemicals as the principal rawmaterials. For the nine months ended March 31, 2011, the Group produced approximately 56% of itshardwood pulp requirements for paper production at its SFI, and Ballarpur facilities and obtained theremainder in open market purchases. Pulp procured on the open market is significantly more expensivethan pulp produced by the Group and exposes the Group to volatility in market pulp prices. The Groupplans to increase the proportion of its pulp requirements that it produces internally such that it intendsto produce 100% of its own hardwood pulp requirements and 90% of its total pulp requirements byJune 30, 2013.
While the Group has previously expanded its paper production capacity, the Group does not haverecent experience of building additional hardwood pulp capacity. Further, a new production facility isbeing assembled at the Ballarpur unit from an existing pulp machine previously installed in Finland,which the Group has purchased, as well as some other new and used equipment. While the Groupbelieves this equipment will be of high quality, there can be no assurance that this will be the caseonce implemented or that the new and used machinery and equipment will be able to be used togetherwithout issue. Further, the used equipment is located in Finland and must be dismantled, shipped toIndia, cleared through customs, transported to the Ballarpur unit and assembled. There can be noassurance that all of the equipment will be dismantled in Finland on schedule (due in part to coldweather or other factors), that there will be no material delays or issues during shipping, that it will notbe delayed at customs or result in customs duties higher than that expected by the Group, that therewill not be delays or problems transporting the equipment overland in India or that assembly will occuron schedule. Further, once assembled, there is no assurance that there will not be a delay incommencement or, once production begins, that the Group will reach full production on schedule or atall.
If the Group is delayed in bringing on line its planned increases in pulp capacity, or if these increaseslag increases in paper production capacity, the Group may not be able to reduce its pulp costs asplanned, reduce its exposure to volatility in open market pulp prices or achieve full integration of itshardwood pulp production, which could have an adverse effect on the Group’s operating profit marginand results of operations.
For additional information concerning the market prices of hardwood and softwood pulp, see“Business — Raw Materials, inputs and suppliers — Pulp”.
Exchange rate fluctuations or devaluations could impact the Group’s reported results of operations,reduce its net income or increase the cost of the Group’s borrowings and repayment of indebtedness
Most of the Group’s revenues and expenses are generated and incurred in rupees and ringgits, whileapproximately 60% of the Group’s borrowings were denominated in US dollars and other non-rupeeand non-ringgit currencies as of June 30, 2010. Accordingly, the Group’s results of operations may be
— 36 —

affected by changes in exchange rates, particularly between the rupees, ringgits and the US dollar. Assuch, devaluations or depreciation of the value of the rupee and the ringgit could increase the cost ofthese borrowings and future borrowings denominated in currencies other than rupees and ringgits.Although the Group engages in currency hedging in order to decrease its currency exchange exposure,a weakening of the rupee or the ringgit against the US dollar and other major foreign currencies couldhave an adverse effect on the Group’s cost of borrowing in rupee and ringgit terms and consequentlymay increase the cost of financing its capital expenditure. In addition, the Group has experienced andcan be expected to continue to experience foreign exchange losses and gains on obligationsdenominated in foreign currencies in respect of its borrowings which could have a material adverseeffect on the Group’s results of operations.
The Group’s presentational currency is the US dollar. Therefore, it faces translation risks because,apart from certain borrowings and export related revenue, most of its assets, liabilities, revenues andexpenses are denominated in rupees and ringgits. In preparing the Group’s financial information, thevalues of those assets and liabilities are translated into US dollars at the applicable exchange rates atyear end. Revenues, other income and expenses are translated into US dollars using the applicableaverage exchange rate for the period. Consequently, increases and decreases in the value of the USdollar against other currencies, in particular the rupee and the ringgit, will affect the value of theseitems in the Group’s financial statements, even if their value has not changed in their originalcurrency.
As the Securities will be traded in US dollars, fluctuations in the value of the US dollar against othercurrencies, in particular the rupee and the ringgit, may impact the value of the Securities.
The Group may be adversely impacted by risks related to hedging activities
The Group regularly enters into hedging transactions in accordance with its hedging policy (see“Management’s Discussion and Analysis of Financial Condition and Results of Operations — HedgingActivities” for further details). The Group is exposed to potential changes in the value of its hedginginstruments primarily caused by fluctuations in currency exchange rates and interest rates. A materialdecrease in the value of the Group’s hedging instruments could have a material adverse effect on theGroup’s results of operations. For more information, see note 3.1(a) to the Historical ConsolidatedFinancial Information for the years ended June 30, 2008, 2009 and 2010.
General economic conditions could adversely affect the Group’s sales of paper
The demand for paper in India, Malaysia and international markets is closely linked to certaineconomic conditions and trends. In general, when economies grow, economic activities such ascorporate advertising, industrial production and overall consumption also tend to expand, whichincreases the consumption of paper products. The domestic Indian paper market is less impacted byinternational trends as it relies on growth in domestic paper demand. The Malaysian paper market ishighly influenced by the economy in South East Asia generally, including China, Indonesia andThailand. The international market, which is the export market for the Group, is linked to generaleconomic trends which impact demand in more mature economies. Of these three, the Group’s resultsare largely driven by the Indian paper market.
— 37 —

Demand for paper is closely linked to per capita disposable income levels and demographic trends suchas literacy rates and population levels. The annual rate of gross domestic product (“GDP”) growth inIndia and Malaysia in the year ended March 31, 2010 was 7.4% and 7.2%, respectively. With respect toincreased demand in India, primary drivers of this demand also include government spending oneducation, in particular educational materials printed on coated and uncoated woodfree paper, whichhas increased in recent years. If India’s and, to a lesser extent, Malaysia’s economies do not continueto grow at such rates, if there is an economic downturn in India or Malaysia, or if the Indiangovernment decreases or does not increase spending generally and on education in particular, themarket for the coated and uncoated wood-free paper is also likely to suffer. A sustained downturn inthe market for coated and uncoated wood-free paper could have a material adverse effect on theGroup’s results of operations.
The Group has also historically exported a portion of its production outside of India and Malaysia(almost 21% (by volume) during the nine months ended March 31, 2011). The Group’s exports arelargely dependent on spot paper prices and are impacted significantly by foreign exchange rates,particularly with respect to the US dollar, pounds sterling and rupee. Further, the Group relies in parton its US dollar denominated sales to hedge a portion of its currency risk. If US dollar denominatedsales were to increase or decrease significantly, the Group may be materially more exposed to currencyrisk. A significant economic downturn, recession or a financial crisis similar to that which began in2007 or other factors impacting paper demand or foreign exchange rates could have a material adverseeffect on the Group’s results of operations.
The Group’s strategy going forward relies significantly on its hardwood fiber sources in India and atthe SFI unit and its ability to transport either hardwood pulp and/or hardwood fiber from the SFIunit to its Bhigwan unit
For the nine months ended March 31, 2011, the Group procured approximately 42% of its hardwoodfiber requirements from its own sources at the SFI unit. Due to the limited domestic supply in India,prices for fiber can fluctuate. While the Group believes that it may be able partially to offset thenegative impact of increases in the price of fiber as a result of its source of wood at SFI in Malaysia,the Group will continue to purchase significant quantities of hardwood fiber on the market, mainly inIndia. There can be no assurance that the Group’s production costs will not increase with an increase infiber prices, thereby adversely impacting the Group’s results of operations. Costs would increasefurther if the Group were required to import wood from international sources, due to shortages in India,as international wood prices are higher than domestic wood prices.
In addition, the Group currently benefits from a contract between the government of Maharashtra andBallarpur, in which the Government of Maharashtra has agreed to provide bamboo from thegovernment forests for the production of pulp, paper, paper board and other pulp products. Ballarpur isrequired to deposit a security amount and pay the sale price in eight equal installments during eachyear. Although the Group is not a party to the agreement, the Group pays royalties based on the amountit harvests in any year. The contract is currently set to expire in 2014. Although the Group believes thatthis contract will be renewed it is currently the subject of litigation between Ballarpur and the regionalgovernment. In the event that Ballarpur and/or the Group loses the benefit of this contract or thecontract is not re-executed or is renegotiated on less favorable terms, the Group would be forced to
— 38 —
increase its market purchases of hardwood fiber or purchase wood at higher prices, which couldincrease its costs and therefore decrease its profitability. For additional information concerning thislitigation, see “Business — Material Litigation”.
Further, the Group procures a portion of its hardwood fiber in the form of wood from farm forestryprograms supported by BTTL. BTTL, a subsidiary of the Issuer’s parent entity, BILT, is not a memberof the Group and there is an agreement dated July 25, 2011 governing the relationship. The Group hasno control over BTTL’s operations and BTTL may cease such operations or alter the program whichcould result in a decrease or a cessation of the wood available from the farm forestry program.Although the Group would then source the necessary wood fiber from the market or other sources thiscould materially increase its costs and therefore decrease its profitability.
The Group intends to use hardwood fiber to enable the expansion of the hardwood pulp production atthe SFI unit, in line with increases in the availability of hardwood from its plantations, withoutincreasing its purchases of hardwood fiber from the market. The Group may therefore transport aportion of the hardwood pulp produced at the SFI unit to the Bhigwan unit for paper production. Theshipment of hardwood pulp is intended to reduce or control the Group’s costs. The value of thisresource and the availability of hardwood fiber may be compromised by a variety of factors includingfire at the unit, disease or restrictions on deforestation. Further, the Group may face restrictions ortariffs in relation to importing or exporting either hardwood fiber or hardwood pulp into India or out ofMalaysia. If the Group’s hardwood fiber supply is compromised due to fire, disease or regulatoryrestrictions or if it is unable to import or export at the expected costs, or at all, the Group may beforced to purchase additional hardwood fiber or hardwood pulp on the market which could have anadverse effect on the Group’s results of operations.
In addition, the Group plans to increase harvesting at the SFI unit, while increasing planting, in orderto maintain the sustainability of the resource. In the event that the additional planting does not producethe necessary amount of adult trees capable of harvesting or if the Group is restricted in its plantingprogram by the government or otherwise, the availability of the hardwood fiber source may not besufficient to supply the requirements of the Group and it would therefore be forced to purchasehardwood fiber or hardwood pulp at a high price on the market, which could have an adverse effect onthe Group’s results of operations.
The Group may be liable for liabilities resulting from actions taken or not taken by members of theAvantha Group or the Ballarpur Group
The Issuer and its subsidiaries are subsidiaries of BILT, which owns, indirectly, a majority of theIssuer’s ordinary shares. As a result, the Group is impacted by a number of the contractualrelationships of members of the Ballarpur Group. Ballarpur Group is owned by the Avantha Group.Consequently, the Group could incur liabilities that arise due to acts or omissions of, or events orcircumstances under the control of, members of the Ballarpur Group or the Avantha Group.
— 39 —

The Group relies on outside suppliers for significant amounts of its electricity, coal andtransportation needs and agreements for the production of chemicals and is therefore susceptible todisruptions in its supply chain, fluctuations in the prices of these production inputs and non-renewalof its agreements with chemical producers
While almost all of the Group’s energy is supplied by on-site facilities owned by the Group or AvanthaPower, the Group and Avantha Power, as the case may be, purchase all of the coal and, with respect tothe SFI unit, oil used in these facilities from outside sources. Although coal in India is partly allocatedby the Government to certain industries, including paper production, thereby limiting pricefluctuations, there can be no assurance that coal prices will not fluctuate to a material degree despitethis program or that this program will continue in the future. The SFI production facility is mainlyoil-fuelled (and partly bio-fuelled) and the Group purchases oil on the open market, subject to pricefluctuations. The cost and/or price of the energy produced is therefore highly dependent on market oilprices, over which the Group has no control, and may in the future be dependent on market coal prices.
The Group also depends on third party transportation providers for the supply of raw materials anddelivery of finished products. Any failure by such providers to deliver the raw materials on time or anystrike by such transporters or transport unions or any significant increase in the cost of transportationby such operators could have an impact on the production schedules and this could have an adverseimpact on the operations and profitability of the Group. Transportation strikes by members of variousIndian transportation unions have occurred in the past and may occur in the future. This could have anadverse impact on the timely receipt of supplies by the Group and on the ability to deliver finishedproducts to the customers. In addition, increases in transportation costs may have an adverse effect onits business and results of operations.
The Group has a number of agreements with chemical producers to supply chemicals necessary forpaper production. These agreements are subject to renewal at various intervals. If the Group is unableto renew any of these agreements, it may not be able to procure the chemical materials necessary forpaper production, which could have a material adverse effect on the Group’s business and results ofoperations.
In the event of a material price increase or significant interruption or limitation in the supply of theseitems from the Group’s current suppliers, the Issuer would seek to obtain them from other sources.However, there can be no assurance that the Group would be able to do so without an adverse impacton its manufacturing operations, such as an interruption or downscaling of production, a change in theproduct mix or increased costs. This could have a material adverse effect on the Group’s results ofoperations.
Increased competition in the Indian paper industry may adversely affect the Group’s results ofoperations
There are over 570 producers in the Indian writing and printing paper industry, with productioncapacities ranging from less than 1,000 tpa to over 500,000 tpa. Of these, the ten largest producersaccounted for 32% of total industry production in the year ended June 30, 2010, and the Groupanticipates that there could be consolidation in the industry as producers either go out of business, are
— 40 —

acquired by larger companies or merge in order to compete more effectively. In addition, asenvironmental standards and regulations increase, which may lead to increased costs to comply withsuch standards and regulations, smaller companies may be unable to compete and either go out ofbusiness or consolidate.
This consolidation could lead to a competitive landscape in India in which domestic companies haveaccess to debt and equity financing in the international capital markets or greater access to moreadvanced technology through strategic alliances between competitors, which may increase competitionin the paper market and lower prices and margins. Such lower prices and margins could have materialadverse effects on the Group’s results of operations.
In addition, if the Indian and, to a lesser extent, Malaysian markets continue to grow and therebybecome more attractive to international paper companies, the Group will be likely to face additionalcompetition from international competitors with greater experience in the international markets asthese competitors seek to access the market through either organic growth or acquisitions. Inparticular, the uncoated woodfree paper market has not to date been a focus of non-Indian companies,which may change if demand in this market continues to grow. Further, if costs associated withdistribution to customers in India decrease for international companies, either as a result of theacquisition of an Indian company or improved infrastructure and distribution networks, the Indianmarket may become less insulated from international competition. Such companies may have greaterfinancial and/or other resources than the Group. The Group may be unable to match the products and/orservices offered by international competitors.
This increased competition may impact the Group’s overall sales and/or its ability to charge a premiumfor its products, which could have a material adverse effect on the Group’s results of operations.
A reduction in the level of tariffs imposed on paper imported into India could make imported paperless expensive and therefore more competitive
As of March 31, 2011, the tariffs, including ad valorem duty, on imported coated and uncoated wood-free paper in India were 11.63% (excluding available credits). These tariffs either increase the price ofimported products or require international companies seeking to sell products in India to do so atdecreased margins, which makes India a less attractive market to non-Indian paper companies. If suchtariffs were reduced or eliminated, products from international paper companies could be priced morecompetitively. This may result in increased competition, lower sales or lower prices achieved by theGroup, any of which could have a material adverse effect on the Group’s results of operations.
The Group may not be able to hire and retain sufficient numbers of qualified professional personnelthat it needs to succeed because these personnel are limited in number and in high demand
The success of the Group’s business will depend on its ability to identify, attract, hire, train, retain andmotivate skilled personnel. Competition for qualified professional personnel is intense as thesepersonnel are in limited supply particularly as the Indian and Malaysian economies continue to growand mature.
— 41 —
At March 31, 2011, the Group employed approximately 5,837 people at its Indian pulp and paperproduction facilities. Historically, due to the remote location of the Group’s units, it has had difficultyin hiring and retaining quality personnel. This has been true in both India and at the SFI unit, where theGroup has increased its usage of mechanized logging equipment due to a difficulty in recruitingpersonnel, which is largely non-indigenous to Malaysia. These problems may continue or worsen as theGroup seeks to expand its production capacity and the inability to increase employees may restrict theGroup’s ability to expand.
If the Group continues to expand financial and technical management of the Group, training andretaining sufficiently skilled technical and management personnel and developing and improvinginternal administrative infrastructure will be increasingly important. This is particularly true as theGroup seeks to continue to grow its accounting and internal reporting resources. The Group’s growthdepends on its ability to meet these challenges successfully, and any inability to do so could have amaterial adverse effect on the Group’s business, results of operations and financial condition.
In addition, at March 31, 2011, the Group employed approximately 2,190 people at its Malaysianplantation and paper production facilities. In the past, it has at times been difficult to recruit and hiresufficient employees for the Malaysian operations as a result of a relatively limited number of potentialemployees in Malaysia and restrictions on foreign workers. As a result, the Group might not be able tohire and retain sufficient numbers of such personnel to grow its business and failure to do so couldadversely affect the Group’s results of operations.
Changes in customer preferences may have an adverse effect on demand for the Group’s productsand its profitability
Changes in customer preferences have affected the demand for paper in general and for specific gradesof paper. For example, some of the most significant changes in customer preferences in mature papermarkets include the decrease in direct-mail advertising, interest in environmentally-friendly products,increased use of e-mail, e-readers and electronic media and increased use of personal computers. TheGroup’s ability to meet such shifts in demand for its products due to changes in customer demand willdepend, in part, on its ability to anticipate changes in customer preferences and its ability to developand produce new products on a competitive and economic basis. There can be no assurance that theGroup will be able to predict and/or meet changes in customer preferences in the future. A failure to doso could have a material adverse effect on the Group’s results of operations.
The Group’s insurance policies may be insufficient to cover certain eventualities
Whilst the Group has insurance policies which the Issuer believes are appropriate, these insurancepolicies may not adequately cover all risks and catastrophic events, and any particular claim may notbe paid. For example, the Group has not insured the natural forest or plantation areas at the SFI unit,which could lead to losses in the value of this asset and, under the terms of the Group’s lease, lead tofurther costs. Further, the Group’s insurance policies on certain properties would not cover the entirevalue of the property because the properties are undervalued for purposes of the insurance policy.A catastrophic event or multiple catastrophic events may cause large losses and could have a materialadverse effect on the Group’s business, results of operations or financial condition. Natural
— 42 —

catastrophic events to which the Group is exposed include, among others, fires, windstorms, severewinter weather, monsoons and floods, which are unpredictable in terms of both their occurrence andseverity. The Group is also exposed to man-made catastrophic events, including acts of terrorism,which may have a significant adverse impact on the industry where the Group operates and the Group’sbusiness. Any such incident could have an impact on the Group’s business, financial condition andprofitability.
Any future acquisitions may not be successful
There is a risk that any future acquisitions may be unsuccessful. Expected revenue gains and/or costsavings might not be realized, and/or unexpected additional costs might be incurred. If the Group isunable to successfully integrate such acquisitions, it may not be able to obtain the advantages that anacquisition is intended to achieve which would have a material adverse effect on the Group’s results ofoperations. Though diligence is performed in respect of each acquisition, there is no guarantee thatsuch acquired companies will be financially successful when integrated into the Group, which couldhave a material adverse effect on the Group’s results of operations.
The Group may face high compliance or clean-up costs under environmental and health and safetylaws and regulations, which could reduce profit margins and earnings
The Group is subject to a wide range of environmental and health and safety laws and regulations,including national, state and local laws and regulations. These requirements are complex, frequentlychanging and have tended to become more stringent over time. There can be no assurance that therequirements of such laws and regulations and the associated cost of compliance will not increase inthe future. Such increases in compliance costs could have a negative impact on the results ofoperations of the Group.
While the Group has procedures in place to allow it to comply with its environmental and health andsafety obligations, there can be no assurance that the Group will be at all times in compliance with itsobligations, that the Group will not incur material costs or liabilities in connection with suchobligations in the future. The Group experienced two fatalities in each year ended June 30, 2008 and2009, respectively, one fatality in the year ended June 30, 2010, and five fatalities between July 2010and May 2011. There can be no assurance that the Group will not experience further such or less severeaccidents.
There can also be no assurance that the Group will not become liable for environmental contaminationin the future or that an event giving rise to such liability may not have already occurred (includingsuch liability to buyers of properties or businesses that the Group has previously sold). Further, thedischarge of pollutants exceeding the permitted levels may cause damage which gives rise to liabilitiescausing the state pollution control boards and/or third parties to initiate action. For example, the Groupis currently subject to litigation as a result of pollution from the Ballarpur unit. See “Business —Material Litigation”.
The Group may incur significant expenditure in connection with the required remediation of past orfuture environmental conditions. In addition, the Group may also incur significant expenditures inorder to comply with any present and new environmental laws, regulations, taxes or fees. There can
— 43 —

also be no assurance that the Group will not be required to incur significant costs to maintaincompliance with existing and future laws, regulations and policies relating to these or similar matters.Such expenditures and liabilities could adversely affect the Group’s results of operations. In addition,part of the operations of the Group (paper or pulp production facilities) may in the future be adverselyaffected by the climate change legislation or similarly focused legislation.
The Group believes that it operates its business in an environmentally sustainable manner (see“Business — Operational strengths” for further details). However, there can be no assurance thatenvironmental groups and similar organizations will not mount campaigns against the Group which,were they to occur, could have an adverse effect on the reputation of the Group.
The Group requires several statutory and regulatory permits, licenses and approvals for its business.The failure to obtain and/or renew any approvals or licenses in future may have an adverse impacton the Group’s operations
The Group has obtained various approvals, registrations and clearances for operating its business.Certain applications for issuance or renewal of approvals may be required in the future. While theGroup believes that all necessary permits and approvals will be issued or renewed in due course, thereis no assurance that the relevant authorities will issue or renew any such permits or approvals in timeor at all.
Further, the Group’s statutory and regulatory approvals and licenses, including environmentalapprovals, are subject to numerous conditions, some of which are onerous and require the Group toincur substantial expenditure. While the Group believes it will obtain and comply with all necessarylicenses, permits and approvals, there can be no assurance that the Group will be able to obtain orcomply with all necessary licenses, permits and approvals required for the Group’s business in a timelymanner or at all, which could have a material adverse effect on the Group’s business and operations.Although the Issuer has no reason to believe it would occur, there can be no assurance that theapprovals, licenses, registrations and permits issued to the Group will not be suspended or revoked inthe event of non-compliance or alleged non-compliance with any terms or conditions thereof, orpursuant to any regulatory action.
The loss of the Issuer’s senior management could adversely affect its business
The Group’s success depends in part on the continued services of the Issuer’s chairman, ChiefExecutive Officer and other key members of senior management. The Group does not carry key personlife insurance on any of the Issuer’s senior management personnel. If the Issuer loses the services ofkey senior management personnel, it would be very difficult to find and integrate replacementpersonnel in a timely manner. R. Vederah, B. Hariharan and Yogesh Agarwal, in particular, are closelyinvolved in the overall strategy, direction and management of the business. The loss of any of thesenior management could impair the Issuer’s ability to implement its strategy, and thus have a materialadverse effect on the Group’s results of operations.
The Group may be subject to increased labor costs and/or labor disruptions
If the Indian and Malaysian economies continue to grow, cost of living and expenses within thesecountries may increase and may result in increased wages and labor costs. The scarcity of skilled
— 44 —

workers is also an important driver of wages and salaries. If such events occur, the Group may be lesscompetitive in both its domestic and international markets which would adversely impact the Group’sresults of operations.
The Group’s manufacturing activities depend on the availability of skilled and unskilled labor. Theinability to attract labor or maintain harmonious relationship with them could affect the operations ofthe Group. While the Issuer believes that relations between the Group and its employees and theirrepresentative unions are satisfactory in both India and Malaysia, there can be no assurance that futuredevelopments in relation to the Group’s businesses would not affect such relationships. For instance, alabor dispute arose in November 2005 at the Kamalpuram unit resulting in a strike for 22 days.Furthermore, the Group’s most recent labor dispute, in 2008, resulted in a temporary closure of theKamalpuram unit production facility for 17 days. Any future sustained labor dispute, strike or workstoppage leading to a substantial interruption to the business of the Group could have a materialadverse effect on the Group’s results of operations, particularly given the dependence on a largeworkforce.
The Group is currently transitioning to a new IT system and has developed a plan to increase therobustness of its internal reporting and controls procedures and its disclosure policies, although thenew system and the transition process may not be as effective as anticipated
Currently, the Group uses different financial reporting systems for its Indian subsidiary, its SFI unitand its Dutch subsidiary, BPH. As a result, the Group’s internal reporting functions are not fullyintegrated. Therefore, as part of its overall IT strategy, the Group plans to upgrade the Group’s systemsto a fully integrated financial reporting system, via a phased implementation. While for the Indianunits this represents an upgrade and not the implementation of a new system, it will be a transition to anew system for the SFI unit and Dutch subsidiary. The Group intends to maintain the current systemwhile implementing the new system. Maintaining two systems and/or a delay in the implementation ofthe new system may require additional time and focus from management. The new system and thetransition process may not be as effective as anticipated, which could, in turn, have a material adverseimpact on its ability to implement other projects or manage the business, thus potentially negativelyimpacting the Group’s prospects and/or results of operations.
The Group does not own or directly control the use of the “BILT” brand
The majority of the products manufactured and sold by the Group are marketed under brands(including the “BILT” brand) licensed from BILT under a trademark license agreement. BGPPL andthe Group have agreed to certain obligations including not to do anything which could reasonably beexpected to bring the trademarks or the Group into disrepute or which could otherwise damage thegoodwill attaching to the trademarks. The license agreement which governs the licensing the “BILT”brand to the Group may be withdrawn or may not be renewed, which may adversely impact the Group’sbusiness and results of operations. The trademark license agreement between the Group and BILTgoverns the licensing of the “BILT” brand to the Group. As the Group is not the owner but a licensee,it will be subject to the risks to which licensees of brand are generally subject, which may at timeshamper its use of the “BILT” brand.
— 45 —
BGPPL is presently involved in certain legal proceedings, and any adverse decision in any of theseproceedings may have a material adverse effect on the business, results of operations and financialcondition of the Group.
BGPPL is presently involved in two environmental proceedings, two civil proceedings and onearbitration proceeding which have been filed against BGPPL in various forums in India and which, ifdetermined against BGPPL, may have a significant effect on the Group’s financial position orprofitability. For details of these cases, see “Business — Material Litigation”. The Group cannotprovide any assurance that these matters will be decided in favor of BGPPL or that similar proceedingswill not be initiated against BGPPL in the future.
Natural calamities could have a negative impact on the Indian and Malaysian economies and couldcause the Group’s business to suffer and the trading price of the Securities to decrease
India and Malaysia have experienced a number of natural calamities, such as fires, earthquakes,windstorms, tsunamis, floods and droughts in recent years. Natural calamites could have an adverseimpact on the Indian and Malaysian economies which, in turn, could adversely affect the Group’sbusiness, and may damage or destroy the Group’s facilities or other assets. The Issuer cannot assureprospective investors that insurance coverage the Group maintains for these risks will adequatelycompensate the Group for all damagers and economic losses resulting from natural catastrophes, orpossible business interruptions. This could cause the Group’s business to suffer and the trading price ofthe Securities to decrease.
Risks Associated with Investing in Indian and/or Malaysian Companies
Political instability or changes in the Governments in India or in Malaysia could delay the furtherliberalization of the Indian or Malaysian economy and adversely affect economic conditions in Indiaor in Malaysia generally and the Group’s business in particular
All of the Group’s manufacturing facilities and all of its sales and distribution network are located inIndia and Malaysia, and in the nine months ended March 31, 2011, approximately 79% of the Group’ssales volume was derived from its domestic markets. The Group’s business, and the market price andliquidity of the Securities, may be affected by foreign exchange rates and controls, interest rates,changes in government policy, taxation, social and civil unrest and other political, economic or otherdevelopments in or affecting India.
Since 1991, successive Indian Governments have pursued policies of economic liberalization,including significantly relaxing restrictions on the private sector. Nevertheless, the roles of the Indiancentral and state governments in the Indian economy as producers, customers and regulators haveremained significant. The rate of economic liberalization could change, and specific laws and policiesaffecting paper and pulp companies, foreign investment, currency exchange and other matters affectinginvestment in the Securities could change as well. A significant change in India’s economicliberalization and deregulation policies could adversely affect business and economic conditions inIndia generally and the Group’s business in particular if new restrictions on the private sector areintroduced or if existing restrictions are increased.
— 46 —

Malaysia has also experienced a recent drive for economic liberalization, which has sought to attractforeign investment and ease the pro-Malay economic policy that was introduced in the 1970s.However, strict regulations still exist and if Malaysia’s economic liberalization policies were reversedor new restrictions on the private sector are introduced or if existing restrictions are increased thiscould also adversely affect business and economic conditions in Malaysia.
Regional conflicts or acts of terrorism or violence in India, Malaysia or export markets couldadversely affect the economy and cause the Group’s business to suffer
Asia has from time to time experienced instances of civil unrest and hostilities among neighboringcountries, including between India and Pakistan. Also, civil unrest in Iraq continues, as does theinstability in Afghanistan. Events of this nature, as well as social and civil unrest in other countries inAsia, could influence the Indian and Asian economies and could have a material adverse effect on themarket for the Securities and the Group’s products.
Terrorist attacks, such as the attacks in Mumbai in July 2011 and November 2008, the bomb blasts thatoccurred in Mumbai in August 2003 and in July 2006, the October 2004 bomb blasts that occurred innorth-east India, the attacks on the World Trade Center in New York and the Pentagon in WashingtonD.C. on September 11, 2001 and the bomb blasts in London on July 7, 2005, as well as other acts ofviolence or war, including those involving India and the United States or other countries, mayadversely affect Indian and worldwide financial markets. India’s neighbor, Pakistan, is currentlyexperiencing increasingly intense terrorist activities and fighting.
India has also experienced internal conflict, including terrorist attacks on major international hotels inMumbai in 2008 and the Naxalism insurgency. Violence as a result of the Naxalism insurgency hasoccurred around the Kamalapuram unit and its nearby sources of bamboo, at times temporarilyinterrupting the Group’s ability to acquire this fiber source. Acts of violence may result in a loss ofbusiness confidence and may have other consequences that could adversely affect the Group’s resultsof operations, including interrupting supply of raw materials. Travel and cargo transport restrictions asa result of such attacks may have an adverse impact on the Group’s ability to operate effectively.
If inflation increases, the Group’s results of operations and financial condition may be adverselyaffected
India has experienced high levels of inflation since 1980. The average annual inflation rates in Indiaand Malaysia from 2005 to 2010 were approximately 9% and 3% respectively according to theInternational Monetary Fund’s World Economic Outlook Database October 2010. According to theRBI, the headline inflation rate for May 2011 reached 9.1%. In the event that inflation remains high, orincreases or if global inflation increases, certain of the Group’s costs, such as salaries, travel costs andrelated allowances, which are typically linked to general price levels, may increase, and the Group maynot be able to recoup these increases through higher prices which could adversely affect the Group’sresults of operations.
— 47 —

Taxes and other levies imposed by the central or state governments in India or regulations applyingto the Group could have a material adverse effect on the demand for its products and/or on itsresults of operations
Taxes and other levies imposed by the central or state governments in India and Malaysia that affectthe Group’s operations include customs duties on imports of raw materials, components, capital goodsand finished products as well as excise duties and interstate taxes. These taxes and levies affect thecost of production and prices of the Group’s products and therefore the demand for its products.Further, as a result of India’s state structure, each state maintains separate systems of taxation whichmay be materially different, requiring the Group to monitor such state systems which can be costly andtime consuming.
An increase in any of these taxes or levies, or the imposition of new taxes or levies in the future, couldadversely affect the Group’s results of operations.
The proposed new taxation system (Direct Tax Code Bill, 2010 (“DTC”)) could adversely affect thebusiness, future financial performance of the companies operating in India
Government of India has proposed new tax legislation (DTC) in the Indian Parliament. The DTC iscurrently envisaged to come into force from April 1, 2012 and proposes to introduce, among others,changes in the scheme of taxation of income of residents and non-residents in India. The DTC iscurrently a bill and may be amended prior to coming into force and there is no certainty about thenature and extent of the amendments, if any. As the taxation system is going to undergo significantoverhaul, its long-term effects are unclear as of the date of this Offering Circular and there can be noassurance that such effects would not adversely affect the business, future financial performance of thecompanies operating in India.
Any downgrade of India’s sovereign debt rating by a credit rating agency could have an adverseeffect on the ability to raise finance on commercially acceptable terms
Any adverse revision of India’s credit ratings for domestic or international debt by international ratingagencies may have a material adverse effect on the Group’s ability to raise additional financing, andthe interest rates and other commercial terms at which such additional financing is available.
Investors may have difficulty enforcing judgments against the Group or the Group’s Directors ormanagement
Most of the Issuer’s Directors and executive officers are residents of India. Further, a substantialportion of the Group’s assets and the assets of such persons are located in India. As a result, it may notbe possible for investors to effect service of process upon the Group or such persons in jurisdictionsoutside India or to enforce judgments obtained against the Group or such persons in courts outsideIndia. India is not a party to any international treaty in relation to the recognition or enforcement offoreign judgments. Recognition and enforcement of foreign judgments is provided for under Section 13and Section 44A of the Code of Civil Procedure, 1908 as amended (the “Civil Code”). Section 13 ofthe Civil Code provides that a foreign judgment will be conclusive as to any matter thereby directlyadjudicated upon between the same parties or between parties under whom they or any of them claim
— 48 —

litigation under the same title except (i) where it has not been pronounced by a court of competentjurisdiction, (ii) where it has not been given on the merits of the case, (iii) where it appears on the faceof the proceedings to be founded on an incorrect view of international law or a refusal to recognize thelaw of India in cases where such law is applicable, (iv) where the proceedings in which the judgmentwas obtained were opposed to natural justice, (v) where it has been obtained by fraud or (vi) where itsustains a claim founded on a breach of any law in force in India.
Section 44A of the Civil Code provides that where a foreign judgment has been rendered by a superiorcourt in any country or territory outside India which the Government has by notification declared to bea reciprocating territory, it may be enforced in India by proceedings in execution as if the judgmenthad been rendered by the court in India where it has been filed for execution. However, Section 44A ofthe Civil Code is applicable only to monetary decrees not being in the nature of any amounts payablein respect of taxes or other charges of a like nature or in respect of a fine or other penalty.
The United States has not been declared by the Indian Government to be a reciprocating territory forthe purpose of Section 44A of the Civil Code. However, the United Kingdom has been declared by theGovernment to be a reciprocating territory. Accordingly, a judgment of a court in the United Statesmay be enforced only by a fresh suit upon the judgment and not by proceedings in execution. The suitmust be brought in India within three years from the date of the judgment in the same manner as anyother suit filed to enforce a civil liability in India. It is unlikely that a court in India would awarddamages on the same basis as a foreign court if an action is brought in India. A party seeking toenforce a foreign judgment in India is required to obtain approval to repatriate outside India anyamount recovered.
There are certain limitations in India’s property title registration system and other associated risksin relation to real property
In contrast to many other countries, India does not have a central title registry for real property. Titleregistries are maintained at the state and district level and since computerization of such records beganonly recently, may not be available online for inspection. Title to land is often fragmented and landmay have multiple owners. Land may also have irregularities of title, such as non-execution ornon-registration of conveyance deeds and inadequate stamping, and may be subject to encumbrances ofwhich the Group may not be aware. As a result of such inadequacies, deeds and other propertydocumentation can sometimes not reflect what is carried out in practice.
The difficulty of obtaining title guarantees in India means that title records provide only forpresumptive rather than guaranteed title. In addition, because it is a practice in some parts of India(especially in villages) for transfers of title upon deaths of family members and in certain othercircumstances to be made only by mutation in local revenue records, changes in the ownership of landmay not be registered with the relevant land registry in a timely manner or at all. Title registries andlocal revenue records may not be updated or complete. As such, legal defects and irregularities mayexist in the titles to the properties on which the Group’s existing facilities and future facilities arelocated. The Group’s rights in respect of these properties may be compromised by improperlyexecuted, unregistered or insufficiently stamped conveyance instruments, unregistered encumbrancesin favor of third parties, rights of adverse possessors, ownership claims of family members of prior
— 49 —

owners, or other defects that the Group may not be aware of. These defects may arise after land isacquired by the Group, and are not necessarily revealed by a title due diligence, on account of variousfactors including but not limited to incomplete land records, transactions without registered documents,the decentralized nature of maintenance of land registries and local revenue records, property-relatedlitigation in India and family disputes in the sellers’ family. Any defects or irregularities of title mayresult in litigation and/or the loss of development rights over the affected property. Legal disputes inrespect of land title can take several years and considerable expense to resolve if they become thesubject of court proceedings and their outcomes can be uncertain. There can also be no assurance thatsuch disputes will not arise in the future.
A decline in India’s or Malaysia’s foreign exchange reserves may affect liquidity and interest ratesin the Indian or Malaysian economy, which could have an adverse impact on the Group
India’s foreign exchange reserves increased, on a balance of payment basis (excluding valuationeffects), by US$13,813 million during the year ended December 31, 2010, as compared to an increaseof US$28,281 million during year ended December 31, 2009. According to the weekly statisticalsupplement of the RBI Bulletin, India’s foreign exchange reserves totalled US$305.5 billion as atApril 1, 2011. A sharp decline in these reserves could result in reduced liquidity and higher interestrates in the Indian economy. To a lesser extent, a sharp decline in Malaysia’s foreign exchangereserves could also result in reduced liquidity and higher interest rates in the Malaysian economy.Reduced liquidity or an increase in interest rates in the economy following a decline in foreignexchange reserves could have a material adverse effect on the Group’s results of operations andfinancial condition.
Risks relating to the Group’s structure
Avantha Group and Ballarpur Group are able to exert significant influence over the Group and theirinterests may conflict with those of the Securities Holders
As of the date of this Offering Circular, Ballarpur Group owns approximately 72.3% of the issuedshares of the Issuer. As a result, Ballarpur Group (and, through Ballarpur Group, Avantha Group) isable to exercise significant influence over certain of the Issuer’s corporate decisions, including theelection or removal of Directors, the declaration of dividends, whether to accept the terms of atakeover offer and the determination of other matters to be decided by the Issuer’s shareholders. Byexercising its powers of control, Ballarpur Group could take certain actions regarding changes in thecontrol of the Issuer or in its capital structure or regarding business combinations involving the Issuer,or encourage or discourage a potential acquirer from making a tender offer or otherwise attempting toobtain control of the Issuer. There can be no assurance that the Avantha Group’s and the BallarpurGroup’s interests will not conflict with those of the Securities Holders.
For more information on the Group’s borrowings from related parties, see note 21.2 to the HistoricalConsolidated Financial Information for the years ended June 30, 2008, 2009 and 2010.
The Group has entered into, and may continue to enter into, certain related-party transactions
The Group has entered into certain related party transactions, which have been disclosed in itsfinancial statements. See note 21.2 and note 37 to the Historical Consolidated Financial Information
— 50 —

and note 22 to the Unaudited Consolidated Interim Financial Information included herein. For furtherdetails of agreements entered with related parties, see “Business — Material Contracts” and“Relationship with the Ballarpur Group and the Avantha Group”. While the Group believes that allsuch transactions have been conducted on an arm’s length basis, there can be no assurance that theGroup could not have achieved more favorable terms had such transactions been entered into withunrelated parties.
Risks relating to the Offer and the Securities
The Securities may not be a suitable investment for all investors
Each potential investor in the Securities must determine the suitability of that investment in light of itsown circumstances. In particular, each potential investor should:
(i) have sufficient knowledge and experience to make a meaningful evaluation of theSecurities, the merits and risks of investing in the Securities and the informationcontained in this Offering Circular or any applicable supplement;
(ii) have access to, and knowledge of, appropriate analytical tools to evaluate, in the contextof its particular financial situation, an investment in the Securities and the impact theSecurities will have on its overall investment portfolio;
(iii) have sufficient financial resources and liquidity to bear all of the risks of an investment inthe Securities, including where the currency for principal or Distribution payments isdifferent from the potential investor’s currency;
(iv) understand thoroughly the terms of the Securities and be familiar with the behavior of anyrelevant financial markets; and
(v) be able to evaluate (either alone or with the help of a financial adviser) possible scenariosfor economic, interest rate and other factors that may affect its investment and its abilityto bear the applicable risks.
The Securities are complex investment securities. Sophisticated institutional investors generally do notpurchase complex investment securities as stand-alone investments. They purchase complex investmentsecurities as a way to reduce risk or enhance yield with an understood, measured, appropriate additionof risk to their overall portfolios. A potential investor should not invest in the Securities unless it hasthe expertise (either alone or with a financial adviser) to evaluate how the Securities will performunder changing conditions, the resulting effects on the value of the Securities and the impact thisinvestment will have on the potential investor’s overall investment portfolio.
The Securities are perpetual securities and investors have no right to require redemption
The Securities are perpetual and have no fixed maturity date. Securities Holders have no right torequire the Issuer to redeem the Securities at any time and they can only be disposed of by sale.
— 51 —

Holders who wish to sell their Securities may be unable to do so at a price at or above the amount theyhave paid for them, or at all, if insufficient liquidity exists in the market for the Securities. Therefore,Securities Holders should be aware that they may be required to bear the financial risks of aninvestment in the Securities for an indefinite period of time.
The Securities are subordinated obligations
The Securities will, subject to such subordination being agreed to between the creditor and all relevantdebtors, be subordinated obligations of the Issuer in terms of its other senior and subordinated debts.The Securities will rank pari passu with each other in a winding-up of the Issuer. In the event of ashortfall of funds on a winding-up, there is a real risk that an investor in the Securities will lose all orsome of its investment and will not receive a full return of the principal amount or any unpaid Interestor Arrears of Interest.
Securities Holders are advised that liabilities of the Issuer may also arise out of events that are notreflected on the balance sheet of the Issuer, including, without limitation, the issuance of guarantees.Claims made under such guarantees will become unsubordinated liabilities of the Issuer (as the casemay be) that in a winding-up of the Issuer will need to be paid in full before the obligations under theSecurities may be satisfied.
The Issuer may redeem the Securities under certain circumstances
Securities Holders should be aware that the Securities may be redeemed at the option of the Issuer (inwhole but not in part) at their principal amount (plus any accrued and outstanding Interest and anyoutstanding Deferred Interest) on the First Call Date, the Second Call Date or on any Interest PaymentDate thereafter. The Securities are also subject to redemption (in whole but not in part) at the Issuer’soption, at the times and prices specified in “Description of the Perpetual Capital Securities”, upon theoccurrence of a Withholding Tax Event, Change of Control, Tax Deduction Event, Capital Event orAccounting Event (each as defined in the “Description of the Perpetual Capital Securities”) orSqueeze-out Event. The relevant redemption amount may be less than the then current market value ofthe Securities.
The date on which the Issuer elects to redeem the Securities may not accord with the preference ofindividual Holders. This may be disadvantageous to Holders in light of market conditions or theindividual circumstances of the Holder of Securities. In addition, an investor may not be able toreinvest the redemption proceeds in comparable securities at an effective interest rate at the same levelas that of the Securities.
Securities Holders may not receive Interest payments if the Issuer elects to defer Interest payments
The Issuer may, at its sole discretion, elect to defer any scheduled Interest on the Securities for anyperiod of time. The Issuer is not subject to any limits as to the number of times Interest can bedeferred. Although Interest is cumulative, the Issuer may defer their payment for an indefinite periodof time by delivering the relevant deferral notices to holders of the Securities.
Any deferral of Interest will likely have an adverse effect on the market price of the Securities. Inaddition, as a result of the Interest deferral provision of the Securities, the market price of the
— 52 —

Securities may be more volatile than the market prices of other debt securities on which original issuediscount or interest accrues that are not subject to such deferrals and may be more sensitive generallyto adverse changes in our financial condition.
There is no limitation on issuing senior or pari passu securities
There is no restriction on the amount of securities or other liabilities which the Issuer may issue orincur and which rank senior to, or pari passu with, the Securities. The issue of any such securities orthe incurrence of any such other liabilities may reduce the amount (if any) recoverable by SecuritiesHolders on a winding-up of the Issuer and/or may increase the likelihood of a deferral of InterestPayments under the Securities. The issue of any such securities or the incurrence of any such otherliabilities might also have an adverse impact on the trading price of the Securities and/or the ability ofHolders to sell their Securities.
Fixed rate securities have a market risk
The Securities will bear interest at a fixed rate (with such rate being reset every five years by referenceto the then yield of five year U.S. Treasury securities). A holder of a security with a fixed interest rateis exposed to the risk that the price of such security falls as a result of changes in the current interestrate on the capital market (the “Market Interest Rate”). While the nominal interest rate of a securitywith a fixed interest rate is fixed during the life of such security or during a certain period of time, theMarket Interest Rate typically changes on a daily basis. A change of the Market Interest Rate causesthe price of such security to change. If the Market Interest Rate increases, the price of such securitytypically falls. If the Market Interest Rate falls, the price of a security with a fixed interest ratetypically increases. Investors should be aware that movements of the Market Interest Rate canadversely affect the price of the Securities and can lead to losses for the Securities Holders if they sellthe Securities.
The Issuer’s right to redeem the Securities is subject to compliance by the Issuer and the RestrictedEntity (as defined in the Replacement Capital Covenant) with the replacement capital covenant
At or around the time of issuance of the Securities, each of the Issuer and BILT has undertaken in acovenant (the “Replacement Capital Covenant”) for the benefit of holders, from time to time, ofdesignated series of debt securities of the Issuer that meet the Eligibility Criteria (as defined in theReplacement Capital Covenant), that each of the Issuer and the Restricted Entity (subject to certainexemptions) will not repay, redeem or purchase, and will procure that its subsidiaries will notpurchase, the Securities from the Issue Date to the earlier of August 11, 2041 or the date on which theReplacement Capital Covenant is otherwise terminated, unless the Restricted Entity or any of itssubsidiaries has sold or issued shares or certain equity-like instruments during a period of 360 daysprior to the date of that repayment, redemption or purchase. This undertaking may prevent the Issuerfrom repaying, redeeming or purchasing the Securities even in circumstances where such repayment,redemption or purchase would be in the interest of the Issuer and the Securities Holders because it wasnot able to obtain proceeds from the issuance or sale of such financing instruments as designated in thereplacement capital covenant.
— 53 —

There are limited remedies for non-payment under the Securities
Any scheduled Interest will not be due if the Issuer elects to defer that Interest pursuant to the terms ofthe Securities and the Indenture. Notwithstanding any of the provisions relating to non-paymentdefaults, the right to institute Winding-Up proceedings is limited to circumstances where payment hasbecome due and the Issuer fails to make the payment when due or where the Issuer is subject to aWinding-Up, except in certain cases as further described in the “Description of the Perpetual CapitalSecurities — Non-Payment and Enforcement”. The only remedy against the Issuer available to theTrustee or (where the Trustee has failed to proceed against the Issuer as provided in the terms of theSecurities and the Indenture) any Securities Holders for recovery of amounts in respect of theSecurities following the occurrence of a payment default after any sum becomes due in respect of theSecurities or the Issuer being subject to a Winding-Up, except in certain cases as described above, willbe instituting Winding-Up proceedings and/or proving in any Winding-Up in respect of any of theIssuer’s payment obligations arising from the Securities and the Indenture. In addition, the right toinstitute Winding-Up proceedings and/or proving in any Winding-Up in respect of any of the Issuer’spayment obligations arising from the Securities and the Indenture is limited to circumstances providedby applicable law.
There are limited remedies for non-compliance with the restrictions set out in the “Description ofthe Perpetual Capital Securities — Restrictions in the Case of Deferral” by either BILT or theRelevant Listco, if it is not the Issuer
BILT and, in certain circumstances, the Relevant Listco, if it is not the Issuer, are subject to therestrictions set out in the “Description of the Perpetual Capital Securities — Restrictions in the Case ofDeferral”. In the event BILT or the Relevant Listco, if it is not the Issuer, fails to comply with suchrestrictions, neither the terms of the Securities nor the Indenture provides any express contractualremedy against either of them or the Issuer. The only available remedy against BILT or the RelevantListco, if it is not the Issuer, available to the Securities Holders or the Trustee for recovery of anydamages suffered by the Securities Holders as a result of BILT or the Relevant Listco, if it is not theIssuer, failing to comply with such restrictions will be instituting a legal proceedings against BILT or,as the case may be, the Relevant Listco and proving that such damages were so suffered. There can beno assurance that damages, if proved and awarded, will be a sufficient remedy for any losses sufferedby the Security Holders for any such non compliance by BILT or the Relevant Listco.
The Issuer is a holding company and payments with respect to the Securities are structurallysubordinated to liabilities, contingent liabilities and obligations of the Issuer’s subsidiaries
The Issuer is a holding company with no material operations. The Issuer owns assets and conducts itsbusiness operations through its subsidiaries. The Securities will not be guaranteed by any current orfuture subsidiaries of the Issuer unless, in the event of an Initial Public Offering (as defined in the“Description of the Perpetual Capital Securities”), the Relevant Listco is either a subsidiary of theIssuer or a Sideco (as defined in the “Description of the Perpetual Capital Securities”), and in eithercase is not substituted as principal debtor under the Indenture and the Securities, the Issuer mustprocure the Relevant Listco to provide a guarantee on a subordinated basis (as described in the“Description of the Perpetual Capital Securities — Initial Public Offering”) the payment of anyamounts payable under the Securities or Indenture.
— 54 —

The Issuer’s primary assets are ownership interests in its subsidiaries. Accordingly, the Issuer’s abilityto pay principal, Interest, any Arrears of Interest and any Additional Interest Amount on the Securitieswill depend upon the receipt of distributions of dividends from its subsidiaries.
As a result, except in the event the Relevant Listco provides a guarantee on a subordinated basis asdescribed above, the Issuer’s payment obligations under the Securities will be effectively subordinatedto all existing and future obligations of its subsidiaries, and all claims of creditors of the Issuer’ssubsidiaries will have priority as to the assets of such entities over the Issuer’s claims and those of theIssuer’s creditors, including the Securities Holders. In addition, in the event the Relevant Listcoprovides a guarantee on a subordinated basis as described above, the claims of the Securities Holdersunder the guarantee will be subordinated to the claims of all senior and other subordinated obligationsof the Relevant Listco, except for the loans and securities of the Relevant Listco expressed to rank paripassu with such subordinated guarantee of the Relevant Listco.
The Issuer will primarily depend upon its subsidiaries for its cash flows and income
The Issuer is a holding company and, therefore, its ability to pay distributions on the Securities willdepend upon the level of distributions, if any, it receives from its operating subsidiaries and associatedcompanies and the level of its cash balances. The Group’s operating subsidiaries may, from time totime, be subject to restrictions on their ability to make distributions to the Issuer, including as a resultof restrictive covenants contained in loan agreements or debt instruments, foreign exchange limitationsand other legal or regulatory restrictions. Thus, the ability of the Issuer to pay distributions on theSecurities is dependent upon receipt by it of dividends and other distributions of value from itssubsidiaries and companies in which it has an investment. There can be no assurance that suchrestrictions will not have a material adverse effect on the ability to pay distributions on the Securitiesand the Group’s business, operating results, financial condition.
An active trading market for the Securities may not develop
The Securities are new securities for which there is currently no existing trading market. Prior to thisoffering there has been no trading market in the Securities. Approval in-principle has been received forthe listing and quotation of the Securities on the Official List of the Singapore Stock Exchange, butthere is no assurance that such approval will be granted. The liquidity of any market for the Securitieswill depend on a number of factors, including general economic conditions and the Issuer’s ownfinancial condition, performance and prospects, as well as recommendations of securities analysts. TheIssuer has been informed by the Initial Purchasers that they currently intend to make a market in theSecurities after the Issuer has completed this offering. However, they are not obligated to do so andmay discontinue such market-making activity at any time without notice. In addition, market-makingactivity by the Initial Purchasers’ affiliates may be subject to limits imposed by applicable law. As aresult, the Issuer cannot assure you that any market in the Securities will develop or, if it does develop,that it will be maintained. If an active market in the Securities fails to develop or be sustained, youmay not be able to sell the Securities or may have to sell them at a lower price.
— 55 —

The Issuer’s credit rating may decline
There is a risk that the Issuer’s credit rating may change as a result of changes in its operatingperformance or capital structure, or for some other reason. No assurance can be given that a creditrating will remain for any given period of time or that a credit rating will not be lowered or withdrawnby the relevant rating agency if, in its judgement, circumstances in the future so warrant or if adifferent methodology is applied to derive such credit ratings. Any lowering or withdrawal of theIssuer’s credit rating could, notwithstanding that it is not a rating of the Securities, adversely impactthe market price and the liquidity of the Securities.
The Securities are not rated
Investors should not assume or imply that any rating ascribed to the Issuer or any of its indebtedness orcredit would apply to the Securities. The Issuer has not applied to any ratings agency for a rating of theSecurities, and does not intend to apply for such a rating. If, however, a rating was obtained in respectof the Securities in the future, because the Securities are its subordinated obligations, the ratingascribed to the Securities may be lower than that ascribed to any of the Issuer’s other credit.
Rights of the Securities Holders may be altered without their consent
The Indenture contains provisions for calling meetings of Securities Holders to consider mattersaffecting their interests generally. These provisions permit defined majorities to bind all SecuritiesHolders, including Securities Holders who did not attend and vote at the relevant meeting andSecurities Holders who voted in a manner contrary to the majority, including, without limitation,amendments to the terms of the Securities and the currency of payment of the Securities. The Indenturealso provides that the Trustee may, without consent of the Securities Holders, agree to modification ofany provision of the Securities which is not materially prejudicial to the interests of the SecuritiesHolders or any modification of the Securities which is of a formal, minor or technical nature or is madeto correct a manifest error, in the circumstances described in “Description of the Perpetual CapitalSecurities — Meetings of Holders, Modification and Amendment”.
Some of the information included in this Offering Circular has been prepared by Pöyry and may beinaccurate or outdated
This Offering Circular includes information taken from a report dated February 10, 2011 which wasprepared for the Group by Pöyry and which has been included as an annexure to the Offering Circularwith Poyry’s written consent. The information taken from the report and included in this OfferingCircular may be inaccurate and outdated and Poyry has made no representation or warranty, express orimplied, as to the accuracy or completeness of this report. Statements from the report that involveestimates are subject to change, and actual amounts may differ materially from those described in thereport and included in this Offering Circular. The Group also cannot provide any assurance that Pöyryhas used correct or sound methodology to prepare the information taken from the report and includedin this Offering Circular.
— 56 —

USE OF PROCEEDS
The Issuer estimates that the gross proceeds to it from its sale of the Securities pursuant to thisOffering Circular will be approximately US$200 million before deducting the underwriting discountand its offering expenses in connection with the issue of the Securities. Of the net proceeds from theoffering, the Issuer intends to use approximately US$97.75 million for the repayment of profitcertificates and US$97.75 million for capital expenditure requirements of its subsidiaries, subject toapplicable laws. See “Description of the Perpetual Capital Securities” for further details.
— 57 —
CAPITALIZATION
The following table sets forth the Issuer’s short-term and long-term debt and shareholders’ equity atMarch 31, 2011 on a consolidated basis and as adjusted to give effect to the issuance of the Securitiesoffered hereby but not the use of proceeds thereof as described in “Use of Proceeds”. You should readthe following table together with “Summary — Recent Developments”, “Summary Financial Data ofthe Group”, “Selected Consolidated Financial Data of the Group”, “Management’s Discussion andAnalysis of Financial Condition and Results of Operations”, the Consolidated Historical FinancialInformation of the Group for the three years ended June 30, 2008, 2009 and 2010 and the UnauditedConsolidated Interim Financial Information of the Group for the nine months ended March 31, 2010and 2011 included elsewhere in this Offering Circular.
As at March 31, 2011
Actual(1) As Adjusted
(US$ in millions) (US$ in millions)(Unaudited) (Unaudited)
Indebtedness:Short-term debt . . . . . . . . . . . . . . . . . . . . . . . . . . . . . . . . . . . . . . . . . . . . . . . . . . . 152 152Long-term debt . . . . . . . . . . . . . . . . . . . . . . . . . . . . . . . . . . . . . . . . . . . . . . . . . . . 522 488
Total indebtedness(2) . . . . . . . . . . . . . . . . . . . . . . . . . . . . . . . . . . . . . . . . . . . . . . 674 640
Ordinary shares . . . . . . . . . . . . . . . . . . . . . . . . . . . . . . . . . . . . . . . . . . . . . . . . . . . 0.029 0.029Share Premium(3) . . . . . . . . . . . . . . . . . . . . . . . . . . . . . . . . . . . . . . . . . . . . . . . . . . 328 328Translation reserve . . . . . . . . . . . . . . . . . . . . . . . . . . . . . . . . . . . . . . . . . . . . . . . . 52 52Other reserves . . . . . . . . . . . . . . . . . . . . . . . . . . . . . . . . . . . . . . . . . . . . . . . . . . . . 88 25Retained earnings . . . . . . . . . . . . . . . . . . . . . . . . . . . . . . . . . . . . . . . . . . . . . . . . . 122 122Non-controlling interest . . . . . . . . . . . . . . . . . . . . . . . . . . . . . . . . . . . . . . . . . . . . . 8 8Perpetual Capital Securities offered hereby . . . . . . . . . . . . . . . . . . . . . . . . . . . . . — 200
Total equity . . . . . . . . . . . . . . . . . . . . . . . . . . . . . . . . . . . . . . . . . . . . . . . . . . . . . 598 735
Total indebtedness and shareholders’ equity . . . . . . . . . . . . . . . . . . . . . . . . . . 1,272 1,375
(1) Except as disclosed herein, there have been no material changes in the Issuer’s capitalization since March 31, 2011.
(2) As at March 31, 2011, the Issuer’s secured and unsecured debt totaled US$409 million and US$265 million, respectively. Formore information regarding the Issuer’s secured and unsecured debt, see “Management’s Discussion and Analysis ofFinancial Condition and Results of Operations”.
(3) On June 30, 2011, the CCDs were converted to cumulative preference shares and thereafter the cumulative preference shareswere converted to share capital and share premium of BPH, which was exchanged for equity shares of the Issuer.
— 58 —

SELECTED CONSOLIDATED FINANCIAL DATA OF THE GROUP
The selected consolidated financial data for the Issuer for each of the fiscal years ended June 30,2008, 2009 and 2010 and for the nine months ended March 31, 2010 and 2011 set forth below havebeen derived or calculated from the Consolidated Historical Financial Information and the UnauditedConsolidated Interim Financial Information included elsewhere in this Offering Circular and isqualified thereby. The Consolidated Historical Financial Information has been prepared in accordancewith International Financial Reporting Standards as adopted by the European Union (“IFRS-EU”).The Unaudited Consolidated Interim Financial Information has been prepared in accordance with IAS34 Interim Financial Reporting as adopted by the European UInion (“IAS 34”). The selectedconsolidated financial data for the Issuer set forth below should be read in conjunction with “SummaryConsolidated Financial Data of the Group,” “Management’s Discussion and Analysis of FinancialCondition and Results of Operations”, the Consolidated Historical Financial Information and theUnaudited Consolidated Interim Financial Information set forth in this Offering Circular.
The Historical Consolidated Financial Information has been prepared for the proposed offering of theSecurities by the Issuer. This financial information is different from the historical statutory financialstatements of the Issuer because it does not include certain disclosures relating to the Dutch civil code,including a director’s report and other information, and because it applies predecessor basis ofaccounting for the year ended June 30, 2008.
Between March 19, 2008 and June 30, 2008, BPH acquired virtually the entire shareholdings anddebentures of BGPPL. Pursuant to a scheme of arrangement and reorganization between BILT andBPH, three undertakings at Bhigwan, Ballarpur and Kamalapuram were transferred to BGPPL duringthe financial year ended June 30, 2008. Under the same agreement, BPH issued additional shares forcash to two investors, J.P. Morgan Mauritius and Lathe Investments, thereby diluting BILT’s effectiveownership of BGPPL to 78.79%. Contractual arrangements put in place as part of this agreementresulted in BGPPL becoming a joint venture between BILT, J.P. Morgan Mauritius and LatheInvestments. This agreement was amended on May 29, 2009 for no consideration and from that datethe Group became a subsidiary of the Ballarpur Group again.
In the determination of the management of the Group, the reorganization that introduced theadditional funding from the two additional investors, J.P. Morgan Mauritius and Lathe Investments, inreturn for issue of shares is outside the scope of IFRS 3 as it does not meet the definition of a businesscombination. For the year ended June 30, 2008, the Group’s management applied predecessoraccounting to the reorganization, thereby recording BGPPL and SFI at the carrying amounts they werepreviously carried at, in the financial statements of the Ballarpur Group. The consolidated historicalfinancial information setting out the Group’s financial position as of June 30, 2008, 2009 and 2010and results of operations and cash flows for the three years are on this basis.
Until July 14, 2008, BPH was the holding company of the Group , whose majority shares were held byBIH. At that time, the Issuer was wholly owned by BIH. On July 14, 2008, BPH became a wholly ownedsubsidiary of the Issuer, and BIH became a 78.79% owner of the Issuer, with 13.33% held by LatheInvestments and 7.88% by J.P. Morgan Mauritius.
— 59 —

As the Issuer is substantially a new company, the acquisition of BPH by the Issuer has been treated inthese consolidated financial statements as a group reorganization. The consolidated assets andliabilities of the Issuer immediately after the effective time of the group reorganization are the same asthe consolidated assets and liabilities of BPH immediately prior thereto.
This consolidated financial information has been prepared in the name of the Issuer, but continuity inthe Group accounting applies to the consolidated financial information of BPH. The information forthe period prior to July 14, 2008 in these consolidated financial statements has been extracted from theBPH consolidated financial statements. Moreover, the financial results for the year ended June 30,2008 include the financial results of BGPPL as if the acquisition of BGPPL had occurred on July 1,2007. See “Presentation of Financial and Other Data” for further information regarding thepresentation of financial information and “Management’s Discussion and Analysis of FinancialCondition and Results of Operations” for a description of certain line items in the Income Statement.
Summary income statement
Years ended June 30Nine months ended
March 31
2008 2009 2010 2010 2011
(Unaudited)(US$ ‘000)
Revenue . . . . . . . . . . . . . . . . . . . . . . . . . . . . . . . . . . . . . . . . . 514,388 408,158 613,164 434,545 557,334Operating profit . . . . . . . . . . . . . . . . . . . . . . . . . . . . . . . . . . . 69,062 51,495 95,329 66,060 65,036Profit for the year/period (after tax) . . . . . . . . . . . . . . . . . 15,648 (7,060) 46,439 37,141 13,533EBITDA* . . . . . . . . . . . . . . . . . . . . . . . . . . . . . . . . . . . . . . . . 101,133 83,230 134,713 94,738 98,619
* EBITDA is a non-GAAP financial measure. Please see “Non-GAAP Financial Measures”.
Summary balance sheet
As at June 30 As at March 31
2008 2009 2010 2011
(Unaudited)(US$ ‘000)
Non-current assets . . . . . . . . . . . . . . . . . . . . . . . . . . . . . . . . . 837,981 959,502 1,050,265 1,202,475Current assets . . . . . . . . . . . . . . . . . . . . . . . . . . . . . . . . . . . . . 176,389 151,418 255,275 287,535Total assets . . . . . . . . . . . . . . . . . . . . . . . . . . . . . . . . . . . . . . 1,014,370 1,110,920 1,305,540 1,490,010
Current liabilities . . . . . . . . . . . . . . . . . . . . . . . . . . . . . . . . . . 179,560 138,467 242,889 318,959Non-current liabilities . . . . . . . . . . . . . . . . . . . . . . . . . . . . . . 440,722 603,840 512,902 573,022Total liabilities . . . . . . . . . . . . . . . . . . . . . . . . . . . . . . . . . . . 620,282 742,307 755,791 891,981
Total equity and liabilities . . . . . . . . . . . . . . . . . . . . . . . . . . 1,014,370 1,110,920 1,305,540 1,490,010
— 60 —

Summary cash flow statement
Years endedJune 30
Nine months endedMarch 31
2008 2009 2010 2010 2011
(Unaudited)(US$ ‘000)
Net cash generated from operating activities . . . . . . . . . . . 96,615 128,599 88,612 76,961 67,998Net cash used in investing activities . . . . . . . . . . . . . . . . . . (158,486) (271,427) (52,607) (57,645) (165,256)Net cash flows generated from/(used in) financing
activities . . . . . . . . . . . . . . . . . . . . . . . . . . . . . . . . . . . . . . 72,507 136,363 (24,295) (1,998) 87,941
— 61 —
MANAGEMENT’S DISCUSSION AND ANALYSIS OF FINANCIALCONDITION AND RESULTS OF OPERATIONS
The following management’s discussion and analysis of the Issuer’s financial condition and results ofoperations is intended to convey management’s perspective on the operating performance andfinancial condition of the Issuer as at and for the fiscal years ended June 30, 2008, 2009 and 2010 andthe nine month period ended March 31, 2010 and 2011 on a consolidated basis. The operatingperformance and financial condition of the Issuer has been prepared in accordance with IFRS-EU.This disclosure is intended to assist in understanding and interpreting the financial data of the Issuerincluded in this Offering Circular. The discussion should be read in conjunction with “SummaryConsolidated Financial Data of the Group”, “Selected Consolidated Financial Data of the Group”,“Capitalization”, Unaudited Consolidated Interim Financial Information for the Issuer for the ninemonth periods ended March 31, 2010 and 2011, and the Consolidated Historical Financial Informationfor the Issuer for the years ended June 30, 2008, 2009 and 2010 and the accompanying schedules andnotes.
Between March 19, 2008 and June 30, 2008, BPH acquired virtually the entire shareholdings anddebentures of BGPPL. Pursuant to a scheme of arrangement and reorganization between BILT andBPH, three undertakings at Bhigwan, Ballarpur and Kamalapuram were transferred to BGPPL duringthe financial year ended June 30, 2008.
In the determination of the management of the Group, the reorganization that introduced theadditional funding from the two additional investors, J.P. Morgan Mauritius and Lathe Investments, inreturn for issue of shares is outside the scope of IFRS 3 as it does not meet the definition of a businesscombination. For the year ended June 30, 2008, the Group’s management applied predecessoraccounting to the reorganization, thereby recording BGPPL and SFI at the carrying amounts they werepreviously carried at, in the financial statements of the Ballarpur Group. The consolidated historicalfinancial information setting out the Group’s financial position as of June 30, 2008,, 2009 and 2010and results of operations and cash flows for the three years are on this basis.
Until July 14, 2008, BPH was the holding company of the Group, whose majority shares were held byBIH. At that time, the Issuer was wholly owned by BIH. On July 14, 2008, BPH became a wholly ownedsubsidiary of the Issuer, and BIH became a 78.79% owner of the Issuer, with 13.33% held by LatheInvestments and 7.88% by J.P. Morgan Mauritius.
As the Issuer is substantially a new company, the acquisition of BPH by the Issuer has been treated inthese consolidated financial statements as a group reorganization. The consolidated assets andliabilities of the Issuer immediately after the effective time of the group reorganization are the same asthe consolidated assets and liabilities of BPH immediately prior thereto.
This consolidated financial information has been prepared in the name of the Issuer, but continuity inthe Group accounting applies to the consolidated financial information of BPH. The information forthe period prior to July 14, 2008 in these consolidated financial statements has been extracted from theBPH consolidated financial statements. Moreover, the financial results for the year ended June 30,
— 62 —

2008 include the financial results of BGPPL as if the acquisition of BGPPL had occurred on July 1,2007. See “Presentation of Financial and Other Data” for further information regarding thepresentation of financial information.
The following discussion contains forward-looking statements. These statements have been based onmanagement’s current projections and expectations about future events. The Issuer’s actual resultsmay differ materially from those anticipated in these forward-looking statements as a result of manyimportant factors, including those set out under “Risk Factors” and elsewhere in this OfferingCircular. See “Forward-Looking Statements and Associated Risks”. Further information regarding thepresentation of financial information is set out under the heading “Presentation of Financial andOther Data”.
Overview
The Group is India’s largest producer of writing and printing paper and Malaysia’s largest producer ofuncoated wood-free paper products. The Group has a 66 year history in India, and SFI, which wasacquired by the Group in March 2007, has a 29 year history in Malaysia. The Group is a part of theAvantha Group. The Group is also the leading producer and seller of market rayon grade pulp in India.The Group’s paper, hardwood pulp and rayon grade pulp manufacturing operations span across fourproduction units: the Ballarpur unit, the Bhigwan unit and the Kamalapuram unit in India and the SFIunit in Malaysia.
In the year ended December 31, 2009, the Group had a 24% market share in the Hi-bright uncoatedwood-free paper segment in India (as compared to a market share of 13% for the Issuer’s parentcompany, BILT, and a market share of 12% for TNPL) and a 51% market share in the blade coatedwood-free paper segment in India (as compared to a market share of 11% for its next closestcompetitor, JK Paper), as reported by Pöyry.
The Group’s business model is based on vertical integration where it seeks to achieve control over thecost of key inputs and flexibility to maximize value across the entire value chain. The Group maintainsits own forest plantations, power facilities, facilities for the production of chemicals required for thepaper and hardwood pulp production and extensive hardwood pulp production capacity, all of whichprovides a high degree of vertical integration.
The Group’s operations have grown significantly since 2008. Since June 30, 2008, the Group’s annualpaper production capacity has increased by 88%, from 403,710 tpa to 758,710 tpa as at March 31,2011. The Group is also currently expanding its hardwood pulp production capacity at both the SFIunit and the Ballarpur unit. The SFI expansion is intended to create a total net increase in hardwoodpulp capacity of 120,000 tpa and the Ballarpur expansion is expected to create a total net increase of170,000 tpa (with new capacity at the Ballarpur unit totalling 300,000 tpa, replacing capacity of130,000 which is being retired). The Issuer expects its total hardwood pulp production capacity to be540,000 tpa by the end of 2012 (excluding capacity of 98,550 tpa at the Kamalapuram unit which isintended to produce rayon grade pulp). The increased hardwood pulp production will reduce theGroup’s cost of hardwood pulp for paper production, secure a source for the Group’s key raw materialinput and reduce exposure to the volatility in market prices for hardwood pulp.
— 63 —

Factors affecting results of operations and financial condition
General
The Group generates revenue predominately from the sale of coated wood-free paper, uncoated wood-free paper and rayon grade pulp. The primary drivers of demand for wood-free paper are growth inGDP and increased per capita income. These factors, in turn, provide a foundation for other drivers ofdemand for wood-free paper, including increased disposable income, increased government spendingon education and increased literacy rates. The primary drivers for rayon grade pulp are globaleconomic growth and activity, the demand for viscose fiber in the textile industry and the price ofcotton which is the primary substitute product for viscose fiber. The Group’s results have historicallybeen and will in the future be affected by changes in demand.
Due to the large amount of capital required for the construction, upgrade and maintenance of paperproduction facilities and the long lead-times between the planning and completion of new productionfacilities, capacity cannot in all circumstances be readily adapted to changing levels in demand.Historically, periods in which demand for paper has accelerated have generally led to rapid increases inprices, due mainly to the inability of manufacturers to expand capacity at a sufficient pace to meetdemand. Conversely, situations of substantial surplus supply of paper, typically caused by eitherperiods of industry-wide investment in new production capacity or significant cyclical contractions indemand due to weak economic conditions, have generally led to decreasing product prices. Duringperiods of falling prices, this trend has often been exacerbated as purchasers have sought to maximizethe benefit of the price trend by reducing their inventories, whereas, in periods of increasing prices,purchasers of paper tend to purchase more than they require and increase inventories as a hedge againstrising prices. As a result, financial performance of the industry overall has in general deterioratedduring periods of significant oversupply, only to improve again when demand has increased to a levelthat supports the implementation of price increases.
Pulp production capacity and pulp prices
The Group’s costs with respect to paper production are closely linked to its pulp production which isthe most expensive raw material input in paper production. Market prices for paper grade pulp canfluctuate significantly and can have a significant impact on profit margins. The Group primarily useshardwood pulp, as well as a small amount of softwood pulp and BCTMP, in the paper productionprocess.
During the nine months ended March 31, 2011, the Group maintained hardwood pulp productioncapacity of 130,000 tpa and 120,000 tpa at its Ballarpur unit and SFI unit, respectively. The SFI unithas historically produced sufficient hardwood pulp to meet its requirements while, in the year endedJune 30, 2010, the Ballarpur and Bhigwan units purchased 9.5% and 100% of their respectivehardwood pulp from the market. The Group’s ability to meet a significant portion of its hardwood pulprequirements at these units through internal production reduces the Group’s reliance on purchases ofhardwood pulp on the market and thereby helps control production costs. To the extent that the Groupmust purchase pulp from the market, the Group’s costs and profit margins may be negatively impacted.
— 64 —

For the year ended June 30, 2010, the Group produced 67% of its total required hardwood pulp throughits production facilities at the SFI unit and the Ballarpur unit, as compared to 85% and 88% in theyears ended June 30, 2009 and 2008, respectively. This decrease, on an overall basis for the Group,was due to increased paper production at the Bhigwan unit, following commencement of productionfrom PM-2. The Bhigwan unit has historically purchased all of its hardwood pulp requirements fromthe market. In addition, the commencement of production from PM-7 in December 2009 at theBallarpur unit increased the paper production capacity and, as a result, the pulp requirements, at theunit. The Ballarpur unit is therefore no longer self sufficient in hardwood pulp production and, duringthe period under review, purchased hardwood pulp in the open market. As a result, in 2010, theGroup’s costs in relation to hardwood pulp increased as it purchased more hardwood pulp on themarket.
Raw material expenses
In addition to pulp, wood fiber and other raw materials, chemicals and energy represent significantcosts in paper production. The prices of wood fiber, chemicals and electricity in turn depend on, amongother factors, changes in global and regional economies, weather conditions, global and regionalpolitical affairs, production levels, prevailing exchange rates and the extent of government regulation.
For the year ended June 30, 2010, the Group procured 94% of its required electricity through on-sitefacilities either owned by the Group or Avantha Power as compared to 91% and 93% in the years endedJune 30, 2009 and 2008, respectively. The Group was therefore able to derive a greater portion of itselectricity needs from captive sources in 2010 despite increased production and increases in productionand increased energy costs in India and Malaysia.
The Group’s costs have been, however, directly and indirectly impacted by fluctuations in oil prices.While certain upgrade works were undertaken at the SFI unit in March 2009 which allow it to use morebiofuel and less oil at the power facility, the unit continues to use oil for energy production and istherefore impacted by increased market oil prices. In addition, the Group’s costs have been impactedby increased transport costs from the SFI unit and exports from its Indian units during periods ofincreased oil prices. These increases have not materially impacted the Group’s margins as it hashistorically been able to pass such increases onto its distributors.
The chemicals used in the paper manufacturing process are also a substantial production cost. As ofMarch 31, 2011, he Group produced approximately 13% of the chemicals used for paper and hardwoodpulp production, while it purchased the rest from the market pursuant largely to long-term supplycontracts.
The Ballarpur unit has its own facilities for producing caustic soda, chlorine, hydrochloric acid(“HCL”) and quick lime. In addition, SMI has established a plant for the production of precipitatedcalcium carbonate at the Ballarpur unit. This plant supplies precipitated calcium carbonate to theGroup’s manufacturing units at a discounted price, calculated based on a formula agreed between theGroup and the supplier.
— 65 —
The Bhigwan unit has an onsite facility to produce ground calcium carbonate operated by Imerys,which supplies the Bhigwan unit with paper grade ground calcium carbonate. Imerys offers thesechemicals at up to a 20% discount to the price of similar quantities imported into India under a contractwith the Group which expires in 2014. The production facility for paper grade ground calciumcarbonate is located in the premises of the Bhigwan unit.
The Kamalapuram unit’s chemical production facility produces quick lime only and the unit purchasesthe rest of its required chemicals from the market.
The SFI unit has a Group-owned chemical production facility which produces caustic soda, chlorineand quick lime, sufficient to satisfy the unit’s requirements of these chemicals. It also has an onsitefacility to produce precipitated calcium carbonate (“PCC”) owned by Speciality Minerals, Malaysia.The unit purchases the rest of its required chemicals from the market at market price.
For the year ended June 30, 2010, the Group produced 45% of its wood fiber, as compared to 42%,49% and 43% for the nine months ended March 31,2011, year ended June 30, 2009 and June 30, 2008respectively. This figure includes wood produced and harvested at the SFI unit. Wood fiber is the rawmaterial for the pulp mills and, consequently, the Group’s costs and profit margins are significantlyimpacted by the price of wood fiber and increased internal wood fiber requirements due to increasedpaper and resulting increased pulp production. The Group’s costs in relation to this input has, at times,been adversely affected by the high prices and unreliability of wood sourced from government forests.In response, the Group has increased the sourcing of its wood from private and sustainable sources, inareas close to its manufacturing facilities, including the forest concession at the SFI unit. This has hada positive impact on the Group’s costs for the year ended June 30, 2010.
Paper production capacity and increases in capacity
The Group’s revenues are closely linked to its paper production capacity. From June 30, 2008 toMarch 31, 2011, the Group’s annual paper production capacity increased 88% from 403,710 tpa to758,710 tpa. This increased capacity has provided the Group with additional production for sale toconsumers and thereby increased its ability to generate additional revenues.
However, significant increases in domestic paper production capacity can impact pricing in the Indianmarket. Therefore, the Group has sought to manage the increase in its paper production capacity, so asto allow the market to absorb the additional capacity without materially disrupting the balance betweensupply and demand. As a result, in order to avoid impacting pricing in the Hi-Bright Maplitho market,the Group used the increased production capacity resulting from the commissioning of PM-7 inDecember 2009 at the Ballarpur unit to produce BILT Magna Print, a competitor to creamwove, whichsells at a lower price than Hi-bright uncoated wood-free paper. This production was largely sold in theIndian market.
As a result of the time required to achieve full production capacity of a new paper machine, additionsto the Group’s paper production capacity also impacts the Group’s profitability in the near term.During the “ramp up” period following installation and commissioning of a new paper machine, the
— 66 —

machine often operates at lower efficiency with respect to production levels and pulp, chemical, powerand water usage. The ramp up period can last up to approximately 18 months.
Competition
The Group’s primary markets have historically been its markets in India and Malaysia. India is themost important market to the Group, accounting for 72% of its total revenue during the nine monthsended March 31, 2011.
Within the uncoated wood-free paper segment in India, the most significant competition faced by theGroup during the periods under review was smaller domestic companies which have substantiallysmaller paper production capacities. Many of these companies have a relatively strong regional focusin India but do not have a material national presence. While the Group’s technology and productioncapacity provides the capability to serve the entire Indian market this competition may impact theGroup’s production and revenue figures, as well as its profit margins, as regional competitors decreasetheir prices or increase their production (which itself can serve to lower prices).
The coated wood-free paper market in India is highly fragmented and the Group largely facescompetition from Chinese or Indonesian companies that import into India. During certain periods,particularly during the global economic downturn during 2008 and 2009, this has increasedcompetition and reduced profit margins as paper prices in India decline and the Group experienceddecreased sales.
The Group is the market leader in uncoated wood-free paper products in Malaysia, but it does faceinternational competition, largely from Indonesia, China and Thailand. Increased supply into Malaysiafrom such companies at competitive prices has, at times, impacted the Group’s prices and profitmargins.
Customer contact and product distribution
Historically, the Group maintained a network of third-party distributors to manage sales, marketing anddistribution of the Group’s products. During the past decade, however, the Group has increasinglysought to increase the contact it has with its customers and has therefore increased its sales, marketingand customer service capabilities, while using the distributors primarily for logistical and productunderwriting purposes. This has improved the Group’s knowledge of its primary markets, the positionof its products within those markets and the demands and preferences of its customers. This additionalinformation and expertise has, in turn, resulted in a greater resilience of the Group’s operations duringdownturns in the paper market. During such periods, the Group has been partially insulated as a resultof long term relationships with its customers and the ability to customize contracts and products to theconsumer needs as a result of the knowledge it has of the consumer.
Shut downs
The paper and pulp production machines are designed to run continuously. Planned shutdowns at theIndian units for repair or maintenance are usually confined to a limited period of two or three days.
— 67 —

However, the SFI unit is obliged to shut down every 18 months as a result of government regulation,unless granted permission otherwise. Each shutdown is usually for a period of 15 to 20 days. Duringthe period under review, such shutdowns at the SFI unit occurred in September 2007, March 2009 andSeptember 2010.
Pricing of paper products
Despite fluctuations in domestic paper prices in India during a portion of the period under review, theGroup has generally maintained the prices it charges for its products in India as a result of, the Issuerbelieves, its high quality products, distribution network and customer service.
Malaysian prices are generally more affected by global price movements. However, the Issuer believesits high quality products, distribution network and customer service at its SFI unit have helped theGroup to offer affordable prices, despite these global price movements.
With respect to export prices, the prices charged by the Group generally follow international prices.While decreases in international paper prices can modestly impact the Group’s results of operations,during periods of significant decreases in international prices, the Group has historically reduced itsexports, thereby limiting the impact.
Funding costs for the expansion projects
The Group operates in a capital intensive industry and has significant funding requirements for itsexisting operations and growth strategy. The Group’s major growth projects have been funded by debtand cash flows from operations. In order to hedge the risk of increased interest rates in relation to itsborrowings, the Group enters into interest rate swap contracts in relation to certain of its borrowingswith floating interest rates. During the year ended June 30, 2009, the Group entered into interest rateswap contracts for a principal amount of US$310 million which provided for a minimum and maximuminterest rate on a floating basis paid by the Group. The interest rate swap arrangements are designed toprotect the Group from increases in LIBOR rates. Interest rates have fluctuated in the past in responseto the expansion or contraction of the Indian or global economy, inflation, Indian government policiesand other factors. These fluctuations have impacted the Group’s funding costs.
Exchange rates
The rupee, US dollar and the ringgit are the most important trading currencies for the Group’sproducts. The majority of the Group’s costs and revenues are denominated in the rupee. The Group’sresults have, at times, been impacted by appreciation or depreciation of the Indian rupee, which iseffectively the Group’s operational currency, against the US dollar, which is the Group’spresentational currency. Exports for the nine months ended March 31, 2011 comprised 21% in volumeof the Group’s total sales quantity, normally in US dollars. Certain of the Group’s costs, particularlywith respect to hardwood pulp purchases for the Bhigwan unit, are incurred predominately in USdollars and certain costs in the Group’s Malaysian operations are incurred in ringgit. As a result, the
— 68 —

appreciation or depreciation of the US dollar and/or the ringitt against the rupee can have a materialimpact on the Group’s results of operations. For more information, see “Exchange rate information”.
During the periods under review, appreciation of rupee and/or the ringgit against the US dollar has hada negative impact on revenue from exports, which has been partially offset by decreased costs relatedto purchases of hardwood and softwood pulp and chemicals. During periods of depreciation of therupee and/or ringgit against the US dollar, the Group’s dollar denominated exports have had a positiveimpact on revenue which is partially offset by increased costs related to purchases of hardwood andsoftwood pulp and chemicals.
While the majority of the Group’s borrowings are denominated in US dollars, a small amount ofborrowings are denominated in euro. The euro denominated borrowings were used to finance theincreased hardwood pulp capacity at the SFI unit. Interest costs and principal repayments related tosuch borrowings can decrease upon appreciation of the rupee and/or ringgit against these foreigncurrencies and increase upon depreciation of the rupee and/or ringgit against these foreign currencies.
Hedging activities
The Group has in the past engaged and continues to engage in hedging activities in relation to itsinterest rate risks and, in a more limited manner during the periods under review, in relation tocurrency risks.
With respect to currency hedging, certain of the Group’s transactions act as a natural hedge as aportion of assets, income, liabilities and expenses are denominated in currencies other than itsoperating currency. For the remaining exposure to foreign exchange risk, the Group adopts a policy ofselective hedging based on the risk perception of management. The Group has entered into short-termforward exchange contracts during the year ended June 30, 2010 in order to manage its committedforeign currency exposures on its trading activities.
The Group’s borrowings, other than its short-term borrowings, are a mix of fixed and variable interestrates, based on either the London Interbank Offered Rate (“LIBOR”) or prime lending rates of banks inIndia. In order to hedge the risk of increased interest rates in relation to its borrowings, during the yearended June 30, 2009, the Group entered into interest rate swap contracts for a principal amount ofUS$310 million which provided for a minimum and maximum interest rate on a floating basis paid bythe Group. The interest rate swap arrangements are designed to protect the Group from increases inLIBOR rates.
Description of key income statement line items
Revenue
The Group generates revenue primarily from sales of its paper products largely in India and Malaysiaand rayon grade pulp to a single customer in India. Revenue from sale of these products is recognized
— 69 —

when the risks and rewards of ownership have passed to the customers. Usually, this means thatrevenue is recorded upon delivery of goods to customers in accordance with agreed terms of delivery.
Other operating income
The other operating income of the Group mainly consists of miscellaneous income generated frombusiness activities including from the sale of scrap, gains on disposal of property, plant and equipment,and export incentives.
Gain on change in fair value of biological assets
The Group’s standing forest at the SFI unit is defined and reported as a biological asset. The forest isvalued annually by the Issuer, except for every third year when the forest is valued by Pöyry. The mostrecent Pöyry valuation was completed in October 2010. The forest is reported at fair value afterdeduction for estimated selling costs. The fair value of the asset is calculated as the present value ofanticipated future cash flow from the assets. The calculation is based on existing, sustainable forestsurveys and assessments regarding growth, timber prices, felling costs including costs for statutoryreplanting.
Raw materials and other consumables used
Raw materials and consumables consumed include wood for fuel and pulp, chemicals, electricity,power, fuel, water and other materials. These costs largely track the volume of pulp and paperproduced by the Group, with increases in production resulting in increases in the amount of rawmaterials and other consumables used.
Excise duty expenses
Excise duty expenses incurred by the Group include indirect taxes levied on those goods which aremanufactured in India. This is a tax on manufacturing which is paid by the manufacturer and passed onto customers.
Employee benefits expense
Employee benefits expenses incurred by the Group encompass all forms of consideration paid or givento employees in exchange for their services rendered to the Group.
Depreciation
Depreciation encompasses the future economic benefits embodied in each of the Group’s assets whichare consumed principally through the asset’s use. Depreciation is utilized to spread the cost of assetsover their estimated useful lives, using the straight line method.
— 70 —

Foreign exchange (losses) / gains — net
The foreign exchange gains or losses of the Group relate to exchange differences on account ofborrowings and foreign exchange forwards.
Other operating expenses
Other operating expenses primarily include expenses related to repair and maintenance of the Group’sequipment and facilities and distribution of the Group’s products. Repair and maintenance costs areimpacted by shutdowns and repairs at the Group’s facilities, planned or otherwise. Distribution costsare impacted by sales.
Finance income and costs
Finance income and costs are comprised largely of interest on bank borrowings, net fair value gain/(loss) on derivative financial instruments, net foreign exchange (loss)/gain on financing activities andaccelerated accounting charges relating to the early repayment of debt. The cost incurred forprocurement of debt financing is included in the amortized cost of borrowings and thereafter amortizedover the life of the debt. Thus the finance costs also include these amortized costs.
With respect to the derivatives held by the Group and its hedging activities, derivatives are initiallyrecognized at fair value on the date a derivative contract is entered into and are subsequentlyre-measured at their fair value. The method of recognizing the resulting gain or loss depends onwhether the derivative is designated as a hedging instrument, and if so, the nature of the item beinghedged. Currently derivatives have not been designated in a cash flow hedge relationship. The Groupdoes not currently use derivatives for speculative purposes.
Income tax (expense) / credit
Income tax expense represents the sum of current tax and deferred tax. Income tax expense in theconsolidated income statement has been computed based on the tax charges recorded by companies ofthe Group in their statutory accounts. Deferred tax assets and liabilities reflect the full historicaldeferred tax assets and liabilities recorded by the legal entities included in the Group.
— 71 —

Results of operations
The following table sets forth the Group’s consolidated income statement for the nine months endedMarch 31, 2010 and 2011, and for the years ended June 30, 2008, 2009 and 2010.
Years endedJune 30
Nine months endedMarch 31
2008 2009 2010 2010 2011
(Unaudited)(US$‘000)
Revenue . . . . . . . . . . . . . . . . . . . . . . . . . . . . . . . . . . . . . . 514,388 408,158 613,164 434,545 557,334Other operating income . . . . . . . . . . . . . . . . . . . . . . . . . . 1,541 2,659 4,849 2,698 4,004Gain on change in fair value of biological assets . . . . . . 13,448 10,955 4,900 5,733 809Raw materials and consumables used . . . . . . . . . . . . . . . (321,267) (258,697) (407,008) (285,200) (386,410)Excise duty expenses . . . . . . . . . . . . . . . . . . . . . . . . . . . . (24,481) (13,360) (13,471) (9,613) (15,057)Employee benefits expense . . . . . . . . . . . . . . . . . . . . . . . (37,156) (36,914) (38,701) (29,446) (31,799)Depreciation . . . . . . . . . . . . . . . . . . . . . . . . . . . . . . . . . . . (32,071) (31,735) (39,384) (28,678) (33,583)Foreign exchange (losses)/gains — net . . . . . . . . . . . . . . (2,650) 3,281 6,162 1,544 2,804Additional consideration paid for acquisition . . . . . . . . . (5,171) — — — —Other operating expenses . . . . . . . . . . . . . . . . . . . . . . . . (37,519) (32,852) (35,182) (25,523) (33,066)Operating profit . . . . . . . . . . . . . . . . . . . . . . . . . . . . . . . 69,062 51,495 95,329 66,060 65,036Finance income . . . . . . . . . . . . . . . . . . . . . . . . . . . . . . . . 595 2,480 2,777 2,095 2,520Finance cost . . . . . . . . . . . . . . . . . . . . . . . . . . . . . . . . . . . (41,233) (86,352) (40,920) (19,765) (41,659)Other gains / (losses) . . . . . . . . . . . . . . . . . . . . . . . . . . . . — 27,281 (10,379) (11,353) (650)
Profit before income tax . . . . . . . . . . . . . . . . . . . . . . . . 28,424 (5,096) 46,807 37,037 25,247Income tax (expense)/credit . . . . . . . . . . . . . . . . . . . . . . (12,776) (1,964) (368) 104 (11,714)Profit for the year/period . . . . . . . . . . . . . . . . . . . . . . . 15,648 (7,060) 46,439 37,141 13,533
Key financial dataEBITDA . . . . . . . . . . . . . . . . . . . . . . . . . . . . . . . . . . . . . . 101,133 83,230 134,713 94,738 98,619EBITDA margin %(1) . . . . . . . . . . . . . . . . . . . . . . . . . . . . 21% 21% 22% 22% 18%
(1) EBITDA margin is EBITDA divided by revenue (net of excise duty).
Nine months ended March 31, 2010 and 2011
Revenue
Revenue for the nine months ended March 31, 2011 was US$557.3 million, an increase of US$122.8million, or 28.3% from US$434.5 million in the nine months ended March 31, 2010. This increase inrevenue was primarily the result of an increase in the average sales price of both coated and uncoatedpaper products and rayon grade pulp in India, and increases in the production of the Group’s papermachines at the Ballarpur unit and Bhigwan unit.
The Ballarpur Unit
For the nine months ended March 31, 2011, revenue from uncoated paper production, external pulpsales and other minor sales at the Ballarpur unit, which produces a broad range of Hi-bright uncoated
— 72 —

wood-free paper products, was US$170.2 million, an increase of 44.6% from US$117.7 million for thenine months ended March 31, 2010. The increase was mainly attributable to the increased productionof PM-7 (with an installed capacity of 165,000 tonnes), which was commissioned in December 2009but operated at lower production levels as it began operations during the first three months of theperiod ended March 2010. This was the primary driver behind the increase in sales from 139,318tonnes for the nine months ended March 31, 2010 to 170,368 tonnes for the nine months endedMarch 31, 2011 as PM-7 sold 87,474 tonnes at 73% capacity utilization for the nine months endedMarch 31, 2011 and contributed 38,960 tonnes of additional sales. There were also increases in the netselling price of uncoated paper during the period. Average prices were US$864 per tonne in the ninemonths ended March 31, 2010 and US$937 per tonne in the nine months ended March 31, 2011.
The Bhigwan Unit
For the nine months ended March 31, 2011, revenue from coated paper production at the Bhigwan unitwas US$215.5 million, an increase of 29.8% from US$166.0 million in the nine months endedMarch 31, 2010. The increase was largely due to the fact that PM-2 was brought to 86% capacityduring the period, from approximately 66% capacity in the comparable period in 2010. During the ninemonths ended March 31, 2011, PM-2 sold 103,582 tonnes of coated paper, an increase of 24,983 tonnesagainst the prior comparable period. The increased sales quantity was supported by increased netselling prices. These prices were US$909 per tonne in the nine months ended March 31, 2010 andUS$989 per tonne in the nine months ended March 31, 2011.
The SFI Unit
For the nine months ended March 31, 2011, revenue from paper sales and the SFI unit’s IntegratedTimber Complex (“ITC”) division sales, which produce surface sized and non-surface sized uncoatedwood-free paper, was US$97.1 million from US$96.9 million in the nine months ended March 31,2010, an increase of US$0.2 million. An 11.8% decrease in sales volume from 113,232 tonnes in thenine months ended March 31, 2010 to 99,840 tonnes in the nine months ended March 31, 2011 wasprimarily the result of a scheduled plant shutdown for maintenance in September 2010. The decline insales volume was partially offset by increased selling prices and a change in revenue due to exchangerate fluctuations as the average rate for ringgit per US dollar for nine months ended March 31, 2011was 3.11 as compared to 3.44 for nine months ended March 31,2010. There were also increases inselling prices, from US$773 per tonne in the nine months ended March 31, 2010 to US$881 per tonnein the nine months ended March 31, 2011.
The Kamalapurum Unit
Revenue from rayon grade pulp and other sales at the Kamalapuram unit for the nine months endedMarch 31, 2011 was US$74.6 million, an increase of 38.1% from US$54.0 million in the nine monthsended March 31, 2010. The increase was primarily due to a 47.2% increase in net prices for rayongrade pulp from US$796 per tonne to US$1172 per tonne.
— 73 —

Gain on change in fair value of biological assets
Gain on change in fair value of biological assets for the nine months ended March 31, 2011 wasUS$0.8 million, a decrease of US$4.9 million from the US$5.7 million recorded in the nine monthsended March 31, 2010. This decrease was primarily the result of a decrease in planting activities inMalaysia during the period ended March 31, 2011 as compared to the same period in 2010.
Raw materials and other consumables used
Raw materials and other consumables used for the nine months ended March 31, 2011 was US$386.4million, an increase of US$101.2 million from the US$285.2 million recorded in the nine months endedMarch 31, 2010. This increase was primarily the result of and generally in line with the increasedproduction noted above, as well as increases in the cost of wood fiber, pulp and consumables asdemand increased following the recession.
Other operating expenses
Other operating expenses for the nine months ended March 31, 2011 were US$33.1 million, an increaseof US$7.6 million from the US$25.5 million recorded in the nine months ended March 31, 2010. Theseincreased operating expenses were primarily the result of increased distribution expenses due toincreased sales volume and oil prices. There were also increases in repair and maintenance costsprimarily resulting from the planned shut down of a plant at SFI.
EBITDA
EBITDA at the Ballarpur unit increased by 8.2% from US$31.7 million for the nine months endedMarch 31, 2010 to US$34.3 million for the nine months ended March 31, 2011. This increase occurredas a result of the significant increase in revenue due to increased sales volume and net selling prices,which was partially offset by the increased requirement to purchase externally produced hardwood pulpfor PM-7 as well as the higher cost of wood used for hardwood pulp. Prior to the additional capacityintroduced by PM-7, the Ballarpur unit was self-sufficient in its hardwood pulp requirements andpurchasing pulp in the open market is generally substantially more expensive for the Group thanproducing the pulp itself.
EBITDA at the Bhigwan unit decreased by 13.1% from US$30.5 million in the nine months endedMarch 31, 2010 to US$26.5 million in the nine months ended March 31, 2011. This decrease was dueto the need to purchase additional externally produced hardwood pulp for PM-2 and significantincreased prices of the market pulp. These decreases were partially offset by the increased revenuedriven by the increased production.
EBITDA from uncoated paper sales and ITC division sales at the SFI unit decreased from US$23.1million in the nine months ended March 31, 2010 to US$13.3 million in the nine months endedMarch 31, 2011. The decrease was due to a decrease in production attributable to the scheduled plant
— 74 —

shutdown in September 2010, as well as increased repair and maintenance costs during the period dueto the scheduled plant shutdown in September 2010.
EBITDA at the Kamalapuram unit increased from US$10.6 million in the nine months ended March 31,2010 to US$25.9 million in the nine months ended March 31, 2011. This increase was primarily theresult of significantly increased revenue due to higher net selling prices of rayon grade pulp. Thisincrease in selling prices was offset by an increase in wood costs.
Net finance costs
Net finance costs for the nine months ended March 31, 2011 were US$39.1 million, an increase ofUS$21.4 million from the US$17.7 million recorded in the nine months ended March 31, 2010. Thisincrease was primarily due to currency exchange translation gains and losses on the Group’s US dollarborrowings. In the nine months ended March 31, 2011, exchange translation led to a US$2.4 milliontranslation gain, while in the nine months ended March 31, 2010 there was a US$40.3 milliontranslation gain. Interest costs on term bank borrowings, debentures, working capital loans and loansfrom related parties amounted to US$32.5 million in the nine months ended March 31, 2011 andUS$30.0 million in the nine months ended March 31, 2010. This was due largely to the increase inborrowings. Furthermore, US$6.3 million of unamortized transactions costs were incurred in the periodending March 31, 2011 whereas US$17.6 million was incurred in the nine months ended March 31,2010, the latter mainly relating to the early termination of the Group’s US$498.3 million Citibankconsortium loan. During the nine months ended March 31, 2011, the Company also incurred US$4.5million in transaction costs for a proposed equity offering, as compared with no such costs in the ninemonths ended March 31, 2010. Since the proposed offering has been deferred these costs have beenrecorded as expenses in the financial statements.
Income tax expense
Income tax expense for the nine months ended March 31, 2011 was US$11.7 million, compared to anincome tax credit of US$0.1 million for the nine months ended March 31, 2010. This increase in taxexpense in the period ended March 31,2011 as compared with the period ended March 31, 2010 wasprimarily the result of a deferred tax charge of US$5.3 million incurred in the nine months endedMarch 31, 2011, after considering of a deferred tax asset of US$10.4 million relating to losses at theSFI unit during the year ended June 30, 2010, compared with a deferred tax credit of US$2.5 millionreceived in the nine months ended March 31, 2010. Moreover, the current tax charge incurred by theGroup increased to US$6.4 million in the nine months ended March 31, 2011, from US$2.3 million inthe nine months ended March 31, 2010.
Years ended June 30, 2009 and 2010
Revenue
Revenue for the year ended June 30, 2010 was US$613.2 million, an increase of US$205.0 million, or50.2%, from US$408.2 million in the year ended June 30, 2009. This increase was primarily the result
— 75 —

of increased demand due to the recovery from the global recession as well as increased productioncapacity at the Ballarpur unit and Bhigwan unit.
The Ballarpur Unit
Revenue from uncoated paper production, external pulp sales and other minor sales at the Ballarpurunit for the year ended June 30, 2010 was US$169.7 million, an increase of 32.6% from US$128.0million in the year ended June 30, 2009. The increase was mainly attributable to the commissioning inDecember 2009 of PM-7 with an installed capacity of 165,000 tonnes. This was the primary driverbehind the increase in sales from 124,948 tonnes to 173,285 tonnes during this period as PM-7 wasprogressively brought up to full capacity and contributed 72,842 tonnes of additional sales. Thisimpacted the revenues resulting from the increased sales capacity. Additionally, the increased salesquantity was further supported by an increase in average net sales prices in US dollar terms of 1.1%,from US$876 per tonne in the year ended June 30, 2009 to US$886 per tonne in the year endedJune 30, 2010, despite lower prices in rupee terms in the Indian market.
The Bhigwan Unit
Revenue from coated paper production at the Bhigwan unit for the year ended June 30, 2010 wasUS$235.4 million, an increase of 63.4% from US$144.1 million in the year ended June 30, 2009. PM-2sold 113,494 tonnes of coated paper during the year ended June 30, 2010, its first full year ofoperations, an increase of 89,949 tonnes against the year ended June 30, 2009. The increased sales wassupported by stable net sales prices in US dollar terms. These prices were US$927 per tonne in the yearended June 30, 2009 and US$923 per tonne in the year ended June 30, 2010.
The SFI Unit
Revenue from paper sales and ITC business at the SFI unit for the year ended June 30, 2010 wasUS$135.0 million, an increase of 25.8% from US$107.3 million in the year ended June 30, 2009. Theincrease was due to a 20.7% increase in production from 124,360 tonnes in the year ended June 30,2009 to 150,127 tonnes in the year ended June 30, 2010. Production for the latter period exceeded thestated capacity of the machines. Certain of this increase was due to the shutdown of the SFI unit formaintenance, which is required by Malaysian regulation to happen every eighteen months, which didnot fall within the year ended June 30, 2010 but did occur during the year ended June 30, 2009. Inaddition, as the global economy recovered from the global economic downturn in 2008 and 2009, theSFI unit increased production as demand increased and the unit was able to sell 150,107 tonnes in theyear ended June 30, 2010 compared to 124,847 tonnes in the year ended June 30, 2009. Further, largelyas a result of increased demand, average sales prices in US dollar terms, increased by 5.8% fromUS$770 per tonne in the year ended June 30, 2009 to US$815 per tonne in the year ended June 30,2010, further driving increased revenue for the period.
The Kamalapurum Unit
Revenue from rayon grade pulp production at the Kamalapuram unit for the year ended June 30, 2010was US$73.1 million, an increase of 154.7% from US$28.7 million in the year ended June 30, 2009.
— 76 —

The increase was due to a 125.1% increase in sales from 39,171 tonnes in the year ended June 30, 2009to 88,175 tonnes in the year ended June 30, 2010. This was a result of the unit’s operationsrecommencing in May 2009, having been shut down for nearly six months starting in November 2008due to a significant decrease in demand resulting from the global economic downturn. In addition,prices for rayon grade pulp increased by 6.3% from US$780 per tonne to US$829 per tonne.
Gain on change in fair value of biological assets
The gain on change in the fair value of biological assets for the year ended June 30, 2010 was US$4.9million, a decrease of US$6.1 million, from US$11.0 million in the year ended June 30, 2009. Thisdecrease was primarily the result of a decrease in planting activities in Malaysia during the year endedJune 30, 2010 as compared to the same period in 2009, partially offset by increased harvesting at theSFI unit in Malaysia during the year ended June 30, 2010.
Raw materials and other consumables used
Raw materials and other consumables used for the year ended June 30, 2010 were US$407.0 million,an increase of US$148.3 million, or 57.3%, from US$258.7 million in the year ended June 30, 2009.This increase was primarily the result of, and generally in line with, the increased production notedabove, as well as an increase in the cost of wood fiber.
Other operating expenses
Other operating expenses for the year ended June 30, 2010 were US$35.2 million, an increase ofUS$2.3 million, from US$32.9 million in the year ended June 30, 2009. This increase was primarilydue to increased distribution expenses as a result of increased sales volume and full year operations atthe Kamalapuram unit during the year ended June 30, 2010, compared to only partial operations duringthe year ended June 30, 2009. The increase was partially offset by decline in repair and maintenancecost largely due to the shut down of SFI plant during the year ended June 30, 2009. There were no suchshut down during the year ended June 30, 2010.
EBITDA
EBITDA at the Ballarpur unit fell by 13.3% from US$51.0 million in the year ended June 30, 2009 toUS$44.2 million in the year ended June 30, 2010. This decrease occurred despite the significantincrease in revenue noted above and was mainly due to the requirement to purchase externallyproduced hardwood pulp for PM-7 as well as the higher cost of wood used for hardwood pulp. Prior tothe additional capacity introduced by PM-7, the Ballarpur unit was self-sufficient in its hardwood pulprequirements and purchasing pulp in the open market is generally substantially more expensive for theGroup than producing the pulp itself.
EBITDA at the Bhigwan unit increased by 37.3% from US$29.2 million in the year ended June 30,2009 to US$40.1 million in the year ended June 30, 2010. This increase was due to increased
— 77 —

production, stable selling prices and raw material costs and the spreading of fixed costs oversignificantly expanded production.
EBITDA from uncoated paper production at the SFI unit increased from US$6.7 million in the yearended June 30, 2009 to US$34.4 million in the year ended June 30, 2010. The increase was due toincreased production and higher average sales prices combined with the containment of operatingcosts. Operating costs (excluding depreciation) did not increase in line with production and remainedstable at US$100.5 million during the year ended June 30, 2010 compared to US$100.7 million duringthe year ended June 30, 2009. This was primarily the result of the reduction in fuel costs from a totalof US$25.7 million in the year ended June 30, 2009 to US$20.0 million in the year ended June 30,2010, despite significantly higher production. This in turn was due to lower oil prices and thereplacement of evaporators and the overhaul of condensing turbo generators as part of the shutdown inMarch 2009 which allowed more bio-fuel to be used and improved power efficiency.
EBITDA at the Kamalapuram unit increased from US$2.1 million in the year ended June 30, 2009 toUS$16.2 million in the year ended June 30, 2010 as a consequence of significantly increasedproduction and revenue.
Net finance costs
Net finance costs for the year ended June 30, 2010 were US$38.1 million, a decrease of US$45.8million, from US$83.9 million in the year ended June 30, 2009.
During the period under review, net finance costs were substantially impacted by foreign exchangetranslation gains and losses on the Group’s US dollar borrowings. In the year ended June 30, 2010,re-translation led to a US$32.5 million translation gain, while in the year ended June 30, 2009 therewas a US$26.8 million translation loss. Interest costs on term bank borrowings, CCDs, working capitalloans and loans from related parties amounted to US$40.9 million in the year ended June 30, 2010,including US$1.8 million in interest on the Group’s CCDs, and US$37.9 million in interest costsduring the year ended June 30, 2009. In 2009 the Group took out interest rate swaps with caps andcollars to hedge the interest risk on its borrowings. Under these arrangements the Group receives afloating LIBOR based interest rate and fixed or floating rate, depending on the LIBOR rate falling inone of the four pre-determined band rates. The interest rate swap arrangements are designed to protectthe Group from increase in LIBOR rates. In the year ended June 30, 2010 the Group incurred losses onthese swaps of US$13.7 million compared to US$17.6 million in the year ended June 30, 2009.
In addition, during the year ended June 30, 2010 the Group incurred a US$17.6 million charge inrespect of the expense of unamortized transaction costs when it terminated early its US$498.3 millionCitibank consortium loan.
Income tax expense
Income tax expense for the year ended June 30, 2010 was US$0.4 million as compared to an incometax expense of US$2.0 million in the year ended June 30, 2009. This was primarily the result of the
— 78 —
creation of a deferred tax asset for US$10.4 million in respect of the SFI unit following approval by theMalaysian authorities of the carry forward of tax losses from previous periods and management’s viewthat there were sufficiently certain future profits against which to absorb those losses.
Years ended June 30, 2008 and 2009
Revenue
Revenue for the year ended June 30, 2009 was US$408.2 million, a decrease of US$106.2 million, or20.6%, from US$514.4 million in the year ended June 30, 2008. This was primarily due to a decline indemand for rayon grade pulp as a result of the global recession, increased competition in the Malaysianpaper market and lower sales prices in US dollar terms despite higher prices in rupee terms in theIndian market.
The Ballarpur Unit
Revenue from uncoated paper production, external pulp sales and other minor sales at the Ballarpurunit for the year ended June 30, 2009 was US$128.0 million, a decrease of 15.2% from US$151.0million in the year ended June 30, 2008. This decrease was primarily due to a 10% decline net salesprices in US dollar terms from US$973 per tonne in the year ended June 30, 2008 to US$876 per tonneduring the year ended June 30, 2009. This, in turn, was largely the result of a depreciation of the rupeeagainst the US dollar from an average of 40.36 rupees in the year ended June 30, 2008 to 48.38 rupeesin the following year. In rupee terms, however, average sales prices increased by 7.9%. The decreasewas also partially due to a 2.9% decline in sales due to the global recession from 128,700 tonnes in theyear ended June 30, 2008 to 124,948 tonnes in the year ended June 30, 2009. Production decreased by3,609 tonnes, or 2.8%, from 128,682 tonnes in the year ended June 30, 2008 to 125,073 tonnes in theyear ended June 30, 2009.
The Bhigwan Unit
Revenue from coated paper production at the Bhigwan unit for the year ended June 30, 2009 wasUS$144.1 million, an increase of 4.3% from US$138.2 million in the year ended June 30, 2008. Theincrease was due to a 17.7% increase in sales from 126,141 tonnes in the year ended June 30, 2008 to148,522 tonnes in the year ended June 30, 2009. Production increased by 17.4% from 125,900 tonnesto 147,754 tonnes during this period. These increases were mainly attributable to the commissioning inMarch 2009 of PM-2, a new paper machine, with an installed capacity of 165,000 tonnes. During theyear ended June 30, 2009, the capacity of PM-2 was progressively increased and it contributed 23,545tonnes of additional sales. The Bhigwan unit was impacted by a similar decline in net sales priceswhich impacted the Ballarpur unit, as prices in US dollar terms fell by 3.0% from US$956 per tonne inthe year ended June 30, 2008 to US$927 per tonne in the year ended June 30, 2009 due to thedepreciation of the rupee against the US dollar. In rupee terms, average sales prices increased by16.1%.
— 79 —
The SFI Unit
Revenue from paper sales and ITC business at the SFI unit for the year ended June 30, 2009 wasUS$107.3 million, a decrease of 21.3% from US$136.4 million in the year ended June 30, 2008. Thedecrease was partially due to a 10.6% decline in sales from 139,662 tonnes in the year ended June 30,2008 to 124,847 tonnes in the following year, along with a decrease in production from 139,194 tonnesto 124,360 tonnes in the same period. The decrease in sales volume was largely due to the globalrecession which impacted the Malaysian market both in terms of consumption and price. Averageprices fell by 13.4% from US$889 in the year ended June 30, 2008 to US$770 in the following year.This was largely the result of increased competition in the Malaysian market from Chinese, Indonesianand Thai producers as these producers had additional capacity due to decreased demand in othermarkets.
The Kamalapuram Unit
Revenue from rayon grade pulp production at the Kamalapuram unit for the year ended June 30, 2009was US$28.7 million, a decrease of 67.6% from US$88.7 million in the year ended June 30, 2008. Thedecrease was due to the global recession which severely impacted the textile industry and resulted inGrasim Industries, Kamalapuram’s largest customer, ceasing orders for rayon grade pulp. As a result,the Kamalapuram unit briefly switched to producing paper grade hardwood pulp in October andNovember 2008 for use in the Group’s paper production but then shut down from November 2008 toMay 2009. The hardwood pulp was sold to the Ballarpur unit. The unit implemented a voluntaryretirement scheme at the Kamalapuram unit which reduced manpower at the unit by approximately 500workers. However, the majority of the workforce was maintained in anticipation of the resumption ofnormal operating activities. Consequently certain operating costs continued to be incurred.
Gain on change in fair value of biological assets
Gain on change in fair value of biological assets for the year ended June 30, 2009 was US$11.0million, which represented a decrease of US$2.4 million from US$13.4 million in the year endedJune 30, 2008. This change was primarily the result of increased harvesting at the plantation inMalaysia coupled with a decrease in the planting activities during the year ended June 30, 2009.
Raw materials and other consumables used
Raw materials and other consumables used for the year ended June 30, 2009 was US$258.7 million, adecrease of US$62.6 million, or 19.5%, from US$321.3 million in the year ended June 30, 2008. Thedecrease was primarily due to the decrease in production resulting in a decrease in raw material andother consumables used at the Kamalapuram unit as a result of the six month shutdown in 2009 and theresult of the recession and lower market prices for the relevant raw materials purchased by the Group.
— 80 —

Other operating expenses
Other operating expenses for the year ended June 30, 2009 was US$32.9 million, a decrease of US$4.6million, from US$37.5 million in the year ended June 30, 2008. This decrease was primarily due to thereduction in selling expenses, selling commissions, freight expenses and other related sales expenses.
EBITDA
EBITDA at the Ballarpur unit fell by 4.7% from US$53.5 million in the year ended June 30, 2008 toUS$51.0 million in the following year, primarily due to the lower average net sales prices in US dollarterms. However, EBITDA in rupee terms increased during the year ended June 30, 2009.
EBITDA at the Bhigwan unit increased by 534.8% from US$4.6 million for the year ended June 30,2008 to US$29.2 million for the year ended June 30, 2009 primarily due to the increase in sales volumeand a reduction in average pulp costs in US dollar terms from US$702 per tonne in the year endedJune 30, 2008 to US$635 per tonne in the following year.
EBITDA from uncoated paper production at the SFI unit fell by 77.5% from US$29.8 million in theyear ended June 30, 2008 to US$6.7 million in the following year, primarily due to the decline in salesrevenue as well as increased chemical costs. Chemical costs increased on the back of increasedinternational oil prices.
EBITDA at the Kamalapuram unit decreased from US$19.4 million in the year ended June 30, 2008 toUS$2.1 million in the year ended June 30, 2009 as a result of the global recession which adverselyimpacted the Kamalapuram’s units revenues.
Net finance costs
Net finance costs for the year ended June 30, 2009 were US$83.9 million compared to US$40.6 millionin the year ended June 30, 2008, an increase of US$43.3 million. This increase was primarily the resultof an increase in borrowings to finance the capital expenditure plan of BGPPL (largely at PM-2 at theBhigwan unit). These increased finance costs also included a US$4.9 million charge in respect ofnotional interest on a seller’s note which financed the SFI acquisition in the year ended June 30, 2008and in the year ended June 30, 2009, the seller’s note was repaid.
Moreover, during the year ended June 30, 2009, the Group entered into three interest rate swapcontracts for a total notional principal amount of US$310 million. The profit and loss arising fromthese interest rate swap contracts was recognized during the year ended June 30, 2009 as a net financecost of US$17.6 million. No comparable finance cost was recognized during the year ended June 30,2008.
— 81 —

Income tax expense
Income tax expense for the year ended June 30, 2009 was US$2.0 million, a decrease of US$10.8million, from US$12.8 million in the year ended June 30, 2008. This decrease was primarily the resultof lower profit before tax in the year ended June 30, 2009.
Liquidity and cash flow
Liquidity
As of the date of this Offering Circular, the Group’s principal sources of liquidity have been cash flowfrom debt financing from external debt providers, related party loans, cash flows from operatingactivities and equity funding from external investors.
— 82 —
Sources of funding and indebtedness
Lender CurrencyOriginal facility
amount
Originalfacilityamount(US$
equivalent)
Lastinstallment/maturity Interest rate
Amountoutstandingat March 31
2011
(Borrowingcurrency million)
(US$ million) (US$ million)
Secured loansStandard Chartered
Bank . . . . . . . . . . . . . . . USD 25.0 25 May 2015 LIBOR + 2.8% 23.8Rabobank . . . . . . . . . . . . . USD 50.0 50 May 2015 LIBOR + 2.8% 47.7Bank of Baroda . . . . . . . . . USD 45.0 45 May 2015 LIBOR + 2.8% 42.9ING Bank NV . . . . . . . . . . USD 25.0 25 May 2015 LIBOR + 2.8% 23.8Rabobank . . . . . . . . . . . . . USD 30.0 30 Sep 2016 LIBOR + 3.65% 30.0Malayan Banking
Berhad . . . . . . . . . . . . . . USD 20.0 20 Sep 2016 LIBOR + 3.65% 20.0Oversea-Chinese Banking
Corporation(1) . . . . . . . . USD 20.0 20 Apr 2017 LIBOR + 3.9% 0Central Bank of India . . . . INR 1,000.0 22 Dec 2016 –Base rate + 2.0% 22.1Standard Chartered
Bank(1) . . . . . . . . . . . . . . USD 20.0 20 July 2017 LIBOR + 3.2% 0ING / Nordea Bank . . . . . . EUR 28.8 39 Dec 2019 EURIBOR + 1.5% 39.2
Non-convertibledebentures:
ICICI Bank(as arranger) . . . . . . . . . INR 2,500.0 54.0 Mar 2017 9.65% 54.0
Yes Bank (as arranger) . . . INR 2,500.0 55.4 Sep 2017 8.75% to 9.90% 55.4ICICI Bank
(as arranger) . . . . . . . . . INR 2,500.0 54.3 Jun 2017 9% to 9.75% 54.3
Other:Working capital loan from
various banks . . . . . . . . — — varied varied 134.9Compulsory convertible
debentures issued toAvantha InternationalAssets(2) . . . . . . . . . . . . . USD 100.0 100 2013 to 2020 Libor + 3.82% 100.0
Profit certificates issued toBIH(3) . . . . . . . . . . . . . . USD 140.0 140 n/a Libor 140.0
(1) Facility still to be drawn as on March 31, 2011.
(2) As on March 31, 2011, US$81.5 million of the US$100 million in CCDs had been classified as debt, while US$15.8 millionwas classified as equity (the difference between total book value of US$97.3 million as of March 31, 2011 and the issue priceof US$100 million is due to the exchange resulting in a revaluation of the liability on balance sheet date).
(3) As on March 31, 2011, US$88.8 million was classified as equity, while US$49.1 million was classified as liability (thedifference between total book value of US$137.9 million as of March 31, 2011 and the subscription price of US$140.0million, is due to the exchange resulting in a revaluation of the liability on balance sheet date).
For a description of the Group’s facilities, see “Description of Other Indebtedness”.
— 83 —

Historical cash flows
The following table summarizes the Group’s cash flows for the nine months ended March 31, 2010 and2011, and for the years ended June 30, 2008, 2009 and 2010.
Years endedJune 30
Nine months endedMarch 31
2008 2009 2010 2010 2011
(Unaudited)(US$ ‘000)
Net cash generated from operating activities . . . . . . . . . . . 96,615 128,599 88,612 76,961 67,998Net cash used in investing activities . . . . . . . . . . . . . . . . . . (158,486) (271,427) (52,607) (57,645) (165,256)Net cash flows generated from/(used in) financing
activities . . . . . . . . . . . . . . . . . . . . . . . . . . . . . . . . . . . . . . 72,507 136,363 (24,295) (1,998) 87,941Effect of change in exchange rate . . . . . . . . . . . . . . . . . . . . 5,916 (2,539) 2,837 4,878 1,158Net increase/(decrease) in cash, cash equivalents and
bank overdrafts . . . . . . . . . . . . . . . . . . . . . . . . . . . . . . . 16,552 (9,004) 14,547 22,196 (8,159)
Net cash generated from operating activities
In the nine months ended March 31, 2011, the Group generated net cash from operating activities ofUS$68.0 million compared to generated net cash of US$77.0 million in the nine months endedMarch 31, 2010. The decrease in net cash generated from operating activities was primarily due to anincreased need to fund inventory, debtors and other receivables to finance increased production andsubsequent sales. This was partially offset by increased cash flow from operations other than workingcapital.
The decrease in the Group’s net cash generated from operating activities from US$128.6 million in theyear ended June 30, 2009 to US$88.6 million in the year ended June 30, 2010 was largely due to theneed to fund inventory and trade receivable balances to finance increased production followingrecovery from the global recession as well as the increased output from PM-2 at the Bhigwan unit andPM-7 at the Ballarpur unit. This was partially offset by increased profitability.
Net cash generated from operating activities during the year ended June 30, 2009 wasUS$128.6 million compared to US$96.6 million in the year ended June 30, 2008. The increase wasprimarily due to the release of cash maintained in working capital balances due to lower productioncaused by the global recession, as well as active measures by the Group to manage its working capitalbalances through stock liquidation and debtor collection.
Net cash used in investing activities
In the nine months ended March 31, 2011, the Group’s net cash used in investing activities increased toUS$165.3 million from US$57.6 million in the nine months ended March 31, 2010. The increase wasdue to capital expenditure on the new hardwood pulp manufacturing plant at the SFI unit. In the ninemonths ended March 31, 2010, capital expenditure was primarily related to the remaining costs for theacquisition of PM-7 at the Ballarpur unit, which was commissioned in December 2009.
— 84 —

In the year ended June 30, 2010, the Group’s net cash used in investing activities decreased toUS$52.6 million from US$271.4 million in the year ended June 30, 2009. The decrease primarilyreflected the fact that in the year ended June 30, 2010, US$51.4 million was paid in respect of capitalexpenditure compared to US$233.9 million in the year ended June 30, 2009, as the major payments inrespect of the installation of PM-7 at the Ballarpur unit, which was commissioned in December 2009,had been made in prior periods, as well as substantial capital expenditure incurred with respect to theinstallation of PM-2 at the Bhigwan unit, which was commissioned in March 2009. In addition, nofurther payments were made in respect of the acquisition of the SFI unit.
In the year ended June 30, 2009, the Group’s net cash used in investing activities increased toUS$271.4 million from US$158.5 million in the year ended June 30, 2008. This increase was primarilydue to increased capital expenditure for the installation of PM-2 at the Bhigwan unit and PM-7 at theBallarpur unit. The cash used in investing activities in the year ended June 30, 2008 largely related toUS$104.8 million of capital expenditure, which was largely in respect of the installation of PM-2 at theBhigwan unit. This machine was commissioned in March 2009. The cash used in investing activitiesfor the year ended June 30, 2009 was largely related to the US$233.9 million in capital expenditurerequired for the installation of PM-2 at the Bhigwan unit and PM-7 at the Ballarpur unit. The increasein cash used for investing activities was partially offset by deferred consideration of US$36.0 millionpaid for the acquisition of the SFI unit during the year ended June 30, 2009, compared to US$45.0million paid in the year ended June 30, 2008.
Net cash flows generated from/(used in) financing activities
In the nine months ended March 31, 2011, the Group generated US$87.9 million from financingactivities compared to net cash used in financing activities of US$2.0 million in the nine months endedMarch 31, 2010. The increase was primarily due to increase in working capital loan byUS$78.1 million during the nine months ended March 31,2011 and 20.6 million during the nine monthsended March 31, 2010. During this period, the Group repaid a total of US$203.3 million toward anoutstanding loan from a consortium led by IDBI Bank and the first installment of a new loan fromRabobank International, Singapore Branch (“Rabobank”), and it refinanced its US$145.0 million loanfrom a consortium led by Axis Bank Limited by way of a loan, for an equivalent amount, from aconsortium led by Rabobank. In order to refinance the majority of the IDBI Bank loan, the Groupissued INR 7,500 million (US$163.7 million) of non-convertible debentures which are publicly listedon the institutional debt market of the Bombay Stock Exchange. In addition, the Group obtained anddrawdown a US$50.0 million loan from Rabo Bank and a facility of €28.8 million from Nordea Bank /ING in order to finance its new pulp machine to expand hardwood pulp capacity at the SFI unit. AtMarch 31, 2011, US$39.2 million of this €28.8 million facility from Nordea Bank and ING had beendrawn down. Also, a loan of US$20.0 million from Standard Chartered Bank Malaysia Berhad, aslender and US$20 million from Oversea-Chinese Banking Corporation Limited, as lender were yet tobe drawn down as of March 31, 2011.
In the year ended June 30, 2010, the Group used US$24.3 million in financing activities whilst in theyear ended June 30, 2009 it generated US$136.4 million from financing activities. This decrease wasprimarily due to a further US$185.0 million drawdown of the US$560.0 million Citibank facilityduring the year ended June 30, 2009. During the year ended June 30, 2010 the Group refinanced anumber of its existing loans. In October 2009, the Group refinanced the outstanding US$498.3 million
— 85 —
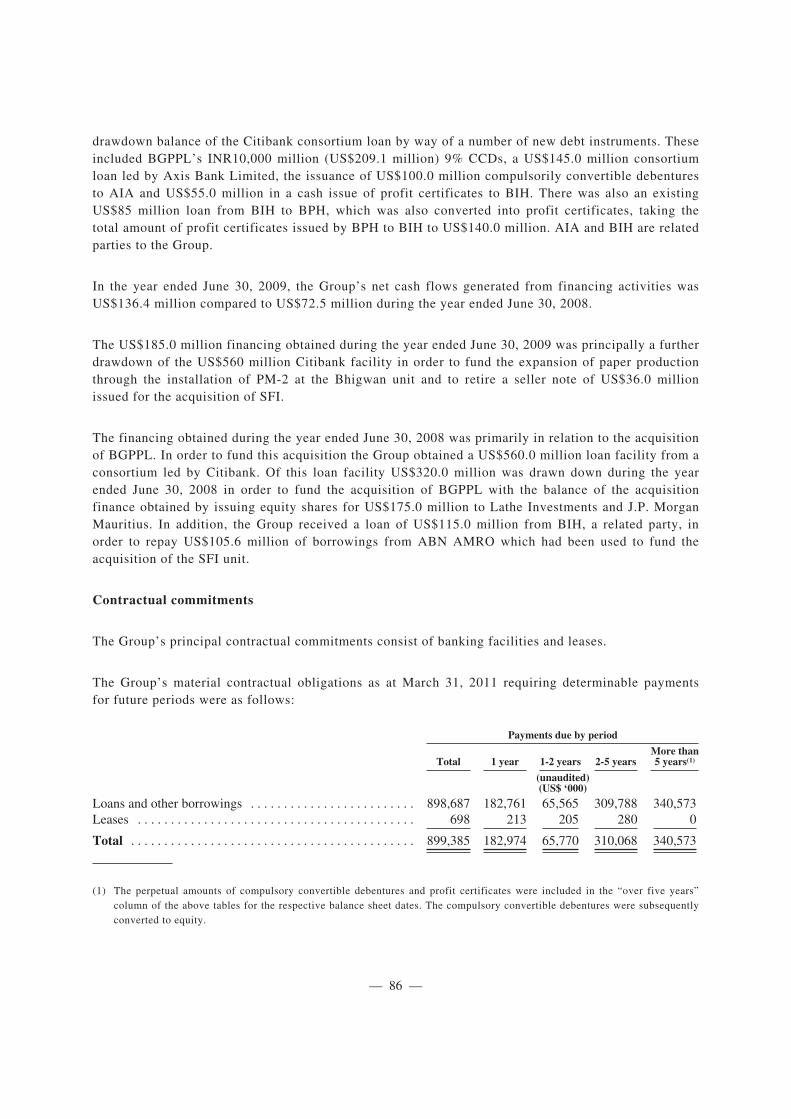
drawdown balance of the Citibank consortium loan by way of a number of new debt instruments. Theseincluded BGPPL’s INR10,000 million (US$209.1 million) 9% CCDs, a US$145.0 million consortiumloan led by Axis Bank Limited, the issuance of US$100.0 million compulsorily convertible debenturesto AIA and US$55.0 million in a cash issue of profit certificates to BIH. There was also an existingUS$85 million loan from BIH to BPH, which was also converted into profit certificates, taking thetotal amount of profit certificates issued by BPH to BIH to US$140.0 million. AIA and BIH are relatedparties to the Group.
In the year ended June 30, 2009, the Group’s net cash flows generated from financing activities wasUS$136.4 million compared to US$72.5 million during the year ended June 30, 2008.
The US$185.0 million financing obtained during the year ended June 30, 2009 was principally a furtherdrawdown of the US$560 million Citibank facility in order to fund the expansion of paper productionthrough the installation of PM-2 at the Bhigwan unit and to retire a seller note of US$36.0 millionissued for the acquisition of SFI.
The financing obtained during the year ended June 30, 2008 was primarily in relation to the acquisitionof BGPPL. In order to fund this acquisition the Group obtained a US$560.0 million loan facility from aconsortium led by Citibank. Of this loan facility US$320.0 million was drawn down during the yearended June 30, 2008 in order to fund the acquisition of BGPPL with the balance of the acquisitionfinance obtained by issuing equity shares for US$175.0 million to Lathe Investments and J.P. MorganMauritius. In addition, the Group received a loan of US$115.0 million from BIH, a related party, inorder to repay US$105.6 million of borrowings from ABN AMRO which had been used to fund theacquisition of the SFI unit.
Contractual commitments
The Group’s principal contractual commitments consist of banking facilities and leases.
The Group’s material contractual obligations as at March 31, 2011 requiring determinable paymentsfor future periods were as follows:
Payments due by period
Total 1 year 1-2 years 2-5 yearsMore than5 years(1)
(unaudited)(US$ ‘000)
Loans and other borrowings . . . . . . . . . . . . . . . . . . . . . . . . . 898,687 182,761 65,565 309,788 340,573Leases . . . . . . . . . . . . . . . . . . . . . . . . . . . . . . . . . . . . . . . . . . 698 213 205 280 0
Total . . . . . . . . . . . . . . . . . . . . . . . . . . . . . . . . . . . . . . . . . . . 899,385 182,974 65,770 310,068 340,573
(1) The perpetual amounts of compulsory convertible debentures and profit certificates were included in the “over five years”column of the above tables for the respective balance sheet dates. The compulsory convertible debentures were subsequentlyconverted to equity.
— 86 —
Capital expenditures
For the years ended June 30, 2008, 2009 and 2010, the Group’s capital expenditures were US$104.8million, US$233.9 million and US$51.4 million, respectively. For the nine months ended March 31,2011, the Group’s capital expenditures were US$167.9 million. The capital expenditures for the yearsended June 30, 2008 and June 30, 2009 were related to paper capacity expansion at the Ballarpur unitand Bhigwan unit. The capital expenditures for the year ended June 30, 2010 were related to pulp millexpansion at the SFI unit, while the capital expenditures for the nine months ended March 31, 2011were related to pulp mill expansion at Ballarpur Unit and SFI Unit.
The Group’s total planned capital expenditures for the year ended June 30, 2012 are US$188 million,US$172 million of which is expected to be expansionary capital expenditure for pulp capacityexpansions at the Ballarpur unit and SFI unit, efficiency improvement capital expenditure for papercapacity at the Ballarpur unit and the Bhigwan unit, and plantation development expenditure at SFI.The Group’s total planned capital expenditures for the year ended June 30, 2013 are US$55 million,US$39 million of which is expected to be efficiency improvement capital expenditure for papercapacity at the Ballarpur unit and the Bhigwan unit, and plantation development expenditure at SFI.These planned capital expenditures will primarily be funded by internal accruals and proceeds from theissuance of these Securities.
The Group’s capital expenditures for the year ended June 30, 2014 are US$498 million, and for theyear ended June 30, 2015 are $76 million. The Group’s capital expenditures for the years endedJune 30, 2014 and June 30, 2015 are uncommitted and are contingent upon an initial public offeringtaking place and will be funded from the proceeds of that initial public offering.
Primary Risks
Interest rate risk
The Group’s significant borrowings are at variable rates except for short-term borrowings. Theseborrowings are linked to LIBOR and prime lending rates of banks in India. The Group has takeninterest rate caps for certain of its LIBOR linked borrowings during the year ended June 30, 2009. Formore information, see note 3.1(b) to the Consolidated Historical Financial Information. Refer tonote 12 for interest rate swap contracts outstanding as at each balance sheet date and the gain or lossrecognized on these contracts.
Credit risk
Credit risk includes risks relating to banks with which the Group maintains accounts, as well ascustomers to whom the Group extends credit.
The Group considers factors such as track record, size of the institution, market reputation and servicestandards to select the banks with which balances are maintained. Generally, the balances are
— 87 —

maintained with the institutions with which the Group has also availed borrowings. The Group does notmaintain significant cash and deposit balances other than those required for its day to day operations.
The Group extends credit to customers for the short-term only. The Group considers factors such ascredit track record in the market, past dealings with the Group for extension of credit to customers. TheGroup monitors the payment track record of the customers. The Group has also taken security depositsfrom its distributors, which mitigate the credit risk to an extent. For more information, see note 3.1(c)to the Consolidated Historical Financial Information.
Liquidity risk
The Group relies on a mix of borrowings, capital infusion and excess operating cash flows to meet itsneeds for funds. The current committed lines of credit are sufficient to meet the Group’s short tomedium term expansion needs. For more information, see note 3.1(d) to the Consolidated HistoricalFinancial Information.
Off-balance sheet arrangements
The Group has no off-balance sheet arrangements as of the date of this Offering Circular.
Seasonality
The Group’s financial results have not historically been subject to significant seasonal trends.
Critical accounting policies
The preparation of consolidated financial information requires management to make estimates andassumptions relating to the reporting of assets and liabilities and the disclosure of contingent assetsand liabilities at the date of the consolidated financial statements and for reporting amounts ofrevenues and expenses during the period. Actual results could differ from those estimates. For detailsof changes in accounting policies and disclosure, refer to the significant policy changes detailed innote 2.2 to the Consolidated Historical Financial Information. Significant estimates and assumptionsare used when accounting for following items:
Group reorganizations
On March 19, 2008, BPH acquired 99.9% of BGPPL’s shares. Under the same agreement, BPH issuedadditional shares for cash to two investors, J.P. Morgan Mauritius and Lathe Investments, therebydiluting Ballarpur’s effective ownership of BGPPL to 78.79%. Contractual arrangements put in placeas part of this agreement resulted in BGPPL becoming a joint venture between Ballarpur andJ.P. Morgan Mauritius and Lathe Investments. This agreement was amended on May 29, 2009 for noconsideration and from that date the Group became a subsidiary of the Ballarpur Group again.
— 88 —

In the determination of the management of the Group, the reorganization that introduced the additionalfunding from the two additional investors, J.P. Morgan Mauritius and Lathe Investments, in return forissue of shares is outside the scope of IFRS 3 ‘Business Combinations’ (“IFRS3”) as it does not meetthe definition of a business combination as per IFRS 3. The Group’s management has appliedpredecessor accounting to the transaction, thereby recording BGPPL and SFI at the carrying amountsthey were previously carried at in the financial statements of the Ballarpur Group. The consolidatedhistorical financial information setting out the Group’s financial position as of June 30, 2008, 2009 and2010 and results of operations and cash flows for the three years are on this basis.
Until July 14, 2008, BPH was the holding company of the Group. BPH was owned by BIH, LatheInvestments Pte Ltd. and J.P. Morgan Mauritius in the ratio of 78.79%, 13.33% and 7.88%respectively. At that time BIGPH was wholly owned by BIH.
On July 14, 2008, BPH became a wholly owned subsidiary of BIGPH, and BIGPH became owned as to78.79% by BIH, 13.33% by Lathe Investments and 7.88% by J.P. Morgan Mauritius.
As BIGPH is substantially a new company, the acquisition of BPH by BIGPH has been treated in theseconsolidated financial statements as a group reorganization. This means that the acquiring company isBPH and the company being acquired is the Group’s current legal parent company BIGPH. Theconsolidated assets and liabilities of BIGPH immediately after the effective time of the groupreorganization are the same as the consolidated assets and liabilities of BPH immediately prior thereto.
This consolidated financial information has been prepared in the name of the current legal parentcompany BIGPH, but continuity in the Group accounting applies to the consolidated financialinformation of BPH. The information for the period prior to July 14, 2008 in these consolidatedfinancial statements has been extracted from the BPH consolidated financial statements.
Property, plant and equipment
For material fixed assets in an acquisition, an external adviser is used to perform a fair valuation of theacquired fixed assets and to assist in determining their remaining useful lives. The Issuer believes thatthe assigned values and useful lives, as well as the underlying assumptions, are reasonable, thoughdifferent assumptions and assigned lives could have a significant impact on the reported amounts.
Biological assets
Biological assets are measured at their fair value. The fair value of biological assets is determinedbased among other estimates on growth potential, harvesting, price development and discount rate.Changes in any estimates could lead to recognition of significant fair value changes in incomestatement.
Impairment of non-financial assets
Assets that have an indefinite useful life, for example, goodwill are not subject to amortization and aretested annually for impairment. Assets that are subject to amortization and depreciation are reviewed
— 89 —

for impairment whenever events or changes in circumstances indicate that the carrying amount may notbe recoverable. An impairment loss is recognized for the amount by which the asset’s carrying amountexceeds its recoverable amount. The recoverable amount is the higher of fair value less costs to selland value in use. For the purposes of assessing impairment, assets are grouped at the lowest levels forwhich there are separately identifiable cash flows (cash-generating units). Non-financial assets otherthan goodwill that suffered impairment are reviewed for possible reversal of the impairment at eachreporting date.
Impairment of financial assets
Assets carried at amortized cost
The Group assesses at the end of each reporting period whether there is objective evidence that afinancial asset or group of financial assets is impaired. A financial asset or a group of financial assetsis impaired and impairment losses are incurred only if there is objective evidence of impairment as aresult of one or more events that occurred after the initial recognition of the asset (a ‘loss event’) andthat loss event (or events) has an impact on the estimated future cash flows of the financial asset orgroup of financial assets that can be reliably estimated.
The criteria that the Group uses to determine that there is objective evidence of an impairment lossinclude:
Š Significant financial difficulty of the issuer or obligor;
Š a breach of contract, such as a default or delinquency in interest or principal payments;
Š the group, for economic or legal reasons relating to the borrower’s financial difficulty, grantingto the borrower a concession that the lender would not otherwise consider;
Š it becomes probable that the borrower will enter bankruptcy or other financial reorganization;
The Group first assesses whether objective evidence of impairment exists.
For loans and receivables category, the amount of the loss is measured as the difference between theasset’s carrying amount and the present value of estimated future cash flows (excluding future creditlosses that have not been incurred) discounted at the financial asset’s original effective interest rate.The carrying amount of the asset is reduced and the amount of the loss is recognized in theconsolidated income statement. If a loan or held-to-maturity investment has a variable interest rate, thediscount rate for measuring any impairment loss is the current effective interest rate determined underthe contract. As a practical expedient, the Group may measure impairment on the basis of aninstrument’s fair value using an observable market price.
If, in a subsequent period, the amount of the impairment loss decreases and the decrease can be relatedobjectively to an event occurring after the impairment was recognized (such as an improvement in the
— 90 —

debtor’s credit rating), the reversal of the previously recognized impairment loss is recognized in theconsolidated income statement.
Assets classified as available for sale
The Group assesses at the end of each reporting period whether there is objective evidence that afinancial asset or a group of financial assets is impaired. For debt securities, the group uses the criteriarefer to (a) above. In the case of equity investments classified as available for sale, a significant orprolonged decline in the fair value of the security below its cost is also evidence that the assets areimpaired. If any such evidence exists for available-for-sale financial assets, the cumulativeloss —measured as the difference between the acquisition cost and the current fair value, less anyimpairment loss on that financial asset previously recognized in profit or loss – is removed from othercomprehensive income and recognized in the separate consolidated income statement. Impairmentlosses recognized in the separate consolidated income statement on equity instruments are not reversedthrough the separate consolidated income statement. If, in a subsequent period, the fair value of a debtinstrument classified as available for sale increases and the increase can be objectively related to anevent occurring after the impairment loss was recognized in profit or loss, the impairment loss isreversed through the separate consolidated income statement.
Impairment testing of trade receivables is described in note 2.13 to the Consolidated HistoricalFinancial Information.
Financial assets
The Group classifies its financial assets in the following categories: loans and receivables, available-for-sale and at fair value through profit or loss. The classification depends on the purpose for whichthe financial assets were acquired. Management determines the classification of its financial assets atinitial recognition.
Loans and receivables
Loans and receivables are non-derivative financial assets with fixed or determinable payments that arenot quoted in an active market. They are included in current assets, except for maturities greater than12 months after the balance sheet date.
Available-for-sale financial assets
Available-for-sale financial assets are non-derivative financial assets that are either designated in thiscategory or not classified in any of the other categories. They are included in non-current assets unlessmanagement intends to dispose of the investment within 12 months of the balance sheet date.
— 91 —

At fair value through profit or loss
Derivative financial instruments are classified in this category unless they are designated as hedges.Assets in this category are categorized as current assets if they are expected to be realized within 12months of the balance sheet date.
Regular purchases and sales of financial assets are recognized on the trade-date – the date on which theGroup commits to purchase or sell the asset. Investments are initially recognized at fair value plustransaction costs for all financial assets not carried at fair value through profit or loss. Financial assetscarried at fair value through profit or loss are initially recognized at fair value, and transaction costsare expensed in the income statement. Financial assets are derecognized when the rights to receive cashflows from the investments have expired or have been transferred and the Group has transferredsubstantially all risks and rewards of ownership. Available-for-sale financial assets and financial assetsat fair value through profit or loss are subsequently carried at fair value. Loans and receivables aresubsequently carried at amortized cost using the effective interest method. Change in the fair value ofnon-monetary securities classified as available for sale are recognized in other comprehensive income.
The Group assesses at each balance sheet date whether there is objective evidence that a financial assetor a group of financial assets is impaired.
Revenue recognition
Revenue from sale of goods is recognized when the risks and rewards of ownership have passed to thecustomers. Usually, this means that sales are recorded upon delivery of goods to customers inaccordance with agreed terms of delivery.
Dividend income is recognized when the right to receive payment is established.
Interest income is recognized on a time-proportion basis using the effective interest method. When areceivable is impaired, the Group reduces the carrying amount to its recoverable amount, being theestimated future cash flow discounted at the original effective interest rate of the instrument, andcontinues unwinding the discount as interest income. Interest income on impaired loans is recognizedusing the original effective interest rate.
Export incentives are recognized at the time of export when the Group will comply with all attachedconditions.
Rental income is accrued on a time basis by reference to the agreements entered into.
Fair value of derivatives and available-for-sale financial asset
Derivative financial assets and liabilities are measured at their fair value. The fair value of interest rateswaps is determined based among other estimates on applicable or effective dates and day conventions,
— 92 —

fixed rate coupon, floating index, notional amount and reset frequency. The fair value of foreignexchange forward contracts is determined based among other estimates on value of swap and themark-to-market value of option. Changes in any estimates could lead to recognition of significant fairvalue changes in income statement. The Group has used discounted cash flow analysis foravailable-for-sale financial asset that is not traded in an active market.
Hedge accounting
Foreign exchange risk in highly probable sales in future periods are hedged using foreign currencyborrowings designated as cash flow hedges. Estimating highly probable sales volume involvesgathering and evaluating sales estimates for future periods as well as analyzing actual outcome on aregular basis in order to fulfill effectiveness testing requirements for hedge accounting. Deviations inoutcome of sales might result in that the requirements for hedge accounting are not fulfilled.
Income taxes
Management judgment is required for the calculation of provision for income taxes and deferred taxassets and liabilities. The Group reviews at each balance sheet date the carrying amount of deferred taxassets. The Group considers whether it is probable that the subsidiary will have sufficient taxableprofits against which the unused tax losses or unused tax credits can be utilized. The factors used inestimates may differ from actual outcome which could lead to significant adjustment to the amountsreported in the consolidated financial statements.
Sales tax scheme
The Group is eligible for certain tax and other benefits from the Indian regulatory authorities under anincentive scheme subject to compliance with conditions stipulated in the scheme. The Group has notrecognized any tax incentives under this scheme pending uncertainties surrounding the amount ofincentive that the Group is eligible for and regulatory approval to receive these tax incentives.
— 93 —

BUSINESS
Investors should read the section in conjunction with the more detailed information contained in thisdocument including the financial and other information appearing in the section entitled“Management’s Discussion and Analysis of Financial Condition and Results of Operations”. Investorsshould also read the industry report prepared by Pöyry and included elsewhere in this OfferingCircular, along with the disclaimer included therein and “Risk Factors — Some of the informationincluded in this Offering Circular has been prepared by Pöyry and may be inaccurate or outdated”.
Overview
The Group is India’s largest producer of writing and printing paper and Malaysia’s largest producer ofuncoated wood-free paper products. The Group has a 66 year history in India and SFI, which wasacquired by Ballarpur in March 2007, has a 29 year history in Malaysia. The Issuer is a subsidiary ofBallarpur Industries Limited, a publicly listed company on the Bombay Stock Exchange and NationalStock Exchange of India. Ballarpur Industries Limited has paid dividends of Rs. 0.50, Rs. 0.50 andRs. 0.70 per equity share of Rs. 2.00 for the years ended June 30, 2010, 2009 and 2008, respectively.The Group is a part of the Avantha Group and has been the market leader in coated and uncoatedwood-free paper in India since 1945. The Group is also the largest producer and seller of market rayongrade pulp in India. The Group’s paper, hardwood pulp and rayon grade pulp manufacturing operationsspan across four production units: the Ballarpur unit, the Bhigwan unit and the Kamalapuram unit inIndia and the SFI unit in Malaysia.
Due to the low level of per capita paper consumption in India, the Issuer believes that there issignificant room for growth in demand and, according to Pöyry, the average per capita consumption ofpaper in India is expected to grow from 8.4 kg in 2009 to 13.9 kg by 2020. Pöyry estimates that thesize of the Indian paper market will rise from 10.1 million tonnes in 2009 to 19.2 million tonnes by2020. Consequently, Pöyry anticipates that the compound annual growth rate of paper demand in Indiafrom 2009 to 2020 will be 6.0%, which is higher than China (4.5%) the rest of Asia (excluding Chinaand India) (2.6%) and significantly higher than Western Europe (0.6%) North America (0.5%) andJapan (-0.2%). The projection for demand in India is based primarily on the projection of sustainedeconomic growth at approximately 8%, as well as population growth of 1.3% per year through 2020.
According to Pöyry, there are currently no publicly announced paper production expansion projectswithin India which have been commenced or announced which would become operational after 2012,unless delayed from an earlier announced operational date. Therefore, with demand growth atapproximately 6.0% and production capacity consistent from 2012 onward in India and withoutincreased imports, the Group anticipates a significant gap between supply and demand of writing andprinting paper starting after 2012.
Along with this projected growth in paper and paperboard demand, Pöyry estimates that the compoundannual growth rate of demand for coated wood-free and uncoated wood-free paper in India from 2009through 2020 will be 9.3% and 6.4%, respectively. Further, with respect to the Group’s primary
— 94 —

products, blade coated wood-free paper and Hi-bright uncoated wood-free paper, demand is expected togrow 10.2% and 8.1% over the same period.
Uncoated wood-free paper is mainly used in printing presses, copy paper and home printers andincludes a range of speciality grades of paper with various colors and cut-sizes. Uncoated wood-freepaper has a broad customer base including paper merchants, office equipment manufacturers, officesuppliers, retailers and printers. Uncoated wood-free paper can come as surface sized and non-surfacesized. Surface sized wood-free paper is paper that has been sized on the surface by a size press insidethe paper machine.
Coated wood-free paper is the same product as uncoated wood-free paper but has a thin layer ofcoating on one or both sides. Coated wood-free paper is sometimes produced by a “blade” technology,which makes it a higher value product. As such, coated wood-free paper is used for applications thatrequire higher quality paper, for example high-end brochures, annual reports, advertising materials, artbooks, labels and promotional products.
The Group maintains strong leadership positions with respect to its core products in India. In the yearended December 31, 2009, the Group had a 24% market share in the Hi-bright uncoated wood-freepaper segment in India (as compared to a market share of 13% for its next closest competitor andultimate parent, BILT, and a market share of 12% for TNPL) and a 51% market share in the bladecoated wood-free paper segment in India (as compared to a market share of 11% for its next closestcompetitor, JK Paper), as reported by Pöyry. According to Pöyry, the total market size in India of theblade coated wood-free and Hi-bright uncoated wood-free paper markets in the year endedJune 30, 2010 was 370,000 tonnes and 549,000 tonnes respectively. The Group’s total productioncapacity for writing and printing paper in India in 2010 was 614,500 tonnes, compared to 390,000tonnes of its closest competitor.
In 2009, according to Pöyry, in Malaysia the Group had a 28% market share of the uncoated wood-freepaper segment (as compared to a market share of 22% for its next closest competitor). The Groupproduces both surface sized and non-surface sized paper in Malaysia, and according to Pöyry, held a22% and 73% market share in these markets, respectively, in 2009. According to Pöyry, the totalmarket size of the surfaced sized and non-surface size uncoated wood-free markets in 2009 in Malaysiawere 233,000 tonnes and 61,000 tonnes respectively.
The Group produces paper grade hardwood pulp in order to meet its own internal hardwood pulprequirements for paper production as well as rayon grade pulp for sale on the market to the viscosefiber industry. During the nine months ended March 31, 2011, the Group’s Ballarpur and SFI unitsproduced approximately 56% of the total hardwood grade pulp used by the Group (resulting in 50% ofthe total pulp used by the Group). The Group also produces rayon grade pulp at the Kamalapuram unitfor sale by the Group. In the nine months ended March 31, 2011, the Group produced 64,789 tonnes ofrayon grade pulp.
Certain of the Group’s paper and hardwood pulp production facilities are located near some of thelargest population centers (including Mumbai), which provides it with access to local markets andhelps to give it geographic coverage of the entire Indian and Malaysian markets. The Indian units are
— 95 —

located at Ballarpur in Central India (the “Ballarpur unit” has paper production capacity of 299,500 tpaand hardwood pulp production capacity of 130,000 tpa); at Bhigwan in Western India (the “Bhigwanunit” has paper production capacity of 315,000 tpa) and at Kamalapuram in Southern India (the“Kamalapuram unit” has a rayon grade pulp production capacity of 98,550 tpa). The Group’sMalaysian unit is in the State of Sabah (Sabah Forest Industries, or the “SFI unit”, has paperproduction capacity of 144,210 tpa and hardwood pulp production capacity of 120,000 tpa). The SFIunit was acquired in 2007 in order to secure a hardwood fiber source sufficient to meet the Group’sneed for hardwood fiber as it increased paper and hardwood pulp production, securing the Issuer’sposition as the only Indian paper company with its own source of fiber outside of India. This unitcontains approximately 288,138 hectares of forest and plantation land which provides the Group with astable hardwood fiber source.
The Group’s operations have grown significantly since 2008. Since June 30, 2008, the Group’s annualpaper production capacity has increased by 88%, from 403,710 tpa to 758,710 tpa as at March 31, 2011and the Group anticipates a total production capacity of 1,443,710 tpa by the year ended June 30, 2014,following further expansion and de-bottlenecking projects.
The Group is also currently expanding its hardwood pulp production at both the SFI unit and theBallarpur unit. The SFI expansion is intended to create a total net increase in hardwood pulp capacityof 120,000 tpa and the Ballarpur expansion is expected to create a total net increase of 170,000 tpa(with new capacity at the Ballarpur unit totalling 300,000 tpa, replacing capacity of 130,000 tpa whichis being retired). The Issuer expects its total hardwood pulp production capacity to be 540,000 tpa bythe end of 2012. The increased hardwood pulp production will reduce the Group’s cost of hardwoodpulp for paper production, secure a source for the Group’s key raw material input and reduce exposureto the volatility in market prices for hardwood pulp.
The Group’s production capacity with respect to paper, hardwood pulp and rayon grade pulp as atMarch 31, 2011 is shown below:
At March 31, 2011
Unit (tpa) PaperHardwood
Pulp
RayonGradePulp
Ballarpur . . . . . . . . . . . . . . . . . . . . . . . . . . . . . . . . . . . . . . . . . . . . . . . . . . . . . . . . . . 299,500 130,000Bhigwan . . . . . . . . . . . . . . . . . . . . . . . . . . . . . . . . . . . . . . . . . . . . . . . . . . . . . . . . . . 315,000Kamalapuram . . . . . . . . . . . . . . . . . . . . . . . . . . . . . . . . . . . . . . . . . . . . . . . . . . . . . . 98,550SFI . . . . . . . . . . . . . . . . . . . . . . . . . . . . . . . . . . . . . . . . . . . . . . . . . . . . . . . . . . . . . . . 144,210 120,000
Total . . . . . . . . . . . . . . . . . . . . . . . . . . . . . . . . . . . . . . . . . . . . . . . . . . . . . . . . . . . . . 758,710 250,000 98,550
Each of the Group’s units has on-site power stations that are either captive power generation capacity,with power facilities at the Kamalapuram and SFI units owned by the Group, or provided by anaffiliated company, with power facilities at the Ballarpur and Bhigwan units owned by Avantha Power(in which the Group maintains a 4.22% interest) which translates in a 26% interest in the equity of theon-site power facility. This 26% interest is required for the Group to maintain captive power plantstatus.
— 96 —

As a result of captive hardwood pulp-making capacity at the SFI unit and the Ballarpur unit and powergeneration facilities at all of the units, the Group believes that it maintains a high degree of integrationin meeting its demand for paper grade hardwood pulp and power, which are two key inputs in paperproduction. With the addition of the wood fiber supply at SFI and future additional hardwood pulpcapacity at the SFI unit and the Ballarpur unit, as well as its direct access to certain of the necessarychemicals (in part via onsite production facilities at the Ballarpur and Bhigwan units) and waterrequired for production, the Issuer believes that the Group will be increasingly vertically integrated.Refer to “— Competitive Strengths — Vertical integration” for further details on vertical integration.
In order to reach its broad customer base across India, the Group operates a comprehensive distributionnetwork consisting of four RSOs, 14 depots and through 141 distributors throughout India. TheGroup’s Malaysian distribution is managed by 55 distributors.
The Issuer is led by a Board and Senior Management team with extensive experience in the industry.As a part of the Avantha Group, the Group maintains a close working relationship with its majorityshareholder, BILT.
History
The Ballarpur Group was established in 1945 by Mr. Karam Chand Thapar as part of the Thapar Group,which was one of India’s largest business houses. The first public offer of shares by the BallarpurGroup was achieved through an initial public offering in 1968 in the name of Ballarpur IndustriesLimited. Control of the Ballarpur Group was passed to Mr. Gautam Thapar with his appointment asmanaging director of Ballarpur Industries in 1999. Following a redefinition of its corporate strategy in1998 whereby it focused on its core paper and pulp businesses, the Ballarpur Group acquired Sinar MasIndia, then the largest Indian producer of coated paper in 2001 and merged it into the Ballarpur Groupin 2003. In 2006 Mr. Gautam Thapar was appointed chairman of Ballarpur Industries and the followingyear the group of companies run by Mr. Gautam Thapar (which included the Ballarpur Group, AvanthaPower and Compton Greaves Limited amongst others) were rebranded as the Avantha Group. TheGroup also acquired SFI in 2007. In order to facilitate the raising of capital and attract investmentinternationally, in 2007, the Ballarpur Group separated its production units and assets (at Ballarpur,Bhigwan and Kamalapuram) into BGPPL, which itself is held in an offshore subsidiary (BPH)). Thesethree assets represented approximately 50% of the revenue of the Ballarpur Group for the year endedJune 30, 2008 and have been the focus of the production expansion projects that the Ballarpur Grouphas been undertaking since 2005.
In March 2008, J.P. Morgan Mauritius and Lathe Investment (a wholly-owned subsidiary ofGovernment of Singapore Investment Corporation (Ventures) Pte Ltd) invested in BPH and in July2008 their ownership in BPH was exchanged for shares of the Issuer. Together, J.P. Morgan Mauritiusand Lathe Investment hold 18.61% of the shares in the Issuer. AIA, an Avantha Group company, owns9.09% of the shares in the Issuer, with the balance held by Ballarpur through its wholly-ownedsubsidiary Ballarpur International Holdings B.V. (“BIH”).
The Ballarpur Group has retained three manufacturing units and the retail business of the BallarpurGroup. These three units will focus on the production of copy paper, specialty paper (including décor,
— 97 —

insulating, grease proof, carbon, check and security paper), BCB packaging containing both recycledcorrugated board and recycled carton board, hard and soft tissue, kraft paper and sack kraft paper. Inaddition, the Ballarpur Group will continue to manufacture premium business stationery paper(including bond paper), super printing paper and BILT classic paper although such products will besold exclusively by the Group on Ballarpur’s behalf. “Relationship with the Ballarpur Group andAvantha Group” has further information on the relationship between the Group, the Ballarpur Groupand the Avantha Group.
Competitive strengths
The Issuer believes its competitive strengths include the following:
Operations in high growth markets
The primary drivers of demand for wood-free paper are GDP growth and increased per capita income.These factors, in turn, provide a foundation for other drivers of demand for wood-free paper, includingincreased spending in the marketing industry, disposable income, government spending on educationand literacy rates. India’s GDP is projected to grow at an annual growth rate of approximately 8% until2020 and is projected to be the 3rd largest global economy by 2050 moving up from its current positionof 5th. India’s share of global GDP is expected to rise to 13% by 2050, from the current share of 2%.This growth is expected to have significant positive effects on increased per capita income, disposableincome and customer purchasing power in India. A shift in discretionary spending in India is projectedto rise from 52% of total private spending to 70% between 2005 and 2025 and a substantial increase inIndia’s middle class are key drivers of increases in per capita disposable income. India’s middle classis expected to increase by approximately 60 million households by 2020, with an increase in the urbanpopulation from 29% in 2005 to 37% in 2025 while India’s population of a working age is projected tobe the largest by 2050. Further, government spending on education was estimated to totalUS$10.7 billion from 2002 through the end of 2011 of which US$6 billion is on paper related products.The Group believes that this increased expenditure, along with other social and demographic trends,will impact literacy rates significantly and the demand for paper products such as books and notebooksduring the next decade.
As a result, per capita consumption of paper and paperboard (including coated and uncoated wood-freepaper) from 2009 to 2020 is expected to increase by approximately 66% from approximately 8.4 kgper year to approximately 13.9 kg per year. Pöyry estimates that total consumption will increase from10.1 million tonnes in 2009 to 19.2 million tonnes in 2020, representing a compound annual growthrate of 6.0%, as compared to 4.5% in China, 0.5% in North America.
According to Pöyry, as the Indian middle class and paper consumption grows, there is likely to be ashift to higher quality, such as coated paper. Consumption of coated wood-free paper as a percentageof writing and printing wood-free paper globally was 32% in 2009, similar consumption in India was13%. In addition, according to Pöyry, consumption of blade coated wood-free paper (generallyconsidered higher quality coated paper) has grown by 14% from 2009 through 2010, whileconsumption of knife coated and other coated wood-free paper has declined as a percentage of total
— 98 —

consumption during this period. As such, demand for coated and uncoated wood-free paper in India isexpected to grow by 9.3% and 6.4%, respectively per year from 2009 through 2020, while the growthrates for the Group’s primary products, blade coated wood-free paper and Hi-bright uncoated wood-free paper are expected to reach 10.2% and 8.1% during this period, respectively (source: Pöyry).
Market leadership
For over 50 years, the Group (together with its predecessors) has been a leading writing and printingpaper producer in India. The Group holds a dominant position in the blade coated wood-free papersegment in India with a 51% market share for the year ended December 31, 2009, as compared to amarket share of 11% for the year ended December 31, 2009 for its closest domestic competitor(source: Pöyry). The Group holds a leading share of the high quality Hi-bright uncoated wood-freepaper market with a share of 24%, as compared to a market share of 13% held by the Issuer’s parentcompany, BILT, and a market share of 12% for TNPL, a competitor of the Group, for the year endedDecember 31, 2009. The Issuer believes that the Group’s ability to service customers with bothuncoated and coated wood-free products results in a distinct advantage as the Group is able to bundleits products, resulting in pricing flexibility and benefits for its customers with respect to product rangeand product size.
In addition, the Group is the largest producer of market rayon grade pulp in India, with total productionof 85,345 tonnes and total capacity of 98,550 tonnes for the year ended June 30, 2010 at theKamalapuram unit.
The Group is also the largest domestic producer of surface sized and non-surfaced size uncoated wood-free paper in Malaysia. It held a market share of 22% in the surface sized uncoated wood-free papermarket for 2009 and a 73% market share in the non-surfaced sized uncoated wood-free paper segment.The majority of the remaining demand in Malaysia is met by imports from Indonesia, Thailand andChina.
In addition, as a result of the Group’s high quality products, market recognition of the BILT brand andits market leading customer service, the Group has been recognized as a “Superbrand” by theSuperbrand Organization each year since 2004. This market leadership and brand awareness providesthe opportunity for the Group to charge a premium for its products as compared to its principalcompetitors.
Vertical integration
The Group’s business model is based on vertical integration where it seeks to achieve control over thecost of key inputs and flexibility to maximize value across the entire value chain. The Group maintainsits own forest plantations, power facilities (two of which are wholly owned and two of which areowned by Avantha Power from which the Group procures a part of its requirements for power),facilities for the production of chemicals (through arrangements with related parties such as Imerys andSMI and third parties such as SMM required for the paper and hardwood pulp production and extensivehardwood pulp production capacity, all of which provide a high degree of vertical integration.
— 99 —

The Group remains focused on improving each component of its vertical integration business model inorder to take advantage of the anticipated market growth in the coated and uncoated wood-free papermarkets and has almost doubled its paper production capacity from 403,710 tpa at June 30, 2008 to758,710 tpa at March 31, 2011.
The Group expects that the paper production capacity at the Ballarpur unit, Bhigwan unit and SFI unitis expected to be increased, with a total additional paper production capacity of 685,000 tpa by the yearended June 30, 2015. Of this additional 685,000 tpa, the Group expects 75,000 tpa to be the result ofsmall improvement investments at the Ballarpur unit and Bhigwan unit (with capacity expansion of40,000 tpa and 35,000 tpa, respectively) to be completed by September 2012. The Group expects60,000 tpa to be the result of small improvement investments at the SFI unit to be completed by June2014. The Group expects the remaining 550,000 tpa to be the result of the introduction of a newuncoated paper machine at the Ballarpur unit and a new paper board machine at the Bhigwan unit withproduction commencing in July 2014, which will broaden the Group’s product portfolio to includecoated paper board. The new machine at the Ballarpur unit will have a capacity of 250,000 tpa and themachine at the Bhigwan unit will have capacity of 300,000 tpa. The additional 685,000 tpa in capacitywill result in total paper production capacity across all units being increased to approximately1,443,710 tpa by June 30, 2014.
In addition to the forest and plantation at the SFI unit during the nine months ended March 31, 2011,the Group procured a portion of its total hardwood fiber requirements from farmers in connection withthe farm forestry programs operated by BTTL and located near the Group’s Ballarpur andKamalapuram units in India. BTTL is an affiliated company of the Group but is not a member of theGroup. Although the farmers may sell the wood to other purchasers, the quantity purchased by theGroup and the proximity to the Group’s units results in a consistent source of hardwood fiber.
In 2004, BILT and the regional government in Maharashtra entered into a contract whereby theGovernment of Maharashtra agreed to provide bamboo from the government forests to the Ballarpurunit for the production of pulp, paper, paper board and other pulp products. The Ballarpur unit wassubsequently transferred to BGPPL, and the Group now benefits from this contract between BILT andthe government in Maharashtra. The Ballarpur unit currently extracts bamboo and BGPPL pays aroyalty and other dues in relation to this extraction. This contract runs until 2014. During the yearended June 30, 2010, the Group purchased 55% of its total hardwood fiber requirements from thirdparties. Increased harvesting at the SFI unit will help the Group maintain a significant level ofintegration.
The Group meets most of the SFI unit’s wood requirement through its own plantations, and part of thewood requirements for the Ballarpur unit and Kamalapuram unit is purchased through the farm forestryprogram run by BTTL. This reduces the Group’s exposure to hardwood fiber price volatility andtransportation costs. Additionally, the Group intends to increase planting and harvesting within theplantation at the SFI unit, which is intended to increase the wood supplied by the plantation to theGroup’s hardwood pulp production capacity, thereby increasing the Group’s vertical integration. TheGroup procured approximately 42% of its hardwood fiber requirements from its own sources during thenine months ended March 31, 2011 and intends to increase this to 52% by the year endingJune 30, 2013 through this planned increase in planting and harvesting.
— 100 —

In order to maximize the benefit of its access to hardwood fiber and the expansion of paper productioncapacity which has already been completed, the Group is focusing on expanding its hardwood pulpproduction and paper production capacity further. The Group believes that the ongoing expansion ofhardwood pulp production at both the SFI unit and the Ballarpur unit will reduce the Group’s exposureto volatile market prices for hardwood pulp and reduce the Group’s cost of hardwood pulp purchases asthe production cost of pulp is substantially lower than the prevailing market price for hardwood pulp.
With respect to the Ballarpur unit, net production capacity of pulp is intended to be expanded to300,000 tpa by March 2012. Of this capacity, 300,000 tpa will be new capacity provided by a newlyacquired hardwood pulpmill which is currently being installed using equipment acquired from anexisting pulpmill in Finland, while the existing facility with capacity of 130,000 tpa will be retired.This increased net capacity of 170,000 tpa, along with the additional capacity discussed below at theSFI unit, is intended to satisfy the increased pulp requirements resulting from the increased paperproduction capacity expected at the Ballarpur unit and the Bhigwan unit (excluding the 300,000 tpapaper board machine to be installed at the Bhigwan unit).
The hardwood pulp production expansion project at the SFI unit is intended to increase hardwood pulpproduction by over 120,000 tpa by September 2011, with wood sourced from the Group’s own forestsand plantations in Malaysia. The Group has leasehold rights to approximately 288,138 hectares offorest and plantation land. The wood fiber available from these forest and plantation lands is expectedto be sufficient to meet the hardwood fiber requirements of the increased hardwood pulp productioncapacity at the SFI unit. This additional hardwood pulp production capacity is intended to be used forthe expanded paper capacities in India.
For the nine months ended March 31, 2011, the Group produced approximately 50% and 56% of itstotal pulp and hardwood pulp requirements, respectively, from its own units and intends to produce90% of its total pulp and 100% of its hardwood pulp by the year ending June 30, 2013.
With this additional hardwood pulp production capacity, the Issuer believes the Group will be fullyintegrated with respect to the hardwood pulp required to maximize its paper production capacity by theend of 2012-2013 (excluding the 300,000 tpa paper board machine to be installed at the Bhigwan unit).The Group will continue to purchase its softwood pulp from the market. Hardwood pulp made upapproximately 88% of the Group’s total pulp requirements during the nine months endedMarch 31, 2011.
Further, the Group’s units contain captive energy production with on-site facilities at each unit,including two that are owned by Avantha Power. Three of the facilities produce approximately 96% ofthe relevant unit’s energy requirements, while the Kamalapuram unit produces 83% of that unit’srequirements during the year ended June 30, 2010. Historically, Avantha Power has increased powergeneration capacity in parallel with growing paper/pulp operations and the Issuer believes that AvanthaPower will continue this approach for the foreseeable future. The Ballarpur unit’s chemical plantcomplex produces caustic soda (total capacity of 14,400 tpa), chlorine (total capacity of 12,775 tpa),chlorine dioxide (total capacity of 1,095 tpa) and sulphur dioxide (total capacity of 444 tpa), all ofwhich are vital chemicals for the paper process. The Ballarpur unit sells any excess caustic sodaproduced at the Plant on the market. The Group’s other units purchase all chemical requirements fromthe market.
— 101 —

The Group has previously furthered its vertical integration through acquisitions (such as through theacquisition of the Bhigwan unit, previously known as Sinar Mas India, in May 2001, and the SFI unitin March 2007) in addition to its pursuit of organic growth described above and intends to focus futurevertical integration upon the pursuit of both organic growth and further acquisitions. The Issuerbelieves that, in line with its previous successful paper and hardwood pulp production projects, thecurrent projects will significantly increase the Group’s ability to capitalize upon the expected growthin the Indian market along with the growing demand for coated and uncoated wood-free paperproducts. Further, given the 88% expansion of the Group’s paper production from 2008 to March 2011(from 403,710 tpa to 758,710 tpa) and the integration of the SFI unit in 2007, the Group has extensiveexperience in expanding the vertical integration across the entire value chain. The Issuer believesincreased vertical integration will continue to improve the Group’s profitability.
Among the most extensive Indian and Malaysian distribution networks
The Indian paper market is characterized by customer fragmentation with respect to the number ofcustomers, average order size and geographic distribution. The Issuer believes that being able to fulfilla large number of client orders of specific size and paper quality is a key differentiator of the Group.The location of certain of the Group’s manufacturing facilities in proximity to major consumer markets(such as Mumbai), as well as to sources of raw materials (such as the plantations at the SFI unit and thehardwood fiber farms near certain Indian units) gives the Group a significant advantage in terms ofmanufacturing, sales and distribution logistics and access to its customers. With what the Issuerbelieves is the largest paper distribution network in India, including distributors which workexclusively for the Group, through which the Group distributed approximated 54% of its sales in theyear ended June 30, 2010, it maintains extensive sales, customer service and distribution coverageacross India. This network allows the Group to reach the approximately 15,000 customers served bythe Group, with an order to delivery time of under 30 days.
The Group’s distribution network allows the Group to service both coated and uncoated wood-freepaper customers from the same network and for all order sizes. For example, in the nine months endedMarch 31, 2011, while 81% and 73% of its coated and Hi-bright uncoated paper production was sold toits large and medium/small sized customers, respectively, the top 10 customers accounted for only 14%and 6% of its sales in India, respectively and 88% and 85% of orders for its coated and Hi-brightuncoated wood-free paper, respectively, were for 10 tonnes or less during the period. Average ordersize during this period for coated wood-free and Hi-bright uncoated wood-free paper was 7.3 tonnesand 7.7 tonnes.
In addition, for the nine months ended March 31, 2011, the Group sold over 54% of its products tocustomers through exclusive distributors. The Group plans to increasingly utilize exclusive distributorsfor its sales to customers. The Group’s ability to respond and fulfill small, medium and large ordersthroughout the network reinforces the Group’s ability to charge a premium for its products. This isfurther supported by the Group’s focus on customer interaction at all levels of production, marketing,sales and management. Such interaction enhances the Group’s knowledge of its customer base, therebyenabling it to customize its relationships and products.
Creating a distribution network of similar size and scope would be time-consuming and expensive,which the Issuer believes imposes a significant barrier to entry for foreign companies as well as new
— 102 —

and existing competitors in the Indian market. The Group’s access to its customers has enabled it toserve a wider market, better understand the position of its products in relation to those of itscompetitors and increasingly diversify its product range, receive high quality feedback from itscustomers, increase the market’s awareness of the Group’s brand and provide a higher level ofcustomer service than that provided by its competitors. The Issuer also believes its access to customersand sales of its coated and uncoated paper under the Group’s “BILT” brand has increased the strengthand market awareness of this brand.
The Group also maintains an extensive distribution network in Malaysia, which can be divided to fivemajor zones: Sabah (East Malaysia), Sarawak (East Malaysia), Northern area of West Malaysia,Central area of West Malaysia and Southern area of West Malaysia. The vast majority of paperconsumption in Malaysia occurs in West Malaysia where major commercial activities are located. TheGroup maintains two RSOs in Malaysia, one of which is located in the Central area of West Malaysia(focused on the West Malaysian market) and the other in Sabah (focused on the East Malaysianmarket).
Operational strength
The Group’s facilities produce coated and uncoated wood-free paper of international standard whichthe Issuer believes are comparable to other major international paper companies and generally regardedas above the quality of products produced by its Indian competitors. Additionally, the Group hassought to increase production and improve quality while also increasing efficiency as evidenced by thewinning of the PPI International Award (RISI) for mill efficiency improvements in 2010 for changes atthe Bhigwan unit. One of the means through which the Group increases efficiency is by adopting thevertical integration business model described above.
The Group’s search for improvements in its processes has resulted in significant reductions in water,steam and fiber consumption (decreases of 15%, 9% and 3%, respectively, during the three years endedJune 30, 2010). These reductions are coupled with an increase in the overall productivity of theGroup’s production operations from 66 Mt per employee in the year ended June 30, 2008 to 81 Mt peremployee in the year ended June 30, 2010.
The Group intends to pursue further operational improvements through its sustainability programs. Forexample, the new hardwood pulp production facility at the SFI unit will be using primarily bio-fuelwhile reducing reliance on oil-fuel. Further, the Group’s farm forestry plantations in India, whilesupported and operated by BTTL and not controlled by the Group, are cost effective and sustainableoptions of wood sourcing.
The Ballarpur, Bhigwan and SFI units are FSC-COC certified and the Kamalapuram unit is in advancedstages of this certification. The Group has been upgrading its facilities from an environmentalperspective. After the completion of the expansions of the Ballarpur unit and the SFI unit, the Issuerbelieves that both of these units are expected to produce ECF pulp (thereby using much less chlorine inthe bleaching process and reducing dioxins from mill effluents and with it reducing the threat to watercourses and to the ozone layer).
— 103 —
The Group is focused on strengthening all aspects of paper production, from captive and sustainableforestry operations, to hardwood pulp and paper production, through to distribution and marketing. Asa result of its market leading position, the Group’s size and scale results in significant purchasingpower and a strong negotiating position with respect to both sales and, in particular, purchases of pulpand other raw materials. This strength played a significant role in the manner in which the separationof the Group and the Ballarpur Group was executed in 2008 as both parties (as well as the privateequity investors) recognized that the ability to leverage the Group’s strength into increased purchasingpower would be an operational asset.
Stable balance sheet and cash flows together with a proven financial track record
The Group observes conservative financial policies and maintains stable cash balances in order to beable to complete projects on a timely basis, capitalize on opportunities and carry out capital investmentprograms through industry cycles. The Group has historically generated steady cash flows and hastraditionally maintained a stable balance sheet. The Group believes that its integrated operations alongwith the purchasing power resulting from the Group’s size and scale allow it to mitigate the impact ofdeclines in commodity prices and to access capital at attractive terms.
The Group’s net debt to EBITDA ratio was 4.67 for the 12 months ended March 31, 2011 compared to3.70 for the year ended June 30, 2010. The Group believes that the net debt to EBITDA ratio hasimproved since March 31, 2011 mainly due to the conversion of CCDs into equity in June 2011,reducing net debt by approximately US$81 million. Net debt includes all of the Group’s secured andunsecured debt and represents total borrowings less cash and cash equivalents and less restricteddeposits as of the end of the applicable time period. In addition, the Group had cash and cashequivalents (excluding bank overdraft) of US$21.0 million as at March 31, 2011 and US$29.1 millionas of the year ended June 30, 2010. Further, strong revenue growth and controlled operating expenseshave resulted in strong sustained cash flow (US$68.0 million in the nine months ended March 31, 2011and US$88.6 million in the year ended June 30, 2010 from operating activities). In addition, the Groupintends to use the proceeds of the offer to retire some of its capital instruments held by BIH, toincrease capital expenditure and generally to reduce debt.
The ability to charge a premium for its products above that which is charged by other producers alongwith operational strength and efficiencies have helped drive strong EBITDA margins of 18% during thenine months ended March 31, 2011 and 22% in the year ended June 30, 2010. The Group has been ableto maintain profitability despite significantly expanding its production capacity. In order to continue tomaintain stable EBITDA margins going forward, the Group will seek to become fully integrated withrespect to its hardwood pulp production by the year ended June 30, 2013 (with hardwood pulpconstituting approximately 85% of the Group’s pulp requirements during the year endingJune 30, 2013).
Experienced management team
The Group has an experienced management team, and several members of the Board and seniormanagement team have decades of experience in the pulp and paper industry. Other members of theBoard and senior management team have significant experience in other areas, such as chemical andbusiness management. The Issuer’s executive management team is supported by strong in-housetechnical capabilities, provided by a highly experienced team of experts. The Group also has a proventrack record of attracting and retaining talent throughout the organization.
— 104 —
Strategy
The Issuer’s business strategy is focused on four major areas:
Š grow market leadership;
Š increase vertical integration to improve profitability;
Š cost management to maintain best in class profitability; and
Š produce world class products which enjoy premium pricing.
Grow market leadership
The Group remains focused on taking advantage of the anticipated market growth in the coated anduncoated wood-free paper markets and has increased its paper production capacity from 403,710 tpa atJune 30, 2008 to 758,710 tpa at March 31, 2011. The Group intends to leverage its current leadingmarket positions and increase paper production capacity further from 758,710 tpa at March 31, 2011 to1,443,710 tpa in the year ending June 30, 2014 in order to take advantage of the expected increaseddemand for coated and uncoated paper products that it anticipates will result from India’s projectedsignificant economic growth from 2010 through 2020 (Source: Pöyry).
As the Group expands its production capacity and seeks to increase sales to its customers, it must alsoensure that its extensive distribution networks throughout India and Malaysia continue to be able todistribute the additional volume that is anticipated. The Group intends to grow its market share in itscore markets and maintain its position as the leading supplier for customers demanding coated anduncoated wood-free paper products, in part through enhancing its IT capabilities and other customerservice oriented systems in order to ensure a positive and consistent customer experience. The Issuerbelieves that this distribution system and customer service capability will help drive the Group’smarket share in certain regions where domestic regional competition has been relatively strong.
Further, as the Indian economy and the Group expands, it will seek to grow further in the coated anduncoated wood-free paper markets while also selectively filling gaps it sees in the market by bringing anew range of products to its customers. The Group is considering the selective expansion into targetedmarket segments and is currently preparing to broaden its product portfolio to the virgin gradepackaging board with FBB and SBS products. These new offerings will be facilitated by a new papermachine at the Bhigwan unit, which is expected to commence production in 2014. The Issuer may offerthese new products along with others going forward as the Indian market continues to develop,providing opportunities to capture synergies with existing paper operations and amplify cross-sellingopportunities.
Increasing vertical integration
In order to support the anticipated increase in paper production from 758,710 tpa at March 31, 2011 to1,443,710 tpa in the year ending June 30, 2014, the Group intends to increase its hardwood pulp
— 105 —

production capacity to 540,000 tpa (excluding production capacity at the Kamalapuram unit which iscurrently and has historically produced rayon grade pulp) by the end of 2012.
Following completion of the hardwood pulp production expansion projects at SFI and Ballarpur, theGroup expects to be fully integrated in the production of hardwood pulp by the year endingJune 30, 2013. Although the Group has significantly improved its cost profiles, the Group expects thisvertical integration to enable it to further reduce its costs related to purchases of pulp as the Group willbe able to supply all of its own hardwood pulp requirements from internally produced hardwood pulp.Additionally, the Group will continue to leverage its size and scale in order to maximize its purchasingpower with respect to other raw materials. The Issuer believes that these actions, along with the benefitreceived by the Group as a result of its secure wood fiber sources at the SFI unit (which itself isfurthered by the Group’s sustainable forestry and wood management programs), will result in theGroup having among the lowest cost structure in the Indian market and provide the opportunity tocontinue to focus on profitable growth.
Cost Management
Additionally, the Group seeks to manage its costs to maintain its strong profitability as compared to itscompetitors in India and Malaysia. The Issuer believes that the use of capital, both for the existingcapacity as well as for the increased capacity that is being developed, has been efficiently employed byuse of effective planning, flexibility and efficient utilization of the units. The Group has recentlyexpanded several of its paper machines (“PM”). The expansion of the Group’s PM-2 at the Bhigwanunit and PM-7 at the Ballarpur unit in March 2009 and December 2009 has increased the Group’s paperproduction capacity of coated and uncoated wood-free paper by 88%. The new machines are of a highquality and perform at international standards. Although the Issuer believes the cost per tonne of paperwill be higher during the ramp-up phase, the Issuer believes that the scale of expansion and theimproved technology now employed by the Group will result in a significant decrease in costs pertonne of paper over time.
According to Pöyry for the three months ended September 30, 2010, the Group’s coated woodfreemachines at the Bhigwan unit (PM-1 and PM-2) maintained among the lowest total production andtransportation costs to Mumbai (including duties) in India. Through its increased integration withrespect to hardwood pulp production, its exploitation of economies of scale and its efficienciesprogram at each of its units, the Group intends to continue to maintain its low cost operations.
Produce world class products which enjoy premium pricing
Historically, the Group has sought to achieve premium pricing through the quality of its products andits ability to meet client requirements through constant benchmarking of its competitors. It also seeksto achieve premium pricing by targeting small and medium sized accounts, and orders which will allowfor utilization of its paper machines. Additionally, the Group offers a high level of customer service,after sales service and cross selling opportunities along with a long running and consistent pricingstrategy with limited discounts. Despite its extensive use of distributors for sales, the Group is able tomaintain premium pricing because of its quality, diversity of products and strong brand name, with
— 106 —

distributors ultimately passing these prices onto end customers. The Group intends to maintain thepursuit of premium pricing and to build upon and advance its leading position in the markets it serves.
Products
The Group’s products consist of a broad range of high-end coated and uncoated wood-free paperproducts and rayon grade pulp. In addition, the Malaysian operations sell a small quantity of timber.
The Paper Products
The Group offers the full range of high-end coated and uncoated wood-free paper products to a widecustomer base. As discussed further in “The Industry and Market Overview”, the paper industry isbroadly classified into three segments: paper and paper board, newsprint and tissue. Writing andprinting paper is a subsegment of paper and paper board, with coated and uncoated wood-free paperfalling under the writing and printing paper segment.
The Issuer believes that the Group’s ability to offer both high quality uncoated and coated wood-freepaper enables it to cross-sell to its customers in a manner which its domestic competitors cannot. TheIssuer also believes that none of the Group’s domestic Indian competitors offer the breadth of theGroup’s products, particularly in higher quality wood-free paper.
The Group’s production of coated and uncoated paper and total production capacity in tonnes for eachof the last three years ended June 30, 2010 and the nine months ended March 31, 2011, is set forth inthe table below:
For the years ended June 30(*)For the nine monthsended March 31
2008 2009 2010 2011
Production Capacity Production Capacity Production Capacity Production Capacity(**)(tonnes per year)
Coatedwood-free . . . . 125,900(***) 125,000 147,754 180,417 248,983 315,000 214,148 315,000
Uncoated wood-free . . . . . . . . . 267,876 278,710 249,443 278,710 323,916 374,960 274,471 443,710
Total . . . . . . . . . . 393,776 403,710 397,187 459,127 572,899 689,960 488,619 758,710
(*) The capacities given for the years ended June 30, 2008, 2009 and 2010 are weighted average capacities for those years.
(**) Capacity given is for the full year.
(***) The table above shows that production of coated wood-free paper in 2008 exceeded capacity, which can occur when thespeed of the machine is increased or product mix is changed, for example with respect to the gsm of the product produced.The production amount exceeded the capacity amount only in the case of PM-1 at the Bhigwan unit. This unit has beenconsistently outperforming and producing more than its capacity.
The Group primarily serves its domestic markets. The Group’s total export sales out of India andMalaysia amounted to approximately 21% of sales (in volume) in the nine months ended
— 107 —

March 31, 2011 (approximately 25% of its uncoated wood-free paper sales and 17% of its coatedwood-free paper sales for that period). In total, the Group has exported to 70 countries outside of Indiaand Malaysia. Exports are used to strategically balance demand and supply in domestic markets, whichwill continue to be important going forward as intended increases in the Group’s production capacity,if utilized in full, for sale in India, have the potential to impact the near term demand and supplydynamics in the market.
Historically, while the Group has been able to maintain relatively stable prices for its primary productsand has largely passed any material increases in price onto its distributors, prices for the productswithin the Group’s primary Indian markets have generally declined.
Coated wood-free paper
Coated wood-free paper is produced largely in the same manner as uncoated wood-free papers, but thefinal production step for coated wood-free paper occurs when the paper is coated by “blade”technology (as used by the Group and most technologically advanced companies) or by older “Airknife” technology on one side of the paper with pigment, before being cut to the specifications of thecustomer. Coated paper is used in a variety of printing and publication end uses such as catalogs, directmail, magazines, inserts, commercial printing and promotional material. Coated wood-free paper ismade from pulp.
The one-sided coated wood-free segment (with coating on only one side of the paper) in India wastraditionally catered for by air-knife coated paper (used for dry labels for example), which representsan older technology for producing coated paper. In order to further diversify its market opportunity andtake advantage of increased capacity, in 2009 the Group sought to create a new market segment inone-sided blade coated paper and boards (used for book covers for example) to redefine this marketspace, which has resulted in reduced market share for most air-knife coated paper technology basedcapacities.
The Issuer believes this premium product offering affords the Group an advantage over its Indiancompetitors as it is the only major producer of coated paper in India that utilizes modern blade coatingtechnology. This technology also provides the opportunity to continue to compete in the internationalpaper market and produce products on par with those produced by the international paper companies.The Group largely focuses on the domestic coated wood-free market and, for the year endedJune 30, 2010, the Group exported approximately 20% in volume of its coated wood-free paper.
The Group is a market leader in the Indian coated wood-free paper market, producing 248,983 tonnesin the year ended June 30, 2010. According to Pöyry, the Group held a 51% share of the Indian bladecoated paper market in the year ended December 31, 2009 (as compared to a market share of 11% forits closest competitor for the period). The Group’s increased market share is the result of the enhancedcapacity of coated paper production at the Bhigwan unit which came on stream in March 2009, withthis enhancement adding 190,000 tonnes to the total Group capacity of coated paper production. TheGroup’s production capacity of coated wood-free paper, as of March 31, 2011, was 315,000 tpa, ascompared to 125,000 tpa as of June 30, 2008. All of the Group’s coated wood-free paper is produced atthe Bhigwan unit.
— 108 —

Uncoated wood-free paper
Uncoated wood-free paper is used primarily in the commercial printing and publishing segment,including brochures, pamphlets and educational materials and has a broader customer base than coatedwood-free paper. Copier paper and business stationery also falls in uncoated wood-free paper segmentbut the Group does not produce such products, aside from a small amount of copier paper produced atthe SFI unit (8% of the SFI unit’s total production in the year end June 30, 2010). Uncoated wood-freepaper is made from pulp.
India
The market for uncoated wood-free paper in India is highly fragmented, with a multitude of productsand manufacturers. In India the uncoated market can broadly be divided into two tiers: the firstprovides a higher-end product (for example, Hi-bright paper which is generally brighter as a result ofadditional bleaching and other processes which remove impurities from the product), and another thatprovides a standard end product to value-for-money customers (for example, low bright paper). TheGroup has focused almost entirely on the higher-end product, specifically upon the Hi-bright papersegment of the uncoated market (which includes, for example, commercial paper, books, catalogs,brochures), and the Group retains the largest market share in this market. The Group held a 24% shareof the Hi-bright market in India for the year ended December 31, 2009. Ballarpur was the next largestproducer with approximately 13% of the total production for uncoated Hi-bright wood-free paper in theyear ended December 31, 2009. Total sales in India for the year ended December 31, 2009 forHi-Bright uncoated wood-free paper was 549,000 tonnes, according to Pöyry.
With the commissioning of the new paper machine at the Ballarpur unit at the end of 2009, the Groupmore than doubled its capacity in uncoated wood-free paper in India that it had built over the previousfive decades, from 134,500 tpa at June 30, 2008 to 299,500 tpa at March 31, 2011. The Group hastaken deliberate steps to penetrate the market with this new capacity, primarily through the highquality of its products, in order to avoid a dilution of the Group’s premium pricing advantage. Therehas been an increase in the distributor network and a clear focus exists on selling products into areasoutside of the major metropolitan centers in India. The Issuer believes that in the highly commoditiseduncoated wood-free market, price competition is the key challenge. To counter this, the Group relies onits manufacturing technology and logistical and distribution capabilities whilst keeping its costsaligned with the lower end of the costs in the Indian paper industry. These capabilities enable theGroup to service its small and medium-sized customers, which are often difficult for its domestic andinternational competitors to access, along with its larger customers. The Group largely focuses on thedomestic uncoated market and, for the nine months ended March 31, 2011, the Group exportedapproximately 21% in volume of its uncoated wood-free paper from the Ballarpur unit.
The Group plans to enhance its production capacity for uncoated wood free paper at its Ballarpur unitby 250,000 tpa by June 2014 and to commence commercial production beginning in July 2014. Thetotal capital expenditure required for this project is estimated to be US$167 million. The Groupbelieves this expansion will help it maintain its market share in the uncoated Hi-bright uncoated wood-free segment in which it held a 24% market share in the year ended December 31, 2009.
— 109 —
Malaysia
Through its SFI unit, the Group is Malaysia’s largest domestic large scale producer of writing andprinting paper and the dominant market player in the Malaysia’s uncoated wood-free paper segment.For the year ended June 30, 2010, the SFI unit produced 150,127 tonnes (and 99,936 tonnes in the ninemonths ended March 31, 2011), amounting to nearly all of the total production in Malaysia during thisperiod. Approximately 30% of the 150,127 tonnes was exported from Malaysia, and the remaining 70%was used to service the domestic market. With a total uncoated market in Malaysia of around382,000 tonnes in 2009, the amount provided by the SFI unit to the Malaysian domestic marketconstituted approximately 28% of Malaysian market share. The Group also held a 22% and 73% shareof the domestic surface sized and non-surface sized uncoated wood-free markets, respectively, in 2009,according to Pöyry. These sub-segments in Malaysia totalled 233,000 tonnes and 61,000 tonnes,respectively, during this period. The Group’s competitors in the Malaysian market are offshore entities,mainly from China, Indonesia and Thailand.
The Group’s production capacity of uncoated wood-free paper as of March 31, 2011 was 144,210,which is unchanged from the capacity at June 30, 2008.
The Group plans to enhance its uncoated wood free capacity in Malaysia by 60,000 tpa throughefficiency improvements to its existing machines, at an estimated capital expenditure cost ofUS$22 million to be incurred in year ended June 30, 2014 and to commence commercial productionbeginning in July 2014. The Group believes this enhancement will help to strengethen its market sharein the different segments of the uncoated wood free paper market in Malaysia.
Virgin grade packaging board
As a result of the installation of the new paper board machine at the Bhigwan unit expected to becommissioned in June 2014 and to commence production later that calendar year, the Group expects tobegin production of folding box board and solid bleached sulphite board), both of which are packagingboard products.
Folding box board is a paperboard grade which is made up of multiple layers of pulp, with low density,high stiffness and often a slightly yellow color. The top layer of folding box board is a bleachedchemical pulp with pigment coating. The primary end use of folding box board is in relation topackaging for health and beauty products, frozen, chilled and other foods, confectionaries,pharmaceuticals and cigarettes.
Solid bleached sulphite board is made from bleached pulp and usually has a mineral or syntheticpigment, coated top surface in one or more layers and a coated reverse side. Solid bleached sulphiteboard is a medium density board with good printing properties for graphical and packaging end usesand is white on both sides. It can easily be cut, creased, hot foil stamped and embossed. Its otherproperties, such as being hygienic and pure with no smell and taste, make it usable for packagingaroma and flavor sensitive products such as chocolate, cigarettes and cosmetics.
— 110 —

Rayon grade pulp
Rayon industries produce viscous fiber which requires pulp of a significantly higher quality than papergrade pulp. The production process behind rayon grade pulp is therefore inherently more complex thanfor paper grade pulp, resulting in a more valuable final product. The pre-hydrolysis process, prior tothe pulping of the wood chips, is one of the ways of achieving the desired high quality pulp. Standardpulp contains certain carbohydrates which interfere with the chemical conversion of cellulose intorayon products. Consequently, the practice of exposing the wood chips to acid hydrolysis prior toalkaline pulping was developed in order to reduce the relevant carbohydrate content and facilitate theconversion of cellulose.
This pre-hydrolysis process is usually carried out by direct steaming, whereby high temperature steamreleases organic acids from the wood and other material in the wood is hydrolyzed into soluble sugars.The subsequent pulping stage produces a product suitable for rayon industries.
The Group produces rayon grade pulp at its Kamalapuram unit. As a result of export restrictions inIndia and the relatively few Indian purchasers of rayon grade pulp, the Group has historically soldalmost all of its production to a single purchaser in India. For the year ended June 30, 2010 and thenine months ended March 31, 2011, the Kamalapuram unit produced 85,345 tonnes and 64,789 tonnes,respectively. The Group maintained a market share of 24% in 2010 and was the largest domesticproducer and seller of market rayon grade pulp, according to Pöyry. The total size of the market duringthis period was 403,300 tonnes. Production in 2010 represented a significant increase from theproduction for the year ended June 30, 2009 of 40,523 tonnes (of which 14,095 tonnes was paper gradepulp). This lower production was the result of a six month production shut down due to decreaseddemand during the global economic downturn. If required, the Kamalapuram unit is capable ofswitching to producing paper grade hardwood pulp instead of rayon grade pulp.
For further information, see “— Raw Materials, Inputs and Suppliers — Pulp and Fiber”.
— 111 —

Facilities
The Group’s consolidated paper, hardwood pulp and rayon grade pulp manufacturing operations spanacross four production units located at Ballarpur, Bhigwan, Kamalapuram (all in India) and Sabah(located in Malaysia). The Kamalapuram unit only manufactures rayon grade pulp (but can producepaper grade pulp if required at no additional cost of transition). The Group’s operations also include 4RSOs and 14 depots, while working with 141 distributors. The distributors are located throughoutIndia, with concentrations in regions with high levels of economic growth. Each distributor, in turn,has an extensive network of local dealers. This distribution network has enabled the Group to maintaina leading position in terms of marketing and distributing its products. The Issuer believes that thelocation of the manufacturing facilities, depots, RSOs and distributors, as indicated on the followingdiagram, provides the Group with a freight cost advantage and better market reach relative tocompetitors.
The table below shows the paper production and production capacity at the Ballarpur, Bhigwan and SFIunits in terms of tpa produced, for the years ended June 30, 2008, 2009 and 2010 and for the ninemonths ended March 31, 2011.
For the years ended June 30For the nine monthsended March 31
2008 2009 2010 2011
Production(**) Capacity Production Capacity Production Capacity Production Capacity(*)(tonnes per year)
Ballarpur . . . . . . . 128,682 134,500 125,073 134,500 173,789 230,750 174,534 299,500Bhigwan . . . . . . . 125,900 125,000 147,754 180,417 248,983 315,000 214,149 315,000SFI . . . . . . . . . . . . 139,194 144,210 124,360 144,210 150,127 144,210 99,936 144,210Total . . . . . . . . . . 393,776 403,710 397,187 459,127 572,899 689,960 488,619 758,710
(*) Capacity given is for the full year
(**) The table above shows that production of coated wood-free paper in 2008 exceeded capacity, which can occur when thespeed of the machine is increased or product mix is changed, for example with respect to the gsm of the product produced.The production amount exceeded the capacity amount only in the case of PM-1 at the Bhigwan unit. This unit has beenconsistently outperforming and producing more than its capacity.
Since 2007, the Group has carried out extensive expansion and modernization programs at its Bhigwan,Ballarpur and SFI units, increasing total paper production capacity from 403,710 tpa at June 30, 2008
— 112 —

to 758,710 at March 31, 2011. Included in these programs was the addition of PM-2 to the Bhigwanunit, which added 165,000 tpa in capacity in 2009 in addition to an increase of 25,000 tpa in capacityto PM-1 as a result of changes to the product mix facilitated by the installation of PM-2. The paperproduction expansion project at the Ballarpur unit included the installation of PM-7, which added165,000 tpa in capacity in 2009-10.
PM-7 at the Ballapur unit is modern and has greater capacity than the uncoated wood-free papermachines generally in India. Similarly, the PM-1 and PM-2 at the Bhigwan unit are newer and havegreater coated wood-free production than other machines in India.
The Group’s hardwood pulp production facilities (excluding the rayon grade pulp production facility atthe Kamalapuram unit) are located at the Ballarpur and the SFI units. The Group’s production ofhardwood pulp at these facilities is intended to satisfy 100% of the hardwood pulp requirements (and80% of the Group’s total pulp requirements, including softwood pulp), within the Group with respectto paper production by June 30, 2013. For the nine months ended March 31, 2011, the Group produced56% of its required hardwood pulp.
The table below shows the hardwood pulp production and total production capacity at the Ballarpurand SFI units for the years ended June 30, 2008, 2009 and 2010 and for the nine months endedMarch 31, 2011.
For the years ended June 30For the nine monthsended March 31,
2008 2009 2010 2011
Production Capacity Production Capacity Production Capacity Production Capacity(*)(tonnes per year)
SFI . . . . . . . . . . . . . . 105,475 120,000 101,509 120,000 113,571 120,000 68,306 120,000Ballarpur . . . . . . . . . 117,339 130,000 118,282 130,000 116,831 130,000 85,400 130,000Total . . . . . . . . . . . . 222,814 250,000 219,791 250,000 230,402 250,000 153,706 250,000
(*) Capacity given is for the full year
Ballarpur
The Ballarpur unit is one of the Group’s most important manufacturing facilities with seven paperproduction machines (PM-1 through PM-7), the last of which was installed in 2009, and a totalinstalled capacity of 299,500 tpa at March 31, 2011. It maintains significant vertical integration with aproduction facility strategically located in the state of Maharashtra, in Western India, on a 171-hectaresite with ready access to raw materials and a reliable water supply. The Ballarpur unit produces a broadrange of Hi-bright uncoated wood-free paper products from 50gsm to 130gsm (accounting for 99% ofits total production in the year ended June 30, 2010).
During the years ended June 30, 2010 and 2009, the Ballarpur unit produced 173,789 tonnes and125,073 tonnes of paper, respectively (production for nine months ended March 31, 2011 was174,534 tonnes). This substantial increase is largely due to the installation in 2009 of a new paper
— 113 —

machine, PM-7, which was purchased from Allimand, France and constructed at the unit, and whichbegan commercial production on December 1, 2009. PM-7 has a total production capacity of165,000 tpa (total production for the year ended June 30, 2010 was 56,155 tonnes and 90,013 tonnesfor the nine months ended March 31, 2011). Along with some minor additional technical innovations,further upgrades are to be carried out on the PM-7 to increase its capacity by a further 40,000 tpa bySeptember 2012, a process that is expected to cost approximately US$27.5 million (withUS$15.4 million employed in the year ended June 30, 2012 and US$12.1 million employed in the yearended June 30, 2013). The PM-7 machine produces paper of comparable quality to that which isproduced by international paper companies, putting it at the top of the market in India and capable ofsale in the international market. In addition, the Group has continuously modernized PM-1-PM-6 inorder to keep them up to date and to maintain its environmental standards. This effort has yieldedproduction during this period of 84,521 tpa at March 31, 2011 of products from PM-1 through PM-6with international quality. PM-1 through PM-6 achieved utilization levels of approximately 84% forthe nine months ended March 31, 2011.
With respect to hardwood pulp production, the Ballarpur unit had a production capacity of 130,000 tpaat March 31, 2011. The unit has historically been able to meet its hardwood pulp requirements throughits own production. Pursuant to an expansion program at the unit, net hardwood pulp productioncapacity is intended to be expanded to 300,000 tpa, with production anticipated to commence in March2012. Of this capacity, 300,000 tpa will be new capacity provided by the new hardwood pulp facility,while the existing facility with capacity of 130,000 tpa will be retired. This increased net productioncapacity of 170,000 tpa, along with the additional capacity discussed below at the SFI unit, is intendedto satisfy the increased paper production capacity expected at the Ballarpur unit and the Bhigwan unit.Following this hardwood pulp capacity expansion, the Ballarpur unit is expected to produce ECF pulp(thereby using much less chlorine in the bleaching process and reducing dioxins from mill effluentsand with it reducing the threat to water courses and to the ozone layer). Total capital expenditure forthis new facility is expected to be US$130 million (with US$36 million employed in the year endedJune 30, 2011, US$94 million employed in the year ended June 30, 2012).
The Group currently benefits from a contract dated March 11, 2004 between the government ofMaharashtra and Ballarpur, in which the government of Maharashtra has agreed to sell bamboo fromthe government forests for the production of pulp, paper, paper board and other pulp products. TheBallarpur unit, which was part of Ballarpur when the contract was entered and which was latertransferred to the Group, is required to deposit a security amount and pay the sale price in eight equalinstallments during each year. Although the Group is not a party to the agreement, Ballarpur unitcontinues to extract bamboo and the Group pays royalties based on the amount it harvests in any year.The contract is currently set to expire on September 30, 2014. This contract is currently the subject oflitigation between the Ballarpur unit and the government of Maharashtra. For additional informationconcerning this litigation, see “— Material Litigation”.
In addition, the Ballarpur unit contains on-site electricity generation via a facility which is majority-owned by Avantha Power (in which the Group also maintains a 26% equity interest which, along with astake in Bhigwan unit’s onsite plant, results in a 4.22% stake in Avantha Power) which provides all ofthe unit’s power requirements and has a total capacity of 67.5 megawats (“MW”). This capacity resultsfrom two facilities with 27.5 MW and 40 MW capacities, respectively. The larger facility was installedin 2009. These facilities provide the Group with a consistent supply of energy at a lower cost than if it
— 114 —
were required to use power from the general Indian power grid. Historically, Avantha Power hasincreased capacity at the facilities in order to keep pace with the increased energy requirements of theexpanded facilities, and the Issuer believes that Avantha Power will continue this practice for futureexpansions. The Group has historically and will in the future, in turn, contribute sufficient capital tomaintain its 26% equity stake in the respective onsite power plants.
The Group focuses on resource conservation throughout the production process, and energyconsumption at the Ballarpur unit was reduced from 1,146 kWh/t in the year ended June 30, 2009 to1,098 kWh/t in the year ended June 30, 2010, despite increased production and capacity. This waslargely due to decreased steam consumption resulting from the installation of a thermo compressor.While the Ballarpur unit has sufficient capacity to meet its energy requirements, at times the Groupmay purchase power from the grid because of maintenance of the Ballarpur unit’s electricity generationfacilities. In the nine months ended March 31, 2011, the Ballarpur unit purchased only 5.35% of itspower needs through the Indian power grid. Additionally, the Ballarpur unit has an on-site chemicalcomplex which produces almost all of its caustic soda, chlorine, chlorine dioxide and sulphur dioxiderequirements and also has onsite facilities to manufacture precipitated calcium carbonate and groundcalcium carbonate (see “— Material Contracts”). The Group has also been continuously seeking toimprove its processes to reduce water consumption. The water consumption at the Ballarpur unit hasbeen reduced from 115 cubic meters per tonne (“m3/tonne”) in 2008 to 76 m3/tonne in 2010 under theGroup’s efficiency program.
The Group plans to enhance its production capacity for uncoated wood free paper at its Ballarpur unitby 250,000 tpa by June 2014 and to commence commercial production beginning in July 2014. Thetotal capital expenditure required for this project is estimated to be US$167 million. The Groupbelieves this expansion will help it maintain its market share in the Hi-bright uncoated wood-freesegment in which it held a 24% market share in the year ended December 31, 2009.
As of March 31, 2011, there were 3,319 employees at the Ballarpur unit, including 232 managementemployees, 1,218 non-management employees and additional casual and contract laborers. Employeesat the production facilities usually work shifts of 8 hours, with 3 shifts existing in a 24 hour period.
The Ballarpur unit has received various certifications, including the:
Š FSC COC and CW Certificate from the Forest Stewardship Council A.C. (valid throughAugust 20, 2014);
Š Quality Management System Standard ISO 9001: 2000 (valid until July 27, 2011);
Š Environmental Management System Standard 14001: 2004 (valid until January 29, 2012); and
Š Occupational Health and Safety Management System Standard OHSAS: 2007 (valid untilAugust 23, 2013).
— 115 —
Bhigwan
The Bhigwan unit is located in Bhadalwadi village in the state of Maharashtra in Western India andwas acquired as part of the purchase of Sinar Mas India in 2001. The unit contains two paper machines,PM-1 and PM-2. With an installed capacity of 315,000 tpa at March 31, 2011, the Bhigwan unitproduced 248,983 tonnes for the year ended June 30, 2010 (214,149 tonnes for the nine months endedMarch 31, 2011). PM-1 underwent a product mix change in 2009 after the installation ofPM-2 whereby all paper with a lower gsm was shifted to PM-2 and all paper with a higher gsm wasproduced on PM-1. This change resulted in a capacity increase of 25,000 tpa of PM-1, the result ofwhich is an installed production capacity of 150,000 tpa, as at March 31, 2011 (from 125,000 tpa atJune 30, 2008). The PM-1 produced 133,234 tonnes during the year ended June 30, 2010.
On March 22, 2007, PM-2 was purchased from Voith Paper GmbH & Co. KG of Germany, one of theleading coated paper machine manufacturing companies in the world. This machine was installed in2009 (with commercial production commencing in March of that year). This machine has a productioncapacity of 165,000 tpa and can produce coated paper ranging from 70 gsm to 130 gsm. PM-2 hason-machine blade coating capabilities where coating is applied at the end of the paper machine withoutthe need to transfer the product to a separate coating machine. The ramp-up of production has been inline with project plan and for the nine months ended March 31, 2011, the new machine produced105,512 tonnes of coated paper. The Bhigwan unit’s PM-2 won the Pulp & Paper International Award(RISI) for mill efficiency improvements in 2010.
Further de-bottlenecking will increase paper production capacity of the Bhigwan unit by 35,000 tpa bySeptember 2012. These additions will increase Bhigwan’s capacity to 350,000 tpa. Total capitalexpenditure for this program is expected to be US$27.5 million (with US$15.4 million employedduring the year ended June 30, 2012 and US$12.1 million employed during the year endedJune 30, 2013). In addition to this coated paper production capacity, the Group intends to install apaper board machine with a capacity of 300,000 tpa. Commissioning is currently anticipated to occurin June 2014 with commercial production commencing shortly thereafter. Total capital expenditure forthis project is expected to be US$322 million (with US$278 million employed during the year endedJune 30, 2014 and US$44 million employed during the year ended June 30, 2015). The Group expectsto finance this project through operating cashflow and net proceeds of this Offering. For furtherinformation, see “Use of Proceeds”.
The Bhigwan unit does not contain a pulp production facility and therefore relies on market purchasesand production from the Group’s other units.
The Bhigwan unit is located in Western India. Mumbai is also located in this region, providing theBhigwan unit with a large metropolitan market for coated paper products. The location enables theBhigwan unit to easily access major highways, railway junctions, an airport and the Mumbai/NhavaSheva seaport to distribute products and receive shipments of raw materials and other inputs, bothdomestically and internationally. This is particularly valuable to the Group as the Bhigwan unitexported approximately 20% of its product for the year ended June 30, 2010.
— 116 —

The Bhigwan unit contains on-site electricity generation via a facility owned by Avantha Power (inwhich the Group also maintains a 26% equity interest which, along with a stake in the Ballarpur onsiteplant, results in a 4.22% stake in the Avantha Power Group), which provides the full powerrequirements for the unit with a capacity of 60 MW. This facility provides the Group with a consistentsupply of energy under a long term contract at a lower cost than if it were required to use power fromthe general Indian power grid. Historically, Avantha Power has increased power generation capacity inparallel with growing paper/pulp operations and the Issuer believes that Avantha Power will continuethis practice.
Resource conservation is a key focus area for the Bhigwan unit. Innovative process changes andoptimization of wet-end chemicals and coating formulation has helped to reduce usage of chemicalsand fiber consumption. Further, the Group intends to reduce the power consumption at the unit througha number of energy conservation measures. Water consumption in the mill has been reduced from21.07 m3/tonne of paper for the year ended June 30, 2009 to 16.65 m3/t of paper for the year endedJune 30, 2010 and 12.75 m3/t in the nine months ended March 31, 2011, as a result of the fact thataddition of PM-2 lowered the average consumption rate.
As of March 31, 2011, there were 1,417 employees at the Bhigwan unit, including 142 managementemployees, 603 non-management employees and additional casual and contract laborers. Employees atthe production facilities usually work shifts of 8 hours, with 3 shifts existing in a 24 hour period.
The Bhigwan unit has received various certifications, including the:
Š FSC-COC & CW Certificate from the Forest Stewardship Council A.C. (valid throughJuly 26, 2014);
Š Quality Management System Standards ISO 9001 (2008) (valid until June 30, 2012);
Š Environmental Management System Standard ISO 14001 (2004) (valid until January 7, 2014);and
Š Occupational Health & Safety Management System OHSAS 18001 (2004) (valid untilMarch 15, 2012).
Sabah Forest Industries
The SFI unit is the largest paper mill in Malaysia and the unit focuses on the Malaysian market and itsneighboring countries. The SFI unit has a 29 year history in Malaysia and, following the acquisition bythe Group in 2007, had its highest total annual paper production with 150,127 tonnes for the yearended June 30, 2010 (as compared to 139,194 tonnes and 124,360 tonnes for the years endedJune 30, 2008 and 2009, respectively). The process of fully integrating SFI’s operations with the restof the Group was completed in March 2009 and the Group has continued to streamline SFI’s operationsand productivity.
— 117 —

The SFI unit has a total paper production capacity of 144,210 tpa at March 31, 2011, with PM-1 andPM-2 each having capacities of 72,105 tpa. Paper production during the year ended June 30, 2010 was150,127 tonnes (99,936 tonnes for the nine months ended March 31, 2011). Production levels in theyear ended June 30, 2010 represented a significant increase on production from the two previous years,particularly with respect to 2009 production figures which were lower as a result of decreased demandresulting from the economic downturn and periodic maintenance. Production for 2010 exceededproduction capacity largely due to a change to higher gsm of the produced paper.
The Group primarily produces surface sized and non-surface sized uncoated wood-free paper at the SFIunit (43% and 49% of total production, respectively, for the year ended June 30, 2010). The unit alsoproduces copier paper for regional distribution (with production of 12,338 tonnes for the year endedJune 30, 2010). Copier paper is a lower value product, best suited for desktop printing and copying.
With respect to hardwood pulp production, the SFI unit has a production capacity of 120,000 tpa atMarch 31, 2011. The unit’s hardwood pulp production capacity meets 100% of its current hardwoodpulp requirements.
The Group has also launched expansion projects at the SFI unit which are expected to increase thehardwood pulp production by an expected capacity of 120,000 tonnes, with such increase to supply theGroup’s Indian operations. In October 2010, a new wood handling plant was commissioned. For thisexpansion, all major machinery has been procured and commissioning of this machinery is currentlytaking place. The new plant is in the final stages of implementation and is expected to becommissioned in September 2011. In connection to pulp mill expansion will also be a new bio fuelfacility which will use wood chips and bark. A temporary shut-down of certain operations is intendedto occur in the second half of 2011 in order to complete the expansion project, after which productionwill commence and full production is expected in 2012. Total capital expenditure for this program isexpected to be US$200 million (with US$45 million employed until the year ended June 30, 2010,US$120 million employed during the year ended June 30, 2011 and US$35 million employed duringthe year ended June 30, 2012).
The Issuer believes that, in addition to catering to the Group’s pulp demands in India, this expansionwill extend the life and operation of the mill and improve the quality of the paper produced.
The SFI unit contains an on-site electricity generation facility which is owned by the Group and whichprovides all of the unit’s power requirements and which currently has a capacity of 63 MW (includingdiesel generator sets of 16 MW). This generation facility is in the process of being enhanced to provideadditional capacity of 22.5 MW by September 2011. This generation facility provides the Group with aconsistent supply of energy at a lower cost than if it were required to use power from the generalMalaysian power grid.
In addition to its core production facilities described above, the SFI unit also contains a sawmill and aplywood mill which have been in operation since 1997 and 1999, respectively. During the year endedJune 30, 2010, the sawmill produced 14,374 cubic meters (against a total production capacity of100,000 cubic meters) and the plywood mill produced 14,397 cubic meters (against a total productioncapacity of 120,000 cubic meters). At present, the products are confined to rough and chemically
— 118 —

treated sawn-timber and dried veneer and common raw plywood, from a variety of tree species sourcedfrom the SFI unit’s own forest concession. The SFI unit’s top 8 customers accounted for 69% of SFI’sdomestic sales in the nine months ended March 31, 2011 (from a sales volume of 67,769 tonnes).While there are some customers within Malaysia, timber has historically been exported to Japan,Europe, Taiwan, South Africa, Thailand, Middle East and Australia. Sales of timber generatedapproximately 9.3% of the unit’s total revenue in the nine months ended March 31, 2011.
The SFI unit contains approximately 288,138 hectares of licensed forest and plantation land from thegovernment (105,000 hectares of licensed natural forest land and 183,000 hectares of plantation) whichserves as a source of wood for its hardwood pulp manufacturing facilities at the SFI unit. The Issuermanages the licensed forest area according to the regulations set forth in Malaysia and employssustainable, selective logging in order to ensure compliance. With respect to the plantation area, theIssuer employs sustainable planting and harvesting techniques which ensure a high yield (nearly10 times that produced by the licensed forest area). Therefore, as the Group intends to increaseharvesting, it also plans to increase planting activities on areas of the plantation which had been loggedpreviously. The Group intends to increase the annual plantation area from 3,500 hectares per annum in2011 to 12,000 hectares in 2012 and 15,000 hectares per annum from the end of 2013 onwards. TheGroup also intends to move from a 7 year cycle from planting to harvesting, to a 6 year cycle. Thesechanges are intended to support the increase in hardwood fiber requirements at the SFI unit resultingfrom the expansion of the hardwood pulp production facilities. During the year ended June 30, 2010,the ratio of available wood for harvesting in that year to wood required was 6.3 million Mt to835,000 Mt. The Issuer expects that, following a slight increase in this ratio, in 2011, this will decreaseto 2.5 million Mt to 1.7 million Mt in 2015 as a result of increase a harvesting.
The Group plans to further enhance its uncoated wood free capacity in Malaysia by 60,000 tpa throughefficiency improvements to its existing machines, at an estimated capital expenditure cost ofUS$22 million. The Group believes this enhancement will help to strengethen its market share in thedifferent segments of the uncoated wood free paper market in Malaysia.
The SFI unit employed 2,190 people as at March 31, 2011. Employees at the production facilitiesusually work shifts of 8 hours, with 3 shifts existing in a 24 hour period.
The SFI unit has received various certifications, including the:
Š FSC Controlled Wood Forest Certification; and
Š Verification of Legal Origin (VLO) Certification.
Kamalapuram
While the Ballarpur and SFI units produce hardwood pulp for internal use only, the Kamalapuram unitcaters to external customers as the only producer of market rayon grade pulp in India. TheKamalapuram unit is a stand-alone pulp business which produces rayon grade pulp for the viscose fiberindustry which is used in the textile industry. It also has the ability to switch from producing rayon
— 119 —

grade pulp to producing paper grade hardwood pulp but the Group only uses this capability to balancelines and fully utilize capacities in the event that demand for rayon grade pulp decreases significantly.For example, as discussed below, the Kamalapuram unit produced 14,095 tonnes of paper gradehardwood pulp for use at the Group’s paper production facilities in the year ended June 30, 2009 butproduced negligible paper grade pulp during the year ended June 30, 2010.
The Group’s production of rayon grade pulp in tonnes for each of the last three years endedJune 30, 2010 and the nine months ended March 31, 2011, is set forth in the table below:
For the years ended June 30For the nine monthsended March 31,
2008 2009 2010 2011
Production(***) Capacity Production Capacity Production Capacity Production Capacity(*)(tonnes per year)
Total . . . . . . . . . . 92,148 98,550 40,523(**) 98,550 85,345 98,550 64,789 98,550
(*) Capacity for the full year
(**) 26,428 tonnes of which was rayon grade pulp and 14,095 tonnes of which was paper grade pulp
Almost all of the Group’s sales of rayon grade pulp are to a single purchaser within India due primarilyto Indian export restrictions on the product and the relatively few purchasers for this speciality productin the country, which leaves the unit’s sales relatively vulnerable to changes in supply and demand.The Group has had, however, a relationship with the purchaser for approximately 17 years and, asrayon grade pulp is a speciality pulp with very few producers globally, it has historically been costlieron the international market.
The decreased production in the year ended June 30, 2009 reflects a six month shut down of theKamalapuram unit resulting from the significantly decreased demand from the Group’s customer whichoccurred during the global economic downturn. However, with demand conditions improving inemerging economies and some degree of global economic stabilization, demand for the productincreased in 2010 and the Group re-commenced production at Kamalapuram.
Kamalapuram sources hardwood, the main raw material for its rayon grade pulp, from forests in nearbystates.
In the years ended June 30, 2009 and 2010, several initiatives were also undertaken to improveproductivity and reduction of fixed expenses, including:
Š In order to reduce manpower costs, a voluntary retirement scheme was announced onJuly 2, 2010 and 228 permanent workmen and 272 contract laborers accepted the offer;
Š Steps were also initiated to outsource various non-core operations;
— 120 —

Š Changes were made in raw material input without affecting quality of pulp, improved qualitycontrol system to reduce off grade pulp generation and fiber loss;
Š Non-conventional energy resources were utilized, including solar energy for water heating andstreet lighting
The Kamalapuram unit contains an on-site electricity generation facility, with a capacity of 12 MW,which is owned by the Group and provided approximately 83% of the unit’s power requirements in theyear ended June 30, 2010. The Group purchases any additional power from the national grid. Thisfacility provides the Group with a consistent supply of energy at a lower cost than if it were required touse power from the general Indian power grid. The water conservation measures taken at theKamalapuram unit have resulted in reduction in fresh water consumption from 129 m3/tonne in theyear ended June 30, 2009 to 99 m3/tonne in the year ended June 30, 2010.
As of March 31, 2011 there were 1,101 employees at the Kamalapuram unit, including159 management employees, 660 non-management employees and 282 contract laborers. Employees atthe production facilities usually work shifts of 8 hours, with 3 shifts existing in a 24 hour period.
The Kamalapuram unit has received numerous certifications, including the:
Š Quality Management System Standard ISO 9001 (2008) (valid until March 22, 2013);
Š Environmental Management System Standard ISO 14001 (2004) (valid until March 22, 2013);and
Š Occupational Health and Safety System Standard OHSAS 18001 (2007) (valid untilMarch 22, 2013).
Raw materials, inputs and suppliers
The critical inputs in the production of paper are pulp, chemicals and energy. Pulp (including wood andother raw materials), chemicals and energy generally account for approximately 45-50%, 20-25%, and15-20%, respectively, of the Group’s total cost of paper production.
Pulp
There is a shortage of fibrous raw materials in India and imported softwood and hardwood pulp is asignificant source of supply for many paper producers. Imported pulp is generally more expensive andsubject to greater price volatility than locally produced pulp due to factors including global marketprices, availability of wood, exchange rate fluctuations, government policies, import tariff structuresand freight costs. A change in any of these factors can have a significant cost impact on producers whosolely rely upon market purchases of pulp. Due to the uncertainties involved in the pricing of pulp, aswell as lags in shipments and delivery schedules, paper producers that have captive sources of fiber or
— 121 —

pulp are more able to control their raw material costs and achieve superior profitability as the cost ofpulp production is substantially lower than the prevailing market prices for hardwood and softwoodpulp.
The table below sets out first quarter prices in real terms for bleached hardwood kraft and bleachedsoftwood kraft pulp for 2004-2010 in Asia (based on 2010 price levels before discount).
2004 2005 2006 2007 2008 2009 2010
(US$/Mt)
Hardwood pulp . . . . . . . . . . . . . . . . . . . . . . . . . . . . . . . . . . . . . . . . . 622 642 605 691 741 440 749Softwood pulp . . . . . . . . . . . . . . . . . . . . . . . . . . . . . . . . . . . . . . . . . . 667 684 611 773 776 527 789
Source: Pöyry
The Group maintains hardwood pulp production facilities at the SFI unit and the Ballarpur unit.Kamalapuram produces rayon grade pulp. As a result of the acquisition of the SFI unit, the Issuerbelieves that the Group is the only Indian paper company which has a captive fiber or wood sourceoutside of India. The Bhigwan unit does not have captive pulp-making capability and has thereforerelied on open market purchases of both hardwood and softwood pulp pursuant to short-term contractsfrom multiple suppliers so as to reduce its exposure to any one source.
As a result of the expansion of paper production over recent years, and the fact that expansion ofhardwood pulp production capacity has followed after expansion of paper production capacity, theGroup was approximately 56% integrated with respect to hardwood pulp and 50% integrated for totalpulp requirements for the nine months ended March 31, 2011. The Group’s current hardwood pulpproduction capacity is 250,000 tpa and all of the Group’s production at the Ballarpur and SFI units areused at each of those units (with Ballarpur also purchasing approximately one quarter of its hardwoodpulp from the market). Following the expansion of the pulp production capacity to be completed, theBallarpur unit will produce 100% of its hardwood pulp requirements and the SFI unit is expected toproduce 120,000 tonnes of additional pulp, while both units will help fulfill the requirements of theBhigwan unit. As a result of this, the Issuer expects that the Group will be 100% integrated in respectof its hardwood pulp requirement by the year ended June 30, 2013.
The Group also uses softwood pulp in the production of its coated and uncoated wood-free paperproducts in order to reinforce the hardwood pulp. For the nine months ended March 31, 2011, theGroup used approximately 24,500 tonnes of softwood pulp and approximately 15,000 tonnes ofBCTMP pulp (as compared to approximately 304,500 tonnes of hardwood pulp used during thisperiod). The Group relies on purchases from the open market for all of its softwood pulp and BCTMP,all of which is imported.
The primary fiber inputs for the paper grade pulp produced by the Group are hardwood and bamboo.
The Group harvests hardwood fiber at the SFI unit purchases hardwood fiber from the market and fromfarmers participating in farm forestry programs supported and facilitated by BTTL and pays royaltiesto governments for harvested bamboo.
— 122 —

Hardwood and bamboo
The correct extraction, handling, procurement and supply of hardwood or bamboo is important becauseensuring the correct quality, quantity and cost has a direct impact upon the operation of the Group’sintegrated hardwood pulp and paper manufacturing facilities. Hardwood fiber is produced usinghardwood trees, such as eucalyptus, aspen, birch and acacia, which have shorter fibers and aregenerally better suited to manufacture coated and uncoated paper, tissue paper and packagingpaperboard. Short fibers are generally best suited for the manufacture of wood-free paper with goodprintability, smoothness, brightness and uniformity.
The Group’s SFI unit and, when it produces paper grade pulp, Kamalapuram unit use hardwood fiberfor the hardwood pulp production. The Ballarpur unit primarily uses hardwood fiber but also usesbamboo.
During the nine months ended March 31, 2011, the SFI unit procured from its own sourcesapproximately 87% of its total hardwood requirements. The Group’s other units historically purchaseall of their hardwood fiber requirements from the open market. For the nine months ended March 31,2011, the Group purchased 58% of its hardwood fiber from outside sources. These figures excludebamboo harvested from government land leased to Ballarpur through a lease set to expire in 2014 andwood purchased through BTTL’s farm forestry program. The Ballarpur unit and the Kamalapuram unitpurchase all of their hardwood requirements from the market.
Through the farm forestry program, BTTL facilitates the supply of fast growing, site specific plantingstock to the farmers, along with technical knowhow. While the farmers are able to sell the hardwoodproduced on the open market, the proximity of the farms to the unit provides the Group with aconvenient source of hardwood.
Bamboo can be used as a hardwood in relation to paper production and, given the rate at which it canbe grown, is considered a renewable resource for these purposes. With respect to the contract betweenthe Ballarpur unit and the government of Maharashtra, the Group receives the benefit of the contractbut also contributes to the annual royalty paid by Ballarpur unit to the government of Maharashtra.Ballarpur currently manages the property owned by the government located near the Ballarpur unit forbamboo production. The royalties paid are based on the amount of bamboo harvested.
— 123 —

The Group’s use and production/harvesting of hardwood and bamboo fiber in tonnes for each of thelast three years ended June 30, 2010 and the nine months ended March 31, 2011, is set forth in thetable below:
For the years ended June 30For the nine monthsended March 31
2008 2009 2010 2011
Consumed Produced Consumed Produced Consumed Produced Consumed Produced(tonnes per year)
Hardwood* . . . . . . . 1,497,375 704,810 1,236,310 660,406 1,627,126 743,575 1,178,053 516,326Bamboo . . . . . . . . . . 141,357 0 105,791 0 34,786 0 37,911 0Total . . . . . . . . . . . . 1,638,732 704,810 1,342,101 660,406 1,661,912 743,575 1,215,963 516,326
* Excluding hardwood used in ITC division at SFU unit.
India
In the late 1980s, approximately 80% of the Group’s hardwood fiber was sourced from Government- orstate-owned forests, and the remaining 20% from private farmers. However, the Issuer believed that theschedule according to which the Government and state authorities set wood pricing was increasinglydivergent from market conditions. In addition, there were indications that the Government wouldincrease its regulation of environmental matters and natural resource use, and there would be greateruncertainty as to the future availability and pricing of wood from Government sources. In order toensure access to alternative sources of pulp and control the costs associated with pulp supplies, BTTL,an affiliate of the Group, started the farm forestry program in 1997. This program involved increasingthe percentage of its wood fiber requirements that are supplied by local farmers, and at the same time,developing relationships with individual farmers and working with them to adopt sustainable farmforestry practices. Recently, the farm forestry programs have also been aimed at increasing the amountof wood that is farmed within a “catchment area”, defined as within a 350 km radius of the relevantunit to be supplied, which the Issuer believes is the distance within which the Group can realizesavings in transportation and related costs.
By the late 1990s, only 30% of its wood fiber requirements were sourced from the Government, downfrom 80% in the late 1980s. The Group currently sources only 20% from Government or state-ownedforests, and the remaining 80% is sourced from non-Government sources, including wood purchased onthe market through farm forestry programs. The Group’s goal is to further decrease its reliance onGovernment-supplied wood. Increased hardwood fiber requirements at the Ballarpur unit will be metby increased purchases from the market and the farm forestry programs as well as from increasedharvesting at the SFI unit (subject to transportation costs, import and export restrictions and customsduties).
The Group currently benefits from a contract dated March 11, 2004 between the government ofMaharashtra and Ballarpur unit, in which the government of Maharashtra has agreed to sell bamboofrom the government forests for the production of pulp, paper, paper board and other pulp products.Ballarpur is required to deposit a security amount and pay the sale price in eight equal installmentsduring each year. Although the Group is not a party to the agreement, the Group pays royalties based
— 124 —

on the amount it harvests in any year. The contract is currently set to expire on September 30, 2014.This contract is currently the subject of litigation between Ballarpur and the government ofMaharashtra and the Group intends to reduce the bamboo it harvests pursuant to this contract andincrease market purchases for bamboo from this unit. For additional information concerning thislitigation, see “— Material Litigation”.
The Group predominantly uses eucalyptus, casuarinas, sababool and acacia for its hardwood pulp inIndia.
Malaysia
As discussed above, the SFI unit contains over 288,138 hectares of licensed forest and plantation land(104,822 hectares of licensed natural forest land, approximately 110,000 hectares suitable forplantation and approximately 73,000 hectares licensed for use as plantation but unsuitable for such ause give such factors as topography) which serves as a source of wood for its hardwood pulpmanufacturing facilities at the SFI unit. The hardwood produced at SFI unit is used for production atthe unit. For the nine months ended March 31, 2011, the SFI unit used 590,498 tonnes of hardwood(excluding wood used to produce timber for sale) while producing 516,326 tonnes of hardwood.
The Group intends to significantly increase hardwood production from the plantation areas at the SFIunit by increasing harvesting and, in order to maintain the desired sustainability of the asset goingforward, increasing planting activities within the plantation area (which is approximately 10 times asproductive as the natural forest area and which produces timber which is more uniform and consistent).During the year ended June 30, 2010, the ratio of available wood to wood required was 6.3 million Mtto 835,000 Mt. The Issuer expects that, following a slight increase in this ratio, in 2011 with the ratioof available wood to wood required coming to 6.8 million Mt to 805,000 Mt, this will decrease to2.5 million Mt to 1.7 million Mt in 2014-2015 as a result of increased harvesting. The availability atthe SFI unit is sufficient to meet the expected expanded hardwood pulp production capacity of 240,000tpa at the SFI unit.
Softwood
The Group uses softwood pulp, or long fiber, for its paper production. Softwood fiber comes primarilyfrom coniferous trees and makes up approximately 7% of the fiber used by the Group during the ninemonths ended March 31, 2011. The Group is entirely dependent on imports of softwood pulp fromNorth America and Northern Europe.
Electricity
Electricity is essential for powering the machinery and equipment involved in paper production.However, the supply of electricity in India distributed over state-owned grids is often unreliable andexpensive. Irregular public power supplies expose manufacturers to sudden work stoppages and otherdisruptions in production. Such unreliability is particularly detrimental to the continuous processnature of the paper industry.
— 125 —

The Group therefore relies primarily on coal or oil fired captive power plants at all of its facilities (twoof which are owned by the Group and two of which are owned by Avantha Power), which currentlygenerate enough electricity to meet nearly all of its electricity requirements. Most of the Group’spower plants incorporate co-generation technology that uses the tap-off steam from the turbines tomeet the process requirements of the Group’s paper and pulp manufacturing process. The averagevariable cost per unit of power produced by its on-site generators is approximately US$ 0.06/kWh,which is significantly lower than the average price of electricity purchased over the state-owned gridsin India and Malaysia.
The SFI unit (partly bio-fueled and partly oil fired) and Kamalapuram unit (coal fired) contain on-sitefacilities which are 100% owned by the Group.
The SFI unit’s facility provides all of the unit’s power requirements with a current capacity of 63 MW(with 16 Mw from a diesel generator). This generation facility is in the process of being enhanced toprovide additional capacity of 22.5 MW by September 2011 to meet increased requirements followingthe commissioning of the new pulp mill. This generation facility provides the Group with a consistentsupply of energy at a lower cost than if it were required to use power from the general Malaysianpower grid.
The Kamalapuram unit’s facility provides approximately 83% of the unit’s power requirements in theyear ended June 30, 2010, with a capacity of 12 MW. This facility provides the Group with a consistentsupply of energy at a lower cost than if it were required to use power from the general Indian powergrid.
The Ballarpur and Bhigwan units contain captive energy production with on-site facilities which areowned by Avantha Power. Historically, Avantha Power has increased power generation capacity inparallel with growing paper/pulp operations and the Issuer believes that Avantha Power will continuethis practice for future expansions as well.
As per the Group’s contracts with Avantha Power for the power generation facilities at the Ballarpurand Bhigwan units, the Group has the right to all electricity produced to meet its energy requirement.In the event that the electricity is insufficient to meet the requirements of the relevant unit, the Grouppurchases additional power from the India grid. The Group is not required to purchase a minimumamount of power from the facilities. Avantha Power has the right to sell electricity to third parties afterfirst offering it to the Group.
For additional information on these contracts, see “— Material Contracts”.
— 126 —

The table below sets forth certain information regarding the captive power plants at each of itsfacilities for the nine months ended March 31, 2011:
Unit
Powerconsumptionfrom publicgrid (kW/hr)
Cost ofpowerfrom
public grid(US$/unit)
Captive powergenerated(kW/hr)
Variablecost ofcaptivepower
(US$/unit)
Savingsin power cost
per year(US$ million)
Coal source/energy source
Ballarpur . . . . . . . . . . . . . . . . 6,218,000 0.11 218,93,427 0.06 12.43 Coal (coalfieldsin Chandrapur)
Bhigwan . . . . . . . . . . . . . . . . 5,831,499 0.13 131,721,305 0.09 4.56 Coal (WCL,Nagpur)
Kamalapuram . . . . . . . . . . . . 17,989,384 0.09 60,493,000 0.03 2.70 Coal(Sigararenicollieries)
SFI . . . . . . . . . . . . . . . . . . . . 10,612,885 0.08 209,274,609 0.06 3.19 Hog fuel (to bereplaced withbio fuel)
The Group’s coal supplies in India are sourced from Government or state run entities. While coalpricing is set by the Government, the Issuer believes that the Group is able to reduce the costsassociated with transporting coal because all of its captive power plants are located near sources ofcoal. The Group continues to evaluate other methods for reducing the cost of coal procurement,including the possibility of sourcing imported coal with higher calorific values than domestic coal.
The Group anticipates that it will be able to continue to supply substantially all of its electricityrequirements from captive generators, even taking into account the increases in production capacityfrom its expansion projects, through productivity gains as older machines are replaced with newer,more efficient equipment.
Chemicals
The main chemicals used in the paper manufacturing process are latex, calcium carbonate and certainspecialty chemicals. These chemicals account for approximately 25-30% of the total cost ofproduction. The Group produces approximately 13% of the chemicals used for paper and hardwoodpulp production, while it purchases the rest from the market pursuant largely to long-term supplycontracts.
The Ballarpur unit contains a chemical plant complex that produces caustic soda (total capacity of14,400 tpa, which constitutes 100% of the Ballarpur unit’s annual requirements), chlorine (totalcapacity of 12,775 tpa, which constitutes 100% of the Ballarpur unit’s annual requirements), chlorinedioxide (total capacity of 1,095 tpa, which constitutes 100% of the Ballarpur unit’s annualrequirements) and sulphur dioxide (total capacity of 444 tpa, which constitutes 100% of the Ballarpurunit’s annual requirements), all of which are vital chemicals for the paper process. The Ballarpur unitsells any excess caustic soda produced at the plant on the market.
In addition, the Group has an agreement for the supply of precipitated calcium carbonate from afacility which is owned by SMI (a joint venture company of an Avantha Group company). This plant
— 127 —

supplies precipitated calcium carbonate to the Group’s manufacturing units at a discounted price,calculated based on a formula agreed between the Group and the supplier.
The Group also has an agreement for the supply of paper grade ground calcium carbonate from afacility which is owned by Imerys (a joint venture company of an Avantha Group company). This plantsupplies paper grade ground calcium carbonate to the Group at up to a 20% discount to the price ofsimilar quantities imported into India. The Group’s contract with Imerys expires in 2014. Theproduction facility for paper grade ground calcium carbonate is located in the premises of the Bhigwanunit.
The SFI unit also an agreement for the supply of precipitated calcium carbonate from an on-site facilitywhich is owned by Speciality Minerals Malaysia Sdn. Bhd. This plant supplies precipitated calciumcarbonate to the SFI unit.
The Kamalapuram unit includes a chemical production facility which produces quick lime.
The Group’s expenditure on certain key chemicals, from which the Group produces chemicals used inthe paper and hardwood pulp production process, for each of the last three years ended June 30, 2010and the nine months ended March 31, 2011, is set forth in the table below:
For the years endedJune 30
For the nine monthsended March 31
2008 2009 2010 2011
(figures in millions of US$)
Latex . . . . . . . . . . . . . . . . . . . . . . . . . . . . . . . . . . . . . . . . . . . . . . . . . . . 5.76 8.72 18.71 15.73Calcium Carbonate . . . . . . . . . . . . . . . . . . . . . . . . . . . . . . . . . . . . . . . . 10.46 13.56 19.92 18.66Clay . . . . . . . . . . . . . . . . . . . . . . . . . . . . . . . . . . . . . . . . . . . . . . . . . . . . 0.85 2.45 3.63 2.38Caustic Lye . . . . . . . . . . . . . . . . . . . . . . . . . . . . . . . . . . . . . . . . . . . . . . 3.65 2.10 2.31 3.54Lime — Unslaked . . . . . . . . . . . . . . . . . . . . . . . . . . . . . . . . . . . . . . . . . 3.94 4.34 1.79 2.42Chlorine . . . . . . . . . . . . . . . . . . . . . . . . . . . . . . . . . . . . . . . . . . . . . . . . 0.50 0.18 0.60 1.29
Total . . . . . . . . . . . . . . . . . . . . . . . . . . . . . . . . . . . . . . . . . . . . . . . . . . . 25.16 31.35 46.97 44.02
Distribution strategy in India
The Indian market for uncoated- and coated woodfree papers is characterized by a high degree ofcustomer fragmentation. As an example, the Group today has more than 15,000 customers, and 88%and 85% of its Indian orders of coated and uncoated wood free paper, respectively, were for 10 tonnesor less. Furthermore, unlike most developed paper markets, the Indian market lacks sizeableintermediaries or merchants able to distribute bigger volumes from paper producer to theend-customer. Each paper producer must therefore develop its own distribution strategy and network todeliver product into its regional or country-wide market.
The Group has spent many years and considerable resources establishing and growing its multi-tiereddistribution network to effectively cover the entire Indian market. The Issuer believes the Group todayhas the most comprehensive distribution network of any competitor with the ability to service
— 128 —

customers across all of India with both coated and uncoated wood-free papers from the same networkand for all order sizes. The Issuer believes this is a key competitive advantage relative its domesticcompetition and a key barrier to entry for new market participants.
In order to create a long-term, sustainable customer base within a historically commoditised market,the Group is increasingly marketing its products directly to the customer and trying to build awarenessof the Group’s “BILT” brand in the market, and leverage its sales, marketing and distribution channelsthat give the Group broad geographic coverage across India. As a result of the Group’s multi-tierdistribution network (including direct sales channels, exclusive distributors and others), the Group hasimproved both its reach to its customers and its flexibility in meeting customer orders to maximize itsincreased production capacity and challenge its competitors in certain markets and regions.
The Group maintains systems intended to improve its responsiveness to customer orders, queries and,if necessary, complaints. Through this system, the Issuer believes that the Group is able to offer amongthe highest quality customer service in the Indian paper industry. During the year ended June 30, 2011,the Group was able to settle over 86% of customer complaints within 30 days through its system ofdistributors and Group employees. Certain of these complaints will be handled centrally or by thedistributor. For others, in order to maintain close client contact and satisfaction, the Group will sendemployees directly to the customer’s location in order to solve the complaint.
— 129 —

India domestic sales
Distribution network
The Group operates what the Issuer believes is the most extensive distribution network in the Indianpaper industry and a key competitive advantage that is paramount to the Group’s approach to servicingits broad customer base. As of the date of this Offering Circular, the Group operates two paper mills inIndia, 1 rayon grade pulp mill, 4 RSOs and 14 depots, while working with 141 distributors. Thedistributors are located throughout India, with concentrations in regions with high levels of economicgrowth. Each distributor, in turns, has an extensive network of local dealers. This distribution networkhas enabled the Group to maintain a leading position in terms of marketing and distributing itsproducts.
State Number of Distributors
Andhra Pradesh . . . . . . . . . . . . . . . . . . . . . . . . . . . . . . . . . . . . . . . . . . . . . . . . . . . . . . . . . . . . 8Bihar . . . . . . . . . . . . . . . . . . . . . . . . . . . . . . . . . . . . . . . . . . . . . . . . . . . . . . . . . . . . . . . . . . . . 1Delhi . . . . . . . . . . . . . . . . . . . . . . . . . . . . . . . . . . . . . . . . . . . . . . . . . . . . . . . . . . . . . . . . . . . . 14Gujarat . . . . . . . . . . . . . . . . . . . . . . . . . . . . . . . . . . . . . . . . . . . . . . . . . . . . . . . . . . . . . . . . . . . 5Haryana . . . . . . . . . . . . . . . . . . . . . . . . . . . . . . . . . . . . . . . . . . . . . . . . . . . . . . . . . . . . . . . . . . 5Jammu & Kashmir . . . . . . . . . . . . . . . . . . . . . . . . . . . . . . . . . . . . . . . . . . . . . . . . . . . . . . . . . 1Karnataka . . . . . . . . . . . . . . . . . . . . . . . . . . . . . . . . . . . . . . . . . . . . . . . . . . . . . . . . . . . . . . . . 7Kerala . . . . . . . . . . . . . . . . . . . . . . . . . . . . . . . . . . . . . . . . . . . . . . . . . . . . . . . . . . . . . . . . . . . 4Madhya Pradesh . . . . . . . . . . . . . . . . . . . . . . . . . . . . . . . . . . . . . . . . . . . . . . . . . . . . . . . . . . . 8Maharashtra . . . . . . . . . . . . . . . . . . . . . . . . . . . . . . . . . . . . . . . . . . . . . . . . . . . . . . . . . . . . . . . 27Orissa . . . . . . . . . . . . . . . . . . . . . . . . . . . . . . . . . . . . . . . . . . . . . . . . . . . . . . . . . . . . . . . . . . . 3Punjab . . . . . . . . . . . . . . . . . . . . . . . . . . . . . . . . . . . . . . . . . . . . . . . . . . . . . . . . . . . . . . . . . . . 8Chandigarh . . . . . . . . . . . . . . . . . . . . . . . . . . . . . . . . . . . . . . . . . . . . . . . . . . . . . . . . . . . . . . . 2Rajasthan . . . . . . . . . . . . . . . . . . . . . . . . . . . . . . . . . . . . . . . . . . . . . . . . . . . . . . . . . . . . . . . . . 2Tamil Nadu . . . . . . . . . . . . . . . . . . . . . . . . . . . . . . . . . . . . . . . . . . . . . . . . . . . . . . . . . . . . . . . 15Uttar Pradesh . . . . . . . . . . . . . . . . . . . . . . . . . . . . . . . . . . . . . . . . . . . . . . . . . . . . . . . . . . . . . . 12West Bengal . . . . . . . . . . . . . . . . . . . . . . . . . . . . . . . . . . . . . . . . . . . . . . . . . . . . . . . . . . . . . . 8Goa . . . . . . . . . . . . . . . . . . . . . . . . . . . . . . . . . . . . . . . . . . . . . . . . . . . . . . . . . . . . . . . . . . . . . 1Other States (incl. Nepal) . . . . . . . . . . . . . . . . . . . . . . . . . . . . . . . . . . . . . . . . . . . . . . . . . . . . 10Total . . . . . . . . . . . . . . . . . . . . . . . . . . . . . . . . . . . . . . . . . . . . . . . . . . . . . . . . . . . . . . . . . . . . 141
Along with the ability to service a broad customer base throughout India, this extensive network alsoserves to control the Group’s cost of transportation. The Group believes this strong distributionnetwork keeps the Group’s transportation costs lower many of its domestic and internationalcompetitors.
Approximately 80% of the Group’s Indian sales (by volume) were to the domestic market in the yearended June 30, 2010 with nearly 99% of the Group’s transportation of its goods in India is donethrough third party trucking companies. The Group’s transportation of its goods throughout Malaysia isdone primarily by ship.
The Group’s distribution network encompasses exclusive distributors, multi-brand distributors anddirect sales. For the year ended June 30, 2010 direct distributions in India were 17.4%, whiledistributions through distributors were 37.2%. Distributions through depots, which act as storehouses
— 130 —

for the Group’s finished goods, were 45.3%. The Group’s customer base has also increased, fromapproximately 12,380 at June 30, 2008 to 14,350 and 15,000 at June 30, 2009 and March 31, 2011,respectively.
Exclusive and multi-brand Indian distributors
Exclusive distributors sell only BILT products, with targets with respect to total volume sold, annualgrowth and incentive bonuses, which the Issuer believes provides some protection against adversemarket conditions. This is a key channel for cross-selling opportunities and, for the nine months endedMarch 31, 2011, was responsible for 54% of total sales from India. The Group intends to increase salesby exclusive distributors as a percentage of total sales.
Multi-brand distributors sell products from a number of companies, including the Issuer, and generallydo not have commitments in relation to volume sold. While this channel provides limited protectionfrom adverse market conditions, it is responsible for a significant portion of the Group’s sales to smalland medium-sized customers, and for 24% of sales overall for the year ended June 30, 2010.
Distribution through the Group’s distributors, both exclusive and multi-brand, is fairly concentrated,with the top 10 coated and uncoated wood-free paper distributors accounting for 49.4% and 43.5% ofdistributions, excluding direct sales, for the year ended June 30, 2010. The majority of this is, in turn,within India via exclusive distributors.
While the volume, growth and incentive structure of exclusive and multi-brand distributors varies,contractual terms with respect to sale, distribution and risk to the products is fairly consistent. Paymentto the Group for the products is generally made within 24 days of delivery to the distributor (with a27% per annum penalty for late payment and a 27% per annum incentive for early payment) and anyend-customer credit risk is, therefore, borne by the distributor. In addition, distributors are required topay a security deposit of INR 10,000 per tonne of the distributor’s average monthly requirements,while the Issuer pays 6% per annum in interest. The Group’s products are provided to the distributorsand are then subject to mark-ups by the distributors and sold to the end customer.
Direct Indian sales
The Group’s direct sales result from the Group’s internal sales and marketing operations which areprimarily focused on large customers. Such sales accounted to 3% of the Group’s total sales for theyear ended June 30, 2010 and the Issuer intends to increase this in order to continue to grow theGroup’s relationships with its customers.
Typically, paper manufacturers in India do not directly interact with end-users, and have historicallyrelied instead on distributors and dealers to generate sales. The Group recognizes the need to increasethe level of direct interaction with end-users in order to better understand their requirements. TheGroup has therefore adopted a number of specific measures designed to build closer relationships withcustomers, including:
Š streamlined the distribution channels so as to reduce the number of intermediaries;
— 131 —

Š increased its sales force to directly access customers;
Š diversified its product offerings, particularly with respect to sizing options, which allowcustomers to use the Issuer for all of the customer’s coated and uncoated wood-free paperneeds; and
Š conducted market research to better understand pricing and other relevant market information.
The Issuer believes that this interaction is vital due to the fragmentation of the industry’s customerbase and the Group’s strategy of targeting filling all order sizes while targeting small and mediumsized customers.
Customer structure
The following table sets out the Group’s sales of coated wood-free paper to its customers based on sizeof the customer for the nine months ended March 31, 2011:
Coated Wood-free Paper Uncoated Hi-Bright Wood-free Paper
Number ofcustomers
(approximately)Percentage oftotal Sales
Number ofcustomers
(approximately)Percentage oftotal Sales
Top 10% customers . . . . . . . . . . . . . . . . . . . . . . . 10 14% 10 6%Other large customers . . . . . . . . . . . . . . . . . . . . . 125 21% 125 21%Medium and small sized customers . . . . . . . . . . 4,000 46% 4,000 46%Traders . . . . . . . . . . . . . . . . . . . . . . . . . . . . . . . . . 3,000 19% 3,000 27%
This fragmentation with respect to the size of its customers translates into a high number of orders anda relatively small average order size. For example, average order size, the percentage of order volumesold in increments of 10 Mt or below and the percentage of the number of orders for 10 Mt or belowfor coated wood-free paper from the Bhigwan unit was 7.3 Mt, 47% and 88%, respectively, for the ninemonths ended March 31, 2011. Similarly, the average order size, the percentage of order volume soldin increments of 10 Mt or below and the percentage of the number of orders for 10 Mt or below foruncoated wood-free paper from the Ballarpur unit was 7.7 Mt, 45% and 85%, respectively, for the ninemonths ended March 31, 2011.
Large customers
The Group’s large customers are primarily characterized by large volume orders of a variety ofproducts. These customers are often served by a number of producers and, as such, have greater choicein supply which, in turn, reduces the Group’s margin of error with respect to filling orders. While theGroup’s management from its centralized headquarters focuses on these customer relationships, ordersare managed by regional offices. While the potential for premium pricing is lower due to thecompetitive nature for large customers, the large order size provides a good base of utilization for thepaper machines and the variety of paper purchased provides opportunities for cross-selling.
— 132 —

Medium sized customers
Medium sized customers usually place orders for a variety of products which are, on average, smallerthan those placed by large customers but often place such orders more frequently. These customers areincreasingly focused on quality and supply choice can be driven by relationships with its chosensupplier. These relationships are usually managed by the Group’s regional offices. Due to the focus onquality and the more regional nature of the customer, the Group may be able to chart a small premiumbased on its historical track record with the customer and the quality of the product. Also, due to thevariety of products ordered, there are often cross-selling opportunities in relation to these customers.
Trade and small customers
Orders from small customers are regionally focused and often from rural areas where supplier choice islimited, more infrequent and at low volumes. The Issuer believes that the Group is uniquely positionedto serve these customers throughout India as a result of its large distribution network. Distribution isoften more complex due to the small volume and location of the customers which, along with limitedsupplier options, results in the Group’s ability to charge a premium. Cross-selling opportunities arelimited.
Malaysian Sales
Approximately 70% of the Group’s Malaysian sales (by volume) were to the domestic market in theyear ended June 30, 2010, with exports distributed to 24 countries. The product manufactured at theSFI unit is sold through merchants as well as directly to customers through the Group’s network.
The SFI unit’s top eight customers accounted for approximately 69% of the unit’s sales (from a total of67,769 Mt) for the nine months ended March 31, 2011, with the top three customers accounting for38% during this period.
The Group maintains an extensive distribution network in Malaysia, which can be divided to five majorzones: Sabah (East Malaysia), Sarawak (East Malaysia), Northern area of West Malaysia, Central areaof West Malaysia and Southern area of West Malaysia. The vast majority of paper consumption inMalaysia occurs in West Malaysia where major commercial activities are located. The Group maintainstwo RSOs in Malaysia, one of which is located in the Central area of West Malaysia (focused on theWest Malaysian market) and the other in Sabah (focused on the East Malaysian market). The Groupalso operates 55 distributors throughout Malaysia for distribution from the SFI unit.
Export Sales
For the year ended June 30, 2010, the Group exported approximately 22% of its paper sales (byvolume) outside India and Malaysia. This figure included 20% from the Bhigwan unit, 19% from theBallarpur unit and 30% from the SFI unit for the period. The Group generally uses exports in order tostrategically balance demand and supply in its domestic markets and have been used to evacuate excess
— 133 —
volumes in order to maintain domestic value and prices especially when domestic capacity hasincrease.
A total of 83,440 Mt were exported from the Group’s Indian operations, primarily into Asia (62% ofexport sales for the year ended June 30, 2010) and Africa (18% during the period). A total of 44,300Mt were exported from the Group’s Malaysian operations, also primary into Asia (78% of export salesfor the year ended June 30, 2010) and Africa (22% during the period).
In order to sell its paper products internationally, the Group maintains relationships with dealersoverseas who are able to sell and distribute its products in the United States, Australia, Europe, Canadaand Asia. The Issuer believes that maintaining these international dealer relationships will give it theexperience to expand its exports if and as opportunities present themselves. Currently the Group has 10internationally-based agents across the globe, who assist the Group in exporting to more than 70countries.
Material Contracts
The following contracts (not being contracts entered into in the ordinary course of business) have beenentered into by the Issuer or another member of the Group: (a) within the two years immediatelypreceding the date of this Offering Circular which are, or may be, material to the Issuer or any memberof the Group, and (b) at any time and contain provisions under which the Issuer or any member of theGroup has an obligation or entitlement which is, or may be, material to the Issuer or any member of theGroup as at the date of this Offering Circular:
Trademark License Agreement
BILT and BGPPL entered into a trademark license agreement dated September 6, 2010 (the “LicenseAgreement”), pursuant to which BILT grants to BGPPL a non exclusive, non transferable right andlicense to use the logo “BILT” and certain registered and unregistered trademarks (together, the“Trademarks”) in the operation of its business. The License Agreement is valid for a period of tenyears from July 16, 2007 or as long as BGPPL remains a subsidiary of BILT, whichever is earlier.
BGPPL has agreed to pay BILT an annual license fee of Rs. 100,000 under the License Agreement inconsideration for the rights granted under the License Agreement.
BGPPL may not sublicense, assign or transfer its rights under the License Agreement without the priorwritten consent of BILT.
Pursuant to the License Agreement:
Š BGPPL acknowledges and agrees that all rights in the Trademarks, including the goodwill ofbusiness associated therewith specifically with the Trademarks, are the sole and exclusiveproperty of BILT;
— 134 —

Š BGPPL may not give a notice of infringement or take any other action in relation to theinfringement and/or passing off of the Trademarks without the prior written authorization ofBILT. Upon BGPPL becoming aware of any actions anywhere in the world that may constituteinfringement and/or passing off of the Trademarks, it shall inform BILT of the same, and hasfurther agreed to cooperate with BILT in any action BILT may subsequently take in relation tosuch infringement and/or passing off.
Š BGPPL has agreed to indemnify BILT and its associated companies from all claims, losses,damages and injuries attributable to BGPPL. Further, BILT shall not be liable for anyincidental or consequential damages arising out or related to the use of the Trademarks.
Š any disputes relating to the License Agreement shall be resolved by way of arbitration
Common Services Agreement
BILT and BGPPL have entered into a common services agreement dated March 20, 2008 (“CommonServices Agreement”) in terms of which BILT has agreed to advise, render consultancy services andprovide necessary assistance to BGPPL in relation to the Bhigwan, Ballarpur and Kamalapuram units.BILT is obliged, under the Common Services Agreement, to provide such various services including,inter alia legal, financial, insurance, accounting, taxation, marketing and sales-accounting services toBGPPL in consideration for service fees payable by BGPPL on an annual basis. The services renderedby BGPPL shall be subject to a joint-annual review.
The Common Services Agreement is for an initial term extending to two years from the date of a“qualified IPO” in terms of the shareholders agreement dated March 18, 2008 between BILT, J.P. MorganMauritius, Lathe Investment, BIH and BPH. Both parties have agreed to indemnify the other against anylosses suffered as a result of any fraud, wilful misconduct, or gross negligence on the part of theindemnifying party or any breach of the terms and conditions of the Common Services Agreement.
Power Agreements
Power Purchase Agreement
BGGPL and Avantha Power plan to enter into a Power Purchase Agreement (“Power PurchaseAgreement”) for the supply and purchase of electricity for the Group’s Ballarpur unit and Bhigwanunit. This agreement will follow termination of an earlier power purchase agreement between BILTand Avantha Power.
Under the terms of the Power Purchase Agreement, Avantha Power is to own, operate and maintainthermal captive power stations located at Ballarpur and Bhigwan, including the interconnectionfacilities and substations, at its own cost and in accordance with prudent utility practices; supplyelectricity to BGPPL in accordance with the demand schedule of 30,000 units per month; and makepayment of applicable electricity duty for the power consumed by BGPPL. BGPPL, in turn, is topurchase the contracted facility capacity and net electrical output of a specified amount of net power;
— 135 —
make all payments to Avantha Power in accordance with the terms of the agreement at a specified rateper unit (kWh) for the specified periods; and abide by and comply with all laws, including electricitylaws, keeping in force all requisite approvals.
In the event that Avantha Power fails to supply the agreed upon quantity of power, BGGPL has theoption to either purchase power from another supplier or to terminate the Agreement with 15 daysnotice and will be entitled to reimbursements from Avantha Power for any additional costs incurred byBGPPL for purchasing power from other sources.
The Power Purchase Agreement will be valid for a specified number of years from its effective date butmay be terminated by either party at will by serving the other party with prior written notice at leastsix months in advance.
Chemical contracts
Precipitated Calcium Carbonate Agreement
BGPPL and SMI NewQuest (India) Private Limited (“SMI”) have entered into a contract datedApril 23, 2009 for the construction, operation and maintenance of a precipitated calcium carbonate(“PCC”) plant and the supply of PCC to the Ballarpur Unit where PCC is used as a raw material in themanufacture of paper.
Under the terms of the agreement, SMI is to construct a plant capable of producing 65,000 dry metrictons per year of PCC at its own expense for the production of PCC products on land leased by BGPPLat Ballarshah. The terms of the lease agreement were further agreed between BGPPL and SMI andcontained in an appendix to the agreement. SMI is required to supply PCC to BGPPL in accordancewith the forecast plans as agreed among them in the terms of the agreement. In the event that SMIcannot supply PCC, SMI shall make reasonable efforts to procure alternative sources for supply toBGPPL. Any production of PCC over the requirements of BGPPL could be sold by SMI to thirdparties, but only after offering it first to BGPPL and giving a notice in writing to that effect and onlyafter BGPPLhave refused such supplies can it be sold to third parties at a price which shall not belower than what is being charged to BGPPL.
The termination of the agreement is to occur on the tenth anniversary of the completion date of theagreement. Following this period, the contract is renewable from year to year unless terminated by awritten notice. The contract can be terminated by either party by giving the other party written noticeof termination, effective no sooner than one year after receipt of such written notice and no sooner thanthe scheduled termination date of the agreement.
Paper Grade Ground Calcium Carbonate Agreement
BILT and Imerys NewQuest (India) Private Limited (“Imerys”) have entered into a sales agreementdated March 22, 2004 for the supply and purchase of paper grade ground calcium carbonate (“GCC”)required in the manufacturing of paper and paper products to the Bhigwan unit.
— 136 —

Under the terms of the sales agreement, Imerys is to build, own and operate a plant at its own expensefor the production of GCC products at the Bhigwan unit. BILT is to furnish to Imerys an annualoperating plan containing estimated GCC requirements for each year. Imerys shall supply to BILT suchamount of GCC as is agreed in the ‘Rolling Plan Forecast’ submitted 30 days prior to thecommencement of every contract year at a price determined the manner set out in the agreement.However, in each contract year, BILT shall ensure that it and its affiliates purchase a minimum of54,500 metric tonnes per annum.
In the event that Imerys cannot provide the stipulated GCC, Imerys is to make all reasonable efforts toprocure the GCC from other sources for supply to BILT. However, any production of GCC over therequirements of BGPPL could be resold by Imerys to third parties, but only after giving a notice inwriting to that effect and after BGPPL has refused such supplies of GCC can it be sold to third partiesat a price not lower than the price at which it is sold to BILT. However, Imerys is required to give firstpriority for the purchase of GCC manufactured at the Bhigwan unit to BGPPL in accordance with theterms of this agreement.
The agreement is to remain in force for ten years.
PCC Production and Sale Agreement
SFI and SMM entered into a contract dated September 3, 2002 for the supply of PCC.
SMM is to construct a plant at its own expense for the production of PCC products on land leased bySFI at Sipitang, Sabah within twelve months of September 3, 2002. The agreement begins onSeptember 3, 2002 and lasts until 15 years after the completion of the construction of the plant.
PCC to be produced at this plant is to be used by SFI for paper production at their on-site mill.Production capacity at the PCC plant would total 30,000 tons per year, dependant upon carbon dioxidegas supply. Carbon dioxide gas is to be provided by SFI.
The purchase price of PCC is to be calculated according to a series of requirements specified in theagreement. SFI is to furnish SMM with an annual operating plan containing estimated PCCrequirements for each year.
The terms of the lease agreement were further agreed between SFI and SMM and contained in anappendix to the agreement.
Supply contracts
Long-term Supply Agreement for Bamboo
BILT and the Government of the State of Maharashtra (“Government of Maharashtra”) have enteredinto a long term agreement for supply of bamboo dated March 11, 2004 (“Supply Agreement”) under
— 137 —

which the Government of Maharashtra has agreed to supply to BILT approximately 181,540 mt ofbamboo from Government forests areas and for the same, BILT has deposited an interest free securityamount of Rs, 10,000,000.
Under the terms of the Supply Agreement, BILT is to cut and remove bamboo from the forest areas, tothe maximum extent possible, strictly in accordance with the appropriate prescriptions laid down in theworking plans/schemes from time to time and/or in accordance with instructions laid down by theAdditional Chief Conservator of Forests. For the same, BILT is required to pay the Government ofMaharashtra an amount for the bamboo removed calculated as per the terms of the Supply Agreement.However, BILT is to pay in advance for the quantity of bamboo removed, in accordance with aschedule specifying the amount to be removed. BILT is to use the bamboo so removed only for themanufacture of pulp, paper, paper boards and other paper products manufactured by the Ballarpur unitand the unit at Ashti.
The agreement between BILT and the Government of Maharashtra is for a period of ten yearscommencing October 1, 2004 and ending on September 30, 2014, renewable solely at the discretion ofthe Government of Maharashtra on such terms and conditions as may be mutually agreed.
Property contracts
Maharashtra Lease
Sinar Mas India Limited (which was acquired by Ballarpur in 2001) (“Sinar Mas”) and MaharashtraIndustrial Development Corporation (“MIDC”) have entered into a lease agreement dated May 30,1996 for an area of land in Bhigwan Industrial Area on which Sinar Mas was to construct paperproduction facilities for a period of 95 years from June 1, 1995, renewable for a further term of95 years subject to certain conditions being fulfilled.
Under the terms of the lease agreement, Sinar Mas has paid an initial premium of Rs 51.75 million forthe land and has agreed to pay a nominal yearly rent of Re. 1 during the lease period in addition to theyearly recurring fees or service charges for the amenities or common facilities to be provided by MIDCand BGPPL continues to pay a nominal rent to MIDC. In addition, post the assignment, BGGPL hasundertaken that it shall use the demised premises only for the purposes of a factory and not for any ofthe “obnoxious industries”, as set out in the schedule, which includes the production of paper.However, BGPPL has obtained a waiver dated March 11, 2011 from MIDC allowing them to producepaper on the leased land.
— 138 —

Subsidiaries and Investments
The principal subsidiaries and subsidiary undertakings of the Issuer are as follows:
Subsidiaries and subsidiary undertakings
Name
Country ofincorporation andregistered office
Class and percentage ofownership interest and
voting power Field of activity
Ballarpur Paper Holdings B.V.(BPH) (Subsidiary of theIssuer) . . . . . . . . . . . . . . . . . . . . . The Netherlands 100% Group holding company
BILT Graphic Paper ProductsLimited (BGPPL) (Subsidiary ofBPH) . . . . . . . . . . . . . . . . . . . . . . India 99.9%
Manufacturing and marketing ofPulp, Paper and Paper Products
Sabah Forest Industries Sdn. Bhd.(SFI) (Subsidiary of BPH) . . . . . Malaysia 97.8%
Manufacturing and marketing ofPulp, Paper and Timber Products
Principal investment
The following is the principal investment of the Group:
Name
Country ofincorporation andregistered office
Class and percentage ofownership interest and
voting power Field of activity
Avantha Power &Infrastructure Limited . . .
India, ThaparHouse, 124,Janpath, NewDelhi — 110001
Equity Shares(4.22%)
Power generation anddistribution
Principal Establishments
The following are the principal establishments of the Group:
Name and location Type of facility Tenure
District Chandrapur, Maharastra,India (Ballarpur) . . . . . . . . . . . . . . Manufacturing Freehold and leasehold
Bhadalwadi, Maharashtra, India(Bhigwan) . . . . . . . . . . . . . . . . . . . Manufacturing Leasehold (until 2090)
District Warangal, Andhra Pradesh,India (Kamalapuram) . . . . . . . . . . . Manufacturing Freehold
Sabah Forest, Malaysia (SFI) . . . . . . Manufacturing Leasehold (until 2094)
Marketing and communication strategy
The Group’s high quality products are supported by the well established BILT brand and the Group’smarketing and communication strategy is focused on growing this brand awareness. The recognition ofthe BILT brand as a “Superbrand” in the paper product category in India for the last six years is due, in
— 139 —

part, to the ability of the Group to target a variety of markets both through its targeted regionalcommunication strategy and its captive distribution network.
The “BILT” brand shall be licensed from BILT to BGPPL BGPPL for a period of ten years fromJuly 16, 2007 or as long as BGPPL remains a subsidiary of BILT. In order to capture and retain agreater share of the coated and uncoated wood-free paper market, the Group has taken steps todifferentiate its products through branding. The Group’s goal is to increase awareness of its productbrands in the Indian market and become the preferred brand for its customers.
Part of this effort has been to promote the “BILT” brand name through marketing and advertising. TheIssuer believes that the “BILT” brand is widely recognized throughout India and occupies a high statusamongst Indian brands. The Group has advanced this cross-product brand-building under theadvertising catchphrase of “BILT — IDEAS IN PAPER”. The Group has also promoted brandingwithin specific product categories. In the coated paper segment, the Group has organized productlaunch conferences across India to announce the new coated paper products in the BILT portfolio,including the “BILT Emperor” and “BILT Royal” brands. Its research indicates that these brands carryhigh name recognition in this product segment. The Group’s promotional efforts within the coatedpaper segment has also included highlighting the fact that the Group exports those brands to discerningoverseas markets, which has helped raise buyer perception of the quality of its coated paper.
The Group has also launched a number of Hi-Bright Maplitho brands, which are intended to diversifythe pricing and products offered by the Group. Brands launched by BILT are “Sunshine SuperPrinting”, “BILT Royal Print Plus”, “Magna Print” and “TA Maplitho NSD Premium” that have beenwell-received in the market. TA Maplitho NSD Premium is currently the single largest sellingHi-Bright Maplitho paper brand in India.
— 140 —

Competition
There are over 570 producers in the Indian paper industry, with production capacities ranging from lessthan 1,000 tpa to over 500,000 tpa. Of these, the ten largest producers accounted for 32% of totalindustry production in the year ended June 30, 2010. The Issuer believes that it is one of the largestproducers of blade coated wood-free and uncoated Hi-bright wood-free paper in India and, as a result,has the largest share of the blade coated and uncoated Hi-bright wood-free paper markets, with marketshares of approximately 51% and 24%, respectively, in year ended December 31, 2009. The followingtable sets forth the estimated production capacities of writing and printing paper generally for the tenlargest producers in India at March 31, 2011.
Group Production Capacity
(figures in ‘000)
BIGPH . . . . . . . . . . . . . . . . . . . . . . . . . . . . . . . . . . . . . . . . . . . . . . . . . . . . . . . . . . . . . . . . . . . . . 615Tamil Nadu Newsprint and Papers Ltd(1) . . . . . . . . . . . . . . . . . . . . . . . . . . . . . . . . . . . . . . . . . . 390Khanna Paper Mill(2) . . . . . . . . . . . . . . . . . . . . . . . . . . . . . . . . . . . . . . . . . . . . . . . . . . . . . . . . . 260The West Coast Paper Mills Ltd(2) . . . . . . . . . . . . . . . . . . . . . . . . . . . . . . . . . . . . . . . . . . . . . . . 250Century Paper& Pulp(2) . . . . . . . . . . . . . . . . . . . . . . . . . . . . . . . . . . . . . . . . . . . . . . . . . . . . . . . . 240BILT . . . . . . . . . . . . . . . . . . . . . . . . . . . . . . . . . . . . . . . . . . . . . . . . . . . . . . . . . . . . . . . . . . . . . . 232Andhra Pradesh Paper Mills Ltd. . . . . . . . . . . . . . . . . . . . . . . . . . . . . . . . . . . . . . . . . . . . . . . . . 225JK Paper Ltd(2). . . . . . . . . . . . . . . . . . . . . . . . . . . . . . . . . . . . . . . . . . . . . . . . . . . . . . . . . . . . . . . 180ITC Limited (2) . . . . . . . . . . . . . . . . . . . . . . . . . . . . . . . . . . . . . . . . . . . . . . . . . . . . . . . . . . . . . . . 146Abhishek Industries Limited . . . . . . . . . . . . . . . . . . . . . . . . . . . . . . . . . . . . . . . . . . . . . . . . . . . . 135
(1) Capacity for TNPL with respect to uncoated wood-free paper is 360,000 Mt, as compared to 300,000 Mt for the Group. Newcapacity of 155,000 tpa in January 2011 is considered for TNPL
(2) Capacity only for writing and printing paper grades
Source: Pöyry
With respect to uncoated wood-free paper production capacity in India in 2009 according to Pöyry, theGroup maintains the second largest capacity (300,000 tpa) behind TNPL (390,000 tpa) and ahead ofKhanna Paper Mill and The West Coast Paper Mills Ltd (260,000 tpa and 250,000 tpa, respectively).The Groups production capacity for coated wood-free paper is by far the largest in India (315,000 tpa)with JK Paper Ltd holding second position (50,000 tpa).
The Group anticipates that, as the Indian paper market grows and the barriers to foreign imports ofpaper are lowered, there will be consolidation in the industry as producers go out of business, areacquired by larger companies, or merge in order to become more competitive. As producers consolidateand become larger, and as they gain greater access to debt and equity financing in the internationalcapital markets or gain access to more advanced technology through strategic alliances, the Groupexpects that it will face greater competition. However, the Issuer believes that it will be able tomaintain its leadership position in the Indian coated and uncoated paper markets. Due largely to itsfirst mover advantages, established customer relationships and unique comprehensive distributionnetwork.
— 141 —
The SFI unit is the only domestic producer of uncoated wood-free paper in Malaysia and, for the yearended December 31, 2009, held a 28% market share of the market. The primary competition to theGroup in Malaysia stems from imports from Indonesia as well as from China and Thailand. Foradditional information concerning the competitive environment, see “Industry and Market Overview”.
Material Litigation
Save as described below, neither the Issuer nor any other member of the Group is or has been engagedin nor, so far as the Issuer is aware, has pending or threatened, any governmental, legal or arbitrationproceedings which may have, or have had during the 12 months preceding the date of this document, asignificant effect on the Issuer’s and/or the Group financial position or profitability.
Dispute with UNP Plywood Sdn Bhd
UNP Plywood Sdn Bhd (“UNP”) filed a claim against SFI for the alleged wrongful termination of twoagreements for the extraction and sale of timber dated June 28, 1993 and August 13, 1993. The claimsought specific performance and or damages of MYR 129 million from SFI. SFI had terminated thesaid agreements in August 1994 on the ground that they contravened s. 24(6) of the Sabah ForestEnactment 1968.
On February 23, 2007, the High Court of Malaysia agreed with SFI’s assessment and held that the twoagreements and the power of attorney entered into between UNP and SFI were illegal. UNP couldtherefore not enforce the agreements against SFI.
UNP appealed the decision of the High Court on March 20, 2007, and the Court of Appeal judged in itsfavor on February 27, 2008. SFI appealed against this decision but on September 11, 2009, the FederalCourt dismissed SFI’s appeal with costs. Following this final judgment, the case was remitted to theHigh Court of Kota Kinabalu for the assessment of damages. Hearing dates for assessment of damageswas fixed on March 7 to 11, 2011, but vacated as the parties were not ready. Hearing for assessment ofdamages is now tentatively fixed in July 2011.
Pursuant to the Amended Escrow Agreement dated March 10, 2008 between Lion Forest IndustriesBhd, JP Morgan Special Situation Asia Corp, Ballarpur Industries Limited, Ballarpur Paper HoldingsB.V and HSBC (Malaysia) Trustee Bhd, the full value of this claim was deducted from the purchaseconsideration payable to the previous owner of SFI and has been deposited by BPH into an escrowaccount. The appropriate amount will be released by the escrow agent upon confirmation that SFI isrequired to pay the said claim.
Dispute with Harapan Parmai Sdn Bhd
Harapan Parmai filed a claim against SFI seeking damages of approximately MYR 184 million for thewrongful repudiation of a timber sale agreement. The High Court of Malaysia struck out HarpanPermai’s claim on the ground that the claim was unsustainable as it was founded upon an illegaltransaction.
— 142 —

Harapan Permai filed a notice of appeal to the Court of Appeal against the High Court’s judgment. TheCourt of Appeal allowed the matter and the matter was fixed for full trial hearing in the High Court onMay 3-6, 2011 and May 18-19, 2011, but these dates were vacated. The High Court has yet to fix a newhearing date for trial.
Pursuant to an amended escrow agreement dated March 10, 2008 between Lion Forest Industries Bhd,JP Morgan Special Situation Asia Corp, Ballarpur Industries Limited, Ballarpur Paper Holdings B.V.and HSBC (Malaysia) Trustee Bhd, the full value of this claim was deducted from the purchaseconsideration payable to the previous owner of SFI and has been deposited by BPH into an escrowaccount. The appropriate amount will be released by the escrow agent upon confirmation that SFI isrequired to pay the said claim.
Dispute with the State of Maharashtra
The Group currently benefits from a contract between Ballarpur and the Government for the State ofMaharastra with respect to the extraction of bamboo from bamboo and teak forests which areapproximately 200 km from the Ballarpur unit. The contract commenced in March 2004 and expires in2014. It provided for a fixed royalty (price) of INR 650 per Mt for the first five years with escalationof 5% per annum thereafter and required Ballarpur and the Ballarpur unit to extract 180,000 tonnes ofbamboo each year if such quantity was available for harvesting. In 2004, the price for the first fiveyears was raised by mutual agreement between the parties to INR 800 per Mt.
The price paid under the contract was revised by Government of the State of Maharastra order onJuly 15, 2009 for the entire life of the contract, including previously harvested bamboo and paidroyalties, to INR1,495 per Mt with an annual escalation of the higher of 5% or the wholesale priceindex. In addition, order by the Government for the State of Maharastra made provision to re-determinethe rate after five years (2010-2011).
The rate demanded by the government was judged by the Group to be disadvantageous to the marketand as a result in the bamboo cutting season (normally January to June) for 2009 and 2010 the Groupcut much less bamboo under the contract compared to prior periods.
In September and October 2009 the Group received demands from the district forest officersresponsible for collecting the bamboo royalties for retrospective revision to the rate, failure to cut themaximum bamboo under the contract (and so royalty) and penalty interest. In total these demandsamount US$ 17.8 million.
The Group has disputed the order and the matter is before the Bombay High Court. By its order datedOctober 8, 2010, the High Court has ruled that the Group should recommence cutting bamboo and thatthe following should be paid for the year ended June 30, 2010 (based on the amount actuallyextracted), being: INR800 per Mt to the Government for the State of Maharastra; INR200 per Mt bedeposited into the court; and INR500 per Mt be furnished as surety to the court.
The Group has not made any provision in relation to the retrospective bamboo royalty payment as itbelieves it has a strong case to be made before the court.
— 143 —

Arbitration petition by M/s. Sai Rayalaseema Paper Mills Limited
M/s. Sai Rayalaseema Paper Mills Limited has filed an arbitration claim petition against BGPPLclaiming breach of the agreement dated April 15, 2009 for the supply of pulp from the respondent tothe petitioner. The petitioner has alleged that respondent has not honored his obligations under theagreement on three accounts, namely (i) it has failed to supply the goods in time and there was a delayin the supply of goods; (ii) the quantity as envisaged under the agreement were not supplied, and(iii) the last two consignments supplied were of inferior quality, not suitable for the petitioner tomanufacture its finished products. As a result of such breach, the petitioner alleges that it has sufferedirretrievable and substantial damages and has therefore claimed an amount of Rs. 52,470,017 asdamages for such breach of the agreement. This matter is currently pending.
BGPPL has filed its counter affidavit against the statement of claim of SRPM. In the counter claimBGPPL has denied all the allegations of the SRPM.
Claim by the Forest Department, Government of Andhra Pradesh
The Divisional Forest Officer of the Forest Department of Andhra Pradesh has claimed an amount ofRs. 47.34 million by letter dated January 2, 2009 and by a reminder notice dated November 1, 2010towards royalty for unlifted quantity of material from BGPPL. BGPPL has replied the letter on26th Feburary 2009 and also to the reminder by a letter dated November 26, 2010 claiming refund ofan excess payment due to BGPPL of Rs. 4.33 million. No reply was received from the ForestDepartment and there is no further correspondence in this regard.
Writ petition by Balasaheb Krishnaraj Dhumal
Mr. Balasaheb Krishnaraj Dhumal and another individual filed a writ petition in the High Court ofMumbai against the Union of India, the State of Maharashtra and its various statutory authorities andSinar Mas India in 1997. In this petition, the petitioners alleged that the trial-run of the Bhiwan unit(which was acquired by BILT in 2001 and transferred to BGPPL in 2007 by a Scheme of Arrangement)by Sinar Mas India had not been in compliance with various statutory clearances that had been grantedby authorities of the State of Maharashtra, including inter alia environmental clearances, the consent toestablish granted by the state pollution control board, and clearances to draw water from a localreservoir of the Ujjaini river from the Department of Irrigation, government of Maharashtra. Thepetitioners prayed inter alia, for appropriate decrees and directions from the High Court of Mumbaisetting aside the aforementioned clearances and approvals granted to Sinar Mas India, prohibiting SinarMas India to commence either trial or final production from the Bhiwan unit and directing Sinar MasIndia to carry out a detailed environmental impact assessment of the Bhiwan unit.
Writ petition by Maneka Gandhi
Ms. Maneka Gandhi has filed a writ petition dated February 17, 1997 in the High Court of Mumbaiagainst the Union of India, the State of Maharashtra and its various statutory authorities and Sinar MasIndia for its Bhigwan unit (which was acquired by BILT in 2001 and transferred to BGPPL in 2007 by
— 144 —

a Scheme of Arrangement). In this writ petition, Ms. Gandhi has alleged that the operations of theBhigwan unit could lead to acute water shortage, degradation of land, destruction of local drainagenetworks and pollution and depletion of the water resources of Bhigwan area. Ms. Gandhi has alsoalleged that the State of Maharashtra and various statutory authorities have granted various clearancesto the Bhigwan unit including, among others, environmental clearances and the consent to establish theunit without considering the environmental impact of this unit. It was alleged that the trial run of theunit had been in violation of the terms and conditions of the aforementioned orders. Ms. Gandhi hasprayed, amongst others, for appropriate decrees and directions from the High Court of Mumbai settingaside the aforementioned clearances and approvals granted to Sinar Mas India and prohibiting SinarMas India to commence either trial or final production from the Bhigwan unit.
The High Court of Mumbai has, by a subsequent interim order dated March 20, 1997, allowed trialproduction to commence at the Bhigwan unit subject to the then Managing Director of Sinar Mas Indiaproviding an undertaking that the unit would not discharge any industrial effluents outside the factorypremises during the trial run, as well as weekly inspections by the Maharashtra Pollution ControlBoard of the unit. The matter is currently pending for admission before the High Court of Mumbai.
Insurance coverage
The Issuer believes that the Group maintains adequate insurance coverage for its facilities with respectto its operational and commercial risks. The Group’s coverage includes fire and special perils,earthquake, furniture and fixtures, machinery and stocks of materials, as well as a marine policy fortransit and movement of goods. Insurance for the various units is managed by a centralized departmentlocated at corporate office. This department develops the insurance strategy of the Group, identifiesrisks and insurance solutions and communicates with the units on these issues.
The majority of the properties and machinery are insured on reinstatement or replacement value basisand all goods in transit are insured.
Information technology
In order to keep pace with its increase production capacity, the Group has further strengthened itssupply chain systems to enhance its access to both its domestic and export markets. The Group beganimplementation of ARIBA applications in 2009. Through this, the Group has implemented astreamlined on-line system for customers and distributors, covering all aspects of sourcing cycle of asupply chain, from request creation to contracts and compliance through purchase requisitions. Thiswas a commitment designed to achieve cost effectiveness, ease-of-use and to enhance organizationalproductivity. The commissioning of the system was completed in August 2009.
As part of its overall IT strategy, the Group additionally plans to upgrade the Group’s systems to afully integrated financial reporting system, via a phased implementation. This upgraded system willserve to further automate the reporting and consolidation process.
The Issuer believes that the Group’s advanced technology capabilities relative, in particular, to thoseof its competitors in its domestic markets, provide the Group with an advantage with respect to
— 145 —
operational management and customer service. The Group’s system provides the ability to trackproduction and capacity levels as well as the status of customer orders, which in turn enables theGroup to provide high quality products and to maximize customer satisfaction.
Research and Development
Each of the units has in-house research and development facilities that focus on costs reduction,product design, production process, technology development and environmental management.
Some of the important research and development programs which have yielded significant benefits tothe Group are:
Š improving in pulp yield through process optimization and the use of pulping additives;
Š introducing of alkaline sizing which reduces the acidity of the paper, increasing opacity,durability and print performance of the paper;
Š using new age fillers (such as precipitated calcium carbonate (“PCC”) and ground gradecalcium carbonate (“GCC”) for improvement in product quality and reduction in productioncost;
Š developing new products (lightweight coated paper (“LWC”), Digital Printing paper, MagnaPrint);
Š reducing of sizing cost and optimizing coating slip formulation for cost reduction; and
Š modifying of pulp bleaching sequence for optimizing bleaching chemical consumptions.
Environmental regulation and initiatives
Regulation
The paper and pulp industry in India is subject to a wide range of Governmental laws and regulationsregarding pollution control, including, variously:
Š Water (Prevention & Control of Pollution) Act, 1974, as amended in 1978 and 1988
Š Water (Prevention & Control of Pollution) Cess Act 1974, as amended in 1991
Š Air (Prevention & Control of Pollution) Act 1981 as amended in 1991
Š Environment (Protection) Act 1986
Š Hazardous Wastes (Management & Handling) Rules 1989 as amended in 2000
— 146 —

Š Manufacture, Storage and Import of Hazardous Chemicals Rules 1989
Š Environment Impact Assessment Notification 1994
Š Gas Cylinder Rules 2004
Š Static and Mobile Pressure Vessels (Unfixed) Rules 1981
There are several agencies that play a key role in environmental regulation in India. The Ministry ofEnvironment & Forests (“MOEF”) administers and enforces laws and regulations at a national level.The Central Pollution Control Board develops regulatory standards at the national level but has noenforcement powers. Different Pollution Control Boards at the state level implement and administerthe national level laws and regulation, and also monitor performance and compliance by industries andcompanies.
The Group has achieved the following environmental certifications.
Unit Environmental Certification
Bhigwan . . . . . International Organization for Standardization 14001:2004, FSC — COCBallarpur . . . . International Organization for Standardization 14001:2004, FSC — COC, FSC — Controlled
WoodKamalapuram International Organization for Standardization 14001: 2004SFI . . . . . . . . . FSC-Controlled Wood Forest Certification and Verification of Legal Origin (VLO)
Certification
FSC is the Forest Stewardship Council. ISO is the International Organization for Standardization
The Group has consistently focused on meeting or exceeding the environmental regulations to which itis subject and maintaining efficient operations. Through such a focus, the Group has won a number ofawards, including the National Award in 2010 for pollution prevention, the gold award forenvironmental excellence from Greentech in 2009 and the National Award in 2008 for excellence inenergy management.
Initiatives
The Group is committed to reducing environmental pollution. The Group treats all effluents at itsplants and the Group has also made significant investments in lowering the emissions associated withmanufacturing its products.
The Group has been upgrading its facilities from an environmental perspective. After the completion ofthe expansions of the Ballarpur unit and the SFI unit, the Issuer believes that both of these units areexpected to produce ECF pulp (thereby using much less chlorine in the bleaching process and reducingdioxins from mill effluents and with it reducing the threat to water courses and to the ozone layer). TheKamalapuram unit will continue to use elemental chlorine as the adapted process for the manufactureof rayon grade pulp mandates use of elemental chlorine and sodium hypochlorite for viscosity controland correction.
The Group frequently commissions environmental, health and safety compliance reviews of its pulpand paper mill operations.
— 147 —

Health and safety
The Group places a high priority on providing a safe working environment to all employees and placesa particular focus on training and awareness of best safety practices. Employees are given safetytraining on the operation of equipment and safe working procedure. Safety audits are regularlyconducted to identify any risk-prone areas and ensure that corrective actions are taken. All units areequipped with occupational health centers with full time doctors, medical personnel and ambulanceservices to provide 24 hour medical facilities to employees and those living on the grounds.
All of the Group’s units operate in accordance with established best practices. The Ballarpur,Kamalapuram and Bhigwan units are Certified Integrated Management System of OHSAS 18001:2007(“OHSAS”) certified. Management at the SFI unit work in close interaction with the government inorder to implement and maintain safe working practices.
This focus on health and safety have contributed to a significant reduction in accidents, from 67 in theyear ended June 30, 2008 to 17 and nine in the years ended June 30, 2009 and 2010, respectively. TheGroup had two, two and one fatality in the years ended June 30, 2008, 2009 and 2010, respectively.The Group had five fatalities from July 2010 to May 2011.
Corporate social responsibility
The Group seeks to deliver value to stakeholders while maintaining its position as a positive social andeconomic force in its communities. A key element of this endeavor is the Group’s structured corporatesocial responsibility (“CSR”) program, which the Issuer believes serves the community and is intrinsicto the sustainability of the Group’s business strategy. The Group is committed to developing itsbusiness towards ecological, social and economic sustainability. All of these are recognized as sharedresponsibilities within the Group, enabling the continuous improvement of its operations.
As the Indian economy grows rapidly, the critical challenge is to create inclusive development. Tomeet this challenge, it is very important to provide equal opportunities to all citizens. As stakeholdersin the economic prosperity of country, the Indian corporate sector has to play a vital role in this task.The Group has therefore focused on providing the opportunity for all members of the community toachieve their potential without any discrimination. The Group’s operations are located in remote areasof country where access to resources and economic opportunity is often limited. Many people in thecommunities around these operations come from marginalised backgrounds. The Group’s CSRactivities are often focused on attempting to include such groups in the development process presentedby the economic growth in the country.
As the Group’s manufacturing units are based in remote parts of the country, the Group’s CSRinitiatives become even more important. The Group’s CSR activities are broadly organized as follows:organizing communities; assisting in capacity building for livelihood programs; undertaking concreteprograms to convert the capacities into action and supporting the communities with active health &education programs.
— 148 —

Organizing communities
The Group recognizes that the empowerment based model of development needs strong communityinstitutions. Today the Group’s development programs reach more than 300,000 people living in morethan 100 villages around the units. Over the last ten years the Group has concentrated on improving thelives of marginalized communities. So far, 700 Self Help Groups have been created, which haveworked directly with more than 11,000 women.
The Group has also continually worked with the youth since the inception of its structured CSRprogram. More than 100 youth groups have been formed and the youth are engaged in variouseconomic activities. The group has also provided skill development training to more than 1200 youth,and now they are engaged in several income earning occupations (jobs or services as well as owningmicro enterprises.
Assisting in capacity building
The Group has conducted a series of training and capacity building programs to enable communitybased organizations to take up a larger role. These have included vocational training andentrepreneurship training on various skills. Youths have been trained in skills related to motor driving,welding, electrical repair, motor winding, screen printing and plumbing. This has provided the youthswith better skills with which to secure gainful employment.
Programs
The Group has focused on starting and maintaining a number of programs for the community, includingthose focused on gender and education issues.
Livelihood Creation
The Group’s focus on livelihood creation for the communities has ensured financial sustainability ofmore than 7,500 families. Various activities on livelihood creation (both farm based and off-farm) haveenabled people to have dependable sources of income.
Health
Achieving health for all is critical to overall development and progress. The health interventions of thegroup has led to ensuring 100% immunization for the children & pregnant mothers. This has impactedreduction of infant mortality rates and maternal morbidity rates significantly.
Gender Equality and Affirmative Action
Empowering women to be at the center stage of decision making in society will accelerate the pace ofdevelopment. The Group’s women’s empowerment projects are focused on collective mobilization andfinancial and social inclusion. Women are an integral part of the rural economy and need to beempowered to develop their full potential. The Group has worked very closely with women to enable
— 149 —

them to earn income from both farm based and off-farm economic activities. Microfinance was madeavailable to them through Self Help Groups that helped assure alternative sources of income to thewomen both in the rural and urban areas. Today, more than 700 women are earning a regular incomeranging from 1,200 rupees per month to 3,500 rupees per month from these activities. This is morethan 200% increase compared to the base period of the year ended June 30, 2003, when the Group hadstarted the intervention.
Initiative to Encourage Nationwide Primary Education
The Group believes that a sound education has the potential to accelerate development and is thebuilding block of any society. The Group-supported education initiatives have reached out to more than150,000 children across the country. The education programs include non formal classes in the form ofbridge courses for early school-leavers, community libraries, and classes for children who requirelearning assistance. More than 19,000 children have been mainstreamed to formal schools. Also, theGroup has taken up Mobile Computer Literacy program which have enabled more than 16,000 studentsto have basic computer literacy. These interventions have enabled reduction of drop-out rates fromschools, improvement in performances in the exams as well as the proportion of children who cancomplete secondary level of education.
Prevention of HIV/AIDS
The prevention of HIV/AIDS program was launched in the 2005. The focus of the program has been tocreate awareness about the disease. The Group has involved employee volunteers to deliver thisprevention message. About 200 employees are active in this campaign as volunteers and make time tospread the message amongst their peers and in the community through one on one and one to groupsessions. These volunteers are trained by the Group and their knowledge is periodically refreshedthrough refresher courses. Mass awareness programs are also conducted in schools, community fairsand any public gatherings. All these efforts are to ensure that HIV not only does not spread but alsothat the stigma associated with the disease is also lessened, so that people feel comfortable to getthemselves tested and disclose their HIV positive status. This can ensure better medical treatment forthem when required. This program has also focused on the overall health of the individual and somesupport programs like de-addiction, stress management and family counseling have been introducedand have been successful. In August 2007 the Group started the first Anti-Retroviral Therapy Center atthe Ballarpur unit in a public-private partnership with the National AIDS Control Organization(NACO) and with technical support from CII. This center caters for the needs of the HIV positivepersons in the community who need treatment and drugs to be able to prolong their life. The center isthe second one in the country to be started in public-private partnership. It serves the population livingnot only in Chandrapur but also in four districts around Chandrapur. The Group has started the secondART center in Koraput, in the State of Orissa. These two ART centers have enabled more than 1,800people to avail treatment for the disease and have ensured that more than 95% of the patients haveadhered to the treatment.
— 150 —

Corporate Social Responsibility Awards
The Group has received a significant number of awards for its commitment to corporate socialresponsibility as described above, including:
Š the Golden Peacock Global Award for Corporate Social Responsibility in Emerging Economies2007;
Š the 2007 Intel AIM Corporate Responsibility Award;
Š the TERI Corporate Award for Business Response to HIV/AIDS in 2008; and
Š the Level 4 CSR Company in a rating given by Karmayog for the 2008-2009 and 2009-2010.
Employees
The following table details the average numbers of the Group’s employees by function as at June 30,2008, 2009 and 2010 and for the nine months ended March 31, 2011:
Function As at June 30 As at March 31
2008 2009 2010 2011
Management . . . . . . . . . . . . . . . . . . . . . . . . . . . . . . . . . . . . . . . . . . . . . . . . 680 724 689 766Non Management . . . . . . . . . . . . . . . . . . . . . . . . . . . . . . . . . . . . . . . . . . . . 4,701 4,626 4,725 4,438Contract . . . . . . . . . . . . . . . . . . . . . . . . . . . . . . . . . . . . . . . . . . . . . . . . . . . . 2,133 1,965 2,768 2,823Total . . . . . . . . . . . . . . . . . . . . . . . . . . . . . . . . . . . . . . . . . . . . . . . . . . . . . . 7,514 7,315 8,182 8,027
The following table details the average numbers of the Group’s employees by location as at June 30,2010, 2009 and 2008 and for the nine months ended March 31, 2011:
Location As at June 30 As at March 31
2008 2009 2010 2011
Ballarpur . . . . . . . . . . . . . . . . . . . . . . . . . . . . . . . . . . . . . . . . . . . . . . . . . . . 3,115 3,050 3,466 3,319Bhigwan . . . . . . . . . . . . . . . . . . . . . . . . . . . . . . . . . . . . . . . . . . . . . . . . . . . 965 1,195 1,413 1,417Kamalapuram . . . . . . . . . . . . . . . . . . . . . . . . . . . . . . . . . . . . . . . . . . . . . . . 1,548 1,096 1,129 1,101SFI . . . . . . . . . . . . . . . . . . . . . . . . . . . . . . . . . . . . . . . . . . . . . . . . . . . . . . . . 1,886 1,974 2,174 2,190Total . . . . . . . . . . . . . . . . . . . . . . . . . . . . . . . . . . . . . . . . . . . . . . . . . . . . . . 7,514 7,315 8,182 8,027
Certain of the Group’s employees are represented by a labor organization. The most recent labor-related work stoppage occurred in 2008, resulted in a temporary closure of the Kamalpuram unitproduction facility for 17 days. The Group considers its relations with its employees to be good.
The SFI unit currently employs one Mandor and intends to employ an additional four Mandors.Directly translated, Mandor means foreman or supervisor and is a role given to one of the foreign
— 151 —

workers who demonstrates the ability to lead a large team. This system was historically introduced toalleviate differences in language, culture and understanding between Malaysian supervision andforeign workers.
The majority of the Group’s employees are housed on-site with their families.
Properties
The following table sets forth certain information concerning the Group’s principal properties.
Location Area Primary Activities or Use
Nature ofGroup’sInterest
District Chandrapur, Maharashtra(Ballarpur) . . . . . . . . . . . . . . . . . . . . . 205.85 hectares Manufacturing Freehold
District Chandrapur, Maharashtra(Ballarpur) . . . . . . . . . . . . . . . . . . . . . 3.90 hectares Wood collection center/other uses Leasehold
Bhadalwadi, Maharashtra (Bhigwan) . . . 345 hectares Manufacturing LeaseholdDistrict Warangal, Andra Pradesh
(Kamalapuram) . . . . . . . . . . . . . . . . . . 558.94 acres Manufacturing FreeholdSabah, Malaysia . . . . . . . . . . . . . . . . . . . 1178 hectares Manufacturing/Housing LeaseholdSabah, Malaysia . . . . . . . . . . . . . . . . . . . 288,138 hectares Forest land and Plantations Leasehold
The Group’s property leases extend for various periods. In addition, in accordance with itsrequirements from time to time, the Group leases and occupies monthly tenancies in various premisesused for offices and other purposes relating to its business.
— 152 —

INDUSTRY AND MARKET OVERVIEW
The information presented in this section has been extracted from publicly available documents andreports prepared by third party consultants, including a study prepared by Pöyry in February 2011,which have not been prepared by the Joint Lead Managers or any of their respective affiliates oradvisors. References to a particular year in “Industry” are to the year ended on December 31, 2010.Investors should read the study prepared by Pöyry, which is included elsewhere in this OfferingCircular, along with the disclaimer included therein and “Risk Factors — Some of the informationincluded in this Offering Circular has been prepared by Pöyry and may be inaccurate or outdated”.
The Global Paper Industry Overview
The global paper industry can broadly be divided into three segments: paper and paper board,newsprint and tissue. Writing and printing paper is a subsegment of paper and paper board, with coatedand uncoated wood-free paper falling under the writing and printing paper segment.
The following graphic sets forth these different paper segments and typical end-uses for such paper:
Paper Industry
Paper and Paper Board Newsprint Tissue
Glazed Standard
Writing & Printing Paper
Uncoated Paper Coated Paper
Uncoated Wood Free
Uncoated Mechanical
PBS*
Bond Paper
Letter Heads
Maplitho Cream Wove Copy Paper
Coated Wood Free
Coated Mechanical
C1S & C2S LWC
-School books-Premium Notebooks
-Annual Reports-Mailers-Movie Posters-Dictionaries-Diaries-Calendars
-Text Books-Notebooks-Leaflets-Scribble Pads-Low End Magazines
-Copier Paper-Desktop Printer Paper
-Calendars-Catalogues-Promotional Material
-Posters-Labels-Magazines-Greeting Cards-Wedding Cards
-Magazines-Newspapers-Publishings
Packaging Speciality Paper
-Décor Paper-Insulating Paper-Grease Proof-Carbon Paper-Cheque Paper-Security Papers
Container Board Grey back/White back/FBB/SBS/Others
* Premium Business Stationery
The global paper industry is cyclical, capital intensive and highly competitive with many participants.Long-term demand growth for paper is primarily driven by expansion of the world economy,demographic trends and technological developments.
Although the industry is characterized by intense price competition, individual companies are able tocompete on factors other than price alone, including the ability to deliver consistent and high-qualitypaper products in a reliable and timely manner.
— 153 —

Due to the large amount of capital required and the long lead-times between the planning andcompletion of either a new facility or the upgrading of an existing production facility, productioncapacity and supply cannot be readily adapted to changes in demand. As a result, a decline in demandcan result in industry overcapacity which can lead to decreasing product prices.
Conversely, overcapacity often leads to under-investment which may lead to insufficient productioncapacity when demand recovers. In such circumstances, or in circumstances where demand increases asa result of economic GDP growth, low levels of supply compared to demand may result in increasedprices.
Within the global paper industry, the developed market and the developing market face fundamentallydifferent challenges. Developed and mature markets are facing weak demand, overcapacity and pricingpressure as a result of electronic media substitution, low population growth and subdued GDP growthrates. To address the overcapacity market participants are now focused on further consolidation andcapacity shutdown to restore industry supply and demand balance. Between 2008 and 2010, there havebeen some significant paper production capacity withdrawals amongst developed economies and Pöyryprojects that growth in paper production capacity will remain flat or decline in the developedeconomies of North America and Western Europe over the next 10 years.
On the other hand, Pöyry expects developing markets to continue to experience strong GDP growth andfavorable demographic changes, requiring additional investment in increased production capacity tomeet demand. For example, in China, rapid economic growth and government incentives have spurredmassive investment in the pulp and paper industry. As a result, in recent years, China’s paper capacityhas increased considerably allowing China to move from a net importer to a net exporter of coatedwood-free paper. Similarly, in India, the paper market has been expanding and in the year endedDecember 31, 2009, for example, writing and printing paper demand increased by 6% and capacity hasbeen increasing in line with this demand.
Writing and Printing Paper
The Group specializes in the production of uncoated and coated wood-free paper (both of which fallwithin the broader writing and printing segment).
Uncoated wood-free paper is primarily produced from chemical pulp. Uncoated wood-free paper isgenerally classified as “maplitho” and “creamwove” and mainly includes branded and unbrandedcopier paper and printer paper. The segment does also include a wide range of speciality and higherquality grades, including colored cut-size paper, label and release, security and other customizedapplications. There is a growing market for specialized and higher quality uncoated grades, forexample Hi-Bright paper, the latter being the core focus for the Group within the uncoated wood-freesegment. Uncoated wood-free paper has a broad customer base including paper merchants, officeequipment manufacturers, office suppliers, retailers and printers.
Coated wood-free paper is generally considered a superior quality printing paper to uncoated wood-free paper. It is achieved by applying a thin layer of pigment coating on the uncoated wood-free paper,which makes the surface more even and improves the printing quality. Coated wood-free paper is
— 154 —

therefore used, among other things, for high-end brochures, annual reports, advertising materials, artbooks and promotional products. Coated wood-free paper is made mainly from chemical pulp and canbe coated on one or both sides.
Rayon grade pulp
In addition to producing pulp principally for use in the Group’s paper production facilities, the Groupspecializes in producing pulp for sale outside the Group in the rayon grade pulp segment. Rayonindustries produce viscous fiber which requires pulp of a significantly higher quality than paper gradepulp.
The relative high purity of rayon grade pulp and viscous fiber make the product ideal for conversioninto textiles and non-woven products for household, hygiene, medical and industrial absorbentproducts. The end-uses of rayon grade pulp are different to hardwood pulp.
The production process behind rayon grade pulp is more complex than for paper grade pulp, resultingin a typically more valuable final product. The pre-hydrolysis process, prior to the pulping of the woodchips, is one of the ways of achieving the desired high quality pulp. Standard pulp contains certaincarbohydrates, which interfere with the chemical conversion of cellulose into rayon products.Consequently, the practice of exposing the wood chips to acid hydrolysis prior to alkaline pulping wasdeveloped in order to reduce the relevant carbohydrate content and facilitate the conversion ofcellulose.
This pre-hydrolysis process is usually carried out by direct steaming, whereby high temperature steamreleases organic acids from the wood and other material in the wood is hydrolyzed into soluble sugars.The subsequent pulping stage produces a product suitable for rayon industries.
According to Pöyry, global demand for rayon grade pulp is expected to grow from 4.2 million Mt in2009 to 5.8 million Mt in 2020 (representing an annual compound growth rate of 2.9%). Demand forthis product in India for the year ended December 31, 2010 was 403,300 Mt, while production in Indiawas approximately only half of that figure.
Expected Demand for Paper in India
Consistent with trends observed in international paper markets, the demand for paper in India is closelylinked to growth in GDP. As the economy grows, economic activities such as advertising and industrialproduction also tend to expand, which increases the consumption of paper products. In addition,demand for paper is closely linked to demographic trends such as population levels, disposable incomelevels and spending patterns as well as literacy rates. The annual rate of real GDP growth in India was7.4% in the year ended March 31, 2010 and it is expected that GDP in India will continue to grow atsimilar rates in the future. According to the CIA World Factbook, India is projected to be the 3rdlargest global economy by 2050 moving up from its current position of 5th. It is also expected that therecent trend of economic liberalization in India will further increase GDP growth rates in the nearfuture, which should result in increased demand for paper.
This growth should have significant positive effects on increased per capita income, disposable incomeand customer purchasing power in India. A shift in discretionary spending patterns from 52% to 70%
— 155 —

between 2005 and 2025 and a substantial increase in India’s middle class are key drivers of increasesin per capita disposable income. India’s middle class is expected to increase by nearly 60 millionhouseholds by 2020, with an increase in the urban population from 29% in 2005 to 37% in 2025 whileIndia’s population of a working age is projected to be the largest by 2050. Further, governmentspending on education was estimated to total US$ 10.7 billion from 2002 through the end of 2011 ofwhich US$ 6 billion is on paper related products. This increased expenditure, along with other socialand demographic trends, are expected to impact literacy rates significantly and the demand for paperproducts such as books and notebooks during the next decade.
As a result, per capita consumption of paper and paperboard (including coated and uncoated wood-freepaper) from 2009 to 2020 is expected to increase by approximately 66% from approximately 8.4 kg peryear to approximately 13.9 kg per year. In terms of total consumption, this translates to approximately10.1 million tonnes in 2009 and 19.2 million tonnes in 2020, representing a compound annual growthrate of 6.0%, as compared to 4.5% in China, 0.5% in North America The projection for demand inIndia is based primarily on the projection of sustained economic growth at approximately 8%, as wellas population growth of 1.3% per year through 2020 (Source: Pöyry).
Expected demand for Coated Wood-Free, Uncoated Wood-Free and rayon grade pulp in India
According to Pöyry, demand for coated and uncoated wood-free paper is expected to increase at highrates as a result of expected growth in advertisement, marketing and other high quality printing by thecorporate and public sectors in India as the Indian economy matures.
The coated wood-free grade has historically been one of the fastest-growing industry segments anddemand for coated and uncoated wood-free paper in India is expected to grow 9.3% and 6.4%,respectively per year from 2009 through 2020. Importantly growth rates for the Group’s primaryproducts, blade coated wood-free paper and Hi-bright uncoated wood-free paper are expected to reachhigher growth rates of 10.2% and 8.1% during this period, respectively. Introduction of these higherspecification paper qualities with better print attributes is expected to lead to increased market sharewithin the overall coated and uncoated woodfree segment on behalf of older paper making and coatingtechniques. The Group is the largest producer of coated wood-free paper in India, measured bycapacity, with a capacity of 315,000 tpa compared to a capacity of 50,000 tpa of its next closestcompetitor. According to Pöyry, the demand for coated wood-free paper within India is 370,000 Mt forthe year ended December 31, 2009.
The Group is the largest producer of Hi-bright uncoated wood-free paper in India with 24% of Indiancapacity for the year ended June 30, 2010 and it particularly focuses on the higher quality grades.
The Group benefits from being the only major player in India that produces both coated and uncoatedpaper products. This will allow it to take advantage of pricing opportunities in either segment.
— 156 —

Estimated growth rates and estimated production tonnages of segments of the Indian paper market areset forth in the table below.
Estimated Demand Tonnages
CAGR(1)
2001- 2009Years*
2009-2010Years*
2010-2011(2)CAGR
2009-2010Years*
2014-15(3)CAGR
2010 to 2015
(in millions of tons, except percentages)
Writing and printing paper . . . . . . . . . . . 7.9% 3.3 3.52 6.7% 5.32 8.6%Uncoated wood-free . . . . . . . . . . . . . . . . . . 7.8% 2.89 3.06 5.9% 4.56 8.3%Hi-bright . . . . . . . . . . . . . . . . . . . . . . . . . . . 8.6% 0.55 0.60 9.1% 0.9 8.4%Copy Paper . . . . . . . . . . . . . . . . . . . . . . . . . 16.1% 0.37 0.43 16.2% 0.71 10.5%Other uncoated wood-free . . . . . . . . . . . . . 6.6% 1.97 2.04 3.6% 2.95 7.7%Coated wood-free . . . . . . . . . . . . . . . . . . . . 8.7% 0.41 0.46 12.2% 0.76 10.6%Industrial . . . . . . . . . . . . . . . . . . . . . . . . . . 5.3% 4.51 4.93 9.3% 6.49 5.7%Newsprint . . . . . . . . . . . . . . . . . . . . . . . . . 6.4% 1.54 1.67 8.4% 2.32 6.8%Specialty & Others . . . . . . . . . . . . . . . . . . 4.3% 0.73 0.71 -2.7% 0.85 3.7%
Total . . . . . . . . . . . . . . . . . . . . . . . . . . . . . . 6.2% 10.08 10.83 7.4% 14.98 6.7%
(1) compound annual growth rate
(2) estimated
(3) forecast
* estimated demand in million tonnes
Source: Pöyry
The rayon grade pulp segment accounts for 2% of pulp production within the global pulp industry(excluding recycled pulp). The total global annual rayon grade pulp production has grown from3.2 million tonnes in 2000 to 4.2 million tonnes in 2009 (Source: Pöyry). Indian rayon grade pulpproduction in 2009 was approximately 202,860 tonnes, all of which was consumed in India due toexport restrictions on the product.
Key Characteristics of the Paper Industry in India
India’s paper market is primarily supplied by domestic producers
The Indian paper market has to date not attracted a major influx of international competitors and hasconsequently remained dominated by local producers.
In the 1970s, excise concessions were given to small agro based mills, which resulted in a rapidincrease of small mills and capacity. These domestic producers have historically been able to largelysatisfy demand in the Indian market.
Today, the Indian market is still small by international standards with total demand of approximately10.1 million tonnes annually and international competitors have neither been particularly incentivizedto enter the Indian market nor been drawn to enter by a lack of domestic capacity.
Even as the market grows, customer fragmentation, lack of established paper merchants, complicatedlogistics and small average order sizes have acted as effective barriers to entry. These factors require a
— 157 —

producer to have sophisticated administrative and logistics systems including a network of mills to dealwith the spread and number of customers and the lack of large independent merchants preventsinternational competitors from rapidly building up a meaningful market position in India.
India’s paper market, particularly with respect to uncoated wood-free paper is not impactedsignificantly by imports. The uncoated wood-free paper market in India is generally domestic as thedomestic capacity is currently sufficient to serve the demand. Additionally, the fragmented market inIndia has many small order sizes which would not be economical to service through imports (andimport duties present a further disincentive). Nearly 99% of uncoated wood-free paper consumption ismet by domestic production. In 2009, total imports of uncoated wood-free paper were an estimated20,000 tonnes and total exports of uncoated wood-free paper were an estimated 141,000 tonnes(Source: Pöyry).
In contrast, imports in the coated wood-free paper segment are more significant. In 2009,approximately 35% of coated wood-free paper purchased in India was estimated to be imported,primarily due to the lack of higher quality coated woodfree capacity available from domesticproducers.
Supply of fiber for paper pulp is limited
Pulp used to make paper is primarily produced from wood fiber. The pulp and paper industry in Indiahas historically relied on Government-controlled sources for this raw material. However, theavailability and reliability of these sources has been reduced as Government forest managementpolicies have become stricter. In addition, land use regulations in India prevent the privateestablishment of large forest plantations. It is therefore expected that there will be continuing shortagesof forest-based wood fiber in India.
Fragmented production and customer structure
The Indian paper producers broadly fall into two tiers. The primary tier consists of the larger producerssuch as the Group that have larger, higher-quality mills with superior distribution networks whencompared against the mills and distribution networks of those smaller producers in the secondary tier.The Indian paper industry consists of over 570 producers, with production capacities ranging from lessthan 1,000 tpa to over 100,000 tpa. Of these, the ten largest producers accounted for approximately32% of total Indian industry capacity in 2010 and the Group’s capacity accounted for approximately5.7%. Of the domestic paper producers approximately 95% have capacity of less than 50,000 tpa. Thefragmentation of the Indian paper industry can be traced to Government excise concession in the 1970swhich encouraged the proliferation of many small capacity mills.
There is also a fragmented, large and geographically diverse customer base for coated wood-free paperand uncoated wood-free paper in India. The long distances within India and the considerable cost oftransportation makes it more economical to operate a network of smaller units that are more flexiblecompared to a single large scale mill.
— 158 —

The following table sets out the Group’s sales of coated wood-free paper and uncoated Hi-bright wood-free paper to its customers based on size of the customer for the nine months ended March 31, 2011:
Coated Wood-free Paper Uncoated Hi-Bright Wood-free Paper
Number ofcustomers
(approximate)Percentage of total
SalesNumber of customers
(approximate)Percentage oftotal Sales
Top 10% customers . . . . . . . . . . . . . . . . . . . . 10 14% 10 6%Other large customers . . . . . . . . . . . . . . . . . . 125 21% 125 21%Medium and small sized customers . . . . . . . . 4,000 46% 4,000 46%Traders . . . . . . . . . . . . . . . . . . . . . . . . . . . . . . 3,000 19% 3,000 27%
This fragmentation with respect to the size of its customers translates into a high number of orders anda relatively small average order size. For example, average order size, the percentage of order volumesold in increments of 10 Mt or below and the percentage of the number of orders for 10 Mt or belowfor coated wood-free paper from the Bhigwan unit was 7.3 Mt, 47% and 88%, respectively, for the ninemonths ended March 31, 2011. Similarly, the average order size, the percentage of order volume soldin increments of 10 Mt or below and the percentage of the number of orders for 10 Mt or below foruncoated wood-free paper for the Ballapur unit was 7.7 Mt, 45% and 85%, respectively, for the ninemonths ended March 31, 2011.
Lack of merchants or other sizeable intermediaries
The Indian market is different from most developed paper markets in that there are no sizeableindependent merchants acting as middlemen between paper producer and its customers. This meanseach paper producer needs to develop and invest in its own distribution network and strategy. Thismakes wider geographic market access challenging for single mill operations restricted to focus ontheir immediate local market. The lack of established paper merchants in the Indian market has alsoacted as a barrier to entry for new market participants.
Expected enforcement of environmental regulations
The Group believes that the Indian Government will enforce further environmental regulations morestrictly in the future. The Group believes that many small and medium scale manufacturers will not beable to meet the costs of complying with such regulations and might have difficulties staying inbusiness. Manufacturers that are unable to comply with applicable environmental regulations will beexposed to the risk of regulatory penalties and enforcement action, including closure. As a result, theIssuer expects that there will be a trend toward consolidation within the Indian paper industry as smalland medium scale manufacturers that are unable to achieve compliance with environmental regulationsshut down, merge with or are acquired by manufacturers with the resources to make the necessaryinvestments in pollution control.
Malaysia and South East Asia
The Group also has a fully integrated manufacturing facility in Malaysia held under the name SabahForest Industries Sdn. Bhd. (SFI). SFI is the largest manufacturer of uncoated wood-free writing andprinting paper in Malaysia and also has forest concessions of 288,138 hectares. Approximately 70% ofthe Group’s Malaysian sales (by volume) were to the domestic market in the year ended June 30, 2010,
— 159 —

with exports distributed to 24 countries. The product manufactured at the SFI unit is sold throughmerchants as well as directly to customers through the Group’s network.
The Group maintains an extensive distribution network in Malaysia, which can be divided to five majorzones: Sabah (East Malaysia), Sarawak (East Malaysia), Northern area of West Malaysia, Central areaof West Malaysia and Southern area of West Malaysia. The vast majority of paper consumption inMalaysia occurs in West Malaysia where major commercial activities are located. The Group maintainstwo RSOs in Malaysia, one of which is located in the Central area of West Malaysia (focused on theWest Malaysian market) and the other in Sabah (focused on the East Malaysian market). The Groupalso operates 55 distributors throughout Malaysia for distribution from the SFI unit.
Expected demand for Uncoated Wood-Free and Coated Wood-Free in Malaysia
Demand for uncoated wood-free paper in Malaysia has grown on average by nearly 1.2% per year overthe past ten years and is forecasted by Pöyry to grow 1.7% per year from 2009 to 2020. Demand withinMalaysia was 382,000 Mt for the year ended December 31, 2009 but it is projected by Pöyry toincrease to 460,000 Mt in 2020. The Group has 28% of the uncoated wood-free market in Malaysia.
Paper Manufacturing Process
Wood-free paper is mainly pulp that can be made from wood (including hardwood), bamboo and tosome extent, materials such as straw. The technology for manufacturing paper is simple, well knownand stable. However, it is energy intensive and capital intensive. The conversion of such raw materialinto paper involves several steps as described below.
Chipping. In order to economically produce the “pulp” that is the intermediate form between wood andpaper, wood logs must be chipped into small pieces. The wood of certain species of tree cannot bechipped directly, and must first have the bark removed. This process is called “debarking”.
Pulping. Pulp is manufactured by removing lignin, a gluey material that holds the wood fibers together,and other impurities from the wood chips. This removal occurs through a cooking process that firstdigests the wood chips in a chemical solution called “white liquor”, and then heats the mixture underpressure. The liquid by-product of this process, called “black liquor”, which has drawn out the ligninand other impurities in a solution, is washed out, leaving cellulose in a fibrous, yellowish form called“unbleached pulp”. The black liquor, depending on the technology used, can be recycled into whiteliquor for reuse in the pulping process. Recycling is done by burning the black liquor in a recoveryboiler producing energy.
Bleaching. Unbleached pulp retains a yellowish color due to residual lignin. In order to manufacturewhite paper, the unbleached pulp goes through a bleaching process, wherein it is mixed and processedwith various chemicals and washed. Bleaching increases the brightness of the pulp, removes impuritiesand lowers the viscosity of the pulp for optimum flow in subsequent operations.
Additives. Depending on the type of paper to be produced, the bleached pulp is subjected to variouschemical additives which can, among other qualities, affect its surface strength, smoothness, opacity,waterproofing, brightness and tint. The pulp is also diluted with water such that it is approximately99% water at the end of this stage.
— 160 —

Removing Water. After the pulp is mixed with a large quality of water in the headbox, 93% to 95% ofthis water is removed through a combination of gravity, suction, pressure, and heat and the resultingpaper is wound into large rolls. This process smoothes the pulp out to the desired thickness.
Finishing. The rolls of finished paper are then either delivered to customers, such as commercialprinters, that require paper in that form, or cut into sheets of various sizes as required before packingand delivery.
Coating. For Coated paper, coating chemicals are applied to the paper. The “air knife coating” processapplies coating to the paper and uses air jets to spread it over the paper uniformly, whereas the newer“blade coating” process uses blades to apply the coating, which results in a more uniformed layer withhigher speeds and increased efficiency.
Rayon grade pulp Manufacturing Process
Rayon grade pulping process is similar to paper grade pulping with an additional stage of cooking, i.e.pre-hydrolysis stage where in hemicelluloses is dissolved in the digester house. After thisPre-hydrolysis, sulphate cooking is carried out. Rayon grade pulp is characterized as relatively freefrom lignin and hemicelluloses, or other short-chain carbohydrates. Special focus is given to ellulosecontent, i.e. it is composed of long-chain molecules, digester house while pre-hydrolysis is carried tomaintain the Pentoson content 2.5 to 3.0 % maximum.
The pulp blown from the digester is washed in a four stage washer, screened well in pressure screenand five staged centricleaning, to ensure low acid insolubles in the pulp and further thickened andstored for processing in bleaching.
The bleaching process is carried out in five stages in a sequence of “C/D, EOP, H, D, Ep(SO2)” toachieve the desired optical properties. Before storing in the tower, pulp is further centricleaned in fourstages. Then pulp is processed in the sheeting machine for sheet making. The final product i.e. rayongrade pulp, in sheet form, is packed and sent to the customer. This pulp is also known as viscose pulp.
— 161 —

RELATIONSHIP WITH THE BALLARPUR GROUP AND THE AVANTHAGROUP
The share capital of the Issuer is currently owned by BIH (a wholly owned subsidiary of BILT)(72.30%), Lathe Investments (a wholly owned subsidiary of GIC Singapore) (11.69%) and J.P. MorganMauritius (6.91%) and AIA (9.09%). As at July 22, 2011, members of the Avantha Group own 49.40%of the issued share capital of BILT.
The Ballarpur Group (including the Group) is the largest manufacturer of writing and printing paper inIndia, with approximately 20% of the writing and printing paper sold in India in the year endedJune 30, 2010. Of the Ballarpur Group’s seven manufacturing facilities, six in India and one inMalaysia, three of the Indian facilities and the Malaysian facility are operated by the Group and theremaining three Indian facilities are owned by BILT. As described in “Business”, the focus of theGroup is on the manufacture of bulk coated and uncoated paper and viscous grade fiber while the restof the Ballarpur Group focuses on the manufacture of copier paper, speciality paper, retail and officesupply and stationery business (“OSSB”) and tissue paper.
The Issuer and/or members of the Group have a number of arrangements with related parties as furtherdescribed below. The Issuer believes that each of these arrangements has been entered into on arm’slength terms.
Power agreement
BGGPL and Avantha Power plan to enter into a Power Purchase Agreement (“Power PurchaseAgreement”) for the supply and purchase of electricity for the Group’s Ballarpur unit and Bhigwanunit. This agreement will follow termination of an earlier power purchase agreement between BILTand Avantha Power. The terms of this agreement are summarized in “Business — Material Contracts”.
Chemical agreements
BILT and Imerys are parties to a sales agreement for the supply of paper grade ground calciumcarbonate to BILT and its affiliates. Imerys is a joint venture between Imerys Pacific Limited andNewquest Corporation Private Limited (a member of the Avantha Group).
BGPPL and SMI are parties to an agreement for the supply of precipitated calcium carbonate toBGPPL. SMI is a joint venture between Speciality Minerals India Holdings, Inc. and NewquestCorporation Limited (a member of the Avantha Group).
The terms of each of the sales agreements referred to above are summarized in “Business — Materialcontracts”.
Farm forestry plantation
The Group procures a portion of its hardwood fiber in the form of wood from farm forestry programssupported by BTTL. BTTL is a member of the Ballarpur Group. BTTL supplies fast growing, site
— 162 —
specific planting seeds and stock and technical knowhow to local private farmers participating in farmforestry programs operated by BTTL. In order to ensure access to alternative sources of pulp andcontrol the costs associated with pulp supplies, BTTL started the farm forestry program in 1997. Thisprogram involved increasing the percentage of its wood fiber requirements that are supplied by localfarmers, and at the same time, developing relationships with individual farmers and working with themto adopt sustainable farm forestry practices. Recently, the farm forestry programs have also been aimedat increasing the amount of wood that is farmed within a “catchment area”, defined as within a 250 kmradius of the relevant unit to be supplied, which the Group believes is the distance within which theGroup can realize savings in transportation and related costs. The Group pays the farmers for the fiberand the farmers pay BTTL.
BGPPL has an agreement with BTTL, pursuant to which BTTL facilitates the raising of pulpwoodplantations on land belonging to farmers located within a catchment area of a radius of 350 kilometersof the Group’s Ballarpur unit and Kamalapuram unit through the provision of various facilitationservices (the “Farm Forestry Plantation”) in consideration for a facilitation charge. A separate salefacilitation charge is payable by BGPPL to BTTL under the agreement for the facilitation of thefelling, extraction, transportation and sale of wood by or on behalf of farmers who have grown on landwithin the Farm Forestry Plantation. The agreement is for a period of 10 years, automaticallyrenewable for a further period of 10 years. Each party has agreed to indemnify the other against anylosses suffered as a result of any breach of representations, warranties or obligations, or any other actsof wilful misconduct or negligence, by the indemnifying party. BTTL has also agreed to indemnifyBGPPL and its officers, employees and directors for claims brought by a third party for damage to realproperty and tangible personal property by reason of any negligent act or omission on the part ofBTTL.
Supply agreement
BGPPL, as an affiliate of BILT, has the right to purchase mixed hardwood pulp or acacia hardwoodpulp pursuant to a supply agreement entered into between BILT and AP Enterprises (Macao)Commercial Offshore Limited (“AP Enterprises”). In exchange for an undertaking from BILT and itsaffiliates to purchase 60,000 Mt of pulp per quarter from October 2009 to September 2012. BILT andAP Enterprises have undertaken to purchase and sell, respectively, a minimum of 25,000 Mt perquarter. Provided that there is due and proper performance of the agreement by such party, APEnterprises undertakes to grant a volume rebate on the net invoiced price on a pro rata basis to BILTand each of its affiliates based on the number of orders placed by each such entity. The agreement isvalid from October 1, 2009 to September 30, 2012 and is governed by the laws of Singapore. See“Business —”Material Contracts”.
Common services agreement
BILT and BGPPL have entered into the Common Services Agreement dated March 20, 2008 in termsof which BILT has agreed to advise, render consultancy services and provide necessary assistance toBGPPL in relation to the Bhigwan, Ballarpur and Kamalapuram units. BILT is obliged, under theCommon Services Agreement, to provide such various services including, among other things, legal,financial, insurance, accounting, taxation, marketing and sales-accounting services to BGPPL inconsideration for service fees payable by BGPPL on an annual basis. The services rendered by BGPPLshall be subject to a joint-annual review.
— 163 —

The Common Services Agreement is for an initial term extending to two years from the date of a“qualified IPO” in terms of the shareholders agreement dated March 18, 2008 between BILT, J.P.Morgan Mauritius, Lathe Investment, BIH and BPH. Both parties have agreed to indemnify the otheragainst any losses suffered as a result of any fraud, wilful misconduct, or gross negligence on the partof the indemnifying party or any breach of the terms and conditions of the Common ServicesAgreement.
Leases
Avantha Power has entered into an agreement with BILT to lease the manufacturing unit located inBallarpur in District Chandrapur, Maharashtra in Central India. The lease runs from June 22, 2006 fora period of fifteen years at an annual rent of Rs. 0.10 million and is renewable at mutually acceptableterms and conditions thereafter. BILT agrees to pay all statutory dues, ground rent and property taximposed or payable on the property. Avantha Power cannot sublet or transfer the leasehold property infavor of any other person or company except in favor of any group and/or subsidiary company,provided that it shall not cease to be subject to any of its liabilities or obligations under the agreementby reason only of such sub-lease or transfer. Pursuant to a rectification deed dated December 2010between BGPPL and Avantha Power, the lease deed has been amended to substitute BGPPL as a partyin place of BILT.
BGPPL has also entered into an agreement with Avantha Power, dated January 13, 2009, to lease themanufacturing unit located in Bhadalwadi, Maharashtra in Western India. This lease runs fromSeptember 1, 2006 for a period of five years and is renewable at mutually acceptable terms andconditions thereafter. Avantha Power is liable to pay a rent of Rs. 0.10 million per annum together withsuch sub-leasing charges as may be imposed by MIDC for granting permission for sub-leasing fromtime to time. Avantha Power is also liable to pay all statutory dues, ground rent and property taximposed or payable on the property. Avantha Power is permitted to transfer absolutely or by way ofmortgage or by sub-lease the whole or any part of its interest in the property in favor of any person orbody corporate with the prior written approval of BGPPL, provided that it shall not cease to be subjectto any of its liabilities or obligations under the agreement by reason only of such transfer.
For more information on the Group’s relationship with companies within the Ballarpur and AvanthaGroup, refer to note 37 to the Group’s Consolidated Historical Financial Information, includedelsewhere in this Offering Circular. For details on other material contracts and related partyagreements entered by the Group, please see “Business — Material Contracts.”
— 164 —

MANAGEMENT AND CORPORATE GOVERNANCE
Directors
The following table lists the names, positions and ages of the Directors:
Name Age Position
Gautam Thapar . . . . . . . . . . . . . . . . . . . . . . . . . . . . . 50 yrs Chairman & Managing DirectorRajeev Ranjan Vederah . . . . . . . . . . . . . . . . . . . . . . . 61 yrs Vice Chairman & Managing DirectorBhuthalingham Hariharan . . . . . . . . . . . . . . . . . . . . . 54 yrs Managing DirectorYogesh Agarwal . . . . . . . . . . . . . . . . . . . . . . . . . . . . 47 yrs Chief Executive Officer & Managing DirectorR.K. Ahooja . . . . . . . . . . . . . . . . . . . . . . . . . . . . . . . 73 yrs Managing DirectorFields Wicker-Miurin . . . . . . . . . . . . . . . . . . . . . . . . 53 yrs Managing DirectorKunnasagaran Chinniah . . . . . . . . . . . . . . . . . . . . . . 54 yrs Managing DirectorChristopher Nicholas . . . . . . . . . . . . . . . . . . . . . . . . . 48 yrs Managing DirectorH.C. Knuvers . . . . . . . . . . . . . . . . . . . . . . . . . . . . . . . 65 yrs Managing Director
Gautam Thapar (Chairman)
Gautam Thapar is Chairman and CEO of the Avantha Group.
Mr. Thapar began his education at the Doon School. After studying chemical engineering in the US, hereturned to India and started his career as a factory assistant in one of the organization’s manufacturingcompanies. He rose steadily through the Group, becoming Group Chairman on July 1, 2006. He sits onthe boards of various companies in India and overseas. In 2008, he received the Ernst & YoungEntrepreneur of the Year Award for Manufacturing. He has been appointed Board Member of theNational Security Advisory Board, a key component of the National Security Council of India. He isalso President of Thapar University, one of the top twenty technical schools in India. He is Chairmanof The Aspen Institute India, which aims to internationalize India’s business, political and culturalleadership. He is President of All India Management Association, the apex body of professionalmanagement in India. He is also President of the Professional Golf Tour of India.
Rajeev Ranjaan Vederah (Vice Chairman)
Mr. Vederah has been associated with the Ballarpur Group for 25 years in various positions ofincreasing responsibility. He has worked at several paper companies over a period of 40 years,including Sinar Mas India, Rayalaseema. Mr Vederah has been ranked in the top 20 of the globalpulp & paper industry’s top 50 power list for two consecutive years 2009 and 2010. He was also thePresident of the Indian Paper Manufacturers Association from 2005 to 2006. Mr Vederah holds aBachelor of Technology (Chemical) from the Indian Institute of Technology, New Delhi and a Masterof Science from the University of Ashton (UK).
— 165 —

Bhuthalingham Hariharan (Managing Director)
Mr Hariharan has been associated with the Ballarpur Group since 1985. In June 2001, Mr Hariharanwas appointed as a full-time Group Director (Finance) of the Avantha Group. He has approximately27 years experience in the paper industry in various positions of increasing responsibility, includingfinance, treasury and mergers and acquisitions. His expertise lies in the field of finance and corporateplanning. Mr Hariharan has contributed significantly in the successful foray of Ballarpur in theinternational capital markets, notably the global depositary receipt (“GDR”) and foreign currencyconvertible bond (“FCCB”) issues — a first in the Indian paper industry. He has also contributedsignificantly to the Group’s strategic mergers and acquisitions roadmap. Mr Hariharan is the ChiefFinancial Officer of the Avantha Group and is a member of the Avantha management board, whichformulates the strategy of the Avantha Group. He is also a director and committee member of variouscompanies that are part of the Avantha Group. Mr Hariharan is a Member of the Institute of CharteredAccountants of India, the Institute of Company Secretaries of India and the Institute of Cost and WorksAccountants of India.
Yogesh Agarwal (Chief Executive Officer)
Mr Agarwal has been associated with the Ballarpur Group for 12 years in various positions ofincreasing responsibility. He was previously the Chief Operating Officer of the Ballarpur Group,including the Group, and is also a Managing Director of SFI. Mr Agarwal’s business experiencestretches back 25 years. He has previously worked in the automobile industry and the white goodssector. Mr Agarwal holds a Bachelor of Engineering (Mechanical) Honors and a post-graduate diplomain Business Management and Advanced Management from Harvard Business School, Boston (USA).He is currently also Vice President of Indian Paper Manufacturers Association.
R.K. Ahooja (Managing Director)
Mr Ahooja retired from the Indian Administrative Services after serving the Government of India forover 30 years. All through his tenure, he held important positions including Deputy Commissioner,Delhi and Chamba (HP); Director of Industries HP, Development Commissioner Delhi, Chief SecretaryArunachal Pradesh, Deputy Secretary Cabinet Affairs, Joint Secretary Health, Secretary UPSC, SpecialSecretary Home Ministry, Secretary Cabinet Secretariat. Member, National Security Advisory Board(post retirement).
He was also the Magistrate First Class, Mandi and Chamba (HP) from 1965 to 1969, DisttMagistrate & Collector Delhi from 1978 to 1981, Financial Commissioner Delhi (1984) and theMember Central Administrative Tribunal Principal Bench from 1995 to 2000.
Mr Ahooja has also served as Director on the Boards of Himachal Finance Corporation; HP SmallIndustries Corp; Hospital Services Consultancy Corp; Rockwood Limited, Hyderabad; Webfil Limited,Kolkata; Zenith Alloys and Steel Limited, Kolkata; Nirlon Limited, Mumbai and LIC Housing FinanceLimited, Mumbai.
Mr Ahooja is also serving as a Senior Adviser, Waterfalls Institute of Technology Transfer, New Delhiand Member, Panel of Arbitrators, National Stock Exchange.
— 166 —

Fields Wicker Miurin (Senior Independent Managing Director)
Ms Wicker-Miurin is currently a non-executive director of the CDC Group plc, where she chairs theInvestment Evaluation and Development Committee. She has previously been a director at Savills plcwhere she chaired the Audit Committee (2002-2010), D. Carnegie & Co AB (2003-2007), RoyalLondon Mutual Insurance Society Limited, where she chaired the Investment Committee (2003-2006)and United Business Media Limited (1998-2004). She is co-founder and partner of Leaders’ Quest, asocial enterprise focused on leadership. Her executive experience includes serving as Director ofFinance and Strategy at the London Stock Exchange (1994-1997), and Managing Director of VestaCapital Advisors (2000-2002), a pan-European venture capital firm. Ms Wicker-Miurin’s otherexperience includes service as a non-executive director and chairman of the Investment Committee ofthe UK Department of Business, Enterprise and Regulatory Reform and its predecessor, theDepartment of Trade and Industry (2002-2008), a member of the NASDAQ Technology Committee andas a special advisor to the EU Parliament on financial regulation. She has completed degrees at theUniversity of Virginia, L’Institut D’Études Politiques in Paris and the Johns Hopkins School ofAdvanced International Studies. She was awarded an OBE in 2007 for services to internationalbusiness.
Kunnasagaran Chinniah (Managing Director)
Mr Kunna Chinniah is a Managing Director of the Issuer. He is also Global Head of Portfolio, Strategy& Risk Group with GIC Special Investments (“GIC SI”). GIC SI is the private equity arm of theGovernment of Singapore Investment Corporation (“GIC”).
Christopher Nicholas (Managing Director)
Mr. Nicholas is the Head of Global Special Opportunities Group at J.P. Morgan, with primaryresponsibility for the bank’s principal activities across geographies. He brings 28 years of experienceto the position, over 23 of which have been spent working in Asia. Mr. Nicholas joined the bank in1998 as part of the Emerging Market global franchise and a key member of the management team.Until June of 2004 he was responsible for leading J.P.Morgan’s credit business in the Region, withresponsibility for sales, trading, syndication and research. Since then, he has focused on the firm’sgrowth in the distressed debt and principal investment arenas. Before joining J.P.Morgan, Mr. Nicholasworked for Lehman Brothers for 5 years where he ran both syndicate and trading, spearheaded thedevelopment of the Asian Dragon Bond market and played a leading role in the Peoples’ Republic ofChina inaugural issue. In 1996 he moved to Credit Agricole Indosuez where he held the position ofRegional Head of Fixed Income for Asia, a franchise which was primarily focused on the developmentof the local currency bond markets throughout the region.
H.C. Knuvers (Managing Director)
Henk is a Managing Director and also a member of the management team of Capita Fiduciary B.V.Henk studied law at the University of Amsterdam and is a former international tax lawyer of ArthurAndersen. He has 30 years of experience in international business, with special focus on the real estateindustry.
— 167 —

Senior Managers Team
The Issuer’s current senior managers, in addition to the Chief Executive Officer, are as follows:
Name Age Position
Vivek Goyal . . . . . . . . . . . . . . . . . . . . . . . . . . . . . . . 42 yrs Chief Financial OfficerNeehar Aggarwal . . . . . . . . . . . . . . . . . . . . . . . . . . . 47 yrs Chief Operating OfficerSanjay Grover . . . . . . . . . . . . . . . . . . . . . . . . . . . . . . 45 yrs Vice President, CommercialS. Mohan . . . . . . . . . . . . . . . . . . . . . . . . . . . . . . . . . . 55 yrs Vice President, Human ResourcesSuneel Pandey . . . . . . . . . . . . . . . . . . . . . . . . . . . . . . 45 yrs Vice President, Raw MaterialsMahadevan Shankara Rajan . . . . . . . . . . . . . . . . . . . 53 yrs Vice President, Information TechnologyBharat Tandon . . . . . . . . . . . . . . . . . . . . . . . . . . . . . . 48 yrs Vice President, Sales & Marketing
Vivek Goyal (Chief Financial Officer)
Mr Goyal has been associated with the Ballarpur Group for over ten years in various positions ofincreasing responsibility. Mr Goyal has a total experience of 19 years. Mr Goyal is a Member of theInstitute of Chartered Accountants of India, the Institute of Company Secretaries of India and holds adegree in Law from Delhi University.
Neehar Aggarwal (Chief Operating Officer)
Mr Aggarwal has been associated with the Ballarpur Group for 25 years including having been UnitHead at the Bhigwan, Shree Gopal and Sewa units. Mr Aggarwal is currently responsible for managingthe manufacturing operations for the Issuer’s mills in both India and Malaysia. Mr Aggarwal holds aBachelor’s degree in Engineering (Mechanical) from the Birla Institute of Technology and Science,Pilani.
Suneel Pandey (Vice President, Raw Materials)
In 2008, Mr Pandey joined the Ballarpur Group and was given responsibility for wood and bamboomanagement and procurement, raw material planning and supply chain and inventory management.Prior to his appointment to the Ballarpur Group, Mr Pandey spent 20 years in the forestry industry withthe Indian Forest Service. Mr Pandey holds a Bachelor degree and a Master degree in Technology fromthe Indian Institute of Technology, Delhi.
Bharat Tandon (Vice President, Sales & Marketing)
Mr Tandon was appointed Head of Exports for the Ballarpur Group in 1993. He has worked in salesand marketing roles in various industries over a period of 26 years. Mr Tandon graduated from DelhiUniversity and has a post graduate qualification in Management.
— 168 —

Sanjay Grover (Vice President, Commercial)
In 2006, Mr Grover joined the Ballarpur Group and was given responsibility for the entire supply chainof each Ballarpur Group unit. Before he was appointed to this position, Mr Grover spent 23 years inmaterials management roles for Larsen & Toubro, GE Appliances and Delphi Automotive. Mr Groveris an Engineering graduate and he holds a post graduate qualification in Management.
S. Mohan (Vice President, Human Resources)
Mr Mohan joined the Ballarpur Group in 2009. Mr Mohan has over 26 years of experience of humanresources functions in various industries including pharmaceuticals, telecoms, steel, fertilizers andchemicals, aircraft manufacture and automobiles. Mr Mohan holds a post graduate qualification inHuman Resources Management from Loyola College, Chennai.
Mahadevan Shankara Rajan (Vice President, Information Technology)
Mr Rajan has spent over 30 years in IT related employment. He has worked in several sectors includingtelecoms, power and pulp and paper. Mr Rajan graduated in Chemical Engineering from the IndianInstitute of Technology, Varanasi and a post graduate qualification in management from IndianInstitute of Management, Bangalore.
Conflicts of interest
Certain directors of Ballarpur and Avantha are also Directors of the Issuer and certain companies of theGroup. The Issuer believes that this arrangement will allow the Issuer to benefit from the expertise ofthe Ballarpur Group’s and the Avantha Group’s management teams and enable it to leverage itsrelationship with the Ballarpur Group and Avantha Group in order to operate on an efficient andcompetitive basis. Please refer to “— Directors” and “— Senior Managers Team”.
In respect of directors who sit on the boards of both the Issuer’s Indian operating companies andcertain Ballarpur Group and Avantha Group companies, Indian law provides various protectionmeasures to preserve the independence of the boards of directors of such companies and to managepotential conflicts of interest. Broadly, these include the following: (i) governmental approval isrequired for the giving or receiving of loans, guarantees or security between a company’s (or its parentcompany) and its directors; (ii) board approval and, in cases where a company’s share capital exceedsINR 10 million (US$0.21 million) governmental approval is required for a company to enter intocontracts for the sale of goods or services with its directors (unless for market value); (iii) priordisclosure of a director’s interest in contracts and arrangements of a company is required; (iv) directorscannot vote in board meetings or count in the quorum for board meetings discussing any contract orarrangement of the company in which they are interested either directly or indirectly; (v) shareholderand governmental approval is required for the remuneration of directors to exceed certain thresholds;and (vi) one third of a listed company’s board must be made up of independent directors for thepurpose of enforcing good corporate governance and managing conflicts of interest if the chairman ofthe board is a non-executive director, otherwise half of the board should comprise of independentdirectors.
— 169 —

DESCRIPTION OF INDEBTEDNESS
The following summary of certain provisions of the Group’s credit arrangements, bonds andindebtedness does not purport to be complete and is subject to, and qualified in its entirety byreference to, the underlying credit agreements, bonds and other documentation. Furthermore, thissummary relates only to the Issuer’s principal long-term indebtedness. The Group utilizes a variety ofshort-term debt instruments.
The Group’s principal sources of external financing include both secured and unsecured short-term aswell as long-term facilities. As at March 31, 2011, the Group had total debt of US$674.3 million,compared to US$532.8 million as at March 31, 2010. Approximately half of the Issuer’s totalborrowings as at March 31, 2011 were denominated in US dollars, with the remainder was denominatedin rupees, euro and ringgits.
The Group’s long-term funding strategy is to continue to pay down debt from operating free cashflows, further lengthen the average maturity of residual debt and diversify sources of financing.
Banking facilities
BGPPL Facility
BGPPL entered into an INR 10 billion term loan facility on November 6, 2009 that was split betweenIDBI Bank Limited (INR 7.5 billion), the Central Bank of India (INR 1 billion) and Axis Bank Limited(INR 1.5 billion) as the lenders (the “BGPPL Facility”) sanctioned by letters dated September 4, 2009and November 5, 2009 by IDBI Bank Limited, October 6, 2009 and November 5, 2009 by the CentralBank of India and October 31, 2009 and November 5, 2009 by Axis Bank Limited. BGPPL took out theBGPPL Facility in order to redeem INR 10 billion of non-convertible debentures. These amounts havebeen fully drawn as of November 9, 2009. All indebtedness of BGPPL to IDBI Bank Limited and AxisBank Limited under the BGPPL Facility has been fully discharged as of December 2010, and there areno dues outstanding from them.
Under the BGPPL Facility, BGPPL is required to pay interest at the Benchmark Prime Lending Rate(“BPLR”) minus 1.75% for the funds from Central Bank of India. The interest rate will be reset afterthe expiry of two years from the date of execution of the finance documents and every two yearsthereafter. The BGPPL Facility will be repaid in unequal quarterly installments commencing onJune 30, 2011 and must be repaid by December 31, 2016.
The BGPPL Facility is subject to various conditions. These conditions include an undertaking byBGPPL that BILT will not dilute their stake in BGPPL to below 51% without the prior approval of theCentral Bank of India, and that BILT will retain management control of BGPPL throughout the term ofthe loan. BGPPL also undertakes that it will not take any major financial or investment decisionwithout informing the Central Bank of India.
— 170 —
BGPPL is subject to certain restrictive covenants. For example, in case of a default, it cannot undertakeany new project, diversification, issue any debentures, raise any loans, issue equity or preferenceshares, change its capital structure, create any subsidiary, undertake or permit any merger,consolidation, re-organization, scheme of arrangement or compromise with its creditors or shareholdersor effect any scheme of amalgamation or reconstruction or declare any dividend, make any investmentby way of deposits, loans or in share capital of any other concerns (including subsidiaries) for theperiod of default, without the prior written approval of the lenders under the BGPPL Facility.
The BGPPL Facility is subject to events of default, which include, but are not limited to, failure tomeet payment, non-compliance with certain obligations, disposal of assets without the approval of thelenders, cross-default and cross acceleration, and the appointment of a receiver or liquidator. Inaddition to accelerating the debt, upon the occurrence of an event of default, the lenders also have theright to appoint and remove nominee directors on the board of directors of BGPPL.
The BGPPL Facility is secured by a first and pari passu charge on the fixed assets (immoveable andmovable) of BGPPL except certain specified properties, and a negative lien on the current assets ofBGPPL.
The New BGPPL Facility
BGPPL entered into a US$145.0 million facility agreement on September 30, 2010 (as amended andrestated on November 18, 2010, the “New BGPPL Facility”), with amongst others, CoöperatieveCentrale Raiffeseisen-Boerenleenbank B.A. (trading as Rabobank International), Singapore Branch,Singapore (“Rabobank International, Singapore Branch”), Baroda and ING Bank N.V., SingaporeBranch as lenders and Rabo India Finance Limited, Bank of Baroda, Ras Al Khaimah Branch, UAE,ING Bank N.V., Singapore Branch and Standard Chartered Bank as mandated lead arrangers,Coöperatieve Centrale Raiffeseisen-Boerenleenbank B.A. (trading as Rabobank International), HongKong branch (“Rabobank International, Hong Kong Branch”) as the facility agent and Axis BankLimited as the security trustee. BGPPL took up the New BGPPL Facility in order to repay in fullindebtedness assumed under a prior facility between BGPPL and BIPH. BGPPL has certain voluntarycancellation and voluntary prepayment rights under the New BGPPL Facility which rights areexercisable in accordance with the RBI’s External Commercial Borrowings (“ECB”) Guidelines.
Under the New BGPPL Facility, BGPPL is required to pay interest at a rate determined by theaggregate of LIBOR plus 2.80 per cent. per annum. The BGPPL Facility will be repaid in unequalinstallments commencing on February 28, 2011 and must be repaid in full by May 31, 2015. Thefacility was fully drawn as of November 24th , 2010 and an amount of US$6.8 million has been repaidon February 28, 2011 as per the repayment schedule.
The events of default include but are not limited to, failure to meet payment, misrepresentation, cross-default, insolvency and insolvency proceedings, material adverse change, non-compliance withenvironmental laws resulting in material adverse effect and change of control.
BPH must at all times, directly or indirectly, own legally and beneficially at least 51% of the sharecapital of BGPPL must at all times be in control of BGPPL. BGPPL further undertakes that subject to
— 171 —

certain exceptions, it will not incur or permit to be outstanding any financial indebtedness, shall notdispose of any of its assets, and that it will not enter into any amalgamation, demerger, merger orcorporate reconstruction.
The New BGPPL Facility is subject to events of default, which include, but are not limited to, failureto meet payment obligations, breaches of financial covenants and cross defaults of BPH and itssubsidiaries.
The New BGPPL Facility is secured by the following:
(a) a first ranking mortgage over all immovable fixed assets of BGPPL ranking pari passu withprior existing first ranking security holders; and
(b) a first ranking hypothecation over all movable fixed assets (excluding current assets) of BGPPLranking pari passu with prior existing first ranking security holders.
Rabobank Facility
SFI entered into a US$50 million term loan facility on July 14, 2010 (subsequently amended by anamendment letter dated September 1, 2010, and further amended and restated by a supplementalagreement dated January 7, 2011, and as further amended by an amendment letter dated June 23, 2011,the “Rabobank Facility”) with amongst others, Rabobank International, Singapore Branch as leadarranger, Coöperatieve Centrale Raiffeseisen-Boerenleenbank B.A. (trading as RabobankInternational), Hong Kong Branch (“Rabobank International, Hong Kong Branch”) as facility agent andCoöperatieve Centrale Raiffeseisen-Boerenleenbank B.A. (trading as Rabobank Nederland), LabuanBranch (“Rabobank Nederland, Labuan Branch”) and Malayan Banking Berhad as lenders, for thepurpose of funding the expansion of the pulp capacity of the SFI unit. Subsequently the term loan wassplit between Rabobank Nederland, Labuan Branch and Malayan Banking Berhad assuming $30million and $20 million of the term loan, respectively. The Rabobank Facility provides SFI withcertain voluntary cancellation and voluntary prepayment rights.
Under the Rabobank Facility, SFI is required to pay interest at a rate determined by the aggregate ofthe margin, charged at 3.65 per cent. per annum and LIBOR. The Rabobank Facility must be repaid 72months from the weighted average utilization date, which is September 15, 2010. SFI shall begin topay in installments from March 15, 2013 until September 15, 2016. As at March 31, 2011,US$50 million of the Rabobank Facility was drawn.
SFI undertakes that no change of control in SFI shall occur. Change of control means any person orgroup of persons in concert gains control (the power to direct the management and policies) of SFI,BPH or BGPPL; Mr Gautam Thapar ceases to control Ballarpur Industries Limited; or BallarpurIndustries Limited ceases to be the beneficial owner directly or indirectly of more than 50% of theissued share capital of any of SFI, BPH, or BGPPL. SFI also undertakes to comply with and performall its obligations under its take or pay agreement with BGPPL dated July 20, 2010 for the supply ofpulp (the “BGPPL-SFI Offtake Agreement”) and its ninety-nine year forest concession from the SabahState Government for forest land dated January 1, 1996 (the “SFI Project Concession”). SFI further
— 172 —

undertakes that apart from certain exceptions, it will not incur or permit to be outstanding any financialindebtedness or dispose of any of its assets. SFI also undertakes that it will not enter into anyamalgamation, demerger, merger or corporate reconstruction, and that it will not declare any dividendsor cash distributions on share capital unless, inter alia, the design, procurement and construction of anexpansion to SFI’s plant in order to increase its pulp capacity (the “SFI Project”) has been completed.
The Rabobank Facility is subject to events of default, which include but are not limited to, failure tomeet payment, non-compliance with certain obligations, misrepresentation, cross-default, insolvencyand insolvency proceedings, expropriation by the government, material adverse change,non-compliance with environmental laws resulting in material adverse effect, suspension of the SFIProject Concession and change of control.
The security for the Rabobank Facility includes:
(a) a fixed charge over fixed assets of SFI including all SFI’s freehold or leasehold property,stocks, shares and securities, all SFI’s intellectual property rights, know how and goodwill withthe exception of the assets included in the following clauses (b) to (e);
(b) a charge over certain real property located in Sabah, East Malaysia;
(c) an assignment of the BGPPL-SFI Offtake Agreement;
(d) a fixed charge on SFI’s receivables account held with Malayan Banking Berhad. All amountsreceived by SFI pursuant to the BGPPL-SFI Offtake Agreement and in connection with the saleof pulp from the SFI Project are deposited in this receivables account; and
(e) a floating charge over all current assets of SFI (apart from the receivables account and thereceivables under the BGPPL-SFI Offtake Agreement).
Pursuant to the intercreditor agreement dated July 20, 2010 (as amended from time to time) between,amongst others, Rabobank International, Hong Kong Branch as facility agent for the finance parties ofthe Rabobank Facility, Nordea Bank AB (Publ) as facility agent for the finance parties of the ECAFacility (as defined below) and Maybank Trustees Berhad as joint security agent (the “IntercreditorAgreement”), the security for the Rabobank Facility is subject to certain pari passu security sharingand ranking arrangements with the ECA Facility, the Parallel Term Facility and the Second ParallelTerm Facility, the Citibank Working Capital Facility and the SCB Working Capital Facility (all asdefined below) in accordance with the terms of the Intercreditor Agreement.
ECA Facility
SFI has entered into a supply agreement with Metso Fiber Karlstad AB for the provision of equipment(for wood handling, fiber line, recausticizing and lime kiln) and services and for the purpose of payinga premium to the Swedish Export Credits Guarantee Board (“EKN”). In order to finance the purchaseof the equipment and services and the premium paid to EKN, SFI entered a Eur 28,800,366 export
— 173 —

credit agreement on July 20, 2010 with ING Bank N.V. and Nordea Bank AB (publ) as arrangers andoriginal lenders, as amended by an amendment letter dated June 23, 2011 (the “ECA Facility”).
Under the ECA Facility, SFI is required to pay interest at a rate determined by the aggregate of themargin, at 1.5 per cent. per annum, EURIBOR and any mandatory compliance costs incurred by alender. The ECA Facility must be repaid in full through 17 approximately equal semi-annualinstallments beginning at the earlier of:
(a) six months after the earlier of the ready for commissioning date or June 30, 2011, or
(b) December 31, 2011;
and ending at the earlier of:
(a) the date falling 102 months after the earlier of the ready for commissioning date or June 30,2011, or
(b) December 31, 2019.
As at March 31, 2011, €28 million (US$39 million) of the ECA Facility was drawn.
Under the ECA Facility, SFI undertakes to comply with and perform all its obligations under theBGPPL-SFI Offtake Agreement, its supply agreement with Metso Fiber Karlstad AB datedSeptember 3, 2008, and the SFI Project Concession. SFI also undertakes that apart from certainexceptions, it will not incur or permit to be outstanding any financial indebtedness or dispose of itsassets. SFI further undertakes that it will not enter into any amalgamation, demerger, merger orcorporate reconstruction without the prior written consent of the majority of lenders, and that it willnot declare any dividends or cash distributions on share capital unless, amongst others, the SFI Projecthas been completed.
SFI has certain voluntary cancellation and voluntary prepayment rights under the ECA Facility.However, the ECA Facility must be prepaid fully or partially if the export credit guarantee from EKNcovering 85% of principal and interest under the ECA Facility guarantee is fully or partiallywithdrawn, if certain insurance proceeds are received, or if SFI is required to prepay under a parallelfacility (such as the Rabobank Facility, the Parallel Term Facility or the Second Parallel TermFacility).
The ECA Facility’s events of default include, but are not limited to, failure to meet payment,non-compliance with certain obligations, misrepresentation, cross-default of an amount over US$5million, insolvency and insolvency proceedings, material adverse change and change of control.Change of control means Ballarpur ceasing to own (directly or indirectly) at least 51% of the totalissued share capital of SFI.
The security for the ECA Facility is identical to that described for the Rabobank Facility. Pursuant tothe Intercreditor Agreement, the security for the ECA Facility is subject to certain pari passu security
— 174 —

sharing and ranking arrangements with the Rabobank Facility, the Parallel Term Facility, the SecondParallel Term Facility, the Citibank Working Capital Facility and the SCB Working Capital Facility (asdefined below) in accordance with the terms of the Intercreditor Agreement.
Parallel Term Facility
SFI has entered into a US$20 million term loan facility on November 23, 2010 with Oversea-ChineseBanking Corporation Limited, Labuan Branch as lender, as amended by an amendment letter datedJune 23, 2011 (the “Parallel Term Facility”). SFI has taken out the Parallel Term Facility with thepurpose of discharging prior facilities with Axis Bank Limited. Under the Parallel Term Facility, SFIhas certain voluntary cancellation and prepayment rights.
SFI is required to pay interest on the Parallel Term Facility at a rate determined by the aggregate of themargin, at 3.90 per cent. per annum, and LIBOR. The Parallel Term Facility terminates 72 monthsfrom the date of first utilization. US$15 million of the facility has been utilized through June 2011.
Under the Parallel Term Facility SFI undertakes to comply with and perform all of its obligationsunder the BGPPL-SFI Offtake Agreement and the SFI Project Concession. SFI also undertakes that nochange of control shall occur. Change of control means any person or group of persons in concert gainscontrol (the power to direct the management and policies) of SFI or BGPPL, or BILT ceasing to be thebeneficial owner directly or indirectly of more than 50% of the issued share capital of any of SFI orBGPPL. SFI further undertakes that subject to certain exceptions, it will not incur or permit to beoutstanding any financial indebtedness or dispose of any assets. SFI also undertakes that it will notenter into any amalgamation, demerger, merger or corporate reconstruction and that it will not declareany dividends or cash distributions on share capital unless, inter alia, the SFI Project has beencompleted.
The events of default include but are not limited to, failure to meet payment, non-compliance withcertain obligations, misrepresentation, cross-default, insolvency and insolvency proceedings,expropriation by the government, material adverse change, non-compliance with environmental lawsresulting in material adverse effect and change of control.
The security for the Parallel Term Facility is identical to that described for the Rabobank Facility.Pursuant to the Intercreditor Agreement, the security for the Parallel Term Facility is subject to paripassu security sharing and ranking arrangements with the Rabobank Facility, the ECA Facility, theCitibank Working Capital Facility, the SCB Working Capital Facility and the Second Parallel TermFacility (as defined below) in accordance with the terms of the Intercreditor Agreement.
Second Parallel Term Facility
SFI has entered a US$20 million term loan facility on November 26, 2010 with Standard CharteredBank Malaysia Berhad as lender, as amended by an amendment letter dated June 23, 2011 (the “SecondParallel Term Facility”). SFI has taken out the Second Parallel Term Facility with the purpose offinancing the expansion of SFI’s plant. Under the Second Parallel Term Facility, SFI has certainvoluntary cancellation and prepayment rights. As at June 30, 2011, this facility had not yet beenutilized.
— 175 —

SFI is required to pay interest on the Second Parallel Term Facility at a rate determined by theaggregate of the margin, at 3.20 per cent. per annum, and LIBOR. The Second Parallel Term Facilitymust be repaid 72 months from the date of its first utilization.
The security for the Second Parallel Term Facility is identical to that described for the RabobankFacility. Pursuant to the Intercreditor Agreement, the security for the Second Parallel Term Facility issubject to certain pari passu security sharing and ranking arrangements with the Rabobank Facility, theECA Facility, the Parallel Term Facility, the Citibank Working Capital Facility and the SCB WorkingCapital Facility in accordance with the terms of the Intercreditor Agreement.
Apart from as otherwise disclosed above, the material terms of the Second Parallel Term Facility aresimilar to the terms of the Parallel Term Facility.
Citibank Working Capital Facility
SFI has entered into a revolving “omnibus line” facility of up to a maximum aggregate principalamount of US$10 million on December 2, 2010 with Citibank Berhad as lender (the “Citibank WorkingCapital Facility”). Under the Citibank Working Capital Facility, SFI may, at its discretion, acceptCitibank Berhad’s offer for it to utilize an overdraft facility, a sight/usage commercial credit facility,an export bills discounting facility, a guarantee facility and a banker’s acceptance facility. Theindicative pricing on the non-fund based facilities is 0.5% per annum. The pricing of fund basedfacilities are based on Citibank’s Base Lending rate and Citibank’s cost of funds (as conclusivelydetermined by Citibank) and the margin above these range from nil per cent. per annum, to 1.25% perannum. Where required, interest will be agreed between SFI and Citibank Berhad prior to eachutilization. The Citibank Working Capital Facility is repayable upon Citibank Berhad’s demand.
Under the Citibank Working Capital Facility, SFI agrees that Ballarpur will continue to maintain director indirect control of the shareholding or management control over SFI for so long as any amounts areoutstanding under the Citibank Working Capital Facility, or the Citibank Working Capital Facility isavailable.
Pursuant to the Intercreditor Agreement and the accession agreement dated December 17, 2010between Mayban Trustees Berhad as joint security agent and Citibank Berhad by which CitibankBerhad has become a party to the Intercreditor Agreement, the Citibank Working Capital Facilitybenefits from common security similar to the Rabobank Facility, the ECA Facility, the Parallel TermFacility, the Second Parallel Term Facility and the SCB Working Capital Facility (as defined below)and is subject to certain pari passu security sharing and ranking arrangements with these facilities.
SCB Working Capital Facility
SFI has entered into “uncommitted” facilities of up to a maximum aggregate principal amount ofUS$20 million dated March 3, 2011 with Standard Chartered Bank Malaysia Berhad as lender (the“SCB Working Capital Facility”). Under the SCB Working Capital Facility, SFI may utilize arevolving credit facility, a trade finance facility (including letters of credit, loans against import,guarantees / bonds, export bills discounting) and treasury facilities. The indicative pricing of the non
— 176 —

fund based facilities range between 0.5% to 1.5% per annum. The pricing of fund based facilities arebased on Bank’s cost of funds (as conclusively determined by the Bank) and the margin above rangefrom 1.25% per annum, to 3.50% per annum. Each facility under the SCB Working Capital Facility isuncommitted and made available to SFI at Standard Chartered Bank Malaysia Berhad’s sole andabsolute discretion. Under the SCB Working Capital Facility, SFI undertakes not to dispose of all orany part of its assets or make any acquisition or investment except where made in the ordinary courseof business, or obtain financing or incur any indebtedness in relation to any invoice issued by a relatedparty (except for all arm’s length transactions) without the prior written consent of Standard CharteredBank Malaysia Berhad.
Events of default include but are not limited to failure to meet payment, non-compliance with certainobligations, misrepresentation, cross-default of an amount over US$5 million, insolvency andinsolvency proceedings and material adverse change.
Pursuant to the Intercreditor Agreement and the accession agreement dated March 10, 2011 betweenMayban Trustees Berhad as joint security agent and Standard Chartered Bank Malaysia Berhad bywhich Standard Chartered Bank Malaysia Berhad has become a party to the Intercreditor Agreement,the SCB Working Capital Facility benefits from common security similar to the Rabobank Facility, theECA Facility, the Parallel Term Facility, the Second Parallel Term Facility and the Citibank WorkingCapital Facility and is subject to certain pari passu security sharing and ranking arrangements withthese facilities.
Non-Convertible Debenture Programs
Issue with ICICI Bank Ltd. as sole arranger
In September 2010, BGPPL issued approximately INR 2.5 billion (US$54.0 million) of securedredeemable non-convertible privately placed debentures through ICICI Bank Ltd. as sole arranger. Thenon-convertible debentures are listed on the Bombay Stock Exchange and are secured by a pari passufirst charge on the fixed assets of BGPPL with a continuing fixed asset coverage ratio requirement of1.25. The non-convertible debentures are divided into six series which mature between September 2012and March 2017. BGPPL is required to pay interest on these non-convertible debentures at a rate of9.65 per cent per annum. As of March 31, 2011, US$54.0 million of these non-convertible debentureswere outstanding.
Issue with Yes Bank Limited as sole arranger
In September 2010, BGPPL issued approximately INR 2.5 billion (US$55.4 million) of securedredeemable nonconvertible privately placed debentures through Yes Bank Limited as sole arranger.The non-convertible debentures are listed on the Bombay Stock Exchange and are secured by a pari-passu first charge on the fixed assets of BGPPL with continuing coverage of 1.25 times fixed assetsuntil the maturity of the non-convertible debentures. The non-convertible debentures are divided intofive series which mature between September 2012 and September 2017. BGPPL is required to payinterest on these non-convertible debentures at a rate between 8.75 per cent. and 9.90 per cent. perannum. Under the terms of the issue, BGPPL is subject to events of default relating to certain financialcovenants throughout the tenor of the non-convertible debentures. As of March 31, 2011, US$55.4million of these non-convertible debentures were outstanding.
— 177 —
Further issue with ICICI Bank Ltd. as sole arranger
In December 2010, BGPPL issued a further approximately INR 2.5 billion (US$54.3 million) ofsecured redeemable non-convertible debentures through ICICI Bank Ltd. as sole arranger. Thenon-convertible debentures are listed on the Bombay Stock Exchange and are secured by a pari-passufirst charge on the fixed assets of BGPPL with continuing coverage of 1.25 times fixed assets until thematurity of the non-convertible debentures. The non-convertible debentures are divided into six serieswhich mature between December 2012 and June 2017. BGPPL is required to pay interest on thesenon-convertible debentures at a rate between 9.00 per cent. and 9.75 per cent. per annum. Under theterms of the issue, BGPPL is subject to events of default relating to certain financial covenantsthroughout the tenor of the non-convertible debentures. As of March 31, 2011, US$54.3 million ofthese non-convertible debentures were outstanding.
Profit Certificates
The Issuer has issued to BIH 20 million profit certificates, each with a nominal value of EUR1 (“ProfitCertificates”) for an aggregate subscription price of US$140 million.
— 178 —
DESCRIPTION OF THE PERPETUAL CAPITAL SECURITIES
The Securities are to be issued under an indenture (the “Indenture”) to be dated as of August 11, 2011(the “Issue Date”) between Ballarpur International Graphic Paper Holdings B.V. (the “Issuer”, whichexpression shall include any entity which is substituted as principal obligor under the Securities inaccordance with the provisions set out under “— Substitution of the Issuer”), Ballarpur IndustriesLimited (“BILT”) and The Bank of New York Mellon as trustee for the holders of the Securities (the“Trustee”). The following summaries of certain provisions of the Securities and the Indenture are notcomplete and are subject to, and are qualified in their entirety by reference to, all the provisionsthereof, including the definitions therein of certain terms. Wherever particular sections or definedterms from the Securities or the Indenture are referred to, such sections or defined terms areincorporated herein by reference. Copies of the Indenture will be available upon request on or after theIssue Date from the Issuer or at the corporate trust office of the Trustee and The Bank of New YorkMellon as paying agent for the holders of the Securities (the “Paying Agent”).
General
The Securities will be issued in an initial aggregate principal amount of US$200,000,000. TheSecurities confer a right to receive interest (“Interest”) at the rates and in the manner described under“— Interest”. There are limited remedies with respect to the Securities as detailed under“— Non-payment and Enforcement” and the Securities have no stated maturity date. The Issuer shallonly have the right to redeem or purchase the Securities in accordance with the provisions describedunder “— Redemption” and “— Purchase”, respectively.
Payments of principal of and Interest on the global securities representing the Securities will be madeto the registered holder thereof in immediately available funds. Payments of principal of, and Intereston, any individual securities representing the Securities that are subsequently issued in certificatedform, as set forth below, will be made by cheque drawn on a bank in The City of New York or, in thecase of any holder of more than US$1,000,000 in principal amount of individual certificated securities,upon timely application, by electronic transfer of immediately available funds to an account of suchholder at a bank in The City of New York. Payments of the principal amount of such Security uponredemption in full, together with accrued Interest due at redemption will be made to the registeredholder thereof against presentation and surrender of such Security at the specified office of the PayingAgent, provided that in the event that a Singapore paying agent is required by the Listing Manual ofthe SGX-ST, and for so long as the Securities are listed on the SGX-ST, such payments of principaland Interest payments may be made by such Singapore paying agent.
The transfer of the Securities will be registrable, and the Securities will be exchangeable at theCorporate Trust Office (as defined in the Indenture) in The City of New York, which initially will bethe office of the Trustee. In the case of the transfer of less than the entire principal amount of anyindividual securities representing the Securities, a new individual security will be delivered by thetransfer agent to the transferor in respect of the untransferred portion.
Status and Subordination; Set-Off
The Securities (together with accrued Interest thereon, including any Arrears of Interest and AdditionalInterest Amounts (each, as defined under “— Deferral of Interest”)) will constitute the Issuer’s direct,
— 179 —

unsecured and subordinated obligations (ranking pari passu among themselves, without any preferenceone over the other by reason of priority of date of issue or otherwise), which in the event of aWinding-Up rank:
(a) junior to the claims of all senior and other subordinated obligations of the Issuer, except for theloans and securities referred to in (b) below;
(b) pari passu with any loans and securities expressed to rank pari passu with the Securities; and
(c) senior to the Issuer’s ordinary and preferred share capital,
except as otherwise required by mandatory provisions of law.
In the event of a Winding-Up, the rights and claims of the holders in respect of the Securities will besubordinated in right of payments to the claims of all senior and subordinated creditors of the Issuerreferred to in (a) above shall have been satisfied in full, and the holders of the Securities irrevocablywaive any right to be treated equally with such creditors of the Issuer in such circumstances.
Subject to applicable law, no holder of a Security may exercise any right of set-off in respect of anyamount owed to it by the Issuer arising under or in connection with the Securities and each holder of aSecurity shall, by virtue of being a holder, be deemed to have waived all such rights of set-off. Thisterm of the Securities is an irrevocable stipulation (derdenbeding) for the benefit of the creditorsreferred to in (a) above and each such creditor may rely on and enforce this term of the Securitiesunder Section 6:253 of the Dutch Civil Code.
This provision shall be governed by, and construed in accordance with, the laws of The Netherlands.The courts of Amsterdam, the Netherlands, shall have exclusive jurisdiction to settle any and alldisputes arising out of or in connection with this provision.
Delivery and Form of the Securities
The statements set forth herein include summaries of certain rules and operating procedures of DTC,Euroclear and Clearstream, Luxembourg which will affect transfers of interests in the global securitiesrepresenting Securities.
The Securities sold in offshore transactions in reliance on Regulation S will be initially in the form ofone or more Regulation S global securities, fully registered without coupons, which will be depositedwith The Bank of New York Mellon (in such capacity, the “Custodian”) for DTC and registered in thename of Cede & Co., as nominee of DTC for credit to the respective accounts of the purchasers, or toother accounts as they may direct, at Euroclear or Clearstream, Luxembourg, each of which is aparticipant in DTC.
The Securities sold to qualified institutional buyers in reliance on Rule 144A will be issued initially inthe form of one or more Rule 144A global securities, fully registered without coupons, which will bedeposited with the Custodian for DTC and registered in the name of Cede & Co., as nominee of DTC.
— 180 —

The Securities will be issued in minimum denominations of US$200,000 and integral multiples ofUS$1,000 above that amount.
The Securities (including beneficial interests in the global securities representing the Securities) willbe subject to certain restrictions on transfer set forth therein and in the Indenture and will bear a legendregarding such restrictions as set forth under “— Transfer Restrictions”. Under certain circumstances,transfers may be made only upon receipt by the Trustee of a written certification (in the form(s)provided in the Indenture).
Prior to the 40th day after the later of the commencement of the offering and 10:00 p.m., Hong Kongtime, on or about August 11, 2011 (the “Time of Delivery”), a beneficial interest in a Regulation Sglobal security may be transferred within the United States to a person who takes delivery in the formof an interest in the related Rule 144A global security only if the transferor, and any person acting onits behalf, reasonably believes that the transferee is a qualified institutional buyer, and upon receipt bythe transfer agent of a written certification (in the form(s) provided in the Indenture) (a) from thetransferee to the effect that such transferee (i) is a qualified institutional buyer purchasing for its ownaccount (or for the account of one or more qualified institutional buyers over which account itexercises sole investment discretion) and (ii) agrees to comply with the restrictions on transfer set forthunder “— Transfer Restrictions”, and (b) from the transferor to the effect that the transfer was made ina transaction meeting the requirements of Rule 144A and in accordance with any applicable securitieslaws of any state of the United States or any other jurisdiction. After the 40th day after the later of thecommencement of the offering and the Time of Delivery, the certifications contemplated by clause(a) (i) and clause (b) of the preceding sentence shall no longer be required, but the transferee will stillbe required to certify as provided by clause (a) (ii) of such sentence.
Beneficial interests in a Rule 144A global security may be transferred to a person who takes deliveryin the form of an interest in a Rule 144A global security without any written certification from thetransferor or the transferee. Beneficial interests in a Rule 144A global security may be transferred to aperson who takes delivery in the form of an interest in a Regulation S global security only upon receiptby the Trustee of written certifications (in the form(s) provided in the Indenture) from the transferor tothe effect that such transfer is being made in accordance with Rule 903 or 904 of Regulation S or Rule144 under the Securities Act (if available).
Any individual securities issued in exchange for an interest in a Rule 144A global security representingSecurities under the circumstances described under “— Individual Securities” below may betransferred only upon receipt by the Trustee of a written certification from the transferor (in theform(s) provided in the Indenture) to the effect that such transfer is being made in accordance with therestrictions on transfer set forth under “— Transfer Restrictions”, and in the case of any resale otherthan a “Safe Harbor Resale” as defined under “— Transfer Restrictions”, the execution and delivery bythe transferee of a written certification (also in the form attached to the Indenture) and any additionaldocuments or other evidence (including, but not limited to, an opinion of counsel) that the Issuer or theTrustee may, in its sole discretion, deem necessary or appropriate to evidence compliance with suchtransfer restrictions.
Any beneficial interest in one of the global securities that is transferred to an entity who takes deliveryin the form of an interest in the other global security will, upon transfer, cease to be an interest in such
— 181 —

global security and become an interest in the other global security and, accordingly, will thereafter besubject to all transfer restrictions, if any, and other procedures applicable to beneficial interests in suchother global security for as long as it remains such an interest.
Investors may hold their interests in the global securities representing Securities directly through DTC,Euroclear or Clearstream, Luxembourg, as the case may be, if they are participants in such systems, orindirectly through organizations which are participants in such systems. Euroclear and Clearstream,Luxembourg will hold interests in the Securities on behalf of their participants through customers’securities accounts in their respective names on the books of their respective depositaries, which areparticipants in DTC.
Transfers between participants in DTC (the “Participants”) will be effected in the ordinary way inaccordance with DTC rules. Transfers between participants in Euroclear and Clearstream, Luxembourg(“Euroclear Participants” and “Clearstream Participants”, respectively) will be effected in theordinary way in accordance with their respective rules and operating procedures.
Initial settlement for the Securities will be made in same-day funds. So long as DTC continues to act asdepositary for the Securities, the Securities will trade in DTC’s Same-Day Funds Settlement System.
Subject to compliance with the transfer restrictions applicable to the Securities, cross-market transfersbetween DTC, on the one hand, and Euroclear Participants or Clearstream Participants, on the otherhand, will be effected in DTC in accordance with DTC rules on behalf of Euroclear or Clearstream,Luxembourg, as the case may be.
Persons who are not Participants may beneficially own interests in the global securities representingSecurities held by DTC only through Participants or Indirect Participants (as defined below) (includingEuroclear and Clearstream, Luxembourg). So long as Cede & Co., as the nominee of DTC, is theregistered owner of the global securities representing Securities, Cede & Co. for all purposes will beconsidered the sole holder of such Securities.
Payment of Interest on and principal of the global securities representing Securities will be made toCede & Co., the nominee for DTC, or such other nominee as may be requested by an authorizedrepresentative of DTC, as the registered owner of such global securities in immediately availablefunds. Neither the Issuer nor the Trustee will have any responsibility or liability for any aspect of therecords relating to or payments made on account of beneficial ownership interests in such globalsecurities or for maintaining, supervising or reviewing any records relating to such beneficialownership interest.
Payments of Interest on and principal of the Securities held through Euroclear or Clearstream,Luxembourg will be credited to the cash accounts of Euroclear Participants or ClearstreamParticipants, as the case may be, in accordance with the relevant system’s rules and procedures.Payments by Participants to owners of beneficial interests in the global securities representingSecurities held through such Participants will be the responsibility of such Participants, as is the casewith Securities held, for the accounts of customers in bearer form or registered in “street name”.
— 182 —

So long as the Securities are represented by global securities and such global securities are held onbehalf of DTC or any other clearing system, such clearing system or its nominee will be considered thesole holder of the Securities represented by the applicable global securities for all purposes under theIndenture, including, without limitation, obtaining consents and waivers thereunder, and neither theTrustee nor the Issuer shall be affected by any notice to the contrary. Neither the Trustee nor the Issuershall have any responsibility or obligation with respect to the accuracy of any records maintained byany clearing system or any Participant of such clearing system. The clearing systems will take actionson behalf of their Participants (and any such Participants will take actions on behalf of any IndirectParticipants) in accordance with their standard procedures. To the extent that any clearing system actsupon the direction of the holders of the beneficial interests in the applicable global security and suchbeneficial holders give conflicting instructions, the applicable clearing system may take conflictingactions in accordance with such instructions.
All interests in the global securities representing Securities, including those held through Euroclear orClearstream, may be subject to the procedures and requirements of DTC. Those interests held throughEuroclear or Clearstream may also be subject to the procedures and requirements of their respectivesystems.
Neither the Trustee nor the Issuer will have any responsibility for the performance by DTC,Clearstream and Euroclear, or their respective Participants or Indirect Participants, of their respectiveobligations under the rules and procedures governing their operations.
Individual Securities
If DTC is at any time unwilling or unable to continue as depositary and a successor depositary is notappointed by the Issuer within 90 days, the Issuer will issue individual securities in certificated, fullyregistered form in exchange for the relevant global securities.
Subject to the transfer restrictions set forth on the individual securities in certificated form, the holderof such individual securities in certificated form may transfer or exchange such securities bysurrendering them at the Corporate Trust Office. Prior to any proposed transfer of individual securitiesin certificated form (other than pursuant to an effective registration statement), the holder may berequired to provide certifications and other documentation relating to the manner of such transfer andsubmit such certifications and other documentation to the transfer agent as described under“— Delivery and Form of the Securities” above. Upon the transfer, exchange or replacement ofindividual securities in certificated form not bearing the legend referred to under “— TransferRestrictions”, the transfer agent will deliver individual securities in certificated form that do not bearthe legend. Upon the transfer, exchange or replacement of individual securities in certificated formbearing the legend, or upon specific request for removal of the legend on an individual security incertificated form, the transfer agent will deliver only individual securities in certificated form that bearsuch legend or shall refuse to remove such legend, as the case may be, unless there is delivered to theIssuer such satisfactory evidence, which may include an opinion of counsel, as may reasonably berequired by the Issuer that neither the legend nor the restrictions on transfer set forth therein arerequired to ensure compliance with the provisions of the Securities Act.
— 183 —

Interest
The Securities confer a right to receive Interest at the applicable rate described below from andincluding the Issue Date or from and including the most recent Interest Payment Date to, but excluding,the next Interest Payment Date or any redemption date payable, subject to the provisions describedunder “— Deferral of Interest”, semi-annually in arrear on the Interest Payment Dates of each year tothe persons in whose name the Securities are registered at the close of business on the date 15 daysimmediately preceding such Interest Payment Date (in each case, whether or not a Payment BusinessDay). Interest will be calculated on the basis of a 360-day year consisting of twelve 30-day months. Inany case where the date for the payment of Interest (including any payment pursuant to the provisionsdescribed under “— Settlement of Arrears of Interest”) on or principal of any Security is not a day onwhich banking institutions are open for business in Amsterdam and New York City (a “PaymentBusiness Day”), then payment of such Interest need not be made at such time and place of payment butmay be made on the next succeeding Payment Business Day with the same force and effect as if madeon the date for such payment of principal or Interest, and no Interest will accrue for the period aftersuch date.
Initial Interest Rate
Unless previously redeemed in accordance with the terms of the Securities, Interest from and includingthe Issue Date to but excluding August 11, 2016 (the “First Call Date”) shall accrue on theoutstanding principal amount of the Securities (and any Arrears of Interest) at the Initial Interest Rateand, subject to the provisions described under “— Deferral of Interest”, shall be paid on each InterestPayment Date in such period and on the First Call Date.
First Reset Interest Rate
Unless previously redeemed in accordance with the terms of the Securities, Interest from and includingthe First Call Date to but excluding August 11, 2021 (the “Second Call Date”) shall accrue on theoutstanding principal amount of the Securities (and any Arrears of Interest) at the First Reset InterestRate and, subject to the provisions described under “— Deferral of Interest”, shall be paid on eachInterest Payment Date in such period and on the Second Call Date. The Calculation Agent shall, on thesecond New York Business Day immediately preceding the First Call Date, calculate the First ResetInterest Rate payable in respect of each Security and will cause the First Reset Interest Rate to benotified to the Issuer, the Trustee and the holders without undue delay but, in any case, not later thanon the fifth New York Business Day after its determination.
Second Reset Interest Rate
Unless previously redeemed in accordance with the terms of the Securities, Interest from and includingthe Second Call Date to but excluding the following Reset Date shall accrue on the outstandingprincipal amount of the Securities (and any Arrears of Interest) at the Second Reset Interest Rate and,subject to the provisions described under “— Deferral of Interest”, shall be paid on each InterestPayment Date in such period. The Calculation Agent shall, on the second New York Business Day
— 184 —

immediately preceding the Second Call Date, calculate the Second Reset Interest Rate payable inrespect of each Security and will cause the Second Reset Interest Rate to be notified to the Issuer, theTrustee and the holders without undue delay but, in any case, not later than on the fifth New YorkBusiness Day after its determination.
Subsequent Reset Interest Rate
Unless previously redeemed in accordance with the terms of the Securities, Interest from and includingeach Reset Date falling after the Second Call Date to but excluding the immediately following ResetDate shall accrue on the outstanding principal amount of the Securities (and any Arrears of Interest) atthe Relevant Reset Interest Rate and, subject to the provisions described under “— Deferral ofInterest” shall be paid on each Interest Payment Date in such period. The Calculation Agent shall, onthe second New York Business Day immediately preceding the relevant Reset Date, calculate theapplicable Reset Interest Rate payable in respect of each Security and will cause each Relevant ResetInterest Rate to be notified to the Issuer, the Trustee and the holders without undue delay but, in anycase, not later than on the fifth New York Business Day after its determination.
Step-up after Change of Control
In the event of a Change of Control, if the Issuer does not elect to redeem the Securities within 60 daysof the occurrence of the Change of Control in accordance with the provisions described under“— Redemption upon a Change of Control” then the prevailing Interest Rate applicable to theSecurities shall be increased by 5% per annum with effect from and including the date on which theChange of Control occurred.
Deferral of Interest
The Issuer may, at its sole discretion, elect to defer (in whole or in part) any Interest which isotherwise scheduled to be paid on an Interest Payment Date to the next Interest Payment Date bygiving notice (a “Deferral Election Notice”) (which notice shall be irrevocable) to the holders of theSecurities and the Trustee not more than 10 nor less than five New York Business Days prior to ascheduled Interest Payment Date (a “Deferral Election Event”). The Issuer shall have no obligation topay any Interest (including any Arrears of Interest and any Additional Interest Amounts) on anyInterest Payment Date if it validly elects not to do so in accordance with the terms of the Securities.
Each Deferral Election Notice shall be accompanied by an officers’ certificate of the Issuerconfirming that a Deferral Election Event has occurred and is continuing. Any Interest deferredpursuant to the terms of the Securities shall constitute “Arrears of Interest”. The Issuer may, at itssole discretion, elect (in the circumstances described above) to defer further any Arrears of Interestby complying with the foregoing notice requirement applicable to any deferral of any accruedInterest. The Issuer is not subject to any limit as to the number of times Interest and Arrears ofInterest can or shall be deferred pursuant to the terms of the Securities, except that the provisionsdescribed under “— Restrictions in the case of Deferral” shall be complied with until all outstandingArrears of Interest have been paid in full.
— 185 —

Each amount of Arrears of Interest shall accrue further interest as if it constituted the principal of theSecurities at the prevailing Interest Rate and the amount of such Interest (the “Additional InterestAmounts”) with respect to Arrears of Interest shall be due and payable on the immediately followingInterest Payment Date, unless further deferred in accordance with the terms of the Securities and shallbe calculated by applying the applicable Interest Rate to the amount of the Arrears of Interest. TheAdditional Interest Amounts accrued up to any Interest Payment Date shall be added, for the purposeof calculating the Additional Interest Amounts accruing thereafter, to the amount of Arrears of Interestremaining unpaid on such Interest Payment Date so that it will itself become Arrears of Interest.
Restrictions in the Case of Deferral
If on any Interest Payment Date, payment of all Interest payments scheduled to be made on such date(including Arrears of Interest and Additional Interest Amounts) is not made in full by reason of theIssuer deferring such Interest in accordance with the terms of the Securities:
(a) prior to an Initial Public Offering, neither the Issuer nor BILT shall:
(1) declare or pay any dividends or distributions, or make any other payment on, and willprocure that no dividend, distribution or other payment is made on any of their respectiveJunior Obligations or Parity Obligations (except in relation to Parity Obligations, on apro-rata basis with any Securities), save that such restriction shall not apply to paymentsin respect of an employee benefit plan or similar arrangement with or for the benefit ofemployees, officers, directors or consultants; or
(2) redeem, reduce, cancel, buy-back or acquire for any consideration any of their respectiveJunior Obligations or Parity Obligations unless (i) the Issuer has satisfied in full alloutstanding Arrears of Interest and any Additional Interest Amounts or (ii) approved bythe holders of at least a simple majority in aggregate principal amount of the Securitiesthen outstanding or other than (iii) as a result of the exchange or conversion of ParityObligations of the Issuer or, as the case may be, BILT for the Junior Obligations of theIssuer or, as the case may be, BILT or (iv) in connection with an employee benefit plan orsimilar arrangement with or for the benefit of employees, officers, directors orconsultants; and
(b) on or after an Initial Public Offering, none of the Issuer, the Relevant Listco nor, if the InitialPublic Offering is not a Qualifying Public Offering, BILT shall:
(1) declare or pay any dividends or distributions, or make any other payment on, and willprocure that no dividend, distribution or other payment is made on any of their respectiveJunior Obligations or Parity Obligations (except in relation to Parity Obligations, on apro-rata basis with any Securities), save that such restriction shall not apply (i) topayments in respect of an employee benefit plan or similar arrangement with or for thebenefit of employees, officers, directors or consultants or (ii) to payments made (X) if theRelevant Listco is a Subsidiary IPO Entity, by the Relevant Listco to the Issuer or (Y) ifthe Relevant Listco is a Non-Subsidiary IPO Entity, by the Relevant Listco to the Issueror by the Issuer to the Relevant Listco; or
— 186 —
(2) redeem, reduce, cancel, buy-back or acquire for any consideration any of their respectiveJunior Obligations or Parity Obligations unless (i) the Issuer has satisfied in full alloutstanding Arrears of Interest and any Additional Interest Amounts or (ii) approved bythe holders of at least a simple majority in aggregate principal amount of the Securitiesthen outstanding or other than (iii) as a result of the exchange or conversion of ParityObligations of the Issuer, the Relevant Listco or, as the case may be, BILT for the JuniorObligations of the Issuer, the Relevant Listco or, as the case may be, BILT or (iv) inconnection with an employee benefit plan or similar arrangement with or for the benefit ofemployees, officers, directors or consultants.
Settlement of Arrears of Interest
The Issuer:
(a) may satisfy any Arrears of Interest and any Additional Interest Amounts (in whole or in part) atany time by giving notice of such election to the holders of the Securities and the Trustee notmore than 20 nor less than 10 New York Business Days prior to the relevant payment datespecified in such notice (which notice is irrevocable and shall oblige the Issuer to pay therelevant Arrears of Interest and any Additional Interest Amounts on the payment date specifiedin such notice); and
(b) in any event shall satisfy any outstanding Arrears of Interest and any Additional InterestAmounts (in whole but not in part) on the earliest of the following:
(1) the date of a Compulsory Interest Settlement Event;
(2) the date of redemption of the Securities at the option of the Issuer as described under“— Redemption”; and
(3) the date of any substitution or variation pursuant to a Special Event,
it being understood that if none of the events referred to in (b)(1) to (3) above take place prior to thecalendar day which is the 5th anniversary of the Interest Payment Date on which the outstandingArrears of Interest would, if not deferred pursuant to a Deferral Election Notice, have fallen due forthe first time, it is the intention, though not an obligation, of the Issuer to pay outstanding Arrears ofInterest (in whole but not in part) on the next Interest Payment Date following such 5th anniversary.
Any partial payment of outstanding Arrears of Interest or any Additional Interest Amount by the Issuershall be shared by the Holders of all outstanding Securities on a pro-rata basis.
Redemption
Optional Redemption
On any Call Date, the Issuer may redeem the Securities, in whole but not in part, upon giving not lessthan 30 nor more than 60 days’ notice (which notice shall be irrevocable) to the holders of the
— 187 —

Securities, at a redemption price equal to the principal amount thereof together with any Interestaccrued to (but excluding) the date fixed for redemption (including any Arrears of Interest and anyAdditional Interest Amounts).
Optional Tax Redemption
The Securities may be redeemed, in whole but not in part, at the Issuer’s option, upon giving not lessthan 30 nor more than 60 days’ notice (which notice shall be irrevocable) to the holders of theSecurities by reason of a Withholding Tax Event, provided that (i) such Withholding Tax Event cannotbe avoided by the Issuer (or if the Relevant Listco Guarantee was called, the Relevant Listco) takingreasonable measures available to it and (ii) no such notice of redemption shall be given earlier than 90days prior to the earliest date on which the Issuer (or if the Relevant Listco Guarantee was called, theRelevant Listco) would be obliged to pay such Additional Tax Amounts if a payment in respect of theSecurities were then due.
The Securities may also be redeemed, in whole but not in part, at the Issuer’s option, upon giving notless than 30 nor more than 60 days’ notice (which notice shall be irrevocable) to the holders of theSecurities by reason of a Tax Deduction Event, provided that (i) such Tax Deduction Event cannot beavoided by the Issuer (or if the Relevant Listco Guarantee was called, the Relevant Listco) takingreasonable measures available to it and (ii) no such notice of redemption shall be given earlier than 90days prior to the earliest date on which Interest payments under the Securities will no longer be taxdeductible by the Issuer or the Relevant Listco for Dutch corporate income tax purposes or, as the casemay be, the tax domicile of the Relevant Listco for corporate income tax purposes.
Upon the expiry of the notice period pursuant to the Issuer’s election to deliver such notice withrespect to:
(a) a Withholding Tax Event, the Issuer will redeem the Securities at their principal amount,together with Interest accrued thereon, including any Arrears of Interest and any AdditionalInterest Amounts, up to (but excluding) the redemption date; and
(b) a Tax Deduction Event, the Issuer will redeem the Securities at (1) their Early RedemptionAmount, if such redemption occurs before (but excluding) August 11, 2021 or (2) if suchredemption occurs after (or on) August 11, 2021, at their principal amount, in each casetogether with Interest accrued thereon, including any Arrears of Interest and any AdditionalInterest Amounts, up to (but excluding) the redemption date.
Redemption upon an Accounting Event
The Securities may be redeemed, in whole but not in part, at the Issuer’s option, upon giving not lessthan 30 nor more than 60 days’ notice (which notice shall be irrevocable) to the holders of theSecurities by reason of an Accounting Event.
Upon the expiry of the notice period pursuant to the Issuer’s election to deliver such notice withrespect to the terms above, the Issuer will redeem the Securities at (1) their Early Redemption Amount,
— 188 —

if such redemption occurs before (but excluding) August 11, 2021 or (2) if such redemption occursafter (or on) August 11, 2021, at their principal amount, in each case together with Interest accruedthereon, including any Arrears of Interest and any Additional Interest Amounts, up to (but excluding)the redemption date, provided that no notice of redemption may be given earlier than 90 days prior tothe last day before the date on which the Securities must not or must no longer be so recorded as“equity” of the Issuer pursuant to the Relevant Accounting Standards.
Redemption upon a Capital Event
The Securities may be redeemed, in whole but not in part, at the Issuer’s option, upon giving not lessthan 30 nor more than 60 days’ notice (which notice shall be irrevocable) by reason of a Capital Event.
Upon the expiry of the notice period pursuant to the Issuer’s election to deliver such notice withrespect to the terms above, the Issuer will redeem the Securities at (1) their Early Redemption Amount,if such redemption occurs before (but excluding) August 11, 2021 or (2) if such redemption occursafter (or on) August 11, 2021, at their principal amount, in each case together with Interest accruedthereon, including any Arrears of Interest and any Additional Interest Amounts, up to (but excluding)the redemption date, provided that no notice of redemption may be given earlier than 90 days prior tothe last day before the date on which the Securities will no longer be eligible for the same or highercategory of equity credit.
Squeeze-Out Redemption
The Securities may be redeemed, in whole but not in part, at the Issuer’s option, upon giving not lessthan 30 nor more than 60 days’ notice (which notice shall be irrevocable) to the holders of theSecurities if, immediately before giving such notice, the aggregate principal amount of the Securitiesoutstanding is less than 10% of the aggregate principal amount originally issued (a “Squeeze-OutEvent”).
Upon the expiry of the notice period pursuant to the Issuer’s election to deliver such notice withrespect to the terms above, the Issuer will redeem the Securities at their principal amount together withInterest accrued thereon, including any Arrears of Interest and any Additional Interest Amounts, up to(but excluding) the redemption date.
Redemption upon a Change of Control
The Securities may be redeemed, in whole but not in part, at the Issuer’s option, upon giving not lessthan 30 nor more than 60 days’ notice (which notice shall be irrevocable) to the holders of theSecurities by reason of a Change of Control.
Upon the expiry of the notice period pursuant to the Issuer’s election to deliver such notice withrespect to the terms above, the Issuer will redeem the Securities at their principal amount, togetherwith Interest accrued thereon, including any Arrears of Interest and any Additional Interest Amounts,up to (but excluding) the redemption date.
— 189 —

No other Redemption
The Issuer shall not be entitled to redeem the Securities and shall have no obligation to make anypayment of principal in respect of the Securities otherwise than as provided above under“— Redemption”.
Replacement Intention
The Issuer intends (but is not obliged to ensure) that, to the extent that the Securities provide theIssuer with “equity credit” for rating purposes by Fitch immediately prior to any redemption effectedin accordance with the Indenture, it will (except in certain circumstances) repay the principal amountof such Securities to be so redeemed with the net proceeds received by the Issuer from the issuance,within a period of 12 months prior to the date set for such redemption, of securities for which theIssuer will receive the same, or higher amount of, “equity credit” (or such other nomenclature thatFitch may then use to describe the degree to which an instrument exhibits the characteristics of anordinary share) by Fitch as at the time of such redemption.
Additional Tax Amounts
The Issuer or the Relevant Listco (where the Relevant Listco Guarantee has been provided) will makeall payments of principal of and Interest in respect of the Securities without withholding or deductingany present or future taxes, duties, assessments, fees or other governmental charges imposed by TheNetherlands, the tax domicile of the Relevant Listco (where the Relevant Listco Guarantee has beenprovided) or any authority therein or thereof having power to tax, unless such withholding or deductionis required by law. In the event that any such withholding or deduction in respect of principal orInterest is required by law, the Issuer or, as the case may be, the Relevant Listco (where the RelevantListco Guarantee has been provided) will pay additional amounts (“Additional Tax Amounts”) asnecessary to ensure that holders of the Securities will receive the same amount as they would havereceived without any such withholding or deduction.
Neither the Issuer nor the Relevant Listco (where the Relevant Listco Guarantee has been provided)will pay, however, any Additional Tax Amounts:
Š in respect of any taxes, duties, assessments, fees or other governmental charges what would nothave been imposed but for a connection between the holder of a Security and The Netherlands,the tax domicile of the Relevant Listco (where the Relevant Listco Guarantee has beenprovided) or any political subdivision or any authority thereof or therein, as the case may be,otherwise than merely holding such Security or receiving principal or Interest in respectthereof;
Š in respect of any Security presented for payment more than 30 days after the relevant date forpayment, except to the extent that the holder thereof would have been entitled to suchAdditional Tax Amounts on presenting the same for payment on the last day of such 30-dayperiod, where “relevant date” means (i) the due date for payment thereof and (ii) if the fullamount payable on such due date has not been received in New York City by the PrincipalAgent on or prior to such due date, the first date on which such full amount has been soreceived and notice to that effect has been given to the holders of the Securities;
— 190 —

Š to a holder of a Security or a third party on behalf of a person who would have been able toavoid such withholding or deduction by duly presenting the Security to another paying agent ina member state of the European Union;
Š where such withholding or deduction is imposed on a payment to an individual and is requiredto be made pursuant to European Council Directive 2003/48/EC or any law implementing orcomplying with, or introduced in order to conform to, such Directive; or
Š surrendered for payment by or on behalf of a holder who would not be liable or subject to thewithholding or deduction by making a declaration of non-residence or other similar claim forexemption to the relevant tax authority.
Unless the context requires otherwise, any reference in the Securities to principal and/or Interest shallbe deemed to include any Additional Tax Amounts which may be payable as described above.
Substitution and Variation
If a Special Event has occurred and is continuing, then the Issuer may (without any requirement for theconsent or approval of the holders of the Securities) having provided a certification from two directorsof the Issuer that (a) the provisions of the Indenture have been complied with and (b) the substitutionor variation is not materially prejudicial to the holders of the Securities (as reasonably determined bythe Issuer), and further having given not less than 30 nor more than 60 days’ irrevocable notice to theTrustee and the holders of the Securities, at any time either (i) substitute all, but not some only, of theSecurities for, or (ii) vary the terms of the Securities with the effect that they remain or become (as thecase may be), Qualifying Securities, and the Trustee shall (subject to the following provisions andsubject to the receipt by it of the certificate of the directors of the Issuer referred to herein) agree tosuch substitution or variation.
Upon expiry of such notice, the Issuer shall either vary the terms of or, as the case may be, substitutethe Securities in accordance with this provision. In connection therewith, any outstanding Arrears ofInterest (including any Additional Interest Amounts) will be satisfied in full.
In connection with any substitution or variation, the Issuer shall comply with the rules of any stockexchange on which the Securities are for the time being listed or admitted to trading. Any suchsubstitution or variation in accordance with the foregoing provisions shall not be permitted if any suchsubstitution or variation would itself give rise to a Special Event with respect to the Securities or theQualifying Securities.
Substitution of the Issuer
The Indenture contains provisions under which either (a) any successor in business of the Issuer or(b) any Relevant Listco may, without the consent of the holders of the Securities, assume theobligations of the Issuer as principal debtor under the Indenture and the Securities provided that certainconditions specified in the Indenture are fulfilled.
— 191 —

In the event of a substitution of the Issuer in accordance with the foregoing, references herein to TheNetherlands shall be deemed to refer to (and in any supplemental or amendment documentation toeffect the substitution shall be amended by making reference to) the jurisdiction of incorporation of thesubstituted entity, in accordance with the provisions set out in the Indenture.
No holder of a Security shall, in connection with any substitution, be entitled to claim anyindemnification or payment in respect of any tax consequence thereof for such holder, except to theextent provided under “— Additional Tax Amounts” (or any undertaking given in addition to orsubstitution for it pursuant to the provisions of the Indenture).
Initial Public Offering
In the event that on an Initial Public Offering, the Relevant Listco is either (i) a Subsidiary of theIssuer or (ii) a Sideco, and in either case is not substituted as principal debtor under the Indenture andthe Securities in accordance with the provisions under “— Substitution of the Issuer” above, the Issuershall procure that (a) such Relevant Listco enters into an indenture supplemental to the Indenturepursuant to which such Relevant Listco shall guarantee on a subordinated basis (as described below)the payment of any amounts payable under the Securities or the Indenture (the “Relevant ListcoGuarantee”) and (b) any sale or transfer of the assets held directly or indirectly by the Issuer or any ofits Subsidiaries to an entity which is not a Subsidiary of the Issuer is made on arm’s length terms forfair market value consideration.
The Relevant Listco Guarantee shall constitute the Relevant Listco’s direct, unsecured andsubordinated obligations, which in the event of a Winding-Up rank:
(a) junior to the claims of all senior and other subordinated obligations of the Relevant Listco,except for the loans and securities referred to in (b) below;
(b) pari passu with any loans and securities expressed to rank pari passu with the Relevant ListcoGuarantee; and
(c) senior to the Relevant Listco’s ordinary and preferred share capital,
except as otherwise required by mandatory provisions of law.
In the event of a Winding-Up, the rights and claims of the holders in respect of the Relevant ListcoGuarantee will be subordinated in right of payments to the claims of all senior and subordinatedcreditors of the Relevant Listco referred to in (a) above shall have been satisfied in full, and theholders of the Relevant Listco Guarantee irrevocably waive any right to be treated equally with suchcreditors of the Relevant Listco in such circumstances.
Subject to applicable law, no holder of a Security may exercise any right of set-off in respect of anyamount owed to it by the Relevant Listco arising under or in connection with the Relevant ListcoGuarantee and each holder of a Security shall, by virtue of being a holder, be deemed to have waivedall such rights of set-off.
— 192 —

The subordination provision of the Relevant Listco Guarantee shall be governed by, and construed inaccordance with, the laws of the place of incorporation of the Relevant Listco. The courts of suchjurisdiction shall have exclusive jurisdiction to settle any and all disputes arising out of or inconnection with those subordination provisions.
Non-Payment and Enforcement
If:
(a) subject as provided under “— Deferral of Interest”, a default is made for a period of more thanseven days in the payment of any amount in respect of the Securities; or
(b) the Issuer or the Relevant Listco (where the Relevant Listco Guarantee has been provided) issubject to a Winding-Up (except in the case of a Winding-Up for the purpose of a merger,reconstruction or amalgamation the terms of which have previously been approved by theholders of at least a simple majority in aggregate principal amount of the Securities thenoutstanding),
(each, an “Enforcement Event”) then, in the case of paragraph (a), the Trustee may, at its discretionand shall, if instructed pursuant to a meeting of holders, subject in each case to being indemnified and/or secured to its satisfaction and to any applicable laws, without further notice, institute proceedingsfor the Winding-Up of the Issuer in The Netherlands (but not elsewhere) or the Relevant Listco (wherethe Relevant Listco Guarantee has been provided) in the place of incorporation of the Relevant Listco(but not elsewhere) and/or prove in any Winding-Up of the Issuer or the Relevant Listco (where theRelevant Listco Guarantee has been provided), but may take no other action in respect of suchEnforcement Event and, in the case of paragraph (b), the Securities will immediately become due andpayable at their principal amount together with accrued Interest (including Arrears of Interest andAdditional Interest Amounts) and the Trustee may, at its discretion and shall, if instructed pursuant toa meeting of holders, subject in each case to being indemnified and/or secured to its satisfaction and toany applicable laws, without further notice, prove in the Winding-Up of the Issuer or the RelevantListco (where the Relevant Listco Guarantee has been provided), subject always to the provisionsdescribed under “— Status and Subordination; Set-Off”.
No Holder shall be entitled to proceed directly against the Issuer or the Relevant Listco (where theRelevant Listco Guarantee has been provided) or to institute proceedings for the Winding-Up or claimin the liquidation of the Issuer or the Relevant Listco (where the Relevant Listco Guarantee has beenprovided) or to prove in such Winding-Up unless the Trustee, having become so bound to proceed orbeing able to prove in such Winding-Up or claim in such liquidation, fails to do so within a reasonableperiod and such failure shall be continuing, in which case the Holder shall have only such rightsagainst the Issuer as those which the Trustee is entitled to exercise as set out above. The Trustee mayrefuse to follow any direction that it determines would involve the Trustee in personal liability, unlessit receives security and/or indemnity satisfactory to it against any loss, liability or expense.
No remedy against the Issuer or the Relevant Listco (where the Relevant Listco Guarantee has beenprovided), other than as referred to in this paragraph, shall be available to the Trustee or the Holders,
— 193 —

whether for the recovery of amounts owing in respect of the Securities or under the Indenture or inrespect of any breach by the Issuer or the Relevant Listco (where the Relevant Listco Guarantee hasbeen provided) of any of its other obligations under or in respect of the Securities or under theIndenture.
The Trustee need not do anything to ascertain whether any Enforcement Event has occurred or iscontinuing and will not be responsible to Holders or any other person for any loss arising from anyfailure by it to do so, and, unless and until the Trustee otherwise has received notice in writing to thecontrary, the Trustee may assume that no such event has occurred and that the Issuer is performing allits obligations under the Indenture and the Securities.
Purchase
The Issuer may, in accordance with all applicable laws and regulations, at any time purchase theSecurities in the open market or otherwise at any price. Any Securities purchased by the Issuer may beheld, cancelled or sold. Any Securities so purchased, while held by or on behalf of the Issuer, shall notentitle the holder thereof to approve any waivers or amendments to the terms of the Securities or theIndenture and shall be excluded for the purposes of calculating a quorum or majority for any meetingof holders.
Listing of the Securities
By the Time of Delivery, the Issuer shall have made an application for the Securities to be listed on theSGX-ST but an application may instead be made to another stock exchange which is: (a) a member ofthe World Federation of Exchanges; or (b) located in a state that is a member of the Organization ofEconomic Co-operation and Development. In connection with such application, the Issuer will use itsbest endeavors to it to obtain the listing as promptly as practicable after the Time of Delivery (if notalready obtained). The Issuer may elect to apply for a de-listing of the Securities from any stockexchange or markets of such stock exchange on which they are traded because the maintenance of suchlisting is or would be, in the opinion of the Issuer, unduly burdensome, in which event the Issuer willuse its best endeavors to seek a replacement listing of such Securities on any section of any stockexchange on which they are traded or another stock exchange which is: (a) a member of the WorldFederation of Exchanges; or (b) located in a state that is a member of the Organization of EconomicCo-operation and Development, provided that obtaining or maintaining a listing on such stockexchange would not be, in the opinion of the Issuer, unduly burdensome. In the event that no listing isobtained or maintained which satisfies the foregoing requirements, the Issuer will use its bestendeavors to obtain a replacement listing elsewhere.
Meetings of Holders, Modification and Amendment
The Issuer, at any time, and the Trustee shall, upon written request of holders of at least 10% of theSecurities outstanding and subject to the Trustee being indemnified and/or secured to its satisfaction,call a meeting of holders of the Securities at such time and at such place in The City of New York asthe Issuer or the holders of at least 10% in principal amount of Securities outstanding may determine.
— 194 —

At a meeting of the holders of the Securities, persons entitled to vote a majority of greater than 50% inaggregate principal amount of the Securities outstanding shall constitute a quorum. In the absence of aquorum, within 30 minutes of the time appointed for any such meeting, at any such meeting, themeeting may be adjourned.
Modifications and amendments to the Securities or the Indenture requiring consent of holders may bemade, and future compliance therewith or past defaults by the Issuer may be waived with respect to theSecurities, with the consent of the lesser of (i) a majority in aggregate principal amount of theSecurities outstanding or by (ii) 75% in aggregate principal amount of the Securities outstandingrepresented and voting at a meeting of holders at which a quorum is present; provided that no suchmodification, amendment or waiver of the Indenture or any Security may, without the consent of eachholder of the Securities, (a) change the date for payment of Interest on any such Security; (b) reducethe principal of or Interest on any such Security; (c) change the currency of payment of the principal ofor Interest on any such Security; (d) change the provisions or procedures relating to the redemption ofthe Securities; or (e) reduce the above-stated percentage of aggregate principal amount of Securitiesoutstanding or reduce the quorum requirements or the percentage of votes required for the taking ofany action.
Further Issuances
The Issuer may from time to time, without notice to or the consent of the holders of the Securities,create and issue further securities ranking pari passu with the Securities in all respects (or in allrespects except for the payment of Interest accruing prior to the issue date of the securities or exceptfor the first payment of Interest following the issue date of the securities). The Issuer may consolidatesuch further securities with the outstanding Securities to form a single series; provided that, if anyfurther debt securities issued are not fungible for U.S. federal income tax purposes with any Securitiespreviously issued, such further debt securities shall trade separately from such previously issuedSecurities under a separate CUSIP number but shall otherwise be treated as a single series with allother Securities issued under the Indenture.
The Trustee
The Bank of New York Mellon will be the Trustee under the Indenture. The Trust and SecuritiesServices division of the Trustee is located at The Bank of New York Mellon, 101 Barclay Street, Floor4 — East, New York, NY 10286, Attention: Global Corporate Trust.
The Trustee may resign at any time or may be removed by the Issuer. If the Trustee resigns, is removedor becomes incapable of acting as Trustee or if a vacancy occurs in the office of the Trustee for anycause, a successor Trustee will be appointed in accordance with the provisions of the Indenture. Insuch event, the Issuer will notify the SGX-ST where such appointment would have a material effect onthe price or value of the Securities or on an investor’s decision whether to trade in the Securities.
The Trustee shall not be required to take any steps to ascertain whether a Change of Control or anySpecial Event has occurred or may occur, and shall be entitled to assume that no such event has
— 195 —

occurred unless an officer of the Trustee has actual knowledge or the Trustee has received writtennotice of the occurrence of such event. The Trustee may conclusively rely upon any officer’scertificate and any opinion, report, certificate or advice obtained from any expert, legal advisor oraccounting firm it receives in relation to a Change of Control, any Special Event or otherwise, andshall have no liability for so doing.
Obligation Currency
To the fullest extent permitted by applicable law, the obligation of the Issuer under the Securities tomake all payments in U.S. dollars (the “Obligation Currency”) will not be satisfied by any payment,recovery or any other realization or proceeds in any currency other than the Obligation Currency. TheIssuer has agreed to indemnify the holders of the Securities in U.S. dollars for any shortfall in theaggregate amount of Obligation Currency actually received by such holders and the aggregate amountof payments due and payable.
Governing Law
The Securities and the Indenture will be governed by and construed in accordance with the laws of theState of New York, save for the provisions described under “— Status and Subordination; Set-Off” andthe provisions of the Indenture in relation to subordination and set-off, which will be governed by andconstrued in accordance with the laws of The Netherlands.
Notices
Notices to the holders of the Securities will be mailed to them at their respective addresses in theregister of the Securities. Any such notice will be deemed to have been given on the fourth day afterbeing so mailed. So long as and to the extent that the Securities are represented by global securitiesand such global securities are held by DTC, notices to owners of beneficial interests in the globalsecurities may be given by delivery of the relevant notice to DTC for communication by it to entitledaccount holders.
No Sinking Fund
There will be no mandatory sinking fund payments with respect to the Securities.
Consent to Jurisdiction and Service of Process
The Indenture will provide that the Issuer will irrevocably appoint Law Debenture Corporate ServicesInc. of 400 Madison Avenue, 4th Floor, New York, New York 10017 or any other person performingsimilar functions as its agent for service of process in any suit, action or proceeding with respect to theIndenture or the Securities brought in any federal or state court located in New York City and that eachof the parties submit to the jurisdiction thereof. If for any reason Law Debenture Corporate ServicesInc. is unable to serve in such capacity, the Issuer shall appoint another agent satisfactory to theTrustee.
— 196 —

No Personal Liability of Directors, Officers, Employees and Shareholders
No director, officer, employee, incorporator or shareholder of the Issuer shall have any liability for anyobligations of the Issuer under the Securities or the Indenture or for any claim based on, in respect of,or by reason of, such obligations or their creation. Each holder of the Securities by accepting aSecurity waives and releases all such liability, to the extent permitted by applicable law. The waiverand release are part of the consideration for issuance of the Securities. Such waiver may not beeffective to waive liabilities under the U.S. federal securities laws, and it is the view of theCommission that such a waiver is against public policy.
Unclaimed Money, Prescription
If money deposited with the Trustee or the Paying Agent for the payment of principal of, premium, ifany, or Interest on, the Securities remains unclaimed for two years, the Trustee and the Paying Agentshall return the money to the Issuer at its written request. After that, holders of the Securities entitledto the money must look to the Issuer for payment unless applicable abandoned property law designatesanother person and all liability of the Trustee and the Paying Agent shall cease. Other than as set forthin this paragraph, the Indenture does not provide for any prescription periods for the payment ofprincipal of, premium, if any, or Interest on, the Securities.
Certain Definitions
Set forth below are definitions of certain terms used herein. Additional terms are defined aboveelsewhere or in the Indenture:
“Accounting Event” means that the Issuer or, after an Initial Public Offering, the Issuer or theRelevant Listco has (i) obtained an opinion of the Issuer’s or, after an Initial Public Offering, theIssuer’s or the Relevant Listco’s independent auditors or of a recognized accountancy firm ofinternational standing and delivered to the Trustee and (ii) delivered an officers’ certificate to theTrustee, each to the effect that as a result of any change or amendment to, or any change or amendmentto any interpretation of, International Financial Reporting Standards, as adopted by the EuropeanUnion or any other internationally generally accepted accounting standards that the Issuer has adoptedfor the purposes of the Issuer’s consolidated financial statements (the “Relevant AccountingStandards”), the Securities must not or must no longer be recorded as “equity” of the Issuer or, afteran Initial Public Offering, the Issuer or the Relevant Listco pursuant to the Relevant AccountingStandards.
“Call Date” means the First Call Date, the Second Call Date or on any Interest Payment Date after theSecond Call Date.
“Capital Event” means that the Issuer or, after an Initial Public Offering, the Issuer or the RelevantListco has (i) received confirmation from S&P or Fitch and delivered to the Trustee and (ii) deliveredan officers’ certificate to the Trustee to the effect that an amendment, clarification or change in theratings criteria of S&P or Fitch, as the case may be, has occurred, which amendment, clarification orchange results in a lower equity content or, as the case may be, credit for the Securities than thatinitially assigned to the Securities.
— 197 —

“Change of Control” means:
(a) prior to an Initial Public Offering, BILT, directly or indirectly, ceasing to own and control atleast 51% of the Issuer’s issued and outstanding capital stock; and
(b) after an Initial Public Offering:
(i) BILT, directly or indirectly, ceasing to own and control at least 40% of the RelevantListco’s issued and outstanding capital stock; or
(ii) BILT, directly or indirectly, ceasing to be the single largest holder of the issued andoutstanding capital stock of the Relevant Listco.
“Comparable Treasury Issue” means (a) in relation to calculating a Reset Interest Rate, the U.S.Treasury security selected by the Calculation Agent as having a maturity of five years that would beutilized at the time of selection and in accordance with customary financial practice, in pricing newissues of corporate debt securities with a maturity of five years and (b) in relation to calculating aMake Whole Amount, the U.S. Treasury security selected by the Calculation Agent as having amaturity comparable to the Remaining Life that would be utilized, at the time of selection and inaccordance with customary financial practice, in pricing new issues of corporate debt securities of amaturity most closely corresponding to the Remaining Life.
“Comparable Treasury Price” means, with respect to a determination date, the average of fiveReference Treasury Dealer Quotations for such determination date, after excluding the highest andlowest of such Reference Treasury Dealer Quotations, or (ii) if fewer than five such ReferenceTreasury Dealer Quotations are available, the average of all such quotations.
“Compulsory Interest Settlement Event” means:
(a) prior to an Initial Public Offering, the Issuer:
(1) declares or pays any dividends or distributions, or makes any other payment on any of itsJunior Obligations or Parity Obligations (except in relation to Parity Obligations, on apro-rata basis with the Securities), except where such dividend, distribution or payment isrequired to be declared or made in respect of an employee benefit plan or similararrangement with or for the benefit of employees, officers, directors or consultants; or
(2) redeems, reduces, cancels, buy-backs or acquires for any consideration any of its JuniorObligations or Parity Obligations other than (i) as a result of the exchange or conversionof its Parity Obligations for its Junior Obligations or (ii) in connection with an employeebenefit plan or similar arrangement with or for the benefit of employees, officers,directors or consultants;
— 198 —

(b) on or after an Initial Public Offering in relation to which the Relevant Listco is a SubsidiaryIPO Entity, the Issuer or the Relevant Listco:
(1) declares or pays any dividends or distributions, or makes any other payment on any oftheir respective Junior Obligations or Parity Obligations (except in relation to ParityObligations, on a pro-rata basis with the Securities), except where such dividend,distribution or payment is required to be declared or made in respect of an employeebenefit plan or similar arrangement with or for the benefit of employees, officers,directors or consultants; or
(2) redeems, reduces, cancels, buy-backs or acquires for any consideration any of theirrespective Junior Obligations or Parity Obligations other than (i) as a result of theexchange or conversion of Parity Obligations of the Issuer or, as the case may be, theRelevant Listco for the Junior Obligations of the Issuer or, as the case may be, theRelevant Listco or (ii) in connection with an employee benefit plan or similar arrangementwith or for the benefit of employees, officers, directors or consultants; and
(c) on or after an Initial Public Offering in relation to which the Relevant Listco is aNon-Subsidiary IPO Entity, the Issuer:
(1) declares or pays any dividends or distributions, or makes any other payment on any of itsJunior Obligations or Parity Obligations (except in relation to Parity Obligations, on apro-rata basis with the Securities), except where such dividend, distribution or payment isrequired to be declared or made in respect of an employee benefit plan or similararrangement with or for the benefit of employees, officers, directors or consultants; or
(2) redeems, reduces, cancels, buy-backs or acquires for any consideration any of its JuniorObligations or Parity Obligations other than (i) as a result of the exchange or conversionof its Parity Obligations for its Junior Obligations or (ii) in connection with an employeebenefit plan or similar arrangement with or for the benefit of employees, officers,directors or consultants.
“Early Redemption Amount” means the greater of:
(a) the principal amount of the Securities, together with any Interest accrued to the date fixed forredemption (including any Arrears of Interest and any Additional Interest Amounts); and
(b) the Make Whole Amount, together with any Interest accrued to the date fixed for redemption(including any Arrears of Interest and any Additional Interest Amounts).
“First Reset Interest Rate” means the Treasury Rate (as calculated on the New York Business Daypreceding the First Call Date) plus the Initial Spread.
“Fitch” means Fitch Ratings Ltd. (or a successor to the rating business thereof).
— 199 —

“Group” means the Issuer and its Subsidiaries.
“Initial Interest Rate” means 9.75% per annum.
“Initial Public Offering” means the initial public offering of the shares of the Relevant Listco.
“Initial Spread” means 8.57%.
“Interest Payment Date” means February 11 and August 11 of each year.
“Interest Rate” means the Initial Interest Rate, the First Reset Interest Rate, the Second Reset InterestRate or, as the case may be, the Relevant Reset Interest Rate.
“IPO Ratings Criteria” means that the initial credit rating ascribed to the Relevant Listco on or afterthe Initial Public Offering by each of (i) Fitch and (ii) S&P shall be not lower than the most recentrating ascribed to the Issuer prior to the Initial Public Offering.
“Junior Obligations” means any class of the Issuer’s, BILT’s or, as the case may be, the RelevantListco’s share capital, including any securities (including without limitation any preference shares)ranking in priority in payment and in all other respects to the ordinary shares of the Issuer, BILT or, asthe case may be, the Relevant Listco but junior to the Securities and the terms of which provide thatthe making of payments thereon or distributions in respect thereof are fully at the discretion of theIssuer, BILT or, as the case may be, the Relevant Listco.
“Make Whole Amount” means the amount, as determined by the Calculation Agent, equal to the sumof (a) the present value of the principal amount of the Securities to be redeemed discounted from thenext Call Date, and (b) the present value of all Interest payable (or but for any deferral would bepayable) on an Interest Payment Date after such redemption date (exclusive of Interest accrued to theredemption date) to, and including, the next Call Date, discounted to the redemption date on a semi-annual basis (assuming a 360 day year consisting of twelve 30 day months) at the Treasury Rate plus1.50 per cent. per annum.
“New York Business Day” means any day, excluding a Saturday and a Sunday, on which banks areopen for general business (including dealings in foreign currencies) in New York City.
“Non-Subsidiary IPO Entity” means, in relation to an Initial Public Offering, either:
(a) the Issuer; or
(b) a Relevant Listco that is not a Subsidiary of the Issuer.
“Parity Obligations” means any instrument or security issued, entered into or guaranteed by theIssuer, BILT or, as the case may be, the Relevant Listco (i) which ranks or is expressed to rank, by its
— 200 —

terms or by operation of law, pari passu with the Securities and (ii) the terms of which provide that themaking of payments thereon or distributions in respect thereof are fully at the discretion of the Issuer,BILT or, as the case may be, the Relevant Listco.
“Permitted Exchange” means any of the following main markets of (i) the London Stock Exchangeplc, (ii) the Bombay Stock Exchange Limited, (iii) the National Stock Exchange of India Limited,(iv) the Stock Exchange of Hong Kong Limited, (v) the SGX-ST, (vi) the New York Stock Exchange,(vii) the São Paulo Stock Exchange (BOVESPA), (viii) the Luxembourg Stock Exchange, (ix) theDeutsche Börse AG and (x) the NASDAQ Stock Market.
“Qualifying Criteria” means each of the following, as applied to an Initial Public Offering:
(a) the shares of the Relevant Listco are listed and admitted to trading on a Permitted Exchange;and
(b) all or substantially all of the assets of the Group are vested in the Relevant Listco.
“Qualifying Public Offering” means an Initial Public Offering which satisfies:
(a) the Qualifying Criteria; and
(b) if (i) the Relevant Listco is not the Issuer and (ii) such Relevant Listco is not substituted asprincipal obligor under the Securities in accordance with the provisions set out under“— Substitution of the Issuer”, the IPO Ratings Criteria.
“Qualifying Securities” means securities that:
(a) are issued by the Issuer or any wholly-owned direct or indirect finance subsidiary of the Issuerwith a guarantee of the Issuer;
(b) themselves or, as appropriate, the guarantee as aforesaid rank: (x) pari passu on a Winding-Upwith the Securities; (y) contain terms which provide at least for the same Interest Rate fromtime to time applying to the Securities; and (z) otherwise have substantially identical terms (asreasonably determined by the Issuer) to the Securities save where any modifications to suchother terms (excluding the preceding subclauses (x) and (y)) are required to be made to avoidthe occurrence of a Special Event;
(c) are listed on the Official List of the main board of either the SGX-ST or the Stock Exchange ofHong Kong Limited; and
(d) are awarded 50% equity content by S&P and Fitch.
— 201 —

“Reference Treasury Dealer” means The Hongkong and Shanghai Banking Corporation Limited andThe Royal Bank of Scotland plc and their respective successors and assigns and three otherinternationally recognized investment banking firms selected by the Issuer (and notified in writing tothe Calculation Agent) that are primary U.S. Government securities dealers.
“Reference Treasury Dealer Quotations” means with respect to each Reference Treasury Dealer andany determination date, the average, as determined by the Calculation Agent, of the bid and askedprices for the Comparable Treasury Issue, expressed in each case as a percentage of its principalamount, quoted in writing to the Calculation Agent by such Reference Treasury Dealer at 5:00 p.m.,New York City time, on the New York Business Day immediately preceding such redemption date.
“Relevant Listco” means the Issuer or, if another entity is used to effect the Initial Public Offering,such other entity.
“Relevant Reset Interest Rate” means the Treasury Rate (as calculated on the New York BusinessDay preceding the relevant Reset Date) plus the Initial Spread plus the Step-Up Margin.
“Remaining Life” means the remaining term of the Securities from the applicable redemption date tothe next Call Date after such redemption date.
“Reset Date” means the First Call Date, the Second Call Date and the day falling every five calendaryears after the Second Call Date.
“Reset Interest Rate” means the First Reset Interest Rate, the Second Reset Interest Rate or, as thecase may be, the Relevant Reset Interest Rate.
“Second Reset Interest Rate” means the Treasury Rate (as calculated on the New York Business Daypreceding the Second Call Date) plus the Initial Spread plus the Step-Up Margin.
“Sideco” means an entity which is neither (a) a direct or indirect shareholder of the Issuer nor (b) aSubsidiary of the Issuer, or any of the Issuer’s Subsidiaries.
“Special Event” means a Withholding Tax Event, a Tax Deduction Event, an Accounting Event or aCapital Event.
“Step-Up Margin” means 1%.
“Subsidiary” means, at any time, any entity in respect of which an entity (directly or indirectlythrough one or more intermediaries, including other Subsidiaries) has the voting power to elect amajority of the board of directors or other managers or otherwise has control over management orpolicy.
— 202 —
“Subsidiary IPO Entity” means, in relation to an Initial Public Offering, a Relevant Listco that is aSubsidiary of the Issuer.
“S&P” means Standard & Poor’s Rating Services, a division of the McGraw-Hill Companies, Inc. (or asuccessor to the rating business thereof).
“Tax Deduction Event means that the Issuer or, after an Initial Public Offering, the Issuer or theRelevant Listco has (i) obtained an opinion in writing from an independent tax advisor of goodstanding and delivered the same to the Trustee and (ii) delivered an officers’ certificate to the Trustee,each to the effect that Interest payments under the Securities were, but are or will no longer be,tax-deductible by the Issuer or, after an Initial Public Offering, the Issuer or the Relevant Listco forDutch or, as the case may be, the tax domicile of the Relevant Listco for corporate income tax purposesby reason of:
(a) any actual or proposed change in or amendment to the laws, regulations or rulings of TheNetherlands or the tax domicile of the Relevant Listco, as the case may be, or any politicalsubdivision or taxing authority thereof or therein; or
(b) any actual or proposed change in the official application or interpretation of such laws,regulations or rulings; or
(c) any action which shall have been taken by any taxing authority or any court of competentjurisdiction of The Netherlands or the tax domicile of the Relevant Listco, as the case may be,or any political subdivision or taxing authority thereof or therein, whether or not such actionwas taken or brought with respect to the Issuer or, after an Initial Public Offering, the Issuer orthe Relevant Listco, which change, amendment or execution becomes effective, taking of actionoccurs, or proposal is made, on or after August 4, 2011.
“Treasury Rate” means the rate in per cent. per annum notified by the Calculation Agent to the Issuerand the holders of the Securities equal to the yield, under the heading that represents the average forthe week immediately prior to the relevant Reset Date, appearing in the most recently publishedstatistical release designated “H.15(519)” or any successor publication that is published weekly by theBoard of Governors of the Federal Reserve System and that establishes yields on actively traded U.S.Treasury securities adjusted to constant maturity under the caption “Treasury constant maturities” forthe maturity corresponding to the Comparable Treasury Issue (in the case of calculating a Make WholeAmount, if there is no Comparable Treasury Issue with a maturity within three months before or afterthe next Call Date after such redemption date, yields for the two published maturities most closelycorresponding to such Call Date will be determined and the Treasury Rate will be interpolated orextrapolated from such yields on a straight line basis, rounding to the nearest month). If such release(or any successor release) is not published during the week preceding the relevant Reset Date or doesnot contain such yields, “Treasury Rate” means the rate in per cent. per annum equal to the semi-annual equivalent yield to maturity of the Comparable Treasury Issue, calculated using a price for theComparable Treasury Issue (expressed as a percentage of its principal amount) equal to theComparable Treasury Price for the relevant Reset Date. The Treasury Rate will be calculated on theNew York Business Day preceding the relevant Reset Date.
— 203 —

“Winding-Up” means, with respect to the Issuer, or as the case may be, the Relevant Listco, a finaland effective order or resolution for the bankruptcy, winding-up, liquidation, receivership, insolvencyor similar proceedings in respect of the Issuer, or as the case may be, the Relevant Listco.
“Withholding Tax Event” means that the Issuer or, after an Initial Public Offering, the Issuer or theRelevant Listco has (i) obtained an opinion in writing from a reputable firm of lawyers of goodstanding and delivered the same to the Trustee and (ii) delivered an officers’ certificate to the Trustee,each to the effect that the Issuer or, after an Initial Public Offering, the Issuer or the Relevant Listcowould be required to pay Additional Tax Amounts upon the next due date for a payment in respect ofthe Securities by reason of:
(a) any actual or proposed change in or amendment to the laws, regulations or rulings of TheNetherlands or the tax domicile of the Relevant Listco, as the case may be, or any politicalsubdivision or taxing authority thereof or therein; or
(b) any actual or proposed change in the official application or interpretation of such laws,regulations or rulings; or
(c) any action which shall have been taken by any taxing authority or any court of competentjurisdiction of The Netherlands or the tax domicile of the Relevant Listco, as the case may be,or any political subdivision or taxing authority thereof or therein, whether or not such actionwas taken or brought with respect to the Issuer or, after an Initial Public Offering, the Issuer orthe Relevant Listco, which change, amendment or execution becomes effective, taking of actionoccurs, or proposal is made, on or after August 4, 2011.
— 204 —

TAXATION
Netherlands Taxation
The following summary describes the principal Netherlands tax consequences of the acquisition,holding, redemption and disposal of an interest in the Securities. This summary does not purport to bea comprehensive description of all Netherlands tax considerations that may be relevant to be a decisionto acquire, to hold and to dispose of the Securities. This summary is intended as general informationonly and each prospective investor should consult a professional tax adviser with respect to the taxconsequences of an investment in the Notes.
This summary is based on the Netherlands tax legislation, published case law, treaties, rules,regulations and similar documentation as currently in effect, without prejudice to any amendmentsintroduced at a later date and implemented with retroactive effect.
This summary does not address the Netherlands tax consequences for:
(i) holders of Securities holding a substantial interest (aanmerkelijk belang) or deemed substantialinterest (fictief aanmerkelijk belang) in the Issuer and holders of Securities of whom a certainrelated person holds a substantial interest in the Issuer. Generally speaking, a substantialinterest in the Issuer arises if a person, alone or, where such person is an individual, togetherwith his or her partner (statutory defined term), directly or indirectly, holds or is deemed tohold (i) an interest of 5% or more of the total issued capital of the Issuer or of 5% or more ofthe issued capital of a certain class of shares of the Issuer, (ii) rights to acquire, directly orindirectly, such interest or (iii) certain profit sharing rights in the Issuer;
(ii) investment institutions (fiscale beleggingsinstellingen); and
(iii) pension funds, exempt investment institutions (vrijgestelde beleggingsinstellingen) or otherentities that are exempt from Netherlands corporate income tax.
Where this summary refers to a holder of Securities, such reference is restricted to a holder holdinglegal title to as well as an economic interest in such Securities.
Where this summary refers to the Netherlands, such reference is restricted to the part of the Kingdomof the Netherlands that is situated in Europe and the legislation applicable in that part of the Kingdom.
Withholding Tax
All payments made by the Issuer under the Securities may be made free of withholding or deductionfor any taxes of whatsoever nature imposed, levied, withheld or assessed by the Netherlands or anypolitical subdivision or taxing authority thereof or therein.
— 205 —

Corporate and Individual Income Tax
(a) Residents of the Netherlands
If a holder of Securities is a resident or deemed to be a resident of the Netherlands for Netherlands taxpurposes and is fully subject to Netherlands corporate income tax or is only subject to Netherlandscorporate income tax in respect of an enterprise to which the Securities are attributable, incomederived from the Securities and gains realized upon the redemption, settlement or disposal of theSecurities are generally taxable in the Netherlands (at up to a maximum corporate income tax rate of25%).
If an individual holder of Securities is a resident or deemed to be a resident of the Netherlands forNetherlands tax purposes (including an individual holder who has opted to be taxed as a resident of theNetherlands), income derived from the Securities and gains realized upon the redemption, settlement ordisposal of the Securities are taxable at the progressive income tax rates (at up to a maximum incometax rate of 52%) under the Netherlands income tax act 2001 (Wet inkomstenbelasting 2001), if:
(i) the holder is an entrepreneur (ondernemer) and has an enterprise to which the Securities areattributable or the holder has, other than as a shareholder, a co-entitlement to the net worth ofan enterprise (medegerechtigde), to which enterprise the Securities are attributable; or
(ii) such income or gains qualify as income from miscellaneous activities (resultaat uit overigewerkzaamheden), which include the performance of activities with respect to the Securities thatexceed regular, active portfolio management (normal, actief vermogensbeheer).
If neither condition (i) nor condition (ii) applies to the holder of the Securities, taxable income withregard to the Securities must be determined on the basis of a deemed return on income from savingsand investments (sparen en beleggen), rather than on the basis of income actually received or gainsactually realized. As of January 1, 2011, this deemed return on income from savings and investmentshas been fixed at a rate of 4% of the individual’s yield basis (rendementsgrondslag) at the beginning ofthe calendar year, insofar as the individual’s yield basis exceeds a certain threshold. The individual’syield basis is determined as the fair market value of certain qualifying assets held by the holder of theSecurities less the fair market value of certain qualifying liabilities on January 1,. The fair marketvalue of the Securities will be included as an asset in the individual’s yield basis. The 4% deemedreturn on income from savings and investments is taxed at the special income tax rate of 30%.
(b) Non-residents of the Netherlands
If a holder of Securities is not a resident nor is deemed to be a resident of the Netherlands forNetherlands tax purposes (nor has opted to be taxed as a resident of the Netherlands), such holder isnot liable to Dutch income tax in respect of income derived from the Securities and gains realized uponthe settlement, redemption or disposal of the Securities, unless:
(i) the holder is not an individual and such holder (1) has an enterprise that is, in whole or in part,carried on through a permanent establishment or a permanent representative in the Netherlandsto which permanent establishment or permanent representative the Securities are attributable,
— 206 —

or (2) is, other than by way of securities, entitled to a share in the profits of an enterprise or aco-entitlement to the net worth of an enterprise, which is effectively managed in theNetherlands and to which enterprise the Securities are attributable. This income is subject toNetherlands corporate income tax at up to a maximum rate of 25%.
(ii) the holder is an individual and such holder (1) has an enterprise or an interest in an enterprisethat is, in whole or in part, carried on through a permanent establishment or a permanentrepresentative in the Netherlands to which permanent establishment or permanentrepresentative the Securities are attributable, or (2) realizes income or gains with respect to theSecurities that qualify as income from miscellaneous activities (resultaat uit overigewerkzaamheden) in the Netherlands, which activities include the performance of activities inthe Netherlands with respect to the Securities which exceed regular, active portfoliomanagement (normal, actief vermogensbeheer), or (3) is, other than by way of securities,entitled to a share in the profits of an enterprise which is effectively managed in theNetherlands and to which enterprise the Securities are attributable.
Income derived from the Securities as specified under (1) and (2) is subject to individual incometax at up to a maximum rate of 52%. Income derived from a share in the profits as specified under(3) that is not already included under (1) or (2) will be taxed on the basis of a deemed return onincome from savings and investments (as described above under “Residents of the Netherlands”).The fair market value of the share in the profits of the enterprise (which includes the Securities)will be part of the individual’s Netherlands yield basis.
Gift and Inheritance Tax
Residents of the Netherlands
Generally, gift and inheritance tax will be due in the Netherlands in respect of the acquisition of theSecurities by way of a gift by, or on behalf of, or on the death of, a holder that is a resident or deemedto be a resident of the Netherlands for the purposes of Netherlands gift and inheritance tax at the timeof the gift or his or her death. A gift made under a condition precedent is deemed to be a made at thetime the condition precedent is fulfilled and is subject to Dutch gift and inheritance tax if the donor isa (deemed) resident of the Netherlands at that time.
A holder of a Security who has the Dutch nationality is deemed to be a resident of the Netherlands forthe purposes of the Netherlands gift and inheritance tax if he or she has been resident in theNetherlands and dies or makes a gift within ten years after leaving the Netherlands. A holder of aSecurity having any other nationality is deemed to be a resident of the Netherlands for the purposes ofthe Netherlands gift tax if he or she has been resident in the Netherlands and makes a gift of a Securitywithin a twelve months period after leaving the Netherlands.
Non-Residents of the Netherlands
No gift or inheritance taxes will arise in the Netherlands in respect of the acquisition of the Securitiesby way of a gift by, or as a result of, the death of a holder that is neither a resident nor deemed to be aresident of the Netherlands for the purposes of Netherlands gift and inheritance tax, unless in the caseof a gift of the Securities by, or on behalf of, a holder who at the date of the gift was neither a resident
— 207 —
nor deemed to be a resident of the Netherlands, such holder dies within 180 days after the date of thegift, and at the time of his or her death is a resident or deemed to be a resident of the Netherlands. Agift made under a condition precedent is deemed to be a made at the time the condition precedent isfulfilled.
Value Added Tax
In general, no value added tax will arise in respect of payments in consideration for the issue of theSecurities or in respect of a cash payment made under the Securities, or in respect of a transfer ofSecurities.
Other Taxes and Duties
No registration tax, customs duty, transfer tax, stamp duty or any other similar documentary tax orduty will be payable in the Netherlands by a holder in respect of or in connection with the subscription,issue, placement, allotment, delivery or transfer of the Securities.
EU Savings Directive
Under EC Council Directive 2003/48/EC on the taxation of savings income, Member States arerequired to provide to the tax authorities of another Member State details of payments of interest (orsimilar income) paid by a person within its jurisdiction to an individual resident in that other MemberState or to certain limited types of entities established in that other Member State. However, for atransitional period, Luxembourg and Austria are instead required (unless during that period they electotherwise) to operate a withholding system in relation to such payments (the ending of suchtransitional period being dependent upon the conclusion of certain other agreements relating toinformation exchange with certain other countries). A number of non-EU countries and territoriesincluding Switzerland have adopted similar measures (a withholding system in the case ofSwitzerland). The European Commission has proposed certain amendments to the Directive, whichmay, if implemented, amend or broaden the scope of the requirements described above.
Certain United States Tax Considerations
TO ENSURE COMPLIANCE WITH INTERNAL REVENUE SERVICE (IRS) CIRCULAR 230,EACH TAXPAYER IS HEREBY NOTIFIED THAT: (A) ANY TAX DISCUSSION HEREIN ISNOT INTENDED OR WRITTEN TO BE USED, AND CANNOT BE USED BY THE TAXPAYERFOR THE PURPOSE OF AVOIDING U.S. FEDERAL INCOME TAX PENALTIES THAT MAYBE IMPOSED ON THE TAXPAYER; (B) ANY SUCH TAX DISCUSSION WAS WRITTEN TOSUPPORT THE PROMOTION OR MARKETING OF THE TRANSACTIONS OR MATTERSADDRESSED HEREIN; AND (C) THE TAXPAYER SHOULD SEEK ADVICE BASED ON THETAXPAYER’S PARTICULAR CIRCUMSTANCES FROM AN INDEPENDENT TAX ADVISER.
The following is a summary of certain U.S. federal income tax considerations relevant to U.S. Holdersand non-U.S. Holders (as defined below) acquiring, holding and disposing of the Securities. Thissummary is based on the U.S. Internal Revenue Code of 1986, as amended (the “Code”), final,
— 208 —

temporary and proposed U.S. Treasury regulations, administrative and judicial interpretations, all ofwhich are subject to change, possibly with retroactive effect, as well as on the income tax treatybetween the United States and the Netherlands as currently in force (the “Treaty”).
This summary does not discuss all aspects of U.S. federal income taxation that may be relevant toinvestors in light of their particular circumstances, such as investors subject to special tax rules(including, without limitation: (i) financial institutions; (ii) insurance companies; (iii) dealers instocks, securities, or currencies or notional principal contracts; (iv) regulated investment companies;(v) real estate investment trusts; (vi) tax-exempt organizations; (vii) partnerships, pass-throughentities, or persons that hold the Securities through pass-through entities; (viii) holders that own(directly, indirectly or constructively) 10% or more of the voting stock of the Issuer; (ix) investors thathold Securities as part of a straddle, hedge, conversion, constructive sale or other integratedtransaction for U.S. federal income tax purposes; (x) investors that have a functional currency otherthan the US dollar and (xi) U.S. expatriates and former long-term residents of the United States), all ofwhom may be subject to tax rules that differ significantly from those summarized below. This summarydoes not address tax consequences applicable to holders of equity interests in a holder of theSecurities, U.S. federal estate, gift or alternative minimum tax considerations, or non-U.S., state orlocal tax considerations. This summary only addresses investors that will acquire the Securities in theOffer, and it assumes that investors will hold their Securities as capital assets (generally, property heldfor investment).
If an entity that is classified as a partnership for U.S. federal income tax purposes holds Securities, theU.S. federal income tax treatment of a partner in such partnership will generally depend on the statusof the partner and the activities of the partnership. Partnerships holding Securities and partners in suchpartnerships should consult their tax advisers as to the particular U.S. federal income tax consequencesof holding and disposing of the Securities.
For the purposes of this summary, a “U.S. Holder” is a beneficial owner of Securities that is for U.S.federal income tax purposes (i) an individual who is a citizen or resident of the United States, (ii) acorporation created in, or organized under the laws of, the United States or any state thereof, includingthe District of Columbia, (iii) an estate the income of which is includible in gross income for U.S.federal income tax purposes regardless of its source or (iv) a trust that is subject to U.S. tax on itsworldwide income regardless of its source. A “Non-U.S. Holder” is a beneficial owner of Securitiesthat is not a U.S. Holder.
U.S. Federal Income Tax Characterization of the Securities
For U.S. federal income tax purposes, one of the primary characteristics used to distinguish thetreatment of an instrument as debt from an instrument treated as equity is whether the instrument,according to its terms, involves an unconditional promise to pay a fixed sum certain on a specified datein the future. The Issuer believes that the Securities, due to their perpetual term, should be treated asequity for U.S. federal income tax purposes, and the following discussion assumes such treatment.However, no assurance can be given that the Internal Revenue Service (“IRS”) will not assert that theSecurities should be treated as indebtedness of the Issuer for U.S. federal income tax purposes. If theSecurities were treated as indebtedness of the Issuer for U.S. federal income tax purposes, the timing,
— 209 —

amount and character of income, gain or loss recognized by a U.S. Holder could be different. Eachholder of Securities should consult its tax advisors with respect to the U.S. federal income taxcharacterization of the Securities.
U.S. Holders
Taxation of Distributions
Subject to the passive foreign investment company (“PFIC”) rules discussed below, the gross amountof any distribution made by the Issuer on the Securities (including amounts withheld in respect ofDutch or Indian taxes, if any) will generally be treated as a dividend includible in the gross income ofa U.S. Holder as ordinary income to the extent of the Issuer’s current and accumulated earnings andprofits as determined under U.S. federal income tax principles. To the extent the amount of suchdistribution exceeds the Issuer’s current and accumulated earnings and profits as so computed, thedistribution will be treated first as a non-taxable return of capital to the extent of such U.S. Holder’sadjusted tax basis in the Securities and, to the extent the amount of such distribution exceeds suchadjusted tax basis, will be treated as gain from the sale of such Securities. The Issuer does not maintaincalculations of its earnings and profits under U.S. federal income tax principles. Therefore, U.S.Holders should expect that the full amount of any distribution by the Issuer generally will be treated asa dividend for U.S. federal income tax purposes. Such dividends will not be eligible for the dividendsreceived deduction allowed to corporations.
“Qualified dividend income” received by individual and certain other non-corporate U.S. Holders intax years beginning before January 1, 2013, will be subject to a maximum U.S. federal income tax rateof 15% if (i) the issuer is a “qualified foreign corporation” (as defined below) and (ii) such dividend ispaid on Securities that have been held by such U.S. Holder for at least 61 days during the 121-dayperiod beginning 60 days before the ex-dividend date. An issuer generally will be a “qualified foreigncorporation” if (1) it is either (a) eligible for the benefits of the Treaty, or (b) if the stock with respectto which such dividend is paid is readily tradable on an established securities market in the UnitedStates, and (2) it is not a PFIC in the taxable year of the distribution or the immediately precedingtaxable year. Dividends on the Securities will not be eligible for the preferential income tax rate on“qualified dividend income” under US federal income tax law because the Issuer does not expect to beeligible for the benefits of the Treaty. Dividends on the Securities generally will constitute incomefrom sources outside the United States for foreign tax credit limitation purposes. The amount of anydistribution of property other than cash will be the fair market value of the property on the date of thedistribution.
The US dollar value of any distribution made by the Issuer in a foreign currency must be calculated byreference to the exchange rate in effect on the date of receipt of such distribution by the U.S. Holder,regardless of whether the foreign currency is in fact converted into US dollars. If the foreign currencyso received is converted into US dollars on the date of receipt, such U.S. Holder will not recognizeforeign currency gain or loss on such conversion. If the foreign currency so received is not convertedinto US dollars on the date of receipt, such U.S. Holder will have a basis in the foreign currency equalto its US dollar value on the date of receipt. Any gain on a subsequent conversion or other dispositionof the foreign currency generally will be treated as ordinary income or loss to such U.S. Holder and
— 210 —

generally will be income or loss from sources within the United States for foreign tax credit limitationpurposes. The rules governing foreign tax credits are complex, and U.S. Holders should consult theirtax advisers regarding the creditability of foreign taxes in their particular circumstances.
Sale or other disposition of Securities
Subject to the PFIC rules discussed below, a U.S. Holder generally will recognize gain or loss for U.S.federal income tax purposes upon a sale or other disposition of its Securities in an amount equal to thedifference between the amount realized from such sale or disposition and the U.S. Holder’s adjustedtax basis in such Securities as determined in US dollars. Such gain or loss generally will be capitalgain or loss and will be long-term capital gain (taxable at a reduced rate for non-corporate U.S.Holders, such as individuals) or loss if, on the date of sale or disposition, such Securities were held bysuch U.S. Holder for more than one year. The deductibility of capital losses is subject to significantlimitations. Such gain or loss realized generally will be treated as derived from U.S. sources.
A U.S. Holder that receives foreign currency from a sale or disposition of Securities generally willrealize an amount equal to the US dollar value of the foreign currency on the date of sale or dispositionor, if such U.S. Holder is a cash basis or electing accrual basis taxpayer and the Securities are treatedas being traded on an “established securities market” for this purpose, the settlement date. If theSecurities are so treated and the foreign currency received is converted into US dollars on thesettlement date, a cash basis or electing accrual basis U.S. Holder will not recognize foreign currencygain or loss on the conversion. If the foreign currency received is not converted into US dollars on thesettlement date, the U.S. Holder will have a basis in the foreign currency equal to the US dollar valueon the settlement date. Any gain or loss on a subsequent conversion or other disposition of the foreigncurrency generally will be treated as ordinary income or loss to such U.S. Holder and generally will beincome or loss from sources within the United States for foreign tax credit limitation purposes. Therules governing foreign tax credits are complex, and U.S. Holders should consult their tax advisersregarding the creditability of foreign taxes in their particular circumstances.
Passive foreign investment company rules
In general, a corporation organized or incorporated outside the United States is a PFIC in any taxableyear in which, after taking into account the income and assets of certain subsidiaries, either (i) at least75% of its gross income is classified as “passive income” or (ii) at least 50% of the average quarterlyvalue attributable to its assets produce or are held for the production of passive income. Passiveincome for this purpose generally includes dividends, interest, royalties, rents and gains fromcommodities and securities transactions.
Based on the present nature of its activities, including the planned issue of Securities and the expecteduse of the proceeds, and the present and projected composition of its income and valuation of its assets,the Issuer believes that it was not a PFIC for the year ending on June 30, 2010 or the year ending onJune 30, 2011 and does not expect to become a PFIC for the current year or for any future taxable year.PFIC status is factual in nature and will depend on the composition of the Issuer’s income and assetsfrom time to time, generally cannot be determined until the close of the taxable year in question, and isdetermined annually. If the Issuer is classified as a PFIC in any year that a U.S. Holder is ashareholder, the Issuer will continue to be treated as a PFIC for that U.S. Holder in all succeeding
— 211 —

years, regardless of whether the Issuer continues to meet the income or asset test described above. Ifthe Issuer were a PFIC in any taxable year, materially adverse U.S. federal income tax consequencescould result for U.S. Holders, as discussed below. If the Issuer is not a PFIC, the general tax treatmentdescribed above under “— Dividends” and “— Sale or other disposition” should apply.
If a U.S. Holder does not make a valid election as discussed below, and the Issuer is a PFIC for anytaxable year during which an investor is a U.S. Holder, the investor will be subject to special tax ruleswith respect to any “excess distribution” received and any gain realized from a sale or other disposition(including a pledge) of Securities. Distributions received in a taxable year that are greater than 125%of the average annual distributions received during the shorter of the three preceding taxable years orthe U.S. Holder’s holding period for the Securities will be treated as excess distributions. Under thesespecial tax rules, (i) the excess distribution or gain will be allocated ratably over the U.S. Holder’sholding period for the Securities; (ii) the amount allocated to the current taxable year and any taxableyear before the Issuer became a PFIC will be treated as ordinary income; and (iii) the amount allocatedto each other year will be subject to tax at the highest tax rate in effect for that year and an interestcharge (at the rate generally applicable to underpayments of tax for the period from such year to thecurrent year) will be imposed on the resulting tax attributable to each such year.
A U.S. Holder subject to the PFIC rules discussed above or below is required to file IRS Form 8621with respect to its investment in the Securities. In addition, recently enacted legislation may require aU.S. Holder subject to the PFIC rules to file additional information with the IRS.
Mark-to-market election
To mitigate any adverse consequences arising from the application of the PFIC rules discussed above,a U.S. Holder may make an election to include gain or loss on the Securities as ordinary income or lossunder a mark-to-market method, provided that the Securities are regularly traded on a qualifiedexchange. The Securities are expected to be listed on the BSE and the NSE, each of which the Issuerexpects to be a qualified exchange. No assurance can be given that the Securities will be “regularlytraded” for purposes of the mark-to-market election.
If a U.S. Holder makes an effective mark-to-market election, the U.S. Holder will include in each yearas ordinary income the excess of the fair market value of its Securities at the end of the year over itsadjusted tax basis in the Securities. The U.S. Holder will be entitled to deduct as an ordinary loss eachyear the excess of its adjusted tax basis in the Securities over their fair market value at the end of theyear, but only to the extent of the net amount previously included in income as a result of themark-to-market election. A U.S. Holder’s adjusted tax basis in the Securities will be increased by theamount of any income inclusion and decreased by the amount of any deductions under themark-to-market rules. In addition, gains from an actual sale or other disposition of Securities will betreated as ordinary income, and any losses will be treated as ordinary losses to the extent of anymark-to-market gains for prior years.
If the Issuer is determined to be a PFIC, the PFIC rules discussed above could apply to indirectdistributions or deemed gains in respect of any of the Issuer’s subsidiaries that also may be determinedto be a PFIC, and the mark-to-market election generally would not be effective for such subsidiaries.U.S. Holders should consult their tax advisers regarding whether the mark-to-market election is
— 212 —

available and the consequences of making such election. If a U.S. Holder makes a mark-to-marketelection, it will be effective for the taxable year for which the election is made and all subsequenttaxable years unless the Securities are no longer regularly traded on a qualified exchange or the IRSconsents to the revocation of the election.
Qualified electing fund election
To mitigate any adverse consequences arising from the application of the PFIC rules discussed above,a U.S. Holder may make an election to treat the Issuer as a qualified electing fund (“QEF”) for U.S.federal income tax purposes. To make a QEF election, the Issuer must provide U.S. Holders withinformation compiled according to U.S. federal income tax principles. The Issuer currently does notintend to compile such information for U.S. Holders, and therefore it is expected that this election willbe unavailable.
Non-U.S. Holders
A Non-U.S. Holder generally should not be subject to U.S. federal income or withholding tax on anydistributions made on the Securities or gain from the sale, redemption or other disposition of theSecurities unless: (i) that distribution and/or gain is effectively connected with the conduct by thatNon-U.S. Holder of a trade or business in the United States; or (ii) in the case of any gain realized onthe sale or exchange of Securities by an individual Non-U.S. Holder, that Non-U.S. Holder is present inthe United States for 183 days or more in the taxable year of the sale, exchange or retirement andcertain other conditions are met.
Information reporting and backup withholding tax
A U.S. Holder may be subject to information reporting unless it establishes that payments to it areexempt from these rules. Payments that are subject to information reporting may be subject to backupwithholding if a U.S. Holder does not provide its taxpayer identification number and otherwise complywith the backup withholding rules. Non-U.S. Holders may be required to comply with applicablecertification procedures to establish that they are not U.S. Holders in order to avoid the application ofsuch information reporting requirements and backup withholding. Backup withholding is not anadditional tax. Amounts withheld under the backup withholding rules are available to be creditedagainst a U.S. Holder’s U.S. federal income tax liability and may be refunded to the extent they exceedsuch liability, provided the required information is timely provided to the IRS.
Under U.S. federal income tax law and regulations, certain categories of U.S. persons must fileinformation returns with respect to their investment in the equity interests of a foreign corporation. AU.S. person that purchases Securities for cash will be required to file IRS Form 926 or similar form ifthe transfer, when aggregated with all transfers made by such person (or any related person) within thepreceding 12 month period, exceeds US$100,000. In the event a U.S. Holder fails to file any suchrequired form, the U.S. Holder could be required to pay a penalty equal to 10% of the gross amountpaid for such Securities up to a maximum penalty of US$100,000.
Each holder of Securities should consult its tax advisors regarding the applicability of the above andany other information reporting rules under their particular circumstances.
— 213 —

Indian Taxation
The following summary describes certain Indian tax consequences applicable to the ownership anddisposal of the Securities by persons who are not resident for tax purposes in India and who do nothold the Securities in connection with an Indian trade, business or permanent establishment.
It is not intended to constitute a complete analysis of all the Indian tax consequences that may berelevant to a Securities Holder. It does not cover all tax matters that may be of importance to aparticular purchaser. Prospective investors should consult their own tax advisors about the taxconsequences of purchasing, holding and disposing of an investment in the Securities. This summary isbased on Indian tax law and practice as at the date of this Offering Circular. It may however be notedthat the Government of India has proposed a new tax legislation (Direct Tax Code Bill, 2010) in theIndian Parliament. The Direct Tax Code Bill, 2010 (“DTC”) is currently envisaged to come into forcefrom April 1, 2012 and proposes to introduce, among others, changes in the scheme of taxation ofincome of residents and non-residents in India. The DTC is currently a bill and may be amended priorto coming into force and there is no certainty about the nature and extent of the amendments, if any.
Income and withholding taxes
Securities Holders may not be subject to any income or withholding taxes in India in connection withpayments of interest made by the Issuer on the Securities in the manner set out in “Description of thePerpetual Capital Securities”.
If investors are held to be liable to tax on interest in India, then payments in respect of interest will besubject to withholding tax at the applicable rates which would vary according to the status of therecipient. The rate of tax will be reduced if the beneficial recipient is a resident of a country withwhich the Indian Government has entered into a Double Taxation Avoidance Agreement (“DTAA”) andthe provisions of such DTAA provide for taxation of such income at a reduced rate.
Taxation of gains arising on disposal of the Securities (including redemption)
Subject to any relief available under a DTAA, gains arising on disposals of capital assets situated inIndia are subject to income tax in India. Provided the Securities continue to be maintained at all timesin registered form on a register outside India, they should not be regarded as situated in India. As aresult, any gains arising on a disposal (including redemption) of a Security should not be subject totaxation in India.
— 214 —

PLAN OF DISTRIBUTION
The Issuer has entered into a purchase agreement with The Hongkong and Shanghai BankingCorporation Limited and The Royal Bank of Scotland plc (the “Joint Lead Managers and JointBookrunners”), dated August 4, 2011 (the “Purchase Agreement”), pursuant to which and subject tocertain conditions contained therein, the Issuer agreed to sell to the Joint Lead Managers and JointBookrunners, and the Joint Lead Managers and Joint Bookrunners, agreed to severally but not jointlysubscribe for the aggregate principal amount of the Securities at a price equal to 100% of the principalamount thereof indicated opposite its name in the following table.
Aggregateprinciple amount
of securities
The Hongkong and Shanghai Banking Corporation Limited . . . . . . . . . . . . . . . . . . . . . . . . . . U.S.$ 100,000,000The Royal Bank of Scotland plc . . . . . . . . . . . . . . . . . . . . . . . . . . . . . . . . . . . . . . . . . . . . . . . . U.S.$ 100,000,000
U.S.$ 200,000,000
The Initial Purchasers may offer and sell the Securities through certain of their affiliates and mayprovide such affiliates an opportunity to purchase some of the Securities in the initial offering.
The Securities are a new issue of securities with no established trading market. Approval in-principlehas been received for the listing and quotation of the Securities on the SGX-ST. We have been advisedby the Initial Purchasers that, in connection with the offering of the Securities, The Hongkong andShanghai Banking Corporation Limited, as the stabilization agent, may, on behalf of the InitialPurchasers, to the extent permitted by applicable laws and regulations, engage in transactions thatstabilize, maintain or otherwise affect the price of the Securities. Specifically, the Initial Purchasersmay over-allot the offering, creating a syndicate short position. In addition, the Initial Purchasers maybid for, and purchase, the Securities in the open market to cover syndicate shorts or to stabilize theprice of the Securities. Any of these activities, which may be effected in the over-the-counter market orotherwise, may stabilize or maintain the market price of the Securities above independent marketlevels. However, the Initial Purchasers are not obligated or required to engage in these activities, andmay end any of these activities at any time at their sole discretion without prior notice. No assurancecan be given as to the liquidity of, or the trading market for, the Securities.
We expect that delivery of the Securities will be made against payment therefor on or about August 11,2011, which we expect will be the fifth business day following the pricing date of the Securities (thissettlement cycle being referred to as “T+5”). Under Rule 15c6-1 of the Securities and Exchange Act of1934, as amended, trades in the secondary market generally are required to settle in three businessdays, unless the parties to any such trade expressly agree otherwise. Accordingly, purchasers who wishto trade Securities on the date of pricing or the next succeeding business day will be required, by virtueof the fact that the Securities initially will settle in T+5, to specify an alternate settlement cycle at thetime of any such trade to prevent a failed settlement. Purchasers of the Securities who wish to trade theSecurities on the date of pricing or succeeding business days should consult their own legal advisor.
The Purchase Agreement provides that the Issuer will indemnify the Joint Lead Managers and JointBookrunners against certain liabilities in connection with the offer and sale of the Securities. The
— 215 —

Purchase Agreement provides that the obligations of the Joint Lead Managers and Joint Bookrunnersare subject to certain conditions precedent, and entitles the Joint Lead Managers and Joint Bookrunnersto terminate it in certain circumstances prior to payment being made to the Issuer.
Investors who purchase Securities from the Initial Purchasers may be required to pay stamp taxes andother charges in accordance with the laws and practices of the country of purchase in addition to theoffering price set forth on the cover page of this Offering Circular. We have been advised that theInitial Purchasers presently intend to make a market in the Securities, as permitted by applicable lawsand regulations. The Initial Purchasers are not obligated, however, to make a market in the Securities,and any such market making may be discontinued at any time without prior notice at the sole discretionof the Initial Purchasers. Accordingly, no assurance can be given as to the liquidity of, or tradingmarkets for, the Securities.
The Joint Lead Managers and Joint Bookrunners and certain of their respective affiliates may haveperformed certain investment banking and advisory services for the Issuer, BILT and/or their affiliatesfrom time to time for which they have received customary fees and expenses and may, from time totime, engage in transactions with and perform services for the Issuer and/or its affiliates in the ordinarycourse of their business.
The Joint Lead Managers and Joint Bookrunners or certain of their respective affiliates may enter intotransactions, including credit derivatives, such as asset swaps, repackaging and credit default swapsrelating to the Securities and/or other securities of the Issuer or its subsidiaries or affiliates at the sametime as the offer and sale of the Securities or in secondary market transactions. Such transactionswould be carried out as bilateral trades with selected counterparties and separately from any existingsale or resale of the Securities to which this Offering Circular relates (notwithstanding that suchselected counterparties may also be purchasers of the Securities).
General
No action has been or will be taken in any jurisdiction by the Joint Lead Managers and JointBookrunners or either the Issuer or BILT that would, or is intended to, permit a public offering of theSecurities, or the possession or distribution of this Offering Circular or any amendment or supplementthereto or any offering or publicity material relating to the Securities, in any country or jurisdictionwhere action for that purpose is required.
Accordingly, the Securities should not be offered or sold, directly or indirectly, and neither thisOffering Circular nor any other offering material, circular, prospectus, form of application oradvertisement in connection with the Securities should be distributed or published in or from anyjurisdiction except in circumstances which will result in compliance with any applicable laws andregulations and will not impose any obligations on the Issuer, BILT or the Joint Lead Managers andJoint Bookrunners.
The distribution of this Offering Circular or any offering material and the offering, sale or delivery ofthe Securities is restricted by law in certain jurisdictions. Therefore, persons who may come intopossession of this Offering Circular or any offering material are advised to consult with their own legal
— 216 —

advisers as to what restrictions may be applicable to them and to observe such restrictions. ThisOffering Circular may not be used for the purpose of an offer or invitation in any circumstances inwhich such offer or invitation is not authorized.
UNITED STATES
In connection with offers and sales of Securities outside the United States:
(a) Each Initial Purchaser has acknowledged that the Securities have not been registered under theSecurities Act and may not be offered or sold within the United States or to, or for the accountor benefit of, U.S. persons except pursuant to an exemption from, or in transactions not subjectto, the registration requirements of the Securities Act.
(b) Each Initial Purchaser has represented, warranted and agreed that:
(i) Such Initial Purchaser has offered and sold the Securities, and will offer and sell theSecurities, (A) as part of their distribution at any time and (B) otherwise until 40 daysafter the later of the commencement of the offering of the Securities and the Closing Date,only in accordance with Regulation S under the Securities Act (“Regulation S”) orRule 144A or any other available exemption from registration under the Securities Act.
(ii) None of such Initial Purchaser or any of its affiliates or any other person acting on its ortheir behalf has engaged or will engage in any directed selling efforts with respect to theSecurities, and all such persons have complied and will comply with the offeringrestrictions requirement of Regulation S.
(iii) Neither it, its Affiliates nor any persons acting on its or their behalf have engaged, or willengage in any form of general solicitation or general advertising (as those terms are usedin Regulation D of the Securities Act) in connection with any offer, sale or resale of theSecurities in the United States.
(iv) At or prior to the confirmation of sale of any Securities sold in reliance on Regulation S,such Initial Purchaser will have sent to each distributor, dealer or other person receiving aselling concession, fee or other remuneration that purchase Securities from it during thedistribution compliance period a confirmation or notice to substantially the followingeffect:
“The Securities covered hereby have not been registered under the U.S. Securities Act of 1933, asamended (the “Securities Act”), and may not be offered or sold within the United States or to, or forthe account or benefit of, U.S. persons (i) as part of their distribution at any time or (ii) otherwise until40 days after the later of the commencement of the offering of the Securities and the date of originalissuance of the Securities, except in accordance with Regulation S or Rule 144A or any other availableexemption from registration under the Securities Act. Terms used above have the meanings given tothem by Regulation S.”
— 217 —

(v) Such Initial Purchaser has not and will not enter into any contractual arrangement withany distributor with respect to the distribution of the Securities, except with its affiliatesor with the prior written consent of the Company.
Terms used in paragraph (a) and this paragraph (b) and not otherwise defined in this Agreementhave the meanings given to them by Regulation S.
(c) Public offer selling restriction under the Prospectus Directive
In relation to each Member State of the European Economic Area which has implemented theProspectus Directive (each, a Relevant Member State), each Initial Purchaser has representedand agreed that with effect from and including the date on which the Prospectus Directive isimplemented in that Relevant Member State (the Relevant Implementation Date) it has notmade and will not make an offer of Securities which are the subject of the offering contemplatedby the Offering Circular to the public in that Relevant Member State other than:
(i) to any legal entity which is a qualified investor as defined in the Prospectus Directive;
(ii) to fewer than 100 or, if the Relevant Member State has implemented the relevantprovision of the 2010 PD Amending Directive, 150, natural or legal persons (other thanqualified investors as defined in the Prospectus Directive), as permitted under theProspectus Directive, subject to obtaining the prior consent of the relevant Dealer orDealers nominated by the Issuer for any such offer; or
(iii) in any other circumstances falling within Article 3(2) of the Prospectus Directive,
provided that no such offer of Securities shall require the Issuer or any Manager to publish aprospectus pursuant to Article 3 of the Prospectus Directive.
For the purposes of this provision, the expression an offer of Securities to the public in relationto any Securities in any Relevant Member State means the communication in any form and by anymeans of sufficient information on the terms of the offer and the Securities to be offered so as toenable an investor to decide to purchase or subscribe the Securities, as the same may be varied inthat Member State by any measure implementing the Prospectus Directive in that Member State,the expression Prospectus Directive means Directive 2003/71/EC (and amendments thereto,including the 2010 PD Amending Directive, to the extent implemented in the Relevant MemberState), and includes any relevant implementing measure in the Relevant Member State and theexpression 2010 PD Amending Directive means Directive 2010/73/EU.
(d) Selling Restrictions Addressing Additional United Kingdom Securities Laws
Each Initial Purchaser has represented, warranted and agreed that:
(i) it has only communicated or caused to be communicated and will only communicate orcause to be communicated any invitation or inducement to engage in investment activity
— 218 —

(within the meaning of Section 21 of the United Kingdom Financial Services and MarketsAct 2000 (the “FSMA”)) received by it in connection with the issue or sale of anySecurities in circumstances in which Section 21(1) of the FSMA does not apply to theCompany; and
(ii) it has complied and will comply with all applicable provisions of the FSMA with respectto anything done by it in relation to the Securities in, from or otherwise involving theUnited Kingdom.
(e) Each Initial Purchaser has acknowledged that no action has been or will be taken by theCompany or BILT that would permit a public offering of the Securities, or possession ordistribution of the Offering Circular or any other offering or publicity material relating to theSecurities, in any country or jurisdiction where action for that purpose is required.
(f) HONG KONG
Each Initial Purchaser has acknowledged, represented and agreed that:
i. it has not offered or sold and will not offer or sell in Hong Kong, by means of anydocument, any Securities other than (a) to “professional investors” as defined in theSecurities and Futures Ordinance (Cap. 571) of Hong Kong and any rules made under thatOrdinance; or (b) in other circumstances which do not result in the Offering Circularbeing a “prospectus” as defined in the Companies Ordinance (Cap. 32) of Hong Kong orwhich do not constitute an offer to the public within the meaning of that Ordinance; and
ii. it has not issued or had in its possession for the purposes of issue, and will not issue orhave in its possession for the purposes of issue, whether in Hong Kong or elsewhere, anyadvertisement, invitation or document relating to the Securities, which is directed at, orthe contents of which are likely to be accessed or read by, the public of Hong Kong(except if permitted to do so under the securities laws of Hong Kong) other than withrespect to Securities which are or are intended to be disposed of only to persons outsideHong Kong or only to “professional investors” as defined in the Securities and FuturesOrdinance and any rules made under that Ordinance.
(g) SINGAPORE
Each Initial Purchaser has acknowledged, represented and agreed that the Offering Circular hasnot been registered as a prospectus with the Monetary Authority of Singapore under the Securitiesand Futures Act, Cap. 289 of Singapore (the “SFA”) and accordingly, the Securities may not beoffered or sold, nor may the Securities be the subject of an invitation for subscription orpurchase, nor may the Offering Circular or any other document or material in connection with theoffer or sale, or invitation for subscription or purchase of the Securities be circulated ordistributed, whether directly or indirectly, to any person in Singapore other than (a) to aninstitutional investor (as defined in Section 4A of the SFA) pursuant to Section 274 of the SFA,
— 219 —

(b) to a relevant person (as defined in Section 275(2) of the SFA) pursuant to Section 275(1) ofthe SFA, or any person pursuant to an offer referred to in Section 275(1A) of the SFA, and inaccordance with the conditions specified in Section 275 of the SFA or (c) otherwise pursuant to,and in accordance with the conditions of, any other applicable provision of the SFA.
Where the Securities are acquired by persons who are relevant persons specified in Section 276 ofthe SFA, namely:
(i) a corporation (which is not an accredited investor (as defined in Section 4A of the SFA))the sole business of which is to hold investments and the entire share capital of which isowned by one or more individuals, each of whom is an accredited investor; or
(ii) a trust (where the trustee is not an accredited investor) whose sole purpose is to holdinvestments and each beneficiary of the trust is an individual who is an accreditedinvestor,
the shares, debentures and units of shares and debentures of that corporation or the beneficiaries’rights and interest (howsoever described) in that trust shall not be transferred within six monthsafter that corporation or that trust has acquired the Securities pursuant to an offer made underSection 275 of the SFA except:
(1) to an institutional investor (under Section 274 of the SFA) or to a relevant person asdefined in Section 275(2) of the SFA, or any person pursuant to an offer that is made onterms that such shares, debentures and units of shares and debentures of that corporationor such rights or interest in that trust are acquired at a consideration of not less thanS$200,000 (or its equivalent in a foreign currency) for each transaction, whether suchamount is to be paid for in cash or by exchange of securities or other assets and further forcorporations, in accordance with the conditions specified in Section 275(1A) of the SFA;
(2) where no consideration is or will be given for the transfer;
(3) where the transfer is by operation of law; or
(4) as specified in Section 276(7) of the SFA.
(h) INDIA
Each Initial Purchaser has acknowledged, represented and agreed that no offer or invitation topurchase or subscribe to the Securities is intended to be made through the Offering Circular orany amendment or supplement thereto directly or indirectly, to the public in India. Neither theOffering Circular nor any amendment or supplement thereto has been or will be registered as a‘prospectus’ under the provisions of the Indian Companies Act, 1956, nor has any OfferingCircular nor any amendment or supplement thereto been reviewed, approved, or recommended bythe Registrar of Companies or the Securities and Exchange Board of India or any other Indianregulatory authority.
— 220 —

No person may offer nor make the Securities the subject of an invitation for subscription orpurchase, nor may the Offering Circular or any amendment or supplement thereto or any otherdocument, material, notice, circular or advertisement in connection with the offer or sale orinvitation for subscription or purchase of any Bonds be circulated or distributed whether directlyor indirectly to, or for the account or benefit of, any person resident in India;
(i) JAPAN
The Securities have not been and will not be registered under the Financial Instruments andExchange Law of Japan (the “Financial Instruments and Exchange Law”). Accordingly, eachInitial Purchaser has represented, warranted and agreed that it has not, directly or indirectly,offered or sold and will not, directly or indirectly, offer or sell any Securities in Japan, or to, orfor the benefit of, any resident of Japan (which term as used herein means any person resident inJapan, including any corporation or other entity organized under the laws of Japan) or to othersfor re-offering or re-sale, directly or indirectly, in Japan or to, or for the benefit of, any residentof Japan except pursuant to an exemption from the registration requirements of, and otherwise incompliance with, the Financial Instruments and Exchange Law and other relevant laws andregulations of Japan.
— 221 —

TRANSFER RESTRICTIONS
Because of the following restrictions, purchasers are advised to consult legal counsel prior to makingany offer, sale, resale, pledge or other transfer of the Securities.
Each purchaser of the Securities, by accepting the delivery of this Offering Circular, will be deemed tohave represented and agreed as follows (terms used in this paragraph that are defined in Rule 144A orin Regulation S are used herein as defined therein):
1. it is purchasing the Securities for its own account or an account with respect to which itexercises sole investment discretion, and it and any such account (A)(i) is a “qualifiedinstitutional buyer” as defined in Rule 144A and (ii) is aware that the sale of the Securities to itis being made in reliance on Rule 144A, or (B) is outside the United States (as defined inRegulation S);
2. it understands and acknowledges that the Securities are being offered only in a transaction notinvolving any public offering in the United States, within the meaning of the Securities Act,and the Securities have not been and will not be registered under the Securities Act or with anysecurities regulatory authority of any jurisdiction and may not be offered or sold within theUnited States except as set forth below;
3. it understands and agrees that if in the future it decides to offer, sell, resell, pledge or otherwisetransfer any Securities or any beneficial interests in any Securities other than Securitiesrepresented by a Regulation S Global Certificate, such Securities may be offered, sold, resold,pledged or otherwise transferred only (A) by an initial investor (i) to the Issuer or anysubsidiary thereof, (ii) so long as the Securities are eligible for resale pursuant to Rule 144A, toa person whom the seller reasonably believes is a qualified institutional buyer (as defined inRule 144A) that purchases for its own account or for the account of a qualified institutionalbuyer in a transaction meeting the requirements of Rule 144A, (iii) in an offshore transaction inaccordance with Rules 903 or 904 of Regulation S under the Securities Act or (iv) pursuant toan exemption from registration under the Securities Act provided by Rule 144 under theSecurities Act (if available) (resales described in subclauses (i) through (iv) of this clause (A),“Permitted Resales”), or (B) by a subsequent investor, in a Permitted Resale or pursuant to anyother available exemption from the registration requirements under the Securities Act (providedthat, as a condition to the registration of transfer of any Securities otherwise than in aPermitted Resale, the Issuer may require delivery of any documents or other evidence(including but not limited to an opinion of counsel) that it, in its sole discretion, may deemnecessary or appropriate to evidence compliance with such exemption), or (C) pursuant to aneffective registration statement under the Securities Act, and in each of such cases, inaccordance with any applicable securities laws of any state of the United States and any otherjurisdiction. It understands that no representation has been made as to the availability ofRule 144A or any other exemption under the Securities Act or any state securities laws for theoffer, sale, resale, pledge or transfer of the Securities.
4. it agrees to, and each subsequent holder is required to, notify any purchaser of the Securitiesfrom it of the resale restrictions referred to in paragraph 3 above, if then applicable;
— 222 —

5. it understands and agrees that (A) Securities initially offered in the United States to qualifiedinstitutional buyers will be represented by the Rule 144A Global Certificate and (B) thatSecurities offered outside the United States in reliance on Regulation S will be represented bythe Regulation S Global Certificates;
6. it understands that the Rule 144A Global Certificates will bear a legend to the following effectunless otherwise agreed to by the Issuer:
“THIS SECURITY HAS NOT BEEN REGISTERED UNDER THE UNITED STATESSECURITIES ACT OF 1933, AS AMENDED (THE “SECURITIES ACT”). THE HOLDERHEREOF, BY PURCHASING THIS SECURITY, AGREES FOR THE BENEFIT OFBALLARPUR INTERNATIONAL GRAPHIC PAPER HOLDINGS B.V. (THE “ISSUER”) THATTHIS SECURITY MAY BE OFFERED, SOLD, RESOLD, PLEDGED OR OTHERWISETRANSFERRED ONLY (A) BY AN INITIAL INVESTOR (AS DEFINED BELOW) (1) TO THEISSUER OR ANY SUBSIDIARY THEREOF, (2) SO LONG AS THIS SECURITY IS ELIGIBLEFOR RESALE PURSUANT TO RULE 144A UNDER THE SECURITIES ACT (“RULE 144A”),TO A PERSON WHOM THE SELLER REASONABLY BELIEVES IS A QUALIFIEDINSTITUTIONAL BUYER (AS DEFINED IN RULE 144A) THAT PURCHASES FOR ITS OWNACCOUNT OR FOR THE ACCOUNT OF A QUALIFIED INSTITUTIONAL BUYER IN ATRANSACTION MEETING THE REQUIREMENTS OF RULE 144A, (3) IN AN OFFSHORETRANSACTION IN ACCORDANCE WITH RULE 903 OR 904 OF REGULATION S UNDERTHE SECURITIES ACT OR (4) PURSUANT TO AN EXEMPTION FROM REGISTRATIONUNDER THE SECURITIES ACT PROVIDED BY RULE 144 UNDER THE SECURITIES ACT(IF AVAILABLE) (RESALES DESCRIBED IN SUBCLAUSES (1) THROUGH (4) OF THISCLAUSE (A), “PERMITTED RESALES”), OR (B) BY A SUBSEQUENT INVESTOR, IN APERMITTED RESALE OR PURSUANT TO ANY OTHER AVAILABLE EXEMPTION FROMTHE REGISTRATION REQUIREMENTS UNDER THE SECURITIES ACT (PROVIDED THAT,AS A CONDITION TO THE REGISTRATION OF TRANSFER OF ANY SECURITIESOTHERWISE THAN IN A PERMITTED RESALE, THE ISSUER MAY REQUIRE DELIVERYOF ANY DOCUMENTS OR OTHER EVIDENCE (INCLUDING BUT NOT LIMITED TO ANOPINION OF COUNSEL) THAT IT, IN ITS SOLE DISCRETION, MAY DEEM NECESSARYOR APPROPRIATE TO EVIDENCE COMPLIANCE WITH SUCH EXEMPTION), OR(C) PURSUANT TO AN EFFECTIVE REGISTRATION STATEMENT UNDER THESECURITIES ACT, AND IN EACH OF SUCH CASES, IN ACCORDANCE WITH ANYAPPLICABLE SECURITIES LAWS OF ANY STATE OF THE UNITED STATES AND ANYOTHER JURISDICTION. THE HOLDER HEREOF, BY PURCHASING THIS SECURITY,REPRESENTS AND AGREES FOR THE BENEFIT OF THE ISSUER THAT IT WILL NOTIFYANY PURCHASER OF THIS SECURITY FROM IT OF THE RESALE RESTRICTIONSREFERRED TO ABOVE. NO REPRESENTATION CAN BE MADE AS TO THEAVAILABILITY OF THE EXEMPTION PROVIDED BY RULE 144A UNDER THESECURITIES ACT FOR RESALES OF THE SECURITIES.
FOR ALL PURPOSES OF THIS SECURITY, THE TERM “INITIAL INVESTOR” MEANS ANYPERSON WHO, IN CONNECTION WITH THE INITIAL DISTRIBUTION OF THISSECURITY, ACQUIRES SUCH SECURITY FROM THE ISSUER OR THE INITIALPURCHASERS (AS SUCH TERM IS DEFINED IN THE INDENTURE) PARTICIPATING INSUCH DISTRIBUTION OR ANY AFFILIATE OF ANY OF THE FOREGOING.”
— 223 —

7. it understands and agrees that if in the future it decides to resell, pledge or otherwise transferany Securities represented by the Regulation S Global Certificates or any beneficial interest inany Securities represented by the Regulation S Global Certificates, such Securities may beresold, pledged or transferred only in accordance with the requirements of the legends set forthin paragraph 8.
8. it understands that the Securities represented by the Regulation S Global Certificates will beara legend to the following effect unless otherwise agreed to by the Issuer:
“THIS SECURITY HAS NOT BEEN AND WILL NOT BE REGISTERED UNDER THE UNITEDSTATES SECURITIES ACT OF 1933, AS AMENDED (THE “SECURITIES ACT”), OR WITHANY SECURITIES REGULATORY AUTHORITY OF ANY JURISDICTION AND,ACCORDINGLY, MAY NOT BE OFFERED, SOLD, RESOLD, PLEDGED OR OTHERWISETRANSFERRED OR DELIVERED IN THE UNITED STATES, UNLESS SUCH SECURITIESARE REGISTERED UNDER THE SECURITIES ACT OR AN EXEMPTION FROM THEREGISTRATION REQUIREMENTS THEREOF IS AVAILABLE.
9. it acknowledges that, prior to any proposed transfer of Securities in certificated form or ofbeneficial interests in Securities represented by a global certificate (in each case other thanpursuant to an effective registration statement), the holder of Securities or the holder ofbeneficial interests in Securities represented by a global certificate, as the case may be, may berequired to provide certifications and other documentation relating to the manner of suchtransfer and submit such certifications and other documentation as provided in the Indenture;and
10. it acknowledges that the Issuer and the Initial Purchasers and others will rely upon the truth andaccuracy of the foregoing acknowledgments, representations and agreements and agrees that, ifany of such acknowledgments, representations or warranties deemed to have been made by it byits purchase of Securities are no longer accurate, it shall promptly notify the Issuer, and if it isacquiring any Securities as a fiduciary or agent for one or more accounts, it represents that ithas sole investment discretion with respect to each such account and that it has full power tomake the foregoing acknowledgments, representations and agreements on behalf of each suchaccount.
For further discussion of the requirements (including the presentation of transfer certificates) under theIndenture to effect exchanges of transfer of interests in Securities represented by a global certificateand of Securities in certificated form, see “Description of the Perpetual Capital Securities”.
— 224 —

LEGAL MATTERS
Certain legal matters in connection with this offering will be passed upon for the Issuer by Allen &Overy, the Issuer’s U.S. counsel, as to matters of United States federal and New York State law, byDLA Piper Nederland N.V., the Issuer’s Dutch counsel, as to matters of Dutch law and by ShearnDelamore & Co., the Issuer’s Malaysian counsel, as to matters of Malaysian law. Certain legal mattersin connection with this offering will be passed upon for the Initial Purchasers by CC Asia Limited, theInitial Purchasers’ U.S. counsel, as to matters of United States federal and New York State law, and byLuthra and Luthra Law Offices, the Initial Purchasers’ Indian counsel, as to matters of Indian law.
INDEPENDENT AUDITORS
The Consolidated Historical Financial Information of the Issuer as of and for each of the fiscal yearsended June 30, 2008, 2009 and 2010 included in this Offering Circular have been audited byPricewaterhouseCoopers Accountants N.V., as stated in their report appearing herein.
— 225 —

GENERAL INFORMATION
1. Approval in-principle has been received for the listing and quotation of the Securities on theSGX-ST. For so long as the Securities are listed on the Official List of the Singapore StockExchange and the rules of the Singapore Stock Exchange so require, the Issuer shall appointand maintain a paying agent in Singapore, where the Securities may be presented orsurrendered for payment or redemption, in the event that the Global Certificates are exchangedfor Definitive Certificates. In addition, an announcement of such exchange shall be made by oron behalf of the Issuer through the Singapore Stock Exchange and such announcement willinclude all material information with respect to the delivery of the Definitive Certificates,including details of the paying agent in Singapore.
2. The Issuer has obtained all necessary consents, approvals and authorizations as may be requiredin connection with the issue and performance of the Securities, except as disclosed in thisOffering Circular. The issue of the Securities was approved by resolutions of the Issuer passedon August 4, 2011.
3. Except as disclosed in this Offering Circular, there has been no material adverse change in thefinancial position or prospects of the Issuer since March 31, 2011, and there has been nomaterial adverse change in the financial position or prospects of the Issuer since its date ofincorporation.
4. Other than as referred to elsewhere in this Offering Circular, the Issuer is not involved in anylitigation or arbitration proceedings that if determined adversely to the Issuer would, in theaggregate, have a material adverse effect on the consolidated financial position of the Issuer,nor is the Issuer aware that any such proceedings are pending or threatened.
5. Copies of the following documents will be available for inspection from the Closing Dateduring normal business hours at the specified office of the Issuer at Paasheuvelweg 16,1105 BH Amsterdam Zuidoost, the Netherlands, so long as any of the Securities is outstanding:
a) A true copy of the deed of Incorporation of the Issuer;
b) The current articles of association of the Issuer;
c) Copies of the annual reports of the Issuer for the years ended, June 30, 2008, 2009 and2010; and
d) The Indenture
e) The Replacement Capital Covenant
6. The Consolidated Historical Financial Information of the Issuer as of and for the years endedJune 30, 2008, 2009 and 2010 appearing in this Offering Circular, have been audited byPricewaterhouseCoopers Accountants N.V., as set forth in their report appearing herein.
— 226 —

INDEX TO CONSOLIDATED FINANCIAL INFORMATION
PageAudited Consolidated Historical Financial Information of Ballarpur International Graphic Paper
Holdings B.V. for the Years ended June 30, 2008, 2009 and 2010Auditor’s Report in respect of the Consolidated Historical Financial Information of the Issuer for the
years ended June 30, 2008, 2009 and 2010 . . . . . . . . . . . . . . . . . . . . . . . . . . . . . . . . . . . . . . . . . . . . . . . . . F-2Consolidated Income Statements for the Years ended June 30, 2008, 2009 and 2010 . . . . . . . . . . . . . . . . . F-5Consolidated Statements of Comprehensive Income for the Years ended June 30, 2008, 2009 and 2010 . . F-6Consolidated Statements of Financial Position as at June 30, 2008, 2009 and 2010 . . . . . . . . . . . . . . . . . . . F-7Consolidated Statements of Changes in Equity for the Years ended June 30, 2008, 2009 and 2010 . . . . . . F-8Consolidated Statements of Cash Flows for the Years ended June 30, 2008, 2009 and 2010 . . . . . . . . . . . . F-9Notes to Consolidated Historical Financial Information for the Years ended June 30, 2008, 2009 and
2010 . . . . . . . . . . . . . . . . . . . . . . . . . . . . . . . . . . . . . . . . . . . . . . . . . . . . . . . . . . . . . . . . . . . . . . . . . . . . . . . F-10
Unaudited Consolidated Interim Financial Information of Ballarpur International Graphic PaperHoldings B.V. for the nine months ended March 31, 2010 and 2011
Interim Consolidated Income Statement for the nine months ended March 31, 2010 and 2011 . . . . . . . . . . F-73Interim Consolidated Statements of Comprehensive Income for the nine months ended March 31, 2010
and 2011 . . . . . . . . . . . . . . . . . . . . . . . . . . . . . . . . . . . . . . . . . . . . . . . . . . . . . . . . . . . . . . . . . . . . . . . . . . . F-74Interim Consolidated Statements of Financial Position as at March 31, 2011 and June 30, 2010 . . . . . . . . . F-75Interim Consolidated Statements of Changes in Equity for the nine months ended March 31, 2010 and
2011 . . . . . . . . . . . . . . . . . . . . . . . . . . . . . . . . . . . . . . . . . . . . . . . . . . . . . . . . . . . . . . . . . . . . . . . . . . . . . . . F-76Interim Consolidated Statements of Cash Flows for the nine months ended March 31, 2010 and 2011 . . . . F-77Notes to Unaudited Consolidated Interim Financial Information for the nine months ended March 31,
2010 and 2011 . . . . . . . . . . . . . . . . . . . . . . . . . . . . . . . . . . . . . . . . . . . . . . . . . . . . . . . . . . . . . . . . . . . . . . . F-78
Important Information
In the Consolidated Historical Financial Information and the Unaudited Interim Financial Information included herein,
Ballarpur International Graphic Paper Holdings B.V. is referred to as “the Company” while in the remainder of this Offering
Circular, it is referred to as “the Issuer”.
Capitalized terms used in the Consolidated Historical Financial Information and the Unaudited Interim Financial Information
included herein may be defined differently than in the reminder of the Offering Circular.
— F-1 —

Independent auditor’s report
To: the Managing Directors of Ballarpur International Graphic Paper Holdings B.V.
Report on the historical consolidated financial information
We have audited the accompanying historical consolidated financial information for the years ended June 30, 2008, June 30,
2009 and June 30, 2010 of Ballarpur International Graphic Paper Holdings B.V., Amsterdam, which comprise the consolidated
balance sheets as at June 30, 2008, June 30, 2009 and June 30, 2010, the consolidated income statements, statements of
comprehensive income, changes in equity and cash flows for the years ended June 30, 2008, June 30, 2009, June 30, 2010, and
the notes, comprising a summary of significant accounting policies and other explanatory information (the ‘Historical
Consolidated Financial Information’).
Managing Directors’ responsibility
The Managing Directors are responsible for the preparation and fair presentation of these Historical Consolidated Financial
Information in accordance with International Financial Reporting Standards as adopted by the European Union. Furthermore,
the Managing Directors are responsible for such internal control as it determines is necessary to enable the preparation of the
Historical Consolidated Financial Information that is free from material misstatement, whether due to fraud or error.
Auditor’s responsibility
Our responsibility is to express an opinion on the Historical Consolidated Financial Information based on our audit. We
conducted our audit in accordance with Dutch law, including the Dutch Standards on Auditing. This requires that we comply
with ethical requirements and plan and perform the audit to obtain reasonable assurance about whether the Historical
Consolidated Financial Information are free from material misstatement.
An audit involves performing procedures to obtain audit evidence about the amounts and disclosures in the Historical
Consolidated Financial Information. The procedures selected depend on the auditor’s judgment, including the assessment of the
risks of material misstatement of the Historical Consolidated Financial Information, whether due to fraud or error. In making
those risk assessments, the auditor considers internal control relevant to the company’s preparation and fair presentation of the
Historical Consolidated Financial Information in order to design audit procedures that are appropriate in the circumstances, but
not for the purpose of expressing an opinion on the effectiveness of the company’s internal control. An audit also includes
evaluating the appropriateness of accounting policies used and the reasonableness of accounting estimates made by the Managing
Directors, as well as evaluating the overall presentation of the Historical Consolidated Financial Information.
We believe that the audit evidence we have obtained is sufficient and appropriate to provide a basis for our audit opinion.
PricewaterhouseCoopers Accountants N.V., Thomas R. Malthusstraat 5, 1066 JR Amsterdam, P.O. Box 90357, 1006 BJAmsterdam, The NetherlandsT: +31 (0) 88 792 00 20, F: +31 (0) 88 792 96 40, www.pwc.nl
‘PwC’ is the brand under which PricewaterhouseCoopers Accountants N.V. (Chamber of Commerce 34180285),PricewaterhouseCoopers Belastingadviseurs N.V. (Chamber of Commerce 34180284), PricewaterhouseCoopers Advisory N.V.(Chamber of Commerce 34180287), PricewaterhouseCoopers Compliance Services B.V. (Chamber of Commerce 51414406),PricewaterhouseCoopers B.V. (Chamber of Commerce 34180289) and other companies operate and provide services. Theseservices are governed by General Terms and Conditions (‘algemene voorwaarden’), which include provisions regarding ourliability. Purchases by these companies are governed by General Terms and Conditions of Purchase (‘algemeneinkoopvoorwaarden’). At www.pwc.ni more detailed information on these companies is available, including these General Termsand Conditions and the General Terms and Conditions of Purchase, which have also been filed at the Amsterdam Chamber ofCommerce.
— F-2 —

Opinion
In our opinion, the Historical Consolidated Financial Information give a true and fair view of the financial position of
Ballarpur International Graphic Paper Holdings B.V. as at June 30, 2008, June 30, 2009, and June 30, 2010, and of its result
and its cash flows for each of the three years then ended in accordance with International Financial Reporting Standards as
adopted by the European Union.
Restriction of use
This Historical Consolidated Financial Information and our report thereon has been prepared for inclusion in the prospectus
with respect to the 2011 Singapore Exchange Securities Trading Limited bond offering. As a consequence, we do not accept or
assume any liability or duty of care if our report is used for any other purpose than described above.
Amsterdam, July 23, 2011
PricewaterhouseCoopers Accountants N.V.
B. Koolstra RA
— F-3 —

AUDITED CONSOLIDATED HISTORICAL FINANCIAL INFORMATION
OF
BALLARPUR INTERNATIONAL GRAPHIC PAPER HOLDINGS B.V.
FOR THE YEARS ENDED JUNE 30, 2008, 2009 AND 2010
— F-4 —

Ballarpur International Graphic Paper Holdings B.V.All amounts in US Dollars thousands unless otherwise stated
Consolidated income statements
Years ended June 30
Note 2008 2009 2010
Revenue . . . . . . . . . . . . . . . . . . . . . . . . . . . . . . . . . . . . . . . . . . . . . . . . . . . . . . . . . . . . . . . . . . . . . . . 5 514,388 408,158 613,164Other operating income . . . . . . . . . . . . . . . . . . . . . . . . . . . . . . . . . . . . . . . . . . . . . . . . . . . . . . . . . . . 24 1,541 2,659 4,849Gain on change in fair value of biological assets . . . . . . . . . . . . . . . . . . . . . . . . . . . . . . . . . . . . . . . . 8a 13,448 10,955 4,900Raw materials and consumables used . . . . . . . . . . . . . . . . . . . . . . . . . . . . . . . . . . . . . . . . . . . . . . . . 25 (321,267) (258,697) (407,008)Excise duty expense . . . . . . . . . . . . . . . . . . . . . . . . . . . . . . . . . . . . . . . . . . . . . . . . . . . . . . . . . . . . . . (24,481) (13,360) (13,471)Employee benefits expense . . . . . . . . . . . . . . . . . . . . . . . . . . . . . . . . . . . . . . . . . . . . . . . . . . . . . . . . 28 (37,156) (36,914) (38,701)Depreciation . . . . . . . . . . . . . . . . . . . . . . . . . . . . . . . . . . . . . . . . . . . . . . . . . . . . . . . . . . . . . . . . . . . . 6 (32,071) (31,735) (39,384)Foreign exchange (losses)/gains — net . . . . . . . . . . . . . . . . . . . . . . . . . . . . . . . . . . . . . . . . . . . . . . . 32 (2,650) 3,281 6,162Additional consideration paid for acquisition . . . . . . . . . . . . . . . . . . . . . . . . . . . . . . . . . . . . . . . . . . 27 (5,171) — —Other operating expenses . . . . . . . . . . . . . . . . . . . . . . . . . . . . . . . . . . . . . . . . . . . . . . . . . . . . . . . . . . 26 (37,519) (32,852) (35,182)
Operating profit . . . . . . . . . . . . . . . . . . . . . . . . . . . . . . . . . . . . . . . . . . . . . . . . . . . . . . . . . . . . . . . . 69,062 51,495 95,329Finance income . . . . . . . . . . . . . . . . . . . . . . . . . . . . . . . . . . . . . . . . . . . . . . . . . . . . . . . . . . . . . . . . . 30 595 2,480 2,777Finance costs . . . . . . . . . . . . . . . . . . . . . . . . . . . . . . . . . . . . . . . . . . . . . . . . . . . . . . . . . . . . . . . . . . . 30 (41,233) (86,352) (40,920)
Finance costs, net . . . . . . . . . . . . . . . . . . . . . . . . . . . . . . . . . . . . . . . . . . . . . . . . . . . . . . . . . . . . . . . (40,638) (83,872) (38,143)Other gains/(losses) . . . . . . . . . . . . . . . . . . . . . . . . . . . . . . . . . . . . . . . . . . . . . . . . . . . . . . . . . . . . . . 12 — 27,281 (10,379)
Profit/(loss) before income tax . . . . . . . . . . . . . . . . . . . . . . . . . . . . . . . . . . . . . . . . . . . . . . . . . . . . 28,424 (5,096) 46,807Income tax (expense)/credit . . . . . . . . . . . . . . . . . . . . . . . . . . . . . . . . . . . . . . . . . . . . . . . . . . . . . . . . 31 (12,776) (1,964) (368)
Profit/(loss) for the year/period . . . . . . . . . . . . . . . . . . . . . . . . . . . . . . . . . . . . . . . . . . . . . . . . . . . 15,648 (7,060) 46,439
Attributable to:—Owners of the parent . . . . . . . . . . . . . . . . . . . . . . . . . . . . . . . . . . . . . . . . . . . . . . . . . . . . . . . . . . . 15,286 (6,901) 45,726— Non-controlling interests . . . . . . . . . . . . . . . . . . . . . . . . . . . . . . . . . . . . . . . . . . . . . . . . . . . . . . . . 362 (159) 713
15,648 (7,060) 46,439
Earnings/(loss) per share attributable to the equity holders of the Company during the year(expressed in US$ per share)
Basic and diluted . . . . . . . . . . . . . . . . . . . . . . . . . . . . . . . . . . . . . . . . . . . . . . . . . . . . . . . . . . . . . . . . 33 10.0 (3.8) 24.5
The notes on pages 6 to 67 are an integral part of this consolidated financial information.
Date: July 23, 2011
Vivek Goyal Yogesh Agarwal
Chief Financial Officer Managing Director
— F-5 — Page 1

Ballarpur International Graphic Paper Holdings B.V.All amounts in US Dollars thousands unless otherwise stated
Consolidated statements of comprehensive income
Years ended June 30
Note 2008 2009 2010
Profit/(loss) for the year/period . . . . . . . . . . . . . . . . . . . . . . . . . . . . . . . . . . . . . . . . . . . . . . . . . . . . . . . . 15,648 (7,060) 46,439Other comprehensive income:Gain/(loss) on fair value of available-for-sale financial assets . . . . . . . . . . . . . . . . . . . . . . . . . . . . . . . . . . 19 — 14,331 (2,983)Cash flow hedges . . . . . . . . . . . . . . . . . . . . . . . . . . . . . . . . . . . . . . . . . . . . . . . . . . . . . . . . . . . . . . . . . . . . 12 — (30,220) —Currency translation differences . . . . . . . . . . . . . . . . . . . . . . . . . . . . . . . . . . . . . . . . . . . . . . . . . . . . . . . . . 18,057 (32,554) 33,033
Other comprehensive income/(expense) for the year/period, net of tax . . . . . . . . . . . . . . . . . . . . . . . 18,057 (48,443) 30,050
Total comprehensive income/(expense) for the year/period . . . . . . . . . . . . . . . . . . . . . . . . . . . . . . . . . 33,705 (55,503) 76,489
Attributable to:—Owners of the parent . . . . . . . . . . . . . . . . . . . . . . . . . . . . . . . . . . . . . . . . . . . . . . . . . . . . . . . . . . . . . . . 33,343 (55,344) 75,266— Non-controlling interests . . . . . . . . . . . . . . . . . . . . . . . . . . . . . . . . . . . . . . . . . . . . . . . . . . . . . . . . . . . . 362 (159) 1,223
Total comprehensive income/(expense) for the year/period . . . . . . . . . . . . . . . . . . . . . . . . . . . . . . . . . 33,705 (55,503) 76,489
Items in the statements above are disclosed net of tax. The income tax relating to each component of other comprehensive
income is disclosed in note 31.
The notes on pages 6 to 67 are an integral part of this consolidated financial information.
Vivek Goyal Yogesh AgarwalChief Financial Officer Managing Director
— F-6 — Page 2

Ballarpur International Graphic Paper Holdings B.V.All amounts in US Dollars thousands unless otherwise stated
Consolidated statements of financial positionJune 30
Note 2008 2009 2010
AssetsNon-current assetsProperty, plant and equipment . . . . . . . . . . . . . . . . . . . . . . . . . . . . . . . . . . . . . . . . . . . . . . . . . . . . . . 6 517,226 670,896 819,255Capital work-in-progress . . . . . . . . . . . . . . . . . . . . . . . . . . . . . . . . . . . . . . . . . . . . . . . . . . . . . . . . . . 7 214,873 126,404 52,203Biological assets . . . . . . . . . . . . . . . . . . . . . . . . . . . . . . . . . . . . . . . . . . . . . . . . . . . . . . . . . . . . . . . . 8a 79,827 76,700 88,222Land use rights . . . . . . . . . . . . . . . . . . . . . . . . . . . . . . . . . . . . . . . . . . . . . . . . . . . . . . . . . . . . . . . . . 8b 11,610 11,783 12,367Available-for-sale financial asset . . . . . . . . . . . . . . . . . . . . . . . . . . . . . . . . . . . . . . . . . . . . . . . . . . . 9 & 11 — 22,006 22,099Restricted deposits . . . . . . . . . . . . . . . . . . . . . . . . . . . . . . . . . . . . . . . . . . . . . . . . . . . . . . . . . . . . . . . 10 & 15 2 2 —Derivative financial instruments . . . . . . . . . . . . . . . . . . . . . . . . . . . . . . . . . . . . . . . . . . . . . . . . . . . . 9, 10 & 12 — 12,208 13,212Deferred income tax asset . . . . . . . . . . . . . . . . . . . . . . . . . . . . . . . . . . . . . . . . . . . . . . . . . . . . . . . . . 22 — — 10,836Trade and other receivables . . . . . . . . . . . . . . . . . . . . . . . . . . . . . . . . . . . . . . . . . . . . . . . . . . . . . . . . 9, 10 & 13 14,443 39,503 32,071
837,981 959,502 1,050,265
Current assetsInventories . . . . . . . . . . . . . . . . . . . . . . . . . . . . . . . . . . . . . . . . . . . . . . . . . . . . . . . . . . . . . . . . . . . . . 14 85,337 72,909 127,249Trade and other receivables . . . . . . . . . . . . . . . . . . . . . . . . . . . . . . . . . . . . . . . . . . . . . . . . . . . . . . . . 9, 10 & 13 62,797 44,438 92,996Derivative financial instruments . . . . . . . . . . . . . . . . . . . . . . . . . . . . . . . . . . . . . . . . . . . . . . . . . . . . — 15,073 —Restricted deposits . . . . . . . . . . . . . . . . . . . . . . . . . . . . . . . . . . . . . . . . . . . . . . . . . . . . . . . . . . . . . . . 9, 10 & 15 4,686 4,433 5,918Cash and cash equivalents (excluding bank overdrafts) . . . . . . . . . . . . . . . . . . . . . . . . . . . . . . . . . . 9, 10 & 16 23,569 14,565 29,112
176,389 151,418 255,275
Total assets . . . . . . . . . . . . . . . . . . . . . . . . . . . . . . . . . . . . . . . . . . . . . . . . . . . . . . . . . . . . . . . . . . . . 1,014,370 1,110,920 1,305,540
EQUITY AND LIABILITIESEquity attributable to owners of the CompanyOrdinary shares . . . . . . . . . . . . . . . . . . . . . . . . . . . . . . . . . . . . . . . . . . . . . . . . . . . . . . . . . . . . . . . . . 17 163,109 29 29Share premium . . . . . . . . . . . . . . . . . . . . . . . . . . . . . . . . . . . . . . . . . . . . . . . . . . . . . . . . . . . . . . . . . . 17 135,219 328,327 328,327Translation reserve . . . . . . . . . . . . . . . . . . . . . . . . . . . . . . . . . . . . . . . . . . . . . . . . . . . . . . . . . . . . . . 19,917 (12,637) 19,886Other reserves . . . . . . . . . . . . . . . . . . . . . . . . . . . . . . . . . . . . . . . . . . . . . . . . . . . . . . . . . . . . . . . . . . 19 — (15,889) 85,775Retained earnings . . . . . . . . . . . . . . . . . . . . . . . . . . . . . . . . . . . . . . . . . . . . . . . . . . . . . . . . . . . . . . . 18 69,153 62,252 107,978
387,398 362,082 541,995Non-controlling interests . . . . . . . . . . . . . . . . . . . . . . . . . . . . . . . . . . . . . . . . . . . . . . . . . . . . . . . . . . 6,690 6,531 7,754
Total equity . . . . . . . . . . . . . . . . . . . . . . . . . . . . . . . . . . . . . . . . . . . . . . . . . . . . . . . . . . . . . . . . . . . 394,088 368,613 549,749
LiabilitiesNon-current liabilitiesBorrowings . . . . . . . . . . . . . . . . . . . . . . . . . . . . . . . . . . . . . . . . . . . . . . . . . . . . . . . . . . . . . . . . . . . . 9 & 21 415,385 566,658 465,134Derivative financial instruments . . . . . . . . . . . . . . . . . . . . . . . . . . . . . . . . . . . . . . . . . . . . . . . . . . . . 9 & 12 — 14,762 19,154Deferred income tax liabilities . . . . . . . . . . . . . . . . . . . . . . . . . . . . . . . . . . . . . . . . . . . . . . . . . . . . . 22 11,072 11,222 16,785Retirement benefit obligations . . . . . . . . . . . . . . . . . . . . . . . . . . . . . . . . . . . . . . . . . . . . . . . . . . . . . 23 6,153 5,584 6,628Trade and other payables . . . . . . . . . . . . . . . . . . . . . . . . . . . . . . . . . . . . . . . . . . . . . . . . . . . . . . . . . . 9 & 20 8,112 5,614 5,201
440,722 603,840 512,902
Current liabilitiesTrade and other payables . . . . . . . . . . . . . . . . . . . . . . . . . . . . . . . . . . . . . . . . . . . . . . . . . . . . . . . . . . 9 & 20 112,626 100,523 173,723Current income tax liabilities . . . . . . . . . . . . . . . . . . . . . . . . . . . . . . . . . . . . . . . . . . . . . . . . . . . . . . 950 2,567 1,464Borrowings . . . . . . . . . . . . . . . . . . . . . . . . . . . . . . . . . . . . . . . . . . . . . . . . . . . . . . . . . . . . . . . . . . . . 9 & 21 65,984 35,377 67,702
179,560 138,467 242,889
Total liabilities . . . . . . . . . . . . . . . . . . . . . . . . . . . . . . . . . . . . . . . . . . . . . . . . . . . . . . . . . . . . . . . . . 620,282 742,307 755,791
Total equity and liabilities . . . . . . . . . . . . . . . . . . . . . . . . . . . . . . . . . . . . . . . . . . . . . . . . . . . . . . . 1,014,370 1,110,920 1,305,540
The notes on pages 6 to 67 are an integral part of this consolidated financial information.
Vivek GoyalChief Financial Officer
Yogesh AgarwalManaging Director
— F-7 — Page 3

Ballarpur International Graphic Paper Holdings B.V.All amounts in US Dollars thousands unless otherwise stated
Consolidated statements of changes in equityAttributable to owners of the parent
NoteSharecapital
Sharepremium
Translationreserve
Otherreserves
Retainedearnings Total
Non-controllinginterests
Totalequity
Balance at July 1, 2007 . . . . . . . . . . . . . . . . . . . . . . 123,323 — 1,860 — 53,867 179,050 6,328 185,378Comprehensive incomeProfit for the year . . . . . . . . . . . . . . . . . . . . . . . . . . . — — — — 15,286 15,286 362 15,648Other comprehensive incomeCurrency translation differences . . . . . . . . . . . . . . . . — — 18,057 — — 18,057 — 18,057
Total other comprehensive income . . . . . . . . . . . . — — 18,057 — — 18,057 — 18,057
Total comprehensive income . . . . . . . . . . . . . . . . . — — 18,057 — 15,286 33,343 362 33,705Transactions with ownersProceeds from shares issued . . . . . . . . . . . . . . . . . . . 17 39,786 135,219 — — — 175,005 — 175,005
Total contributions by and distributions toowners . . . . . . . . . . . . . . . . . . . . . . . . . . . . . . . . . . 39,786 135,219 — — — 175,005 — 175,005
Balance at June 30, 2008 . . . . . . . . . . . . . . . . . . . . . 163,109 135,219 19,917 — 69,153 387,398 6,690 394,088Comprehensive incomeProfit/(loss) for the year . . . . . . . . . . . . . . . . . . . . . . — — — — (6,901) (6,901) (159) (7,060)Other comprehensive incomeCurrency translation differences . . . . . . . . . . . . . . . . — — (32,554) — — (32,554) — (32,554)Gain on fair valuation of available-for-sale financialasset, net of tax . . . . . . . . . . . . . . . . . . . . . . . . . . . 19 — — — 14,331 — 14,331 — 14,331
Cash flow hedge . . . . . . . . . . . . . . . . . . . . . . . . . . . . 12 — — — (30,220) — (30,220) — (30,200)
Total other comprehensive Income . . . . . . . . . . . . — — (32,554) (15,889) — (48,443) — (48,443)
Total comprehensive income . . . . . . . . . . . . . . . . . — — (32,554) (15,889) (6,901) (55,344) (159) (55,503)Transactions with ownersIssue of shares . . . . . . . . . . . . . . . . . . . . . . . . . . . . . . 17 1 29,999 — — — 30,000 — 30,000Elimination of share capital and share premium ofBPH . . . . . . . . . . . . . . . . . . . . . . . . . . . . . . . . . . . . 17 (163,109) (135,219) — — — (298,328) — (298,328)
Share capital and share premium of BIGPH . . . . . . . 17 28 298,328 — — — 298,356 — 298,356
Total contributions by and distributionsowners . . . . . . . . . . . . . . . . . . . . . . . . . . . . . . . . . . (163,080) 193,108 — — — 30,028 — 30,028
Balance at June 30, 2009 . . . . . . . . . . . . . . . . . . . . . 29 328,327 (12,637) (15,889) 62,252 362,082 6,531 368,613Comprehensive IncomeProfit for the year . . . . . . . . . . . . . . . . . . . . . . . . . . . — — — — 45,726 45,726 713 46,439Other comprehensive IncomeCurrency translation differences . . . . . . . . . . . . . . . . — — 32,523 — — 32,523 510 33,033Gain/(loss) on fair valuation of available-for salefinancial asset, net of tax . . . . . . . . . . . . . . . . . . . . 19 — — — (2,983) — (2,983) — (2,983)
Total other comprehensive income . . . . . . . . . . . . — — 32,523 (2,983) — 29,540 510 30,050
Total comprehensive income . . . . . . . . . . . . . . . . . — — 32,523 (2,983) 45,726 75,266 1,223 76,489Transaction with ownersEquity contribution of profit certificates andcompulsory convertible debentures . . . . . . . . . . . . 21 — — — 104,647 — 104,647 — 104,647
Total transactions with owners . . . . . . . . . . . . . . . — — — 104,647 — 104,647 — 104,647
Balance as at June 30, 2010 . . . . . . . . . . . . . . . . . . 29 328,327 19,886 85,775 107,978 541,995 7,754 549,749
The notes on pages 6 to 67 are an integral part of this consolidated financial information.
vivek GoyalChief Financial Officer
Yogesh AgarwalManaging Director
— F-8 — Page 4

Ballarpur International Graphic Paper Holdings B.V.All amounts in US Dollars thousands unless otherwise stated
Consolidated statements of cash flows
Years ended June 30
Note 2008 2009 2010
Cash flows from operating activitiesCash generated from (used in) operations . . . . . . . . . . . . . . . . . . . . . . . . . . . . . . . . . . . . . . . . . . . . . 34 101,811 130,887 94,645Income taxes paid . . . . . . . . . . . . . . . . . . . . . . . . . . . . . . . . . . . . . . . . . . . . . . . . . . . . . . . . . . . . . . . (5,196) (2,288) (6,033)
Net cash generated from (used in) operating activities . . . . . . . . . . . . . . . . . . . . . . . . . . . . . . . . 96,615 128,599 88,612
Cash flows from investing activitiesRepayment of SFI seller’s note . . . . . . . . . . . . . . . . . . . . . . . . . . . . . . . . . . . . . . . . . . . . . . . . . . . . . (45,000) (36,000) —Further consideration paid for SFI acquisition . . . . . . . . . . . . . . . . . . . . . . . . . . . . . . . . . . . . . . . . . (5,171)Purchase of property, plant and equipment . . . . . . . . . . . . . . . . . . . . . . . . . . . . . . . . . . . . . . . . . . . . (4,001) (8,661) (3,123)Additions to capital work-in-progress . . . . . . . . . . . . . . . . . . . . . . . . . . . . . . . . . . . . . . . . . . . . . . . . (100,779) (225,197) (48,241)Proceeds from disposal of property, plant and equipment . . . . . . . . . . . . . . . . . . . . . . . . . . . . . . . . . 10 280 484Purchase of available-for-sale investment . . . . . . . . . . . . . . . . . . . . . . . . . . . . . . . . . . . . . . . . . . . . . 11 — (3,920) (2,831)Interest received . . . . . . . . . . . . . . . . . . . . . . . . . . . . . . . . . . . . . . . . . . . . . . . . . . . . . . . . . . . . . . . . . 1,143 2,193 2,162Decrease / (Increase) in restricted deposits . . . . . . . . . . . . . . . . . . . . . . . . . . . . . . . . . . . . . . . . . . . . (4,688) (122) (1,058)
Net cash used in investing activities . . . . . . . . . . . . . . . . . . . . . . . . . . . . . . . . . . . . . . . . . . . . . . . . (158,486) (271,427) (52,607)
Cash flows from financing activitiesFinance costs paid . . . . . . . . . . . . . . . . . . . . . . . . . . . . . . . . . . . . . . . . . . . . . . . . . . . . . . . . . . . . . . . (26,092) (46,218) (49,073)Proceeds from borrowings, net of transaction costs . . . . . . . . . . . . . . . . . . . . . . . . . . . . . . . . . . . . . 21 466,702 182,572 564,333Repayment of borrowings . . . . . . . . . . . . . . . . . . . . . . . . . . . . . . . . . . . . . . . . . . . . . . . . . . . . . . . . . 21 (105,565) (6,714) (711,343)Net movement in working capital loans, cash credit, packing credit, bankers acceptance andfinance lease liabilities . . . . . . . . . . . . . . . . . . . . . . . . . . . . . . . . . . . . . . . . . . . . . . . . . . . . . . . . . . 21 29,161 6,695 19,500
Proceeds from issuance of profit certificates . . . . . . . . . . . . . . . . . . . . . . . . . . . . . . . . . . . . . . . . . . . 21 — — 55,000Proceeds from issuance of compulsory convertible debentures, net of transaction costs . . . . . . . . . 21 — — 97,288Distribution on group reorganization . . . . . . . . . . . . . . . . . . . . . . . . . . . . . . . . . . . . . . . . . . . . . . . . . 29 (466,704) — —Contribution from owners . . . . . . . . . . . . . . . . . . . . . . . . . . . . . . . . . . . . . . . . . . . . . . . . . . . . . . . . . 175,005 28 —
Net cash flows generated from/(used in) financing activities . . . . . . . . . . . . . . . . . . . . . . . . . . . . 72,507 136,363 (24,295)
Effect of change in exchange rate . . . . . . . . . . . . . . . . . . . . . . . . . . . . . . . . . . . . . . . . . . . . . . . . . . . 5,916 (2,539) 2,837
Net increase/(decrease) in cash and cash equivalents, net of bank overdrafts . . . . . . . . . . . . . . 16,552 (9,004) 14,547
Cash and cash equivalents, net of bank overdrafts at beginning of the year/period . . . . . . . . . . . . . 16 7,017 23,569 14,565
Cash and cash equivalents, net of bank overdrafts at end of the year/period . . . . . . . . . . . . . . 16 23,569 14,565 29,112
The notes on pages 6 to 67 are an integral part of this consolidated financial information.
Vivek Goyal
Chief Financial Officer
Yogesh Agarwal
Managing Director
— F-9 — Page 5

Ballarpur International Graphic Paper Holdings B.V.All amounts in US Dollars thousands unless otherwise stated
Notes to consolidated financial information1. General information and development of the BIGPH Group
Ballarpur International Graphic Paper Holdings B.V. (“BIGPH” or the “Company”), a company incorporated and domiciled in the
Netherlands, is currently a majority owned subsidiary of Ballarpur International Holdings B.V., Amsterdam (“BIH”), which is wholly
owned by the ultimate parent company Ballarpur Industries Limited (“Ballarpur”, together with its subsidiaries “Ballarpur Group”).
The Ballarpur Group has been established for 65 years and its shares are listed on the Bombay Stock Exchange and the National Stock
Exchange of India. Approximately 49% of its shares are owned directly and indirectly by the family owned Avantha Group.
Reorganization in the company over the years is as follows:
Š Incorporation of the holding companies BIH and its wholly owned subsidiary Ballarpur Paper Holdings B.V. (“BPH”)
in October and November 2006, respectively;
Š On March 16, 2007, BPH acquired 98% of the shares in Sabah Forest Industries, Malaysia (“SFI”) from a third-party
seller;
Š On July 17, 2007 BILT Graphic Paper Products Limited (“BGPPL”) was incorporated as a wholly owned subsidiary of
Ballarpur;
Š Under a scheme of arrangement and reorganization between Ballarpur and BGPPL, approved by the High Court of
Bombay effective December 26, 2007, but with retrospective application from July 1, 2007, the three production units
owned by Ballarpur at Ballarpur, Bhigwan and Kamalapuram were transferred to BGPPL (together, with its
subsidiaries, the “BGPPL Group”). The consideration for the transfer was the issue to Ballarpur by BGPPL of
150,000,000 9.0% compulsorily convertible debentures of INR100 each (totalling INR15,000,000 (US$369,835)) due
June 15, 2020 (“9.0% CCDs”) and all of the 450,000,000 new shares issued by BGPPL on the same date, representing
99.99% of the increased share capital of BGPPL;
Š On March 19, 2008, these 99.99% of the shares in BGPPL were transferred from Ballarpur to BPH for a consideration
of US$111,193. On the same day, Lathe Investments Pte. Ltd. (“Lathe Investments”) and JP Morgan Mauritius Holdings
VII Limited (“J.P. Morgan Mauritius”) invested US$175,000 in BPH for a total equity stake of 21.21% and BIH’s
ownership was reduced to 78.79%.
Š In connection with this transaction, BPH purchased on March 19, 2008 INR2,582,250 (US$63,806) and on
June 20, 2008 INR12,417,750 (US$291,705) of the 9.0% CCDs from Ballarpur;
Š On May 2, 2008, BIGPH was established as a wholly owned subsidiary of BIH; and
Š On July 14, 2008, J.P. Morgan Mauritius and Lathe Investments acquired a 21.21% ownership interest in BIGPH
(together with its current and predecessor subsidiaries “BIGPH Group”), from BIH. On the same date the BPH
shareholders contributed and transferred as a voluntary non-cash contribution their respective shareholdings in BPH to
BIGPH.
This consolidated historical financial information is in respect of the BIGPH Group which is defined as the “Group” in this
consolidated historical financial information.
These financial statements are different from the historical statutory financial statements of the Company due to the proposed
offering of securities by the Company and disclosures relating to Dutch Civil code like director’s report, other information
have not been considered. In addition, in the historical statutory financial statements of the Company, predecessor basis of
accounting for the group reorganization in 2008 was not applied.
The Group’s operations comprise of the production of pulp and paper spanning across three production units in India and one
in Malaysia. The unit in Malaysia owns two timber licenses granted for a term of 99 years by the State Government of Sabah,
Malaysia for the extraction of timber from the natural forest and for industrial tree plantation in Sabah, Malaysia.
The principal activities of the subsidiaries included in the consolidated historical financial information are as follows:
— F-10 — Page 6

Company Production Units Principal ActivityCountry of
IncorporationEquity interest onJune 30, 2010
BPH . . . . . . . . . . . . . . . . . . . . . . . . . . . . . . . . . . . . . . . Holding Netherlands 100.00%BIPH . . . . . . . . . . . . . . . . . . . . . . . . . . . . . . . . . . . . . . Holding Netherlands 100.00%BGPPL . . . . . . . . . . . . . . . . . . . . . . . . . . . . . . . . . . . . India 99.99%
Ballarpur Pulp and paper IndiaBhigwan Paper IndiaKamalapuram Pulp India
SF1 . . . . . . . . . . . . . . . . . . . . . . . . . . . . . . . . . . . . . . . Sabah Pulp, paper and forestry Malaysia 97.80%
The Company’s ownership percentages in the above listed companies and their predecessor entities, where applicable, have
been unchanged during the periods covered by this consolidated historical financial information.
The non-controlling interest in BGPPL is owned by Ballarpur and the non-controlling interest in SFI is owned by the
Government of Malaysia.
2. Summary of significant accounting policies
The principal accounting policies applied in the preparation of this consolidated financial information are set out below. These
policies have been consistently applied to all the years presented, unless otherwise stated.
2.1 Basis of preparation
Group reorganisation I
As detailed under ‘General Information and the Development of the BIGPH Group’, on March 19, 2008 BPH acquired 99.9%
of BGPPL’s shares. Under the same agreement, BPH issued additional shares for cash to two investors, J.P. Morgan Mauritius
and Lathe Investments, thereby diluting Ballarpur’s effective ownership of BGPPL to 78.79%. Contractual arrangements put
in place as part of this agreement resulted in BGPPL becoming a joint venture between Ballarpur and J.P. Morgan Mauritius
and Lathe Investments. This agreement was amended on May 29, 2009 for no consideration and from that date the Group
became a subsidiary of the Ballarpur Group again.
Management have determined that the reorganisation that introduced the additional funding from the two additional investors,
J.P. Morgan Mauritius and Lathe Investments, to this subgroup in return for the issue of shares is outside the scope of IFRS 3
‘Business Combinations’ (“IFRS3”) as it does not meet the definition of a business combination. Management has applied
predecessor accounting to the transaction, thereby recording BGPPL and SF1 at the carrying amounts they were previously
carried at in the financial statements of the Ballarpur Group. On such basis, the consolidated historical financial information
sets out the Group’s financial position as of June 30, 2008, 2009 and 2010 and results of operations and cash flows for the
three years.
Group reorganisation II
Until July 14, 2008, BPH was the holding company of the Group. BPH was owned by BIH, Lathe Investments Pte Ltd. and J.P.
Morgan Mauritius in the ratio of 78.79%, 13.33% and 7.88% respectively. At that time BIGPH was wholly owned by BIH.
As detailed under ‘General Information and the Development of the BIGPH Group’, on July 14, 2008 BPH became a wholly
owned subsidiary of BIGPH, and BIGPH became owned as to 78.79% by BIH, 13.33% by Lathe Investments and 7.88% by
J.P. Morgan Mauritius.
As BIGPH is substantially a new company, the acquisition of BPH by BIGPH has been treated in these consolidated financial
statements as a group reorganisation. This means that the acquiring company is BPH
— F-11 — Page 7

and the company being acquired is the Group’s current legal parent company BIGPH. The consolidated assets and liabilities of
BIGPH immediately after the effective time of the group reorganization are the same as the consolidated assets and liabilities
of BPH immediately prior thereto.
This consolidated financial information has been prepared in the name of the current legal parent company BIGPH, but
continuity in the Group accounting applies to the consolidated financial information of BPH. The information for the period
prior to July 14, 2008 in these consolidated financial statements has been extracted from the BPH consolidated financial
statements.
Applicable accounting standards
This consolidated historical financial information has been prepared in accordance with International Financial Reporting
Standards as adopted by the European Union (“IFRS”) and International Financial Reporting Interpretations Committee
(“IFRIC”) interpretations.
These consolidated financial statements are presented in US dollars, rounded to the nearest thousand (US$’000) unless
otherwise stated. It has been prepared under the historical cost convention, except for available for sale financial assets,
financial assets and financial liabilities (including derivative instruments) at fair value through profit or loss and biological
assets, which has been recorded at fair value. The consolidated financial statements have been prepared on going concern
basis.
In respect of the opening year of the historical financial information, no financial statements have previously been published
in relation to the assets and liabilities that comprise the Group during the year ended June 30, 2008.
The preparation of historical financial information in conformity with IFRS requires the use of certain critical accounting
estimates. It also requires management to exercise its judgment in the process of applying the Group’s accounting policies.
The areas involving a higher degree of judgment or complexity, or areas where assumptions and estimates are significant to
the consolidated financial information are disclosed in note 4.
2.2 Changes in accounting policy and disclosure
a. New and amended standards adopted by the Group
The following new standards and amendments to standards are mandatory for the first time for the financial year beginning
July 1, 2009.
IFRS 8, ‘Operating segments’, (effective from January 1, 2009): IFRS 8 requires an entity to report financial and descriptive
information about its reportable segments. Reportable segments are components of an entity for which separate financial
information is available that is evaluated regularly by the chief operating decision maker in deciding how to allocate resources
and assessing performance. The adoption of IFRS 8 “Operating Segments” did not have an impact on the Group’s reported
results or financial position.
IAS 1 (Revised), ‘Presentation of financial statements’ (effective from January 1, 2009): The revised standard prohibits the
presentation of items of income and expenses (that is, ‘non-owner changes in equity’) in the statement of changes in equity,
requiring ‘non-owner changes in equity’ to be presented separately from owner changes in equity in a statement of
comprehensive income. As a result the Group presents in the consolidated statement of changes in equity all owner changes in
equity, whereas all non-owner changes in equity are presented in the consolidated statement of comprehensive income.
Comparative information has been re-presented so that it also is in conformity with the revised standard. As the amendment
only results in additional disclosures, there is no impact on earnings per share.
IAS 23 (Revised), ‘Borrowing costs’ (effective from January 1, 2009): The revised standard changes the accounting policy in
respect of borrowing costs relating to qualifying assets for which the commencement
— F-12 — Page 8

date for capitalization is on or after January 1, 2009. The borrowing costs directly attributable to the acquisition, construction
or production of a qualifying asset shall be capitalized as part of the cost of that asset. Previously all borrowing costs could be
recognized as an expense immediately. The amendment does not change the accounting policy applied by the Group as the
Group has already been capitalizing the eligible borrowing costs as allowed by this standard before amendment.
IFRS 7 ‘Financial instruments — Disclosures’ (amendment) — effective January 1, 2009. The amendment requires enhanced
disclosures about fair value measurement and liquidity risk. In particular, the amendment requires disclosure of fair value
measurements by level of a fair value measurement hierarchy. As the amendment only results in additional disclosures, there
is no impact on earnings per share.
IAS 41 (Amendment), Agriculture (effective from January 1, 2009): The amendment is part of the IASB’s annual
improvements project published in May 2008. It requires the use of a market-based discount rate where fair value calculations
are based on discounted cash flows and the removal of the prohibition on taking into account biological transformation when
calculating fair value. The amendment does not have a material impact on the Group’s financial statements.
IFRS 3 (revised), ‘Business combinations’ (effective from July 1, 2009): The revised standard continues to apply the
acquisition method to business combinations but with some significant changes compared with IFRS 3. For example, all
payments to purchase a business are recorded at fair value at the acquisition date, with contingent payments classified as debt
subsequently remeasured through the statement of comprehensive income. There is a choice on an acquisition-by-acquisition
basis to measure the non-controlling interest in the acquiree either at fair value or at the non-controlling interest’s
proportionate share of the acquiree’s net assets. All acquisition-related costs are expensed. The revised standard will affect the
accounting of all business combinations from July 1, 2009.
IAS 27 (Revised), ‘Consolidated and Separate Financial Statements’ (effective from July 1, 2009): The revised standard
requires the effects of all transactions with non-controlling interests to be recorded in equity if there is no change in control
and these transactions will no longer result in goodwill or gains and losses. The standard also specifies the accounting when
control is lost. Any remaining interest in the entity is re-measured to fair value, and a gain or loss is recognized in profit or
loss. IAS 27 (revised) has had no impact on the current period, as none of the non-controlling interests have a deficit balance;
there have been no transactions whereby an interest in an entity is retained after the loss of control of that entity, and there
have been no transactions with non-controlling interests.
b. New and amended standards, and interpretations mandatory for the first time for the financial year beginning July 1, 2009
but not currently relevant to the Group (although they may affect the accounting for future transactions and events)
IAS 38 (Amendment), Intangible assets (effective from July 1, 2009): The amendment is part of the IASB’s annual
improvements project published in April 2009 and the Group and company will apply IAS 38 (amendment) from the date
IFRS 3 (revised) is adopted. The amendment clarifies guidance in measuring the fair value of an intangible asset acquired in a
business combination and it permits the grouping of intangible assets as a single asset if each asset has similar useful
economic lives. The amendment will not result in a material impact on the Group or company’s financial statements.
IFRS 2 (Amendment), ‘Share-based payment’ (effective from January 1, 2009): The amended standard deals with vesting
conditions and cancellations. IFRS 2 (Amendment) is not relevant for the Group as there are no share-based payments.
IFRIC 9 (Amendment), Reassessment of embedded derivatives (effective from July 1, 2009). The amendment is part of the
IASB’s annual improvements project published in April 2009. The amendment clarifies the scope of IFRIC 9 to exclude
embedded derivatives in contracts acquired in business combinations, combination of entities or businesses under common
control, or the formation of joint ventures, or their possible reassessment at the date of acquisition.
— F-13 — Page 9

IFRIC 9 (Amendment), ‘Reassessment of embedded derivatives and IAS 39, Financial instruments: Recognition and
measurement’, (effective July 1, 2009): The change requires that an assessment is made of whether an embedded derivative
must be separated from a host contract, for all financial instruments reclassified out of the “fair value through profit or loss”
category. This assessment must be made at the time of re-classification.
IFRIC 15 Agreements for the Construction of Real Estate (effective from January 1, 2009) The aim of this interpretation is to
determine whether an agreement for the construction of real estate is within the scope of IAS 11 Construction Contracts or
IAS 18 Revenue.
IFRIC 16, ‘Hedges of a net investment in a foreign operation’ (effective July 1, 2009): This amendment states that, in a hedge
of a net investment in a foreign operation, qualifying hedging instruments may be held by any entity or entities within the
group, including the foreign operation itself, as long as the designation, documentation and effectiveness requirements of
IAS 39 that relate to a net investment hedge are satisfied.
IFRIC 17, ‘Distribution of non-cash assets to owners’ (effective on or after July 1, 2009): The interpretation was published in
November 2008. This interpretation provides guidance on accounting for arrangements whereby an entity distributes non-cash
assets to shareholders either as a distribution of reserves or as dividends. IFRS 5 has also been amended to require that assets
are classified as held for distribution only when they are available for distribution in their present condition and the
distribution is highly probable.
IFRIC 18, ‘Transfers of assets from customers’, effective for transfer of assets received on or after July 1, 2009. This
interpretation clarifies the requirements of IFRSs for agreements in which an entity receives from a customer an item of property,
plant and equipment that the entity must then use either to connect the customer to a network or to provide the customer with
ongoing access to a supply of goods or services (such as a supply of electricity, gas or water). In some cases, the entity receives
cash from a customer that must be used only to acquire or construct the item of property, plant, and equipment in order to connect
the customer to a network or provide the customer with ongoing access to a supply of goods or services (or to do both).
c. New and amended standards, and interpretations issued but not effective for the financial year beginning July 1, 2009 and
not early adopted
IFRS 10, ‘Consolidated Financial Statements’, effective for annual periods beginning on or after January 1, 2013; IFRS 10
supersedes IAS 27 Consolidated and Separate Financial Statements and SIC-12 Consolidation — Special Purpose Entities. The
IFRS defines the principal of control and establishes control as the basis for determining which entities are consolidated in the
consolidated financial statements. The IFRS also sets out the accounting requirements for the preparation of consolidated
financial statements. The Group is currently evaluating the impact that the adoption of this standard will have on its
consolidated financial statements.
IAS 27, ‘Separate financial statements’, includes the provisions on separate financial statements that are left after the control
provisions of IAS 27 have been included in the new IFRS 10.
IFRS 11, ‘Joint arrangements’, effective for annual periods beginning on or after January 1, 2013; IFRS 11 supersedes IAS 31
Interest in Joint Ventures and SIC-13 Jointly Controlled Entities-Non Monetary Contributions by Venturers. The IFRS
requires a party to a joint arrangement to determine the type of joint arrangement in which it is involved by assessing its rights
and obligations arising from the arrangement. The Group is currently evaluating the impact that the adoption of this standard
will have on its consolidated financial statements. The standard has not yet been endorsed by the EU.
IAS 28, ‘Investments in associates and joint ventures’, now includes the requirements for joint ventures, as well as associates,
to be equity accounted following the issue of IFRS 11.
IFRS 12, ‘Disclosure of Interest in Other Entities’ effective for annual periods beginning on or after January 1,
— F-14 — Page 10

2013; The IFRS requires an entity to disclose information that enables users of financial statements to evaluate the nature of,
and risks associated with, its interests in other entities; and the effects of those interests on its financial position, financial
performance and cash flows. The Group is currently evaluating the impact that the adoption of this standard will have on its
consolidated financial statements. The standard has not yet been endorsed by the EU.
IFRS 13, ‘Fair Value Measurement’, effective for annual periods beginning on or after January 1, 2013; The IFRS 13 defines
fair value; sets out in a single IFRS a framework for measuring fair value; and requires disclosures about fair value
measurements. The IFRS explains how to measure fair value for financial reporting. It does not require fair value
measurements in addition to those already required or permitted by other IFRSs and is not intended to establish valuation
standards or affect valuation practices outside financial reporting. The Group is currently evaluating the impact that the
adoption of this standard will have on its consolidated financial statements. The standard has not yet been endorsed by the EU.
IAS 1 (Amendment), ‘Presentation of financial statements’ (effective from January 1, 2010): The amendment clarifies that the
potential settlement of a liability by the issue of equity is not relevant to its classification as current or non-current. By
amending the definition of current liability, the amendment permits a liability to be classified as non-current (provided that the
entity has an unconditional right to defer settlement by transfer of cash or other assets for at least 12 months after the
accounting period) notwithstanding the fact that the entity could be required by the counterparty to settle in shares at any time.
IAS 19 (revised), ‘Employee benefits’, issued in June 2011. It supersedes IAS 19, ‘Employee benefits’. The revised standard
eliminates the corridor approach and method of calculating finance cost on a net funding basis. It is applicable from January 1,
2013. The standard has not yet been endorsed by the EU. The standard is not expected to have a material impact on the
group’s financial statements.
IAS 24 (revised), ‘Related party disclosures’, issued in November 2009. It supersedes IAS 24, ‘Related party disclosures’,
issued in 2003 (effective on or after January 1, 2011): The revised standard clarifies and simplifies the definition of a related
party and removes the requirement for government-related entities to disclose details of all transactions with the government
and other government-related entities. When the revised standard is applied, the group and the parent will need to disclose any
transactions between its subsidiaries and its associates. The Group is currently putting systems in place to capture the
necessary information. It is, therefore, not possible at this stage to disclose the impact, if any, of the revised standard on the
related party disclosures. The standard has not yet been endorsed by the EU.
IAS 36 (amendment), ‘Impairment of assets’, effective January 1, 2010. The amendment clarifies that the largest cash-
generating unit (or Group of units) to which goodwill should be allocated for the purposes of impairment testing is an
operating segment, as defined by paragraph 5 of IFRS 8, ‘Operating segments’ (that is, before the aggregation of segments
with similar economic characteristics). The amendment does not have a material impact on the Group’s financial statements.
IFRS 2 (amendments), ‘Group cash-settled share-based payment transactions’, effective form January 1, 2010. In addition to
incorporating IFRIC 8, ‘Scope of IFRS 2’, and IFRIC 11, ‘IFRS 2 — Group and treasury share transactions’, the amendments
expand on the guidance in IFRIC 11 to address the classification of group arrangements that were not covered by that
interpretation. IFRS 2 (Amendment) is not relevant for the Group as there are no share-based payments.
IAS 32 Financial instruments: Presentation on classification of rights issues (effective on or after February 1, 2010): The
amendment addresses the accounting for rights issues that are denominated in a currency other than the functional currency of
the issuer. Provided certain conditions are met, such rights issues are now classified as equity regardless of the currency in
which the exercise price is denominated. Previously, these issues had to be accounted for as derivative liabilities. The
amendment does not have a material impact on the Group’s financial statements.
IFRS 5 (amendment), ‘Non-current assets held for sale and discontinued operations’. The amendment
— F-15 — Page 11

clarificates that IFRS 5 specifies the disclosures required in respect of non-current assets (or disposal groups) classified as
held for sale or discontinued operations. It also clarifies that the general requirement of IAS 1 still apply, in particular
paragraph 15 (to achieve a fair presentation) and paragraph 125 (sources of estimation uncertainty) of IAS 1. As the
amendment only impact disclosures, there is no impact on earnings per share.
IFRS 9, ‘Financial instruments’, issued in November 2009. This standard is the first step in the process to replace IAS 39,
‘Financial instruments: recognition and measurement’. IFRS 9 introduces new requirements for classifying and measuring
financial assets and is likely to affect the Group’s accounting for its financial assets. The standard is not applicable until
January 1, 2013 but is available for early adoption. However, the standard has not yet been endorsed by the EU. The Group is
currently evaluating the impact that the adoption of this standard will have on its consolidated financial statements.
IFRIC 19, ‘Extinguishing financial liabilities with equity instruments’, effective July 1, 2010. The interpretation clarifies the
accounting by an entity when the terms of a financial liability are renegotiated and result in the entity issuing equity
instruments to a creditor of the entity to extinguish all or part of the financial liability (debt for equity swap). It requires a gain
or loss to be recognized in profit or loss, which is measured as the difference between the carrying amount of the financial
liability and the fair value of the equity instruments issued. If the fair value of the equity instruments issued cannot be reliably
measured, the equity instruments should be measured to reflect the fair value of the financial liability extinguished. The Group
will apply the interpretation from January 1, 2011, subject to endorsement by the EU. The Group is currently evaluating the
impact that the adoption of this interpretation will have on its consolidated financial statements.
IFRIC 14 (amendment) ‘Prepayments of a minimum funding requirement’ (effective on or after January 1, 2011): The
amendment corrects an unintended consequence of IFRIC 14, ‘IAS 19 — The limit on a defined benefit asset, minimum
funding requirements and their interaction’. Without the amendments, entities are not permitted to recognize as an asset some
voluntary prepayments for minimum funding contributions. This was not intended when IFRIC 14 was issued, and the
amendments correct this. The amendments are effective for annual periods beginning January 1, 2011. Earlier application is
permitted. The amendments should be applied retrospectively to the earliest comparative period presented. The amendment
does not have a material impact on the Group’s financial statements.
2.3 Consolidation
(a) Subsidiaries
Subsidiaries are all entities (including special purpose entities) over which the Group has the power to govern the financial
and operating policies generally accompanying a shareholding of more than one half of the voting rights. The existence and
effect of potential voting rights that are currently exercisable or convertible are considered when assessing whether the Group
controls another entity. Subsidiaries are fully consolidated from the date on which control is transferred to the Group. They
are de-consolidated from the date that control ceases.
The Group uses the purchase method of accounting to account for the acquisition of subsidiaries. The consideration transferred
for the acquisition of a subsidiary is the fair values of the assets transferred, the liabilities incurred and the equity interests
issued by the Group. The consideration transferred includes the fair value of any asset or liability resulting from a contingent
consideration arrangement. Acquisition related costs are expensed as incurred. Identifiable assets acquired and liabilities and
contingent liabilities assumed in a business combination are measured initially at their fair values at the acquisition date. On
an acquisition-by-acquisition basis, the Group recognises any non-controlling interest in the acquiree either at fair value or at
the non-controlling interest’s proportionate share of the acquiree’s net assets.
The excess of the consideration transferred, the amount of any non-controlling interest in the acquiree and the acquisition date
fair value of any previous equity interest in the acquiree over the fair value of the Group’s
— F-16 — Page 12

share of the identifiable net assets acquired is recorded as goodwill. If this is less than the fair value of the net assets of the
subsidiary acquired in the case of a bargain purchase, the difference is recognized directly in the statement of comprehensive
income.
Inter-company transactions, balances and unrealized gains on transactions between Group companies are eliminated.
Unrealized losses are also eliminated. Accounting policies of subsidiaries have been changed where necessary to ensure
consistency with the policies adopted by the Group.
(b) Transactions and non-controlling interests
The Group treats transactions with non-controlling interests as transactions with equity owners of the Group. For purchases
from non-controlling interests, the difference between any consideration paid and the relevant share acquired of the carrying
value of net assets of the subsidiary is recorded in equity. Gains or losses on disposals to non-controlling interests are also
recorded in equity.
When the Group ceases to have control or significant influence, any retained interest in the entity is re-measured to its fair
value, with the change in carrying amount recognized in profit or loss. The fair value is the initial carrying amount for the
purposes of subsequently accounting for the retained interest as an associate, joint venture or financial asset. In addition, any
amounts previously recognized in other comprehensive income in respect of that entity are accounted for as if the Group had
directly disposed of the related assets or liabilities. This may mean that amounts previously recognized in comprehensive
income are reclassified to profit or loss.
2.4 Segmental reporting
Operating segments are reported in a manner consistent with the internal reporting provided to the chief operating decision-
maker. The chief operating decision-maker, who is responsible for allocating resources and assessing performance of the
operating segments, has been identified as the board that makes strategic decisions.
2.5 Foreign currency translation
(a) Functional and presentation currency
Items included in the financial statements of each of the Group’s entities are measured using the currency of the primary
economic environment in which the entity operates (‘the functional currency’). The functional currency of the Malaysian
operations at SFI is Malaysian ringgit, and the functional currency of the Indian operations and the Dutch holding entities is
Indian rupees.
The consolidated financial statements are presented in United States Dollars (“US$”) as the Company believes this is a
currency familiar to international investors.
(b) Transactions and balances
Foreign currency transactions are translated into the functional currency using the exchange rates prevailing at the dates of the
transactions. At each balance sheet date, monetary items denominated in foreign currencies are translated at the exchange rates
prevailing at the balance sheet date. Non-monetary items carried at fair value that are denominated in foreign currencies are
translated at the exchange rates prevailing at the date when the fair value was determined. All foreign exchange gains or losses
are recognized in the income statement, except when deferred in other comprehensive income as qualifying cash flow hedges.
(c) Translation into presentation currency
The results and financial position of all the Group entities that have a functional currency different from the presentation
currency are translated into the presentation currency as follows:
— F-17 — Page 13

Š assets and liabilities for each balance sheet presented are translated at the closing rate at the date of that balance sheet;
Š components of equity are translated at historical rate;
Š income and expenses for each income statement are translated at average exchange rates; and
Š all resulting exchange differences are recognized as a separate component of other comprehensive income.
Goodwill and fair value adjustments arising on the acquisition of a foreign entity are treated as assets and liabilities of the
foreign entity and translated at the closing rate.
The translation rates applied to translate from the functional currencies Indian rupee and Malaysian ringgit into the
presentation currency US$ are as follows:
Currency CodeAs at July 1,
2007
As atJune 30,2008
Averageyearended
June 30,2008
As atJune 30,2009
Averageyearended
June 30,2009
As atJune 30,2010
Averageyearended
June 30,2010
Indian rupee . . . . . . . . . . . . . . . . . . . . . . . . . . INR 40.74 42.85 40.36 48.64 48.38 46.48 46.86Malaysian ringgit . . . . . . . . . . . . . . . . . . . . . . MYR 3.48 3.26 3.32 3.54 3.52 3.25 3.40
2.6 Property, plant and equipment
Property, plant and equipment are stated at historical cost less accumulated depreciation. Historical cost includes expenditure
that is directly attributable to the acquisition of the items.
Subsequent costs are included in the asset’s carrying amount or recognized as a separate asset, as appropriate, only when it is
probable that future economic benefits associated with the item will flow to the Group and the cost of the item can be
measured reliably. The carrying amount of the replaced part is derecognized. All other repairs and maintenance are charged to
the income statement during the financial period in which they are incurred.
Freehold land is not depreciated. Depreciation is charged on a straight line basis so as to write off the cost of the assets to
their residual values over their estimated useful lives using the straight-line method, as follows:
BuildingsFactory Buildings . . . . . . . . . . . . . . . . . . . . . . . . . . . . . . . . . . . . . . . . . . . . . . . . . . . . . . . . . . . . . . . . . . . . . . . . . . . . . 8 to 26 yearsResidential buildings . . . . . . . . . . . . . . . . . . . . . . . . . . . . . . . . . . . . . . . . . . . . . . . . . . . . . . . . . . . . . . . . . . . . . . . . . . . 55 to 61 years
Plant and machinery and equipmentPaper, pulp and utility plants, machinery and equipment Acquired and installed in recent years . . . . . . . . . . . . . . . . 27 to 30 yearsPaper, pulp and utility plants, machinery and equipment implemented historically . . . . . . . . . . . . . . . . . . . . . . . . . . . 15 to 18 yearsOffice and other equipment . . . . . . . . . . . . . . . . . . . . . . . . . . . . . . . . . . . . . . . . . . . . . . . . . . . . . . . . . . . . . . . . . . . . . . 4 to 10 years
Motor vehicles . . . . . . . . . . . . . . . . . . . . . . . . . . . . . . . . . . . . . . . . . . . . . . . . . . . . . . . . . . . . . . . . . . . . . . . . . . . . . . . . . . . . . . . . 4 to 5 yearsJetty and access roads . . . . . . . . . . . . . . . . . . . . . . . . . . . . . . . . . . . . . . . . . . . . . . . . . . . . . . . . . . . . . . . . . . . . . . . . . . . . . . . . . . 25 years
The estimated useful lives, residual values and depreciation method are reviewed at each year end, with the effect of any
changes in estimate being accounted for on a prospective basis.
— F-18 — Page 14
The gain or loss arising on the disposal or retirement of an item of property, plant and equipment is determined as the
difference between the sales proceeds and the carrying amount of the asset and is recognized in the income statement.
2.7 Biological assets
The Group’s standing forest is defined and reported as a biological asset. The biological assets are valued and reported at fair
value after deduction for estimated selling costs. The fair value of the Group’s standing forest is calculated as the present
value of anticipated future cash flow from the assets. The calculation is based on existing, sustainable forest surveys and
assessments regarding growth, timber prices, felling costs including costs for statutory replanting. The changes in fair value
are recorded in a separate line item in operating profit.
2.8 Impairment of non financial assets
Assets that have an indefinite useful life, for example, goodwill are not subject to amortization and are tested annually for
impairment. Assets that are subject to amortization and depreciation are reviewed for impairment whenever events or changes
in circumstances indicate that the carrying amount may not be recoverable. An impairment loss is recognized for the amount
by which the asset’s carrying amount exceeds its recoverable amount. The recoverable amount is the higher of fair value less
costs to sell and value in use. For the purposes of assessing impairment, assets are grouped at the lowest levels for which there
are separately identifiable cash flows (cash-generating units). Non-financial assets other than goodwill that suffered
impairment are reviewed for possible reversal of the impairment at each reporting date.
2.9 Financial assets
The Group classifies its financial assets in the following categories: loans and receivables, available-for-sale and at fair value
through profit or loss. The classification depends on the purpose for which the financial assets were acquired. Management
determines the classification of its financial assets at initial recognition.
(a) Loans and receivables
Loans and receivables are non-derivative financial assets with fixed or determinable payments that are not quoted in an active
market. They are included in current assets, except for maturities greater than 12 months after the balance sheet date.
(b) Available-for-sale financial assets
Available-for-sale financial assets are non-derivative financial assets that are either designated in this category or not
classified in any of the other categories. They are included in non-current assets unless management intends to dispose of the
investment within 12 months of the balance sheet date.
(c) At fair value through profit or loss
Derivative financial instruments are classified in this category unless they are designated as hedges. Assets in this category are
categorized as current assets if they are expected to be realized within 12 months of the balance sheet date.
Regular purchases and sales of financial assets are recognized on the trade-date — the date on which the Group commits to
purchase or sell the asset. Investments are initially recognized at fair value plus transaction costs for all financial assets not
carried at fair value through profit or loss. Financial assets carried at fair value through profit or loss are initially recognized
at fair value, and transaction costs are expensed in the income statement. Financial assets are derecognized when the rights to
receive cash flows from the investments have expired or have been transferred and the Group has transferred substantially all
risks and rewards of ownership. Available-for-sale financial assets and financial assets at fair value through profit or loss are
subsequently carried at fair value. Loans and receivables are subsequently carried at
— F-19 — Page 15
amortized cost using the effective interest method. Change in the fair value of non-monetary securities classified as available
for sale are recognized in other comprehensive income.
The Group assesses at each balance sheet date whether there is objective evidence that a financial asset or a group of financial
assets is impaired.
2.10 Derivative financial instruments and hedging activities
(a). Derivative financial instruments
Derivative financial instruments are initially recognized at fair value on the date a derivative contract is entered into and are
subsequently re-measured at their fair value at the end of each period. The method of recognizing the resulting gain or loss
depends on whether the derivative is designated as a hedging instrument, and if so, the nature of the item being hedged.
(b). Hedging activities
The Group has designated certain borrowings in cash flow hedging relationship. Currently derivatives have not been
designated in a cash flow hedge relationship.
The Group documents at the inception of the transaction the relationship between hedging instruments and hedged items, as
well as its risk management objectives and strategy for undertaking various hedging transactions. The Group also documents
its assessment, both at hedge inception and on an ongoing basis, of whether the derivatives that are used in hedging
transactions are highly effective in offsetting changes in fair values or cash flows of hedged items.
The full fair value of the hedging derivative is classified as a non-current asset or liability when the remaining maturity of the
hedged item is more than 12 months and as a current asset or liability when the remaining maturity of the hedged item is less
than 12 months.
Cash flow hedge
The effective portion of foreign exchange results relating to proportion of the borrowings that are designated and qualify as
cash flow hedges is recognized in other comprehensive income. The gain or loss relating to the ineffective portion is
recognized immediately in the income statement.
Amounts accumulated in other comprehensive income are recycled in the income statement in the periods when the hedged
item affects profit or loss (for example, when the forecast sale that is hedged takes place).
When a hedging instrument expires or is sold, or when a hedge no longer meets the criteria for hedge accounting, any
cumulative gain or loss existing in other comprehensive income at that time remains in other comprehensive income and is
recognized when the forecast transaction is ultimately recognized in the income statement. When a forecast transaction is no
longer expected to occur, the cumulative gain or loss that was reported in other comprehensive income is immediately
transferred to the income statement.
(a) Derivatives at fair value through profit or loss and accounted for at fair value through profit or loss
Certain derivative instruments do not qualify for hedge accounting. Changes in the fair value of any these derivative instruments are
recognized immediately in the income statement.
2.11 Impairment of financial assets
(a) Assets carried at amortized cost
The Group assesses at the end of each reporting period whether there is objective evidence that a financial
— F-20 — Page 16

asset or group of financial assets is impaired. A financial asset or a group of financial assets is impaired and impairment losses
are incurred only if there is objective evidence of impairment as a result of one or more events that occurred after the initial
recognition of the asset (a ‘loss event’) and that loss event (or events) has an impact on the estimated future cash flows of the
financial asset or group of financial assets that can be reliably estimated.
The criteria that the Group uses to determine that there is objective evidence of an impairment loss include:
Š Significant financial difficulty of the issuer or obligor;
Š a breach of contract, such as a default or delinquency in interest or principal payments;
Š the group, for economic or legal reasons relating to the borrower’s financial difficulty, granting to the borrower a
concession that the lender would not otherwise consider;
Š it becomes probable that the borrower will enter bankruptcy or other financial reorganization;
The Group first assesses whether objective evidence of impairment exists.
For loans and receivables category, the amount of the loss is measured as the difference between the asset’s carrying amount
and the present value of estimated future cash flows (excluding future credit losses that have not been incurred) discounted at
the financial asset’s original effective interest rate. The carrying amount of the asset is reduced and the amount of the loss is
recognized in the consolidated income statement. If a loan or held-to-maturity investment has a variable interest rate, the
discount rate for measuring any impairment loss is the current effective interest rate determined under the contract. As a
practical expedient, the Group may measure impairment on the basis of an instrument’s fair value using an observable market
price.
If, in a subsequent period, the amount of the impairment loss decreases and the decrease can be related objectively to an event
occurring after the impairment was recognized (such as an improvement in the debtor’s credit rating), the reversal of the
previously recognized impairment loss is recognized in the consolidated income statement.
(b) Assets classified as available for sale
The Group assesses at the end of each reporting period whether there is objective evidence that a financial asset or a group of
financial assets is impaired. For debt securities, the group uses the criteria refer to (a) above. In the case of equity investments
classified as available for sale, a significant or prolonged decline in the fair value of the security below its cost is also
evidence that the assets are impaired. If any such evidence exists for available-for-sale financial assets, the cumulative loss —
measured as the difference between the acquisition cost and the current fair value, less any impairment loss on that financial
asset previously recognized in profit or loss — is removed from other comprehensive income and recognized in the separate
consolidated income statement. Impairment losses recognized in the separate consolidated income statement on equity
instruments are not reversed through the separate consolidated income statement. If, in a subsequent period, the fair value of a
debt instrument classified as available for sale increases and the increase can be objectively related to an event occurring after
the impairment loss was recognized in profit or loss, the impairment loss is reversed through the separate consolidated income
statement.
Impairment testing of trade receivables is described in note 2.13.
2.12 Inventories
Inventories are stated at lower of cost and net realizable value. Cost is determined on the weighted average method except for
log inventories for which cost is determined on a first-in, first-out basis. The cost of direct work in progress and finished
goods comprises of the cost of raw materials, labor and proportion of conversion costs.
Net realizable value represents the estimated selling price for inventories less all estimated costs to completion and costs
necessary to make the sale.
— F-21 — Page 17

The cost for the purpose of transfer from biological assets is fair value of harvested produce less estimated sales costs.
2.13 Trade receivables
Receivables are recognized initially at fair value and subsequently measured at amortized cost using the effective interest
method, less provision for impairment. A provision for impairment is established when there is objective evidence that the
Group will not be able to collect all amounts due according to the original terms of the receivables. The amount of the
provision is the difference between the asset’s carrying amount and the present value of estimated future cash flows,
discounted at the original effective interest rate. The carrying amount of the asset is reduced through the use of an allowance
account, and the amount of the loss is recognized in the income statement. When a trade receivable is uncollectible, it is
written off against the allowance account for trade receivables. Subsequent recoveries of amounts previously written off are
credited in the income statement.
2.14 Cash and cash equivalents
In the consolidated statement of Cash flow, Cash and cash equivalents includes cash in hand, deposits held at call with banks,
other short-term highly liquid investments with original maturities of three months or less, and bank overdrafts. In the
consolidated balance sheet, Bank overdrafts are shown within borrowings in current liabilities.
2.15 Share capital
Ordinary shares are classified as equity. Incremental costs directly attributable to the issue of new shares are shown in equity
as a deduction, net of tax, from the proceeds.
2.16 Trade payables
Trade payables are recognized initially at fair value and subsequently measured at amortized cost using the effective interest
method.
2.17 Borrowings
Borrowings are recognized initially at fair value, net of transaction costs incurred. Borrowings are subsequently stated at
amortized cost; any difference between the proceeds (net of transaction costs) and the redemption value is recognized in the
income statement over the period of the borrowings using the effective interest method.
Borrowings are classified as current liabilities unless the Group has an unconditional right to defer settlement of the liability
for at least 12 months after the balance sheet date.
Borrowing costs incurred for the construction of any qualifying asset are capitalized during the period of time that is required
to complete and prepare the asset for its intended use. Other borrowing costs are expensed.
If the company revises its estimates of payments or receipts, the carrying amount of the financial liability is adjusted to reflect
actual and revised estimated cash flows. The entity recalculates the carrying amount by computing the present value of
estimated future cash flows at the financial instrument’s original effective interest rate and the adjustment is recognized in
profit or loss as income or expense.
Where borrowings from the shareholders are extinguished for consideration other than fair value, the difference between the
consideration and the carrying amount of the borrowing is accounted for as an equity contribution.
2.18 Taxation
Income tax expense represents the sum of the current tax and deferred tax. Tax is recognized in the income statement, except
to the extent that it relates to items recognized directly in other comprehensive income. In
— F-22 — Page 18

this case the tax is also recognized directly in equity or in other comprehensive income.
The current tax is based on taxable profit for the year/period. Taxable profit differs from profit as reported in the income
statement because it excludes items of income or expense that are taxable or deductible in other years and it further excludes
items that are never taxable or deductible. The current income tax charge is calculated on the basis of the tax laws enacted or
substantively enacted at the balance sheet date in the countries where the Company and its subsidiaries operate and generate
taxable income.
Deferred tax is recognized on differences between the carrying amounts of assets and liabilities in the financial statements and
the corresponding tax bases used in the computation of taxable profit and are accounted for using the balance sheet liability
method. Deferred tax liabilities are generally recognized for all taxable temporary differences, and deferred tax assets are
generally recognized for all deductible temporary differences, unused tax losses and unused tax credits to the extent that it is
probable that future taxable profits will be available against which those deductible temporary differences, unused tax losses
and unused tax credits can be utilized. Such assets and liabilities are not recognized if the temporary difference arises from
goodwill or from the initial recognition (other than in a business combination) of an asset or liability in a transaction that at
the time of the transaction affects neither the taxable profit or loss nor the accounting profit or loss.
The carrying amount of deferred tax assets is reviewed at each balance sheet date and reduced to the extent that it is no longer
probable that sufficient taxable profits will be available against which the temporary differences can be utilized.
Deferred tax assets and liabilities are measured at the tax rates that are expected to apply in the period in which the liability is
settled or the asset realized, based on tax rates (and tax laws) that have been enacted or substantively enacted by the balance
sheet date. The measurement of deferred tax liabilities and assets reflects the tax consequences that would follow from the
manner in which the Company expects, at the reporting date, to recover or settle the carrying amount of its assets and
liabilities.
Deferred income tax is provided on temporary differences arising on investments in subsidiaries and associates, except where
the timing of the reversal of the temporary difference is controlled by the Group and it is probable that the temporary
difference will not reverse in the foreseeable future.
Deferred income tax assets and liabilities are offset when there is a legally enforceable right to offset current tax assets against
current tax liabilities and when the deferred income taxes assets and liabilities relate to income taxes levied by the same
taxation authority on either the taxable entity or different taxable entities where there is an intention to settle the balances on a
net basis.
2.19 Employee benefits
(a) Gratuity plan
The gratuity plan is a defined benefit plan that, at retirement or termination of employment, provides eligible employees with
a lump sum payment, which is a function of the last drawn salary and completed years of service. The liability recognized in
the balance sheet in respect of gratuity plan is the present value of the defined benefit obligation at the balance sheet date less
the fair value of plan assets, if any, together with adjustments for unrecognized past — service costs. The defined benefit
obligation is calculated annually by independent actuaries using the projected unit credit method. The present value of the
defined benefit obligation is determined by discounting the estimated future cash outflows using high quality corporate bonds
and that have terms to maturity approximating to the terms of the related gratuity liability.
Actuarial gains and losses arising from experience adjustments and changes in actuarial assumptions are charged or credited to
income statement in the period in which they arise.
— F-23 — Page 19

(b) Compensated absences
The Group operates both accumulating and non-accumulating absences plan. The Group measures the expected cost of
accumulating compensated absences as the additional amount expected to be paid as a result of the unused entitlement that has
accumulated at the balance sheet date. Expense on non-accumulating compensated absences is recognized in the period in
which the absences occur. The Group records a liability for accumulating balance based on actuarial valuation.
(c) Short-term employee benefits
The Group recognizes a liability and an expense for bonuses. The Group recognizes a provision where contractually obliged or where there is
a past practice that has created a constructive obligation.
Wages, salaries, paid annual leave and sick leave, bonuses, and non-monetary benefits are accrued in the period in which the
associated services are rendered by employees of the Group.
(d) Post-employment benefits — Defined contribution plans
The Group’s contributions to defined contribution plans are charged to the income statement in the period to which they relate.
Once the contributions have been paid, the Group has no further payment obligations. Prepaid contributions are recognized as
an asset to the extent that a cash refund or a reduction in the future payments is available.
2.20 Revenue recognition
Revenue from sale of goods is recognized when the risks and rewards of ownership have passed to the customers. Usually, this
means that sales are recorded upon delivery of goods to customers in accordance with agreed terms of delivery.
Dividend income is recognized when the right to receive payment is established.
Interest income is recognized on a time-proportion basis using the effective interest method. When a receivable is impaired,
the Group reduces the carrying amount to its recoverable amount, being the estimated future cash flow discounted at the
original effective interest rate of the instrument, and continues unwinding the discount as interest income. Interest income on
impaired loans is recognized using the original effective interest rate.
Export incentives are recognized at the time of export when the Group will comply with all attached conditions.
Rental income is accrued on a time basis by reference to the agreements entered into.
2.21 Sales tax incentives
The Group receives the benefit of certain sales tax incentives under the Packaged Scheme Incentive 2007 of the Maharashtra
Government (the “Sales Tax Incentive Scheme”). The benefits under the Sales Tax Incentive Scheme are recognized when it is
reasonable to expect that the benefit will be received and that all related conditions will be met. The main benefits relevant to
the Group are the Sales Tax Deferment Scheme and the Sales Tax Exemption Scheme.
(a) Sales Tax Deferment Scheme
The benefit of a sales tax deferral with no associated interest outflow is recognized as a liability in accordance with the
imputation under IAS 20 Accounting for Governments grants and disclosure of Government Assistance. This deferred liability
is measured in accordance with IAS 39 Financial Instruments: Recognition and Measurement. The benefit of the below market
rate of interest (or no interest) is measured
— F-24 — Page 20

as the difference between initial carrying value of the loan as determined in accordance with IAS 39 and the sales tax
collected.
The benefits under the Sales Tax Deferment Scheme are available only when eligible domestic sales are made from the
Maharashtra State and the sale is therefore treated as the key condition giving rise to the recognition of the benefit. It is
expected that all other conditions related to the deferral of sales will be met and therefore the benefit is recognized as eligible
domestic sales are made. The deferred liability to the State is recognized at is net present value and therefore a finance charge
is recorded as the discount on this liability unwinds.
(b) Sales Tax Exemption Scheme
The benefit of the sales tax exemption applies to qualifying sales to customers within the state of Maharashtra of paper
produced on paper machine PM1 in Bhigwan. While sales tax is levied from the customer, the Group is exempt from payment
of sales tax to the tax authorities, thereby increasing revenues. As this incentive scheme is granted in connection with certain
capital investments in the area, the Group considers the exempt sales tax as capital receipt for purposes of corporate income
taxes. Capital receipts are treated as non-taxable income and thereby reduce the taxable income for BGPPL. Refer to note 22
for the current status of treatment in BGPPL’s income tax returns.
2.22 Government grants
Grants from the government are recognized at their fair value where there is reasonable assurance that the grant will be
received and the Group will comply with all attached conditions. Government grants relating to costs are deferred and
recognized in the income statement over the period necessary to match them with the costs that they are intended to
compensate.
2.23 Prepaid land lease payments
Prepaid land lease payments in the balance sheet represent up-front payment made for operating leases for land use rights paid
and payable to the counterparties. Land use rights are carried at cost and are charged to the consolidated income statement on
a straight-line basis over the respective periods of the leases which have been disclosed in note 8(b).
2.24 Leases
Leases of property, plant and equipment, where the Group has substantially all the risks and rewards of ownership, are
classified as finance leases. Finance leases are capitalized at the lease’s commencement at the lower of the fair value of the
leased property and the present value of the minimum lease payments.
Each lease payment is allocated between the liability and finance charges so as to achieve a constant rate on the finance
balance outstanding. The corresponding rental obligations, net of finance charges, are included in current and non-current
borrowings. The interest element of the finance cost is charged to the income statement over the lease period so as to produce
a constant periodic rate of interest on the remaining balance of the liability for each period. The property, plant and equipment
acquired under finance leases are depreciated over the shorter of the useful life of the asset and the lease term.
Leases in which a significant portion of the risks and rewards of ownership are retained by the lessor are classified as
operating leases. Payments made under operating lease (net of any incentives received from the lessor) are charged to the
income statement on a straight line basis over the period of the lease.
2.25 Compound financial instruments
The liability component of a compound financial instrument is recognized initially at fair value of a similar liability that does
not have an equity component. The equity component is recognized initially at the difference between the fair value of the
compound financial instrument as a whole and the fair value of the
— F-25 — Page 21

liability component. Any directly attributable transaction costs are allocated to the liability and the equity components, if
material, in proportion to their initial carrying amounts.
Subsequent to the initial recognition, the liability component of a compound financial instrument is measured at amortized
cost using the effective interest method. The equity component of a compound financial instrument is not re-measured
subsequent to initial recognition except on conversion or expiry.
2.26 Dividend distribution
Dividend distribution to the Company’s shareholders is recognized as a liability in the Group’s financial statements in the
period in which the dividends are approved by the Company’s shareholders.
2.27 Business combinations
Acquisitions of subsidiaries and businesses are accounted for using the acquisition method. The consideration for each
acquisition is measured at the aggregate of the fair values (at the date of exchange) of assets given, liabilities incurred or
assumed, and equity instruments issued by the Group in exchange for control of the acquiree. Acquisition-related costs are
recognized in profit or loss as incurred.
Any contingent consideration to be transferred by the acquirer will be recognized at fair value at the date of acquisition.
Subsequent changes in such fair values are adjusted against the cost of acquisition where they qualify as measurement period
adjustments. All other subsequent changes in the fair value of contingent consideration classified as an asset or liability are
accounted for in accordance with relevant IFRSs. Changes in the fair value of contingent consideration classified as equity are
not recognized.
Prior to adoption of IFRS 3R, contingent consideration was accounted for in the financial statements on the date of
finalization of the additional consideration. Such amounts were adjusted in the carrying value of goodwill unless a negative
goodwill was recognized as part of the business combination wherein it was recognized in the income statement.
3. Financial risk management
3.1 Financial risk factors
The Group’s activities expose it to a variety of financial risks: market risk (including currency risk, fair value interest rate
risk, cash flow interest rate risk and price risk), commodity risk, credit risk and liquidity risk. The Group’s overall risk
management program focuses on the unpredictability of financial markets and seeks to minimize potential adverse effects on
the Group’s financial performance. The Group uses derivative financial instruments to hedge certain risk exposures.
(a) Foreign exchange risk
The Group has borrowings, deposits and balances with banks, derivative financial instruments, financial trade and other
receivables and payables which are denominated in currencies other than the functional currency of the respective Group
entity. A significant portion of these balances is denominated in US$. The payments and year end translation of these
instruments will be affected by exchange rate movements.
Certain transactions of the Group act as a natural hedge as a portion of both assets and liabilities are denominated in foreign
currencies. For the remaining exposure to foreign exchange risk, the Group adopts a policy of selective hedging based on risk
perception of the management. The Group has entered into a forward exchange contract during the year ended 30 June 2009 to
manage its committed foreign currency exposures. Further, the group has managed its risks of highly probable forecast sales
with foreign currency borrowings. Refer to note 12 for forward exchange contracts outstanding and hedging activities at each
balance sheet date and the gain/loss recognized on this contract.
— F-26 — Page 22

The tables below summarize the impact of changes in the exchange rate of INR to US$. The impact is expressed in terms of
the resulting change in the Group’s profit before tax for the year/period and in the Group’s equity due to hedging reserves as a
result of movement on year-end balances. The sensitivities are based on the assumption that the exchange rate changes by 10%
for the years ended June 30, 2008 and 2009 and by 5% for the year ended June 30, 2010 with all other variables held constant.
Effect on profit before tax
INR to US$ Year ended June 30
2008 2009 2010*
Gain/(loss) associated with 10%/5%* change from year end rateINR strengthens by 10%/5%* against US$ . . . . . . . . . . . . . . . . . . . . . . . . . . . . . . . . . . . . . . . . . . . . . . . 45,043 86,291 14,291
INR weakens by 10%/5%* against US$ . . . . . . . . . . . . . . . . . . . . . . . . . . . . . . . . . . . . . . . . . . . . . . . . . (47,001) (84,792) (14,501)
Effect on other components of equity
INR to US$ Year ended June 30
2008 2009 2010
Gain/(loss) associated with 10% change from year end rateINR strengthens by 10% against US$ . . . . . . . . . . . . . . . . . . . . . . . . . . . . . . . . . . . . . . . . . . . . . . . . . . . . — 25,300 —
INR weakens by 10% against US$ . . . . . . . . . . . . . . . . . . . . . . . . . . . . . . . . . . . . . . . . . . . . . . . . . . . . . . — (25,300) —
There was no hedging reserve in the year ended June 30, 2008. There is no impact on other components of equity for all other
periods.
Effect on profit before tax
INR to Euro Year ended June 30
2008 2009 2010*
Gain/(loss) associated with 10%/5%* change from year end rateINR strengthens by 10%/5%* against Euro . . . . . . . . . . . . . . . . . . . . . . . . . . . . . . . . . . . . . . . . . . . . . . . 7,573 131 2,685
INR weakens by 10%/5%* against Euro . . . . . . . . . . . . . . . . . . . . . . . . . . . . . . . . . . . . . . . . . . . . . . . . . (7,258) (131) (2,685)
(a) Interest rate risk
The Group’s significant borrowings are at variable rates except for short-term borrowings. These borrowings are linked to
LIBOR and prime lending rates of banks in India. The Group has taken interest rate caps for certain of its LIBOR linked
borrowings during the year ended June 30, 2009. Refer to note 12 for interest rate swap contracts outstanding as at each
balance sheet date and the gain/loss recognized on these contracts.
The table below summarizes the impact of changes in interest rates. The impact is expressed in terms of the resulting change
in the Group’s profit before tax for the year/period. The sensitivities are based on the assumption that the interest rate changes
by 110 basis points for the years ended June 30, 2008 and 2009 and by 50 basis points for the year ended June 30, 2010 with
all other variables hold constant.
— F-27 — Page 23

Effect on profit before tax
Interest rates Year ended June 30,
2008 2009 2010*
Gain/(loss) associated with 110/50* basis points change from year end rateInterest rates higher by 110/50* basis points . . . . . . . . . . . . . . . . . . . . . . . . . . . . . . . . . . . . . . . . . . . . . . (507) (773) 1,537
Interest rates lower by 110/50* basis points . . . . . . . . . . . . . . . . . . . . . . . . . . . . . . . . . . . . . . . . . . . . . . 501 (2,048) (1658)
(c) Credit risk
The Group considers factors such as track record, size of the institution, market reputation and service standards to select the
banks with which balances are maintained. Generally, the balances are maintained with the institutions with which the
Company has also availed borrowings. The Group does not maintain significant cash and deposit balances other than those
required for its day to day operations.
The Group extends credit to customers for the short-term only. The Group considers factors such as credit track record in the
market, past dealings with the Group for extension of credit to customers. The Group monitors the payment track record of the
customers. The Group has also taken security deposits from its distributors, which mitigate the credit risk to an extent.
The Group maintains balances and deposits with financial institutions after consideration of their market reputation. The
deposits and balances of the Group have been maintained with financial institutions which has credit rating of
Š AAA (AAA ratings are judged to be of highest quality and are subject to minimal credit risk), AA and AA+ (AA and
AA+ ratings are judged to be of high quality and are subject to very low credit risk), A (A ratings are considered upper-
medium grade and are subject to low credit risk) and Ba (Ba are judged to have speculative elements and are subject to
substantial credit risk).
Š P1 (P1 ratings are judged to be of highest quality and are subject to minimal credit risk), P2 (P2 ratings are judged to be
of high quality and are subject to low credit risk) and P3 (P3 ratings are considered of adequate quality and are subject
to medium credit risk).
Maximum exposure to credit risk and credit quality is disclosed in note 9 and note 10.
(d) Liquidity risk
The Group relies on a mix of borrowings, capital infusion and excess operating cash flows to meet its needs for funds. The
current committed lines of credit are sufficient to meet its short to medium term expansion needs.
The table below analyses the Group’s financial liabilities into relevant maturity groupings based on the remaining period at
the balance sheet to the contractual maturity date. The maturity profile based on undiscounted cash flows is as under:
As at June 30, 2008Less than1 year
Between1 and 2years
Between2 and 5years
Over 5years
Borrowings (excluding finance lease liabilities) . . . . . . . . . . . . . . . . . . . . . . . . . . . . . . . . . . . . 88,787 21,854 216,503 303,353Finance lease liabilities . . . . . . . . . . . . . . . . . . . . . . . . . . . . . . . . . . . . . . . . . . . . . . . . . . . . . . . . 71 71 198 40Trade and other payables . . . . . . . . . . . . . . . . . . . . . . . . . . . . . . . . . . . . . . . . . . . . . . . . . . . . . . 112,626 1,398 6,333 3,026
Total . . . . . . . . . . . . . . . . . . . . . . . . . . . . . . . . . . . . . . . . . . . . . . . . . . . . . . . . . . . . . . . . . . . . . . 201,484 23,323 223,034 306,419
— F-28 — Page 24

As at June 30, 2009Less than1 year
Between1 and 2years
Between2 and 5years
Over 5years
Borrowings (excluding finance lease liabilities) . . . . . . . . . . . . . . . . . . . . . . . . . . . . . . . . . . . . 59,551 69,711 388,575 205,512Finance lease liabilities . . . . . . . . . . . . . . . . . . . . . . . . . . . . . . . . . . . . . . . . . . . . . . . . . . . . . . . . 79 80 183 —Derivative financial instruments . . . . . . . . . . . . . . . . . . . . . . . . . . . . . . . . . . . . . . . . . . . . . . . . . — — 14,762 —Trade and other payables . . . . . . . . . . . . . . . . . . . . . . . . . . . . . . . . . . . . . . . . . . . . . . . . . . . . . . 99,993 1,594 5,800 1,379
Total . . . . . . . . . . . . . . . . . . . . . . . . . . . . . . . . . . . . . . . . . . . . . . . . . . . . . . . . . . . . . . . . . . . . . . 159,623 71,385 409,320 206,891
As at June 30, 2010Less than1 year
Between1 and 2years
Between2 and 5years
Over 5years(notebelow)
Borrowings (excluding finance lease liabilities) . . . . . . . . . . . . . . . . . . . . . . . . . . . . . . . . . . . . 100,213 62,953 279,134 337,766Finance lease liabilities . . . . . . . . . . . . . . . . . . . . . . . . . . . . . . . . . . . . . . . . . . . . . . . . . . . . . . . . 114 114 184 —Derivative financial instruments . . . . . . . . . . . . . . . . . . . . . . . . . . . . . . . . . . . . . . . . . . . . . . . . . — — 19,154 —Trade and other payables . . . . . . . . . . . . . . . . . . . . . . . . . . . . . . . . . . . . . . . . . . . . . . . . . . . . . . 174,042 1,904 5,056 —
Total . . . . . . . . . . . . . . . . . . . . . . . . . . . . . . . . . . . . . . . . . . . . . . . . . . . . . . . . . . . . . . . . . . . . . . 274,369 64,971 303.528 337,766
The amounts of compulsory convertible debentures and profit certificates (further described in note 21.2. b) and c)) issued and
outstanding as at June 30, 2010 are included in the “over 5 years” column of the above tables for the respective balance sheet dates.
3.2 Capital risk management
The Group’s objective when managing capital is to safeguard the Group’s ability to continue as a going concern in order to provide
returns for shareholders and benefits for stakeholders. The Group also proposes to maintain an optimal capital structure to reduce the
cost of capital. In order to maintain or adjust the capital structure, the Group may adjust any dividend payments, return capital to
shareholders or issue new shares. Equity as shown in the consolidated balance sheet together with compulsory convertible debentures
issued to a related party as reduced by equity component of profit certificate is managed as capital by the Group.
3.3 Fair value estimation
The tables below analyses financial instruments carried at fair value, by valuation method. The different levels have been
defined as follows:
Š Quoted prices (unadjusted) in active markets for identical assets or liabilities (level 1).
Š Inputs other than quoted prices included within level 1 that are observable for the asset or liability, either directly (that
is, as prices) or indirectly (that is, derived from prices) (level 2).
Š Inputs for the asset or liability that are not based on observable market data (that is, unobservable inputs) (level 3).
The Group did not have financial instruments carried at fair value as at June 30, 2008. The following tables present the
Group’s assets and liabilities that are measured at fair value as at June 30, 2009 and 2010.
June 30, 2009
Level 1 Level 2 Level 3 Total
AssetsDerivative financial instruments at fair value through profit or loss . . . . . . . . . . . . . . . . . . . . . . . . . . — — 27,281 27,281Available-for-sale financial asset . . . . . . . . . . . . . . . . . . . . . . . . . . . . . . . . . . . . . . . . . . . . . . . . . . . . . — — 22,006 22,006
Total assets . . . . . . . . . . . . . . . . . . . . . . . . . . . . . . . . . . . . . . . . . . . . . . . . . . . . . . . . . . . . . . . . . . . . . . — — 49,287 49,287
LiabilitiesDerivative financial instruments at fair value through profit or loss . . . . . . . . . . . . . . . . . . . . . . . . . . — 14,762 — 14,762
Total liabilities . . . . . . . . . . . . . . . . . . . . . . . . . . . . . . . . . . . . . . . . . . . . . . . . . . . . . . . . . . . . . . . . . . . — 14,762 — 14,762
— F-29 — Page 25

June 30, 2010
Level 1 Level 2 Level 3 Total
AssetsDerivative financial instruments at fair value through profit or loss . . . . . . . . . . . . . . . . . . . . . . . . . . — — 13,212 13,212Available-for-sale financial asset . . . . . . . . . . . . . . . . . . . . . . . . . . . . . . . . . . . . . . . . . . . . . . . . . . . . . — 22,099 — 22,099
Total assets . . . . . . . . . . . . . . . . . . . . . . . . . . . . . . . . . . . . . . . . . . . . . . . . . . . . . . . . . . . . . . . . . . . . . . — 22,099 13,212 35,311
LiabilitiesDerivative financial instruments at fair value through profit or loss . . . . . . . . . . . . . . . . . . . . . . . . . . — 19,154 — 19,154
Total liabilities . . . . . . . . . . . . . . . . . . . . . . . . . . . . . . . . . . . . . . . . . . . . . . . . . . . . . . . . . . . . . . . . . . . — 19,154 — 19,154
The fair value of financial instruments traded In active markets is based on quoted market prices at the balance sheet date and
included in level 1. The Group had no financial instruments included in level 1 during the period of this consolidated financial
information.
The fair value of financial instruments that are not traded in an active market (for example, over-the-counter derivatives) is
determined by using valuation techniques. These valuation techniques maximize the use of observable market data where it is
available and rely as little as possible on entity specific estimates. If all significant inputs required to fair value an instrument
are observable, the instrument is included in level 2.
If one or more of the significant inputs is not based on observable market data, the instrument is included in level 3.
Specific valuation techniques used to value these financial instruments include:
Š The fair value of the foreign exchange forward and option derivative contract has been calculated based on
management’s assessment of forward foreign exchange and volatility curves.
Š The fair value of the available-for sale investment at June 30, 2009 has been calculated based on a discounted cash flow
analysis and at June 30, 2010 based on a comparable market transaction occurred in September 2010.
Š The fair value of interest rate swaps has been calculated as the present value of the estimated future cash flows based on
observable yield curves.
Š The fair value of the LIBOR profit certificates and LIBOR + 3.82% compulsorily convertible debentures has been
calculated using the Group’s observable average borrowing rate and applying discounted cash flow analysis. However,
since these instruments are carried at amortized cost, they have not been included in level hierarchy disclosure.
The following table presents the changes in level 3 instruments as at June 30, 2009 and 2010.
Derivative financialinstruments at fair
value throughprofit or loss
Available-for-salefinancial asset Total
At July 1, 2008 . . . . . . . . . . . . . . . . . . . . . . . . . . . . . . . . . . . . . . . . . . . . . . . . . . . . . . . — — —Purchases . . . . . . . . . . . . . . . . . . . . . . . . . . . . . . . . . . . . . . . . . . . . . . . . . . . . . . . . . . . . — 3,920 3,920Gains and losses recognized in profit or loss . . . . . . . . . . . . . . . . . . . . . . . . . . . . . . . . . 27,281 — 27,281Gains and losses recognized in other comprehensive income . . . . . . . . . . . . . . . . . . . . — 17,913 17,913Exchange differences . . . . . . . . . . . . . . . . . . . . . . . . . . . . . . . . . . . . . . . . . . . . . . . . . . . — 173 173
At June 30, 2009 . . . . . . . . . . . . . . . . . . . . . . . . . . . . . . . . . . . . . . . . . . . . . . . . . . . . . . 27,281 22,006 49,287Exchange differences . . . . . . . . . . . . . . . . . . . . . . . . . . . . . . . . . . . . . . . . . . . . . . . . . . . — 990 990Purchases . . . . . . . . . . . . . . . . . . . . . . . . . . . . . . . . . . . . . . . . . . . . . . . . . . . . . . . . . . . . 12,000 2,831 14,831Settlements . . . . . . . . . . . . . . . . . . . . . . . . . . . . . . . . . . . . . . . . . . . . . . . . . . . . . . . . . . . (15,690) — (15,690)Transfer to Level 2 . . . . . . . . . . . . . . . . . . . . . . . . . . . . . . . . . . . . . . . . . . . . . . . . . . . . — (22,099) (22,099)
— F-30 — Page 26

Gains and losses recognized in profit or loss . . . . . . . . . . . . . . . . . . . . . . . . . . . . . . . . . . . . . . . . . . . . . . . . . . . . . (10,379) — (10,379)Gains and losses recognized in other comprehensive income . . . . . . . . . . . . . . . . . . . . . . . . . . . . . . . . . . . . . . . . — (3,728) (3,728)
At June 30, 2010 . . . . . . . . . . . . . . . . . . . . . . . . . . . . . . . . . . . . . . . . . . . . . . . . . . . . . . . . . . . . . . . . . . . . . . . . . . 13,212 — 13,212
If discount rates for fair valuation of the available-for-sale financial assets had been higher/lower by 2% in the year ended
June 30, 2009, the gain in that period would have been lower/higher by US$401/550.
If exchange rates for fair valuation of the derivative financial instruments had been higher/lower by 10%/ 5% in the year
ended June 30, 2009 and June 30, 2010, the gain in that period would have been lower/higher by US$19,681/ 25,713 for the
year ended June 30, 2009 and higher/lower by US$490/ 700 for the year ended June 30, 2010.
4. Critical accounting estimates and assumptions
The preparation of consolidated financial statements requires management to make estimates and assumptions relating to the
reporting of assets and liabilities and the disclosure of contingent assets and liabilities at the date of the consolidated financial
statements and for reporting amounts of revenues and expenses during the period. Actual results could differ from those
estimates. Significant estimates and assumptions are used when accounting for following items:
(a) Property, plant and equipment
For fixed assets in a business combination, an external adviser is used to perform a fair valuation of the acquired fixed assets
(Plant, machinery, equipment and buildings). Further the external adviser is used to assist in determining their remaining
useful lives. Management believes that the assigned values and useful lives, as well as the underlying assumptions, are
reasonable, though different assumptions and assigned lives could have a significant impact on the reported amounts
Refer note 6.
(b) Biological assets
The fair value of the biological assets is the present value of the expected future cash flows taking into account estimated
market prices in available markets, estimated projected growth over the rotation period for the existing biological assets and
estimated cost of extraction including transportation costs. The discount rate used is the applicable pre-tax weighted average
cost of capital of the business unit. Determining the appropriate discount rate requires significant assumption and judgment
and changes in these assumptions could change the outcomes of the plantation valuations.
Changes in the assumptions or estimates used in these calculations may affect the results, in particular, valuation of biological
assets and as a result, the amount recorded in profit or loss arising from fair value changes and growth.
A key assumption and estimation is the projected growth estimation over a period of 5 to 7 years per rotation. The Company
involves experts to determine inputs to the plantation growth model since they are complex and involve estimations and
judgments. The expert establishes a long-term sample plot network which is representative of the species and sites on which
we grow trees and the measured data from these permanent sample plots are used as input into our growth estimation
Refer note 8a.
(c) Fair value of derivatives and available-for-sale financial asset
Derivative financial assets and liabilities are measured at their fair value. The fair value of interest rate swaps has been
determined based among other estimates on applicable or effective dates and day conventions, fixed rate coupon, floating
index, notional amount and reset frequency. The fair value of foreign exchange forward contracts has been determined based
among other estimates on value of swap and the mark-to-market value of option. Changes in any estimates could lead to
recognition of significant fair value changes
— F-31 — Page 27

in income statement.
The Group has used discounted cash flow analysis for available-for-sale financial asset that is not traded in active market
Refer note 11 & 12.
(d) Hedge accounting
Foreign exchange risk in highly probable sales in future periods are hedged using foreign currency borrowings designated as
cash flow hedges. Estimating highly probable sales volume involves gathering and evaluating sales estimates for future
periods as well as analyzing actual outcome on a regular basis in order to fulfill effectiveness testing requirements for hedge
accounting. Deviations in outcome of sales might result in that the requirements for hedge accounting are not fulfilled
Refer note 12.
(e) Income taxes
Management judgment is required for the calculation of provision for income taxes and deferred tax assets and liabilities. The
Group reviews at each balance sheet date the carrying amount of deferred tax assets. The Group considers whether it is
probable that the subsidiary will have sufficient taxable profits against which the unused tax losses or unused tax credits can
be utilized. The factors used in estimates may differ from actual outcome which could lead to significant adjustment to the
amounts reported in the consolidated financial statements. The company is eligible for certain tax and other benefits from the
regulatory authority under an incentive scheme subject to compliance of conditions stipulated in the scheme. Group has not
recognized any incentives under such scheme pending uncertainty of eligible amount and approval thereon Refer
note 22 & 31...
5. Segment information
Management has determined the operating segments based on the reports reviewed by the board that are used to make strategic
decisions.
The board considers the business from a production unit perspective which also aligns with the products and the geography of
the Group’s domestic markets. Accordingly, management considers the performance of its businesses as follows:
Š Coated paper manufactured in India — Bhigwan production unit
Š Uncoated paper manufactured in India — Ballarpur production unit
Š Uncoated paper manufactured in Malaysia — SFI production unit
Š Rayon grade pulp manufactured in India — Kamalapuram production unit
The reportable operating segments derive their revenue primarily from the manufacture and sale of paper and pulp. Certain of
the segments include ancillary income as follows:
Š The Bhigwan production unit sells surplus power purchased from its captive power production unit to the national grid
Š The Ballarpur production unit sells surplus pulp from its pulping facilities to the Ashti production unit, a production
unit owned by the Ballarpur Group and it sells surplus caustic soda that it produces to the market
Š The SFI production unit operates an integrated timber complex which produces plywood, sawn timber and veneer wood
products for external sale
The results of these activities are included in the relevant segment as this is how the segments are presented to the board. All
the production units, with the exception of Kamalapuram, sell their products in their domestic market and export
internationally. Kamalapuram only sells domestically within India.
— F-32 — Page 28

During the year ended June 30, 2009 the Kamalapuram production unit temporarily switched to producing paper grade pulp
and sold US$5,942 of such pulp intersegment and to external customers. These pulp sales are included in the Kamalapuram
segment as they were not separately identified in the reports provided to the board.
The board assesses the performance of the operating segments based on a measure of EBITDA. Interest income and
expenditure and derivative gains and losses are not allocated to segments, as this type of activity is driven by the central
treasury function, which manages the cash and risk positions of the Group.
The revenue from external parties reported to the board is measured in a manner consistent with that in the income statement.
The segment information provided to the board for the reportable segments for the years ended June 30, 2008, June 30,
2009, June 30, 2010 is as follows:
— F-33 — Page 29

YearendedJu
ne30,2008
YearendedJu
ne30,2009
Pap
erPap
er
India
Malaysia
Uncoated
Total
India
Pulp
Headoffice
/others
Total
India
Malaysia
Uncoated
Total
India
Pulp
Headoffice
/others
Total
Coated
Uncoated
Coated
Uncoated
Totalsegm
entrevenue
...........138,227
152,123
136,410
426,760
88,712
—515,472
144,085
128,710
107,338
380,133
29,951
—410,084
Inter-segm
entrevenue
............
—(1,084)
—(1,084)
——
(1,084)
—(674)
—(674)(1,252)
—(1,926)
Revenue
from
externalcustom
ers...138,227
151,039
136,410
425,676
88,712
—514,388
144,085
128,036
107,338
379,459
28,699
—408,158
Netrevenuefrom
external
custom
ers(1)
..................
127,142
137,643
136,410
401,195
88,712
—489,907
137,270
121,491
107,338
366,099
28,699
—394,798
EBITDA
......................
4,562
53,475
29,824
87,861
19,377
(6,105)
101,133
29,240
50,988
6,651
86,879
2,062
(5,711)
83,230
Depreciation
...................
(4,917)
(8,518)
(13,770)
(27,205)
(4,866)
—(32,071)
(7,111)
(7,089)
(13,745)
(27,945)
(3,790)
—(31,735)
Operatin
gprofit/(loss)...........
(355)
44,957
16,054
60,656
14,511
(6,105)
69,062
22,129
43,899
(7,094)
58,934
(1,728)
(5,711)
51,495
YearendedJu
ne30,2010
Pap
er
India
Malaysia
Uncoated
Total
India
Pulp
Headoffice
/others
Total
Coated
Uncoated
Totalsegm
entrevenue
..................................................................
235,371
170,122
134,987
540,480
73,100
—613,580
Inter-segm
entrevenue
..................................................................
—(408)
—(408)
(8)
—(416)
Revenue
from
externalcustom
ers.........................................................
235,371
169,714
134,987
540,072
73,092
—613,164
Netrevenuefrom
externalcustom
ers
......................................................
227,528
164,086
134,987
526,601
73,092
—599,693
EBITDA
.............................................................................
40,121
44,181
34,446
118,748
16,213
(248)
134,713
Depreciation..........................................................................
(10,968)
(11,602)
(12,834)
(35,404)
(3,980)
—(39,384)
Operatin
gprofit/(loss).................................................................
29,153
32,579
21,612
83,344
12,233
(248)
95,329
(1)
Net
reve
nuefrom
external
custom
ersrepresen
tsreve
nuene
tof
excise
duty
which
isap
plicab
leto
thepa
perop
erations
inIndia.
— F-34 — Page 30

A reconciliation of EBITDA to profit before tax is provided as follows:
Year ended June 30
2008 2009 2010
EBITDA for reportable segments . . . . . . . . . . . . . . . . . . . . . . . . . . . . . . . . . . . . . . . . . . . . . . . . . . . . . . . . . . . . 107,238 88,941 134,961Head office / others . . . . . . . . . . . . . . . . . . . . . . . . . . . . . . . . . . . . . . . . . . . . . . . . . . . . . . . . . . . . . . . . . . . . . . . (6,105) (5,711) (248)Total segments . . . . . . . . . . . . . . . . . . . . . . . . . . . . . . . . . . . . . . . . . . . . . . . . . . . . . . . . . . . . . . . . . . . . . . . . . . 101,133 83,230 134,713Depreciation . . . . . . . . . . . . . . . . . . . . . . . . . . . . . . . . . . . . . . . . . . . . . . . . . . . . . . . . . . . . . . . . . . . . . . . . . . . . . (32,071) (31,735) (39,384)Finance costs, net . . . . . . . . . . . . . . . . . . . . . . . . . . . . . . . . . . . . . . . . . . . . . . . . . . . . . . . . . . . . . . . . . . . . . . . . . (40,638) (83,872) (38,143)Other gains/(losses) . . . . . . . . . . . . . . . . . . . . . . . . . . . . . . . . . . . . . . . . . . . . . . . . . . . . . . . . . . . . . . . . . . . . . . . — 27,281 (10,379)
Profit/(loss) before tax . . . . . . . . . . . . . . . . . . . . . . . . . . . . . . . . . . . . . . . . . . . . . . . . . . . . . . . . . . . . . . . . . . . . 28,424 (5,096) 46,807
Head office / others relate to administration costs incurred by BGPPL Head office and Netherlands entities.
No amounts are provided to the board with respect to segmental assets and liabilities and accordingly no such financial
measures are presented here.
Breakdown of the revenue from external customers is as follows:
Year ended June 30
2008 2009 2010
Paper . . . . . . . . . . . . . . . . . . . . . . . . . . . . . . . . . . . . . . . . . . . . . . . . . . . . . . . . . . . . . . . . . . . . . . . . . . . . . . . . . . 394,232 355,102 515,549Rayon grade pulp . . . . . . . . . . . . . . . . . . . . . . . . . . . . . . . . . . . . . . . . . . . . . . . . . . . . . . . . . . . . . . . . . . . . . . . . 88,711 22,575 71,702Paper grade pulp . . . . . . . . . . . . . . . . . . . . . . . . . . . . . . . . . . . . . . . . . . . . . . . . . . . . . . . . . . . . . . . . . . . . . . . . . 10,487 16,327 10,354Timber . . . . . . . . . . . . . . . . . . . . . . . . . . . . . . . . . . . . . . . . . . . . . . . . . . . . . . . . . . . . . . . . . . . . . . . . . . . . . . . . . 12,209 10,033 11,803Caustic soda . . . . . . . . . . . . . . . . . . . . . . . . . . . . . . . . . . . . . . . . . . . . . . . . . . . . . . . . . . . . . . . . . . . . . . . . . . . . 2,249 2,093 1,622Power . . . . . . . . . . . . . . . . . . . . . . . . . . . . . . . . . . . . . . . . . . . . . . . . . . . . . . . . . . . . . . . . . . . . . . . . . . . . . . . . . 6,500 884 1,217Other . . . . . . . . . . . . . . . . . . . . . . . . . . . . . . . . . . . . . . . . . . . . . . . . . . . . . . . . . . . . . . . . . . . . . . . . . . . . . . . . . . — 1,144 917
514,388 408,158 613,164
The entity is domiciled in the Netherlands but its subsidiaries have operations in India and Malaysia. The Group has no
revenue from external customers in the Netherlands. Its revenue from external customers in India and Malaysia is shown
below.
Year ended June 30
2008 2009 2010
India — domestic . . . . . . . . . . . . . . . . . . . . . . . . . . . . . . . . . . . . . . . . . . . . . . . . . . . . . . . . . . . . . . . . . . . . . . . . 362,803 285,016 407,317India — exports . . . . . . . . . . . . . . . . . . . . . . . . . . . . . . . . . . . . . . . . . . . . . . . . . . . . . . . . . . . . . . . . . . . . . . . . . . 15,175 15,804 70,860Malaysia — domestic . . . . . . . . . . . . . . . . . . . . . . . . . . . . . . . . . . . . . . . . . . . . . . . . . . . . . . . . . . . . . . . . . . . . . 91,834 65,085 91,658Malaysia — exports . . . . . . . . . . . . . . . . . . . . . . . . . . . . . . . . . . . . . . . . . . . . . . . . . . . . . . . . . . . . . . . . . . . . . . 44,576 42,253 43,329
514,388 408,158 613,164
The breakdown of the major components of the total of revenue from external customers from other countries is disclosed
above. The revenues are distinguished based on trading currency.
— F-35 — Page 31

The total of non-current assets other than financial instruments and deferred tax assets (there are no employment benefit assets
and rights arising under insurance contracts) located in the Netherlands was nil for all periods. The total of these non-current
assets located in India and Malaysia is disclosed below.
June 30
2008 2009 2010
India . . . . . . . . . . . . . . . . . . . . . . . . . . . . . . . . . . . . . . . . . . . . . . . . . . . . . . . . . . . . . . . . . . . . . . . . . . . . . . . . . 556,100 673,949 698,139Malaysia . . . . . . . . . . . . . . . . . . . . . . . . . . . . . . . . . . . . . . . . . . . . . . . . . . . . . . . . . . . . . . . . . . . . . . . . . . . . . . 281,881 276,073 328,077
873,981 950,022 1,026,216
Revenues for the years ended June 30, 2008, June 30, 2009, and June 30, 2010, of respectively, US$78,900, US$20,382, and
US$70,601 were derived from a single external customer being the principal customer of the Kamalapuram production unit,
which produces rayon grade pulp.
6. Property, plant and equipment
Land andbuildings
Plant,machinery andequipment
Motorvehicles
Jetty andaccessroads Total
At July 1, 2007 . . . . . . . . . . . . . . . . . . . . . . . . . . . . . . . . . . . . . . . . . . . . . . 67,692 467,129 901 10,498 546,220Exchange differences . . . . . . . . . . . . . . . . . . . . . . . . . . . . . . . . . . . . . . . . . . (4,467) (2,423) (188) 653 (6,425)Additions . . . . . . . . . . . . . . . . . . . . . . . . . . . . . . . . . . . . . . . . . . . . . . . . . . . 139 7,260 436 1,741 9,576Disposals . . . . . . . . . . . . . . . . . . . . . . . . . . . . . . . . . . . . . . . . . . . . . . . . . . . — (57) (17) — (74)Depreciation charge . . . . . . . . . . . . . . . . . . . . . . . . . . . . . . . . . . . . . . . . . . . (3,300) (28,008) (187) (576) (32,071)
At June 30, 2008 . . . . . . . . . . . . . . . . . . . . . . . . . . . . . . . . . . . . . . . . . . . . . 60,064 443,901 945 12,316 517,226Exchange differences . . . . . . . . . . . . . . . . . . . . . . . . . . . . . . . . . . . . . . . . . . (6,243) (46,477) (108) (1,042) (53,870)Additions . . . . . . . . . . . . . . . . . . . . . . . . . . . . . . . . . . . . . . . . . . . . . . . . . . . 6,814 229,912 965 1,602 239,293Disposals . . . . . . . . . . . . . . . . . . . . . . . . . . . . . . . . . . . . . . . . . . . . . . . . . . . — (12) (6) — (18)Depreciation charge . . . . . . . . . . . . . . . . . . . . . . . . . . . . . . . . . . . . . . . . . . . (2,619) (27,499) (199) (1,418) (31,735)
At June 30, 2009 . . . . . . . . . . . . . . . . . . . . . . . . . . . . . . . . . . . . . . . . . . . . . 58,016 599,825 1,597 11,458 670,896Exchange differences . . . . . . . . . . . . . . . . . . . . . . . . . . . . . . . . . . . . . . . . . . 3,565 34,690 86 855 39,196Additions . . . . . . . . . . . . . . . . . . . . . . . . . . . . . . . . . . . . . . . . . . . . . . . . . . . 20,145 128,305 505 70 149,025Disposals . . . . . . . . . . . . . . . . . . . . . . . . . . . . . . . . . . . . . . . . . . . . . . . . . . . (97) (146) (235) — (478)Depreciation charge . . . . . . . . . . . . . . . . . . . . . . . . . . . . . . . . . . . . . . . . . . . (3,508) (34,057) (280) (1,539) (39,384)
At June 30, 2010 . . . . . . . . . . . . . . . . . . . . . . . . . . . . . . . . . . . . . . . . . . . . . 78,121 728,617 1,673 10,844 819,255Cost . . . . . . . . . . . . . . . . . . . . . . . . . . . . . . . . . . . . . . . . . . . . . . . . . . . . . . . 63,873 475,123 1,157 13,214 553,367Accumulated depreciation . . . . . . . . . . . . . . . . . . . . . . . . . . . . . . . . . . . . . . (3,809) (31,222) (212) (898) (36,141)
Net book amount at June 30, 2008 . . . . . . . . . . . . . . . . . . . . . . . . . . . . . . 60,064 443,901 945 12,316 517,226
Cost . . . . . . . . . . . . . . . . . . . . . . . . . . . . . . . . . . . . . . . . . . . . . . . . . . . . . . . 63,265 645,042 1,976 14,439 724,722Accumulated depreciation . . . . . . . . . . . . . . . . . . . . . . . . . . . . . . . . . . . . . . (5,249) (45,217) (379) (2,981) (53,826)
Net book amount at June 30, 2009 . . . . . . . . . . . . . . . . . . . . . . . . . . . . . . 58,016 599,825 1,597 11,458 670,896
Cost . . . . . . . . . . . . . . . . . . . . . . . . . . . . . . . . . . . . . . . . . . . . . . . . . . . . . . . 87,311 810,362 2,366 15,688 915,727Accumulated depreciation . . . . . . . . . . . . . . . . . . . . . . . . . . . . . . . . . . . . . . (9,190) (81,745) (693) (4,844) (96,472)
Net book amount at June 30, 2010 . . . . . . . . . . . . . . . . . . . . . . . . . . . . . . 78,121 728,617 1,673 10,844 819,255
— F-36 — Page 32

Land and buildings includes freehold land, buildings, employee housing and infrastructure. Refer to note 21 for assets charged
as security.
With effect from July 1, 2009 the Group changed its estimate of the useful economic life of recently installed paper machinery
from 18 years to 30 years. Prior to this, the Group has applied a useful economic life of 18 years consistently to all paper and
pulp machinery, regardless of the technology stage and time of installation. However, in connection with the recent investment
programme to install additional paper and pulp capacities in the Indian paper plants and SFI, the Group has re-assessed the
useful lives of its machinery and equipment during the year ended June 30, 2010. This assessment resulted in a split of the
useful life of paper and pulp plant, machinery and equipment into 30 years for recently added machinery and remains at 18
years for historically existing machinery. This change in estimate of useful life has reduced depreciation in the year ended
June 30, 2010 by US$ 5.4 million.
Property, plant and equipment include the following amounts where the Group is a lessee under a finance lease:
June 30
2008 2009 2010
Cost — capitalized finance leases . . . . . . . . . . . . . . . . . . . . . . . . . . . . . . . . . . . . . . . . . . . . . . . . . . . . . . . 411 446 619Accumulated depreciation and impairment . . . . . . . . . . . . . . . . . . . . . . . . . . . . . . . . . . . . . . . . . . . . . . . . (86) (180) (348)
Net book amount . . . . . . . . . . . . . . . . . . . . . . . . . . . . . . . . . . . . . . . . . . . . . . . . . . . . . . . . . . . . . . . . . . . 325 266 271
7. Capital work-in-progress
June 30
2008 2009 2010
Opening balance . . . . . . . . . . . . . . . . . . . . . . . . . . . . . . . . . . . . . . . . . . . . . . . . . . . . . . . . . . . . . . . . . . . . . . . . 69,912 214,873 126,404Exchange differences . . . . . . . . . . . . . . . . . . . . . . . . . . . . . . . . . . . . . . . . . . . . . . . . . . . . . . . . . . . . . . . . . . . . (9,081) (25,166) 6,904Additions . . . . . . . . . . . . . . . . . . . . . . . . . . . . . . . . . . . . . . . . . . . . . . . . . . . . . . . . . . . . . . . . . . . . . . . . . . . . . 157,868 167,329 64,796Transferred to property, plant and equipment . . . . . . . . . . . . . . . . . . . . . . . . . . . . . . . . . . . . . . . . . . . . . . . . . (3,826) (230,632) (145,901)
Closing balance . . . . . . . . . . . . . . . . . . . . . . . . . . . . . . . . . . . . . . . . . . . . . . . . . . . . . . . . . . . . . . . . . . . . . . . . 214,873 126,404 52,203
Capital work-in-progress comprised plant and machinery under construction for the expansion of production capacity of
various production units of the Group. The closing balance at June 30, 2008 was primarily in respect of new paper machines
being installed at Ballarpur and Bhigwan. The paper machine in Bhigwan was commissioned during the year ended June 30,
2009 and the respective cost was transferred to property, plant and equipment. The closing balance as at June 30, 2009 is
primarily in respect of the new paper machine at Ballarpur which was commissioned in the year ended June 30, 2010. The
additions and closing balances as at June 30, 2010 are primarily in respect of the pulp mill upgrade at SFI.
Refer to note 21 for assets charged as security.
8a. Biological assets
The Group — through its subsidiary SFI — manages about 288,623 hectares of forest land in Sabah, Malaysia, under two
licenses for natural forest management and industrial tree plantation granted by the Malaysian government. The licenses were
issued in 1996 with a duration period of 99 years.
Of the total available forest land, approximately 110,579 hectares are currently used by the Group as productive forest land for
plantation and natural forest management.
— F-37 — Page 33

June 30
2008 2009 2010
Opening balance . . . . . . . . . . . . . . . . . . . . . . . . . . . . . . . . . . . . . . . . . . . . . . . . . . . . . . . . . . . . . . . . . . . . . . . . . . . 70,703 79,827 76,700Capitalized expenditure . . . . . . . . . . . . . . . . . . . . . . . . . . . . . . . . . . . . . . . . . . . . . . . . . . . . . . . . . . . . . . . . . . . . . 3,182 5,241 6,065Gain arising from change in fair value . . . . . . . . . . . . . . . . . . . . . . . . . . . . . . . . . . . . . . . . . . . . . . . . . . . . . . . . . . 13,448 10,955 4,900Decreases due to transfer to inventory . . . . . . . . . . . . . . . . . . . . . . . . . . . . . . . . . . . . . . . . . . . . . . . . . . . . . . . . . . (13,532) (12,965) (6,436)Exchange differences . . . . . . . . . . . . . . . . . . . . . . . . . . . . . . . . . . . . . . . . . . . . . . . . . . . . . . . . . . . . . . . . . . . . . . . 6,026 (6,358) 6,993
Closing balance . . . . . . . . . . . . . . . . . . . . . . . . . . . . . . . . . . . . . . . . . . . . . . . . . . . . . . . . . . . . . . . . . . . . . . . . . . . 79,827 76,700 88,222
The discount rates used in determining the fair value for the Malaysia forests was 10.5% at each balance sheet date. The table
below summarizes the impact of a 1% increase/decrease in discount rate on the fair value of biological assets.
June 30
2008 2009 2010
1% increase in discount rate . . . . . . . . . . . . . . . . . . . . . . . . . . . . . . . . . . . . . . . . . . . . . . . . . . . . . . . . . . . . . . . . . . . . 2,062 1,933 2,8391% decrease in discount rate . . . . . . . . . . . . . . . . . . . . . . . . . . . . . . . . . . . . . . . . . . . . . . . . . . . . . . . . . . . . . . . . . . . . (2,150) (2,009) (2,988)
Refer to note 21 for assets charged as security.
8b. Land use rights
276,600 hectares of the total managed forest land (288,600 hectares) are leased from the Malaysian government under various
lease arrangements with terms between 61 and 99 years. The lease arrangements expire at the end of the year 2094. The land
premium is prepaid and amortized over the respective lease periods.
June 30
2008 2009 2010
Opening balance . . . . . . . . . . . . . . . . . . . . . . . . . . . . . . . . . . . . . . . . . . . . . . . . . . . . . . . . . . . . . . . . . . . . . . . . . . . . 12,143 11,610 11,783Additions . . . . . . . . . . . . . . . . . . . . . . . . . . . . . . . . . . . . . . . . . . . . . . . . . . . . . . . . . . . . . . . . . . . . . . . . . . . . . . . . . . — 570 —Amortization of land premium . . . . . . . . . . . . . . . . . . . . . . . . . . . . . . . . . . . . . . . . . . . . . . . . . . . . . . . . . . . . . . . . . (210) (200) (208)Exchange differences . . . . . . . . . . . . . . . . . . . . . . . . . . . . . . . . . . . . . . . . . . . . . . . . . . . . . . . . . . . . . . . . . . . . . . . . (323) (197) 792
Closing balance . . . . . . . . . . . . . . . . . . . . . . . . . . . . . . . . . . . . . . . . . . . . . . . . . . . . . . . . . . . . . . . . . . . . . . . . . . . . 11,610 11,783 12,367
June 30
2008 2009 2010
Cost . . . . . . . . . . . . . . . . . . . . . . . . . . . . . . . . . . . . . . . . . . . . . . . . . . . . . . . . . . . . . . . . . . . . . . . . . . . . . . . . . . . . . . 11,820 12,192 12,984Accumulated amortization . . . . . . . . . . . . . . . . . . . . . . . . . . . . . . . . . . . . . . . . . . . . . . . . . . . . . . . . . . . . . . . . . . . . (210) (409) (617)
Net book amount . . . . . . . . . . . . . . . . . . . . . . . . . . . . . . . . . . . . . . . . . . . . . . . . . . . . . . . . . . . . . . . . . . . . . . . . . . . 11,610 11,783 12,367
— F-38 — Page 34

9. Financial instruments by category
Assets as per balance sheetLoans andreceivables
Assets at fairvalue throughprofit or loss
Available-for-sale
financial asset Total
Restricted deposits . . . . . . . . . . . . . . . . . . . . . . . . . . . . . . . . . . . . . . . . . . . . . . . . 4,688 — — 4,688Trade and other receivables* . . . . . . . . . . . . . . . . . . . . . . . . . . . . . . . . . . . . . . . . 40,047 — — 40,047Cash and cash equivalents . . . . . . . . . . . . . . . . . . . . . . . . . . . . . . . . . . . . . . . . . . . 23,569 — — 23,569
Total as at June 30, 2008 . . . . . . . . . . . . . . . . . . . . . . . . . . . . . . . . . . . . . . . . . . . 68,304 — — 68,304
Available-for-sale financial asset . . . . . . . . . . . . . . . . . . . . . . . . . . . . . . . . . . . . . — — 22,006 22,006Restricted deposits . . . . . . . . . . . . . . . . . . . . . . . . . . . . . . . . . . . . . . . . . . . . . . . . 4,435 — — 4,435Derivative financial instruments . . . . . . . . . . . . . . . . . . . . . . . . . . . . . . . . . . . . . . — 27,281 — 27,281Trade and other receivables* . . . . . . . . . . . . . . . . . . . . . . . . . . . . . . . . . . . . . . . . 28,377 — — 28,377Cash and cash equivalents . . . . . . . . . . . . . . . . . . . . . . . . . . . . . . . . . . . . . . . . . . . 14,565 — — 14,565
Total as at June 30, 2009 . . . . . . . . . . . . . . . . . . . . . . . . . . . . . . . . . . . . . . . . . . . 47,377 27,281 22,006 96,664
Available-for-sale financial asset . . . . . . . . . . . . . . . . . . . . . . . . . . . . . . . . . . . . . — — 22,099 22,099Restricted deposits . . . . . . . . . . . . . . . . . . . . . . . . . . . . . . . . . . . . . . . . . . . . . . . . 5,918 — — 5,918Derivative financial instruments . . . . . . . . . . . . . . . . . . . . . . . . . . . . . . . . . . . . . . — 13,212 — 13,212Trade and other receivables* . . . . . . . . . . . . . . . . . . . . . . . . . . . . . . . . . . . . . . . . 53,628 — — 53,628Cash and cash equivalents . . . . . . . . . . . . . . . . . . . . . . . . . . . . . . . . . . . . . . . . . . . 29,112 — — 29,112
Total as at June 30, 2010 . . . . . . . . . . . . . . . . . . . . . . . . . . . . . . . . . . . . . . . . . . . 88,658 13,212 22,099 123,969
* Prepayments, statutory dues recoverable and advances to suppliers are not in nature of financial instruments, hence not been considered.
Liabilities as per balance sheet
Financial liabilitiesat fair value
through profit orloss
Other financialliabilities at
amortized Cost Total
Borrowings (excluding finance lease liabilities) . . . . . . . . . . . . . . . . . . . . . . . . . . . . . . . . — 481,029 481,029Finance lease liabilities . . . . . . . . . . . . . . . . . . . . . . . . . . . . . . . . . . . . . . . . . . . . . . . . . . . . — 340 340Trade and other payables (excluding statutory liabilities) . . . . . . . . . . . . . . . . . . . . . . . . . — 120,738 120,738
Total as at June 30, 2008 . . . . . . . . . . . . . . . . . . . . . . . . . . . . . . . . . . . . . . . . . . . . . . . . . — 602,107 602,107
Borrowings (excluding finance lease liabilities) . . . . . . . . . . . . . . . . . . . . . . . . . . . . . . . . — 601,723 601,723Finance lease liabilities . . . . . . . . . . . . . . . . . . . . . . . . . . . . . . . . . . . . . . . . . . . . . . . . . . . . — 312 312Trade and other payables (excluding statutory liabilities) . . . . . . . . . . . . . . . . . . . . . . . . . — 106,137 106,137Derivative financial instruments . . . . . . . . . . . . . . . . . . . . . . . . . . . . . . . . . . . . . . . . . . . . . 14,762 — 14,762
Total as at June 30, 2009 . . . . . . . . . . . . . . . . . . . . . . . . . . . . . . . . . . . . . . . . . . . . . . . . . 14,762 708,172 722,934
Borrowings (excluding finance lease liabilities) . . . . . . . . . . . . . . . . . . . . . . . . . . . . . . . . — 532,459 532,459Finance lease liabilities . . . . . . . . . . . . . . . . . . . . . . . . . . . . . . . . . . . . . . . . . . . . . . . . . . . . — 377 377Trade and other payables (excluding statutory liabilities) . . . . . . . . . . . . . . . . . . . . . . . . . — 178,924 178,924Derivative financial instruments . . . . . . . . . . . . . . . . . . . . . . . . . . . . . . . . . . . . . . . . . . . . . 19,154 — 19,154
Total as at June 30, 2010 . . . . . . . . . . . . . . . . . . . . . . . . . . . . . . . . . . . . . . . . . . . . . . . . . 19,154 711,760 730,194
— F-39 — Page 35

10. credit quality of financial assets
The credit quality of financial assets that are neither past due nor impaired can be assessed by reference to external credit
ratings (if available) or to historical information about counterparty default rates:
June 30
2008 2009 2010
Trade receivablesCustomers with no default in the past . . . . . . . . . . . . . . . . . . . . . . . . . . . . . . . . . . . . . . . . . . . . . . . . . . . . . . . . . . . . 29,346 23,589 50,575
Total . . . . . . . . . . . . . . . . . . . . . . . . . . . . . . . . . . . . . . . . . . . . . . . . . . . . . . . . . . . . . . . . . . . . . . . . . . . . . . . . . . . . . 29,346 23,589 50,575
Cash at bank and short-term depositsAAA . . . . . . . . . . . . . . . . . . . . . . . . . . . . . . . . . . . . . . . . . . . . . . . . . . . . . . . . . . . . . . . . . . . . . . . . . . . . . . . . . . . . . — 15 12,524AA and AA+ . . . . . . . . . . . . . . . . . . . . . . . . . . . . . . . . . . . . . . . . . . . . . . . . . . . . . . . . . . . . . . . . . . . . . . . . . . . . . . . 6,488 141 2,010A . . . . . . . . . . . . . . . . . . . . . . . . . . . . . . . . . . . . . . . . . . . . . . . . . . . . . . . . . . . . . . . . . . . . . . . . . . . . . . . . . . . . . . . . 15.945 13,287 —P1 and P1+ . . . . . . . . . . . . . . . . . . . . . . . . . . . . . . . . . . . . . . . . . . . . . . . . . . . . . . . . . . . . . . . . . . . . . . . . . . . . . . . . — — 8,357P3 . . . . . . . . . . . . . . . . . . . . . . . . . . . . . . . . . . . . . . . . . . . . . . . . . . . . . . . . . . . . . . . . . . . . . . . . . . . . . . . . . . . . . . . — — 6,164Ba . . . . . . . . . . . . . . . . . . . . . . . . . . . . . . . . . . . . . . . . . . . . . . . . . . . . . . . . . . . . . . . . . . . . . . . . . . . . . . . . . . . . . . . 723 — —Rating not available . . . . . . . . . . . . . . . . . . . . . . . . . . . . . . . . . . . . . . . . . . . . . . . . . . . . . . . . . . . . . . . . . . . . . . . . . 339 1,076 —
Total . . . . . . . . . . . . . . . . . . . . . . . . . . . . . . . . . . . . . . . . . . . . . . . . . . . . . . . . . . . . . . . . . . . . . . . . . . . . . . . . . . . . . 23,495 14,519 29,055
The above table excludes cash at hand. Refer to note 16.
June 30
2008 2009 2010
Deposits forming part of restricted depositsAAA . . . . . . . . . . . . . . . . . . . . . . . . . . . . . . . . . . . . . . . . . . . . . . . . . . . . . . . . . . . . . . . . . . . . . . . . . . . . . . . . . . . . . . — 123 76AA and AA+ . . . . . . . . . . . . . . . . . . . . . . . . . . . . . . . . . . . . . . . . . . . . . . . . . . . . . . . . . . . . . . . . . . . . . . . . . . . . . . . . — 73 255A . . . . . . . . . . . . . . . . . . . . . . . . . . . . . . . . . . . . . . . . . . . . . . . . . . . . . . . . . . . . . . . . . . . . . . . . . . . . . . . . . . . . . . . . . 4,605 — —P1 and P1+ . . . . . . . . . . . . . . . . . . . . . . . . . . . . . . . . . . . . . . . . . . . . . . . . . . . . . . . . . . . . . . . . . . . . . . . . . . . . . . . . . — 4,239 5,587Ba . . . . . . . . . . . . . . . . . . . . . . . . . . . . . . . . . . . . . . . . . . . . . . . . . . . . . . . . . . . . . . . . . . . . . . . . . . . . . . . . . . . . . . . . 83 — —
Total . . . . . . . . . . . . . . . . . . . . . . . . . . . . . . . . . . . . . . . . . . . . . . . . . . . . . . . . . . . . . . . . . . . . . . . . . . . . . . . . . . . . . . 4,688 4,435 5,918
Derivative financial assetsAA+ . . . . . . . . . . . . . . . . . . . . . . . . . . . . . . . . . . . . . . . . . . . . . . . . . . . . . . . . . . . . . . . . . . . . . . . . . . . . . . . . . . . . . . . — 27,281 13,212
Total . . . . . . . . . . . . . . . . . . . . . . . . . . . . . . . . . . . . . . . . . . . . . . . . . . . . . . . . . . . . . . . . . . . . . . . . . . . . . . . . . . . . . . — 27,281 13,212
30 June
2008 2009 2010
Loans to related partiesRelated parties with no defaults in the past . . . . . . . . . . . . . . . . . . . . . . . . . . . . . . . . . . . . . . . . . . . . . . . . . . . . . . . . . . . 8,052 1,567 1,605
Total 8,052 1,567 1,605
11. Available-for-sale financial asset
June 30
2008 2009 2010
Opening balance . . . . . . . . . . . . . . . . . . . . . . . . . . . . . . . . . . . . . . . . . . . . . . . . . . . . . . . . . . . . . . . . . . . . . . . . . . . . . . — — 22,006Exchange differences . . . . . . . . . . . . . . . . . . . . . . . . . . . . . . . . . . . . . . . . . . . . . . . . . . . . . . . . . . . . . . . . . . . . . . . . . . — 173 990Additions . . . . . . . . . . . . . . . . . . . . . . . . . . . . . . . . . . . . . . . . . . . . . . . . . . . . . . . . . . . . . . . . . . . . . . . . . . . . . . . . . . . — 3,920 2,831Net gains transfer to other comprehensive income (note 19) . . . . . . . . . . . . . . . . . . . . . . . . . . . . . . . . . . . . . . . . . . . — 17,913 (3,728)
— 22,006 22,099
During the year ended June 30, 2009 the Company purchased from Ballarpur, at a cost of US$3,920, 18.2 million shares in
Avantha Power and Infrastructure Limited (“APIL”). Further, during the year ended June 30,
— F-40 — Page 36

2010, the Company purchased from Ballarpur, at a cost of US$2,831, additional 12.01 million shares in APIL. The Group’s
total percentage holding in APIL at June 30, 2010 was 4.22%. The purchase price for both transactions was based on the book
value of the net assets.
The fair value of the shares as at June 30, 2009 was determined by the Group on the basis of expected future cash flows
discounted at a rate of 14.36% for captive power plants, and 19%- 20% respectively for the Korba and Jhabua power plants. In
contrast, the basis for the valuation as at June 30, 2010 is a comparable market transaction occurred in September 2010.
12. Derivative financial instruments and hedging activities
Derivative financial instruments
June 30
2008 2009 2010
Assets (Non-current)Forward foreign exchange contract . . . . . . . . . . . . . . . . . . . . . . . . . . . . . . . . . . . . . . . . . . . . . . . . . . . . . . . . . . . . . . — 12,208 13,212Assets (Current)Forward foreign exchange contract . . . . . . . . . . . . . . . . . . . . . . . . . . . . . . . . . . . . . . . . . . . . . . . . . . . . . . . . . . . . . . — 15,073 —Liabilities (Non-current)
Interest rate swaps . . . . . . . . . . . . . . . . . . . . . . . . . . . . . . . . . . . . . . . . . . . . . . . . . . . . . . . . . . . . . . . . . . . . . . . . . . . — (14,762) (19,154)
Derivative financial instruments are classified as a non-current asset or liability if the remaining maturity of the hedged item is
more than 12 months and as a current asset or liability if the maturity of the hedged item is less than 12 months.
The derivative financial assets and liabilities are denominated in US dollar. The maximum exposure to credit risk at the
balance sheet date is the fair value of the derivative assets at each balance sheet date.
Forward foreign exchange option/contract
In December 2008, the Group has entered into a derivative contract in nature of swap with option protection for USD200,000
whereby there is an outright swap together with long and short calls at different strikes on amortizing notionals over the
period to 2015.
The profit or loss arising from the forward foreign exchange forward and option contract has been recognized in the income
statement in other gains and losses and was a profit of US$27,281 and losses of US$10,379, for, respectively, the years ended
June 30, 2009 and 2010.
Interest rate swaps
In the year ended June 30, 2009, the Group entered into three interest rate swap contracts for a total notional principal amount
of US$310,000. Under these arrangements, the Group receives a floating LIBOR based interest rate and pays fix or floating
rates, depending on the LIBOR rate falling in one of the four pre-determined band rates. The interest rate swap arrangements
are designed to protect the Group from increase in LIBOR rates by providing a cap of 6.0%.
The profit or loss arising from the interest rate swap contracts has been recognized in the income statement in finance income
or costs and was losses of US$17,629 and US$13,694 for, respectively, the years ended June 30, 2009 and 2010.
Hedging activities
During the year ended June 30, 2009, a proportion of the Group’s US$ denominated loan from Citi (refer to note 21)
amounting to US$253,657 was designated as a cash flow hedge against highly probable forecast export sales of the Indian
paper operations also denominated in US$. These forecast sales were expected to occur from January 1, 2011 to June 30, 2015.
During the year ended June 30, 2009, a foreign exchange loss
— F-41 — Page 37

of US$30,220 was recognized in other reserves, in other comprehensive income.
During the year ended June 30, 2010, the entire Citi loan was repaid early (refer to note 21) and as a result the hedging
arrangement was terminated. The foreign exchange loss in other comprehensive income will be released to the income
statement in the years ending June 30, 2011 to June 30, 2015 based on the original forecast sales anticipated. The release of
the foreign exchange loss will result in a charge of US$4,060, US$7,680, US$7,200, US$6,320 and US$4,960 for,
respectively, the years ending June 30, 2011, June 30, 2012, June 30, 2013, June 30, 2014 and June 30, 2015.
13. Trade and other receivables
June 30
2008 2009 2010
Trade receivables . . . . . . . . . . . . . . . . . . . . . . . . . . . . . . . . . . . . . . . . . . . . . . . . . . . . . . . . . . . . . . . . . . . . . . . . . 29,351 23,594 50,622Less: Provision for impairment of trade receivables . . . . . . . . . . . . . . . . . . . . . . . . . . . . . . . . . . . . . . . . . . . . . . (5) (5) (47)
Trade receivables — net . . . . . . . . . . . . . . . . . . . . . . . . . . . . . . . . . . . . . . . . . . . . . . . . . . . . . . . . . . . . . . . . . . . . 29,346 23,589 50,575Prepayments . . . . . . . . . . . . . . . . . . . . . . . . . . . . . . . . . . . . . . . . . . . . . . . . . . . . . . . . . . . . . . . . . . . . . . . . . . . . . 1,643 845 5,159Statutory dues recoverable . . . . . . . . . . . . . . . . . . . . . . . . . . . . . . . . . . . . . . . . . . . . . . . . . . . . . . . . . . . . . . . . . . 25,747 50,192 59,292Deposits . . . . . . . . . . . . . . . . . . . . . . . . . . . . . . . . . . . . . . . . . . . . . . . . . . . . . . . . . . . . . . . . . . . . . . . . . . . . . . . . 1,353 1,185 971Refundable royalty . . . . . . . . . . . . . . . . . . . . . . . . . . . . . . . . . . . . . . . . . . . . . . . . . . . . . . . . . . . . . . . . . . . . . . . . 1,028 1,049 1,252Amounts due from related parties (refer to note 38) . . . . . . . . . . . . . . . . . . . . . . . . . . . . . . . . . . . . . . . . . . . . . . 8,052 1,567 1,605Advances to suppliers (other than fixed assets) . . . . . . . . . . . . . . . . . . . . . . . . . . . . . . . . . . . . . . . . . . . . . . . . . . 8,774 2,093 4,127Other receivables . . . . . . . . . . . . . . . . . . . . . . . . . . . . . . . . . . . . . . . . . . . . . . . . . . . . . . . . . . . . . . . . . . . . . . . . . 1,297 3,421 2,086
77,240 83,941 125,067Less: Non-current portionStatutory dues recoverable . . . . . . . . . . . . . . . . . . . . . . . . . . . . . . . . . . . . . . . . . . . . . . . . . . . . . . . . . . . . . . . . . . (14,072) (39,503) (31,735)Deposits . . . . . . . . . . . . . . . . . . . . . . . . . . . . . . . . . . . . . . . . . . . . . . . . . . . . . . . . . . . . . . . . . . . . . . . . . . . . . . . . (371) — (336)Non-current portion . . . . . . . . . . . . . . . . . . . . . . . . . . . . . . . . . . . . . . . . . . . . . . . . . . . . . . . . . . . . . . . . . . . . . . . (14,443) (39,503) (32,071)
Current portion 62,797 44,438 92,996
The fair values of financial trade and other receivables approximate their respective carrying values.
Statutory dues recoverable primarily comprise Central value added tax (“Cenvat”) credits available in India for import duty
paid on purchases of property, plant and equipment and input materials that can be offset against excise duty due for
qualifying domestic paper sales produced on this equipment and with these input materials.
As at June 30, 2008, June 30, 2009 and June 30, 2010 trade receivables of US$24,275, US$15,864, and US$38,418 were,
respectively, fully performing.
As at June 30, 2008, June 30, 2009 and June 30, 2010 trade receivables of US$5,071, US$7,725 and US$12,157 were,
respectively, past due but not impaired. These relate to external customers for whom there is no history of default. The ageing
analysis of these trade receivables is as follows:
June 30
2008 2009 2010
Up to 6 months . . . . . . . . . . . . . . . . . . . . . . . . . . . . . . . . . . . . . . . . . . . . . . . . . . . . . . . . . . . . . . . . . . . . . . . . . . . . . . . 4,045 7,199 11,7466 months to a year . . . . . . . . . . . . . . . . . . . . . . . . . . . . . . . . . . . . . . . . . . . . . . . . . . . . . . . . . . . . . . . . . . . . . . . . . . . . . 640 485 3261 year to 2 years . . . . . . . . . . . . . . . . . . . . . . . . . . . . . . . . . . . . . . . . . . . . . . . . . . . . . . . . . . . . . . . . . . . . . . . . . . . . . . 386 41 85
Total . . . . . . . . . . . . . . . . . . . . . . . . . . . . . . . . . . . . . . . . . . . . . . . . . . . . . . . . . . . . . . . . . . . . . . . . . . . . . . . . . . . . . . . 5,071 7,725 12,157
— F-42 — Page 38

The carrying amounts of the Group’s trade and other receivables are denominated in the following currencies:
June 30
2008 2009 2010
INR . . . . . . . . . . . . . . . . . . . . . . . . . . . . . . . . . . . . . . . . . . . . . . . . . . . . . . . . . . . . . . . . . . . . . . . . . . . . . . . . . . . . . 49,725 61,804 76,307RM . . . . . . . . . . . . . . . . . . . . . . . . . . . . . . . . . . . . . . . . . . . . . . . . . . . . . . . . . . . . . . . . . . . . . . . . . . . . . . . . . . . . . 12,657 8,767 11,018US$ . . . . . . . . . . . . . . . . . . . . . . . . . . . . . . . . . . . . . . . . . . . . . . . . . . . . . . . . . . . . . . . . . . . . . . . . . . . . . . . . . . . . . 14,114 10,916 33,919Euro . . . . . . . . . . . . . . . . . . . . . . . . . . . . . . . . . . . . . . . . . . . . . . . . . . . . . . . . . . . . . . . . . . . . . . . . . . . . . . . . . . . . . — 1,016 700GBP . . . . . . . . . . . . . . . . . . . . . . . . . . . . . . . . . . . . . . . . . . . . . . . . . . . . . . . . . . . . . . . . . . . . . . . . . . . . . . . . . . . . . — 132 28Other . . . . . . . . . . . . . . . . . . . . . . . . . . . . . . . . . . . . . . . . . . . . . . . . . . . . . . . . . . . . . . . . . . . . . . . . . . . . . . . . . . . . 744 1,306 3,095
Total . . . . . . . . . . . . . . . . . . . . . . . . . . . . . . . . . . . . . . . . . . . . . . . . . . . . . . . . . . . . . . . . . . . . . . . . . . . . . . . . . . . . 77,240 83,941 125,067
Movements on the Group provision for impairment of trade receivables are as follows:
June 30
2008 2009 2010
Opening balance . . . . . . . . . . . . . . . . . . . . . . . . . . . . . . . . . . . . . . . . . . . . . . . . . . . . . . . . . . . . . . . . . . . . . 5 5 5Bad debt provision . . . . . . . . . . . . . . . . . . . . . . . . . . . . . . . . . . . . . . . . . . . . . . . . . . . . . . . . . . . . . . . . . . . — — 41Release (write off) . . . . . . . . . . . . . . . . . . . . . . . . . . . . . . . . . . . . . . . . . . . . . . . . . . . . . . . . . . . . . . . . . . . — — —Exchange difference . . . . . . . . . . . . . . . . . . . . . . . . . . . . . . . . . . . . . . . . . . . . . . . . . . . . . . . . . . . . . . . . . . — — 1
Closing balance . . . . . . . . . . . . . . . . . . . . . . . . . . . . . . . . . . . . . . . . . . . . . . . . . . . . . . . . . . . . . . . . . . . . . 5 5 47
The creation of provision for impaired receivables has been included in ‘Other operating expenses’ in the income statement.
Amounts charged to the allowance account are generally written off when there is no expectation of recovering additional
cash.
The charges to profit and loss from bad debt provisions and write off of receivables are as follows:
Year ended June 30
2008 2009 2010
Bad debt provision charge / (release) . . . . . . . . . . . . . . . . . . . . . . . . . . . . . . . . . . . . . . . . . . . . . . . . . . . . . . . . . . . — — 41Write off . . . . . . . . . . . . . . . . . . . . . . . . . . . . . . . . . . . . . . . . . . . . . . . . . . . . . . . . . . . . . . . . . . . . . . . . . . . . . . . . . — 121 —
Net charge to profit and loss . . . . . . . . . . . . . . . . . . . . . . . . . . . . . . . . . . . . . . . . . . . . . . . . . . . . . . . . . . . . . . . . — 121 41
The other classes within trade and other receivables do not contain impaired assets.
The maximum exposure to credit risk at the reporting date is the carrying value of each class of receivable mentioned above.
The Group holds security deposits as security against certain receivables. The security deposits have been disclosed under
trade and other payables.
14. Inventories
June 30
2008 2009 2010
Raw materials . . . . . . . . . . . . . . . . . . . . . . . . . . . . . . . . . . . . . . . . . . . . . . . . . . . . . . . . . . . . . . . . . . . . . . . . . . . . . . 44,390 26,538 62,586Stores and spares . . . . . . . . . . . . . . . . . . . . . . . . . . . . . . . . . . . . . . . . . . . . . . . . . . . . . . . . . . . . . . . . . . . . . . . . . . . . 32,800 30,371 45,155Work in progress . . . . . . . . . . . . . . . . . . . . . . . . . . . . . . . . . . . . . . . . . . . . . . . . . . . . . . . . . . . . . . . . . . . . . . . . . . . . 3,647 11,197 12,406
— F-43 — Page 39

Finished goods . . . . . . . . . . . . . . . . . . . . . . . . . . . . . . . . . . . . . . . . . . . . . . . . . . . . . . . . . . . . . . . . . . . . . . . . . . . . 4,500 5,034 7,102Less: Provision for inventory . . . . . . . . . . . . . . . . . . . . . . . . . . . . . . . . . . . . . . . . . . . . . . . . . . . . . . . . . . . . . . . . . — (231) —
85,337 72,909 127,249
The charges to profit and loss from inventory provisions and write off are as follows:
Year ended June 30
2008 2009 2010
Inventory provision charge / (release) . . . . . . . . . . . . . . . . . . . . . . . . . . . . . . . . . . . . . . . . . . . . . . . . . . . . . . . . . . . — 231 (231)Inventory write off . . . . . . . . . . . . . . . . . . . . . . . . . . . . . . . . . . . . . . . . . . . . . . . . . . . . . . . . . . . . . . . . . . . . . . . . . . — — 353Exchange rate impact . . . . . . . . . . . . . . . . . . . . . . . . . . . . . . . . . . . . . . . . . . . . . . . . . . . . . . . . . . . . . . . . . . . . . . . . — 2 (11)
Net charge to profit and loss . . . . . . . . . . . . . . . . . . . . . . . . . . . . . . . . . . . . . . . . . . . . . . . . . . . . . . . . . . . . . . . . . — 233 111
15. Restricted deposits
June 30
2008 2009 2010
Fixed deposits maturing within 12 months . . . . . . . . . . . . . . . . . . . . . . . . . . . . . . . . . . . . . . . . . . . . . . . . . . . . . . . . . . . 4,686 4,433 5,918Fixed deposits maturing beyond 12 months . . . . . . . . . . . . . . . . . . . . . . . . . . . . . . . . . . . . . . . . . . . . . . . . . . . . . . . . . . 2 2 —
4,688 4,435 5,918
Fixed deposits shown above are kept as security by financial institutions against bank overdrafts and bank guarantees.
The carrying amounts of the Group’s restricted deposits are denominated in the following currencies:
June 30
2008 2009 2010
INR . . . . . . . . . . . . . . . . . . . . . . . . . . . . . . . . . . . . . . . . . . . . . . . . . . . . . . . . . . . . . . . . . . . . . . . . . . . . . . . . . . . . . . . . . — 198 77US$ . . . . . . . . . . . . . . . . . . . . . . . . . . . . . . . . . . . . . . . . . . . . . . . . . . . . . . . . . . . . . . . . . . . . . . . . . . . . . . . . . . . . . . . . . — — 255RM . . . . . . . . . . . . . . . . . . . . . . . . . . . . . . . . . . . . . . . . . . . . . . . . . . . . . . . . . . . . . . . . . . . . . . . . . . . . . . . . . . . . . . . . . 4,688 4,237 5,586
Total . . . . . . . . . . . . . . . . . . . . . . . . . . . . . . . . . . . . . . . . . . . . . . . . . . . . . . . . . . . . . . . . . . . . . . . . . . . . . . . . . . . . . . . . 4,688 4,435 5,918
16. Cash and cash equivalents
June 30
2008 2009 2010
Cash in hand . . . . . . . . . . . . . . . . . . . . . . . . . . . . . . . . . . . . . . . . . . . . . . . . . . . . . . . . . . . . . . . . . . . . . . . . . . . . . . . 74 46 57Bank balances . . . . . . . . . . . . . . . . . . . . . . . . . . . . . . . . . . . . . . . . . . . . . . . . . . . . . . . . . . . . . . . . . . . . . . . . . . . . . . 8,459 9,705 7,679Short-term deposits with banks . . . . . . . . . . . . . . . . . . . . . . . . . . . . . . . . . . . . . . . . . . . . . . . . . . . . . . . . . . . . . . . . . 15,036 4,814 21,376
23,569 14,565 29,112
Deposits of the Group have an average effective interest rate of 2.8% per annum, 1.3% per annum and 2.8% per annum,
respectively, as at June 30, 2008, June 30, 2009 and June 30, 2010.
— F-44 — Page 40

The carrying amounts of the Group’s cash and cash equivalents are denominated in the following currencies:June 30
2008 2009 2010
INR . . . . . . . . . . . . . . . . . . . . . . . . . . . . . . . . . . . . . . . . . . . . . . . . . . . . . . . . . . . . . . . . . . . . . . . . . . . . . . . . . . . . . . 1,112 7,234 8,959US$ . . . . . . . . . . . . . . . . . . . . . . . . . . . . . . . . . . . . . . . . . . . . . . . . . . . . . . . . . . . . . . . . . . . . . . . . . . . . . . . . . . . . . . 7,151 4,792 9,795Euro . . . . . . . . . . . . . . . . . . . . . . . . . . . . . . . . . . . . . . . . . . . . . . . . . . . . . . . . . . . . . . . . . . . . . . . . . . . . . . . . . . . . . . — 9 19RM . . . . . . . . . . . . . . . . . . . . . . . . . . . . . . . . . . . . . . . . . . . . . . . . . . . . . . . . . . . . . . . . . . . . . . . . . . . . . . . . . . . . . . 15,288 2,507 10,322SGD . . . . . . . . . . . . . . . . . . . . . . . . . . . . . . . . . . . . . . . . . . . . . . . . . . . . . . . . . . . . . . . . . . . . . . . . . . . . . . . . . . . . . 18 23 17
Total . . . . . . . . . . . . . . . . . . . . . . . . . . . . . . . . . . . . . . . . . . . . . . . . . . . . . . . . . . . . . . . . . . . . . . . . . . . . . . . . . . . . . 23,569 14,565 29,112
Cash, cash equivalents and bank overdrafts include the following for the purposes of the Statements of Cash Flows:June 30
2008 2009 2010
Cash and cash equivalents . . . . . . . . . . . . . . . . . . . . . . . . . . . . . . . . . . . . . . . . . . . . . . . . . . . . . . . . . . . . . . . . 23,569 14,565 29,112Bank overdrafts (note 21) . . . . . . . . . . . . . . . . . . . . . . . . . . . . . . . . . . . . . . . . . . . . . . . . . . . . . . . . . . . . . . . . . (2) — —
23,567 14,565 29,112
17. Share capital and premiumJune 30
2008 2009 2010
€ US$ € US$ € US$
BIGPH
Authorized9,000,000 ordinary shares of €.01 per share . . . . . . . . . . . . . . . . . . . . . . . . . . . . . . . . . . . . . . . . 240,000 329,147 90 141 90 141
Issued and fully paid up1,865,455 (at June 30, 2008: 1,800,000) ordinary shares of €0.01 per share . . . . . . . . . . . . . . . 118,932 163,109 19 29 19 29
The movement in the share capital and share premium accounts of BPH and the Company during the period of this
consolidated financial information was as follows:Number ofordinaryshares
(thousands)Ordinaryshares
Sharepremium Total
At July 1, 2007 . . . . . . . . . . . . . . . . . . . . . . . . . . . . . . . . . . . . . . . . . . . . . . . . . . . . . . . . . . 93,707 123,323 — 123,323Issue of shares . . . . . . . . . . . . . . . . . . . . . . . . . . . . . . . . . . . . . . . . . . . . . . . . . . . . . . . . . . . 25,226 39,786 135,219 175,005
At June 30, 2008 . . . . . . . . . . . . . . . . . . . . . . . . . . . . . . . . . . . . . . . . . . . . . . . . . . . . . . . . 118,933 163,109 135,219 298,328
Elimination of share capital and share premium of BPH . . . . . . . . . . . . . . . . . . . . . . . . . . (118,933) (163,109) (135,219) (298,328)Share capital and share premium of BIGPH . . . . . . . . . . . . . . . . . . . . . . . . . . . . . . . . . . . . 1,800 28 298,328 298,356Issue of shares . . . . . . . . . . . . . . . . . . . . . . . . . . . . . . . . . . . . . . . . . . . . . . . . . . . . . . . . . . . 65 1 29,999 30,000
At June 30, 2009 and June 30, 2010 . . . . . . . . . . . . . . . . . . . . . . . . . . . . . . . . . . . . . . . . 1,865 29 328,327 328,356
On March 19, 2008, 25,225,659 ordinary shares were issued in connection with agreement entered between
— F-45 — Page 41

Lathe Investments Pte Ltd. (LIPL), JP Morgan Mauritius Holdings VII Limited (JPM) and Ballarpur Paper Holdings B.V.
The acquisition of BPH by BIGPH is disclosed in share capital and share premium movements in 2009. For details refer Group
re-organization II in Note 2.1 (basis for preparation).
On February 27, 2009, the Company issued 65,455 ordinary shares to BIH, its parent company, through conversion of
US$30,000 from a total loan of US$115,000 from BIH (refer to Note 21.2.a) into equity. The fair value of the shares issued
amounted to US$30,000.
18. Retained earnings
At July 1, 2007 . . . . . . . . . . . . . . . . . . . . . . . . . . . . . . . . . . . . . . . . . . . . . . . . . . . . . . . . . . . . . . . . . . . . . . . . . . . . . . . . . . . . . . . . . . . . 53,867Profit for the year . . . . . . . . . . . . . . . . . . . . . . . . . . . . . . . . . . . . . . . . . . . . . . . . . . . . . . . . . . . . . . . . . . . . . . . . . . . . . . . . . . . . . . . . . . 15,286
At June 30, 2008 . . . . . . . . . . . . . . . . . . . . . . . . . . . . . . . . . . . . . . . . . . . . . . . . . . . . . . . . . . . . . . . . . . . . . . . . . . . . . . . . . . . . . . . . . . 69,153Profit for the year . . . . . . . . . . . . . . . . . . . . . . . . . . . . . . . . . . . . . . . . . . . . . . . . . . . . . . . . . . . . . . . . . . . . . . . . . . . . . . . . . . . . . . . . . . (6,901)
At June 30, 2009 . . . . . . . . . . . . . . . . . . . . . . . . . . . . . . . . . . . . . . . . . . . . . . . . . . . . . . . . . . . . . . . . . . . . . . . . . . . . . . . . . . . . . . . . . . 62,252Profit for the year . . . . . . . . . . . . . . . . . . . . . . . . . . . . . . . . . . . . . . . . . . . . . . . . . . . . . . . . . . . . . . . . . . . . . . . . . . . . . . . . . . . . . . . . . . 45,726
At June 30, 2010 . . . . . . . . . . . . . . . . . . . . . . . . . . . . . . . . . . . . . . . . . . . . . . . . . . . . . . . . . . . . . . . . . . . . . . . . . . . . . . . . . . . . . . . . . . 107,978
19. Other reserves
LIBORCCDs
Profitcertificates
Hedgingreserve
Available-for-salefinancialasset Total
At July 1, 2007 . . . . . . . . . . . . . . . . . . . . . . . . . . . . . . . . . . . . . . . . . . . . . . . . . . — — — — —Currency translation differences . . . . . . . . . . . . . . . . . . . . . . . . . . . . . . . . . . . . . — — — — —Distribution to owners . . . . . . . . . . . . . . . . . . . . . . . . . . . . . . . . . . . . . . . . . . . . . — — — — —Contribution from owners . . . . . . . . . . . . . . . . . . . . . . . . . . . . . . . . . . . . . . . . . . — — — — —
At June 30, 2008 . . . . . . . . . . . . . . . . . . . . . . . . . . . . . . . . . . . . . . . . . . . . . . . . . — — — — —Gain on fair valuation of available-for-sale financial asset . . . . . . . . . . . . . . . . . — — — 17,913 17,913Deferred tax liabilities on available-for-sale financial asset . . . . . . . . . . . . . . . . — — — (3,582) (3,582)
— — — 14,331 14,331Cash flow hedge . . . . . . . . . . . . . . . . . . . . . . . . . . . . . . . . . . . . . . . . . . . . . . . . . — — (30,220) — (30,220)Currency translation differences . . . . . . . . . . . . . . . . . . . . . . . . . . . . . . . . . . . . . — — — — —
At June 30, 2009 . . . . . . . . . . . . . . . . . . . . . . . . . . . . . . . . . . . . . . . . . . . . . . . . . — — (30,220) 14,331 (15,889)Gain on fair valuation of available-for-sale financial asset . . . . . . . . . . . . . . . . . — — — (3,729) (3,729)Deferred tax liabilities on available-for-sale financial asset . . . . . . . . . . . . . . . . — — — 746 746
— — — (2,983) (2,983)Equity contribution of profit certificates and compulsory convertibledebentures . . . . . . . . . . . . . . . . . . . . . . . . . . . . . . . . . . . . . . . . . . . . . . . . . . . . 15,800 88,847 — — 104,647
At June 30, 2010 . . . . . . . . . . . . . . . . . . . . . . . . . . . . . . . . . . . . . . . . . . . . . . . . . 15,800 88,847 (30,220) 11,348 85,775
— F-46 — Page 42

20. Trade and other payables
June 30
2008 2009 2010
Trade and other payables . . . . . . . . . . . . . . . . . . . . . . . . . . . . . . . . . . . . . . . . . . . . . . . . . . . . . . . . . . . . . . . . . . 102,906 62,024 153,982Amounts due to related parties (refer to note 38) . . . . . . . . . . . . . . . . . . . . . . . . . . . . . . . . . . . . . . . . . . . . . . . . 4,168 30,400 8,765Sales tax deferment loan (refer to note 2.20) . . . . . . . . . . . . . . . . . . . . . . . . . . . . . . . . . . . . . . . . . . . . . . . . . . . 9,383 7,204 7,053Security deposits from customers . . . . . . . . . . . . . . . . . . . . . . . . . . . . . . . . . . . . . . . . . . . . . . . . . . . . . . . . . . . . 2,787 1,991 6,795Interest payable . . . . . . . . . . . . . . . . . . . . . . . . . . . . . . . . . . . . . . . . . . . . . . . . . . . . . . . . . . . . . . . . . . . . . . . . . . 1,494 4,518 2,329
120,738 106,137 178,924Less: Non-current portionAmounts due to related parties (refer to note 38) . . . . . . . . . . . . . . . . . . . . . . . . . . . . . . . . . . . . . . . . . . . . . . . . — — (23)Sales tax deferment loan (refer to note 2.20) . . . . . . . . . . . . . . . . . . . . . . . . . . . . . . . . . . . . . . . . . . . . . . . . . . . (8,112) (5,614) (5,178)
Non-current portion . . . . . . . . . . . . . . . . . . . . . . . . . . . . . . . . . . . . . . . . . . . . . . . . . . . . . . . . . . . . . . . . . . . . . (8,112) (5,614) (5,201)
Current portion . . . . . . . . . . . . . . . . . . . . . . . . . . . . . . . . . . . . . . . . . . . . . . . . . . . . . . . . . . . . . . . . . . . . . . . . . 112,626 100,523 173,723
The carrying amounts of the Group’s trade and other payables are denominated in the following currencies:
June 30
2008 2009 2010
INR . . . . . . . . . . . . . . . . . . . . . . . . . . . . . . . . . . . . . . . . . . . . . . . . . . . . . . . . . . . . . . . . . . . . . . . . . . . . . . . . . . . 50,279 69,880 82,752US$ . . . . . . . . . . . . . . . . . . . . . . . . . . . . . . . . . . . . . . . . . . . . . . . . . . . . . . . . . . . . . . . . . . . . . . . . . . . . . . . . . . . 9,158 16,755 62,532Euro . . . . . . . . . . . . . . . . . . . . . . . . . . . . . . . . . . . . . . . . . . . . . . . . . . . . . . . . . . . . . . . . . . . . . . . . . . . . . . . . . . . 46,063 1,044 16,642GBP . . . . . . . . . . . . . . . . . . . . . . . . . . . . . . . . . . . . . . . . . . . . . . . . . . . . . . . . . . . . . . . . . . . . . . . . . . . . . . . . . . . — 128 276RM . . . . . . . . . . . . . . . . . . . . . . . . . . . . . . . . . . . . . . . . . . . . . . . . . . . . . . . . . . . . . . . . . . . . . . . . . . . . . . . . . . . 15,086 18,267 16,584Other . . . . . . . . . . . . . . . . . . . . . . . . . . . . . . . . . . . . . . . . . . . . . . . . . . . . . . . . . . . . . . . . . . . . . . . . . . . . . . . . . . 152 63 138
Total . . . . . . . . . . . . . . . . . . . . . . . . . . . . . . . . . . . . . . . . . . . . . . . . . . . . . . . . . . . . . . . . . . . . . . . . . . . . . . . . . . 120,738 106,137 178,924
21. Borrowings
June 30
2008 2009 2010
Non-currentTerm loans (21.1. below) . . . . . . . . . . . . . . . . . . . . . . . . . . . . . . . . . . . . . . . . . . . . . . . . . . . . . . . . . . . . . . . . . . 300,074 481,395 340,885Loans from related parties (21.2. below) . . . . . . . . . . . . . . . . . . . . . . . . . . . . . . . . . . . . . . . . . . . . . . . . . . . . . . 115,000 85,000 —LIBOR CCDs issued to a related party (21.2. below) . . . . . . . . . . . . . . . . . . . . . . . . . . . . . . . . . . . . . . . . . . . . — — 81,488Profit certificates issued to related parties (21.2. below) . . . . . . . . . . . . . . . . . . . . . . . . . . . . . . . . . . . . . . . . . . — — 42,483Finance lease liabilities (21.4. below) . . . . . . . . . . . . . . . . . . . . . . . . . . . . . . . . . . . . . . . . . . . . . . . . . . . . . . . . . 311 263 278
Non-current portion . . . . . . . . . . . . . . . . . . . . . . . . . . . . . . . . . . . . . . . . . . . . . . . . . . . . . . . . . . . . . . . . . . . . . 415,385 566,658 465,134Current . . . . . . . . . . . . . . . . . . . . . . . . . . . . . . . . . . . . . . . . . . . . . . . . . . . . . . . . . . . . . . . . . . . . . . . . . . . . . . . . 2 — —Bank overdraft (note 16) . . . . . . . . . . . . . . . . . . . . . . . . . . . . . . . . . . . . . . . . . . . . . . . . . . . . . . . . . . . . . . . . . . . 35,511 — —SFI seller’s note (21.3. below) . . . . . . . . . . . . . . . . . . . . . . . . . . . . . . . . . . . . . . . . . . . . . . . . . . . . . . . . . . . . . . — — 12,825Current portion of non-current term loans (21.1. below) . . . . . . . . . . . . . . . . . . . . . . . . . . . . . . . . . . . . . . . . . . 17,689 552 —Packing credit for export sales (21.3. below) . . . . . . . . . . . . . . . . . . . . . . . . . . . . . . . . . . . . . . . . . . . . . . . . . . . 1,090 856 248Banker’s acceptance (21.3. below) . . . . . . . . . . . . . . . . . . . . . . . . . . . . . . . . . . . . . . . . . . . . . . . . . . . . . . . . . . . 11,663 33,920 54,531Working capital term loans (21.3. below) . . . . . . . . . . . . . . . . . . . . . . . . . . . . . . . . . . . . . . . . . . . . . . . . . . . . . . 29 49 98
Finance lease liabilities (21.4. below) . . . . . . . . . . . . . . . . . . . . . . . . . . . . . . . . . . . . . . . . . . . . . . . . . . . . . . . . . 65,984 35,377 67,702
Total borrowings . . . . . . . . . . . . . . . . . . . . . . . . . . . . . . . . . . . . . . . . . . . . . . . . . . . . . . . . . . . . . . . . . . . . . . . . 481,369 602,035 532,836
— F-47 — Page 43

21.1. Term loans
The following table shows the movement in term loans.
June 30
2008 2009 2010
Opening balance . . . . . . . . . . . . . . . . . . . . . . . . . . . . . . . . . . . . . . . . . . . . . . . . . . . . . . . . . . . . . . . . . . . . . . . . 50,824 300,074 481,395Exchange loss/(gain) . . . . . . . . . . . . . . . . . . . . . . . . . . . . . . . . . . . . . . . . . . . . . . . . . . . . . . . . . . . . . . . . . . . . — 2,354 1,403Drawdown during the year . . . . . . . . . . . . . . . . . . . . . . . . . . . . . . . . . . . . . . . . . . . . . . . . . . . . . . . . . . . . . . . . 371,690 185,000 358,057Repayment during the year . . . . . . . . . . . . . . . . . . . . . . . . . . . . . . . . . . . . . . . . . . . . . . . . . . . . . . . . . . . . . . . (105,565) (6,714) (498,286)Transaction costs paid during the year . . . . . . . . . . . . . . . . . . . . . . . . . . . . . . . . . . . . . . . . . . . . . . . . . . . . . . . (19,988) (2,428) (7,619)Amortization of transaction costs . . . . . . . . . . . . . . . . . . . . . . . . . . . . . . . . . . . . . . . . . . . . . . . . . . . . . . . . . . . 62 3,109 1,208Expense of unamortized transaction costs . . . . . . . . . . . . . . . . . . . . . . . . . . . . . . . . . . . . . . . . . . . . . . . . . . . . 3,051 — 17,552
Closing balance . . . . . . . . . . . . . . . . . . . . . . . . . . . . . . . . . . . . . . . . . . . . . . . . . . . . . . . . . . . . . . . . . . . . . . . . 300,074 481,395 353,710
Current . . . . . . . . . . . . . . . . . . . . . . . . . . . . . . . . . . . . . . . . . . . . . . . . . . . . . . . . . . . . . . . . . . . . . . . . . . . . . . . — — 12,825Non-current . . . . . . . . . . . . . . . . . . . . . . . . . . . . . . . . . . . . . . . . . . . . . . . . . . . . . . . . . . . . . . . . . . . . . . . . . . . 300,074 481,395 340,885
The following table summarizes the draw downs and repayments by facility, each of them is explained in more detail further
below
Year ended June 30
2008 2009 2010
Draw downs— ABN AMRO/JPM . . . . . . . . . . . . . . . . . . . . . . . . . . . . . . . . . . . . . . . . . . . . . . . . . . . . . . . . . . . . . . . . . . . . 51,690 — —— Citigroup . . . . . . . . . . . . . . . . . . . . . . . . . . . . . . . . . . . . . . . . . . . . . . . . . . . . . . . . . . . . . . . . . . . . . . . . . . . 320,000 185,000 —— IDBI/Axis/CBI . . . . . . . . . . . . . . . . . . . . . . . . . . . . . . . . . . . . . . . . . . . . . . . . . . . . . . . . . . . . . . . . . . . . . . — — 213,057— Axis Bank . . . . . . . . . . . . . . . . . . . . . . . . . . . . . . . . . . . . . . . . . . . . . . . . . . . . . . . . . . . . . . . . . . . . . . . . . . — — 145,000
Total draw downs . . . . . . . . . . . . . . . . . . . . . . . . . . . . . . . . . . . . . . . . . . . . . . . . . . . . . . . . . . . . . . . . . . . . . . . 371,690 185,000 358,057
Repayments— ABN AMRO/JPM . . . . . . . . . . . . . . . . . . . . . . . . . . . . . . . . . . . . . . . . . . . . . . . . . . . . . . . . . . . . . . . . . . . . (105,565) — —— Citigroup . . . . . . . . . . . . . . . . . . . . . . . . . . . . . . . . . . . . . . . . . . . . . . . . . . . . . . . . . . . . . . . . . . . . . . . . . . . — (6,714) (498,286)
Total repayments . . . . . . . . . . . . . . . . . . . . . . . . . . . . . . . . . . . . . . . . . . . . . . . . . . . . . . . . . . . . . . . . . . . . . . . (105,565) (6,714) (498,286)
(a) ABN AMRO and J.P. Morgan loan
As at July 1, 2007 BPH had a drawn down balance of US$50,824, net of unamortized transaction fees of US$3,051, under a
US$200,000 facility with ABN AMRO and J.P. Morgan Securities (Asia Pacific Ltd.). A further drawdown of US$51,690 was
made during the year ended June 30, 2008 and the total drawn amount of US$105,565 was repaid early during that year. As a
result, the Group was subject to early debt retirement costs of US$2,152, and the unamortized transaction costs of US$3,051
of were expensed in that year. The loan was refinanced by way of a US$115,000 loan from BIH, the holding company of the
Group.
(b) Term loan from consortium led by Citigroup Global Markets PTE Ltd. (“Citigroup”)
In March 2008 BPH obtained a US$560,000 loan facility from Citigroup at LIBOR plus a margin. The margin was in the range
of 2.15% to 2.75%, varying with different tranches. In the year ended June 30, 2008 US$320,000 of this loan was drawn down
and in the year ended June 30, 2009 a further US$185,000 was drawn down. In addition during the year ended June 30, 2009
US$6,714 of the loan was repaid.
— F-48 — Page 44
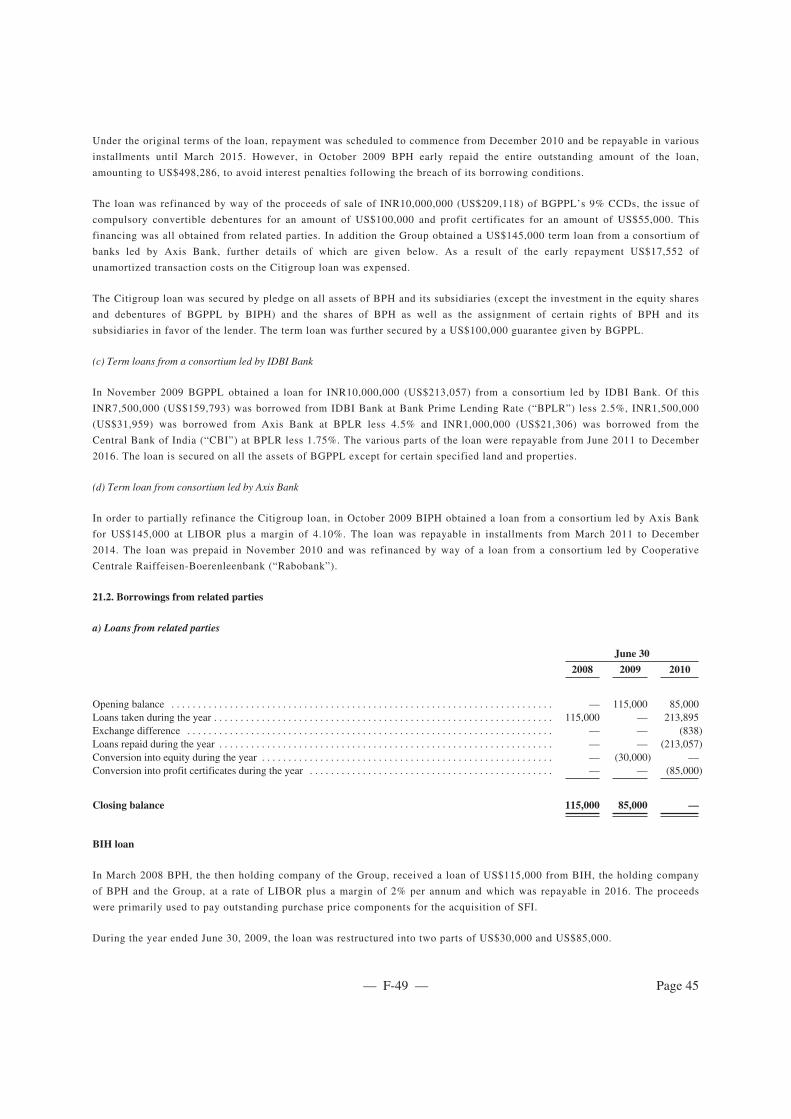
Under the original terms of the loan, repayment was scheduled to commence from December 2010 and be repayable in various
installments until March 2015. However, in October 2009 BPH early repaid the entire outstanding amount of the loan,
amounting to US$498,286, to avoid interest penalties following the breach of its borrowing conditions.
The loan was refinanced by way of the proceeds of sale of INR10,000,000 (US$209,118) of BGPPL’s 9% CCDs, the issue of
compulsory convertible debentures for an amount of US$100,000 and profit certificates for an amount of US$55,000. This
financing was all obtained from related parties. In addition the Group obtained a US$145,000 term loan from a consortium of
banks led by Axis Bank, further details of which are given below. As a result of the early repayment US$17,552 of
unamortized transaction costs on the Citigroup loan was expensed.
The Citigroup loan was secured by pledge on all assets of BPH and its subsidiaries (except the investment in the equity shares
and debentures of BGPPL by BIPH) and the shares of BPH as well as the assignment of certain rights of BPH and its
subsidiaries in favor of the lender. The term loan was further secured by a US$100,000 guarantee given by BGPPL.
(c) Term loans from a consortium led by IDBI Bank
In November 2009 BGPPL obtained a loan for INR10,000,000 (US$213,057) from a consortium led by IDBI Bank. Of this
INR7,500,000 (US$159,793) was borrowed from IDBI Bank at Bank Prime Lending Rate (“BPLR”) less 2.5%, INR1,500,000
(US$31,959) was borrowed from Axis Bank at BPLR less 4.5% and INR1,000,000 (US$21,306) was borrowed from the
Central Bank of India (“CBI”) at BPLR less 1.75%. The various parts of the loan were repayable from June 2011 to December
2016. The loan is secured on all the assets of BGPPL except for certain specified land and properties.
(d) Term loan from consortium led by Axis Bank
In order to partially refinance the Citigroup loan, in October 2009 BIPH obtained a loan from a consortium led by Axis Bank
for US$145,000 at LIBOR plus a margin of 4.10%. The loan was repayable in installments from March 2011 to December
2014. The loan was prepaid in November 2010 and was refinanced by way of a loan from a consortium led by Cooperative
Centrale Raiffeisen-Boerenleenbank (“Rabobank”).
21.2. Borrowings from related parties
a) Loans from related parties
June 30
2008 2009 2010
Opening balance . . . . . . . . . . . . . . . . . . . . . . . . . . . . . . . . . . . . . . . . . . . . . . . . . . . . . . . . . . . . . . . . . . . . . . . . — 115,000 85,000Loans taken during the year . . . . . . . . . . . . . . . . . . . . . . . . . . . . . . . . . . . . . . . . . . . . . . . . . . . . . . . . . . . . . . . . 115,000 — 213,895Exchange difference . . . . . . . . . . . . . . . . . . . . . . . . . . . . . . . . . . . . . . . . . . . . . . . . . . . . . . . . . . . . . . . . . . . . . — — (838)Loans repaid during the year . . . . . . . . . . . . . . . . . . . . . . . . . . . . . . . . . . . . . . . . . . . . . . . . . . . . . . . . . . . . . . . — — (213,057)Conversion into equity during the year . . . . . . . . . . . . . . . . . . . . . . . . . . . . . . . . . . . . . . . . . . . . . . . . . . . . . . . — (30,000) —Conversion into profit certificates during the year . . . . . . . . . . . . . . . . . . . . . . . . . . . . . . . . . . . . . . . . . . . . . . — — (85,000)
Closing balance 115,000 85,000 —
BIH loan
In March 2008 BPH, the then holding company of the Group, received a loan of US$115,000 from BIH, the holding company
of BPH and the Group, at a rate of LIBOR plus a margin of 2% per annum and which was repayable in 2016. The proceeds
were primarily used to pay outstanding purchase price components for the acquisition of SFI.
During the year ended June 30, 2009, the loan was restructured into two parts of US$30,000 and US$85,000.
— F-49 — Page 45

Under an agreement dated February 27, 2009 between BIGPH, BIH and BPH, BIGPH (which had, on July 14, 2008, as a result
of the group reorganization become the new holding company of the Group) assumed the US$30,000 loan from BIH with
effect from December 31, 2008 in return for the issuance to BIH of 65,455 shares at a par value of €0.01 and a premium of
US$29,999. As a result the external liability owed by the Group was extinguished.
On October 8, 2009 the remaining US$85,000 was extinguished and profit certificates were issued as detailed below.
9% CCDs
In October 2009, BIPH sold to Ballarpur INR10,000,000 (US$213,895) of the 9% BGPPL CCDs that it owned. The 9% CCDs
had originally been bought by BPH in March and June 2008 when BGPPL was transferred to BPH. These CCDs were
converted to INR10,000,000 non Compulsorily convertible debentures and were subsequently redeemed by BGPPL in
November 2009 through payment of cash of INR10,000,000 (US$213,057). The redemption of the NCDs was funded by way
of an INR10,000,000 (US$213,057) loan from a consortium led by IDBl Bank as detailed above.
b) Compulsory convertible debentures issued to a related party
In October 2009, BPH, a Group company, issued 100 million LIBOR + 3.82% compulsorily convertible debentures (“LIBOR
CCDs”) at a par value of US$100,000 to Avantha International Asset B.V. (“AlA”), a related party of the Group. The LIBOR
CCDs are mandatorily convertible into preference shares on June 30, 2013 and, in addition, AlA has an option to require
conversion before June 30, 2013. On conversion AlA would receive preference shares to the value of US$100 million. Prior to
conversion the Group is required to pay interest at LIBOR + 3.82% Post conversion into preference shares, the Group is
required to pay an annual dividend of LIBOR + 3.82% subject to the availability of sufficient profits.
The fair value of the LIBOR CCDs, included in non-current borrowings, was calculated at issuance using the average interest
rate for the Group’s external borrowings. The difference between the proceeds and the fair value of the LIBOR CCDs
representing the equity contribution from AlA is included in shareholders’ equity in other reserves, (note 19), net of income
taxes.
The LIBOR CCDs recognized in the balance sheet are calculated as follows:
June 30
2008 2009 2010
Proceeds received on issuance of LIBOR CCDs on 8 October 2009 . . . . . . . . . . . . . . . . . . . . . . . . . . . . . . — — 100,000Transaction costs . . . . . . . . . . . . . . . . . . . . . . . . . . . . . . . . . . . . . . . . . . . . . . . . . . . . . . . . . . . . . . . . . . . . . . — — (2,712)Equity contribution from AlA (note 19) . . . . . . . . . . . . . . . . . . . . . . . . . . . . . . . . . . . . . . . . . . . . . . . . . . . . — — (15,800)
LIBOR CCDs at fair value . . . . . . . . . . . . . . . . . . . . . . . . . . . . . . . . . . . . . . . . . . . . . . . . . . . . . . . . . . . . . . — — 81,488
The fair value of the LIBOR CCDs at June 30, 2010 amounted to US$82.1 million and was calculated using cash flows
discounted at a rate based on the borrowings rate of 5.3%.
c) Profit certificates issued to a related party
In October 2009, BPH, a Group company issued 20 million LIBOR profit certificates with a par value of Euro 20 million to
BIH, the parent company, for a consideration of US$140,000. The profit certificates do not have any stated maturity. The
Group is required to pay dividends at LIBOR over the consideration received subject to the availability of sufficient profits.
The fair value of the profit certificates, included in non-current borrowings, was calculated at its issuance
— F-50 — Page 46

using the average interest rate for the Group’s external borrowings. The difference between the proceeds received and the fair
value of the profit certificates, representing the value of the equity contribution from BIH, is included in shareholders’ equity
in other reserves, (note 19) net of income taxes.
The profit certificates recognized in the balance sheet are calculated as follows:
June 30
2008 2009 2010
Consideration for issuance of profit certificates . . . . . . . . . . . . . . . . . . . . . . . . . . . . . . . . . . . . . . . . . . . . . . — — 140,000Equity contribution by BIH (note 19) . . . . . . . . . . . . . . . . . . . . . . . . . . . . . . . . . . . . . . . . . . . . . . . . . . . . . . — — (88,847)
Fair value of profit certificates on initial recognition at October 8, 2009 . . . . . . . . . . . . . . . . . . . . . . . . . . . — — 51,153Exchange gain . . . . . . . . . . . . . . . . . . . . . . . . . . . . . . . . . . . . . . . . . . . . . . . . . . . . . . . . . . . . . . . . . . . . . . . . — — (8,670)
Liability component . . . . . . . . . . . . . . . . . . . . . . . . . . . . . . . . . . . . . . . . . . . . . . . . . . . . . . . . . . . . . . . . . . — — 42,483
The fair value of the profit certificates at June 30, 2010 amounted to US$43.21 million and was calculated using cash flows
discounted at a rate based on the borrowings rate of 6.0%.
21.3. Other current borrowings
Packing credit for export sales
Packing credits for export sales are typically for up to six months to finance export sales against letters of credit from
customers. Under the terms of the lender providing the packing credit working capital facilities to BGPPL, its charge over
assets is to rank pari passu with other banks providing working capital facilities.
Banker’s acceptance
The banker’s acceptance relates to SFI and is secured by deposits pledged.
Working capital loans
Working capital loans comprise:
June 30
2008 2009 2010
Short-term loans . . . . . . . . . . . . . . . . . . . . . . . . . . . . . . . . . . . . . . . . . . . . . . . . . . . . . . . . . . . . . . . . . . . . . . . . . . . . 11,663 20,108 10,412Commercial paper . . . . . . . . . . . . . . . . . . . . . . . . . . . . . . . . . . . . . . . . . . . . . . . . . . . . . . . . . . . . . . . . . . . . . . . . . . . — 3,083 —Buyers’ credit facilities . . . . . . . . . . . . . . . . . . . . . . . . . . . . . . . . . . . . . . . . . . . . . . . . . . . . . . . . . . . . . . . . . . . . . . . — 10,729 44,119
Total . . . . . . . . . . . . . . . . . . . . . . . . . . . . . . . . . . . . . . . . . . . . . . . . . . . . . . . . . . . . . . . . . . . . . . . . . . . . . . . . . . . . . 11,663 33,920 54,531
Buyers’ credit facilities are utilized to finance raw material import for a period of up to one year.
21.4. Finance lease liabilities
Finance lease liabilities relate to the financing of vehicles. These lease liabilities are effectively secured as the rights to the
leased asset revert to the lessor in the event of default
— F-51 — Page 47

June 30
2008 2009 2010
Gross finance liabilities — minimum lease paymentsNo later than 1 year . . . . . . . . . . . . . . . . . . . . . . . . . . . . . . . . . . . . . . . . . . . . . . . . . . . . . . . . . . . . . . . . . . 71 79 114More than 1 year and no later than 5 years . . . . . . . . . . . . . . . . . . . . . . . . . . . . . . . . . . . . . . . . . . . . . . . . 269 263 298Later than 5 years . . . . . . . . . . . . . . . . . . . . . . . . . . . . . . . . . . . . . . . . . . . . . . . . . . . . . . . . . . . . . . . . . . . . 40 — —
380 342 412Future finance charges on finance lease . . . . . . . . . . . . . . . . . . . . . . . . . . . . . . . . . . . . . . . . . . . . . . . . . . 40 30 35
Present value of finance lease liabilities 340 312 377
Present value of finance lease liabilitiesNo later than 1 year . . . . . . . . . . . . . . . . . . . . . . . . . . . . . . . . . . . . . . . . . . . . . . . . . . . . . . . . . . . . . . . . . . 57 66 98More than 1 year and no later than 5 years . . . . . . . . . . . . . . . . . . . . . . . . . . . . . . . . . . . . . . . . . . . . . . . . 244 246 279Later than 5 years . . . . . . . . . . . . . . . . . . . . . . . . . . . . . . . . . . . . . . . . . . . . . . . . . . . . . . . . . . . . . . . . . . . . 39 — —
340 312 377
21.5. Other information
The average effective interest rates per annum of the Group’s borrowings are as follows:
June 30
2008 2009 2010% % %
Borrowings in RM . . . . . . . . . . . . . . . . . . . . . . . . . . . . . . . . . . . . . . . . . . . . . . . . . . . . . . . . . . . . . . . . . . . . 4 2 – 3 2 – 6Borrowings in US$ (Term loans) . . . . . . . . . . . . . . . . . . . . . . . . . . . . . . . . . . . . . . . . . . . . . . . . . . . . . . . . . 4 – 5 4 – 5 4 – 6Borrowings in US$ (working capital loans) . . . . . . . . . . . . . . . . . . . . . . . . . . . . . . . . . . . . . . . . . . . . . . . . . — 1 – 2 0.7 –2.1Borrowings in INR . . . . . . . . . . . . . . . . . . . . . . . . . . . . . . . . . . . . . . . . . . . . . . . . . . . . . . . . . . . . . . . . . . . . 9 – 12 10 – 13 10 – 11Borrowings in Euro (Term Loan) . . . . . . . . . . . . . . . . . . . . . . . . . . . . . . . . . . . . . . . . . . . . . . . . . . . . . . . . . — — 0 – 1Borrowings in Euro (Working capital Loan) . . . . . . . . . . . . . . . . . . . . . . . . . . . . . . . . . . . . . . . . . . . . . . . . — — 1 – 2
The estimated fair values of the Group’s borrowings as at June 30, 2008, June 30, 2009 and June 30, 2010 approximated their
respective carrying values as all the non-current borrowings are at a floating rate of interest except for the loan from related
parties, which had a fair value as at June 30, 2008 and June 30, 2009, respectively, of US$109,967 and US$76,411, using a
discount rate, respectively, of 4.54%, and 4.12%. At June 30, 2010, except for LIBOR CCDs and profit certificates which have
been explained in the relevant note above, there were no loans from a related party.
The carrying amounts of the Group’s borrowings are denominated in the following currencies:
June 30
2008 2009 2010
INR . . . . . . . . . . . . . . . . . . . . . . . . . . . . . . . . . . . . . . . . . . . . . . . . . . . . . . . . . . . . . . . . . . . . . . . . . . . . . . . . . . . 21,320 34,333 213,243US$ . . . . . . . . . . . . . . . . . . . . . . . . . . . . . . . . . . . . . . . . . . . . . . . . . . . . . . . . . . . . . . . . . . . . . . . . . . . . . . . . . . . 458,957 566,534 274,773Euro . . . . . . . . . . . . . . . . . . . . . . . . . . . . . . . . . . . . . . . . . . . . . . . . . . . . . . . . . . . . . . . . . . . . . . . . . . . . . . . . . . . 2 — 44,196RM . . . . . . . . . . . . . . . . . . . . . . . . . . . . . . . . . . . . . . . . . . . . . . . . . . . . . . . . . . . . . . . . . . . . . . . . . . . . . . . . . . . 1,090 1,168 624
Total . . . . . . . . . . . . . . . . . . . . . . . . . . . . . . . . . . . . . . . . . . . . . . . . . . . . . . . . . . . . . . . . . . . . . . . . . . . . . . . . . . 481,369 602,035 532,836
— F-52 — Page 48

The Group has the following undrawn borrowing facilities:
June 30
2008 2009 2010
Term loan . . . . . . . . . . . . . . . . . . . . . . . . . . . . . . . . . . . . . . . . . . . . . . . . . . . . . . . . . . . . . . . . . . . . . . . . . . . . . . . 240,000 — —Working capital facilities . . . . . . . . . . . . . . . . . . . . . . . . . . . . . . . . . . . . . . . . . . . . . . . . . . . . . . . . . . . . . . . . . . . 5,801 12,950 169,535
245,801 12,950 169,535
The undrawn term loan amounts as at June 30, 2008 and June 30, 2009 are in respect of the Citigroup loan facility.
22. Deferred income tax
The analysis of deferred tax assets and deferred tax liabilities is as follows. A net asset or liability is recorded based on the net
tax position in each tax jurisdiction.
June 30
2008 2009 2010
Deferred tax assetsDeferred tax assets to be recovered after more than 12 months . . . . . . . . . . . . . . . . . . . . . . . . . . . . . . . . . . . . . . . 2,174 18,609 49,672Deferred tax assets to be recovered within 12 months . . . . . . . . . . . . . . . . . . . . . . . . . . . . . . . . . . . . . . . . . . . . . . 3,443 10,294 5,405
5,617 28,903 55,077Deferred tax liabilitiesDeferred tax liabilities due after more than 12 months . . . . . . . . . . . . . . . . . . . . . . . . . . . . . . . . . . . . . . . . . . . . . . 15,266 28,657 59,401Deferred tax liabilities due within 12 months . . . . . . . . . . . . . . . . . . . . . . . . . . . . . . . . . . . . . . . . . . . . . . . . . . . . . 1,423 11,468 1,625
16,689 40,125 61,026
Deferred tax asset (net) . . . . . . . . . . . . . . . . . . . . . . . . . . . . . . . . . . . . . . . . . . . . . . . . . . . . . . . . . . . . . . . . . . . . . — — 10,836
Deferred tax liabilities (net) . . . . . . . . . . . . . . . . . . . . . . . . . . . . . . . . . . . . . . . . . . . . . . . . . . . . . . . . . . . . . . . . . 11,072 11,222 16,785
The gross movement on the deferred income tax accounts is as follows:
June 30
2008 2009 2010
Deferred tax asset, netOpening balance . . . . . . . . . . . . . . . . . . . . . . . . . . . . . . . . . . . . . . . . . . . . . . . . . . . . . . . . . . . . . . . . . . . . . . . . . . . — — —Exchange differences . . . . . . . . . . . . . . . . . . . . . . . . . . . . . . . . . . . . . . . . . . . . . . . . . . . . . . . . . . . . . . . . . . . . . . . — — 459Income statement charge/(credit) . . . . . . . . . . . . . . . . . . . . . . . . . . . . . . . . . . . . . . . . . . . . . . . . . . . . . . . . . . . . . . — — 10,377
Closing balance, net asset . . . . . . . . . . . . . . . . . . . . . . . . . . . . . . . . . . . . . . . . . . . . . . . . . . . . . . . . . . . . . . . . . . . — — 10,836
June 30
2008 2009 2010
Deferred tax liabilities, netOpening balance . . . . . . . . . . . . . . . . . . . . . . . . . . . . . . . . . . . . . . . . . . . . . . . . . . . . . . . . . . . . . . . . . . . . . . . . . . . 5,162 11,072 11,222Exchange differences . . . . . . . . . . . . . . . . . . . . . . . . . . . . . . . . . . . . . . . . . . . . . . . . . . . . . . . . . . . . . . . . . . . . . . . (611) (1,308) 127Income statement charge/(credit) . . . . . . . . . . . . . . . . . . . . . . . . . . . . . . . . . . . . . . . . . . . . . . . . . . . . . . . . . . . . . . 6,521 (2,125) 6,021Tax charge relating to components of other comprehensive income (note 31) . . . . . . . . . . . . . . . . . . . . . . . . . . . — 3,583 (585)
Closing balance, net liability . . . . . . . . . . . . . . . . . . . . . . . . . . . . . . . . . . . . . . . . . . . . . . . . . . . . . . . . . . . . . . . . 11,072 11,222 16,785
— F-53 — Page 49

The movement in deferred income tax assets and liabilities during the years/period, without taking into consideration the
offsetting of balances within the same tax jurisdiction, is as follows:
Deferred tax liabilitiesAccelerated taxdepreciation
Derivativefinancial
Instruments
AFSfinancialasset Other Total
At July 1, 2007 . . . . . . . . . . . . . . . . . . . . . . . . . . . . . . . . . . . . . . . . . . . . . . . 6,615 — — 1,496 8,111Charged/(credited) to the income statement . . . . . . . . . . . . . . . . . . . . . . . . . 9,531 — — — 9,531Exchange differences . . . . . . . . . . . . . . . . . . . . . . . . . . . . . . . . . . . . . . . . . . (880) — — (73) (953)
At June 30, 2008 . . . . . . . . . . . . . . . . . . . . . . . . . . . . . . . . . . . . . . . . . . . . . 15,266 — — 1,423 16,689Charged/(credited) to the income statement . . . . . . . . . . . . . . . . . . . . . . . . . 15,296 7,011 — (325) 21,982Charged directly to other comprehensive income (note 31) . . . . . . . . . . . . . — — 3,583 — 3,583Exchange differences . . . . . . . . . . . . . . . . . . . . . . . . . . . . . . . . . . . . . . . . . . (1,907) (54) — (168) (2,129)
At June 30, 2009 . . . . . . . . . . . . . . . . . . . . . . . . . . . . . . . . . . . . . . . . . . . . . 28,655 6,957 3,583 930 40,125Charged/(credited) to the income statement . . . . . . . . . . . . . . . . . . . . . . . . . 23,538 (3,588) — 668 20,618Charged/(credited) directly to other comprehensive income (note 31) . . . . — — (585) — (585)Exchange differences . . . . . . . . . . . . . . . . . . . . . . . . . . . . . . . . . . . . . . . . . . 841 — — 27 868
At June 30, 2010 . . . . . . . . . . . . . . . . . . . . . . . . . . . . . . . . . . . . . . . . . . . . . 53,034 3,369 2,998 1,625 61,026
Deferred tax assets
Definedbenefit
obligations
Trade andother
receivables
Tax lossesand taxcredits(see notebelow)
Derivativefinancial
instruments
Exchange ratedifferences onqualifying loans Other Total
At July 1, 2007 . . . . . . . . . . . . . . . . . . . . . . — 3,118 — — — (172) 2,946Credited to the income statement . . . . . . . . 2,308 181 — — — 522 3,011Exchange differences . . . . . . . . . . . . . . . . . (134) (164) — — — (42) (340)
At June 30, 2008 . . . . . . . . . . . . . . . . . . . . 2,174 3,135 — — — 308 5,617Credited to the income statement . . . . . . . . 52 121 19,960 3,785 — 189 24,107Exchange differences . . . . . . . . . . . . . . . . . (263) (374) (126) (21) — (37) (821)
At June 30, 2009 . . . . . . . . . . . . . . . . . . . . 1,963 2,882 19,834 3,764 — 460 28,903Credited/(charged) to the incomestatement . . . . . . . . . . . . . . . . . . . . . . . . . 279 (146) 23,118 (395) — 2117 24,973
Exchange differences . . . . . . . . . . . . . . . . . 47 64 1,062 — — 28 1,201
At June 30, 2010 . . . . . . . . . . . . . . . . . . . . 2,289 2,800 44,014 3,389 — 2,605 55,077
— F-54 — Page 50

Deferred income tax assets are recognized for tax loss carry-forwards and tax credits to the extent that the realization of the
related tax benefit through future taxable profits is probable. The underlying tax losses and tax credits primarily relate to
minimum alternate tax (“MAT”) credits and unabsorbed depreciation in India and tax loss carry forwards in SFI, Malaysia, as
detailed in the following table and further explained below. The applicable tax rates in the relevant jurisdictions enacted at
each balance sheet date are shown in note 31.
The deferred tax asset on tax losses carried forward and tax credits has developed as follows:
India Malaysia Other Total
Deferred tax assets ontax losses and tax credits
Unabsorbeddepreciation MAT credit
Tax lossescarriedforward
Tax lossescarriedforward
At June 30, 2008 . . . . . . . . . . . . . . . . . . . . . . . . . . . . . . . . . . . . . . . . . . . — — — — —Credited/(charged) to the income statement . . . . . . . . . . . . . . . . . . . . . . . 12,704 4,030 — 3,226 19,960Exchange differences . . . . . . . . . . . . . . . . . . . . . . . . . . . . . . . . . . . . . . . . (70) (23) — (33) (126)
At June 30, 2009 . . . . . . . . . . . . . . . . . . . . . . . . . . . . . . . . . . . . . . . . . . . 12,634 4,007 — 3,193 19,834Credited/(charged) to the income statement . . . . . . . . . . . . . . . . . . . . . . . 11,260 4,674 10,377 (3,193) 23,118Exchange differences . . . . . . . . . . . . . . . . . . . . . . . . . . . . . . . . . . . . . . . . 378 225 459 — 1,062
At June 30, 2010 . . . . . . . . . . . . . . . . . . . . . . . . . . . . . . . . . . . . . . . . . . . 24,272 8,906 10,836 — 44,014
India
Indian companies are subject to corporate income tax or MAT. If MAT is greater than corporate income tax, then MAT is
levied. MAT is charged on book profits, and the excess of MAT over the lower corporate income tax amount is available as a
credit against corporate income tax in the following ten years (prior to April 2010: seven years). Un absorbed depreciation
represents tax losses resulting from higher depreciation charges according to the Indian Income Tax Act as compared to book
depreciation and can be carried forward against future tax profits indefinitely.
BGPPL has no significant unrecognized MAT credits and unabsorbed depreciation from prior years.
Tax periods remain open to review by the Indian Tax Authorities in respect of income taxes for 6 years following the date of
the filing of the corporate tax return, during which time the authorities have the right to raise additional tax assessments
including penalties and interest. Under certain circumstances the reviews may take a longer period of time. Because a number
of tax periods remain open to review by tax authorities, there is a risk that transactions that have not been challenged in the
past by the authorities may be challenged by them in the future, and this may result in the raising of additional tax assessments
plus penalties and interest. The Group makes no provision in respect of such tax assessments until an unfavorable outcome is
considered more likely than not.
In its tax returns for the tax years ended March 31, 2008, 2009 and 2010, BGPPL has deducted approximately US$16 million
sales taxes that are subject to the Sales Tax Exemption scheme (refer to note 2.20.b) as non-taxable income both for purposes
of calculating its tax liability under normal provisions and the MAT liability under the MAT regime. This deduction has been
disputed by the Indian Tax Authorities for the March 2008 tax return where they disallowed the deduction of sales tax both for
the calculation of the tax under normal provisions and under the MAT regime. This case is currently pending at appellate
level. The Group’s ultimate parent company Ballarpur is also in litigation with the Tax Authorities in a similar case and has
achieved favorable court rulings so far; however, the Tax Authorities continue to litigate this matter at the Mumbai High
Court. The Group and its tax advisors believe that the risk of an unfavorable court decision is low both for tax deduction under
normal provisions and under the MAT regime and has therefore not adjusted the deferred tax asset on tax losses of BGPPL.
However, in the event of an unfavorable court ruling, BGPPL would likely be subject to reduction in available tax losses of
US$8.8 million and US$4.9
— F-55 — Page 51

million, in the Indian tax years 2009 and 2010, respectively. Further an additional MAT, penalty and interest exposure may
also arise, which may be partially offset by a MAT credit.
The present draft of a new Direct Tax Code (“DTC”) with proposed effective date from April 1, 2012 does not permit the carry
forward of MAT credits paid under the currently effective Income Tax Act. Thus, the proposed DTC, if enacted in its present
draft form, might impact the carry forward of BGPPL’s MAT credits that were accumulated under the India Tax Act before the
introduction of the DTC. However, MAT paid under the proposed DTC is allowed to be carried forward and set off against
future corporate tax liabilities for a period of fifteen years. The DTC proposals are currently in draft form and subject to
further discussion and debate until finalized. The Group and its tax advisors believe that the final draft of the DTC will
deviate from the current draft in that it will allow grandfathering of previously accumulated MAT credits, and therefore has
not adjusted the deferred tax asset for MAT credits.
Malaysia
SFI, the Malaysian entity, has historically been in a tax loss situation and therefore does not incur any substantial current
income tax expense.
SFI carries forward unused tax losses and various tax allowances, all of which are available for set-off against taxable income
in future years for an unlimited period. Details are shown in the following table:
June 30
2008 2009 2010
SFI, MalaysiaUnutilized tax losses . . . . . . . . . . . . . . . . . . . . . . . . . . . . . . . . . . . . . . . . . . . . . . . . . . . . . . . . . . . . . . . . . . . . . . 152,596 140,428 152,815Unabsorbed capital allowances . . . . . . . . . . . . . . . . . . . . . . . . . . . . . . . . . . . . . . . . . . . . . . . . . . . . . . . . . . . . . . 393,269 369,038 381,975Reinvestment allowance . . . . . . . . . . . . . . . . . . . . . . . . . . . . . . . . . . . . . . . . . . . . . . . . . . . . . . . . . . . . . . . . . . . 20,936 19,272 20,979Infrastructure allowance . . . . . . . . . . . . . . . . . . . . . . . . . . . . . . . . . . . . . . . . . . . . . . . . . . . . . . . . . . . . . . . . . . . 686 631 687
567,487 529,369 556,456
In addition, SFI carries forward a tax-exempt income account from historical investment tax credits that — subject to
agreement by the Inland Revenue Board of Malaysia — is available for distribution of tax-exempt dividends to the
shareholders of the subsidiary. The available tax-exempt balance at each balance sheet date is as follows:
June 30
2008 2009 2010
Tax-exempt account . . . . . . . . . . . . . . . . . . . . . . . . . . . . . . . . . . . . . . . . . . . . . . . . . . . . . . . . . . . . . . . . . . . . . . 180,990 166,608 181,363
The Netherlands
The Dutch holding entities have historically been and continue to be in a tax loss situation and therefore do not incur any
substantial current income tax expense. Tax losses can be set off upto 9 years.
The Dutch entities BIPH and BPH have no unused tax losses at June 30, 2008, 2009, 2010 that can be carried forward.
— F-56 — Page 52

Unrecognized deferred taxes
As at June 30, 2008, June 30, 2009 and June 30, 2010, the estimated net deferred tax assets of the Group, calculated at the
applicable tax rate, which have not been recognized in the Group’s financial statements, are as follows:
June 30
2008 2009 2010
Tax effects of:Unabsorbed capital allowances (Malaysia) . . . . . . . . . . . . . . . . . . . . . . . . . . . . . . . . . . . . . . . . . . . . . . . . . . 98,317 92,260 84,658Unutilized tax losses (Malaysia) . . . . . . . . . . . . . . . . . . . . . . . . . . . . . . . . . . . . . . . . . . . . . . . . . . . . . . . . . . 38,149 35,107 38,204Reinvestment allowance . . . . . . . . . . . . . . . . . . . . . . . . . . . . . . . . . . . . . . . . . . . . . . . . . . . . . . . . . . . . . . . . 5,234 4,818 5,245Infrastructure allowance . . . . . . . . . . . . . . . . . . . . . . . . . . . . . . . . . . . . . . . . . . . . . . . . . . . . . . . . . . . . . . . . 172 158 172Temporary differences arising from:
Property plant and equipment (Malaysia) . . . . . . . . . . . . . . . . . . . . . . . . . . . . . . . . . . . . . . . . . . . . . . . (33,021) (29,838) (31,220)Biological assets (Malaysia) . . . . . . . . . . . . . . . . . . . . . . . . . . . . . . . . . . . . . . . . . . . . . . . . . . . . . . . . . (11,358) (11,182) (13,131)
Total . . . . . . . . . . . . . . . . . . . . . . . . . . . . . . . . . . . . . . . . . . . . . . . . . . . . . . . . . . . . . . . . . . . . . . . . . . . . . . . . . . . 97,466 91,323 83,928
23. Retirement benefit obligations
Defined benefit plans
June 30
2008 2009 2010
Balance sheet obligations for:Gratuity plan (note 23(a)) . . . . . . . . . . . . . . . . . . . . . . . . . . . . . . . . . . . . . . . . . . . . . . . . . . . . . . . . . . . . . . . . . . . . . 5,556 5,007 5,957Compensated absences (note 23(b)) . . . . . . . . . . . . . . . . . . . . . . . . . . . . . . . . . . . . . . . . . . . . . . . . . . . . . . . . . . . . . 597 577 671
Total . . . . . . . . . . . . . . . . . . . . . . . . . . . . . . . . . . . . . . . . . . . . . . . . . . . . . . . . . . . . . . . . . . . . . . . . . . . . . . . . . . . . . 6,153 5,584 6,628
June 30
2008 2009 2010
Income statement charge for (note 28):Gratuity plan (note 23(a)) . . . . . . . . . . . . . . . . . . . . . . . . . . . . . . . . . . . . . . . . . . . . . . . . . . . . . . . . . . . . . . . . . . . . . 1,271 1,355 1,534Compensated absences (note 23(b)) . . . . . . . . . . . . . . . . . . . . . . . . . . . . . . . . . . . . . . . . . . . . . . . . . . . . . . . . . . . . . 220 231 120
Total . . . . . . . . . . . . . . . . . . . . . . . . . . . . . . . . . . . . . . . . . . . . . . . . . . . . . . . . . . . . . . . . . . . . . . . . . . . . . . . . . . . . . 1,491 1,586 1,654
Defined contribution plans
June 30
2008 2009 2010
Income statement charge for (note 28):Provident fund (note 23(c)) . . . . . . . . . . . . . . . . . . . . . . . . . . . . . . . . . . . . . . . . . . . . . . . . . . . . . . . . . . . . . . . . . . . . 1,726 2,097 2,247Superannuation fund (note 23(d)) . . . . . . . . . . . . . . . . . . . . . . . . . . . . . . . . . . . . . . . . . . . . . . . . . . . . . . . . . . . . . . . 342 188 199
Total . . . . . . . . . . . . . . . . . . . . . . . . . . . . . . . . . . . . . . . . . . . . . . . . . . . . . . . . . . . . . . . . . . . . . . . . . . . . . . . . . . . . . 2,068 2,285 2,446
(a) Gratuity benefit plan
In accordance with applicable Indian laws, the Group provides for gratuity, a defined benefit plan, covering eligible employees. This
plan provides for a lump sum payment to vested employees on retirement, death, incapacity or termination of employment of amounts
that are based on salary and tenure of employment. Liabilities with regard to this plan are determined by actuarial valuation.
— F-57 — Page 53
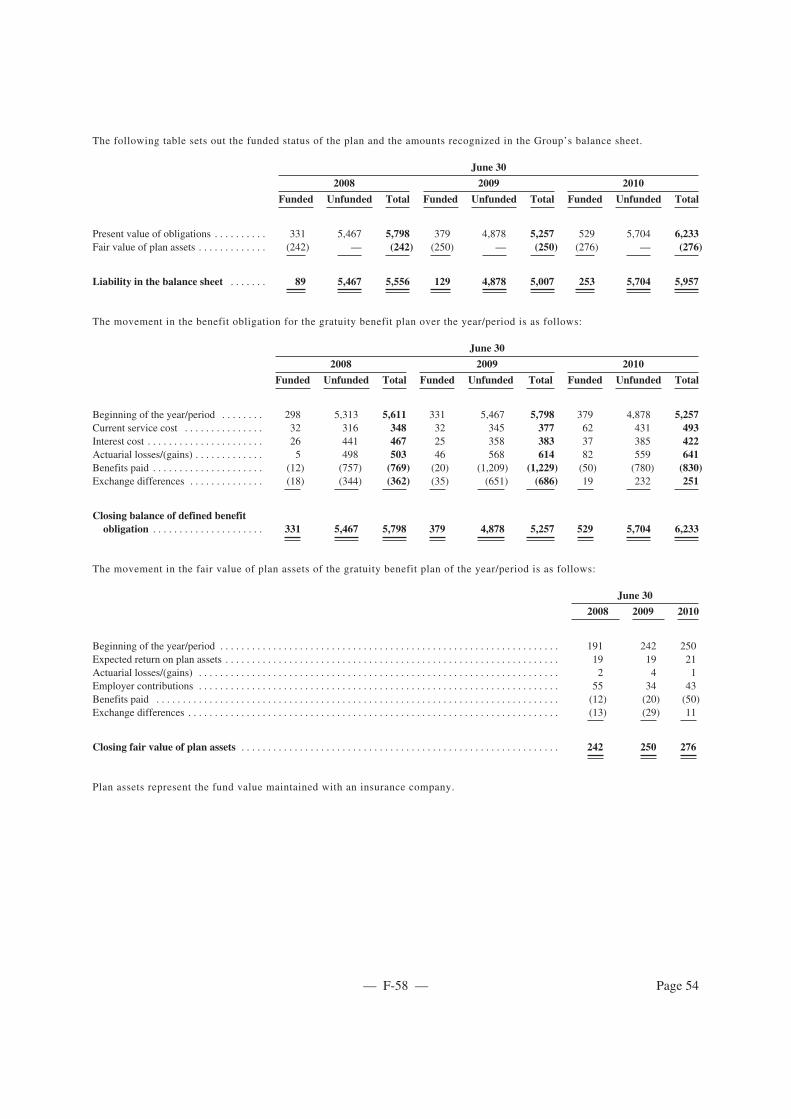
The following table sets out the funded status of the plan and the amounts recognized in the Group’s balance sheet.
June 30
2008 2009 2010
Funded Unfunded Total Funded Unfunded Total Funded Unfunded Total
Present value of obligations . . . . . . . . . . 331 5,467 5,798 379 4,878 5,257 529 5,704 6,233Fair value of plan assets . . . . . . . . . . . . . (242) — (242) (250) — (250) (276) — (276)
Liability in the balance sheet . . . . . . . 89 5,467 5,556 129 4,878 5,007 253 5,704 5,957
The movement in the benefit obligation for the gratuity benefit plan over the year/period is as follows:
June 30
2008 2009 2010
Funded Unfunded Total Funded Unfunded Total Funded Unfunded Total
Beginning of the year/period . . . . . . . . 298 5,313 5,611 331 5,467 5,798 379 4,878 5,257Current service cost . . . . . . . . . . . . . . . 32 316 348 32 345 377 62 431 493Interest cost . . . . . . . . . . . . . . . . . . . . . . 26 441 467 25 358 383 37 385 422Actuarial losses/(gains) . . . . . . . . . . . . . 5 498 503 46 568 614 82 559 641Benefits paid . . . . . . . . . . . . . . . . . . . . . (12) (757) (769) (20) (1,209) (1,229) (50) (780) (830)Exchange differences . . . . . . . . . . . . . . (18) (344) (362) (35) (651) (686) 19 232 251
Closing balance of defined benefitobligation . . . . . . . . . . . . . . . . . . . . . 331 5,467 5,798 379 4,878 5,257 529 5,704 6,233
The movement in the fair value of plan assets of the gratuity benefit plan of the year/period is as follows:
June 30
2008 2009 2010
Beginning of the year/period . . . . . . . . . . . . . . . . . . . . . . . . . . . . . . . . . . . . . . . . . . . . . . . . . . . . . . . . . . . . . . . . 191 242 250Expected return on plan assets . . . . . . . . . . . . . . . . . . . . . . . . . . . . . . . . . . . . . . . . . . . . . . . . . . . . . . . . . . . . . . . 19 19 21Actuarial losses/(gains) . . . . . . . . . . . . . . . . . . . . . . . . . . . . . . . . . . . . . . . . . . . . . . . . . . . . . . . . . . . . . . . . . . . . 2 4 1Employer contributions . . . . . . . . . . . . . . . . . . . . . . . . . . . . . . . . . . . . . . . . . . . . . . . . . . . . . . . . . . . . . . . . . . . . 55 34 43Benefits paid . . . . . . . . . . . . . . . . . . . . . . . . . . . . . . . . . . . . . . . . . . . . . . . . . . . . . . . . . . . . . . . . . . . . . . . . . . . . (12) (20) (50)Exchange differences . . . . . . . . . . . . . . . . . . . . . . . . . . . . . . . . . . . . . . . . . . . . . . . . . . . . . . . . . . . . . . . . . . . . . . (13) (29) 11
Closing fair value of plan assets . . . . . . . . . . . . . . . . . . . . . . . . . . . . . . . . . . . . . . . . . . . . . . . . . . . . . . . . . . . . 242 250 276
Plan assets represent the fund value maintained with an insurance company.
— F-58 — Page 54

The components of amounts recognized in the income statement for the gratuity benefit plan are as follows:
June 30
2008 2009 2010
Funded Unfunded Total Funded Unfunded Total Funded Unfunded Total
Current service cost . . . . . . . . . . . . . . . . 32 316 348 32 345 377 62 431 493Interest cost . . . . . . . . . . . . . . . . . . . . . . 26 441 467 25 358 383 37 385 422Expected return on plan assets . . . . . . . . (19) — (19) (19) — (19) (21) — (21)Actuarial losses/(gains) . . . . . . . . . . . . . 5 498 503 46 568 614 82 559 641
Total included in staff costs(note 28) . . . . . . . . . . . . . . . . . . . . . . 44 1,255 1,299 84 1,271 1,355 160 1,375 1,535
The actual return on plan assets for the years ended June 30, 2008, June 30, 2009 and June 30, 2010 was, respectively, US$20,
US$23 and US$22.
The principal actuarial assumptions used for the gratuity benefit plan were as follows:
June 30
2008 2009 2010
Discount rate . . . . . . . . . . . . . . . . . . . . . . . . . . . . . . . . . . . . . . . . . . . . . . . . . . . . . . . . . . . . . . . . . . . . . . . . . 8.00% 7.50% 7.50%Long-term rate of compensation increase . . . . . . . . . . . . . . . . . . . . . . . . . . . . . . . . . . . . . . . . . . . . . . . . . . . 5.00% 5.00% 5.00%Mortality rates at various age-groups
18 years . . . . . . . . . . . . . . . . . . . . . . . . . . . . . . . . . . . . . . . . . . . . . . . . . . . . . . . . . . . . . . . . . . . . . . . . . 0.000919 0.000919 0.00091923 years . . . . . . . . . . . . . . . . . . . . . . . . . . . . . . . . . . . . . . . . . . . . . . . . . . . . . . . . . . . . . . . . . . . . . . . . . 0.001090 0.001090 0.00109028 years . . . . . . . . . . . . . . . . . . . . . . . . . . . . . . . . . . . . . . . . . . . . . . . . . . . . . . . . . . . . . . . . . . . . . . . . . 0.001166 0.001166 0.00116633 years . . . . . . . . . . . . . . . . . . . . . . . . . . . . . . . . . . . . . . . . . . . . . . . . . . . . . . . . . . . . . . . . . . . . . . . . . 0.001246 0.001246 0.00124638 years . . . . . . . . . . . . . . . . . . . . . . . . . . . . . . . . . . . . . . . . . . . . . . . . . . . . . . . . . . . . . . . . . . . . . . . . . 0.001721 0.001721 0.00172143 years . . . . . . . . . . . . . . . . . . . . . . . . . . . . . . . . . . . . . . . . . . . . . . . . . . . . . . . . . . . . . . . . . . . . . . . . . 0.002602 0.002602 0.00260248 years . . . . . . . . . . . . . . . . . . . . . . . . . . . . . . . . . . . . . . . . . . . . . . . . . . . . . . . . . . . . . . . . . . . . . . . . . 0.004243 0.004243 0.00424353 years . . . . . . . . . . . . . . . . . . . . . . . . . . . . . . . . . . . . . . . . . . . . . . . . . . . . . . . . . . . . . . . . . . . . . . . . . 0.007116 0.007116 0.00711658 years . . . . . . . . . . . . . . . . . . . . . . . . . . . . . . . . . . . . . . . . . . . . . . . . . . . . . . . . . . . . . . . . . . . . . . . . . 0.011025 — —
The Group assesses these assumptions with its projected long-term plans of growth and prevalent industry standards. The
mortality rates used are as published by one of the leading life insurance companies in India.
(b) Compensated absences
The Group permits encashment of leave accumulated by their employees on retirement, separation and during the course of
service. The liability for encashment of leave is determined and provided on the basis of an actuarial valuation performed by
an independent actuary at each balance sheet date. This plan is completely un-funded.
(c) Provident Fund
The employees of the Group participate in a provident fund plan, a defined contribution plan. The Group makes annual
contributions based on a specific percentage of salary of each covered employee to a government recognized provident fund.
The Group does not have any further obligation to the provident fund plan beyond making such contributions. Upon retirement
or separation, an employee becomes entitled to this lump sum benefit, which is paid directly to the employee by the fund.
— F-59 — Page 55

(d) Superannuation fund
The employees of the Group participate in a superannuation fund plan, a defined contribution plan. The Group makes annual
contributions based on a specific percentage of salary of each covered employee to a government recognized fund. The Group
does not have any further obligation to this plan beyond making such contributions. Upon retirement or separation, an
employee becomes entitled to this lump sum benefit, which is paid directly to the employee by the fund.
24. Other operating income
Year ended June 30
2008 2009 2010
Income from insurance claims . . . . . . . . . . . . . . . . . . . . . . . . . . . . . . . . . . . . . . . . . . . . . . . . . . . . . . . . . . . . . . . . 513 321 —Gain on disposal of property, plant and equipment . . . . . . . . . . . . . . . . . . . . . . . . . . . . . . . . . . . . . . . . . . . . . . . . 11 262 6Sale of scrap . . . . . . . . . . . . . . . . . . . . . . . . . . . . . . . . . . . . . . . . . . . . . . . . . . . . . . . . . . . . . . . . . . . . . . . . . . . . . . 510 588 562Export incentive . . . . . . . . . . . . . . . . . . . . . . . . . . . . . . . . . . . . . . . . . . . . . . . . . . . . . . . . . . . . . . . . . . . . . . . . . . . — — 2,227Miscellaneous income . . . . . . . . . . . . . . . . . . . . . . . . . . . . . . . . . . . . . . . . . . . . . . . . . . . . . . . . . . . . . . . . . . . . . . 507 1,488 2,054
1,541 2,659 4,849
25. Raw materials and consumables used
Year ended June 30
2008 2009 2010
Raw materials (pulp and wood) . . . . . . . . . . . . . . . . . . . . . . . . . . . . . . . . . . . . . . . . . . . . . . . . . . . . . . . . . . . . . 168,258 138,699 220,968Stores and consumables . . . . . . . . . . . . . . . . . . . . . . . . . . . . . . . . . . . . . . . . . . . . . . . . . . . . . . . . . . . . . . . . . . . 74,645 66,818 106,505Power and fuel . . . . . . . . . . . . . . . . . . . . . . . . . . . . . . . . . . . . . . . . . . . . . . . . . . . . . . . . . . . . . . . . . . . . . . . . . . 73,554 52,022 75,381Change in finished goods stock . . . . . . . . . . . . . . . . . . . . . . . . . . . . . . . . . . . . . . . . . . . . . . . . . . . . . . . . . . . . . (2,309) (5,000) (1,547)Other . . . . . . . . . . . . . . . . . . . . . . . . . . . . . . . . . . . . . . . . . . . . . . . . . . . . . . . . . . . . . . . . . . . . . . . . . . . . . . . . . . 7,119 6,158 5,701
Total . . . . . . . . . . . . . . . . . . . . . . . . . . . . . . . . . . . . . . . . . . . . . . . . . . . . . . . . . . . . . . . . . . . . . . . . . . . . . . . . . . 321,267 258,697 407,008
Stores and consumables primarily include chemicals and water.
The Group has power purchase agreement at two of its units with Avantha power and Infrastructure Limited. This arrangement
is considered as an operating lease. Payments for other elements in the arrangement is not separated from lease payments and
all payments have been disclosed under power and fuel. The total expense for power under this arrangement for the years
ended June 30, 2008, June 30, 2009 and June 30, 2010 is US$39,258, US$35,897 and US$51,521 respectively.
The Group is purchasing Calcium Carbonate at two of its units under an agreement with Imerys New Quest India Pvt. Ltd &
SMI New Quest India Pvt. Ltd. This arrangement is considered as an operating lease. Payments for other elements in the
arrangement is not separated from lease payments and all payments have been disclosed under Stores and consumables. The
total expense for purchase of Calcium carbonate under this arrangement for the years ended June 30, 2008, June 30, 2009 and
June 30, 2010 is US$10,423, US$9,482 and US$17,847 respectively.
— F-60 — Page 56

26. Other operating expenses
Year ended June 30
2008 2009 2010
Repair and maintenance . . . . . . . . . . . . . . . . . . . . . . . . . . . . . . . . . . . . . . . . . . . . . . . . . . . . . . . . . . . . . . . . . . . . . . 15,724 14,309 9,539Distribution expenses . . . . . . . . . . . . . . . . . . . . . . . . . . . . . . . . . . . . . . . . . . . . . . . . . . . . . . . . . . . . . . . . . . . . . . . . 4,818 7,897 12,944Professional fees . . . . . . . . . . . . . . . . . . . . . . . . . . . . . . . . . . . . . . . . . . . . . . . . . . . . . . . . . . . . . . . . . . . . . . . . . . . . 984 3,036 1,594Travel costs . . . . . . . . . . . . . . . . . . . . . . . . . . . . . . . . . . . . . . . . . . . . . . . . . . . . . . . . . . . . . . . . . . . . . . . . . . . . . . . . 4,936 4,335 4,700Other . . . . . . . . . . . . . . . . . . . . . . . . . . . . . . . . . . . . . . . . . . . . . . . . . . . . . . . . . . . . . . . . . . . . . . . . . . . . . . . . . . . . . 11,057 3,275 6,405Total . . . . . . . . . . . . . . . . . . . . . . . . . . . . . . . . . . . . . . . . . . . . . . . . . . . . . . . . . . . . . . . . . . . . . . . . . . . . . . . . . . . . . 37,519 32,852 35,182
27. Additional consideration paid for acquisition
The Group had acquired SFI in March 2007. Part of the consideration was contingently payable based on finalization of
amounts in the financial statements of the acquiree. During the year ended June 30, 2008, additional consideration became
payable consequent to the finalization of these amounts. As this acquisition had resulted in a negative goodwill, additional
consideration paid was charged to expense during the year ended June 30, 2008.
28. Employee benefit expense
Year ended June 30
2008 2009 2010
Wages and salaries . . . . . . . . . . . . . . . . . . . . . . . . . . . . . . . . . . . . . . . . . . . . . . . . . . . . . . . . . . . . . . . . . . . . . . . . . . 32,570 30,980 32,662Pension costs — defined benefit plans (note 23) . . . . . . . . . . . . . . . . . . . . . . . . . . . . . . . . . . . . . . . . . . . . . . . . . . . 1,491 1,586 1,654Pension costs — defined contribution plans (note 23) . . . . . . . . . . . . . . . . . . . . . . . . . . . . . . . . . . . . . . . . . . . . . . . 2,068 2,285 2,446Welfare expenses . . . . . . . . . . . . . . . . . . . . . . . . . . . . . . . . . . . . . . . . . . . . . . . . . . . . . . . . . . . . . . . . . . . . . . . . . . . 1,027 2,063 1,939
37,156 36,914 38,701
Wages and salaries include voluntary severance redundancy costs totalling US$4,422 for the year ended June 30, 2009. No
other periods include such costs.
29. Distribution on reorganization of the Group
As disclosed in note 1, on March 19, 2008, 99.99% of the shares in BGPPL were transferred from Ballarpur to BPH for a cash
consideration of US$111,193. Further, in connection with this transaction, BPH purchased on March 19, 2008 US$63,806 and
on June 20, 2008 US$291,705 of the CCDs from Ballarpur.
30. Finance income and costs
Year ended June 30
2008 2009 2010
Finance incomeInterest income on bank deposits . . . . . . . . . . . . . . . . . . . . . . . . . . . . . . . . . . . . . . . . . . . . . . . . . . . . . . . . . . . . . . . . . . . 595 628 942Other income . . . . . . . . . . . . . . . . . . . . . . . . . . . . . . . . . . . . . . . . . . . . . . . . . . . . . . . . . . . . . . . . . . . . . . . . . . . . . . . . . . — 1,852 1,835
Total finance income . . . . . . . . . . . . . . . . . . . . . . . . . . . . . . . . . . . . . . . . . . . . . . . . . . . . . . . . . . . . . . . . . . . . . . . . . . . 595 2,480 2,777
— F-61 — Page 57

Finance costsInterest on:— long-term bank borrowings . . . . . . . . . . . . . . . . . . . . . . . . . . . . . . . . . . . . . . . . . . . . . . . . . . . . . . . . . . . . . . . (5,825) (32,041) (32,795)— working capital term loans . . . . . . . . . . . . . . . . . . . . . . . . . . . . . . . . . . . . . . . . . . . . . . . . . . . . . . . . . . . . . . . . — (1,078) (2,083)— interest rate swaps . . . . . . . . . . . . . . . . . . . . . . . . . . . . . . . . . . . . . . . . . . . . . . . . . . . . . . . . . . . . . . . . . . . . . . — (2,867) (9,348)— 9% CCDs . . . . . . . . . . . . . . . . . . . . . . . . . . . . . . . . . . . . . . . . . . . . . . . . . . . . . . . . . . . . . . . . . . . . . . . . . . . . . (14,118) — (1,761)— loans from other related parties . . . . . . . . . . . . . . . . . . . . . . . . . . . . . . . . . . . . . . . . . . . . . . . . . . . . . . . . . . . . (1,494) (4,806) (4,217)Unwind of discount on:— SFI seller’s note . . . . . . . . . . . . . . . . . . . . . . . . . . . . . . . . . . . . . . . . . . . . . . . . . . . . . . . . . . . . . . . . . . . . . . . . (4,930) (489) —— sales tax deferment loan . . . . . . . . . . . . . . . . . . . . . . . . . . . . . . . . . . . . . . . . . . . . . . . . . . . . . . . . . . . . . . . . . . (163) (821) (776)Net fair value gain/(loss) on interest rate swaps (note 12) . . . . . . . . . . . . . . . . . . . . . . . . . . . . . . . . . . . . . . . . . . — (14,762) (4,346)Net foreign exchange (loss)/gain on financing activities (note 12) . . . . . . . . . . . . . . . . . . . . . . . . . . . . . . . . . . . (10,290) (26,834) 32,540Realized loss on forward covers . . . . . . . . . . . . . . . . . . . . . . . . . . . . . . . . . . . . . . . . . . . . . . . . . . . . . . . . . . . . . . (6,074)Expense of unamortized transaction costs . . . . . . . . . . . . . . . . . . . . . . . . . . . . . . . . . . . . . . . . . . . . . . . . . . . . . . (3,051) — (17,552)Early debt retirement costs . . . . . . . . . . . . . . . . . . . . . . . . . . . . . . . . . . . . . . . . . . . . . . . . . . . . . . . . . . . . . . . . . . (2,152) — —Bank charges . . . . . . . . . . . . . . . . . . . . . . . . . . . . . . . . . . . . . . . . . . . . . . . . . . . . . . . . . . . . . . . . . . . . . . . . . . . . . (855) (983) (1,411)
Finance costs . . . . . . . . . . . . . . . . . . . . . . . . . . . . . . . . . . . . . . . . . . . . . . . . . . . . . . . . . . . . . . . . . . . . . . . . . . . . (42,878) (90,755) (41,749)
Less: Amounts capitalized on qualifying assets . . . . . . . . . . . . . . . . . . . . . . . . . . . . . . . . . . . . . . . . . . . . . . . . . . 1,645 4,403 829
Total finance costs . . . . . . . . . . . . . . . . . . . . . . . . . . . . . . . . . . . . . . . . . . . . . . . . . . . . . . . . . . . . . . . . . . . . . . . . (41,233) (86,352) (40,920)
Net finance costs . . . . . . . . . . . . . . . . . . . . . . . . . . . . . . . . . . . . . . . . . . . . . . . . . . . . . . . . . . . . . . . . . . . . . . . . . (40,638) (83,872) (38,143)
The table below shows the applicable capitalization rates in respect of borrowing costs capitalized on qualifying assets:
Year ended June 30
2008 2009 2010
Capitalization rate . . . . . . . . . . . . . . . . . . . . . . . . . . . . . . . . . . . . . . . . . . . . . . . . . . . . . . . . . . . . . . . . . . . . . . . . . . . . . . . 9.1% 11.0% 3.4%
31. Income tax expense
Year ended June 30
2008 2009 2010
Current tax expense . . . . . . . . . . . . . . . . . . . . . . . . . . . . . . . . . . . . . . . . . . . . . . . . . . . . . . . . . . . . . . . . . . . . . . . . . 6,255 4,089 4,723
Deferred tax related to:Temporary differences . . . . . . . . . . . . . . . . . . . . . . . . . . . . . . . . . . . . . . . . . . . . . . . . . . . . . . . . . . . . . . . . . . . 6,521 (2,125) 5,872Recognition of tax losses carried forward from prior years . . . . . . . . . . . . . . . . . . . . . . . . . . . . . . . . . . . . . . . — — (10,377)Change in tax rate . . . . . . . . . . . . . . . . . . . . . . . . . . . . . . . . . . . . . . . . . . . . . . . . . . . . . . . . . . . . . . . . . . . . . . . — — 152
Deferred tax expense/(credit) . . . . . . . . . . . . . . . . . . . . . . . . . . . . . . . . . . . . . . . . . . . . . . . . . . . . . . . . . . . . . . . . . . 6,521 (2,125) (4,355)
Income tax expense/(credit) . . . . . . . . . . . . . . . . . . . . . . . . . . . . . . . . . . . . . . . . . . . . . . . . . . . . . . . . . . . . . . . . . . 12,776 1,964 368
— F-62 — Page 58
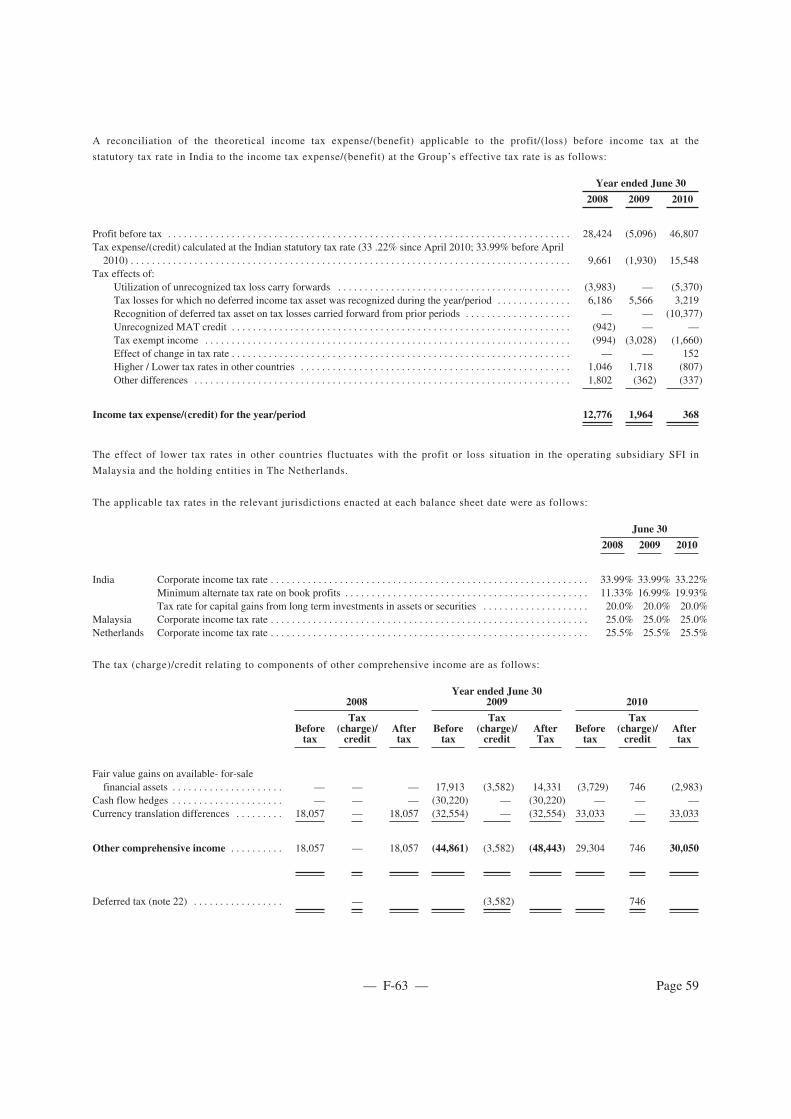
A reconciliation of the theoretical income tax expense/(benefit) applicable to the profit/(loss) before income tax at the
statutory tax rate in India to the income tax expense/(benefit) at the Group’s effective tax rate is as follows:
Year ended June 30
2008 2009 2010
Profit before tax . . . . . . . . . . . . . . . . . . . . . . . . . . . . . . . . . . . . . . . . . . . . . . . . . . . . . . . . . . . . . . . . . . . . . . . . . . . . 28,424 (5,096) 46,807Tax expense/(credit) calculated at the Indian statutory tax rate (33 .22% since April 2010; 33.99% before April2010) . . . . . . . . . . . . . . . . . . . . . . . . . . . . . . . . . . . . . . . . . . . . . . . . . . . . . . . . . . . . . . . . . . . . . . . . . . . . . . . . . . . 9,661 (1,930) 15,548
Tax effects of:Utilization of unrecognized tax loss carry forwards . . . . . . . . . . . . . . . . . . . . . . . . . . . . . . . . . . . . . . . . . . . . (3,983) — (5,370)Tax losses for which no deferred income tax asset was recognized during the year/period . . . . . . . . . . . . . . 6,186 5,566 3,219Recognition of deferred tax asset on tax losses carried forward from prior periods . . . . . . . . . . . . . . . . . . . . — — (10,377)Unrecognized MAT credit . . . . . . . . . . . . . . . . . . . . . . . . . . . . . . . . . . . . . . . . . . . . . . . . . . . . . . . . . . . . . . . . (942) — —Tax exempt income . . . . . . . . . . . . . . . . . . . . . . . . . . . . . . . . . . . . . . . . . . . . . . . . . . . . . . . . . . . . . . . . . . . . . (994) (3,028) (1,660)Effect of change in tax rate . . . . . . . . . . . . . . . . . . . . . . . . . . . . . . . . . . . . . . . . . . . . . . . . . . . . . . . . . . . . . . . . — — 152Higher / Lower tax rates in other countries . . . . . . . . . . . . . . . . . . . . . . . . . . . . . . . . . . . . . . . . . . . . . . . . . . . 1,046 1,718 (807)Other differences . . . . . . . . . . . . . . . . . . . . . . . . . . . . . . . . . . . . . . . . . . . . . . . . . . . . . . . . . . . . . . . . . . . . . . . 1,802 (362) (337)
Income tax expense/(credit) for the year/period 12,776 1,964 368
The effect of lower tax rates in other countries fluctuates with the profit or loss situation in the operating subsidiary SFI in
Malaysia and the holding entities in The Netherlands.
The applicable tax rates in the relevant jurisdictions enacted at each balance sheet date were as follows:
June 30
2008 2009 2010
India Corporate income tax rate . . . . . . . . . . . . . . . . . . . . . . . . . . . . . . . . . . . . . . . . . . . . . . . . . . . . . . . . . . . . 33.99% 33.99% 33.22%Minimum alternate tax rate on book profits . . . . . . . . . . . . . . . . . . . . . . . . . . . . . . . . . . . . . . . . . . . . . . 11.33% 16.99% 19.93%Tax rate for capital gains from long term investments in assets or securities . . . . . . . . . . . . . . . . . . . . 20.0% 20.0% 20.0%
Malaysia Corporate income tax rate . . . . . . . . . . . . . . . . . . . . . . . . . . . . . . . . . . . . . . . . . . . . . . . . . . . . . . . . . . . . 25.0% 25.0% 25.0%Netherlands Corporate income tax rate . . . . . . . . . . . . . . . . . . . . . . . . . . . . . . . . . . . . . . . . . . . . . . . . . . . . . . . . . . . . 25.5% 25.5% 25.5%
The tax (charge)/credit relating to components of other comprehensive income are as follows:
Year ended June 302008 2009 2010
Beforetax
Tax(charge)/credit
Aftertax
Beforetax
Tax(charge)/credit
AfterTax
Beforetax
Tax(charge)/credit
Aftertax
Fair value gains on available- for-salefinancial assets . . . . . . . . . . . . . . . . . . . . . — — — 17,913 (3,582) 14,331 (3,729) 746 (2,983)
Cash flow hedges . . . . . . . . . . . . . . . . . . . . . — — — (30,220) — (30,220) — — —Currency translation differences . . . . . . . . . 18,057 — 18,057 (32,554) — (32,554) 33,033 — 33,033
Other comprehensive income . . . . . . . . . . 18,057 — 18,057 (44,861) (3,582) (48,443) 29,304 746 30,050
Deferred tax (note 22) . . . . . . . . . . . . . . . . . — (3,582) 746
— F-63 — Page 59

32. Net foreign exchange gains/(losses)
The exchange differences (charged)/credited to the income statement are included as follows:
Year ended June 30
2008 2009 2010
Net foreign exchange (losses)/gains on operating activities (note 25) . . . . . . . . . . . . . . . . . . . . . . . . . . . . . . . . . . (2,650) 3,281 6,162Realized loss on forward cover . . . . . . . . . . . . . . . . . . . . . . . . . . . . . . . . . . . . . . . . . . . . . . . . . . . . . . . . . . . . . . . — (6,074) —Net foreign exchange (loss)/gain on financing activities (note 30) . . . . . . . . . . . . . . . . . . . . . . . . . . . . . . . . . . . . (10,290) (26,834) 32,540
(12,940) (29,627) 38,702
33. Earnings per share
(a) Basic
Basic earnings per share is calculated by dividing the profit attributable to equity holders of the Company by the weighted
average number of ordinary shares in issue during the year/period.
Year ended June 30
2008 2009 2010
Profit/(loss) attributable to owners of the parent . . . . . . . . . . . . . . . . . . . . . . . . . . . . . . . . . . . . . . . . . . . . . . . . . . . . 15,286 (6,901) 45,726
Weighted average number of ordinary shares in issue (thousands) . . . . . . . . . . . . . . . . . . . . . . . . . . . . . . . . . . . . . . 1,530 1,822 1,865
(b) Diluted
Diluted earnings per share is calculated by adjusting the weighted average number of ordinary shares outstanding to assume
conversion of all dilutive potential ordinary shares. The Company has no dilutive potential shares and accordingly diluted
earnings per share is the same as basic earnings per share.
34. Cash generated from operations
Years ended June 30
Note 2008 2009 2010
Profit for the year/period before income tax . . . . . . . . . . . . . . . . . . . . . . . . . . . . . . . . . . . . . . . . . . . . . . . 28,424 (5,096) 46,807Adjustments for:Depreciation . . . . . . . . . . . . . . . . . . . . . . . . . . . . . . . . . . . . . . . . . . . . . . . . . . . . . . . . . . . . . . . . . . . . . . . 6 32,071 31,735 39,384Gain on change in fair value of biological assets . . . . . . . . . . . . . . . . . . . . . . . . . . . . . . . . . . . . . . . . . . . 8a (13,448) (10,955) (4,900)Profit on disposal of property, plant and equipment . . . . . . . . . . . . . . . . . . . . . . . . . . . . . . . . . . . . . . . . . 24 (11) (262) (6)Defined benefit obligation expense . . . . . . . . . . . . . . . . . . . . . . . . . . . . . . . . . . . . . . . . . . . . . . . . . . . . . . 23 1,491 1,586 1,654Other (gains)/losses . . . . . . . . . . . . . . . . . . . . . . . . . . . . . . . . . . . . . . . . . . . . . . . . . . . . . . . . . . . . . . . . . . 12 — (27,281) 10,379Finance costs — net . . . . . . . . . . . . . . . . . . . . . . . . . . . . . . . . . . . . . . . . . . . . . . . . . . . . . . . . . . . . . . . . . 30 40,638 83,872 38,143Bad debts provision and write offs . . . . . . . . . . . . . . . . . . . . . . . . . . . . . . . . . . . . . . . . . . . . . . . . . . . . . . — 121 41Inventory provision and write offs . . . . . . . . . . . . . . . . . . . . . . . . . . . . . . . . . . . . . . . . . . . . . . . . . . . . . . — 233 111Changes in working capital (excluding the effects of acquisition and exchange differences onconsolidation):
— F-64 — Page 60

Decrease/(increase) in inventories . . . . . . . . . . . . . . . . . . . . . . . . . . . . . . . . . . . . . . . . . . . . . . . . . . . . . . . . . . . . (9,132) 10,898 (48,997)Decrease/(increase) in trade and other receivables . . . . . . . . . . . . . . . . . . . . . . . . . . . . . . . . . . . . . . . . . . . . . . . (4,690) 6,557 (24,749)Increase/(decrease) in trade and other payables . . . . . . . . . . . . . . . . . . . . . . . . . . . . . . . . . . . . . . . . . . . . . . . . . 26,468 39,479 36,778
Cash generated from operations 101,811 130,887 94,645
35. Contingencies
The Group is currently involved in a number of legal cases. Although it is not possible to predict the outcome of the pending
litigation with accuracy, the Group believes, based on legal opinions received, that the Group has meritorious defences to the
claims. The Directors believe the pending actions will not require outflow of resources embodying economic benefits and will
not have a material adverse effect upon the results of the operations, cash flows or financial condition of the Group.
Ballarpur production unit
The unit has various matters in dispute with the Central Excise Department at Nagpur. These are:
(a) During September 1996 to December 2000 the Central Excise Department issued various notices, requiring the
unit to show cause, in respect of bookkeeping, sales value and other matters in relation to pulp which had been
transferred to a production unit of Ballarpur. On two of the notices, the unit has appealed to the Central Excise
and Service Tax Appellate Tribunal (the “Tribunal”) and the Tribunal has ruled in favor of the unit. The Central
Excise Department has appealed the Tribunal’s decision to the High Court and the Supreme Court and a hearing
is awaited in those courts. The cumulative amount of the contingent liability as at June 30, 2010 was US$4,822.
(b) During March 2006 to March 2010 the Central Excise Department claimed that the benefit received by the unit
under the sales tax deferral scheme represents additional consideration and is liable for excise duty. The unit has
appealed to the Tribunal and the TribunaI has granted unconditional stay for payment of any excise duty and
associated interest. The cumulative amount of the contingent liability as at June 30, 2010 was US$3,536; and
(c) During January 2001 to February 2003 the Central Excise Department issued various notices relating to the
maintenance of separate books of account for the manufacture of paper using unconventional raw materials. The
cumulative amount of the contingent liability as at June 30, 2010 was US$787.
In addition the unit has other disputed amounts with the Nagpur Central Excise Department totalling US$1,737 and which are
at various stages of dispute and appeal.
The water supply charges from Wardha river have been revised with retrospective effect. The Collector, Chandrapur has raised
a demand with arrears for consolidated amount of US$1,427 for periods to May 2004. The unit has filed writ petition before
High Court at Nagpur. The High Court has granted stay and the petition is pending for final arguments and order.
During August 2009 to September 2009 the Chandrapur Forest Conservation Department revised the bamboo royalty rate
payable by the unit with retrospective effect for the period from 2005 to 2006 and has demanded a total US$17,084 additional
payment as at June 30, 2010. The unit has petitioned the Nagpur High Court challenging the revision of the royalty rate and
judgment is pending.
Kamalapuram production unit
a. In February 2002 the Andhra Pradesh Electricity Regulatory Commission (“APERC”) sought to levy on the unit a
grid support charge of INR0.50 per unit of power generated. The unit appealed to the High Court of
Andhra Pradesh and the court set aside APERC’s levy. APERC and AP Transco have appealed to the Supreme
Court of India against the High Court of Andhra Pradesh’s order. The
— F-65 — Page 61

matter is pending before the Supreme Court. The cumulative amount of the contingent liability is US$2,559 as at June 30,
2010.
b. In October 2003 the Government of Andhra Pradesh passed an ordinance levying electricity duty on captive
power generation at the rate of INR0.25 per unit. The unit has petitioned the High Court of Andhra Pradesh
against this ordinance. The High Court had made an interim order staying payment of the levy and the matter is
pending for hearing. The cumulative amount of the liability is US$2,918 as at June 30, 2010.
c. In October 2005 the Andhra Pradesh Forest Department had demanded US$1,606 in respect of royalty, extraction
charges, interest, penalties and sales tax. The unit has provided evidence to the Andhra Pradesh District Collector
that these amounts have already been paid. The Andhra Pradesh District Collector has directed the Andhra
Pradesh Forest Department to reconcile its accounts with the unit. The demand remains pending on this
reconciliation.
d. Claims filed by the customers not acknowledged as debt — US$1,129.
SFI production unit
The SFI unit has two legal cases against it, one by UNP Plywood for US$37,948 and another by Harapan Permai for
US$54,314. These claims arose from the termination by the SFI unit of the timber charge agreements entered into by SFI prior
to the acquisition by BPH. The Company believes that these agreements were illegal and unenforceable. Both the cases have
been decided in favor of the SFI unit by lower court. However, both parties have appealed in court of appeal. The Company
has lost its appeal in respect of the claim by UNP Plywood and a ruling on the quantum of damages is due to be heard in July
2011. In case of Harapan Permai, Hon’ble High Court granted SFI stay application of all the legal proceedings on the basis of
hearing held on May 25, 2011. The next hearing is due to be heard on July 19, 2011.
The Company retained US$90,983 from the purchase consideration payable for the acquisition of SFI which has been
subsequently deposited in an escrow account Management believes that amount retained is sufficient to pay the eventual
outcome of the claims and any additional amounts due would, under the sale and purchase agreement for the SFI unit, be
required to be paid by the seller, Lion Forest Industries Berhad (“LFIB”).
In December 2008 back pay labour claims were filed by 1,070 employees amounting to US$6,898. However, the former
holding company, LFIB, of the SFI unit, has by a letter dated December 30, 2008 confirmed to the SFI unit that LFIB will
accept responsibility and lead the conduct of the defense of the legal claims of employees.
There are various other matters pending before various authorities and courts, the outcome of which, are not expected to result
in significant claims against the Group.
36. Commitments
(a) Capital commitments
Capital expenditure contracted for at the balance sheet date is as follows:
June 30
2008 2009 2010
Purchase of property, plant and equipment . . . . . . . . . . . . . . . . . . . . . . . . . . . . . . . . . . . . . . . . . . . . . . . . . . . . . 182,421 124,752 123,691
— F-66 — Page 62

(b) Operating lease commitments
The Group did not have significant non-cancellable operating lease arrangements during the reporting period.
37. Related party transactions
The Group is controlled by BIH, which owns 79.53% of the Company as on June 30, 2010. The ultimate parent of the Group is
Ballarpur. Ballarpur is controlled by the Avantha Group, whose subsidiaries and affiliates are therefore also considered related
parties to the Group.
The following transactions were carried out with the related parties:
(a) Borrowings from related parties
Refer to note 21.2. for detailed information about borrowings from related parties at each balance sheet date.
(b) Available-for-sale financial asset
Refer to note 11 for detailed information about the purchase of shares in Avantha Power & Infrastructure Limited from
Ballarpur.
(c) Sale of goods and services
The Group sells manufactured paper pulp, paper and excess electricity to other related parties. Income from such sales is as
follows:
Year ended June 30
2008 2009 2010
Ballarpur Industries Limited . . . . . . . . . . . . . . . . . . . . . . . . . . . . . . . . . . . . . . . . . . . . . . . . . . . . . . . . . . . . . . . . . . . 18,204 19,405 11,469Imerys New Quest India Pvt. Ltd. . . . . . . . . . . . . . . . . . . . . . . . . . . . . . . . . . . . . . . . . . . . . . . . . . . . . . . . . . . . . . . 922 1,084 1,486Avantha Power and Infrastructure Limited . . . . . . . . . . . . . . . . . . . . . . . . . . . . . . . . . . . . . . . . . . . . . . . . . . . . . . . . 692 993 270APR Sacs Limited . . . . . . . . . . . . . . . . . . . . . . . . . . . . . . . . . . . . . . . . . . . . . . . . . . . . . . . . . . . . . . . . . . . . . . . . . . . 4,656 3 4,341Biltech Building Elements Limited . . . . . . . . . . . . . . . . . . . . . . . . . . . . . . . . . . . . . . . . . . . . . . . . . . . . . . . . . . . . . . 32 4 —Crompton Greaves Ltd. . . . . . . . . . . . . . . . . . . . . . . . . . . . . . . . . . . . . . . . . . . . . . . . . . . . . . . . . . . . . . . . . . . . . . . . — 32 —APR Sacs Limited . . . . . . . . . . . . . . . . . . . . . . . . . . . . . . . . . . . . . . . . . . . . . . . . . . . . . . . . . . . . . . . . . . . . . . . . . . . — — —Avantha Holdings Limited . . . . . . . . . . . . . . . . . . . . . . . . . . . . . . . . . . . . . . . . . . . . . . . . . . . . . . . . . . . . . . . . . . . . — 3,582 —
24,506 25,103 17,566
— F-67 — Page 63

(d) Purchase of goods and services
The Group primarily purchases paper pulp, electricity and chemicals from related parties. The costs for these purchases in the
reporting period were as follows:
Year ended June 30
2008 2009 2010
Ballarpur Industries Limited . . . . . . . . . . . . . . . . . . . . . . . . . . . . . . . . . . . . . . . . . . . . . . . . . . . . . . . . . . . . . 1,731 548 3,216Biltech Building Elements Limited . . . . . . . . . . . . . . . . . . . . . . . . . . . . . . . . . . . . . . . . . . . . . . . . . . . . . . . . 345 — 218SMI New Quest Inda Pvt. Ltd . . . . . . . . . . . . . . . . . . . . . . . . . . . . . . . . . . . . . . . . . . . . . . . . . . . . . . . . . . . . — — 2,326Avantha Holdings Limited . . . . . . . . . . . . . . . . . . . . . . . . . . . . . . . . . . . . . . . . . . . . . . . . . . . . . . . . . . . . . . 2,158 6,044 27,852Imerys New Quest Inda Pvt. Ltd . . . . . . . . . . . . . . . . . . . . . . . . . . . . . . . . . . . . . . . . . . . . . . . . . . . . . . . . . . 10,423 9,482 15,521Avantha Power & Infrastructure Ltd . . . . . . . . . . . . . . . . . . . . . . . . . . . . . . . . . . . . . . . . . . . . . . . . . . . . . . 39,258 35,897 51,521Crompton Greaves Ltd. . . . . . . . . . . . . . . . . . . . . . . . . . . . . . . . . . . . . . . . . . . . . . . . . . . . . . . . . . . . . . . . . . 1,931 2,580 171Solaris Chemitech Ltd. . . . . . . . . . . . . . . . . . . . . . . . . . . . . . . . . . . . . . . . . . . . . . . . . . . . . . . . . . . . . . . . . . 1 12 14Mirablle Trading Pte. Ltd. . . . . . . . . . . . . . . . . . . . . . . . . . . . . . . . . . . . . . . . . . . . . . . . . . . . . . . . . . . . . . . — 25,581 33,438Saraswati Travels Private Limited . . . . . . . . . . . . . . . . . . . . . . . . . . . . . . . . . . . . . . . . . . . . . . . . . . . . . . . . 72 369 645Leading Line Merchant Traders (P) Limited . . . . . . . . . . . . . . . . . . . . . . . . . . . . . . . . . . . . . . . . . . . . . . . . 81 793 797BILT Tree Tech . . . . . . . . . . . . . . . . . . . . . . . . . . . . . . . . . . . . . . . . . . . . . . . . . . . . . . . . . . . . . . . . . . . . . . 24 13 33Avantha Technologies Limited . . . . . . . . . . . . . . . . . . . . . . . . . . . . . . . . . . . . . . . . . . . . . . . . . . . . . . . . . . . 38 133 182ASA Agencies Pvt. Ltd. . . . . . . . . . . . . . . . . . . . . . . . . . . . . . . . . . . . . . . . . . . . . . . . . . . . . . . . . . . . . . . . . 124 — 117
56,186 81,452 136,051
(e) Interest expense to related parties
For the year ended June 30
2008 2009 2010
Ballarpur Industries Limited . . . . . . . . . . . . . . . . . . . . . . . . . . . . . . . . . . . . . . . . . . . . . . . . . . . . . . . . . . . 14,118 — 1,761Ballarpur International Holdings B.V. . . . . . . . . . . . . . . . . . . . . . . . . . . . . . . . . . . . . . . . . . . . . . . . . . . . . 1,494 4,806 1,267Avanatha International Asset BV . . . . . . . . . . . . . . . . . . . . . . . . . . . . . . . . . . . . . . . . . . . . . . . . . . . . . . . — — 2,950
15,612 4,806 5,978
— F-68 — Page 64

(f) Year/period end balances arising from transactions with related parties
Receivables:
Year ended June 30
2008 2009 2010
Ballarpur Industries Limited . . . . . . . . . . . . . . . . . . . . . . . . . . . . . . . . . . . . . . . . . . . . . . . . . . . . . . . . . . . 7,581 30 —Ballarpur International Holdings B.V. . . . . . . . . . . . . . . . . . . . . . . . . . . . . . . . . . . . . . . . . . . . . . . . . . . . . 345 347 39Biltech Building Elements Limited . . . . . . . . . . . . . . . . . . . . . . . . . . . . . . . . . . . . . . . . . . . . . . . . . . . . . . 1 3 1Avantha Holdings Limited . . . . . . . . . . . . . . . . . . . . . . . . . . . . . . . . . . . . . . . . . . . . . . . . . . . . . . . . . . . . . 35 56 —Crompton Greaves Ltd. . . . . . . . . . . . . . . . . . . . . . . . . . . . . . . . . . . . . . . . . . . . . . . . . . . . . . . . . . . . . . . . — 17 —Mirablle Trading Pte. Ltd. . . . . . . . . . . . . . . . . . . . . . . . . . . . . . . . . . . . . . . . . . . . . . . . . . . . . . . . . . . . . . — 1,095 —BILT Tree Tech . . . . . . . . . . . . . . . . . . . . . . . . . . . . . . . . . . . . . . . . . . . . . . . . . . . . . . . . . . . . . . . . . . . . . 77 5 —Avantha Power & Infrastructure Ltd . . . . . . . . . . . . . . . . . . . . . . . . . . . . . . . . . . . . . . . . . . . . . . . . . . . . . — — 195APR Sacs Limited . . . . . . . . . . . . . . . . . . . . . . . . . . . . . . . . . . . . . . . . . . . . . . . . . . . . . . . . . . . . . . . . . . . 13 14 1,327Ballarpur Specialty Paper Holdings Limited . . . . . . . . . . . . . . . . . . . . . . . . . . . . . . . . . . . . . . . . . . . . . . . — — 4Ballarpur Packing Holdings Limited . . . . . . . . . . . . . . . . . . . . . . . . . . . . . . . . . . . . . . . . . . . . . . . . . . . . . — — 2TAF Asset 2 B.V. . . . . . . . . . . . . . . . . . . . . . . . . . . . . . . . . . . . . . . . . . . . . . . . . . . . . . . . . . . . . . . . . . . . — — 4Vitringa B.V. . . . . . . . . . . . . . . . . . . . . . . . . . . . . . . . . . . . . . . . . . . . . . . . . . . . . . . . . . . . . . . . . . . . . . . . — — 10Avantha International Holdings . . . . . . . . . . . . . . . . . . . . . . . . . . . . . . . . . . . . . . . . . . . . . . . . . . . . . . . . . — — 1Avanatha International Asset BV . . . . . . . . . . . . . . . . . . . . . . . . . . . . . . . . . . . . . . . . . . . . . . . . . . . . . . . — — 17ASA Agencies Pvt. Ltd. . . . . . . . . . . . . . . . . . . . . . . . . . . . . . . . . . . . . . . . . . . . . . . . . . . . . . . . . . . . . . . . — — 5
8,052 1,567 1,605
Payables:
2008 2009 2010
Ballarpur Industries Limited . . . . . . . . . . . . . . . . . . . . . . . . . . . . . . . . . . . . . . . . . . . . . . . . . . . . . . . . . . . 39 7,844 26Ballarpur International Holdings B.V. . . . . . . . . . . . . . . . . . . . . . . . . . . . . . . . . . . . . . . . . . . . . . . . . . . . . 157 355 142Biltech Building Elements Limited . . . . . . . . . . . . . . . . . . . . . . . . . . . . . . . . . . . . . . . . . . . . . . . . . . . . . . 3 — 44SMI New Quest Inda Pvt. Ltd . . . . . . . . . . . . . . . . . . . . . . . . . . . . . . . . . . . . . . . . . . . . . . . . . . . . . . . . . . — — 322Avantha Holdings Limited . . . . . . . . . . . . . . . . . . . . . . . . . . . . . . . . . . . . . . . . . . . . . . . . . . . . . . . . . . . . . 87 139 339Imerys New Quest Inda Pvt. Ltd . . . . . . . . . . . . . . . . . . . . . . . . . . . . . . . . . . . . . . . . . . . . . . . . . . . . . . . . 1,035 3,098 —Avantha Power & Infrastructure Ltd . . . . . . . . . . . . . . . . . . . . . . . . . . . . . . . . . . . . . . . . . . . . . . . . . . . . . 2,344 5,652 3,381Crompton Greaves Ltd. . . . . . . . . . . . . . . . . . . . . . . . . . . . . . . . . . . . . . . . . . . . . . . . . . . . . . . . . . . . . . . . 503 119 4Mirablle Trading Pte. Ltd. . . . . . . . . . . . . . . . . . . . . . . . . . . . . . . . . . . . . . . . . . . . . . . . . . . . . . . . . . . . . . — 12,800 3,405Saraswati Travels Private Limited . . . . . . . . . . . . . . . . . . . . . . . . . . . . . . . . . . . . . . . . . . . . . . . . . . . . . . . — 285 86Leading Line Merchant Traders (P) Limited . . . . . . . . . . . . . . . . . . . . . . . . . . . . . . . . . . . . . . . . . . . . . . . — 59 6BILT Tree Tech . . . . . . . . . . . . . . . . . . . . . . . . . . . . . . . . . . . . . . . . . . . . . . . . . . . . . . . . . . . . . . . . . . . . . — 42 25Avanatha International Asset BV . . . . . . . . . . . . . . . . . . . . . . . . . . . . . . . . . . . . . . . . . . . . . . . . . . . . . . . — — 984Solaris Chemtech Ltd. . . . . . . . . . . . . . . . . . . . . . . . . . . . . . . . . . . . . . . . . . . . . . . . . . . . . . . . . . . . . . . . . — 7 —Ballarpur Specialty Paper Holdings Limited . . . . . . . . . . . . . . . . . . . . . . . . . . . . . . . . . . . . . . . . . . . . . . . — — 1
4,168 30,400 8,765
— F-69 — Page 65

(g) Key management compensation Total fees paid to the directors are as follows:
Year ended June 30
2008 2009 2010
Total fees paid to directors . . . . . . . . . . . . . . . . . . . . . . . . . . . . . . . . . . . . . . . . . . . . . . . . . . . . . . . . . . . . . 6 9 3
Number of directors to whom fees are paid . . . . . . . . . . . . . . . . . . . . . . . . . . . . . . . 1 2 2
For the year ended June 30, 2008 there was one director of BPH who had been nominated by private equity investors. For the
years ended June 30, 2009 and June 30, 2010 there were two directors of BIGPH that had been nominated by private equity
investors. These directors were not paid any emoluments by the Group.
For each of the years ended June 30, 2008, June 30, 2009 and June 30, 2010 there were three directors of the Company that
were paid by the ultimate parent, Ballarpur, which made no recharge to the Group. These directors are directors of the ultimate
parent and a number of affiliates. Accordingly, the above details include no emoluments in respect of these directors. Their
total emoluments as included in the aggregate of key management compensation disclosed in the financial statements of the
ultimate parent are US$1,105, US$1,930, US$2,117, respectively, for the years ended June 30, 2008, June 30, 2009 and
June 30, 2010.
h) The Group has been provided certain administrative, accounting, legal, treasury, marketing, procurement and other support services by
the holding company and the ultimate holding company.
38. The Indian subsidiary of the Group is eligible for certain fiscal incentives from the State under a Government Scheme. The
Scheme envisages to provide the incentives to eligible companies based on investments made and employment generated in the
State. The Scheme further outlines the eligibility criteria, quantum of incentives and monitoring mechanism for administering
the incentives. Pursuant to the expansion of production capacity at the subsidiary it is eligible for the incentives and an
application to this effect has been filed with the Government Authorities. However, no incentives have been accrued in these
consolidated financial statements as there is significant uncertainty involved w.r.t. the eligibility of the incentives and reliable
measurement of the amount and form of the entitlement.
39. Events after the balance sheet date
The Group entered into following transactions:
1. Sabah Forest Industries Sdn.Bhd. one of the subsidiary of the company, for the purpose of increasing pulp mill capacity has
got financing of USD130,000 from following banks:
a) USD50,000 from Rabobank.
b) Euro28,800 from ING /Nordea Bank.
c) USD20,000 from Standard Chartered Bank.
d) USD20,000 from Overseas-Chinese Banking Corporation.
2. BILT Graphic Paper Products Limited (BGPPL) one of the subsidiary of the company, has entered into the following
financing arrangements:
a) Obtained US$145,000 loan from a consortium led by Rabobank.
b) Issued Non convertible Debentures (“NCD”) of US$109,408 arranged by ICICI Bank and Yes Bank.
c) Issued Non convertible Debentures (“NCD”) of US$54,331 arranged by ICICI Bank.
d) Repayment of US$196,507 representing the IDBI Bank and Axis bank portions of the loan.
— F-70 — Page 66

3. Ballarpur International Paper Holdings B.V. (BIPH) one of the subsidiary of the company, has repaid US$145,000 loan
obtained from consortium led by Axis Bank.
4. On June 29, 2011, the LIBOR CCD issued to a related party have been converted into cumulative preference shares in
accordance with the terms of the instrument and thereafter 186,546 equity shares of BIGPH valued at USD100 million have
been issued in consideration of the preference shares held by the related party in a debt for equity swap. Since a fair valuation
of the liability has not been carried out on the date of conversion, the impact on the financial statements has not been
estimated.
5. Further, on June 30, 2011, BIPH and BPH have been merged through an internal re-organization. This has no effect on the
consolidated financial statements.
— F-71 — Page 67
UNAUDITED CONSOLIDATED INTERIM FINANCIAL INFORMATION
OF
BALLARPUR INTERNATIONAL GRAPHIC PAPER HOLDINGS B.V.
FOR THE NINE MONTHS ENDED MARCH 31, 2010 AND 2011
— F-72 —

Ballarpur International Graphic Paper Holdings B.V.All amounts in US Dollars thousands unless otherwise stated
Interim consolidated income statementNine months period ended
March 31, 2011 March 31, 2010
Note (Unaudited)(Unaudited)(Unreviewed)
Revenue . . . . . . . . . . . . . . . . . . . . . . . . . . . . . . . . . . . . . . . . . . . . . . . . . . . . . . . . . . . . . . . . . . . . 7 557,334 434,545Other operating income . . . . . . . . . . . . . . . . . . . . . . . . . . . . . . . . . . . . . . . . . . . . . . . . . . . . . . . . 4,004 2,698
561,338 437,243
Gain on change in fair valuation of biological assets . . . . . . . . . . . . . . . . . . . . . . . . . . . . . . . . . . 10 809 5,733Raw materials and consumables used . . . . . . . . . . . . . . . . . . . . . . . . . . . . . . . . . . . . . . . . . . . . . . 17 (386,410) (285,200)Excise duty expenses . . . . . . . . . . . . . . . . . . . . . . . . . . . . . . . . . . . . . . . . . . . . . . . . . . . . . . . . . . (15,057) (9,613)Employee benefits expense . . . . . . . . . . . . . . . . . . . . . . . . . . . . . . . . . . . . . . . . . . . . . . . . . . . . . . (31,799) (29,446)Depreciation . . . . . . . . . . . . . . . . . . . . . . . . . . . . . . . . . . . . . . . . . . . . . . . . . . . . . . . . . . . . . . . . . 8 (33,583) (28,678)Foreign exchange (losses)/gains — net . . . . . . . . . . . . . . . . . . . . . . . . . . . . . . . . . . . . . . . . . . . . 2,804 1,544Other operating expenses . . . . . . . . . . . . . . . . . . . . . . . . . . . . . . . . . . . . . . . . . . . . . . . . . . . . . . . (33,066) (25,523)
Operating profit . . . . . . . . . . . . . . . . . . . . . . . . . . . . . . . . . . . . . . . . . . . . . . . . . . . . . . . . . . . . . 65,036 66,060
Finance income . . . . . . . . . . . . . . . . . . . . . . . . . . . . . . . . . . . . . . . . . . . . . . . . . . . . . . . . . . . . . . . 2,520 2,095Finance cost . . . . . . . . . . . . . . . . . . . . . . . . . . . . . . . . . . . . . . . . . . . . . . . . . . . . . . . . . . . . . . . . . 18 (41,659) (19,765)
Finance cost, net . . . . . . . . . . . . . . . . . . . . . . . . . . . . . . . . . . . . . . . . . . . . . . . . . . . . . . . . . . . . . (39,139) (17,670)
Other gains /(losses) . . . . . . . . . . . . . . . . . . . . . . . . . . . . . . . . . . . . . . . . . . . . . . . . . . . . . . . . . . . 11 (650) (11,353)
Profit before income tax . . . . . . . . . . . . . . . . . . . . . . . . . . . . . . . . . . . . . . . . . . . . . . . . . . . . . . . 25,247 37,037Income tax (expense)/credit . . . . . . . . . . . . . . . . . . . . . . . . . . . . . . . . . . . . . . . . . . . . . . . . . . . . . 15 (11,714) 104
Profit for the period . . . . . . . . . . . . . . . . . . . . . . . . . . . . . . . . . . . . . . . . . . . . . . . . . . . . . . . . . . 13,533 37,141
Attributable to:Owners of the parent . . . . . . . . . . . . . . . . . . . . . . . . . . . . . . . . . . . . . . . . . . . . . . . . . . . . . . . . . . . 13,484 36,611Non-controlling interest . . . . . . . . . . . . . . . . . . . . . . . . . . . . . . . . . . . . . . . . . . . . . . . . . . . . . . . . 49 530
Earnings per share for profit attributable to the equity holders of the company duringthe period: (expressed in USD per share)
—Basic and diluted . . . . . . . . . . . . . . . . . . . . . . . . . . . . . . . . . . . . . . . . . . . . . . . . . . . . . . . . . . . 19 7.23 19.63
The notes on pages 6 to 22 are an integral part of these interim consolidated financial information.
Date: July 23, 2011
Vivek Goyal
Chief Financial Officer
Yogesh Agarwal
Managing Director
— F-73 — Page 1

Ballarpur International Graphic Paper Holdings B.V.All amounts in US Dollars thousands unless otherwise stated
Interim consolidated statements of comprehensive income
Nine months period endedMarch 31, 2011 March 31, 2010
(Unaudited)(Unaudited)(Unreviewed)
Profit for the period . . . . . . . . . . . . . . . . . . . . . . . . . . . . . . . . . . . . . . . . . . . . . . . . . . . . . . . . . . . . . . . . . 13,533 37,141Other comprehensive income:Gain/(Loss) on fair valuation of available-for-sale financial assets net of tax . . . . . . . . . . . . . . . . . . . . . — (2,852)Currency translation differences . . . . . . . . . . . . . . . . . . . . . . . . . . . . . . . . . . . . . . . . . . . . . . . . . . . . . . . . 32,717 37,093Cash flow hedging reserve release . . . . . . . . . . . . . . . . . . . . . . . . . . . . . . . . . . . . . . . . . . . . . . . . . . . . . . . 2,030 —
Other comprehensive income for the period, net of tax . . . . . . . . . . . . . . . . . . . . . . . . . . . . . . . . . . . . 34,747 34,241
Total comprehensive income for the period . . . . . . . . . . . . . . . . . . . . . . . . . . . . . . . . . . . . . . . . . . . . . 48,280 71,382
Attributable to:—Owners of the parent . . . . . . . . . . . . . . . . . . . . . . . . . . . . . . . . . . . . . . . . . . . . . . . . . . . . . . . . . . . . . . . 47,646 69,978— Non-controlling interests . . . . . . . . . . . . . . . . . . . . . . . . . . . . . . . . . . . . . . . . . . . . . . . . . . . . . . . . . . . 634 1,404
Total comprehensive income/(expense) for the period . . . . . . . . . . . . . . . . . . . . . . . . . . . . . . . . . . . . . 48,280 71,382
Items in the financial information above are disclosed net of tax.
The notes on pages 6 to 22 are an integral part of these interim consolidated financial information.
Vivek Goyal
Chief Financial Officer
Yogesh Agarwal
Managing Director
— F-74 — Page 2

Ballarpur International Graphic Paper Holdings B.V.All amounts in US Dollars thousands unless otherwise stated
Interim consolidated statements of financial position
NoteAs at
March 31, 2011As at
June 30, 2010
(Unaudited)ASSETSNon-current assetsProperty, plant and equipment . . . . . . . . . . . . . . . . . . . . . . . . . . . . . . . . . . . . . . . . . . . . . . . . . . . . . . . . . . 8 824,511 819,255Capital work-in-progress . . . . . . . . . . . . . . . . . . . . . . . . . . . . . . . . . . . . . . . . . . . . . . . . . . . . . . . . . . . . . . 9 200,357 52,203Biological assets . . . . . . . . . . . . . . . . . . . . . . . . . . . . . . . . . . . . . . . . . . . . . . . . . . . . . . . . . . . . . . . . . . . . . 10 95,410 88,222Available for sale financial asset . . . . . . . . . . . . . . . . . . . . . . . . . . . . . . . . . . . . . . . . . . . . . . . . . . . . . . . . 22,592 22,099Restricted deposits . . . . . . . . . . . . . . . . . . . . . . . . . . . . . . . . . . . . . . . . . . . . . . . . . . . . . . . . . . . . . . . . . . . 2 0Land use rights . . . . . . . . . . . . . . . . . . . . . . . . . . . . . . . . . . . . . . . . . . . . . . . . . . . . . . . . . . . . . . . . . . . . . . 13,191 12,367Derivative financial instruments . . . . . . . . . . . . . . . . . . . . . . . . . . . . . . . . . . . . . . . . . . . . . . . . . . . . . . . . 11 197 13,212Deferred income tax assets . . . . . . . . . . . . . . . . . . . . . . . . . . . . . . . . . . . . . . . . . . . . . . . . . . . . . . . . . . . . . 16 11,636 10,836Trade and other receivables . . . . . . . . . . . . . . . . . . . . . . . . . . . . . . . . . . . . . . . . . . . . . . . . . . . . . . . . . . . . 34,579 32,071
1,202,475 1,050,265
Current assetsInventories . . . . . . . . . . . . . . . . . . . . . . . . . . . . . . . . . . . . . . . . . . . . . . . . . . . . . . . . . . . . . . . . . . . . . . . . . 137,045 127,249Trade and other receivables . . . . . . . . . . . . . . . . . . . . . . . . . . . . . . . . . . . . . . . . . . . . . . . . . . . . . . . . . . . . 124,083 92,996Restricted deposits . . . . . . . . . . . . . . . . . . . . . . . . . . . . . . . . . . . . . . . . . . . . . . . . . . . . . . . . . . . . . . . . . . . 5,454 5,918Cash and cash equivalents (excluding bank overdraft) . . . . . . . . . . . . . . . . . . . . . . . . . . . . . . . . . . . . . . . 20,953 29,112
287,535 255,275
Total assets . . . . . . . . . . . . . . . . . . . . . . . . . . . . . . . . . . . . . . . . . . . . . . . . . . . . . . . . . . . . . . . . . . . . . . . . 1,490,010 1,305,540
EQUITY AND LIABILITIESEquity attributable to owners of the companyOrdinary shares . . . . . . . . . . . . . . . . . . . . . . . . . . . . . . . . . . . . . . . . . . . . . . . . . . . . . . . . . . . . . . . . . . . . . . 12 29 29Share premium . . . . . . . . . . . . . . . . . . . . . . . . . . . . . . . . . . . . . . . . . . . . . . . . . . . . . . . . . . . . . . . . . . . . . . 12 328,327 328,327Translation reserve . . . . . . . . . . . . . . . . . . . . . . . . . . . . . . . . . . . . . . . . . . . . . . . . . . . . . . . . . . . . . . . . . . . 52,018 19,886Other reserves . . . . . . . . . . . . . . . . . . . . . . . . . . . . . . . . . . . . . . . . . . . . . . . . . . . . . . . . . . . . . . . . . . . . . . . 13 87,805 85,775Retained earnings . . . . . . . . . . . . . . . . . . . . . . . . . . . . . . . . . . . . . . . . . . . . . . . . . . . . . . . . . . . . . . . . . . . . 121,462 107,978
589,641 541,995
Non-controlling interest . . . . . . . . . . . . . . . . . . . . . . . . . . . . . . . . . . . . . . . . . . . . . . . . . . . . . . . . . . . . . . . 8,388 7,754
Total equity 598,029 549,749
LIABILITIESNon-current liabilitiesBorrowings . . . . . . . . . . . . . . . . . . . . . . . . . . . . . . . . . . . . . . . . . . . . . . . . . . . . . . . . . . . . . . . . . . . . . . . . . 14 522,367 465,134Deferred income tax liabilities . . . . . . . . . . . . . . . . . . . . . . . . . . . . . . . . . . . . . . . . . . . . . . . . . . . . . . . . . . 16 22,468 16,785Derivative financial instruments . . . . . . . . . . . . . . . . . . . . . . . . . . . . . . . . . . . . . . . . . . . . . . . . . . . . . . . . 11 15,915 19,154Retirement benefit obligation . . . . . . . . . . . . . . . . . . . . . . . . . . . . . . . . . . . . . . . . . . . . . . . . . . . . . . . . . . . 6,724 6,628Trade and other payables . . . . . . . . . . . . . . . . . . . . . . . . . . . . . . . . . . . . . . . . . . . . . . . . . . . . . . . . . . . . . . 5,548 5,201
573,022 512,902
Current liabilitiesTrade and other payable . . . . . . . . . . . . . . . . . . . . . . . . . . . . . . . . . . . . . . . . . . . . . . . . . . . . . . . . . . . . . . . 166,028 173,723Current income tax liabilities . . . . . . . . . . . . . . . . . . . . . . . . . . . . . . . . . . . . . . . . . . . . . . . . . . . . . . . . . . . 997 1,464Borrowings . . . . . . . . . . . . . . . . . . . . . . . . . . . . . . . . . . . . . . . . . . . . . . . . . . . . . . . . . . . . . . . . . . . . . . . . . 14 151,934 67,702
Total liabilities . . . . . . . . . . . . . . . . . . . . . . . . . . . . . . . . . . . . . . . . . . . . . . . . . . . . . . . . . . . . . . . . . . . . . 318,959 242,889
Total equity and liabilities . . . . . . . . . . . . . . . . . . . . . . . . . . . . . . . . . . . . . . . . . . . . . . . . . . . . . . . . . . . . 891,981 755,791
1,490,010 1,305,540
The notes on pages 6 to 22 are an integral part of these interim consolidated financial information.
Vivek Goyal
Chief Financial Officer
Yogesh Agarwal
Managing Director
— F-75 — Page 3

Ballarpur International Graphic Paper Holdings B.V.All amounts in US dollars thousands unless otherwise stated
Interim consolidated statements of changes in equity
Attributable to owners of the parent
NoteSharecapital
Sharepremium
Retainedearnings
Translationreserve
OtherReserves
Non-controllinginterest
Totalequity
Balance at July 1, 2009 . . . . . . . . . . . 29 328,327 62,252 (12,637) (15,889) 6,531 368,613
Comprehensive incomeProfit/(Loss) for the period . . . . . . . . . — — 36,611 — — 530 37,141Other comprehensive incomeCurrency translation differences . . . . . — — — 36,219 — 874 37,093Gain on fair valuation of available forsale financial asset, net of tax . . . . . — — — — (2,852) — (2,852)
Total other comprehensive income — — — 36,219 (2,852) 874 34,241
Total comprehensive income . . . . . . — — 36,611 36,219 (2,852) 1,404 71,362
Transaction with ownersEquity component of profit certificatesand compulsory convertibledebentures . . . . . . . . . . . . . . . . . . . . — — — — 104,647 — 104,647
Total transactions with owners . . . . — — — — 104,647 — 104,647
Balance at March 31, 2010 . . . . . . . . 29 328,327 98,863 23,582 85,906 7,935 544,642
(Unaudited / Unreviewed)
Balance at July 1, 2010 . . . . . . . . . . . 29 328,327 107,978 19,886 85,775 7,754 549,749
Comprehensive incomeProfit/(Loss) for the period . . . . . . . . . — — 13,484 — — 49 13,533Other comprehensive incomeCurrency translation differences . . . . . — — — 32,132 — 585 32,717Gain on fair valuation of available forsale financial asset, net of tax . . . . . — — — — — — —
Cash flow hedging reserve release . . . 11 — — — — 2,030 — 2,030
Total other comprehensive income . . . — — — 32,132 2,030 585 34,747
Total comprehensive income . . . . . . — — 13,484 32,132 2,030 634 48,280
Transaction with owners . . . . . . . . . — — — — — — —
Total transactions with owners . . . . — — — — — — —
Balance at March 31, 2011(Unaudited) . . . . . . . . . . . . . . . . . . 29 328,327 121,462 52,018 87,805 8,388 598,029
The notes on pages 6 to 22 are an integral part of these interim consolidated financial information.
Vivek Goyal
Chief Financial Officer
Yogesh Agarwal
Managing Director
— F-76 — Page 4

Ballarpur International Graphic Paper Holdings B.V.All amounts in US dollars thousands unless otherwise stated
Interim consolidated statements of cash flowsNine months period endedMarch 31,
2011March 31,
2010
Note (Unaudited)(Unaudited)(Unreviewed)
Cash flows from operating activitiesProfit / (loss) for the period before tax . . . . . . . . . . . . . . . . . . . . . . . . . . . . . . . . . . . . . . . . . . . . . . . . . . 25,247 37,037Adjustments for:Depreciation . . . . . . . . . . . . . . . . . . . . . . . . . . . . . . . . . . . . . . . . . . . . . . . . . . . . . . . . . . . . . . . . . . . . . . 8 33,583 28,678Amortization of land premium . . . . . . . . . . . . . . . . . . . . . . . . . . . . . . . . . . . . . . . . . . . . . . . . . . . . . . . . 52 48Bad debts written off . . . . . . . . . . . . . . . . . . . . . . . . . . . . . . . . . . . . . . . . . . . . . . . . . . . . . . . . . . . . . . . — 41Inventory provision and written off . . . . . . . . . . . . . . . . . . . . . . . . . . . . . . . . . . . . . . . . . . . . . . . . . . . . — 110Gain on disposal of property, plant and equipment . . . . . . . . . . . . . . . . . . . . . . . . . . . . . . . . . . . . . . . . (3) 1Release of hedge reserve . . . . . . . . . . . . . . . . . . . . . . . . . . . . . . . . . . . . . . . . . . . . . . . . . . . . . . . . . . . . 11 2,030 0Finance costs, net recognized in income statement . . . . . . . . . . . . . . . . . . . . . . . . . . . . . . . . . . . . . . . . 39,139 17,670Other gains or losses net . . . . . . . . . . . . . . . . . . . . . . . . . . . . . . . . . . . . . . . . . . . . . . . . . . . . . . . . . . . . . 650 11,353Increase in defined benefit obligations . . . . . . . . . . . . . . . . . . . . . . . . . . . . . . . . . . . . . . . . . . . . . . . . . . 920 1,289Gain on change in fair value of biological assets . . . . . . . . . . . . . . . . . . . . . . . . . . . . . . . . . . . . . . . . . . 10 (809) (5,733)Movement in working capitalIncrease/decrease in(Increase) / Decrease in inventories . . . . . . . . . . . . . . . . . . . . . . . . . . . . . . . . . . . . . . . . . . . . . . . . . . . . (4,833) (33,623)(Increase) / Decrease in trade and other receivables . . . . . . . . . . . . . . . . . . . . . . . . . . . . . . . . . . . . . . . (33,083) (18,155)Increase / (Decrease) in trade and other payable . . . . . . . . . . . . . . . . . . . . . . . . . . . . . . . . . . . . . . . . . . 12,005 43,013
Cash generated from/(used in) operating activities . . . . . . . . . . . . . . . . . . . . . . . . . . . . . . . . . . . . . 74,898 81,729Income taxes paid . . . . . . . . . . . . . . . . . . . . . . . . . . . . . . . . . . . . . . . . . . . . . . . . . . . . . . . . . . . . . . . . . . (6,900) (4,768)
Net cash generated from/(used in) operating activities . . . . . . . . . . . . . . . . . . . . . . . . . . . . . . . . . . . 67,998 76,961
Cash flows used in investing activitiesPurchase of available for sale investment . . . . . . . . . . . . . . . . . . . . . . . . . . . . . . . . . . . . . . . . . . . . . . . — (2,831)Proceeds from disposal of property plant and equipment . . . . . . . . . . . . . . . . . . . . . . . . . . . . . . . . . . . 4 4Purchases of property, plant and equipment . . . . . . . . . . . . . . . . . . . . . . . . . . . . . . . . . . . . . . . . . . . . . (5,088) (1,859)Purchases of capital work-in-progress . . . . . . . . . . . . . . . . . . . . . . . . . . . . . . . . . . . . . . . . . . . . . . . . . . (162,791) (54,664)Interest received . . . . . . . . . . . . . . . . . . . . . . . . . . . . . . . . . . . . . . . . . . . . . . . . . . . . . . . . . . . . . . . . . . . 1,770 1,576(Increase)/Decrease in restricted deposits — net . . . . . . . . . . . . . . . . . . . . . . . . . . . . . . . . . . . . . . . . . . 849 129
Net cash used in investing activities . . . . . . . . . . . . . . . . . . . . . . . . . . . . . . . . . . . . . . . . . . . . . . . . . . (165,256) (57,645)
Cash flows generated from financing activitiesFinance cost paid . . . . . . . . . . . . . . . . . . . . . . . . . . . . . . . . . . . . . . . . . . . . . . . . . . . . . . . . . . . . . . . . . . (30,773) (27,881)Proceeds from borrowings, net of transaction costs . . . . . . . . . . . . . . . . . . . . . . . . . . . . . . . . . . . . . . . . 14 388,954 564,333Repayment / extinguishment of borrowings . . . . . . . . . . . . . . . . . . . . . . . . . . . . . . . . . . . . . . . . . . . . . 14 (348,37) (711,343)Proceeds from issuance of profit certificates and CCD’s . . . . . . . . . . . . . . . . . . . . . . . . . . . . . . . . . . . . — 97,288Proceeds from issuance of profit certificates . . . . . . . . . . . . . . . . . . . . . . . . . . . . . . . . . . . . . . . . . . . . . — 55,000Net movement in cash credit, packing credit, bankers acceptance and finance lease liabilities . . . . . . 78,087 20,605
Net cash flows generated from financing activities . . . . . . . . . . . . . . . . . . . . . . . . . . . . . . . . . . . . . . 87,941 (1,998)
Effect of change in exchange rate . . . . . . . . . . . . . . . . . . . . . . . . . . . . . . . . . . . . . . . . . . . . . . . . . . . . . 1,158 4,678
Net increase in cash, cash equivalents and bank overdrafts . . . . . . . . . . . . . . . . . . . . . . . . . . . . . . (8,159) 22,196Cash, cash equivalents and bank overdrafts at beginning of the year/period . . . . . . . . . . . . . . . . . . . . . 29,112 14,565
Cash, cash equivalents and bank overdrafts at end of the year/period . . . . . . . . . . . . . . . . . . . . . 20,953 36,761
The notes on pages 6 to 22 are an integral part of these interim consolidated financial information.
Vivek Goyal
Chief Financial Officer
Yogesh Agarwal
Managing Director
— F-77 — Page 5

Ballarpur International Graphic Paper Holdings B.V.All amounts in US dollars thousands unless otherwise stated
Notes to the interim financial information
1. General information and development of the BIGPH Group
Ballarpur International Graphic Paper Holdings B.V. (“BIGPH” or the “Company”), a company incorporated and domiciled in the
Netherlands, is currently a majority owned subsidiary of Ballarpur International Holdings B.V., Amsterdam (“BIH”), which is wholly
owned by the ultimate parent company Ballarpur Industries Limited (“Ballarpur”, together with its subsidiaries “Ballarpur Group”).
The Group’s operations comprise production of pulp and paper spanning across three production units in India and one in
Malaysia. The unit in Malaysia owns two timber licenses granted under a 99 years lease by the State Government of Sabah,
Malaysia for the extraction of timber from the natural forest and for industrial tree plantation in Sabah, Malaysia.
These condensed consolidated interim financial information include the financial position and results of the Company and its
subsidiaries Ballarpur Paper Holdings B.V. (BPH), Ballarpur International Paper Holdings B.V. (BIPH), BILT Graphic Paper
Products Limited (BGPPL) and Sabah Forest Industries (SFI) (together “the Group”).
These condensed consolidated interim financial information has been reviewed, not audited. The comparative information
presented for the nine month period ended March 31, 2010 has not been reviewed. These condensed consolidated interim
financial Information have been prepared due to proposed offerings of securities by the company.
The principal activities of the subsidiaries included in the condensed consolidated interim financial information are as follows:
CompanyProduction
UnitsPrincipalActivity
Country ofIncorporation
Equityinterest onJune 30,2010
BPH . . . . . . . . . . . . . . . . . . . . . . . . . . . . . . . . . . . . . . . . . . . . . . . . . . . . . . . Holding Netherlands 100.00%BIPH . . . . . . . . . . . . . . . . . . . . . . . . . . . . . . . . . . . . . . . . . . . . . . . . . . . . . . . Holding Netherlands 100.00%BGPPL . . . . . . . . . . . . . . . . . . . . . . . . . . . . . . . . . . . . . . . . . . . . . . . . . . . . . India 99.99%
Ballarpur Pulp and paper IndiaBhigwan Paper IndiaKamalapuram Pulp and paper India
SFI . . . . . . . . . . . . . . . . . . . . . . . . . . . . . . . . . . . . . . . . . . . . . . . . . . . . . . . . Sabah Pulp, paperand fores
Malaysia 97.80%
The non-controlling interest in BGPPL is owned by Ballarpur Industries Limited and the non-controlling interest in SFI is
owned by the Government of Malaysia.
2. Basis of preparation
The condensed consolidated interim financial information for the nine months ended March 2011 have been prepared in
accordance with IAS 34, ‘Interim Financial Reporting’. The condensed consolidated interim financial information should be read
in conjunction with the annual financial statements for the year ended June 30, 2010, which have been prepared in accordance
with International Financial Reporting Standards as adopted by the European Union (“IFRS”). These condensed consolidated
interim financial information are presented in US dollars, rounded to the nearest thousand (US$’000) unless otherwise stated. It
has been prepared under the historical cost convention, except for available for sale financial assets, financial assets and financial
liabilities (including derivative instruments) at fair value through profit or loss and biological assets, which have been recorded at
fair value. These condensed consolidated interim financial information have been prepared on a going concern basis.
2.1 Foreign currency translation
(a) Functional and presentation currency
Items included in the condensed consolidated interim financial information of each of the Group’s entities are measured using the
currency of the primary economic environment in which the entity operates (‘the functional currency’). The functional currency of
— F-78 — Page 6

the Malaysian operations at SFI is Malaysian ringgit, and the functional currency of the Indian operations and the Dutch
holding entities is Indian rupees.
The condensed consolidated interim financial information are presented in United States Dollars (“US$”) as the Company
believes this is a currency familiar to international investors.
(b) Transactions and balances
Foreign currency transactions are translated into the functional currency using the exchange rates prevailing at the dates of the
transactions. At each balance sheet date, monetary items denominated in foreign currencies are translated at the exchange rates
prevailing at the balance sheet date. Non-monetary items carried at fair value that are denominated in foreign currencies are
translated at the exchange rates prevailing at the date when the fair value was determined. All foreign exchange gains or losses
are recognized in the income statement, except when deferred in other comprehensive income as qualifying cash flow hedges.
(c) Translation into presentation currency
The results and financial position of all the Group entities that have a functional currency different from the presentation
currency are translated into the presentation currency as follows:
Š assets and liabilities for each balance sheet presented are translated at the closing rate at the date of that balance sheet;
Š components of equity are translated at historical rate;
Š income and expenses for each income statement are translated at average exchange rates; and
Š all resulting exchange differences are recognized as a separate component of equity.
Goodwill and fair value adjustments arising on the acquisition of a foreign entity are treated as assets and liabilities of the
foreign entity and translated at the closing rate.
The translation rates applied to translate from the functional currencies Indian rupee and Malaysian ringgit into the
presentation currency US$ are as follows:
Currency CodeAs at March 31,
2011As at 30 June,
2010
AverageNine month
ended31 March, 2011
AverageNine month
ended31 March, 2010
Indian rupee . . . . . . . . . . . . . . . . . . . . . . . . . . . . . . . . . . INR 45.40 46.48 45.96 47.23Malaysian ringgit . . . . . . . . . . . . . . . . . . . . . . . . . . . . . . MYR 3.03 3.25 3.11 3.44
3. Accounting Policies
The accounting policies adopted are consistent with those of the annual financial statements for the year ended June 30, 2010,
except for taxes as described below.
The adaptation of amended standards and new interpretations which are mandatory from July 1, 2010. These changes are described below.
However, none of these currently have a material impact on the financial position or performance of the group. The group has not early
adopted any standard, interpretation or amendment that has been issued but is not yet mandatory.
Taxes on income in the interim periods are accrued using the tax rate that would be applicable to the expected total annual
profit or loss.
New standards and developments adopted by the Group
IAS 1 (Amendment), ‘Presentation of financial statements’ (effective from January 1, 2010): The amendment clarifies that the
— F-79 — Page 7

potential settlement of a liability by the issue of equity is not relevant to its classification as current or non-current. By
amending the definition of current liability, the amendment permits a liability to be classified as non-current (provided that the
entity has an unconditional right to defer settlement by transfer of cash or other assets for at least 12 months after the
accounting period) notwithstanding the fact that the entity could be required by the counterparty to settle in shares at any time.
IAS 36 (amendment), ‘Impairment of assets’, effective January 1, 2010. The amendment clarifies that the largest cash-
generating unit (or group of units) to which goodwill should be allocated for the purposes of impairment testing is an
operating segment, as defined by paragraph 5 of IFRS 8, ‘Operating segments’ (that is, before the aggregation of segments
with similar economic characteristics). The amendment does not have a material impact on the group’s financial statements.
IFRS 2 (amendments), ‘Group cash-settled share-based payment transactions’, effective form January 1, 2010. In addition to
incorporating IFRIC 8, ‘Scope of IFRS 2’, and IFRIC 11, ‘IFRS 2 — Group and treasury share transactions’, the amendments
expand on the guidance in IFRIC 11 to address the classification of group arrangements that were not covered by that
interpretation. IFRS 2 (Amendment) is not relevant for the Group as there are no share-based payments.
IAS 32 Financial instruments: Presentation on classification of rights issues (effective on or after February 1, 2010): The
amendment addresses the accounting for rights issues that are denominated in a currency other than the functional currency of
the issuer. Provided certain conditions are met, such rights issues are now classified as equity regardless of the currency in
which the exercise price is denominated. Previously, these issues had to be accounted for as derivative liabilities. The
amendment does not have a material impact on the group’s financial statements.
IFRS 5 (amendment), ‘Non-current assets held for sale and discontinued operations’. The amendment clarifies that IFRS 5
specifies the disclosures required in respect of non-current assets (or disposal groups) classified as held for sale or
discontinued operations. It also clarifies that the general requirement of IAS 1 still apply, in particular paragraph 15 (to
achieve a fair presentation) and paragraph 125 (sources of estimation uncertainty) of IAS 1. As the amendment only impact
disclosures, there is no impact on earnings per share.
4. Critical accounting estimates and assumptions
The preparation of interim condensed consolidated financial statements requires management to make judgements, estimates
and assumptions that affect the application of accounting policies and the reported amounts of assets and liabilities, income
and expense. Actual results may differ from these estimates.
In preparing these condensed consolidated interim financial information, significant judgements made by the management in
applying the group’s accounting policies and the key sources of estimation uncertainty were the same as those that applied to
the consolidated financial statements for the year ended June 30, 2010.
5. Financial risk management
5.1 Financial risk factors
The Group’s activities expose it to a variety of financial risks: market risk (including currency risk, fair value interest rate
risk, cash flow interest rate risk and price risk), commodity risk, credit risk and liquidity risk.
The interim condensed consolidated financial statements do not include all financial risk management information and
disclosures required in the annual financial statements, and should be read in conjunction with the group’s annual financial
statements as at 30 June 2010.
There have been no changes in the risk management department since year end June 30, 2010 or in any risk management policies. The
Group’s overall risk management programme focuses on the unpredictability of financial markets and seeks to minimize potential
adverse effects on the Group’s financial performance. The Group uses derivative financial instruments to hedge certain risk exposures.
5.2 Liquidity risk
The Group relies on a mix of borrowings, capital infusion and excess operating cash flows to meet its needs for funds. The
current committed lines of credit are sufficient to meet its short to medium term expansion needs.
— F-80 — Page 8

The table below analyses the Group’s financial liabilities into relevant maturity groupings based on the remaining period at
the balance sheet to the contractual maturity date. The maturity profile based on undiscounted cash flows is as under:
At March 31, 2011 Less than 1 yearBetween 1 and 2
yearsBetween 2and 5 years
More than5 years
Borrowings (excluding financial lease liabilities) . . . . . . . . . . . . . . . . . . 182,761 65,565 309,788 340,673Finance lease liabilities . . . . . . . . . . . . . . . . . . . . . . . . . . . . . . . . . . . . . . 213 205 280 —Derivative financial instruments . . . . . . . . . . . . . . . . . . . . . . . . . . . . . . . — 4,430 11,485 —Trade and other payables . . . . . . . . . . . . . . . . . . . . . . . . . . . . . . . . . . . . . 166,146 1,949 5,177 40
Total . . . . . . . . . . . . . . . . . . . . . . . . . . . . . . . . . . . . . . . . . . . . . . . . . . . . . 349,120 72,149 326,730 340,613
At June 30, 2010 Less than 1 yearBetween 1 and 2
yearsBetween 2and 5 years
More than5 years
Borrowings (excluding financial lease liabilities) . . . . . . . . . . . . . . . . . . 100,213 62,953 279,134 337,766Finance lease liabilities . . . . . . . . . . . . . . . . . . . . . . . . . . . . . . . . . . . . . . 114 114 184 —Derivative financial instruments . . . . . . . . . . . . . . . . . . . . . . . . . . . . . . . — — 19,154 —Trade and other payables . . . . . . . . . . . . . . . . . . . . . . . . . . . . . . . . . . . . . 174,042 1,904 5,056 —
Total . . . . . . . . . . . . . . . . . . . . . . . . . . . . . . . . . . . . . . . . . . . . . . . . . . . . . 274,369 64,971 303,528 337,766
5.3 Fair value estimation
The tables below analyses financial instruments carried at fair value, by valuation method. The different levels have been
defined as follows:
Š Quoted prices (unadjusted) in active markets for identical assets or liabilities (level 1).
Š Inputs other than quoted prices included within level 1 that are observable for the asset or liability, either directly (that
is, as prices) or indirectly (that is, derived from prices) (level 2).
Š Inputs for the asset or liability that are not based on observable market data (that is, unobservable inputs) (level 3).
The following tables present the Group’s assets and liabilities that are measured at fair value as at March 31, 2011.
March 2011
Level 1 Level 2 Level 3 Total
AssetsFinancial assets at fair value through profit or loss— Derivatives . . . . . . . . . . . . . . . . . . . . . . . . . . . . . . . . . . . . . . . . . . . . . . . . . . . . . . . . . . . . . . . . . . . . — 197 — 197Available for sale financial assets—Investments . . . . . . . . . . . . . . . . . . . . . . . . . . . . . . . . . . . . . . . . . . . . . . . . . . . . . . . . . . . . . . . . . . . . — 22,592 — 22,592
Total assets . . . . . . . . . . . . . . . . . . . . . . . . . . . . . . . . . . . . . . . . . . . . . . . . . . . . . . . . . . . . . . . . . . . . . . — 22,789 — 22,789
Level 1 Level 2 Level 3 Total
LiabilitiesFinancial liabilities at fair value through profit or loss . . . . . . . . . . . . . . . . . . . . . . . . . . . . . . . . . . . . . — 15,915 — 15,915
— Derivatives . . . . . . . . . . . . . . . . . . . . . . . . . . . . . . . . . . . . . . . . . . . . . . . . . . . . . . . . . . . . . . . . . . . . — 15,915 — 15,915
— F-81 — Page 9

The following tables present the Group’s assets and liabilities that are measured at fair value as at June 30, 2010.
June 2010
Level 1 Level 2 Level 3 Total
AssetsFinancial assets at fair value through profit or loss— Derivatives . . . . . . . . . . . . . . . . . . . . . . . . . . . . . . . . . . . . . . . . . . . . . . . . . . . . . . . . . . . . . . . . . . . . — — 13,212 13,212Available for sale financial assets . . . . . . . . . . . . . . . . . . . . . . . . . . . . . . . . . . . . . . . . . . . . . . . . . . . . . — 22,099 — 22,099
Total assets . . . . . . . . . . . . . . . . . . . . . . . . . . . . . . . . . . . . . . . . . . . . . . . . . . . . . . . . . . . . . . . . . . . . . . — 22,099 13,212 35,311
Liabilities Level 1 Level 2 Level 3 Total
Financial liabilities at fair value through profit or loss . . . . . . . . . . . . . . . . . . . . . . . . . . . . . . . . . . . . . — 19,154 — 19,154
—Derivatives . . . . . . . . . . . . . . . . . . . . . . . . . . . . . . . . . . . . . . . . . . . . . . . . . . . . . . . . . . . . . . . . . . . . — 19,154 — 19,154
In 2011 there were no significant changes in the business or economic circumstances that affect the fair value of the group’sfinancial assets and financial liabilities.
In 2011 there were no reclassifications of financial assets.
6. Seasonality
The Group’s financial results have not, historically, been subject to significant seasonal trends.
7. Segment information
Management has determined the operating segments based on the reports reviewed by the board that are used to make strategic decisions.
The board considers the business from a production unit perspective which also aligns with the products and the geography ofthe Group’s domestic markets. Accordingly, management considers the performance of its businesses as follows:
Š Coated paper manufactured in India — Bhigwan production unit
Š Uncoated paper manufactured in India — Ballarpur production unit
Š Uncoated paper manufactured in Malaysia — SFI production unit
Š Rayon grade pulp manufactured in India — Kamalapuram production unit
The reportable operating segments derive their revenue primarily from the manufacture and sale of paper and pulp. Certainsegments include ancillary income as follows:
Š The Ballarpur production unit sale surplus pulp from its pulping facilities to the Ashti production unit, a production unitowned by the Ballarpur Group and it sells surplus caustic soda that it produces to the market
Š The SFI production unit operates an integrated timber complex which produces plywood, sawn timber and veener woodproducts for external sale
The results of these activities are included in the relevant segment as this is how the segments are presented to the board. Allthe production units, with the exception of Kamalapuram, sell their products in their domestic market and exportinternationally. Kamalapuram sells its product only in the domestic market.
The board assesses the performance of the operating segments based on a measure of EBITDA. Interest income andexpenditure and derivative gains and losses are not allocated to segments, as this type of activity is driven by the centraltreasury function, which manages the cash and risk positions of the Group.
The revenue from external parties reported to the board is measured in a manner consistent with that in the income statement.
The segment information provided to the board for the reportable segments for the nine months ended March 30, 2011 andMarch 30, 2010 is as follows:
— F-82 — Page 10

Nine months period ended March 31, 2011
Paper
India Malaysia India
Coated Uncoated Uncoated Total PulpHead office/Others Total
Total Segment Revenue . . . . . . . . . . . . . . . . . . . . . . . . . . 215,477 170,242 97,060 482,779 74,555 — 557,334Inter Segment Revenue . . . . . . . . . . . . . . . . . . . . . . . . . . — — — — — — —Revenue from External Customer . . . . . . . . . . . . . . . . . . 215,477 170,242 97,060 482,779 74,555 — 557,334Net Revenue from External Customer . . . . . . . . . . . . . . . 207,166 163,929 97,060 468,155 74,122 — 542,277EBIDTA . . . . . . . . . . . . . . . . . . . . . . . . . . . . . . . . . . . . . . 26,492 34,349 13,319 74,160 25,895 (1,436) 98,519Depreciation . . . . . . . . . . . . . . . . . . . . . . . . . . . . . . . . . . . (8,400) (10,570) (11,328) (30,298) (3,285) (33,583)Operating Profit/(Loss) . . . . . . . . . . . . . . . . . . . . . . . . . . 18,092 23,779 1,991 43,862 22,610 (1,436) 65,036
Nine months period ended March 31, 2010
Paper
India Malaysia India
Coated Uncoated Uncoated Total PulpHead office/Others Total
Total Segment Revenue . . . . . . . . . . . . . . . . . . . . . . . . . . 166,000 117,682 96,881 380,563 53,990 — 434,553Inter Segment Revenue . . . . . . . . . . . . . . . . . . . . . . . . . . — — — — (8) — (8)Revenue from External Customer . . . . . . . . . . . . . . . . . . 166,000 117,682 96,881 380,563 53,982 — 434,545Net Revenue from External Customer . . . . . . . . . . . . . . . 160,510 113,559 96,881 370,950 53,982 — 424,932EBIDTA . . . . . . . . . . . . . . . . . . . . . . . . . . . . . . . . . . . . . . 30,503 31,743 23,082 85,328 10,621 (1,211) 94,738Depreciation . . . . . . . . . . . . . . . . . . . . . . . . . . . . . . . . . . . (8,164) (7,984) (9,566) (25,714) (2,964) — (28,678)Operating Profit/(Loss) . . . . . . . . . . . . . . . . . . . . . . . . . . 22,339 23,759 13,516 59,614 7,657 (1,211) 66,060
(1) Net revenue from external customers represents revenue net of excise duty which is applicable to the paper operations
in India.
A reconciliation of EBITDA to profit before tax and is provided as follows:
Nine monthsperiod ended
March 31, 2011
Nine monthsperiod ended
March 31, 2010
EBITDA for Reportable Segments . . . . . . . . . . . . . . . . . . . . . . . . . . . . . . . . . . . . . . . . . . . . . . . . . . . . . . 100,055 95,949Head office / Others . . . . . . . . . . . . . . . . . . . . . . . . . . . . . . . . . . . . . . . . . . . . . . . . . . . . . . . . . . . . . . . . . . (1,436) (1,211)
Total Segments . . . . . . . . . . . . . . . . . . . . . . . . . . . . . . . . . . . . . . . . . . . . . . . . . . . . . . . . . . . . . . . . . . . . . 98,619 94,738
Depreciation . . . . . . . . . . . . . . . . . . . . . . . . . . . . . . . . . . . . . . . . . . . . . . . . . . . . . . . . . . . . . . . . . . . . . . . . (33,583) (28,678)Finance cost Net . . . . . . . . . . . . . . . . . . . . . . . . . . . . . . . . . . . . . . . . . . . . . . . . . . . . . . . . . . . . . . . . . . . . . (39,139) (17,670)Other gains /Losses . . . . . . . . . . . . . . . . . . . . . . . . . . . . . . . . . . . . . . . . . . . . . . . . . . . . . . . . . . . . . . . . . . (650) (11,353)
Profit/(Loss) before Tax . . . . . . . . . . . . . . . . . . . . . . . . . . . . . . . . . . . . . . . . . . . . . . . . . . . . . . . . . . . . . 25,247 37,037
Head office / others relate to administration costs incurred by BGPPL Head office and Netherland entities.
No amounts are provided to the board with respect to segmental assets and liabilities and accordingly no such financial
measures are presented here.
— F-83 — Page 11

Breakdown of the revenue from external customers is as follows:
Nine monthsperiod ended
March 31, 2011
Nine monthsperiod ended
March 31, 2010
Paper . . . . . . . . . . . . . . . . . . . . . . . . . . . . . . . . . . . . . . . . . . . . . . . . . . . . . . . . . . . . . . . . . . . . . . . . . . . . . 468,378 362,029Rayon Grade Pulp . . . . . . . . . . . . . . . . . . . . . . . . . . . . . . . . . . . . . . . . . . . . . . . . . . . . . . . . . . . . . . . . . . . 74,555 52,603Paper Grade Pulp . . . . . . . . . . . . . . . . . . . . . . . . . . . . . . . . . . . . . . . . . . . . . . . . . . . . . . . . . . . . . . . . . . . . 2,675 8,602Sawn timber . . . . . . . . . . . . . . . . . . . . . . . . . . . . . . . . . . . . . . . . . . . . . . . . . . . . . . . . . . . . . . . . . . . . . . . . 9,075 9,297Caustic soda/Chemicals . . . . . . . . . . . . . . . . . . . . . . . . . . . . . . . . . . . . . . . . . . . . . . . . . . . . . . . . . . . . . . . 1,680 1,113Power . . . . . . . . . . . . . . . . . . . . . . . . . . . . . . . . . . . . . . . . . . . . . . . . . . . . . . . . . . . . . . . . . . . . . . . . . . . . . 971 901
557,334 434,545
The entity is domiciled in the Netherlands but its subsidiaries have operations in India and Malaysia. The Group has no
revenue from external customers in the Netherlands. Its revenue from external customers in India and Malaysia is shown
below.
Nine monthsperiod ended
March 31, 2011
Nine monthsperiod ended
March 31, 2010
India-domestic . . . . . . . . . . . . . . . . . . . . . . . . . . . . . . . . . . . . . . . . . . . . . . . . . . . . . . . . . . . . . . . . . . . . . . 400,040 296,862India-exports . . . . . . . . . . . . . . . . . . . . . . . . . . . . . . . . . . . . . . . . . . . . . . . . . . . . . . . . . . . . . . . . . . . . . . . 60,234 40,802Malaysia-domestic . . . . . . . . . . . . . . . . . . . . . . . . . . . . . . . . . . . . . . . . . . . . . . . . . . . . . . . . . . . . . . . . . . . 63,728 64,788Malaysia-exports . . . . . . . . . . . . . . . . . . . . . . . . . . . . . . . . . . . . . . . . . . . . . . . . . . . . . . . . . . . . . . . . . . . . 33,332 32,093
557,334 434,545
The breakdown of the major components of the total of revenue from external customers from other countries is disclosed
above. The revenues are distinguished based on trading currency.
The total of non-current assets other than financial instruments and deferred tax assets (there are no employment benefit assets
and rights arising under insurance contracts) located in the Netherlands was nil for all periods. The total of these non-current
assets located in India and Malaysia is disclosed below.
As at March 31,2011
As at June 30,2010
India . . . . . . . . . . . . . . . . . . . . . . . . . . . . . . . . . . . . . . . . . . . . . . . . . . . . . . . . . . . . . . . . . . . . . . . . . . . . . . . 749,937 698,139Malaysia . . . . . . . . . . . . . . . . . . . . . . . . . . . . . . . . . . . . . . . . . . . . . . . . . . . . . . . . . . . . . . . . . . . . . . . . . . . . 440,705 328,077
1,190,642 1,026,216
Revenues for the nine months ended March 30, 2011 and March 30, 2010 of respectively, US$63,853 and US$51,612 were
derived from a single external customer being the principal customer of the Kamalapuram production unit, which produces
rayon grade pulp.
— F-84 — Page 12
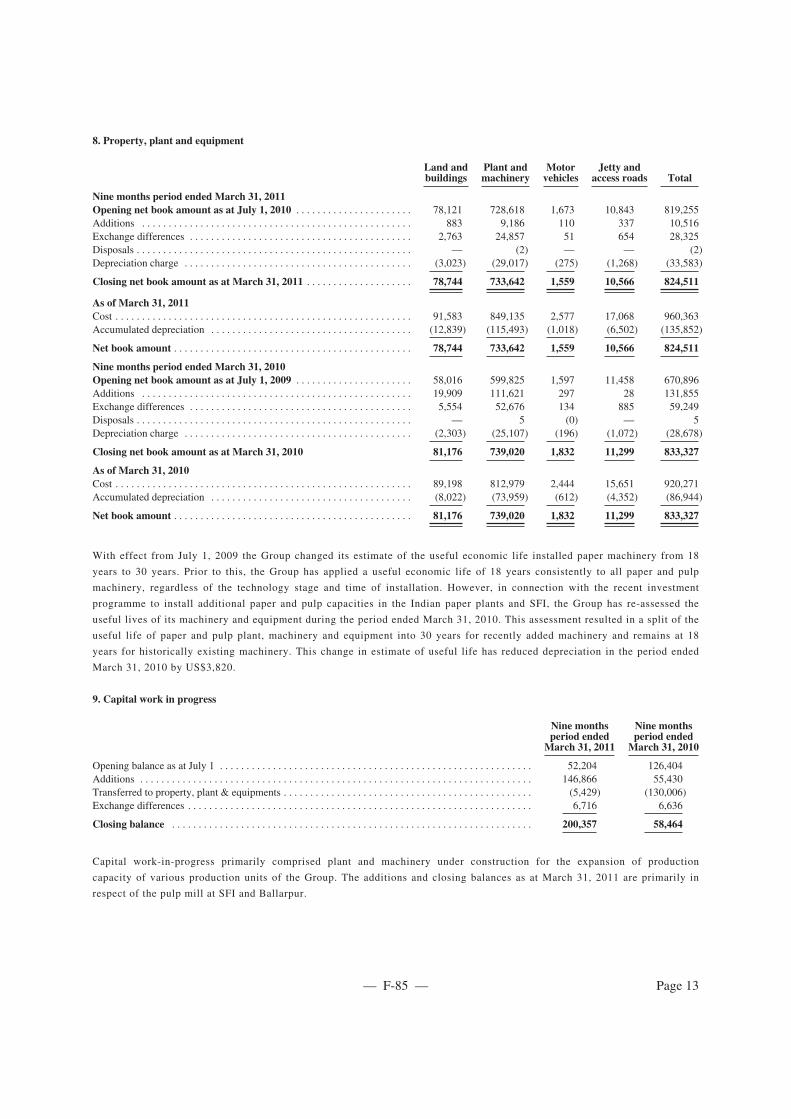
8. Property, plant and equipment
Land andbuildings
Plant andmachinery
Motorvehicles
Jetty andaccess roads Total
Nine months period ended March 31, 2011Opening net book amount as at July 1, 2010 . . . . . . . . . . . . . . . . . . . . . . 78,121 728,618 1,673 10,843 819,255Additions . . . . . . . . . . . . . . . . . . . . . . . . . . . . . . . . . . . . . . . . . . . . . . . . . . . 883 9,186 110 337 10,516Exchange differences . . . . . . . . . . . . . . . . . . . . . . . . . . . . . . . . . . . . . . . . . . 2,763 24,857 51 654 28,325Disposals . . . . . . . . . . . . . . . . . . . . . . . . . . . . . . . . . . . . . . . . . . . . . . . . . . . . — (2) — — (2)Depreciation charge . . . . . . . . . . . . . . . . . . . . . . . . . . . . . . . . . . . . . . . . . . . (3,023) (29,017) (275) (1,268) (33,583)
Closing net book amount as at March 31, 2011 . . . . . . . . . . . . . . . . . . . . 78,744 733,642 1,559 10,566 824,511
As of March 31, 2011Cost . . . . . . . . . . . . . . . . . . . . . . . . . . . . . . . . . . . . . . . . . . . . . . . . . . . . . . . . 91,583 849,135 2,577 17,068 960,363Accumulated depreciation . . . . . . . . . . . . . . . . . . . . . . . . . . . . . . . . . . . . . . (12,839) (115,493) (1,018) (6,502) (135,852)
Net book amount . . . . . . . . . . . . . . . . . . . . . . . . . . . . . . . . . . . . . . . . . . . . . 78,744 733,642 1,559 10,566 824,511
Nine months period ended March 31, 2010Opening net book amount as at July 1, 2009 . . . . . . . . . . . . . . . . . . . . . . 58,016 599,825 1,597 11,458 670,896Additions . . . . . . . . . . . . . . . . . . . . . . . . . . . . . . . . . . . . . . . . . . . . . . . . . . . 19,909 111,621 297 28 131,855Exchange differences . . . . . . . . . . . . . . . . . . . . . . . . . . . . . . . . . . . . . . . . . . 5,554 52,676 134 885 59,249Disposals . . . . . . . . . . . . . . . . . . . . . . . . . . . . . . . . . . . . . . . . . . . . . . . . . . . . — 5 (0) — 5Depreciation charge . . . . . . . . . . . . . . . . . . . . . . . . . . . . . . . . . . . . . . . . . . . (2,303) (25,107) (196) (1,072) (28,678)
Closing net book amount as at March 31, 2010 81,176 739,020 1,832 11,299 833,327
As of March 31, 2010Cost . . . . . . . . . . . . . . . . . . . . . . . . . . . . . . . . . . . . . . . . . . . . . . . . . . . . . . . . 89,198 812,979 2,444 15,651 920,271Accumulated depreciation . . . . . . . . . . . . . . . . . . . . . . . . . . . . . . . . . . . . . . (8,022) (73,959) (612) (4,352) (86,944)
Net book amount . . . . . . . . . . . . . . . . . . . . . . . . . . . . . . . . . . . . . . . . . . . . . 81,176 739,020 1,832 11,299 833,327
With effect from July 1, 2009 the Group changed its estimate of the useful economic life installed paper machinery from 18
years to 30 years. Prior to this, the Group has applied a useful economic life of 18 years consistently to all paper and pulp
machinery, regardless of the technology stage and time of installation. However, in connection with the recent investment
programme to install additional paper and pulp capacities in the Indian paper plants and SFI, the Group has re-assessed the
useful lives of its machinery and equipment during the period ended March 31, 2010. This assessment resulted in a split of the
useful life of paper and pulp plant, machinery and equipment into 30 years for recently added machinery and remains at 18
years for historically existing machinery. This change in estimate of useful life has reduced depreciation in the period ended
March 31, 2010 by US$3,820.
9. Capital work in progress
Nine monthsperiod ended
March 31, 2011
Nine monthsperiod ended
March 31, 2010
Opening balance as at July 1 . . . . . . . . . . . . . . . . . . . . . . . . . . . . . . . . . . . . . . . . . . . . . . . . . . . . . . . . . . . 52,204 126,404Additions . . . . . . . . . . . . . . . . . . . . . . . . . . . . . . . . . . . . . . . . . . . . . . . . . . . . . . . . . . . . . . . . . . . . . . . . . . 146,866 55,430Transferred to property, plant & equipments . . . . . . . . . . . . . . . . . . . . . . . . . . . . . . . . . . . . . . . . . . . . . . . (5,429) (130,006)Exchange differences . . . . . . . . . . . . . . . . . . . . . . . . . . . . . . . . . . . . . . . . . . . . . . . . . . . . . . . . . . . . . . . . . 6,716 6,636
Closing balance . . . . . . . . . . . . . . . . . . . . . . . . . . . . . . . . . . . . . . . . . . . . . . . . . . . . . . . . . . . . . . . . . . . . 200,357 58,464
Capital work-in-progress primarily comprised plant and machinery under construction for the expansion of production
capacity of various production units of the Group. The additions and closing balances as at March 31, 2011 are primarily in
respect of the pulp mill at SFI and Ballarpur.
— F-85 — Page 13
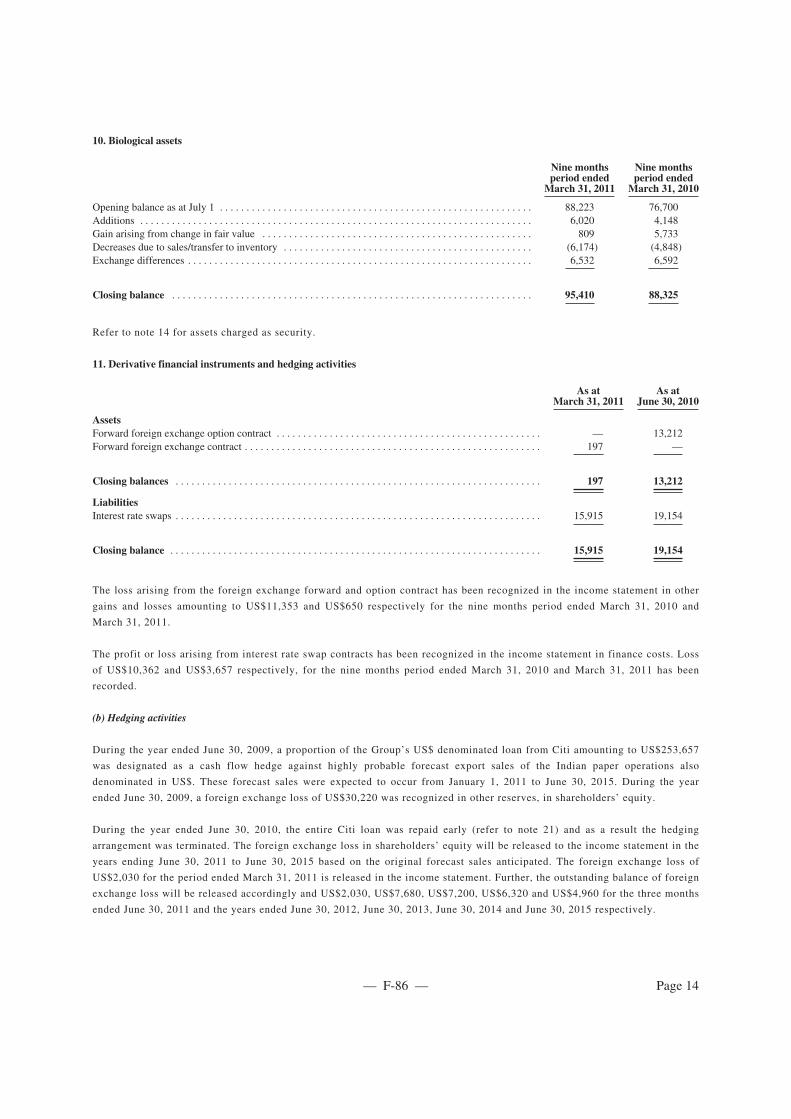
10. Biological assets
Nine monthsperiod ended
March 31, 2011
Nine monthsperiod ended
March 31, 2010
Opening balance as at July 1 . . . . . . . . . . . . . . . . . . . . . . . . . . . . . . . . . . . . . . . . . . . . . . . . . . . . . . . . . . . 88,223 76,700Additions . . . . . . . . . . . . . . . . . . . . . . . . . . . . . . . . . . . . . . . . . . . . . . . . . . . . . . . . . . . . . . . . . . . . . . . . . . 6,020 4,148Gain arising from change in fair value . . . . . . . . . . . . . . . . . . . . . . . . . . . . . . . . . . . . . . . . . . . . . . . . . . . 809 5,733Decreases due to sales/transfer to inventory . . . . . . . . . . . . . . . . . . . . . . . . . . . . . . . . . . . . . . . . . . . . . . . (6,174) (4,848)Exchange differences . . . . . . . . . . . . . . . . . . . . . . . . . . . . . . . . . . . . . . . . . . . . . . . . . . . . . . . . . . . . . . . . . 6,532 6,592
Closing balance . . . . . . . . . . . . . . . . . . . . . . . . . . . . . . . . . . . . . . . . . . . . . . . . . . . . . . . . . . . . . . . . . . . . 95,410 88,325
Refer to note 14 for assets charged as security.
11. Derivative financial instruments and hedging activities
As atMarch 31, 2011
As atJune 30, 2010
AssetsForward foreign exchange option contract . . . . . . . . . . . . . . . . . . . . . . . . . . . . . . . . . . . . . . . . . . . . . . . . . . — 13,212Forward foreign exchange contract . . . . . . . . . . . . . . . . . . . . . . . . . . . . . . . . . . . . . . . . . . . . . . . . . . . . . . . . 197 —
Closing balances . . . . . . . . . . . . . . . . . . . . . . . . . . . . . . . . . . . . . . . . . . . . . . . . . . . . . . . . . . . . . . . . . . . . . 197 13,212
LiabilitiesInterest rate swaps . . . . . . . . . . . . . . . . . . . . . . . . . . . . . . . . . . . . . . . . . . . . . . . . . . . . . . . . . . . . . . . . . . . . . 15,915 19,154
Closing balance . . . . . . . . . . . . . . . . . . . . . . . . . . . . . . . . . . . . . . . . . . . . . . . . . . . . . . . . . . . . . . . . . . . . . . 15,915 19,154
The loss arising from the foreign exchange forward and option contract has been recognized in the income statement in other
gains and losses amounting to US$11,353 and US$650 respectively for the nine months period ended March 31, 2010 and
March 31, 2011.
The profit or loss arising from interest rate swap contracts has been recognized in the income statement in finance costs. Loss
of US$10,362 and US$3,657 respectively, for the nine months period ended March 31, 2010 and March 31, 2011 has been
recorded.
(b) Hedging activities
During the year ended June 30, 2009, a proportion of the Group’s US$ denominated loan from Citi amounting to US$253,657
was designated as a cash flow hedge against highly probable forecast export sales of the Indian paper operations also
denominated in US$. These forecast sales were expected to occur from January 1, 2011 to June 30, 2015. During the year
ended June 30, 2009, a foreign exchange loss of US$30,220 was recognized in other reserves, in shareholders’ equity.
During the year ended June 30, 2010, the entire Citi loan was repaid early (refer to note 21) and as a result the hedging
arrangement was terminated. The foreign exchange loss in shareholders’ equity will be released to the income statement in the
years ending June 30, 2011 to June 30, 2015 based on the original forecast sales anticipated. The foreign exchange loss of
US$2,030 for the period ended March 31, 2011 is released in the income statement. Further, the outstanding balance of foreign
exchange loss will be released accordingly and US$2,030, US$7,680, US$7,200, US$6,320 and US$4,960 for the three months
ended June 30, 2011 and the years ended June 30, 2012, June 30, 2013, June 30, 2014 and June 30, 2015 respectively.
— F-86 — Page 14
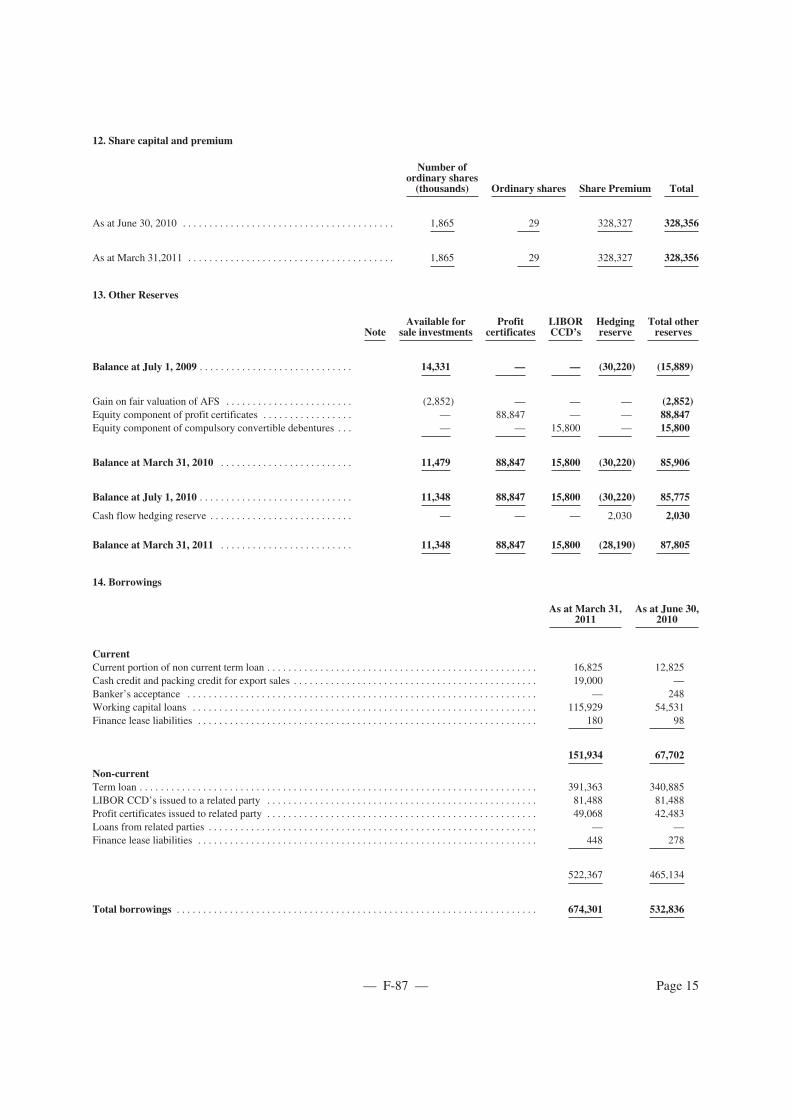
12. Share capital and premium
Number ofordinary shares(thousands) Ordinary shares Share Premium Total
As at June 30, 2010 . . . . . . . . . . . . . . . . . . . . . . . . . . . . . . . . . . . . . . . . 1,865 29 328,327 328,356
As at March 31,2011 . . . . . . . . . . . . . . . . . . . . . . . . . . . . . . . . . . . . . . . 1,865 29 328,327 328,356
13. Other Reserves
NoteAvailable for
sale investmentsProfit
certificatesLIBORCCD’s
Hedgingreserve
Total otherreserves
Balance at July 1, 2009 . . . . . . . . . . . . . . . . . . . . . . . . . . . . . 14,331 — — (30,220) (15,889)
Gain on fair valuation of AFS . . . . . . . . . . . . . . . . . . . . . . . . (2,852) — — — (2,852)Equity component of profit certificates . . . . . . . . . . . . . . . . . — 88,847 — — 88,847Equity component of compulsory convertible debentures . . . — — 15,800 — 15,800
Balance at March 31, 2010 . . . . . . . . . . . . . . . . . . . . . . . . . 11,479 88,847 15,800 (30,220) 85,906
Balance at July 1, 2010 . . . . . . . . . . . . . . . . . . . . . . . . . . . . . 11,348 88,847 15,800 (30,220) 85,775
Cash flow hedging reserve . . . . . . . . . . . . . . . . . . . . . . . . . . . — — — 2,030 2,030
Balance at March 31, 2011 . . . . . . . . . . . . . . . . . . . . . . . . . 11,348 88,847 15,800 (28,190) 87,805
14. Borrowings
As at March 31,2011
As at June 30,2010
CurrentCurrent portion of non current term loan . . . . . . . . . . . . . . . . . . . . . . . . . . . . . . . . . . . . . . . . . . . . . . . . . . . 16,825 12,825Cash credit and packing credit for export sales . . . . . . . . . . . . . . . . . . . . . . . . . . . . . . . . . . . . . . . . . . . . . . 19,000 —Banker’s acceptance . . . . . . . . . . . . . . . . . . . . . . . . . . . . . . . . . . . . . . . . . . . . . . . . . . . . . . . . . . . . . . . . . . — 248Working capital loans . . . . . . . . . . . . . . . . . . . . . . . . . . . . . . . . . . . . . . . . . . . . . . . . . . . . . . . . . . . . . . . . . 115,929 54,531Finance lease liabilities . . . . . . . . . . . . . . . . . . . . . . . . . . . . . . . . . . . . . . . . . . . . . . . . . . . . . . . . . . . . . . . . 180 98
151,934 67,702
Non-currentTerm loan . . . . . . . . . . . . . . . . . . . . . . . . . . . . . . . . . . . . . . . . . . . . . . . . . . . . . . . . . . . . . . . . . . . . . . . . . . . 391,363 340,885LIBOR CCD’s issued to a related party . . . . . . . . . . . . . . . . . . . . . . . . . . . . . . . . . . . . . . . . . . . . . . . . . . . 81,488 81,488Profit certificates issued to related party . . . . . . . . . . . . . . . . . . . . . . . . . . . . . . . . . . . . . . . . . . . . . . . . . . . 49,068 42,483Loans from related parties . . . . . . . . . . . . . . . . . . . . . . . . . . . . . . . . . . . . . . . . . . . . . . . . . . . . . . . . . . . . . . — —Finance lease liabilities . . . . . . . . . . . . . . . . . . . . . . . . . . . . . . . . . . . . . . . . . . . . . . . . . . . . . . . . . . . . . . . . 448 278
522,367 465,134
Total borrowings . . . . . . . . . . . . . . . . . . . . . . . . . . . . . . . . . . . . . . . . . . . . . . . . . . . . . . . . . . . . . . . . . . . . 674,301 532,836
— F-87 — Page 15

Term loans
The following table shows the movement in term loans.
Nine monthsperiod ended
March 31, 2011
Nine monthsperiod ended
March 31, 2010
Opening Balance as at July 1 . . . . . . . . . . . . . . . . . . . . . . . . . . . . . . . . . . . . . . . . . . . . . . . . . . . . . . . . . . . 353,710 481,395Drawdown during the year . . . . . . . . . . . . . . . . . . . . . . . . . . . . . . . . . . . . . . . . . . . . . . . . . . . . . . . . . . . . 397,959 358,057Repayment during the year . . . . . . . . . . . . . . . . . . . . . . . . . . . . . . . . . . . . . . . . . . . . . . . . . . . . . . . . . . . . (348,327) (498,286)Transaction costs paid during the year . . . . . . . . . . . . . . . . . . . . . . . . . . . . . . . . . . . . . . . . . . . . . . . . . . . . (9,005) (7,619)Amortization of transaction costs . . . . . . . . . . . . . . . . . . . . . . . . . . . . . . . . . . . . . . . . . . . . . . . . . . . . . . . 598 779Expense of unamortized transaction costs . . . . . . . . . . . . . . . . . . . . . . . . . . . . . . . . . . . . . . . . . . . . . . . . . 6,259 17,552Exchange Loss/Gain . . . . . . . . . . . . . . . . . . . . . . . . . . . . . . . . . . . . . . . . . . . . . . . . . . . . . . . . . . . . . . . . . 6,994 8,274
Closing Balance . . . . . . . . . . . . . . . . . . . . . . . . . . . . . . . . . . . . . . . . . . . . . . . . . . . . . . . . . . . . . . . . . . . . 408,188 360,152
Current Portion . . . . . . . . . . . . . . . . . . . . . . . . . . . . . . . . . . . . . . . . . . . . . . . . . . . . . . . . . . . . . . . . . . . . . 16,825 8,547Non Current Portion . . . . . . . . . . . . . . . . . . . . . . . . . . . . . . . . . . . . . . . . . . . . . . . . . . . . . . . . . . . . . . . . . . 391,363 351,605
Total . . . . . . . . . . . . . . . . . . . . . . . . . . . . . . . . . . . . . . . . . . . . . . . . . . . . . . . . . . . . . . . . . . . . . . . . . . . . . 408,188 360,152
The following table summarizes the draw downs and repayments by facility, each of them is explained in more detail further
below
Nine monthsperiod ended
March 31, 2011
Nine monthsperiod ended
March 31, 2010
Drawdowns—Rabobank (BGPPL) . . . . . . . . . . . . . . . . . . . . . . . . . . . . . . . . . . . . . . . . . . . . . . . . . . . . . . . . . . . . . . . 145,000 —— Rabobank (SFI) . . . . . . . . . . . . . . . . . . . . . . . . . . . . . . . . . . . . . . . . . . . . . . . . . . . . . . . . . . . . . . . . . . . 50,000 —— ING/Nordea Bank . . . . . . . . . . . . . . . . . . . . . . . . . . . . . . . . . . . . . . . . . . . . . . . . . . . . . . . . . . . . . . . . . 39,220 —— IDBI/Axis/CBI . . . . . . . . . . . . . . . . . . . . . . . . . . . . . . . . . . . . . . . . . . . . . . . . . . . . . . . . . . . . . . . . . . . — 213,057— NCD’S . . . . . . . . . . . . . . . . . . . . . . . . . . . . . . . . . . . . . . . . . . . . . . . . . . . . . . . . . . . . . . . . . . . . . . . . . 163,739 —— Axis Bank . . . . . . . . . . . . . . . . . . . . . . . . . . . . . . . . . . . . . . . . . . . . . . . . . . . . . . . . . . . . . . . . . . . . . . . — 145,000
Total draw downs . . . . . . . . . . . . . . . . . . . . . . . . . . . . . . . . . . . . . . . . . . . . . . . . . . . . . . . . . . . . . . . . . . . 397,959 358,057
Repayments—Citigroup . . . . . . . . . . . . . . . . . . . . . . . . . . . . . . . . . . . . . . . . . . . . . . . . . . . . . . . . . . . . . . . . . . . . . . . . — (498,286)— IDBI/Axis Bank . . . . . . . . . . . . . . . . . . . . . . . . . . . . . . . . . . . . . . . . . . . . . . . . . . . . . . . . . . . . . . . . . . (196,507) —— Axis Bank . . . . . . . . . . . . . . . . . . . . . . . . . . . . . . . . . . . . . . . . . . . . . . . . . . . . . . . . . . . . . . . . . . . . . . . (145,000) —— Rabobank (BGPPL) . . . . . . . . . . . . . . . . . . . . . . . . . . . . . . . . . . . . . . . . . . . . . . . . . . . . . . . . . . . . . . . (6,820) —
Total repayments . . . . . . . . . . . . . . . . . . . . . . . . . . . . . . . . . . . . . . . . . . . . . . . . . . . . . . . . . . . . . . . . . . . (348,327) (498,286)
Note on significant movement of borrowings
(a) Term loan from consortium led by Citigroup Global Markets PTE Ltd. (“Citigroup”)
Under the original terms of the Citigroup agreement, repayment was scheduled to commence from December 2010 and be
repayable in various installments until March 2015. However, in October 2009 BPH prepaid the entire outstanding amount of
the loan, amounting to US$498,286, to avoid interest penalties following the breach of its borrowing conditions.
The loan was repaid by way of proceeds of sale of INR10,000,000 (US$209,118) of BGPPL’s 9% CCDs, the issue of
compulsory convertible debentures for an amount of US$100,000 and profit certificates for an amount of US$55,000. This
financing was all obtained from related parties. In addition the Group obtained a US$145,000 term loan from a consortium of
banks led by Axis Bank, further details of which are given below. As a result of the early repayment US$17,552 of
unamortized transaction costs on the Citigroup loan was expensed.
— F-88 — Page 16

(b) Term loans from a consortium led by IDBI Bank
In November 2009 BGPPL obtained a loan for INR10,000,000 (US$213,057) from a consortium led by IDBI Bank, Of this
lNR7,500,000 (US$159,793) was borrowed from IDBI Bank at Bank Prime Lending Rate (“BPLR”) less 2.5%, INR1,500,000
(US$31,959) was borrowed from Axis Bank at BPLR less 4.5% and INR1,000,000 (US$21,306) was borrowed from the
Central Bank of India (“CBI”) at BPLR less 1.75%. The various parts of the loan were repayable from June 2011 to December
2016. In December 2010 INR9,000,000 (US$196,507), representing the IDBI Bank and Axis portions of the loan was repaid.
Unamortised transaction cost of US$1,725 was expensed. As at March 31, 2011 the CBI portion of INR1,000,000 (US$21,864)
was outstanding. The loan is secured on all the assets of BGPPL except for certain specified land and properties.
(c) Term loan from consortium led by Axis Bank
In order to partially refinance the Citigroup loan, in October 2009 BIPH obtained a loan from a consortium led by Axis Bank
for US$145,000 at LIBOR plus a margin of 4.10%. The loan was repayable in instalments from March 2011 to December
2014. The loan was prepaid in November 2010 and was refinanced by way of a loan from a consortium led by Rabobank.
Unamortised transaction cost of US$4,534 was expensed.
(d) Term loans from consortiums led by Rabobank
In order to refinance the Axis Bank loan, in September 2010 BGPPL obtained a loan from a consortium led by Rabobank for
US$145,000 at LIBOR plus a margin of 2.8%. The loan was drawn down in November 2010 and is repayable in instalments
from February 2011 to May 2015. The loan is secured against all the movable and immovable fixed assets of the BGPPL
Instalment of US$6820 was repaid in February. As at March 31, 2011, US$137,812 is outstanding.
In addition in July 2010 SFI obtained a loan from Rabobank for US$50,000 at LIBOR plus a margin of 3.65%. The loan was
drawn down from July 2010 to December 2010 and is repayable in instalments from March 2013 to September 2016. The loan
is secured against all the current and fixed assets of the SFI.
(e) Non convertible debentures
In September 2010 BGPPL issued two tranches of non convertible debentures (“NCD”) of INR2,500,000 each and totalling
INR5,000,000 (US$109,408) in issues arranged by ICICI Bank and Yes Bank. The NCDs carry, respectively, a rate of 9.65%
and 8.75% to 9.90% and are repayable in instalments from September 2012 to September 2017. In December 2010 BGGPL
issued a further INR2,500,000 NCD (US$54,331) arranged by ICICI Bank with an interest rate in the range of 9.00% to
9.75%. This is repayable in instalments from December 2012 to June 2017. The debenture is secured by pari-passu first charge
on the fixed assets of the BGPPL.
(f) Term loan from ING and Nordea Bank
In July 2010 SFI obtained from ING and Nordea Bank a €28,800 loan at EURIBOR plus a margin of 1.5%. The loan was
drawn down in instalments from December 2010 to February 2011 and is repayable in instalments from December 2011 to
December 2019. The loan is secured against all the current and fixed assets of the SFI.
15. Income Tax
Income tax expense is recognized based on management’s best estimate of the weighted average annual income tax rate
expected for the full financial year. The estimated average annual tax rate used for the nine months ended March 31, 2011 is
33.22% (the estimated tax rate for the nine months ended March 31, 2010 was 33.22%). The increase in tax expense in current
period compared to the prior period is mainly due to recognition of deferred tax asset relating to losses of SFI in 2010
amounting to USD10,377.
— F-89 — Page 17

Nine monthsperiod ended
March 31, 2011
Nine monthsperiod ended
March 31, 2010
Current tax . . . . . . . . . . . . . . . . . . . . . . . . . . . . . . . . . . . . . . . . . . . . . . . . . . . . . . . . . . . . . . . . . . . . . . . . . 6,412 2,347Deferred tax . . . . . . . . . . . . . . . . . . . . . . . . . . . . . . . . . . . . . . . . . . . . . . . . . . . . . . . . . . . . . . . . . . . . . . . . 5,302 (2,451)
11,714 (104)
16. Deferred Income tax
The analysis of deferred tax assets and deferred tax liabilities is as follows. A net asset or liability is recorded based on the net
tax position in each tax jurisdiction.
The balance of deferred tax assets and liabilities is as follows:
As at March 31,2011
As at June 30,2010
Deferred tax assets:Deferred tax assets to be recovered after more than 12 months . . . . . . . . . . . . . . . . . . . . . . . . . . . . . . . . . 55,001 49,672Deferred tax assets to be recovered within 12 . . . . . . . . . . . . . . . . . . . . . . . . . . . . . . . . . . . . . . . . . . . . . . . 5,130 5,405
60,131 55,077
Deferred tax liabilities:Deferred tax liabilities to be recovered after more than 12 months . . . . . . . . . . . . . . . . . . . . . . . . . . . . . . . 69,507 59,401Deferred tax liabilities to be recovered within 12 months . . . . . . . . . . . . . . . . . . . . . . . . . . . . . . . . . . . . . . 1,457 1,625
70,964 61,026
Deferred tax assets, net . . . . . . . . . . . . . . . . . . . . . . . . . . . . . . . . . . . . . . . . . . . . . . . . . . . . . . . . . . . . . . . 11,636 10,836
Deferred tax liabilities, net . . . . . . . . . . . . . . . . . . . . . . . . . . . . . . . . . . . . . . . . . . . . . . . . . . . . . . . . . . . . 22,468 16,785
The gross movement on the deferred income tax account is as follows:
Deferred Tax Asset, net
Nine monthsperiod ended
March 31, 2011
Nine monthsperiod ended
March 31, 2010
Opening balance as at July 1 . . . . . . . . . . . . . . . . . . . . . . . . . . . . . . . . . . . . . . . . . . . . . . . . . . . . . . . . . . . 10,836 —Exchange differences . . . . . . . . . . . . . . . . . . . . . . . . . . . . . . . . . . . . . . . . . . . . . . . . . . . . . . . . . . . . . . . . . 800 542Income statement charge / (credit) . . . . . . . . . . . . . . . . . . . . . . . . . . . . . . . . . . . . . . . . . . . . . . . . . . . . . . . — 10,233
Closing balance, net asset . . . . . . . . . . . . . . . . . . . . . . . . . . . . . . . . . . . . . . . . . . . . . . . . . . . . . . . . . . . . 11,636 10,775
Deferred tax liabilities, net
Nine monthsperiod ended
March 31, 2011
Nine monthsperiod ended
March 31, 2010
Opening balance as at July 1 . . . . . . . . . . . . . . . . . . . . . . . . . . . . . . . . . . . . . . . . . . . . . . . . . . . . . . . . . . . 16,785 11,222Exchange differences . . . . . . . . . . . . . . . . . . . . . . . . . . . . . . . . . . . . . . . . . . . . . . . . . . . . . . . . . . . . . . . . . 381 650Income statement charge / (credit) . . . . . . . . . . . . . . . . . . . . . . . . . . . . . . . . . . . . . . . . . . . . . . . . . . . . . . . 5,302 7,782
Closing balance, net asset . . . . . . . . . . . . . . . . . . . . . . . . . . . . . . . . . . . . . . . . . . . . . . . . . . . . . . . . . . . . 22,468 19,654
The movement during the year in utilizing the current year tax profits have been netted with the available unrecognized
cumulative taxes, therefore no movement is disclosed.
— F-90 — Page 18

17. Raw materials and consumables used
Nine monthsperiod ended
March 31, 2011
Nine monthsperiod ended
March 31, 2010
Raw materials . . . . . . . . . . . . . . . . . . . . . . . . . . . . . . . . . . . . . . . . . . . . . . . . . . . . . . . . . . . . . . . . . . . . . . 215,771 149,589Stores and consumables . . . . . . . . . . . . . . . . . . . . . . . . . . . . . . . . . . . . . . . . . . . . . . . . . . . . . . . . . . . . . . . 103,608 81,580Power and fuel . . . . . . . . . . . . . . . . . . . . . . . . . . . . . . . . . . . . . . . . . . . . . . . . . . . . . . . . . . . . . . . . . . . . . . 68,101 54,645Change in finished goods stock . . . . . . . . . . . . . . . . . . . . . . . . . . . . . . . . . . . . . . . . . . . . . . . . . . . . . . . . . (4,700) (4,813)Others . . . . . . . . . . . . . . . . . . . . . . . . . . . . . . . . . . . . . . . . . . . . . . . . . . . . . . . . . . . . . . . . . . . . . . . . . . . . . 3,630 4,199
386,410 285,200
18. Finance Cost
Nine monthsperiod ended
March 31, 2011
Nine monthsperiod ended
March 31, 2010
Net foreign exchange loss/(gain) . . . . . . . . . . . . . . . . . . . . . . . . . . . . . . . . . . . . . . . . . . . . . . . . . . . . . . . . (2,407) (40,329)Interest on bank borrowings . . . . . . . . . . . . . . . . . . . . . . . . . . . . . . . . . . . . . . . . . . . . . . . . . . . . . . . . . . . 19,641 23,606Interest on debentures . . . . . . . . . . . . . . . . . . . . . . . . . . . . . . . . . . . . . . . . . . . . . . . . . . . . . . . . . . . . . . . . 7,222 1,761Net fair value loss/(gain) on interest rate swaps . . . . . . . . . . . . . . . . . . . . . . . . . . . . . . . . . . . . . . . . . . . . (3,240) 1,659Debt extinguishment costs . . . . . . . . . . . . . . . . . . . . . . . . . . . . . . . . . . . . . . . . . . . . . . . . . . . . . . . . . . . . . 6,259 17,552Realized loss on derivative financial instruments . . . . . . . . . . . . . . . . . . . . . . . . . . . . . . . . . . . . . . . . . . . 6,897 8,703Interest on loans from related parties . . . . . . . . . . . . . . . . . . . . . . . . . . . . . . . . . . . . . . . . . . . . . . . . . . . . . 3,561 3,102Interest on working capital term loans . . . . . . . . . . . . . . . . . . . . . . . . . . . . . . . . . . . . . . . . . . . . . . . . . . . . 2,091 1,534Other transaction costs* . . . . . . . . . . . . . . . . . . . . . . . . . . . . . . . . . . . . . . . . . . . . . . . . . . . . . . . . . . . . . . . 4,552 —Other charges . . . . . . . . . . . . . . . . . . . . . . . . . . . . . . . . . . . . . . . . . . . . . . . . . . . . . . . . . . . . . . . . . . . . . . . 2,011 3,006
46,587 20,594
Less: Amounts capitalized as qualifying assets . . . . . . . . . . . . . . . . . . . . . . . . . . . . . . . . . . . . . . . . . . . . . 4,928 829
Finance cost . . . . . . . . . . . . . . . . . . . . . . . . . . . . . . . . . . . . . . . . . . . . . . . . . . . . . . . . . . . . . . . . . . . . . . . 41,659 19,765
* During the current period, the Company incurred certain transaction costs for a proposed equity offering. Since, the
proposed offering has been deferred, these costs have been expensed off in the financial statements.
The table below shows the applicable capitalization rates in respect of borrowing costs capitalized on qualifying assets:
Mar 2011 Mar 2010
Capitalization rate . . . . . . . . . . . . . . . . . . . . . . . . . . . . . . . . . . . . . . . . . . . . . . . . . . . . . . . . . . . . . . . . . . . . . 4.8% 3.4%
19. Earning per share
(a) Basic
Basic earnings per share is calculated by dividing the profit attributable to equity holders of the Company by the weighted
average number of ordinary shares in issue during the year/period.
Nine monthsperiod ended
March 31, 2011
Nine monthsperiod ended
March 31, 2010
Profit/(loss) attributable to owners of the parent . . . . . . . . . . . . . . . . . . . . . . . . . . . . . . . . . . . . . . . . . . . . 13,484 36,611
Weighted average number of ordinary shares in issue (thousands) . . . . . . . . . . . . . . . . . . . . . . . . . . . . . . 1,865 1,865
— F-91 — Page 19

(b) Diluted
Diluted earnings per share is calculated by adjusting the weighted average number of ordinary shares outstanding to assume
conversion of all dilutive potential ordinary shares. The Company has no dilutive potential shares or dilutive earnings and
accordingly diluted earnings per share is the same as basic earnings per share.
20. Contingencies
Reference is drawn to the note on contingencies in the financial statements for the year ended June 30, 2010. No new
significant claims have been lodged against the Group during the period. The Group, believes based on legal opinions received
during the period, that there will not be outflow of resources embodying economic benefits for contingent liabilities of the
Group.
21. Capital Commitments
Capital expenditure contracted for is as follows:
As at March 31,2011
As at June 31,2010
Purchase of property, plant and equipments . . . . . . . . . . . . . . . . . . . . . . . . . . . . . . . . . . . . . . . . . . . . . . . . 114,841 123,691
Total capital commitments . . . . . . . . . . . . . . . . . . . . . . . . . . . . . . . . . . . . . . . . . . . . . . . . . . . . . . . . . . . . 114,841 123,691
22. Related party transactions
The Group is controlled by BIH, which owns 79.53% of the Company as on March 31, 2011. The ultimate parent of the Group
is Ballarpur. Ballarpur is controlled by the Avantha Group, whose subsidiaries and affiliates are therefore also considered
related parties to the Group and disclosed as follows:
The following transactions were carried out with the related parties:
(a) Sale of goods and services
Nine monthsperiod ended
March 31, 2011
Nine monthsperiod ended
March 31, 2010
Ballarpur Industries Limited . . . . . . . . . . . . . . . . . . . . . . . . . . . . . . . . . . . . . . . . . . . . . . . . . . . . . . . . . . . 3,803 8,664Imerys New Quest Inda Pvt. Ltd . . . . . . . . . . . . . . . . . . . . . . . . . . . . . . . . . . . . . . . . . . . . . . . . . . . . . . . . 1,299 1,038Avantha Power & Infrastructure Ltd . . . . . . . . . . . . . . . . . . . . . . . . . . . . . . . . . . . . . . . . . . . . . . . . . . . . . 139 159APR Sacs Limited . . . . . . . . . . . . . . . . . . . . . . . . . . . . . . . . . . . . . . . . . . . . . . . . . . . . . . . . . . . . . . . . . . . 5,440 3,688
10,681 13,549
— F-92 — Page 20

(b) Purchase of goods and services
Nine monthsperiod ended
March 31, 2011
Nine monthsperiod ended
March 31, 2010
Ballarpur Industries Limited . . . . . . . . . . . . . . . . . . . . . . . . . . . . . . . . . . . . . . . . . . . . . . . . . . . . . . . . . . . 454 2,978Biltech Building Elements Limited . . . . . . . . . . . . . . . . . . . . . . . . . . . . . . . . . . . . . . . . . . . . . . . . . . . . . . 158 —SMI New Quest Inda Pvt. Ltd . . . . . . . . . . . . . . . . . . . . . . . . . . . . . . . . . . . . . . . . . . . . . . . . . . . . . . . . . . 5,218 1,189Avantha Holdings Limited . . . . . . . . . . . . . . . . . . . . . . . . . . . . . . . . . . . . . . . . . . . . . . . . . . . . . . . . . . . . . 15,113 4,167Imerys New Quest Inda Pvt. Ltd . . . . . . . . . . . . . . . . . . . . . . . . . . . . . . . . . . . . . . . . . . . . . . . . . . . . . . . . 12,905 11,331Avantha Power & Infrastructure Ltd . . . . . . . . . . . . . . . . . . . . . . . . . . . . . . . . . . . . . . . . . . . . . . . . . . . . . 62,133 37,869Crompton Greaves Ltd . . . . . . . . . . . . . . . . . . . . . . . . . . . . . . . . . . . . . . . . . . . . . . . . . . . . . . . . . . . . . . . . 2,105 139Solaris Chemitech Ltd. . . . . . . . . . . . . . . . . . . . . . . . . . . . . . . . . . . . . . . . . . . . . . . . . . . . . . . . . . . . . . . . 25 1Mirablle Trading Pte. Ltd. . . . . . . . . . . . . . . . . . . . . . . . . . . . . . . . . . . . . . . . . . . . . . . . . . . . . . . . . . . . . . 35,915 23,932Saraswati Travels Private Limited . . . . . . . . . . . . . . . . . . . . . . . . . . . . . . . . . . . . . . . . . . . . . . . . . . . . . . . 2,942 591Leading Line Merchant Traders (P) Limited . . . . . . . . . . . . . . . . . . . . . . . . . . . . . . . . . . . . . . . . . . . . . . . 2,806 717BILT Tree Tech . . . . . . . . . . . . . . . . . . . . . . . . . . . . . . . . . . . . . . . . . . . . . . . . . . . . . . . . . . . . . . . . . . . . . 18 31Avantha Technologies Limited . . . . . . . . . . . . . . . . . . . . . . . . . . . . . . . . . . . . . . . . . . . . . . . . . . . . . . . . . 166 131ASA Agencies Pvt. Ltd. . . . . . . . . . . . . . . . . . . . . . . . . . . . . . . . . . . . . . . . . . . . . . . . . . . . . . . . . . . . . . . . 1,087 50
141,045 83,126
(c) Year-end payables from related parties:
As atMarch 31, 2011
As atJune 30, 2010
Ballarpur Industries Limited . . . . . . . . . . . . . . . . . . . . . . . . . . . . . . . . . . . . . . . . . . . . . . . . . . . . . . . . . . . . . 1,098 142Ballarpur International Holdings B.V. . . . . . . . . . . . . . . . . . . . . . . . . . . . . . . . . . . . . . . . . . . . . . . . . . . . . . 2,020 26Biltech Building Elements Limited . . . . . . . . . . . . . . . . . . . . . . . . . . . . . . . . . . . . . . . . . . . . . . . . . . . . . . . . 53 44SMI New Quest Inda Pvt. Ltd . . . . . . . . . . . . . . . . . . . . . . . . . . . . . . . . . . . . . . . . . . . . . . . . . . . . . . . . . . . . — 322Avantha Holdings Limited . . . . . . . . . . . . . . . . . . . . . . . . . . . . . . . . . . . . . . . . . . . . . . . . . . . . . . . . . . . . . . 399 339Imerys New Quest Inda Pvt. Ltd . . . . . . . . . . . . . . . . . . . . . . . . . . . . . . . . . . . . . . . . . . . . . . . . . . . . . . . . . . 3,517 —Avantha Power & Infrastructure Ltd . . . . . . . . . . . . . . . . . . . . . . . . . . . . . . . . . . . . . . . . . . . . . . . . . . . . . . . 259 3,381Crompton Greaves Ltd. . . . . . . . . . . . . . . . . . . . . . . . . . . . . . . . . . . . . . . . . . . . . . . . . . . . . . . . . . . . . . . . . . 9 4Mirablle Trading Pte. Ltd. . . . . . . . . . . . . . . . . . . . . . . . . . . . . . . . . . . . . . . . . . . . . . . . . . . . . . . . . . . . . . . . 1,489 3,405Saraswati Travels Private Limited . . . . . . . . . . . . . . . . . . . . . . . . . . . . . . . . . . . . . . . . . . . . . . . . . . . . . . . . 292 86Leading Line Merchant Traders (P) Limited . . . . . . . . . . . . . . . . . . . . . . . . . . . . . . . . . . . . . . . . . . . . . . . . 260 6BILT Tree Tech . . . . . . . . . . . . . . . . . . . . . . . . . . . . . . . . . . . . . . . . . . . . . . . . . . . . . . . . . . . . . . . . . . . . . . . — 25Avanatha International Asset BV . . . . . . . . . . . . . . . . . . . . . . . . . . . . . . . . . . . . . . . . . . . . . . . . . . . . . . . . . 973 984ASA Agencies Pvt. Ltd. . . . . . . . . . . . . . . . . . . . . . . . . . . . . . . . . . . . . . . . . . . . . . . . . . . . . . . . . . . . . . . . . 1,085 —Ballarpur Specialty Paper Holdings Limited . . . . . . . . . . . . . . . . . . . . . . . . . . . . . . . . . . . . . . . . . . . . . . . . — 1
11,454 8,765
— F-93 — Page 21

(e) Year-end receivables from related parties:
As atMarch 31, 2011
As atJune 30, 2010
Ballarpur Industries Limited . . . . . . . . . . . . . . . . . . . . . . . . . . . . . . . . . . . . . . . . . . . . . . . . . . . . . . . . . . . . . 9,272 —Ballarpur International Holdings B V . . . . . . . . . . . . . . . . . . . . . . . . . . . . . . . . . . . . . . . . . . . . . . . . . . . . . . 438 39Biltech Building Elements Limited . . . . . . . . . . . . . . . . . . . . . . . . . . . . . . . . . . . . . . . . . . . . . . . . . . . . . . . . — 1BILT Tree Tech . . . . . . . . . . . . . . . . . . . . . . . . . . . . . . . . . . . . . . . . . . . . . . . . . . . . . . . . . . . . . . . . . . . . . . . 6 —Avantha Power & Infrastructure Ltd . . . . . . . . . . . . . . . . . . . . . . . . . . . . . . . . . . . . . . . . . . . . . . . . . . . . . . . 15,833 195APR Sacs Limited . . . . . . . . . . . . . . . . . . . . . . . . . . . . . . . . . . . . . . . . . . . . . . . . . . . . . . . . . . . . . . . . . . . . . 2,621 1,327Ballarpur Packing Holdings Limited . . . . . . . . . . . . . . . . . . . . . . . . . . . . . . . . . . . . . . . . . . . . . . . . . . . . . . . — 2Ballarpur Specialty Paper Holdings Limited . . . . . . . . . . . . . . . . . . . . . . . . . . . . . . . . . . . . . . . . . . . . . . . . 13 4Ballarpur lnternational Packing Holdings Limited . . . . . . . . . . . . . . . . . . . . . . . . . . . . . . . . . . . . . . . . . . . . 26 —TAF Asset 2 B.V. . . . . . . . . . . . . . . . . . . . . . . . . . . . . . . . . . . . . . . . . . . . . . . . . . . . . . . . . . . . . . . . . . . . . . 18 4Vitringa B.V. . . . . . . . . . . . . . . . . . . . . . . . . . . . . . . . . . . . . . . . . . . . . . . . . . . . . . . . . . . . . . . . . . . . . . . . . . 11 10SMI New Quest Inda Pvt. Ltd . . . . . . . . . . . . . . . . . . . . . . . . . . . . . . . . . . . . . . . . . . . . . . . . . . . . . . . . . . . . 42 —Avanatha International Asset BV . . . . . . . . . . . . . . . . . . . . . . . . . . . . . . . . . . . . . . . . . . . . . . . . . . . . . . . . . 32 17Avantha International Holdings . . . . . . . . . . . . . . . . . . . . . . . . . . . . . . . . . . . . . . . . . . . . . . . . . . . . . . . . . . 8 1ASA Agencies Pvt. Ltd. . . . . . . . . . . . . . . . . . . . . . . . . . . . . . . . . . . . . . . . . . . . . . . . . . . . . . . . . . . . . . . . . 2 5
28,322 1,605
(f) Borrowings from related parties
Refer to note 14 for detailed information about borrowings from related parties at each balance sheet date.
(g) Interest expense to related parties
Nine monthsperiod ended
March 31, 2011
Nine monthsperiod ended
March 31, 2010
Ballarpur Industries Limited . . . . . . . . . . . . . . . . . . . . . . . . . . . . . . . . . . . . . . . . . . . . . . . . . . . . . . . . . . . — 1,747Ballarpur International Holdings B.V. . . . . . . . . . . . . . . . . . . . . . . . . . . . . . . . . . . . . . . . . . . . . . . . . . . . . 401 1,156Avantha International Asset B.V. . . . . . . . . . . . . . . . . . . . . . . . . . . . . . . . . . . . . . . . . . . . . . . . . . . . . . . . 3,160 1,960
3,561 4,863
23. The Group has net current liability position as at March 31, 2011 primarily due to increase in capital creditors
and increase in short term borrowings. These balances have increased due to capital expansion plans of the
Company. The Group is earning profits and has positive cash flows from operations. The directors believe the
Group will be able to manage the cash flows for at least the next twelve months.
24. Events after the balance sheet date
The Group entered into following transactions:
1. On June 29, 2011 the LIBOR CCD issued to a related party have been converted into cumulative preference shares in
accordance with the terms of the instrument and thereafter 186,546 equity shares of BIGPH valued at USD 100 million
have been issued in consideration of the preference shares held by the related party in a debt for equity swap. Since a
fair valuation of the liability has not been carried out on the date of conversion, the impact on the financial statements
has not been estimated.
2. Further, on June 30, 2011, BIPH and BPH have been merged through an internal re-organization. This has no effect on
the Company only financial statements.
— F-94 — Page 22

Support Material for Company Prospectus
Ballarpur Industries LimitedFebruary 10, 2011
— A-1 —

Disclaimer and rights
This report has been prepared by Pöyry Management Consulting Oy (“Pöyry”) solely for use byBallarpur Industries Limited (the “Recipient”). All other use is strictly prohibited and no other personor entity is permitted to use this report, unless otherwise agreed in writing by Pöyry. By acceptingdelivery of this report, the Recipient acknowledges and agrees to the terms of this disclaimer.
NOTHING IN THIS REPORT IS OR SHALL BE RELIED UPON AS A PROMISE ORREPRESENTATION OF FUTURE EVENTS OR RESULTS. PÖYRY HAS PREPARED THIS REPORTBASED ON INFORMATION AVAILABLE TO IT AT THE TIME OF ITS PREPARATION AND HASNO DUTY TO UPDATE THIS REPORT.
Pöyry makes no representation or warranty, expressed or implied, as to the accuracy or completenessof the information provided in this report or any other representation or warranty whatsoeverconcerning this report. This report is partly based on information that is not within Pöyry’s control.Statements in this report involving estimates are subject to change and actual amounts may differmaterially from those described in this report depending on a variety of factors. Pöyry hereby expresslydisclaims any and all liability based, in whole or in part, on any inaccurate or incomplete informationgiven to Pöyry or arising out of the negligence, errors or omissions of Pöyry or any of its officers,directors, employees or agents. Recipients’ use of this report and any of the estimates contained hereinshall be at Recipients’ sole risk.
Pöyry expressly disclaims any and all liability arising out of or relating to the use of this report exceptto the extent that a court of competent jurisdiction shall have determined by final judgment (not subjectto further appeal) that any such liability is the result of the willful misconduct or gross negligence ofPöyry. Pöyry also hereby disclaims any and all liability for special, economic, incidental, punitive,indirect, or consequential damages. Under no circumstances shall Pöyry have any liability relating tothe use of this report in excess of the fees actually received by Pöyry for the preparation of this report.
All information contained in this report is confidential and intended for the exclusive use of theRecipient. The Recipient may transmit the information contained in this report to its directors, officers,employees or professional advisors provided that such individuals are informed by the Recipient of theconfidential nature of this report. All other use is strictly prohibited.
All rights (including copyrights) are reserved to Pöyry. No part of this report may be reproduced in anyform or by any means without prior permission in writing from Pöyry. Any such permitted use orreproduction is expressly conditioned on the continued applicability of each of the terms andlimitations contained in this disclaimer.
— A-2 —

Preface
Vantaa/Singapore February 10, 2011
Support Material for Company Prospectus
In December 2010, Ballarpur Industries Limited (BILT) commissioned Pöyry Management Consultingto present a market assessment to support the company prospectus for the forthcoming IPO.
The primary objective of the market assessment is to provide BILT and outside industry analysts andinvestment banks with a clear, independent and understandable analysis and view of BILT’s position inthe global, Asian and Indian woodfree paper markets. The key issues in focus relate to futuredevelopment of demand, supply and prices in Asia with particular emphasis on India, and BILT’scompetitive position on selected product markets.
We trust that the material will provide a useful basis for the company prospectus, and thank the Clientfor their cooperation.
Pöyry Management Consulting Oy/Pöyry Management Consulting (Singapore) Pte. Ltd.
Timo Suhonen Peter Kahn Wallace Tham
— A-3 —

Contents
Page
1 Global Paper and Pulp Markets . . . . . . . . . . . . . . . . . . . . . . . . . . . . . . . . . . . . . . . . . . . . . . . . . . . . . . . . A-52 Woodfree Paper Markets in Asia, Southeast Asia and Malaysia . . . . . . . . . . . . . . . . . . . . . . . . . . . . . . . A-283 Paper and Dissolving Pulp Market in India . . . . . . . . . . . . . . . . . . . . . . . . . . . . . . . . . . . . . . . . . . . . . . . A-434 Price Analysis and Price Forecasts . . . . . . . . . . . . . . . . . . . . . . . . . . . . . . . . . . . . . . . . . . . . . . . . . . . . . . A-605 Asset Quality and Cost Competitiveness . . . . . . . . . . . . . . . . . . . . . . . . . . . . . . . . . . . . . . . . . . . . . . . . . A-78
— A-4 —

Global Paper and Pulp Markets
— A-5 —

Estimated Long-term GDP Growth by Region through 2020
Economic growth will be fastest in China, India and the rest of Asia (excl. Japan). The long-termgrowth in North America and Western Europe is estimated at 2.1%/a and 1.3%/a, respectively, whilethe Japanese economy is expected to grow at 1.0%/a through 2020.
— A-6 —

GDP and Paper Consumption per Capita
There is a clear correlation between paper consumption and GDP per capita. This relationship is validboth between countries and with respect to time. However, income elasticity of paper consumption hasdeclined in the course of time.
— A-7 —

Paper Consumption per Capita in Selected Countries 2008-2020
Country Paper consumption (1000 tons) Population (millions) Per capita consumption (kg)
2008 2009 2020 2008 2009 2020 2008 2009 2020
USA . . . . . . . . . . . . . . . . 81352 71360 76297 311,67 314,66 342,64 261,0 226,8 222,7Finland . . . . . . . . . . . . . . 1540 1243 1350 5,30 5,33 5,44 290,6 233,2 248,2Sweden . . . . . . . . . . . . . . 2522 2148 2269 9,21 9,25 9,65 273,9 232,2 235,1France . . . . . . . . . . . . . . 10693 9531 10243 62,04 62,34 64,87 172,4 152,9 157,9Germany . . . . . . . . . . . . 20620 18507 19778 82,26 82,17 81,21 250,7 225,2 243,5UK . . . . . . . . . . . . . . . . . 10944 9737 10082 61,23 61,57 64,05 178,7 158,2 157,4Japan . . . . . . . . . . . . . . . 30508 27092 26830 127,29 127,16 124,57 239,7 213,1 215,4Mainland China . . . . . . . 79338 85115 139135 1337,41 1345,75 1421,54 59,3 63,2 97,9Thailand . . . . . . . . . . . . . 3833 3740 5131 67,39 67,76 71,52 56,9 55,2 71,7Malaysia . . . . . . . . . . . . . 2897 2733 3750 27,01 27,47 32,04 107,3 99,5 117,0Indonesia . . . . . . . . . . . . 6040 5910 8986 227,35 229,97 262,04 26,6 25,7 34,3Taiwan . . . . . . . . . . . . . . 4407 3892 4296 22,92 22,97 23,13 192,3 169,4 185,7Korea Rep. . . . . . . . . . . . 8764 8297 9751 48,15 48,33 49,24 182,0 171,7 198,0India . . . . . . . . . . . . . . . . 9950 10080 19152 1181,41 1198,00 1380,02 8,4 8,4 13,9WORLD TOTAL . . . . . . 389043 368443 474259 6756,95 6835,65 7671,35 57,6 53,9 61,8
— A-8 —

Changes in Graphic Paper Demand and Advertising Expenditure
The strong relationship between advertising expenditure and graphic paper demand seems to continue.Historically, the volatility of the advertising sector has resulted in rapid changes in graphic paperdemand.
Note: market area combines North America, Western Europe and Japan; graphic paper = newsprint +printing/writing papers; adspend data is based on total advertising expenditure in constant money terms
— A-9 —

Changes in Packaging Board Demand and Industrial Production
The positive correlation between industrial production and packaging board demand is evident. Duringthe past 7-8 years, though, the relationship has become somewhat blurred, indicating a trend break inestablished patterns. This trend break stems from the globalization of manufacturing industries, i.e. themove of packaging operations from mature economies to emerging markets in the East.
Note: market area combines North America, Western Europe and Japan; packaging board =containerboards + cartonboards; industrial production is a weighted index series of the market area.
— A-10 —

Global Paper Demand — World Total vs. China 1960-2010
Structural factors(1 are partly hindering the cyclical recovery in the West while the emerging marketssuch as China and India continue to grow rapidly. The demand for paper and paperboard is recoveringfrom the global recession, totalling an estimated 392-393 million tons in 2010.
— A-11 —

Global Product and Furnish Mix 2009
Graphic papers account for about 37% of the world paper and paperboard production. The share ofpackaging boards and papers is roughly 55% of the total. Recovered paper dominates the globalpapermaking fibre markets (55% of total), followed by chemical wood pulps (32%) and mechanicalwood pulps (8%).
— A-12 —

Global Printing & Writing Paper Demand Comparison
Printing & writing paper demand has improved in 2010 as compared to 2009. Based on availableJanuary-October statistics, the global demand growth in 2010 is estimated at 5-6%/a.
— A-13 —

Global Printing & Writing Paper Demand Comparison
Estimated demand change from 2009 to 2010.
— A-14 —

Global Printing & Writing Paper Demand Comparison by Region
Estimated demand change from 2009 to 2010.
— A-15 —

Leading Producers of Uncoated Woodfree Paper 2010/IV
International Paper and Domtar are the leading producers of uncoated woodfree paper in the world,accounting for about 14% of the global capacity. The ten leading producers account for over 37% ofthe world uncoated woodfree paper capacity.
— A-16 —

Leading Producers of Coated Woodfree Paper 2010/IV
Top five firms account for 13.6 million tons (44%) of the world’s 31 million ton coated woodfreepaper capacity.
— A-17 —

Long-term Paper Demand Growth by Region 2008-2020
Paper demand prospects vary considerably between regions, with a modest outlook for Japan, NorthAmerica and Western Europe but still significant growth potential for Asia and Eastern Europe —India, China and Russia in particular.
— A-18 —

Long-term Paper Demand Growth by Product Area 2008-2020
World paper demand is expected to grow by 1.7%/a through 2020. Tissue paper, containerboards andcartonboards will be the fastest-growing product areas, while the demand for newsprint and mechanicalprinting papers will decline in the long term.
— A-19 —
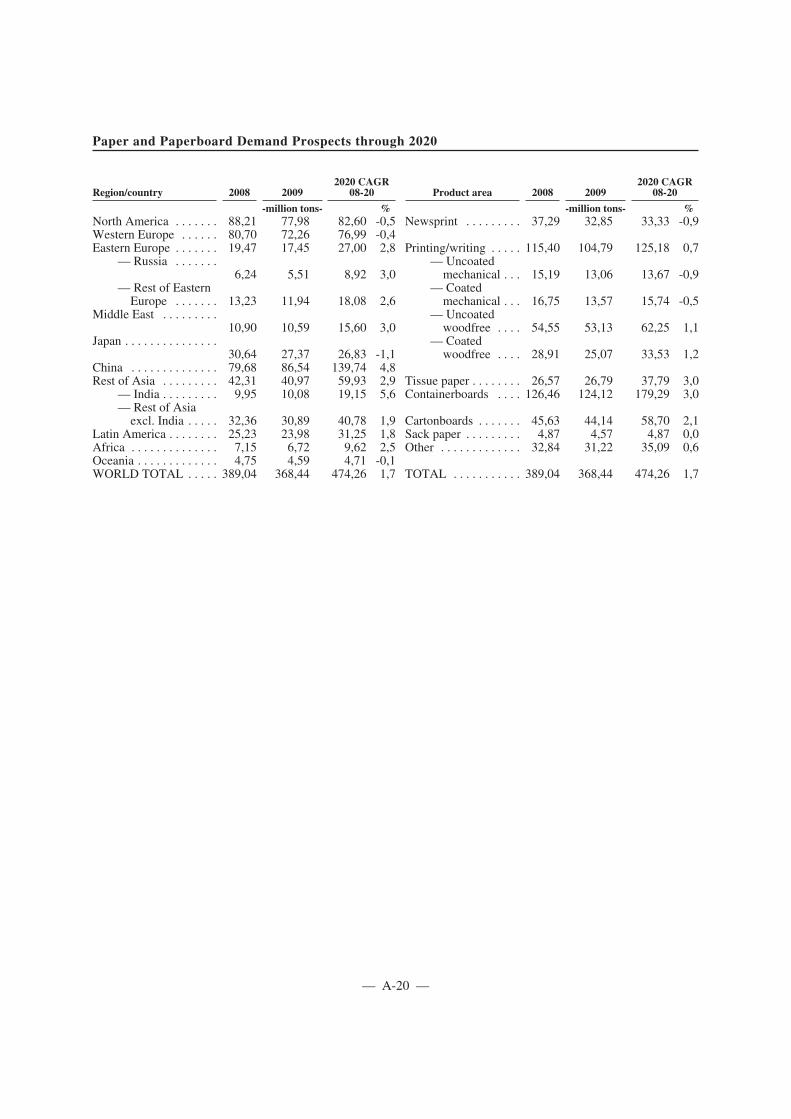
Paper and Paperboard Demand Prospects through 2020
Region/country 2008 20092020 CAGR
08-20 Product area 2008 20092020 CAGR
08-20
-million tons- % -million tons- %North America . . . . . . . 88,21 77,98 82,60 -0,5 Newsprint . . . . . . . . . 37,29 32,85 33,33 -0,9Western Europe . . . . . . 80,70 72,26 76,99 -0,4Eastern Europe . . . . . . . 19,47 17,45 27,00 2,8 Printing/writing . . . . . 115,40 104,79 125,18 0,7
— Russia . . . . . . .6,24 5,51 8,92 3,0
— Uncoatedmechanical . . . 15,19 13,06 13,67 -0,9
— Rest of EasternEurope . . . . . . . 13,23 11,94 18,08 2,6
— Coatedmechanical . . . 16,75 13,57 15,74 -0,5
Middle East . . . . . . . . .10,90 10,59 15,60 3,0
— Uncoatedwoodfree . . . . 54,55 53,13 62,25 1,1
Japan . . . . . . . . . . . . . . .30,64 27,37 26,83 -1,1
— Coatedwoodfree . . . . 28,91 25,07 33,53 1,2
China . . . . . . . . . . . . . . 79,68 86,54 139,74 4,8Rest of Asia . . . . . . . . . 42,31 40,97 59,93 2,9 Tissue paper . . . . . . . . 26,57 26,79 37,79 3,0
— India . . . . . . . . . 9,95 10,08 19,15 5,6 Containerboards . . . . 126,46 124,12 179,29 3,0— Rest of Asia
excl. India . . . . . 32,36 30,89 40,78 1,9 Cartonboards . . . . . . . 45,63 44,14 58,70 2,1Latin America . . . . . . . . 25,23 23,98 31,25 1,8 Sack paper . . . . . . . . . 4,87 4,57 4,87 0,0Africa . . . . . . . . . . . . . . 7,15 6,72 9,62 2,5 Other . . . . . . . . . . . . . 32,84 31,22 35,09 0,6Oceania . . . . . . . . . . . . . 4,75 4,59 4,71 -0,1WORLD TOTAL . . . . . 389,04 368,44 474,26 1,7 TOTAL . . . . . . . . . . . 389,04 368,44 474,26 1,7
— A-20 —

Share of China and India of Incremental Paper Demand 2009-2020
China and India are estimated to account for 59% of global incremental paper and paperboard demandin 2009-2020.
— A-21 —

Global Paper and Paperboard Production Growth 2009-2020
The growth of production is shifting outside the traditional supply areas. The share of North Americaand Western Europe of the world’s paper and paperboard production is forecast to decline from thecurrent 46% to 38% by 2020. At the same time, Asia’s (excl. Japan) share is expected to grow from36% to 44%.
— A-22 —
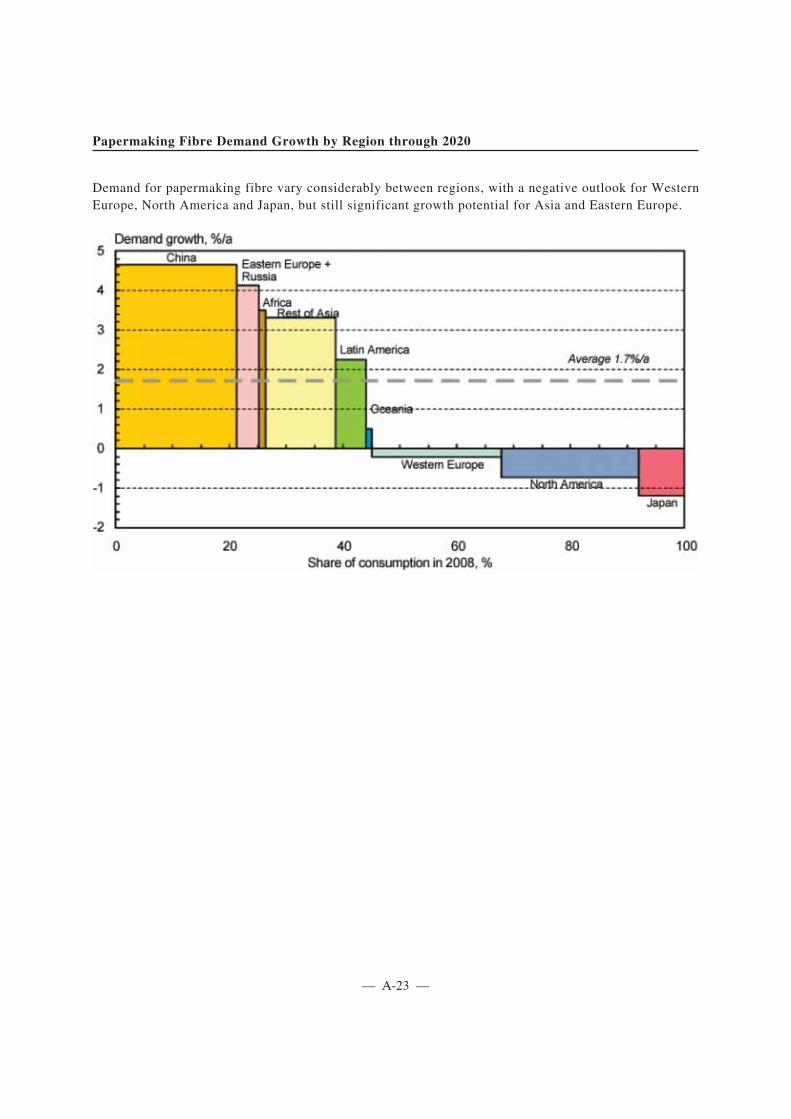
Papermaking Fibre Demand Growth by Region through 2020
Demand for papermaking fibre vary considerably between regions, with a negative outlook for WesternEurope, North America and Japan, but still significant growth potential for Asia and Eastern Europe.
— A-23 —

Papermaking Fibre Demand Growth by Region through 2020
Demand for papermaking fibre vary considerably between regions, with a negative outlook for WesternEurope, North America and Japan, but still significant growth potential for Asia and Eastern Europe.
— A-24 —

Market Wood Pulp Demand Growth by Region through 2020
Western Europe and North America account for 33% and 15%, respectively, of world demand formarket wood pulp at present. China’s share is 20% but increasing rapidly — by 2020 China willaccount for 32% of world demand for market pulp.
— A-25 —

Market Wood Pulp Demand Growth by Region through 2020
Western Europe and North America account for 33% and 15%, respectively, of world demand formarket wood pulp at present. China’s share is 20% but increasing rapidly — by 2020 China willaccount for 32% of world demand for market pulp.
— A-26 —

Forecast Consumption of Dissolving Pulp by Region through 2020
The world demand for dissolving pulp is expected to grow from 4.2 million ADt/a in 2009 to5.8 million ADt/a by 2020 (CAGR 2.9%/a). Demand is expected to grow fastest in China (5.1%/a) andthe rest of Asia (2.5%/a). The supply of cotton will be the main driver of viscose fibre and thusdissolving pulp demand in the future.
— A-27 —

Woodfree Paper Markets in Asia,Southeast Asia and Malaysia
— A-28 —

Major Decided UWF Capacity Changes in Asia 2010
There are over 1.4 million tons of new UWF production capacity added in Asia by end of 2010.
Period Country Company Mill Location PMCapacity
change 1000t Description
2010: 1 China Fujian Nanping Paper Nanping 3 50 conversion (+)2010: 1 China Fujian Nanping Paper Nanping 4 50 conversion (+)2010: 1 India Agio Paper & Industries Bilaspur 2 9 new PM2010: 1 India Kohinoor Paper & Newsprint Kolkata 1 25 new PM2010: 1 India Maa Chandi Papers Durgapur 2 3 new PM2010: 1 India Servalakshmi Paper & Boards Tirunelveli 1 105 second hand PM2010: 1 India The Andhra Pradesh Paper Mills Rajahmundry 6 85 second hand PM2010: 1 Indonesia PT Indah Kiat Pulp & Paper Tbk. Perawang, Riau 7 175 second hand PM2010: 1 Indonesia PT Indah Kiat Pulp & Paper Tbk. Perawang, Riau 8 60 second hand PM2010: 2 China Binyang Daqiao Paper Nanning city 1 100 new PM2010: 2 China Binyang Daqiao Paper Nanning city 2 100 new PM2010: 2 China Yanzhou Huamao Paper Industry Yanzhou city 23 350 new PM2010: 2 India Amaravathi Sri Venkatesa Paper
MillsMadathukulam 4 50 second hand PM
2010: 2 India Sidharth Papers Ltd. Muzaffarnagar 1 12 new PM2010: 2 India West Coast Paper Mills Ltd. Dandeli 6 150 new PM2010: 3 Japan Mitsubishi Paper Mills Ltd. Takasago-Shi 12 -25 shut-down2010: 3 Japan Oji Paper Co., Ltd. Kure 4 -43 shut-down2010: 3 Japan Oji Paper Co., Ltd. Kure 5 -175 conversion (-)2010: 3 India Ladhar Paper Mill Jalandhar 2 15 second hand PM2010: 3 India Nagaland Pulp and Paper Co.
Ltd.Mukokchung 2 65 new PM
2010: 3 India Rainbow Papers Ltd. Village Rajpur 5 110 second hand PM2010: 3 India Tamil Nadu Newsprint & Papers Kagithapuram 3 155 new PM2010: 4 China Guangxi Huacheng Paper Laibin City 1 60 new PM2010: 4 China Guangxi Huacheng Paper Laibin City 2 60 new PM2010: 4 China Guangxi Huacheng Paper Laibin City 3 60 new PM2010: 4 China Guangxi Huacheng Paper Laibin City 4 60 new PM2010: 4 Vietnam Bai Bang Joint Stock Company Ky Son 1 50 second hand PM2010.... India KR Pulp 1552010: .. China Fujian Nanping Paper Nanping City 6 -250 grade change
Total 1621
— A-29 —

Major Decided UWF Capacity Changes in Asia as from 2011
Decided projects will increase UWF capacity in Asia by 3.3 million tons from 2011 onwards. Abouttwo-thirds of the capacity expansion is from China. As from 2011, UWF production capacity in Indiawill increase by over 0.4 million tons. BGGPL Unit Ballarshah will complete rebuilding their PM7 andincrease UWF capacity by 40 000 t/a in early 2012.
Period Country Company Mill Location PMCapacity
change (1000 t) Description
2011: 1 China Guangxi Yongkai Sugar andPaper
Nanning 1 200 second hand PM
2011: 1 China Minfeng Special Paper Co.,Ltd.
Jiaxing 20 3 rebuild
2011: 1 China Nine Dragons PaperIndustries (Taicang)
Taicang City 21 200 conversion (+)
2011: 1 China Shandong Huatai Paper Dongyin City 8 150 new PM2011: 1 China Yilin Paper Xuchang 6 95 new PM2011: 1 China Zhanjiang Chenming Pulp &
PaperZhanjiang 1 450 new PM
2011: 2 China Anhui Huatai Forest Pulp &Paper
Anqing City 1 130 second hand PM
2011: 2 China Dongguan Nine DragonsPaper Industries
Dongguan City 28 250 new PM
2011: 2 China Zhumadianshi Baiyun Paper Zhumadian City 8 250 new PM2011: 2 Korea, Moorim Pulp & Paper Kyungnam 1 220 new PM2011: 4 China APRIL Fine Paper
(Guangdong)Jiangmen 11 450 new PM
2011: 4 Indonesia PT Indah Kiat Pulp & PaperTbk.
Perawang, Riau 6 200 second hand PM
2012: 1 India BGPPL (Unit Ballarshah) Ballarshah 7 40 PM Rebuild2012: 2 India Whitefield Paper Mills West Godavari
dist.1 210 new PM
2012: 2 Thailand Double A (1991) Public Co,.Ltd
Prachinburi 3 290 new PM
2012: 4 India JK Paper Ltd. Jaykaypur 6 150 new PM2012: 4 India Purvi Bharat Paper Choudwar 1 22 new PM
Total 3310
— A-30 —

Major Planned UWF Capacity Changes in Asia
There are over 5.5 million tons of planned projects in Asia. Though most planned uncoated woodfreeprojects will increase in capacities, JK Paper plans to shut down three machines that will decrease itscapacity by 50,000 tons.
Period* Country Company Mill Location PMCapacity change
1000 t Description
2011: 9 China Henan JiaozuoRuifeng Paper Co
Jiaozuo 1 300 new PM
2011: 9 India ABC Paper 1 100 new PM2011: 9 India Rama Newsprint &
Papers Ltd.Magdalla Port 3 60 new PM
2011: 9 India Shri Jagannath PaperMills
1 25 second hand PM
2012: 1 Vietnam Thanh Hoa Paper Mill Thanh Hoa 1 180 new PM2012: 4 India JK Paper Ltd. Jaykaypur 2 -7 shut-down2012: 4 India JK Paper Ltd. Jaykaypur 4 -16 shut-down2012: 4 India JK Paper Ltd. Jaykaypur 5 -27 shut-down2012: 4 India M/s Kohinoor Pulp &
Paper Pvt. LtdMatia 1 200 new PM
2012: 9 China Guizhou ChitianhuaPaper Industrial
Chishui City 1 155 new PM
2012: 9 China Luohe Yinge SpecialtyPaper
Luohe 3 200 new PM
2012: 9 Bangladesh Creative Paper Mills 1 20 new PM2012: 9 India Bengal Paper Mills Raniganj 3 5 restart2012: 9 India Bengal Paper Mills Raniganj 6 30 restart2012: 9 India Emami Paper Mills near Kultikiri 1 200 new PM2012: 9 India Sikka Papers (P) Ltd. Himalayan 1 30 new PM
* The period for start-up in these planned projects are based on estimation
— A-31 —

Major Planned UWF Capacity Changes in Asia (Cont’d)
Among the UWF projects planned in India, Hindustan Paper’s planned new mill in Jagdishpur is knownto be the largest with 300 000 tons/a new machine in the state of Uttar Pradesh.
Period* Country Company Mill Location PMCapacity
change 1000 t Description
2013: 9 India Hindustan PaperCorporation Limited
Kajag Nagar 1 50 capacity expansion
2013: 9 India Hindustan PaperCorporation Limited
Kajag Nagar 2 85 capacity expansion
2013: 9 India Hindustan PaperCorporation Limited
Jagdishpur 1 300 new PM
2013: 9 Kazakhstan Ilisky Paper-Board Plant Boralday 3 70 second hand PM2014 - China Gold East Paper (Jiangsu)
Co., Ltd.Zhenjiang City 5 300 new PM
2014 - China Gold East Paper (Jiangsu)Co., Ltd.
Zhenjiang City 6 300 new PM
2014 - China Gold East Paper (Jiangsu)Co., Ltd.
Zhenjiang City 7 300 new PM
2014 - China Gold East Paper (Jiangsu)Co., Ltd.
Zhenjiang City 8 300 new PM
2014 - China Guangxi Jindaxing PaperCo., Ltd.
Nanning City 99 1000 new PM
2014 - China Guangxi Yongkai Sugarand Paper
Cenci city 1 350 new PM
2014 - China Nanning Phoenix Pulp &Paper Co. Ltd.
Nanning City 3 60 new PM
2014 - China Sichuan Jinan Pulp &Paper
Yaan City 2 150 new PM
2014 - China Wuhan ChenmingHanyang Paper Co., Ltd.
Wuhan 11 300 new PM
2014 - China Zhenjiang Gold RiverPulp & Paper Co. Ltd.
Zhenjiang 13 180 new PM
2014 - India BVR Paper Industries(India) PVT. LTD.
Kukatpally 1 35 second hand PM
2014 - India Century Pulp & Paper Bharuch 7 175 new PM2014 - India Danalakshmi Paper Mills
(P) Ltd.Vilampatti 3 15 second hand PM
2014 - India Mandya National PaperMills Limited
Belagula 1 35 restart
2014 - India Star Paper Mills, Ltd. Saharanpur 5 70 new PM2014 - Vietnam Dong Nai Paper Joint-
Stock Company (Codigo)Bien Hoa City 4 30 second hand PM
TOTAL: 5560
* The period for start-up in these planned projects are based on estimation
— A-32 —
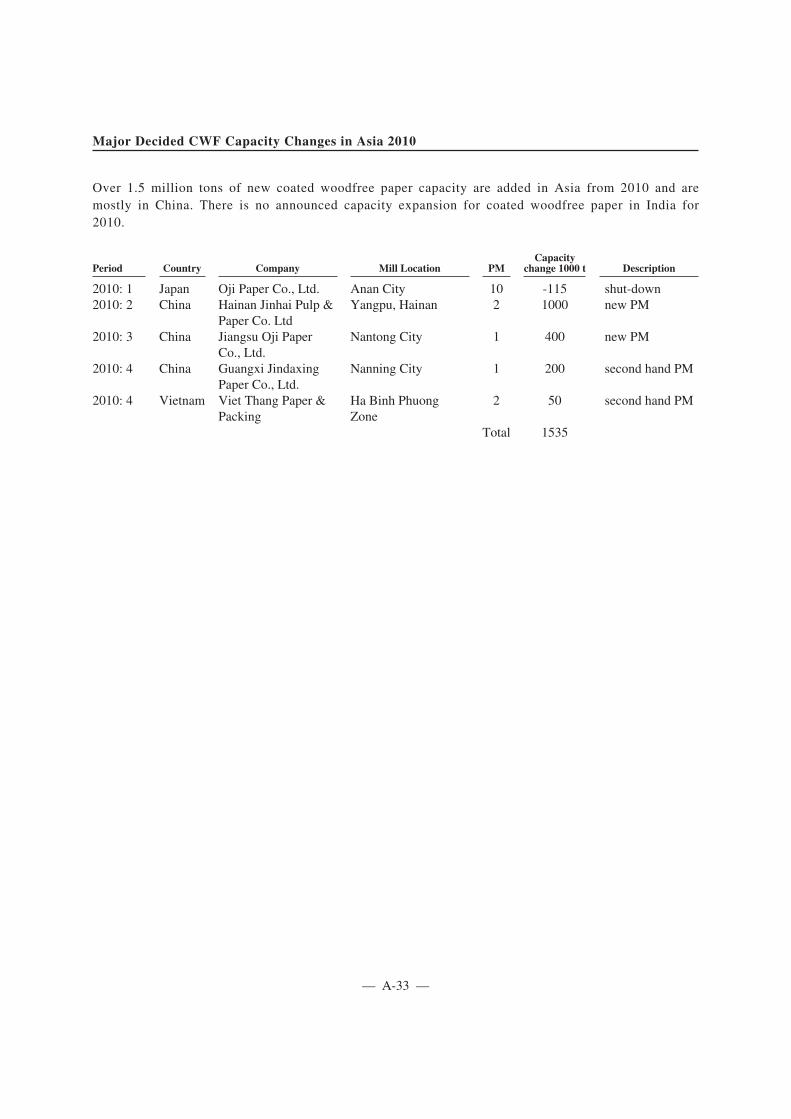
Major Decided CWF Capacity Changes in Asia 2010
Over 1.5 million tons of new coated woodfree paper capacity are added in Asia from 2010 and aremostly in China. There is no announced capacity expansion for coated woodfree paper in India for2010.
Period Country Company Mill Location PMCapacity
change 1000 t Description
2010: 1 Japan Oji Paper Co., Ltd. Anan City 10 -115 shut-down2010: 2 China Hainan Jinhai Pulp &
Paper Co. LtdYangpu, Hainan 2 1000 new PM
2010: 3 China Jiangsu Oji PaperCo., Ltd.
Nantong City 1 400 new PM
2010: 4 China Guangxi JindaxingPaper Co., Ltd.
Nanning City 1 200 second hand PM
2010: 4 Vietnam Viet Thang Paper &Packing
Ha Binh PhuongZone
2 50 second hand PM
Total 1535
— A-33 —
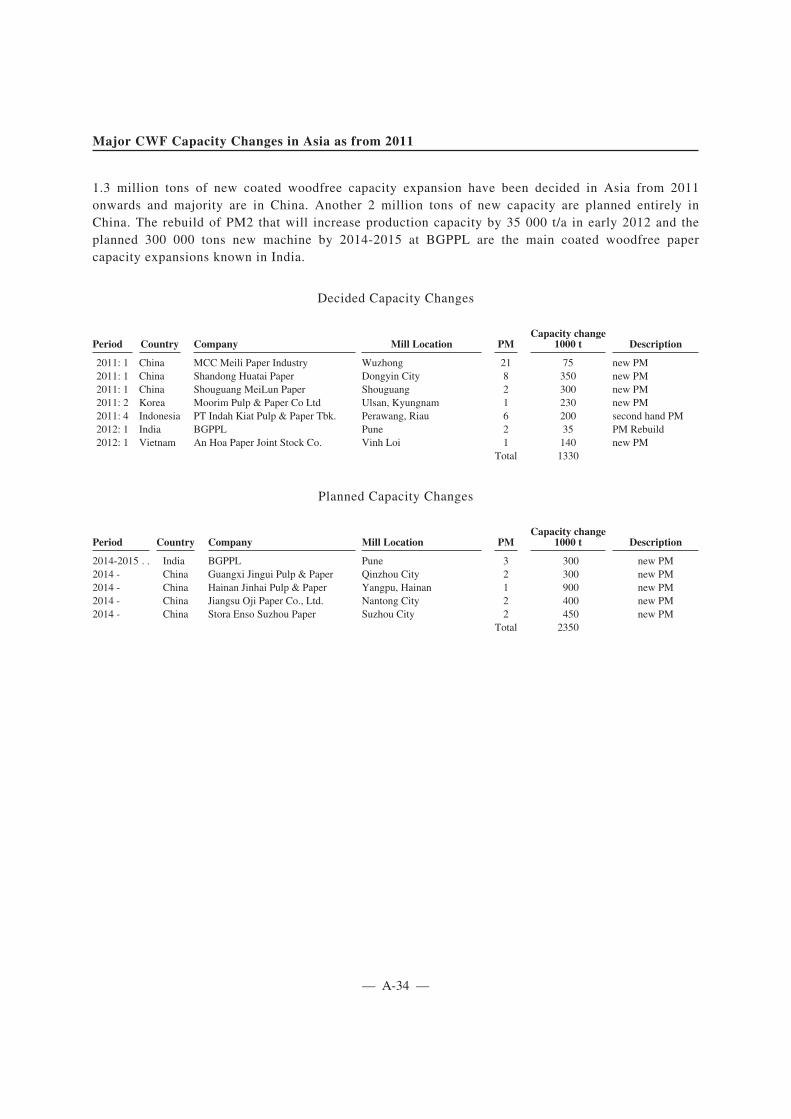
Major CWF Capacity Changes in Asia as from 2011
1.3 million tons of new coated woodfree capacity expansion have been decided in Asia from 2011onwards and majority are in China. Another 2 million tons of new capacity are planned entirely inChina. The rebuild of PM2 that will increase production capacity by 35 000 t/a in early 2012 and theplanned 300 000 tons new machine by 2014-2015 at BGPPL are the main coated woodfree papercapacity expansions known in India.
Decided Capacity Changes
Period Country Company Mill Location PMCapacity change
1000 t Description
2011: 1 China MCC Meili Paper Industry Wuzhong 21 75 new PM2011: 1 China Shandong Huatai Paper Dongyin City 8 350 new PM2011: 1 China Shouguang MeiLun Paper Shouguang 2 300 new PM2011: 2 Korea Moorim Pulp & Paper Co Ltd Ulsan, Kyungnam 1 230 new PM2011: 4 Indonesia PT Indah Kiat Pulp & Paper Tbk. Perawang, Riau 6 200 second hand PM2012: 1 India BGPPL Pune 2 35 PM Rebuild2012: 1 Vietnam An Hoa Paper Joint Stock Co. Vinh Loi 1 140 new PM
Total 1330
Planned Capacity Changes
Period Country Company Mill Location PMCapacity change
1000 t Description
2014-2015 . . India BGPPL Pune 3 300 new PM2014 - China Guangxi Jingui Pulp & Paper Qinzhou City 2 300 new PM2014 - China Hainan Jinhai Pulp & Paper Yangpu, Hainan 1 900 new PM2014 - China Jiangsu Oji Paper Co., Ltd. Nantong City 2 400 new PM2014 - China Stora Enso Suzhou Paper Suzhou City 2 450 new PM
Total 2350
— A-34 —

Uncoated Woodfree Paper Demand in Asia, Oceania and Africa
Demand for uncoated woodfree paper in Asia, Oceania and Africa has increased from 15.3 million tonsin 1995 to 26.9 million tons in 2009.
— A-35 —

Uncoated Woodfree Paper Demand in Southeast Asia
Indonesia is the largest market for uncoated woodfree paper in Southeast Asia, accounting for morethan half of the region’s consumption. Total consumption of uncoated woodfree paper in SoutheastAsia had grown by 1.1 million tons or 4.7%/a from 1995 to 2009.
Thailand and Malaysia are the other main markets in the region with combined share of 38% of thetotal consumption. Indonesia has the fastest consumption growth in the region of about 8%/a.
— A-36 —

Uncoated Woodfree Paper Production in Southeast Asia
Indonesia is the largest producer, accounting for 77% of uncoated woodfree paper production in theregion. Thailand is another major producer in the region (18%). APP Indonesia has the largestuncoated woodfree paper capacity in South East Asia with 2 million t/a followed by APRIL (0.8million t/a). Advance Agro and Siam Group are the major producers in Thailand. Sabah ForestIndustries (owned by BILT) in Malaysia is the fifth largest producer in the region with 150 000 t/a.
— A-37 —

Uncoated Woodfree Paper Demand in Malaysia
Uncoated woodfree demand has developed positively with 1.2%/a annual growth rate from period 2000to 2009.
Cut size paper has experienced an increase from 59 000 tons in 2000 to 89 000 tons in 2009, reflectingan average annual growth of almost 5%/a. Folio & sheets on the other hand has observed lower growthof less than 1%/a.
All cut sizes are in 70 and 80 g/m2 in basis weights. Majority of cut-size consumption in Malaysia is70 g/m2 Only about 10 — 15 % of offset reels and sheets is higher than 80 g/m2 and mainly used forproducing envelopes.
Only about 10 — 15 % of offset reels and sheets is higher than 80 g/m2 and mainly used for producingenvelopes.
Similarly, about 7 — 15% of UWF is at 55 g/m2 or lower and mostly used in reels for production ofstationery (writing books/pad and notebooks).
Majority of UWF in folio sheets and reels, 50% — 60%, is between 70 and 80 g/m2, for quality offsetprinting of books, magazine, annual reports and others
— A-38 —

Uncoated Woodfree Paper Production in Malaysia, 2009
Uncoated woodfree paper (UWF) supply in Malaysia is much dominated by foreign imports. In 2009,local uncoated woodfree paper supply for domestic consumption is 106 000 tons while importsaccounted for 276 000 tons (72%).
Cut size paper accounts for nearly one-quarter of the total uncoated woodfree market in Malaysia, andis mostly supplied by foreign producers.
Indonesian suppliers like APRIL and APP whom are highly competitive in terms of costs, accountedfor majority 46% of woodfree paper market in Malaysia. Other major foreign suppliers are SiamCement and Advance Agro of Thailand, which represented 12% of the market.
UWF demand is forecast to reach 430 000 tons in 2015. With no capacity expansions announced, futuresupply is expected to remain unchanged.
— A-39 —

Uncoated Woodfree Paper Supply by Grades in Malaysia, 2009
While supply of uncoated surface sized (SS) woodfree paper and cut-size copy paper are mostly fromother producers (imports from foreign producers), majority of uncoated non-surface sized (NSS)woodfree paper in Malaysia are supplied by Sabah Forest (SFI).
— A-40 —

Paper and Paperboard Demand in Malaysia till 2020
Total paper and paperboard in Malaysia is forecast to grow at 3.1%/a from 2009 to 2020. Uncoatedwoodfree paper is forecast to rise from 382 000 tons in 2009 to over 460 000 tons in 2020 or growthrate of 1.7%/a.
— A-41 —

Uncoated Woodfree Paper Export Sales Opportunities by Region
Except for Southeast Asia region, all other regions are net importers of uncoated woodfree paper in2009. Africa, Middle East, India and Rest of Asia (excl. North East Asia, South East Asia and India),with few major domestic producers, has a larger net imports of 1.1 million tons in 2009.
— A-42 —

Paper and Dissolving Pulp Market in India
— A-43 —

Paper and Paperboard Demand in India 1990-2020
Paper and paperboard demand in India is projected to grow from 10 million tons in 2008 to 19 milliontons by 2020.
— A-44 —

Woodfree Paper Consumption by Grades in India till 2010
Among the uncoated woodfree grades in India, copy paper consumption has risen rapidly by 16%/asince 2001. Blade coated woodfree has achieved double-digit consumption growth of 24%/a since2004. However air knife coated grades and others have declined significantly due to substitution byblade coated paper.
— A-45 —

Paper and Paperboard Demand Growth in India 2009-2010
Paper and paperboard average demand growth in India is one of the highest in Asia with an averagerate of 7.4% from 2009 to 2010. Among the paper and paperboard grades, tissue has the largest growthrate of 20%/a. Copier paper has the second highest growth rate of 16%. Blade coated woodfree(including C1S and C2S) also has double digit rate of 14%
— A-46 —

*Uncoated Woodfree Paper Supply/Demand Balance in India
There is an excess production over consumption of *uncoated woodfree paper (UWF) by 120 000 tonsin 2009/2010.
More than 800 000 tons of new capacity has been added in 2010 and an additional 422 000 tons(including rebuild of PM7 at BGPPL Unit Ballarshah) will start-up from 2011 onwards. Almost1.4 million tons are in the planning stage but it is reasonable to assume that some of the capacity maynot go ahead as planned. Demand is forecast to rise from 2.9 million tons in 2009 to almost 4.6 milliontons in 2015.
— A-47 —

Coated Woodfree Paper (CWF) Supply/Demand Balance in India
Domestic supply accounted for about 65% of Indian coated woodfree market in 2009, and majority ofthis is from BILT’s Bhigwan mill (BGPPL).
There are smaller supply from JK Paper and ITC. Imports accounted for 35% or 145 000 tons in2009/2010. CWF paper demand in India is forecast to increase from 416 000 in 2009/2010 to over 760000 tons in 2015. Though there will be expanding supply from BGPPL (including new PM3 of 300 000tons/year and expansion of 35 000 t/a from rebuilding of PM2), local CWF supply is expected toremain short of future demand.
— A-48 —

Leading Producers of Uncoated Woodfree Paper in India 2010/IV
The top ten incoated woodfree paper companies in India accounted for about 46% of total capacity inthe country. Ballarpur Industries (BILT and BGPPL) is the largest uncoated woodfree paper producer,with total capacity of over 530 000 t/a.
— A-49 —
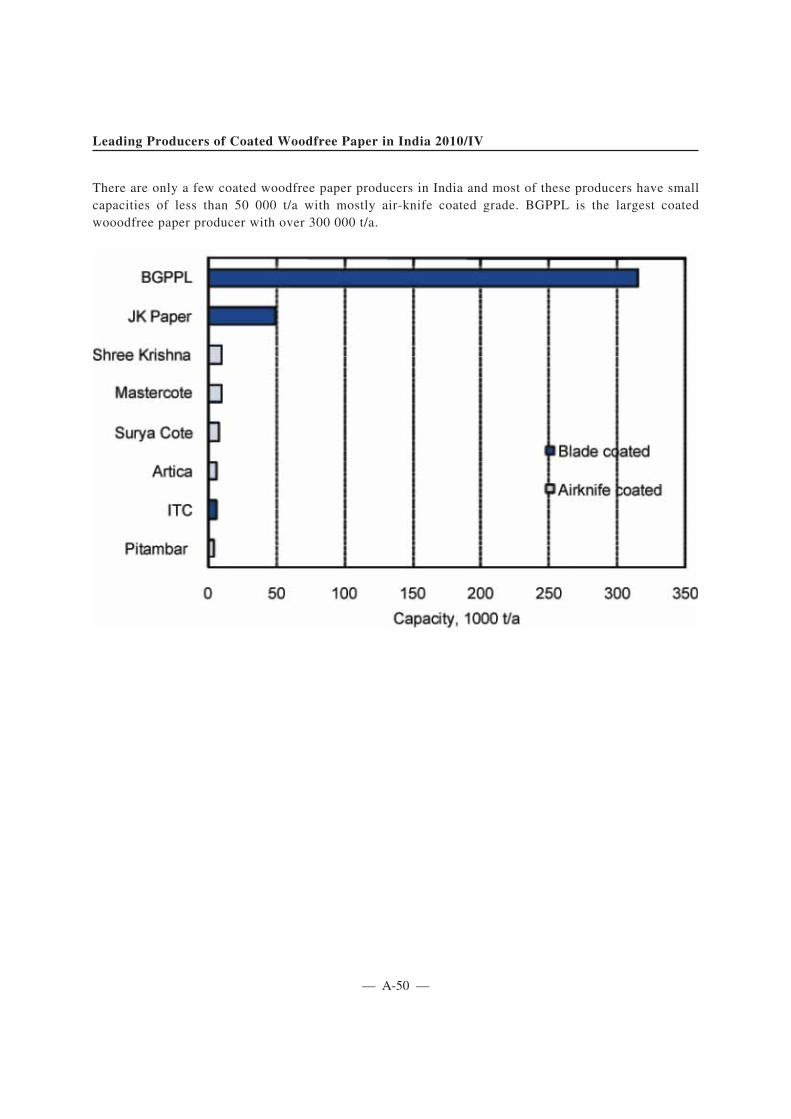
Leading Producers of Coated Woodfree Paper in India 2010/IV
There are only a few coated woodfree paper producers in India and most of these producers have smallcapacities of less than 50 000 t/a with mostly air-knife coated grade. BGPPL is the largest coatedwooodfree paper producer with over 300 000 t/a.
— A-50 —

Uncoated Woodfree Paper Imports and Exports in India 2009/2010
Majority of uncoated woodfree paper imports in India are from Indonesia, China, Finland, USA andBrazil. Much of Indian uncoated woodfree are exported to neighbouring South Asian and Africancountries.
Imports
Others17%
Brazil14%
UnitedStates15%
Indonesia19%
Finland18%
China17%
20 000 tons
Others38%
Kenya4%
Exports
Nepal5%
Sri Lanka20%
Nigeria20%
Bangladesh8%Egypt
5%
141 000 tons
— A-51 —

Coated Woodfree Paper Imports and Exports in India 2009/2010
Majority of coated woodfree paper imports to India is from China. USA, Europe (Austria and Finland),South Korea and Indonesia are the other main sources of supply. Most coated woodfree paper in Indiaare exported to Sri Lanka. Other important export markets are the Middle East countries, UK and USA.
China47%
Imports
United States13%
Indonesia9%
Finland8%
South Korea7%
Austria5%
Others11%
145 000 tons
UnitedStates
6%
Turkey7%
Kuwait7%
Sri Lanka23%
Exports
UnitedKingdom
6% United Arab
Emirates6%
SaudiArabia
4%
Others41%
50 000 tons
— A-52 —

Woodfree Paper Market Shares by Grade in India 2009/2010
Ballarpur Industries (BILT and BGPPL) is major supplier with significant market shares of qualitywoodfree paper grades in India. The other main suppliers of UWF (high bright grade) are TNPL, ITCand Abhishek. JK paper has the largest market share of 28% for copier paper in India followed byBILT. Other main copy paper suppliers are TNPL and Century Pulp and Paper. Domestic supply ofCWF (C1S and C2S) are mainly from BILT and JK.
Copy Paper
Century9%
Khanna7%
Abhishek7%
Others11%
370 000 tons
TNPL13%
JK28%
BILT25%
Coated Woodfree
370 000 tons
^Blade coated (C1S and C2S)
^ITC1%^JK
11%
^BGPPL51%
Others37%
— A-53 —

*Capacity Expansions in Uncoated Woodfree Paper in India
The total capacity of Indian UWF paper has risen from 3.7 million tons to 5.3 in 2008 million tons in2010. Total *capacity of UWF paper is estimated to reach 6.8 million tons in 2013. Majority of the newadditional capacities in 2010 are from West Coast Paper, Andhra Pradesh Paper Mills (APPM) andTamil Nadu Paper (TNPL).
— A-54 —

*Capacity Expansions in Coated Woodfree Paper in India
The start-up of PM2 (165 000 t/a) and the increase from product rationalization of PM1 (25 000 t/a) atBGPPL added the overall CWF capacity by 190 000 t/a in 2009. BGGPL’s new PM3 (300 000 t/aplanned for 2014-2015) and the rebuild of PM2 by 2012 (35 000 t/a) are the main future capacityexpansions in India.
— A-55 —

Paper and Paperboard Demand by Grades in India till 2020
Total paper and paperboard demand in India is forecast to grow by 5.6%/a from 2008 to 2020. Coatedwoodfree paper (CWF) is forecast to have the highest growth rate of 9.4%/a from 2008 to 2020.Uncoated woodfree paper (UWF) is forecast have a steady growth rate of 6.3%/a.
— A-56 —

Uncoated Woodfree Paper Demand by Grades in India till 2020
Copy paper is forecast to have the highest growth rate of 11.6%/a among uncoated woodfree gradesfrom 2008 to 2020. High bright woodfree is forecast have a strong growth rate of 8.1%/a.
— A-57 —

Total Paper and Paperboard Supply/Demand in India up to 2020
Though there have been significant capacity expansion recently, total paper and paperboard productionhas not been able to meet consumption in India. There are new decided capacities of over 0.4 milliontons respectively from 2011 onwards. These additional capacities shall be able to sustain the increasingdemand in India until 2012.
— A-58 —

Indian Dissolving Pulp Market 2010
Dissolving pulp supply in India is dominated by BGPPL (96 000 t/a), Grasim (73 000 t/a) and CenturyPulp (34 000 t/a). With the overall demand exceeding 400 000 t/a, the need for imports amounts toabout 200 000 t/a.
Demand by main end use
Viscosestaple fibre
87,0 %Imports/shortfall49,7 %
Supply/Demand Balance
BGPPL23,8 %
Century Pulp8,4 %Viscose
filament13,0 %
Viscose filament industry:Century Rayon 27.5 ktIndian Rayon 17.6 kt Grasim
18,1 %Kesoram Rayon 7.7 kt
Total 403 300 t/a
Note: market data partly based on BILT information
Viscose staple fibre:Grasim 350.7 kt
— A-59 —

Price Analysis and Price Forecasts
— A-60 —

Paper Grade BSKP Price(* Development in Europe 1980-2015
Prices fell rapidly in 2009 but started to rise again during the 3rd quarter of 2009, supported by lowpulp stocks, the Nordic strikes and the Chilean earthquake. Resumed pulp operations coupled withstrengthening dollar, rising producer stocks and persistently weak paper prices resulted in softeningpulp prices since late 2010.
— A-61 —

BHKP (Euca) Price(* Development in Europe 1980-2015
Improved demand and weak USD helped pulp price rises in 2005-2008. Since late 2008 throughmid-2009 prices fell, but started to rise again towards 2010. USD denominated pulp prices are expectedto soften in 2011 due to new pulp entries in China, relatively weak paper prices and strengthening ofthe US dollar.
— A-62 —

BSKP Price(* Development in Europe and Asia 1990-2015
There is a strong correlation between pulp prices in Europe and Asia, albeit BSKP prices paid on theAsian markets have been on average 6% lower than corresponding quotes in Europe. Pulp buyers inAsia typically enjoy smaller rebates than their European counterparts, which partly explains thedifferences.
— A-63 —

BHKP Price (* Development in Europe and Asia 1990-2015
Asian BHKP prices have been on average 7-8% lower than those in Europe. Cutthroat competition withsurplus volumes being sold onto the Asian market has meant lower troughs in Asia. Correspondingly,periods of high prices tend to last somewhat longer in Europe as compared to Asian markets.
— A-64 —

Paper Grade BSKP Price (* Development in Asia 1990-2015
The main downside drivers for the year 2011 include return of Chilean supply to the market andbuild-up of inventories. Chinese buyers have been holding pulp purchases back in order to get pricesdown while maintaining a high level of paper stocks.
— A-65 —

BHKP (Euca) Price(* Development in Asia 1990-2015
Reduction of shipments to China during the first 9-10 months of 2010 has been so significant that ithas not been compensated by gains in other regions. New entries (Rizhao pulp mill) will furthermoderate the near-term price outlook in Asia.
— A-66 —

Dissolving Pulp Price (* Development in Europe 1980-2015
The shortage of cotton supply continues through first half of 2011, fuelling the demand for viscosepulp. By the second half of 2011, cotton supply will grow with 13-14% increase in cultivation acreage.Some further softening of the dissolving pulp market is expected in 2011 due to Cosmopolis restart(+140 000 t/a), Thurso conversion (+200 000 t/a) and small expansion of Toba Lestari.
— A-67 —
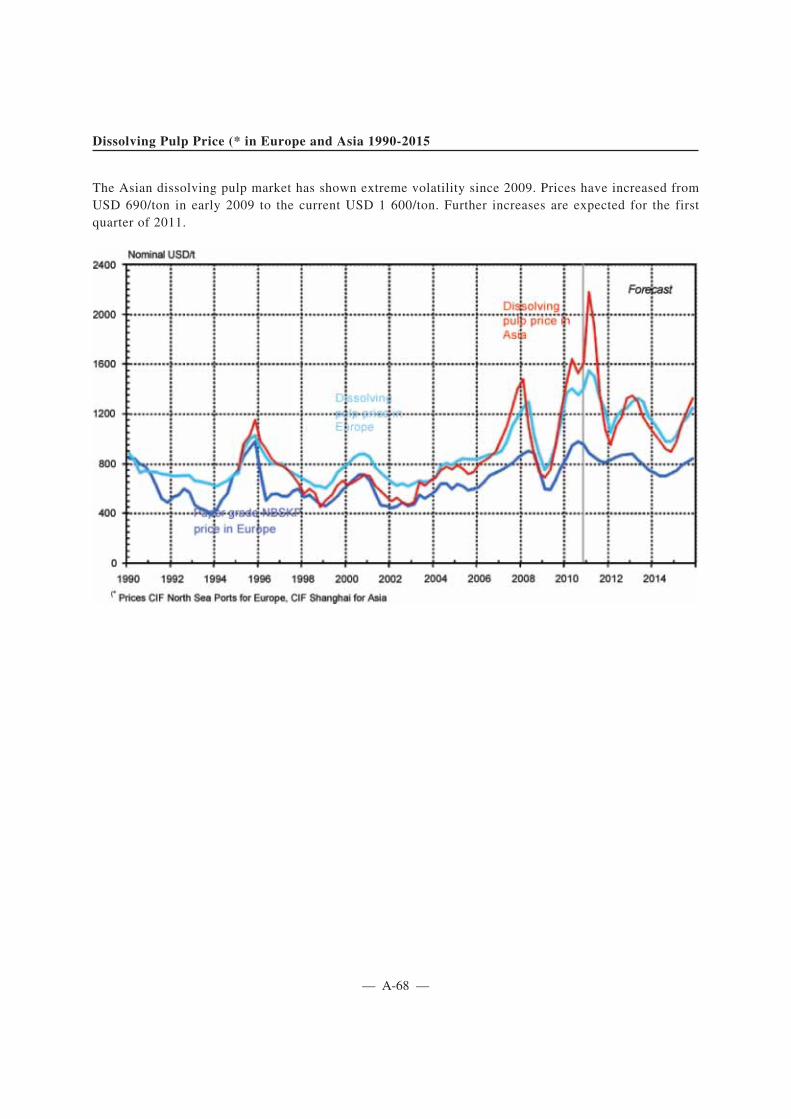
Dissolving Pulp Price (* in Europe and Asia 1990-2015
The Asian dissolving pulp market has shown extreme volatility since 2009. Prices have increased fromUSD 690/ton in early 2009 to the current USD 1 600/ton. Further increases are expected for the firstquarter of 2011.
— A-68 —

Dissolving Pulp Price (* Development in Asia 1995-2015
After a sharp peak in early 2011, the Asian dissolving pulp market will gradually normalize withgrowing cotton supply. New price hike is expected around 2013 but the assumed entry of Mörrum andPaskov capacity additions will moderate the price next increase as compared to the previous two peaks.
— A-69 —
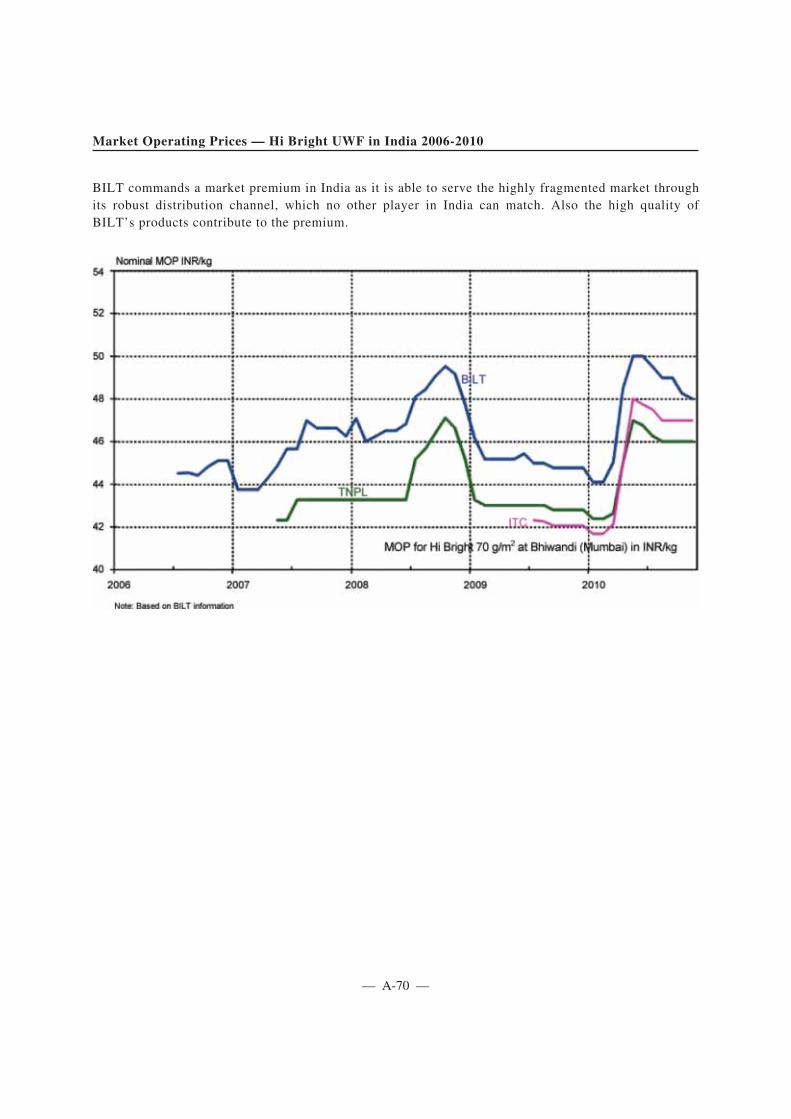
Market Operating Prices — Hi Bright UWF in India 2006-2010
BILT commands a market premium in India as it is able to serve the highly fragmented market throughits robust distribution channel, which no other player in India can match. Also the high quality ofBILT’s products contribute to the premium.
— A-70 —

Market Operating Prices — UWF Paper in Malaysia 2006-2010
SFI commands a market premium in Malaysia as it is the only domestic uncoated woodfree paperproducer with own distribution network and local support services.
— A-71 —

Stable Indian Domestic Price Development
Domestic Indian prices exhibit less volatile price movements than comparable export prices in FOBterms.
Note: Based on BILT information
— A-72 —

UWF Paper Price (* Development in Europe 1980-2015
Nominal prices in Euro terms were flat in 2008 but fell clearly through 2009. Increased pulp prices andbetter demand turned also paper prices up in mid-2010 despite the supply increase (Portucel-Soporcel)in late 2009. Economic recovery, cost increases and weaker euro through 2011–2013 support pricerises.
— A-73 —

UWF Paper Price (* in Europe and Asia 1995-2015
The assumption of strengthening USD against Euro tends to moderate estimated future price cycle inEurope. Reviving pulp prices as from end-2011 will push Asian UWF prices up through 2013.
— A-74 —

Market Operating Prices — Coated Woodfree in India 2006-2010
BILT commands a market premium in India as it is able to serve the highly fragmented market throughits robust distribution channel, which no other player in India can match.
— A-75 —

CWF Paper Price(* Development in Europe 1980-2015
CWF prices weakened in mid-2009. Economic recovery, weaker Euro and cost pressures combinedwith further capacity reductions in Europe will continue to strengthen prices as from 2010/Q2.However, price recovery faces a significant long-term downside risk from the substantial capacityincreases in China.
— A-76 —

CWF Paper Price(* in Europe and Asia 1995-2015
The assumption of strengthening USD against Euro tends to moderate estimated future price cycle inEurope. Assuming that pulp prices start to increase again after dipping in late-2010 and early 2011, theEast Asian coated woodfree paper prices are likely to rise from the current USD 850-870/t level toUSD 980-1000/t by 2013.
— A-77 —

Asset Quality and Cost Competitiveness
— A-78 —

Uncoated Woodfree Paper
— A-79 —

Industry Structure — UWF by Top Producers
In the global perspective IP is the largest UWF producer and China Sun has the youngest asset base.APP operates the biggest capacity of UWF in Asia. BGPPL is located among the medium-sizedcompanies with relatively modern paper machines.
Bubble size reflects the total allocated UWF capacity. Not allproducers are presented.
— A-80 —

Industry Structure — Asian UWF Paper Machines
There are a lot of assets below the Asian weighted average. The median capacity is 10 000 t/a and inthat range BGPPL Ballarshah PM 7 is well positioned.
Source: Pöyry Management Consulting estimates
— A-81 —

Cost Competitiveness — Manufacturing Costs of Selected Producers
APP Indah Kiat is the cost leader and SFI’s PM 1 is very competitive among the domestic producers inIndia.
Source: Pöyry Management Consulting estimates
— A-82 —

Cost Competitiveness — Landed Costs of Selected Producers
In terms of landed costs to Indian markets Ballarpur has significant advantage against the maincompetitors in transportation costs and duties.
Source: Pöyry Management Consulting estimates
— A-83 —

Cost Competitiveness — Manufacturing Costs of Selected Producers
APP Indah Kiat and West Coast Dandeli lose their cost leader positions when using market based pulpprice. This benefit more to those DIP pulp based paper machines such as Khanna Paper PM 4.
Source: Pöyry Management Consulting estimates
— A-84 —

Cost Competitiveness — Landed Costs of Selected Producers
In terms of landed costs to Indian markets Ballarpur PM 7 has a benefit against the main foreigncompetitors in lower transportation costs and duties.
Source: Pöyry Management Consulting estimates
— A-85 —

Coated Woodfree Paper
— A-86 —

Industry Structure — CWF by Top Producers
In the global perspective APP is the largest CWF producer and has modern asset base. In Asiacompanies behind APP operate clearly smaller machines. BGPPL is located among the medium-sizedcompanies with modern paper machines.
Bubble size reflects the total allocated CWF capacity. Not allproducers are presented.
— A-87 —

Industry Structure — Asian CWF Paper Machines
Only 13 PMs have capacity above the Asian weighted average, which describes the size of the largemodern machines. The median capacity is 61 000 t/a and in that range BGPPL Bhigwan is wellpositioned.
Source: Pöyry Management Consulting estimates
— A-88 —

Cost Competitiveness — Manufacturing Costs of Selected Producers
Bhigwan paper machines benefit from low personnel costs compared to many of its foreigncompetitors. In manufacturing costs Bhigwan PM 2 is on the same level with APP’s Dagang PM 2.
Source: Pöyry Management Consulting estimates
— A-89 —

Cost Competitiveness — Landed Costs of Selected Producers
In terms of landed costs to Indian markets Bhigwan PM 2 has a benefit of above 10% against the maincompetitors due to lower transportation costs and duties. The benefit would be even higher in Indianinland locations.
Source: Pöyry Management Consulting estimates
— A-90 —

Cost Competitiveness — Manufacturing Costs of Selected Producers
Stora Enso Oulu keeps its cost leader position when using market based transfer price for integratedpulp production, but the competition becomes much tighter. It improves also the competitiveness ofBhigwan PM 1.
Source: Pöyry Management Consulting estimates
— A-91 —

Cost Competitiveness — Landed Costs of Selected Producers
With market based integrated pulp costing Bhigwan’s lead in Mumbai over its main western rivalsincreases compared to cost based pricing. Moorim Jinju PM 2 and Sappi Alfeld PM 2 keep theirpositions in the back end of the chart.
Source: Pöyry Management Consulting estimates
— A-92 —
Annex I
Background Material for Price Analysis
— A-93 —

Annual GDP Growth by Region 2000-2020(e)
The economic recovery in the West will remain slow next year. China and India will be the mainengines for Asian growth in 2011 as Japan and Southeast Asia will slow down from the 2010 peaklevels. Measures to cool off the property market will result in slight moderation of economic activity inChina through 2015.
-7-6-5-4-3-2-10123456789
1011121314
20002020
Western Europe North America India JapanChina Latin America Weighted average
%
Further downside risks
Mainly upside risks
2001 2002 2003 2004 2005 2006 2007 2008 2009 2010 2011 2012 2013 2014 2015 2016-
— A-94 —
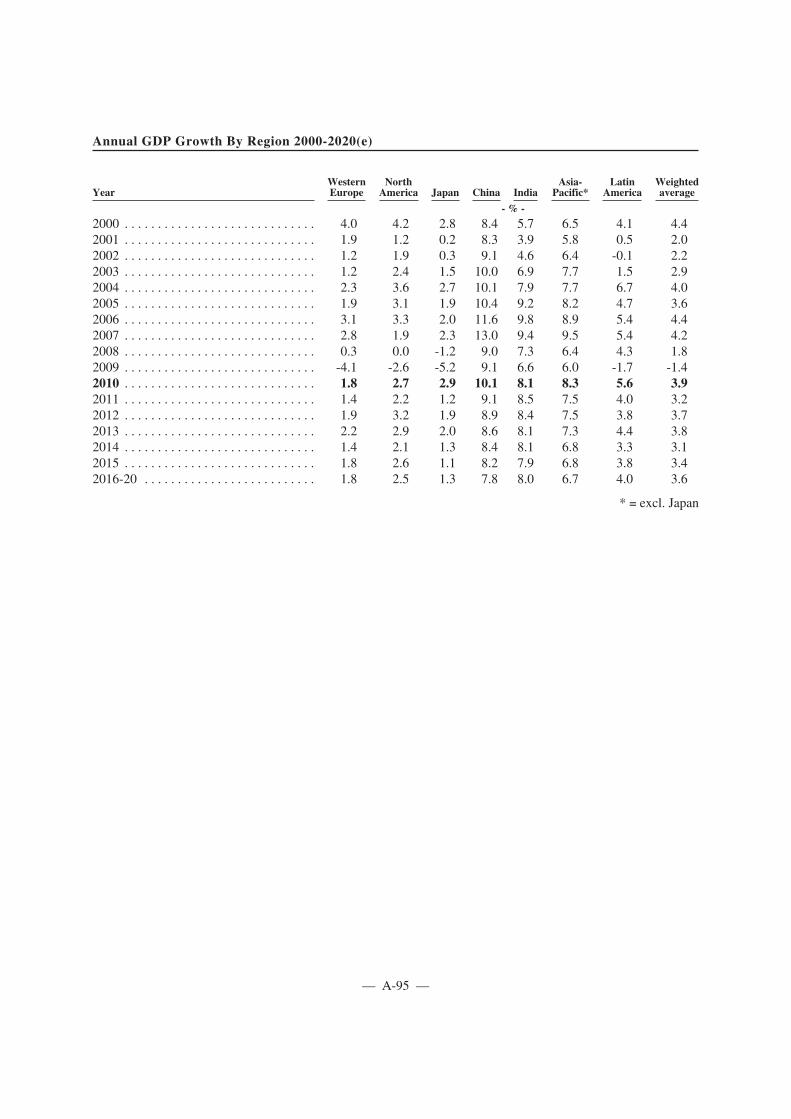
Annual GDP Growth By Region 2000-2020(e)
YearWesternEurope
NorthAmerica Japan China India
Asia-Pacific*
LatinAmerica
Weightedaverage
- % -
2000 . . . . . . . . . . . . . . . . . . . . . . . . . . . . . 4.0 4.2 2.8 8.4 5.7 6.5 4.1 4.42001 . . . . . . . . . . . . . . . . . . . . . . . . . . . . . 1.9 1.2 0.2 8.3 3.9 5.8 0.5 2.02002 . . . . . . . . . . . . . . . . . . . . . . . . . . . . . 1.2 1.9 0.3 9.1 4.6 6.4 -0.1 2.22003 . . . . . . . . . . . . . . . . . . . . . . . . . . . . . 1.2 2.4 1.5 10.0 6.9 7.7 1.5 2.92004 . . . . . . . . . . . . . . . . . . . . . . . . . . . . . 2.3 3.6 2.7 10.1 7.9 7.7 6.7 4.02005 . . . . . . . . . . . . . . . . . . . . . . . . . . . . . 1.9 3.1 1.9 10.4 9.2 8.2 4.7 3.62006 . . . . . . . . . . . . . . . . . . . . . . . . . . . . . 3.1 3.3 2.0 11.6 9.8 8.9 5.4 4.42007 . . . . . . . . . . . . . . . . . . . . . . . . . . . . . 2.8 1.9 2.3 13.0 9.4 9.5 5.4 4.22008 . . . . . . . . . . . . . . . . . . . . . . . . . . . . . 0.3 0.0 -1.2 9.0 7.3 6.4 4.3 1.82009 . . . . . . . . . . . . . . . . . . . . . . . . . . . . . -4.1 -2.6 -5.2 9.1 6.6 6.0 -1.7 -1.42010 . . . . . . . . . . . . . . . . . . . . . . . . . . . . . 1.8 2.7 2.9 10.1 8.1 8.3 5.6 3.92011 . . . . . . . . . . . . . . . . . . . . . . . . . . . . . 1.4 2.2 1.2 9.1 8.5 7.5 4.0 3.22012 . . . . . . . . . . . . . . . . . . . . . . . . . . . . . 1.9 3.2 1.9 8.9 8.4 7.5 3.8 3.72013 . . . . . . . . . . . . . . . . . . . . . . . . . . . . . 2.2 2.9 2.0 8.6 8.1 7.3 4.4 3.82014 . . . . . . . . . . . . . . . . . . . . . . . . . . . . . 1.4 2.1 1.3 8.4 8.1 6.8 3.3 3.12015 . . . . . . . . . . . . . . . . . . . . . . . . . . . . . 1.8 2.6 1.1 8.2 7.9 6.8 3.8 3.42016-20 . . . . . . . . . . . . . . . . . . . . . . . . . . 1.8 2.5 1.3 7.8 8.0 6.7 4.0 3.6
* = excl. Japan
— A-95 —

Development of Exchange Rates
Economic difficulties in parts of the Euro area (Greece, Ireland, Iberian peninsula etc.) on one hand,and more promising economic growth prospects in the USA on the other (difference in the regions’GDP growth rates Δ~1-1.5%) suggest that the USD will strengthen against EUR in the medium term.
0,4
0,6
0,8
1,0
1,2
1,4
19900
10
20
30
40
50
INR
EUR (& former ECU)
EUR and GBP per USD CNY, INR and MYR per USD
GBP
CNY
CNY, INR and GBP forecasts through 2013 by Consensus Economics Inc; Euro rate assumption by Pöyry. Note that price projections onp. 70 and 72 assume no changes in INR/USD rate.
MYR
1995 2000 2005 2010 2015
CNY, INR and GBP forecasts through 2013 by Consensus Economics Inc; Euro rate assumptionby Pöyry. Note that price projections on p. 70 and 72 assume no changes in INR/USD rate.
— A-96 —

Bleached Kraft Market Pulp Supply/Demand through 2015
BKP delivery rates deteriorated in 2008-2009 due to global economic recession and simultaneous largecapacity increases in Latin America and Asia. Practical supply problems (e.g. Chilean earthquake) andtemporary closures in 2009-2010 helped the price increases, but led to re-opening of closed assets in2010. Global demand recovery will eventually lead to improved delivery rates by 2012.
0
10
20
30
40
50
60
1990 1992 1994 1996 1998 2000 2002 2004 2006 2008 2010 2012 201480
82
84
86
88
90
92
94
96
98
100
Delivery rate
Supply
Demand
Million tons Delivery rate %
9090 93 9289 89 88 96 9292 89 92 90 94 94 92 94949191 91919697 90 92
Ratio in practice clearly better in 2009-early 2010. Presently un-announced closures/integration likely to improve ratio in 2014-15
— A-97 —

Dissolving Pulp Supply/Demand Balance through 2015
The world dissolving pulp demand* was tight in 2004-2006 due to a number of closures in 2003.Capacity increases and conversions from paper grade pulp coupled with weak economic growthresulted in softening supply as from late 2008, but losses in global cotton supply resulted in atightening global market in 2010. The estimated average demand increase in 2008-2015 is projected atabout 5.0%/a.
0,0
1,0
2,0
3,0
4,0
5,0
6,0
7,0
2000 2001 2002 2003 2004 2005 2006 2007 2008 2009 2010 2011 2012 2013 2014 2015
Total demand Wood Decided
Non wood Planned
Million metric tons
* Data excludes dissolving pulp use in specialty paper production (>100 000 tons)
Forecast
82 % 85% 87 % 93 % 98 % 90 % 98 % 92 % 97 % 91 % 93 % 93 % 96 % 95 % 97 % 98 %
— A-98 —

Mar
ket
Pulp
Cap
acityChan
ges
Cap
acitychan
ge1000
tStart-up
Region
Cou
ntry
Group
Com
pany
Mill
Location
State
Grade
Integrated
Market
Total
Year:
qtr
Description
Com
pleted
Nordic
Finland
Botnia
OyMetsä-BotniaAb
Kaskinen
blhw
sa-50
-300
-350
2009:1
shut-dow
nNordic
Finland
Botnia
OyMetsä-BotniaAb
Kaskinen
blsw
sa0
-100
-100
2009:1
shut-dow
nNordic
Finland
Botnia
OyMetsä-BotniaAb
Äänekoski
blhw
sa-15
205
190
2009:1
capacity
expansion
Nordic
Finland
Botnia
OyMetsä-BotniaAb
Äänekoski
blsw
sa-125
-65
-190
2009:1
decrease
W.E
urope
France
Tem
bec
Tem
becTartasS.A.S.
Tartas
blsw
disi
025
252009:1
capacity
expansion
W.E
urope
France
Tem
bec
Tem
becTartasS.A.S.
Tartas
blsw
fsi
0-25
-25
2009:1
decrease
W.E
urope
Spain
ENCE
Grupo
Empresarial
ENCE,S
.A.
Navia
AS
blhw
sa0
200
200
2009:1
capacity
expansion
W.E
urope
Spain
Rottneros
Rottneros
Miranda
S.A.
Miranda
deEbro
BU
blhw
sa0
-150
-150
2009:1
shut-dow
nE.E
urope
Russia
IP/Ilim
Holding
OAOIlim
Group
Korjazm
aARK
blsw
disi
0-110
-110
2009:1
shut-dow
nN.A
merica
Canada
AdityaBirla
AVCellInc.
Atholville
NB
blsw
disi
015
152009:1
capacity
expansion
N.A
merica
Canada
Kruger/T
embec
MarathonPu
lpInc.
Marathon
ON
blsw
sa0
-210
-210
2009:1
shut-dow
nN.A
merica
Canada
Kruger/T
embec
MarathonPu
lpInc.
Marathon
ON
unbl
swsa
0-5
-52009:1
shut-dow
nN.A
merica
Canada
Tem
bec
Tem
becInc.
Chetwynd
BC
blhw
CTMP
0-240
-240
2009:1
shut-dow
nN.A
merica
Canada
Terrace
Bay
Pulp
Inc.
Terrace
Bay
ON
blhw
sa0
-120
-120
2009:1
shut-dow
nN.A
merica
UnitedStates
Boise
Inc.
St.H
elens
OR
blsw
sa-100
-80
-180
2009:1
shut-dow
nN.A
merica
UnitedStates
Boise
Inc.
Wallula
WA
blsw
sa60
-60
02009:1
change
inintegration
N.A
merica
UnitedStates
Old
Tow
nFu
el&
Fiber
Old
Tow
nME
blhw
sa0
180
180
2009:1
restart
N.A
merica
UnitedStates
New
Page
Rum
ford
PaperCo.
Rum
ford
ME
blhw
sa95
-95
02009:1
change
inintegration
N.A
merica
UnitedStates
New
Page
Rum
ford
PaperCo.
Rum
ford
ME
blsw
sa20
-20
02009:1
change
inintegration
L.A
merica
Chile
CMPC
CMPC
CelulosaS.A.
Laja
blsw
sa0
-90
-90
2009:1
decrease
China
China
Henan
Investment
Puyang
LongfengPaper
Co.,L
td.
Puyang
City
HE
blhw
CTMP
105
-105
02009:1
change
inintegration
Japan
Japan
Oji
OjiPaperCo.,L
td.
AnanCity
TK
blhw
sa-75
750
2009:1
change
inintegration
-85
-1075
-1160
Nordic
Finland
StoraEnso
EnocellOy
Uim
aharju
blhw
sa-80
-140
-220
2009:2
shut-dow
nNordic
Finland
StoraEnso
SunilaOy
Sunila
blsw
sa-265
-110
-375
2009:2
shut-dow
nNordic
Sweden
Korsnäs
AB
Frövi
blhw
CTMP
25-25
02009:2
change
inintegration
Nordic
Sweden
Korsnäs
AB
Frövi
blsw
CTMP
40-40
02009:2
change
inintegration
W.E
urope
Austria
M-real
M-realH
allein
AG
Hallein
blsw
si-130
130
02009:2
change
inintegration
W.E
urope
France
M-real
M-realA
lizay
S.A.S.
Alizay
EE
blhw
sa-160
-150
-310
2009:2
shut-dow
nW.E
urope
Portugal
Altri
CeluloseBeira
Industrial
(CELBI),S
.A.
Leirosa,
Figueira
daFo
zbl
hwsa
0295
295
2009:2
capacity
expansion
W.E
urope
Spain
ENCE
Grupo
Empresarial
ENCE,S
.A.
Huelva
blhw
sa0
3030
2009:2
capacity
expansion
W.E
urope
Spain
ENCE
Grupo
Empresarial
ENCE,S
.A.
Pontevedra
blhw
sa0
1010
2009:2
capacity
expansion
N.A
merica
Canada
Fraser
Papers
Fraser
PapersInc.
Thurso
QC
blhw
sa0
-250
-250
2009:2
shut-dow
n
— A-99 —

Mar
ket
Pulp
Cap
acityChan
ges(C
ont’d)
Cap
acitychan
ge1000
tStart-up
Region
Cou
ntry
Group
Com
pany
Mill
Location
State
Grade
Integrated
Market
Total
Year:
qtr
Description
Com
pleted
N.A
merica
UnitedStates
Dom
tar
Dom
tarPaperCo.,L
LC
Plym
outh
NC
blhw
sa-65
650
2009:2
change
inintegration
N.A
merica
UnitedStates
Dom
tar
Dom
tarPaperCo.,L
LC
Plym
outh
NC
blsw
fsa
025
252009:2
capacity
expansion
N.A
merica
UnitedStates
Dom
tar
Dom
tarPaperCo.,L
LC
Plym
outh
NC
blsw
sa-70
45-25
2009:2
decrease
L.A
merica
Brazil
Fibria
FibriaS.A.
Tres
Lagoas
MS
blhw
sa0
1300
1300
2009:2
newmill
FarEast
Myanm
arMyanm
aPaperand
ChemicalsIndustries
(MPC
I)
Yeni
blsw
sa15
520
2009:2
newlin
e
-690
1190
500
W.E
urope
Portugal
PortucelSo
porcel
Portucel-
EmpresaProdutorade
PastaePapelS
.A.
Mitrena,
Setubal
blhw
sa185
-185
02009:3
change
inintegration
W.E
urope
Portugal
PortucelSo
porcel
Portucel-Empresa
Produtorade
Pastae
PapelS
.A.
Mitrena,
Setubal
blhw
sa135
-135
02009:3
change
inintegration
E.E
urope
Russia
Solombalsky
Pulp
And
PaperMill
JSC
Arhangelsk
ARK
unbl
swsa
0-130
-130
2009:3
decrease
N.A
merica
Canada
NanaimoFo
restProducts
Ltd
Nanaimo
BC
blsw
sa0
105
105
2009:3
partialrestart
N.A
merica
UnitedStates
GraphicPackaging
InternationalInc.
West
Monroe
LA
unbl
swsa
-125
125
02009:3
change
inintegration
N.A
merica
UnitedStates
InternationalP
aper
InternationalP
aper
Co.
Franklin
VA
blhw
sa-80
800
2009:3
change
inintegration
N.A
merica
UnitedStates
InternationalP
aper
InternationalP
aper
Co.
Franklin
VA
blsw
sa-40
400
2009:3
change
inintegration
N.A
merica
UnitedStates
LongviewFibrePaper
andPackaging,Inc.
Longview
WA
unbl
swsa
-75
750
2009:3
change
inintegration
China
China
Shandong
Chenm
ing
Yanbian
Chenm
ingPaper
Co.,L
td.
Longjing
JLbl
hwdisi
010
102009:3
restart
China
China
Shandong
Chenm
ing
Yanbian
Chenm
ingPaper
Co.,L
td.
Longjing
JLbl
swdisi
025
252009:3
restart
010
10
W.E
urope
Spain
Jofel/
Bestpapel
Pastguren,S.L.
Aranguren
VZ
blhw
sa-40
-35
-75
2009:4
shut-dow
nChina
China
Tiger
Forest&
Paper
Hunan
JuntaiPu
lpand
PaperCo.,L
tdHuaihua
HU
blhw
sa40
-40
02009:4
change
inintegration
China
China
Tiger
Forest&
Paper
Hunan
JuntaiPu
lpand
PaperCo.,L
tdHuaihua
HU
blsw
sa30
-30
02009:4
change
inintegration
FarEast
India
SKBangur
WestC
oastPaperMills
Ltd.
Dandeli
KA
blhw
sa150
80230
2009:4
newmill
180
-25
155
— A-100 —

Mar
ket
Pulp
Cap
acityChan
ges(C
ont’d)
Cap
acitychan
ge1000
tStart-up
Region
Cou
ntry
Group
Com
pany
Mill
Location
State
Grade
Integrated
Market
Total
Year:
qtr
Description
Com
pleted
Nordic
Finland
StoraEnso
EnocellOy
Uim
aharju
blsw
sa-5
-335
-340
2009:..shut-dow
nNordic
Finland
StoraEnso
EnocellOy
Uim
aharju
blsw
sa5
555
560
2009:..restart
W.E
urope
Italy
Sicem-Saga
Sicem-SagaS.p.A.
Canossa
RE
blhw
CTMP
025
252009:..capacity
expansion
W.E
urope
Spain
Celulosas
deAndoain
S.A.
Andoain
GZ
blsw
gw0
-30
-30
2009:..shut-dow
n
E.E
urope
Russia
IP/Ilim
Holding
OAOIlim
Group
Ust-Ilim
skIRK
blsw
sa0
7070
2009:..capacity
expansion
N.A
merica
Canada
CatalystP
aper
CatalystP
aper
Corp.
Crofton
BC
blsw
sa-60
-340
-400
2009:..shut-dow
nN.A
merica
Canada
CatalystP
aper
CatalystP
aper
Corp.
Crofton
BC
blsw
sa0
00
2009:..restart
N.A
merica
Canada
CatalystP
aper
CatalystP
aper
Corp.
Crofton
BC
blsw
sa60
160
220
2009:..partialrestart
N.A
merica
Canada
Terrace
Bay
Pulp
Inc.
Terrace
Bay
ON
blsw
sa0
-350
-350
2009:..shut-dow
nN.A
merica
Canada
Terrace
Bay
Pulp
Inc.
Terrace
Bay
ON
blsw
sa0
00
2009:..shut-dow
nL.A
merica
Brazil
LwarcelC
eluloseePapel
Ltda.
LencoisPaulista
SPbl
hwsa
030
302009:..capacity
expansion
China
China
NineDragons
NineDragons
Pulp
&Paper(Leshan)
Leshan
SIbl
swsa
0-10
-10
2009:..shut-dow
n
China
China
Shandong
Zhongmao
ShengyuanPu
lpCo.,L
td.
DezhouCity
,Sh
iling
SDbl
hwCTMP
020
202009:..capacity
expansion
FarEast
Indonesia
APP
/Sinar
Mas
PTIndahKiatP
ulp&
PaperTbk.
Perawang,
Riau
CS
blhw
sa40
-40
02009:..change
inintegration
FarEast
Indonesia
RGE/APR
ILPT
RiauAndalan
Pulp
&Paper
Pekanbaru,
Kerinci
CS
blhw
sa0
100
100
2009:..capacity
expansion
FarEast
Indonesia
PTTobaPu
lpLestari
Porsea
NS
blhw
disa
045
452009:..capacity
expansion
FarEast
Indonesia
PTTobaPu
lpLestari
Porsea
NS
blhw
disa
090
902009:..capacity
expansion
FarEast
Indonesia
PTTobaPu
lpLestari
Porsea
NS
blhw
sa0
-110
-110
2009:..decrease
FarEast
Indonesia
PTTobaPu
lpLestari
Porsea
NS
blhw
sa0
-65
-65
2009:..decrease
FarEast
Vietnam
HaiphongGroup
HaiHaPu
lpCo.
VinhTuy
Ward
unbl
hwsa
030
302009:..newmill
40-155
-115
Nordic
Finland
StoraEnso
StoraEnsoOyj
Sunila
blsw
sa265
110
375
2010:1
restart
Nordic
Finland
UPM
UPM
-Kym
meneOyj
Pietarsaari
blhw
sa0
-40
-40
2010:1
change
inintegration
Nordic
Finland
UPM
UPM
-Kym
meneOyj
Pietarsaari
blsw
sa-70
110
402010:1
change
inintegration
E.E
urope
Russia
IP/Ilim
Holding
OAOIlim
Group
Korjazm
aARK
blhw
sa0
-35
-35
2010:1
decrease
E.E
urope
Russia
IP/Ilim
Holding
OAOIlim
Group
Korjazm
aARK
unbl
swsa
035
352010:1
capacity
expansion
E.E
urope
Russia
Solombalsky
Pulp
And
PaperMill
JSC
Arhangelsk
ARK
unbl
swsa
0130
130
2010:1
partialrestart
N.A
merica
Canada
Tem
bec
Tem
becInc.
Chetwynd
BC
blhw
CTMP
0240
240
2010:1
restart
N.A
merica
UnitedStates
Dom
tar
Dom
tarPaperCo.,L
LC
Bennettsville
SCbl
swsa
-50
500
2010:1
change
inintegration
N.A
merica
UnitedStates
GraphicPackaging
InternationalInc.
WestM
onroe
LA
unbl
swsa
125
-125
02010:1
change
inintegration
— A-101 —

Mar
ket
Pulp
Cap
acityChan
ges(C
ont’d)
Cap
acitychan
ge1000
tStart-up
Region
Cou
ntry
Group
Com
pany
Mill
Location
State
Grade
Integrated
Market
Total
Year:
qtr
Description
Com
pleted
N.A
merica
....
UnitedStates
KapStone
KapStoneCharleston
Kraft,L
LC
North
Charleston
SCunbl
swsa
50-50
02010:1
change
inintegration
N.A
merica
....
UnitedStates
LongviewFibrePaper
andPackaging,Inc.
Longview
WA
unbl
swsa
75-75
02010:1
change
inintegration
N.A
merica
....
UnitedStates
Weyerhaeuser
WeyerhaeuserCo.
Port
Wentworth
GA
blsw
disa
025
252010:1
capacity
expansion
N.A
merica
....
UnitedStates
Weyerhaeuser
WeyerhaeuserCo.
Port
Wentworth
GA
blsw
fsa
0-25
-25
2010:1
decrease
FarEast.......Indonesia
PTTobaPu
lpLestari
Porsea
NS
blhw
disa
040
402010:1
capacity
expansion
FarEast.......Indonesia
PTTobaPu
lpLestari
Porsea
NS
blhw
sa0
-60
-60
2010:1
conversion
(-)
Africa.........Sw
aziland
Sappi
Usutu
Pulp
Co.,L
td.
Bhunya
unbl
swsa
0-230
-230
2010:1
shut-dow
nOceania
.......New
Zealand
RankGroup
CarterHoltH
arveyPu
lp&
PaperLtd.
Kaw
erau
blhw
sa0
-35
-35
2010:1
decrease
Oceania
.......New
Zealand
RankGroup
CarterHoltH
arveyPu
lp&
PaperLtd.
Kaw
erau
blsw
sa0
3535
2010:1
capacity
expansion
395
100
495
N.A
merica
....
Canada
CatalystP
aper
CatalystP
aper
Corp.
Crofton
BC
blsw
sa0
170
170
2010:2
partialrestart
N.A
merica
....
Canada
Fortress
Group
Fortress
Specialty
Cellulose
Inc.
Thurso
QC
blhw
sa0
250
250
2010:2
restart
N.A
merica
....
UnitedStates
InternationalP
aper
InternationalP
aper
Co.
Franklin
VA
blhw
sa-330
-80
-410
2010:2
shut-dow
nN.A
merica
....
UnitedStates
InternationalP
aper
InternationalP
aper
Co.
Franklin
VA
blsw
sa-175
-45
-220
2010:2
shut-dow
nL.A
merica.....Argentin
aCelulosaCam
pana
PastaCelulosicaPu
erto
Piray
Puerto
Piray
MS
blhw
si10
3545
2010:2
restart
L.A
merica.....Chile
Arauco
CelulosaAraucoy
Constitu
cion
S.A.
Arauco,
Bio-Bio
blsw
sa0
-500
-500
2010:2
shut-dow
n
China
.........China
APP
/Sinar
Mas
HainanJinhaiPu
lp&
PaperCo.
Ltd
Yangpu,
Hainan
HN
blhw
sa80
-80
02010:2
change
inintegration
China
.........China
NineDragons
NineDragons
XingAn
Paper(Inner
Mongolia)
Co.
Ltd.
Zalantun
IMunbl
swsa
-20
200
2010:2
change
inintegration
-435
-230
-665
E.E
urope......
Russia
JSCBaikalP
ulp&
Paper
Mill
Bajkalsk
IRK
blsw
disa
075
752010:3
restart
E.E
urope......
Russia
JSCBaikalP
ulp&
Paper
Mill
Bajkalsk
IRK
unbl
swsa
010
102010:3
restart
China
.........China
RGE/APR
ILSh
andong
AsiaPacific
SSYMBPu
lp&
Paper
Co.
Ltd
Rizhao
SDbl
hwsa
01300
1300
2010:3
newlin
e
01385
1385
— A-102 —

Mar
ket
Pulp
Cap
acityChan
ges(C
ont’d)
Cap
acitychan
ge1000
tStart-up
Region
Cou
ntry
Group
Com
pany
Mill
Location
State
Grade
Integrated
Market
Total
Year:
qtr
Description
Com
pleted
Nordic
Sweden
Rottneros
VallviksBrukAB
Vallvik
blsw
sa0
1010
2010:4
capacity
expansion
Nordic
Sweden
Rottneros
VallviksBrukAB
Vallvik
unbl
swsa
05
52010:4
capacity
expansion
N.A
merica
Canada
SFKPu
lpFu
ndSF
KPu
lpGeneral
Partnership
St.F
elicien
QC
blsw
sa0
1515
2010:4
capacity
expansion
N.A
merica
Canada
Terrace
Bay
Pulp
Inc.
Terrace
Bay
ON
blsw
sa0
350
350
2010:4
partialrestart
N.A
merica
UnitedStates
Dom
tar
Dom
tarPaperCo.,L
LC
Plym
outh
NC
blhw
sa-110
-65
-175
2010:4
conversion
(-)
N.A
merica
UnitedStates
Dom
tar
Dom
tarPaperCo.,L
LC
Plym
outh
NC
blsw
fsa
0260
260
2010:4
capacity
expansion
N.A
merica
UnitedStates
Dom
tar
Dom
tarPaperCo.,L
LC
Plym
outh
NC
blsw
sa-30
-45
-75
2010:4
conversion
(-)
FarEast
Indonesia
PTKertasNusantara
Mangkajang
EK
blhw
sa0
500
500
2010:4
restart
FarEast
Indonesia
APP
/Sinar
Mas
PTLontarPapyrusPu
lp&
PaperIndustry
Tanjung
Jabung,
Jambi
CS
blhw
sa40
-40
02010:4
change
inintegration
FarEast
Korea,R
ep.
Moorim
Moorim
Pulp
&PaperCo
Ltd
Ulsan,
Kyungnam
blhw
sa0
2020
2010:4
capacity
expansion
Africa
SouthAfrica
Mondi
Mondi
RichardsBay
RichardsBay
KN
blhw
sa-50
500
2010:4
change
inintegration
-150
1060
910
Nordic
Sweden
Dom
sjöFabriker
AB
Örnsköldsvik
blsw
disi
015
152010:..capacity
expansion
N.A
merica
Canada
APP
/Sinar
Mas
MackenziePu
lpMill
Corporatio
nMackenzie
BC
blsd
sa0
9595
2010:..restart
N.A
merica
Canada
APP
/Sinar
Mas
MackenziePu
lpMill
Corporatio
nMackenzie
BC
blsd
sa0
-50
-50
2010:..decrease
N.A
merica
Canada
APP
/Sinar
Mas
MackenziePu
lpMill
Corporatio
nMackenzie
BC
blsw
sa0
140
140
2010:..restart
N.A
merica
Canada
APP
/Sinar
Mas
MackenziePu
lpMill
Corporatio
nMackenzie
BC
blsw
sa0
5050
2010:..capacity
expansion
China
China
Lee
&Man
Lee
&Man
Paper
Manufacturing
Co.,L
td.
Yongchuan
IndustrialPark
CH
blhw
sa-50
0-50
2010:..decrease
China
China
Lee
&Man
Lee
&Man
Paper
Manufacturing
Co.,L
td.
Yongchuan
IndustrialPark
CH
blhw
sa0
1515
2010:..capacity
expansion
FarEast
Indonesia
APP
/Sinar
Mas
PTIndahKiatP
ulp&
PaperTbk.
Perawang,
Riau
CS
blhw
sa40
-40
02010:..change
inintegration
-10
225
215
Decided
W.E
urope
France
Tem
bec
Tem
becTartasS.A.S.
Tartas
blsw
disi
3535
2011:1
capacity
expansion
W.E
urope
France
Tem
bec
Tem
becTartasS.A.S.
Tartas
blsw
fsi
-35
-35
2011:1
decrease
L.A
merica
Chile
Arauco
CelulosaAraucoy
Constitu
cion
S.A.
Arauco,
Bio-
Bio
blsw
sa500
500
2011:1
restart
FarEast
Vietnam
AnHoa
PaperJointS
tock
Co.
VinhLoi,
Tuyen
Quang
TQ
blhw
sa130
130
2011:1
newmill
0630
630
— A-103 —

Mar
ket
Pulp
Cap
acityChan
ges(C
ont’d)
Cap
acitychan
ge1000
tStart-up
Region
Cou
ntry
Group
Com
pany
Mill
Location
State
Grade
Integrated
Market
Total
Year:
qtr
Description
Decided
N.A
merica
UnitedStates
CosmoSp
ecialty
Fibers,
Inc.
Cosmopolis
WA
blsw
disi
140
140
2011:2
restart
N.A
merica
UnitedStates
Georgia-Pacific
GPCellulose,L
.L.C.
Perdue
Hill
AL
blsw
fsa
7575
2011:2
conversion
(+)
N.A
merica
UnitedStates
Georgia-Pacific
GPCellulose,L
.L.C.
Perdue
Hill
AL
blsw
sa-75
-75
2011:2
decrease
China
China
Huatai
Anhui
HuataiF
orestP
ulp
&PaperCo.,L
td.
AnqingCity
AN
blsw
sa100
200
300
2011:2
newmill
China
China
ChenzhouYunongPaper
Industries
Co.
Ltd
Chenzhou
City
HU
blhw
CTMP
175
175
2011:2
newmill
China
China
Shandong
Chenm
ing
Zhanjiang
Chenm
ingPu
lp&
PaperCo.,L
td.
Zhanjiang
GD
blhw
sa600
100
700
2011:2
newmill
FarEast
Indonesia
APP
/Sinar
Mas
PTLontarPapyrusPu
lp&
PaperIndustry
Tanjung
Jabung,
Jambi
CS
blhw
sa40
-40
02011:2
change
inintegration
FarEast
Korea,R
ep.
Moorim
Moorim
Pulp
&PaperCo
Ltd
Ulsan,
Kyungnam
blhw
sa280
-280
02011:2
change
inintegration
1020
295
1315
N.A
merica
Canada
Fortress
Group
FortressSpe
cialty
Cellulose
Inc.
Thurso
QC
blhw
disa
200
200
2011:3
conversion
(+)
N.A
merica
Canada
Fortress
Group
FortressSpe
cialty
Cellulose
Inc.
Thurso
QC
blhw
sa-250
-250
2011:3
conversion
(-)
L.A
merica
Chile
CMPC
CMPCCelulosaS.A
.Nacim
iento,
Bio-Bio
blhw
sa360
360
2011:3
capacity
expansion
FarEast
Indonesia
APP
/Sinar
Mas
PTLon
tarPap
yrus
Pulp&
Pap
erIndu
stry
Tanjung
Jabung,
Jambi
CS
blhw
sa40
-40
02011:3
change
inintegration
FarEast
Malaysia
Ballarpur
Industries
-BILT
Sab
ahForestIndu
stries
Sdn
.Bhd
.Sipitang
SHbl
hwsa
120
120
2011:3
capacity
expansion
40390
430
FarEast
Indonesia
APP
/Sinar
Mas
PTInda
hKiatPulp&
Pap
erTbk
.Perawang,
Riau
CS
blhw
sa300
-300
02011:4
change
inintegration
Nordic
Sweden
Dom
sjöFab
rike
rAB
Örnsköldsvik
blsw
disi
1515
2011:..capacity
expansion
W.E
urope
Austria
Lenzing
Group
Len
zing
AG
Lenzing
UA
blhw
disi
20-15
52011:..capacity
expansion
N.A
merica
Canada
WestF
raserTim
ber
WestFraserMills
Ltd
Hinton
AB
blsw
sa70
702011:..capacity
expansion
2070
90
Nordic
Sweden
Södra
Söd
raCellAB
Mörrum
blhw
disa
170
170
2012:1
conversion
(+)
Nordic
Sweden
Södra
Söd
raCellAB
Mörrum
blhw
sa-145
-145
2012:1
conversion
(-)
Nordic
Sweden
Södra
Söd
raCellAB
Mörrum
blsw
sa-55
-55
2012:1
decrease
China
China
Yun
nanYun
-Jing
Forestry&
PulpMill
Co.,Ltd.
Simao
YU
blhw
sa40
402012:1
newlin
e
— A-104 —

Mar
ket
Pulp
Cap
acityChan
ges(C
ont’d)
Cap
acitychan
ge1000
tStart-up
Region
Cou
ntry
Group
Com
pany
Mill
Location
State
Grade
Integrated
Market
Total
Year:
qtr
Description
Decided
China
China
Yun
nanYun
-Jing
Forestry&
PulpMill
Co.,Ltd.
Simao
YU
blsw
sa50
502012:1
newlin
e
FarEast
Vietnam
AnHoa
Pap
erJoint
Stock
Co.
VinhLoi,
Tuyen
Quang
TQ
blhw
sa80
-80
02012:1
change
inintegration
80-20
60
China
China
FujianQingsha
nPap
erIndu
stry
Co.
Ltd.
Sanm
ing
City
,Qingzhou
City
FUbl
swdisa
120
120
2012:2
newlin
e
China
China
APP
/Sinar
Mas
Haina
nJinh
aiPulp&
Pap
erCo.
Ltd
Yangpu,
Hainan
HN
blhw
sa220
-220
02012:2
change
inintegration
FarEast
Thailand
DoubleAGroup
Dou
bleA
(199
1)Pub
lic
Com
pany
Lim
ited
Tha
Toom,
Prachinburi
blhw
sa200
-200
02012:2
change
inintegration
420
-300
120
L.A
merica
Chile
CMPC
CMPCCelulosaS.A
.Laja
blsw
sa100
100
2012:3
capacity
expansion
E.E
urope
Czech
Rep.
Lenzing
Group
BiocelPasko
va.s.
Paskov
blsw
disi
-20
-20
2012:4
conversion
(+)
E.E
urope
Russia
IP/Ilim
Holding
OAO
Ilim
Group
Bratsk
IRK
blsw
sa-220
-220
2012:4
shut-dow
nE.E
urope
Russia
IP/Ilim
Holding
OAO
Ilim
Group
Bratsk
IRK
blsw
sa720
720
2012:4
newlin
eL.A
merica
Brazil
Eldorad
oCelulosee
Pap
elLtda
TresLagoas
MS
blhw
sa1500
1500
2012:4
newmill
01980
1980
FarEast
Vietnam
Int’lCom
merce
Impo
rtExp
ortCom
pany
ofSaigo
n
Duy
Xuyen,
Quang
Nam
QM
blhw
CTMP
100
100
2012:..newmill
China
China
Oji
Jian
gsuOjiPap
erCo.,
Ltd.
Nantong
City
JGbl
hwsa
200
500
700
2013:1
newlin
e
Plann
edE.E
urope
Russia
JSCBaikalP
ulp&
Paper
Mill
Bajkalsk
IRK
unbl
swsa
115
115
2011:1
partialrestart
N.A
merica
Canada
APP
/Sinar
Mas
MackenziePu
lpMill
Corporatio
nMackenzie
BC
blsd
sa-45
-45
2011:1
conversion
(-)
N.A
merica
Canada
APP
/Sinar
Mas
MackenziePu
lpMill
Corporatio
nMackenzie
BC
blsw
sa45
452011:1
capacity
expansion
FarEast
Pakistan
Faruki
Pulp
MillsLtd.
Lahore,
Punjab
PBsblh
wsa
3030
2011:3
partialrestart
Nordic
Sweden
SCA
SCAGraphicSu
ndsvall
AB
Östrand
blsw
sa10
102011:4
capacity
expansion
W.E
urope
Spain
EnkartepastS.L.
Aranguren
VZ
blhw
sa40
3575
2011:..restart
E.E
urope
Bulgaria
Svilo
cell
Svishtov
blhw
sa20
202011:..capacity
expansion
— A-105 —

Mar
ket
Pulp
Cap
acityChan
ges(C
ont’d)
Cap
acitychan
ge1000
tStart-up
Region
Cou
ntry
Group
Com
pany
Mill
Location
State
Grade
Integrated
Market
Total
Year:
qtr
Description
Plann
edN.A
merica
Canada
AdityaBirla
AVNackawicInc.
Nackawic
NB
blhw
disa
1515
2011:..capacity
expansion
L.A
merica
Brazil
CMPC
MelhoramentosPapeis
Ltda.
Caieiras
SPbl
hwCTMP
1515
2011:..capacity
expansion
L.A
merica
Brazil
CMPC
MelhoramentosPapeis
Ltda.
Caieiras
SPbl
swCTMP
1515
2011:..capacity
expansion
L.A
merica
Chile
Arauco
CelulosaAraucoy
Constitu
cion
S.A.
Valdivia
blhw
sa55
552011:..capacity
expansion
L.A
merica
Chile
Arauco
CelulosaAraucoy
Constitu
cion
S.A.
Valdivia
blsw
sa55
552011:..capacity
expansion
China
China
RGE/APR
ILSh
andong
AsiaPacific
SSYMBPu
lp&
Paper
Co.
Ltd
Rizhao
SDbl
hwsa
200
200
2011:..capacity
expansion
China
China
Tiger
Forest&
Paper
Tiger
Forest&
Paper
Changde
HU
blhw
disa
300
300
2011:..newmill
FarEast
India
AndhraPradesh
The
AndhraPradesh
PaperMillsLtd.
Rajahmundry
AP
blhw
sa35
352011:..capacity
expansion
FarEast
Indonesia
PTTobaPu
lpLestari
Porsea
NS
blhw
disa
6060
2011:..capacity
expansion
FarEast
Indonesia
PTTobaPu
lpLestari
Porsea
NS
blhw
disa
6060
2012:1
capacity
expansion
FarEast
India
JKPaperLtd.
Jaykaypur
OA
blhw
sa-95
-15
-110
2012:4
shut-dow
nNordic
Sweden
Holmen
Iggesund
Paperboard
AB
Iggesund
blhw
sa10
3545
2012:..capacity
expansion
Nordic
Sweden
Holmen
Iggesund
Paperboard
AB
Iggesund
blsw
sa5
1520
2012:..capacity
expansion
W.E
urope
Germany
MercerInternational
Zellstoff-und
Papierfabrik
Rosenthal
GmbH
Blankenstein
TH
blsw
sa70
702012:..capacity
expansion
E.E
urope
Russia
IP/Ilim
Holding
OAOIlim
Group
Korjazm
aARK
blhw
sa165
-165
02012:..change
inintegration
E.E
urope
Russia
IP/Ilim
Holding
OAOIlim
Group
Korjazm
aARK
blsw
sa35
-35
02012:..change
inintegration
E.E
urope
Russia
Solombalsky
Pulp
And
PaperMill
JSC
Arhangelsk
ARK
unbl
swsa
2020
2012:..capacity
expansion
N.A
merica
UnitedStates
Georgia-Pacific
GPCellulose,L
.L.C.
Perdue
Hill
AL
blsw
fsa
7575
2012:..capacity
expansion
N.A
merica
UnitedStates
Georgia-Pacific
GPCellulose,L
.L.C.
Perdue
Hill
AL
blsw
sa-75
-75
2012:..decrease
China
China
Guangxi
Forestry
Lipu
PaperCo.,L
td.
Lipu
GZ
unbl
swsa
5050
2012:..newlin
e
China
China
Lee
&Man
Lee
&Man
Paper
Manufacturing
Co.,L
td.
Yongchuan
Industrial
Park
CH
blhw
sa25
252012:..capacity
expansion
FarEast
Vietnam
Vinapaco
BaiBangPaperCom
pany
(Bapaco)
PhongChau
Tow
nPT
blhw
sa60
120
180
2012:..newlin
e
Africa
SouthAfrica
Pulp
United(Pty)Ltd
RichardsBay
blhw
CTMP
165
165
2012:..newmill
— A-106 —

Mar
ket
Pulp
Cap
acityChan
ges(C
ont’d)
Cap
acitychan
ge1000
tStart-up
Region
Cou
ntry
Group
Com
pany
Mill
Location
State
Grade
Integrated
Market
Total
Year:
qtr
Description
Plann
edL.A
merica
Uruguay
StoraEnso/A
rauco
MontesdelP
lata
PuntaPereira,
Colonia
blhw
sa1300
1300
2013:3
newmill
L.A
merica
Brazil
Suzano
Suzano
Papele
Celulose
S.A
..,Maranhao
MA
blhw
sa1400
1400
2013:4
newmill
Nordic
Sweden
SCA
SCAGraphicSu
ndsvall
AB
Östrand
blsw
sa320
320
2013:..capacity
expansion
Nordic
Sweden
SCA
SCAGraphicSu
ndsvall
AB
Östrand
blsw
CTMP
5050
2013:..capacity
expansion
E.E
urope
Czech
Rep.
Lenzing
Group
BiocelP
askova.s.
Paskov
blsw
disi
180
180
2013:..conversion
(+)
E.E
urope
Czech
Rep.
Lenzing
Group
BiocelP
askova.s.
Paskov
blsw
si-250
-250
2013:..decrease
N.A
merica
UnitedStates
Georgia-Pacific
GPCellulose,L
.L.C.
Perdue
Hill
AL
blsw
fsa
7575
2013:..capacity
expansion
N.A
merica
UnitedStates
Georgia-Pacific
GPCellulose,L
.L.C.
Perdue
Hill
AL
blsw
sa-75
-75
2013:..decrease
China
China
Chung
HwaPu
lpGuangdong
Dingfeng
Pulp
&PaperCo.,L
td.
Zhaoqingcity,
Guangning
GD
blhw
sa200
200
2013:..newlin
e
China
China
China
Metallurgical
Tiger
Group/China
MetallurgicalGroup
Yuanjiang
City
HU
blhw
sa300
300
2013:..newmill
FarEast
Indonesia
Korindo
Group
....,Kalim
antan
blhw
CTMP
250
250
2013:..newmill
FarEast
Thailand
Panjapol
Paper
Evergreen
Plus
,,,Lopburi
Province
blhw
sa400
400
2013:..newmill
E.E
urope
Belarus
SvetlogorskPu
lpMill
Svetlogorsk
blsw
sa400
400
2014
-newmill
E.E
urope
Russia
AngaraPaper
Lesosibirk
KYA
blsw
sa900
900
2014
-newmill
E.E
urope
Russia
Aspek
near
Manturovo
KOS
blhw
sa280
120
400
2014
-newmill
E.E
urope
Russia
Aspek
near
Manturovo
KOS
blsw
sa50
350
400
2014
-newmill
E.E
urope
Russia
BoguchanskiyPu
lp&
PaperMill
Yarki
KYA
blsw
sa800
800
2014
-newmill
E.E
urope
Russia
EstonianPu
lpDedovich
PSK
blhw
CTMP
270
270
2014
-newmill
E.E
urope
Russia
Investlesprom
JSCSegezhaPu
lpand
PaperMill
Segezha
KR
blhw
sa160
160
2014
-newlin
e
E.E
urope
Russia
Investlesprom
JSCSegezhaPu
lpand
PaperMill
Segezha
KR
blsw
sa340
340
2014
-newlin
e
E.E
urope
Russia
Khanti-Mansiyskproject
Priobye
KM
blsw
sa800
800
2014
-newmill
E.E
urope
Russia
Mondi
Mondi
SyktyvkarOAO
Syktyvkar
KO
blsw
sa1000
1000
2014
-newlin
eE.E
urope
Russia
OAODallesprom
Amursk
KHA
blsw
sa500
500
2014
-newmill
E.E
urope
Russia
UPM
OOOBorea
..bl
hwsa
480
480
2014
-newmill
E.E
urope
Russia
UPM
OOOBorea
..bl
swsa
320
320
2014
-newmill
E.E
urope
Russia
OOOTsPKPo
lyarnaya
Amazar,
Mogochinsk
distr.
CHI
unbl
swsa
200
200
2014
-newmill
— A-107 —

Mar
ket
Pulp
Cap
acityChan
ges(C
ont’d)
Cap
acitychan
ge1000
tStart-up
Region
Cou
ntry
Group
Com
pany
Mill
Location
State
Grade
Integrated
Market
Total
Year:
qtr
Description
Plann
edE.E
urope
Russia
OOOTsPKPo
lyarnaya
Amazar,
Mogochinsk
distr.
CHI
unbl
swsa
200
200
2014
-newlin
e
E.E
urope
Russia
StoraEnso
StoraEnsoRussia
..,Nizhni
Novgorod
NIZ
blsw
sa400
500
900
2014
-newmill
E.E
urope
Russia
UdorskPu
lpandPaper
Mill
Udorsky
DistrictKO
blsw
sa500
500
2014
-newmill
N.A
merica
Canada
AdityaBirla
AVNackawicInc.
Nackawic
NB
blhw
disa
5050
2014
-capacity
expansion
N.A
merica
UnitedStates
Georgia-Pacific
GPCellulose,L
.L.C.
Perdue
Hill
AL
blsw
fsa
2525
2014
-capacity
expansion
N.A
merica
UnitedStates
Georgia-Pacific
GPCellulose,L
.L.C.
Perdue
Hill
AL
blsw
sa-25
-25
2014
-decrease
L.A
merica
Brazil
Cenibra
-CeluloseNipo-
BrasileiraS.A.
BeloOriente
MG
blhw
sa800
800
2014
-newlin
e
L.A
merica
Brazil
CMPC
CMPC
Celulose
Riograndense
Guaiba,Po
rto
Alegre
RS
blhw
sa1300
1300
2014
-newlin
e
L.A
merica
Brazil
Fibria
FibriaS.A
..,Rio
Grande
doSu
lbl
hwsa
1500
1500
2014
-newmill
L.A
merica
Brazil
Fibria
FibriaS.A.
Aracruz
ES
blhw
sa1500
1500
2014
-newlin
eL.A
merica
Brazil
Fibria
FibriaS.A.
TresLagoas
MS
blhw
sa1500
1500
2014
-newlin
eL.A
merica
Brazil
Orsa
JariCeluloseS.A.
MonteDourado,
Munguba
PAbl
hwsa
1300
1300
2014
-newlin
e
L.A
merica
Brazil
Klabin
KlabinPapéis
..,Paraná
PRbl
hwsa
1500
1500
2014
-newmill
L.A
merica
Brazil
PortucelSo
porcel
PortucelBrazil
..bl
hwsa
1300
1300
2014
-newmill
L.A
merica
Brazil
Suzano
Suzano
Papele
Celulose
S.A
..,Maranhao
MA
blhw
sa1300
1300
2014
-newlin
e
L.A
merica
Brazil
Suzano
Suzano
Papele
Celulose
S.A.
Mucuri
BA
blhw
sa400
400
2014
-capacity
expansion
L.A
merica
Brazil
Suzano
Suzano
Papele
Celulose
S.A.
Teresina,Piaui
PIbl
hwsa
1400
1400
2014
-newmill
L.A
merica
Brazil
Fibria/S
tora
Enso
VeracelCeluloseS.A.
Eunápolis
BA
blhw
sa1500
1500
2014
-newlin
eL.A
merica
Uruguay
Tapebicuá
CelulosaArgentin
a..
blhw
sa700
700
2014
-newmill
L.A
merica
Venezuela
Empresade
Producción
Socialde
(Pulpaca)
Anzoáteguistate
blhw
sa100
100
2014
-newlin
e
L.A
merica
Venezuela
Empresade
Producción
Socialde
(Pulpaca)
Anzoáteguistate
blsw
sa100
100
2014
-newlin
e
China
China
China
Int’lT
ourism
&Trade
China
International
Tourism
&Trade
Co.
Ltd...
blsw
sa275
275
2014
-newmill
China
China
Oji
JiangsuOjiPaperCo.,
Ltd.
Nantong
City
JGbl
hwsa
200
-200
02014
-change
inintegration
China
China
Lee
&Man
Lee
&Man
Paper
Manufacturing
Co.,L
td.
..GZ
blhw
sa150
150
300
2014
-newmill
— A-108 —
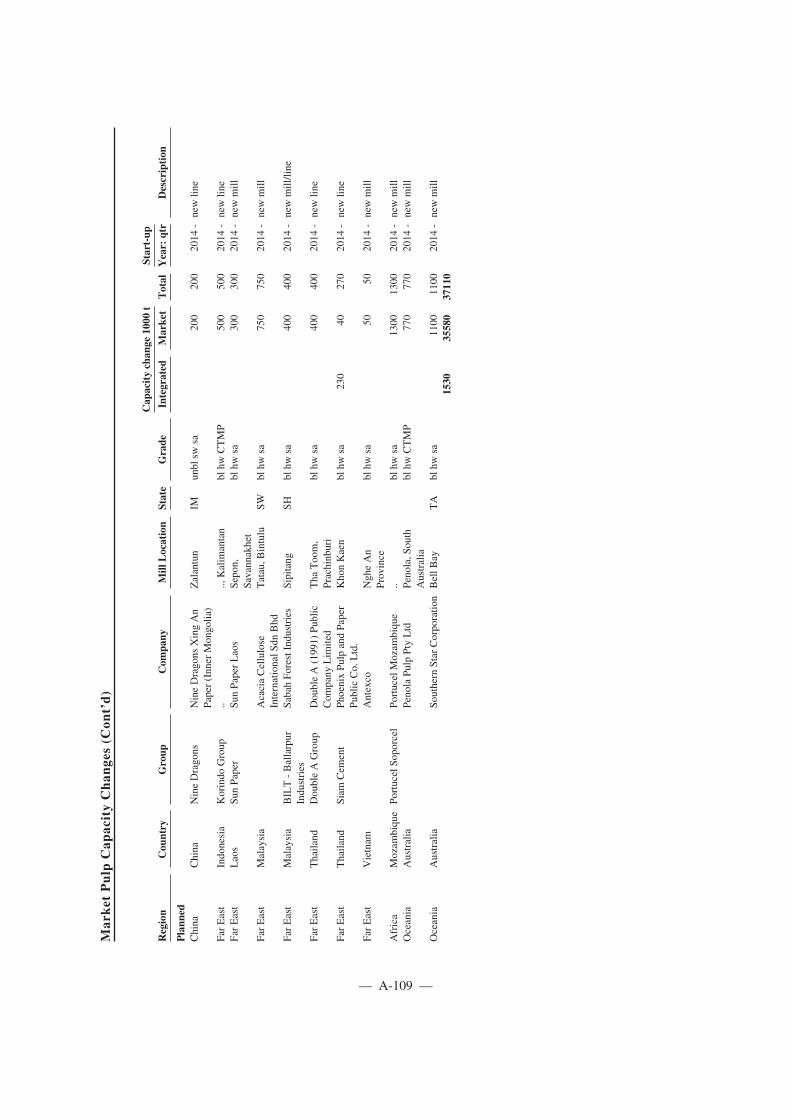
Mar
ket
Pulp
Cap
acityChan
ges(C
ont’d)
Cap
acitychan
ge1000
tStart-up
Region
Cou
ntry
Group
Com
pany
Mill
Location
State
Grade
Integrated
Market
Total
Year:
qtr
Description
Plann
edChina
China
NineDragons
NineDragons
XingAn
Paper(Inner
Mongolia)
Zalantun
IMunbl
swsa
200
200
2014
-newlin
e
FarEast
Indonesia
Korindo
Group
....,Kalim
antan
blhw
CTMP
500
500
2014
-newlin
eFarEast
Laos
SunPaper
SunPaperLaos
Sepon,
Savannakhet
blhw
sa300
300
2014
-newmill
FarEast
Malaysia
AcaciaCellulose
InternationalS
dnBhd
Tatau,B
intulu
SWbl
hwsa
750
750
2014
-newmill
FarEast
Malaysia
BILT-Ballarpur
Industries
SabahFo
restIndustries
Sipitang
SHbl
hwsa
400
400
2014
-newmill/line
FarEast
Thailand
DoubleAGroup
DoubleA(1991)
Public
Com
pany
Lim
ited
Tha
Toom,
Prachinburi
blhw
sa400
400
2014
-newlin
e
FarEast
Thailand
Siam
Cem
ent
PhoenixPu
lpandPaper
PublicCo.
Ltd.
KhonKaen
blhw
sa230
40270
2014
-newlin
e
FarEast
Vietnam
Antexco
NgheAn
Province
blhw
sa50
502014
-newmill
Africa
Mozam
bique
PortucelSo
porcel
PortucelMozam
bique
..bl
hwsa
1300
1300
2014
-newmill
Oceania
Australia
PenolaPu
lpPtyLtd
Penola,S
outh
Australia
blhw
CTMP
770
770
2014
-newmill
Oceania
Australia
Southern
Star
Corporatio
nBellB
ayTA
blhw
sa1100
1100
2014
-newmill
1530
35580
37110
— A-109 —

Global WF Paper Demand and Capacity Changes 2000-2015
Balancing capacity and demand will continue to be crucial for the global woodfree paper industry inthe medium term. New capacity coming on stream in Asia during 2011-2012 (4.6 million tons) will beeventually absorbed by the increasing demand in the region. In Europe, the slowly recovering demandwill lead to improved market balances through 2015.
-4000
-3000
-2000
-1000
0
1000
2000
3000
2000 2001 2002 2003 2004 2005 2006 2007 2008 2009 2010 2011 2012 2013 2014 2015
Capacity change
Demand change
1000 t/a
Uncoated woodfree paper Coated woodfree paper
-4000
-3000
-2000
-1000
0
1000
2000
3000
2000 2001 2002 2003 2004 2005 2006 2007 2008 2009 2010 2011 2012 2013 2014 2015
Capacity change
Demand change
1000 t/a
Capacity projection 2010-2015 includes decided capacity changes only; no creep considered
— A-110 —

Unco
ated
Woo
dfree
Pap
erCap
acityChan
ges
Region
Cou
ntry
Group
Com
pany
Mill
Location
State
PM
Grade
Cap
acity
chan
ge1000
tStart-up
Year:
qtr
Description
Com
pleted
W.E
urope
France
Papeteries
desDeux-Guiers
St.L
aurent
duPo
ntIE
3uncoated
woodfreeboard
-20
2009:1
shut-dow
nW.E
urope
Germany
M-real
M-realZ
andersGmbH
BergischGladbach
NW
3uncoated
WFspecialties
105
2009:1
gradechange
W.E
urope
Germany
M-real
M-realZ
andersGmbH
BergischGladbach
NW
3uncoated
woodfree
105
2009:1
gradechange
W.E
urope
Italy
Cartiere
PaoloPignaS.p.A.
AlzanoLom
bardo
BG
2uncoated
woodfree
-10
2009:1
shut-dow
nW.E
urope
Italy
Cartiere
PaoloPignaS.p.A.
AlzanoLom
bardo
BG
2uncoated
woodfreeboard
-52009:1
shut-dow
nW.E
urope
Italy
Cartiere
PaoloPignaS.p.A.
AlzanoLom
bardo
BG
6uncoated
woodfree
-25
2009:1
shut-dow
nW.E
urope
Netherlands
MeerssenPapier
B.V.
Meerssen
2uncoated
WFspecialties
22009:1
restartP
MW.E
urope
Netherlands
MeerssenPapier
B.V.
Meerssen
2uncoated
woodfreeboard
12009:1
restartP
MW.E
urope
Netherlands
MeerssenPapier
B.V.
Meerssen
3uncoated
WFspecialties
22009:1
restartP
MW.E
urope
Netherlands
MeerssenPapier
B.V.
Meerssen
3uncoated
woodfreeboard
12009:1
restartP
MW.E
urope
Netherlands
MeerssenPapier
B.V.
Meerssen
4uncoated
WFspecialties
22009:1
restartP
MW.E
urope
Netherlands
MeerssenPapier
B.V.
Meerssen
4uncoated
woodfreeboard
12009:1
restartP
MW.E
urope
UnitedKingdom
InternationalP
aper
InternationalP
aper
(UK)Ltd.Inverurie
SC3
uncoated
WFspecialties
-25
2009:1
shut-dow
nW.E
urope
UnitedKingdom
InternationalP
aper
InternationalP
aper
(UK)Ltd.Inverurie
SC3
uncoated
woodfreeboard
-52009:1
shut-dow
nW.E
urope
UnitedKingdom
InternationalP
aper
InternationalP
aper
(UK)Ltd.Inverurie
SC4
uncoated
woodfree
-225
2009:1
shut-dow
nW.E
urope
UnitedKingdom
DSSm
ithSt.R
egisPaperCom
pany
Ltd.
Sittingbourne
KE
6uncoated
woodfree
-230
2009:1
conversion
(-)
N.A
merica
UnitedStates
Boise
Inc.
St.H
elens
OR
1uncoated
woodfree
-60
2009:1
shut-dow
nN.A
merica
UnitedStates
Boise
Inc.
St.H
elens
OR
4uncoated
woodfree
-95
2009:1
shut-dow
nN.A
merica
UnitedStates
Dom
tar
Dom
tarPaperCo.,L
LC
Plym
outh
NC
5uncoated
woodfree
-255
2009:1
shut-dow
nN.A
merica
UnitedStates
New
Page
Rum
ford
PaperCo.
Rum
ford
ME
15uncoated
woodfree
902009:1
conversion
(+)
L.A
merica
Brazil
InternationalP
aper
InternationalP
aper
doBrasil
Ltda.
TresLagoas
MS
1uncoated
woodfree
200
2009:1
newPM
China
China
Shandong
Tralin
Shandong
Tralin
PaperCo.
Ltd.
Gaotang
County,
Liaocheng
SD2
uncoated
woodfree
150
2009:1
second
hand
PMJapan
Japan
Tokushu
Tokai
Holdings
MeijiSeishi
PaperCo.,L
td.
FujiCity
SZ5
uncoated
woodfree
-30
2009:1
shut-dow
n
Japan
Japan
NipponPaper
Group
NipponDaishow
aPaperboard
Yoshinaga
Co.,
Ltd.
FujiCity
SZ1
uncoated
woodfree
-70
2009:1
shut-dow
n
Japan
Japan
Oji
OjiSp
ecialty
PaperCo.,L
td.
Ebetsu
HO
3uncoated
woodfree
-20
2009:1
shut-dow
nFarEast
India
BindalP
apersLtd
Muzaffanagar
UP
1uncoated
woodfree
902009:1
newPM
FarEast
India
Saber
SaberPaperLim
ited
..HP
1uncoated
woodfree
702009:1
newPM
FarEast
India
SubburajPapersPrivateLtd.
Tirunelveli
TN
1uncoated
woodfree
115
2009:1
second
hand
PMAfrica
Mozam
bique
Fabricade
Papele
Cartao
Ltd.(Fapel/F
apacar)
Maputo
3uncoated
woodfree
-52009:1
shut-dow
n
-146
— A-111 —

Unco
ated
Woo
dfree
Pap
erCap
acityChan
ges(C
ont’d)
Region
Cou
ntry
Group
Com
pany
Mill
Location
State
PM
Grade
Cap
acity
chan
ge1000
tStart-up
Year:
qtr
Description
Com
pleted
W.E
urope
Belgium
Interm
illsBelgium
Malmedy
10uncoated
WFspecialties
-35
2009:2
shut-dow
nW.E
urope
Belgium
Interm
illsBelgium
Malmedy
10uncoated
woodfreeboard
-52009:2
shut-dow
nW.E
urope
France
Arjow
iggins
Arjow
iggins
Dessinet
PapiersFins
S.A.
Annonay
AR
5uncoated
WFspecialties
-72009:2
shut-dow
n
W.E
urope
Germany
SmurfitK
appa
Papierfabrik
Hainsberg
GmbH
Freital
SC2
uncoated
woodfree
52009:2
rebuild
W.E
urope
Germany
SteinbeisPapier
Glückstadt
GmbH
&Co.
KG
Glückstadt
SH4
uncoated
woodfree
152009:2
rebuild
W.E
urope
Spain
Papelera
deAmaroz,S
.A.
Tolosa
GZ
2uncoated
woodfree
-24
2009:2
shut-dow
nW.E
urope
Spain
Papelera
deAmaroz,S
.A.
Tolosa
GZ
4uncoated
woodfree
-24
2009:2
shut-dow
nW.E
urope
UnitedKingdom
Arjow
iggins
Arjow
iggins
Carbonless
PapersLtd.
Dartford
KE
6lw
uncoated
woodfree
-10
2009:2
shut-dow
n
E.E
urope
Slovenia
Prinzhorn
PapirnicaVevce
d.d.
Ljubljana-
Dobrunje
4uncoated
woodfree
-20
2009:2
shut-dow
n
N.A
merica
UnitedStates
InternationalP
aper
InternationalP
aper
Co.
Franklin
VA
6uncoated
woodfree
-202
2009:2
shut-dow
nN.A
merica
UnitedStates
NeenahPaper
NeenahPaper,Inc.
Ripon
CA
1uncoated
WFspecialties
-20
2009:2
shut-dow
nN.A
merica
UnitedStates
NeenahPaper
NeenahPaper,Inc.
Ripon
CA
1uncoated
woodfreeboard
-10
2009:2
shut-dow
nN.A
merica
UnitedStates
SmartP
apersL.L.C.
Ham
ilton
OH
2uncoated
WFspecialties
-18
2009:2
shut-dow
nN.A
merica
UnitedStates
SmartP
apersL.L.C.
Ham
ilton
OH
3uncoated
WFspecialties
-52009:2
shut-dow
nL.A
merica
Argentin
aMassuh
Papelera
Quilm
esQuilm
esBA
9uncoated
woodfree
752009:2
restartP
MFarEast
India
Ballarpur
Industries
-BILT
BILTGraphicPaper
ProductsLtd.
Ballarshah
MA
7uncoated
woodfree
165
2009:2
newPM
FarEast
India
Hindustan
Paper
Hindustan
PaperCorporatio
nLim
ited
Cachar
AM
2uncoated
woodfree
-50
2009:2
shut-dow
n
-170
W.E
urope
Portugal
PortucelSo
porcel
Portucel-EmpresaProdutora
dePastaePapelS
.A.
Setubal
2uncoated
woodfree
-25
2009:3
shut-dow
n
W.E
urope
Portugal
PortucelSo
porcel
Portucel-EmpresaProdutora
dePastaePapelS
.A.
Setubal
4uncoated
woodfree
500
2009:3
newPM
W.E
urope
Spain
Papelera
deAmaroz,S
.A.
Legorreta
GZ
5uncoated
woodfree
302009:3
restartP
MW.E
urope
Spain
Papelera
deAmaroz,S
.A.
Legorreta
GZ
6uncoated
woodfree
602009:3
restartP
MN.A
merica
UnitedStates
InternationalP
aper
InternationalP
aper
Co.
Franklin
VA
1uncoated
WFspecialties
-24
2009:3
shut-dow
nChina
China
China
Metallurgical
MCCPaperYinhe
Co.,L
td.
Linqing
SD2
uncoated
woodfree
200
2009:3
newPM
China
China
Tiger
Forest&
Paper
Yueyang
PaperCo.,L
tdYueyang
City
HU
10uncoated
woodfree
200
2009:3
newPM
Japan
Japan
HokuetsuKishu
Group
HokuetsuKishu
PaperCo.,
Ltd.
IchikawaCity
2uncoated
woodfree
-20
2009:3
shut-dow
n
— A-112 —

Unco
ated
Woo
dfree
Pap
erCap
acityChan
ges(C
ont’d)
Region
Cou
ntry
Group
Com
pany
Mill
Location
State
PM
Grade
Cap
acity
chan
ge1000
tStart-up
Year:
qtr
Description
Com
pleted
Japan
Japan
HokuetsuKishu
Group
HokuetsuKishu
PaperCo.,
Ltd.
Nagaoka
City
NA
5uncoated
woodfree
-62009:3
shut-dow
n
Japan
Japan
NipponPaper
Group
NipponPaperIndustries
Co.,
Ltd.
FujiCity
SZ14
lwuncoated
woodfree
-52009:3
shut-dow
n
Japan
Japan
NipponPaper
Group
NipponPaperIndustries
Co.,
Ltd.
IshinomakiC
ityMI
2uncoated
woodfree
-25
2009:3
shut-dow
n
Japan
Japan
NipponPaper
Group
NipponPaperIndustries
Co.,
Ltd.
IshinomakiC
ityMI
4uncoated
woodfree
-50
2009:3
shut-dow
n
Japan
Japan
NipponPaper
Group
NipponPaperIndustries
Co.,
Ltd.
Nakoso
FA7
uncoated
WFspecialties
-35
2009:3
shut-dow
n
FarEast
India
ABCPaper
Sailakhurd
PB4
uncoated
woodfree
105
2009:3
second
hand
PMAfrica
Egypt
CartaMisr
6thof
October
City
,nearCairo
3uncoated
woodfree
502009:3
second
hand
PMAfrica
Ethiopia
Anm
olProductsEthiopia
PLC
Ginchi
1uncoated
woodfree
152009:3
second
hand
PMAfrica
SouthAfrica,
Rep.o
fSo
uthAfrican
PaperMills
(Pty)Ltd.
Durban
3uncoated
woodfree
92009:3
second
hand
PM979
W.E
urope
Germany
UPM
NordlandPapier
GmbH
Dörpen
NS
2uncoated
woodfree
125
2009:4
restartP
MW.E
urope
Germany
Papierfabrik
Louisenthal
GmbH
Königstein
SC2
uncoated
WFspecialties
-22009:4
shut-dow
n
W.E
urope
Germany
Papierfabrik
Louisenthal
GmbH
Königstein
SC4
uncoated
WFspecialties
112009:4
newPM
L.A
merica
Brazil
Ahlstrom
Ahlstrom
Industriade
Papeis
EspeciaisS.A.
Jacarei
SP1
uncoated
woodfree
-37
2009:4
gradechange
China
China
FujianNanping
Group
FujianNanping
PaperCo.,
Ltd.
Nanping
City
FU6
uncoated
woodfree
250
2009:4
newPM
China
China
Shandong
Chenm
ing
Wuhan
Chenm
ingHanyang
PaperCo.,L
td.
Wuhan
City
HB
1uncoated
woodfree
152009:4
gradechange
China
China
Tiger
Forest&
Paper
Yueyang
PaperCo.,L
tdYueyang
City
HU
9uncoated
woodfree
200
2009:4
newPM
Japan
Japan
Kishu
PaperCo.,L
td.
Suita
City
3uncoated
woodfree
-11
2009:4
shut-dow
nFarEast
India
Hindustan
Paper
Hindustan
New
sprint
Ltd.
Kottayam
KE
2uncoated
woodfree
302009:4
newPM
FarEast
India
KRPu
lp&
PapersLtd.
Shahjahanpur
UP
2uncoated
woodfree
702009:4
newPM
FarEast
India
MBDGroup
Gagrettow
nHP
1uncoated
woodfree
442009:4
newPM
FarEast
India
Ram
aPaperMillsLtd.
Kiratpur
UP
4uncoated
woodfree
172009:4
second
hand
PM
— A-113 —

Unco
ated
Woo
dfree
Pap
erCap
acityChan
ges(C
ont’d)
Region
Cou
ntry
Group
Com
pany
Mill
Location
State
PM
Grade
Cap
acity
chan
ge1000
tStart-up
Year:
qtr
Description
Com
pleted
Africa
SouthAfrica,
Rep.o
fMondi
Mondi
Merebank
Merebank,Durban
KN
32uncoated
woodfree
-96
2009:4
shut-dow
n
616
W.E
urope
Italy
Cartiera
SantaLida
Germagnano
TO
3uncoated
woodfree
-35
2009:..
tempshut
(restarted
2010)
W.E
urope
Spain
Bestpapel
Papelera
deBesayaS.A.
Torrelavega
CB
1uncoated
woodfree
-80
2009:..
tempshut
(restarted
2010)
E.E
urope
Czech
Republic
OlsanskePapirnya.s.
Aloisov
1uncoated
woodfree
-42009:..
tempshut
(restarted
2010)
E.E
urope
Russia
Nem
anPu
lpandPaperMill
Nem
anKGD
9uncoated
woodfree
102009:..
gradechange
E.E
urope
Ukraine
Kolom
iyaPaperMill
Kolom
yja
IF2
uncoated
woodfree
-72009:..
shut-dow
nFarEast
India
Tam
ilNaduNew
sprint
&PapersLtd.
Kagith
apuram
TN
1uncoated
woodfree
52009:..
rebuild
Africa
Kenya
GP-CKBirla
Panafrican
PaperMills(EA)
Ltd.
Webuye
2uncoated
woodfree
-20
2009:..
tempshut
(restarted
2010)
Africa
Kenya
GP-CKBirla
Panafrican
PaperMills(EA)
Ltd.
Webuye
3uncoated
woodfree
-30
2009:..
tempshut
(restarted
2010)
-161
Nordic
Finland
StoraEnso
StoraEnsoOyj
Imatra
8uncoated
woodfree
-215
2010:1
shut-dow
nW.E
urope
France
VertarisS.A.S.
Voreppe
IE5
uncoated
woodfree
352010:1
restartP
MW.E
urope
France
VertarisS.A.S.
Voreppe
IE6
uncoated
woodfree
402010:1
restartP
MW.E
urope
Germany
Felix
Schoeller
Felix
SchoellerJrFo
to-und
Spezialpapiere
Osnabrück
NS
1uncoated
WFspecialties
-100
2010:1
conversion
(-)
W.E
urope
Italy
Burgo
Burgo
Group
S.p.A.
Tolmezzo
UD
2uncoated
woodfree
-30
2010:1
shut-dow
nChina
China
FujianNanping
Group
FujianNanping
PaperCo.,
Ltd.
Nanping
FU3
uncoated
woodfree
502010:1
conversion
(+)
China
China
FujianNanping
Group
FujianNanping
PaperCo.,
Ltd.
Nanping
FU4
uncoated
woodfree
502010:1
conversion
(+)
FarEast
India
AgioPaper&
Industries
Bilaspur
CT
2uncoated
woodfree
92010:1
newPM
FarEast
India
KohinoorGroup
KohinoorPaper&
New
sprint
Kolkata
WB
1uncoated
woodfree
252010:1
newPM
FarEast
India
Maa
ChandiP
apers
Durgapur
WB
2uncoated
woodfree
32010:1
newPM
FarEast
India
Servall
Engineering
ServalakshmiP
aper
&Boards
Tirunelveli
TN
1uncoated
woodfree
105
2010:1
second
hand
PM
— A-114 —
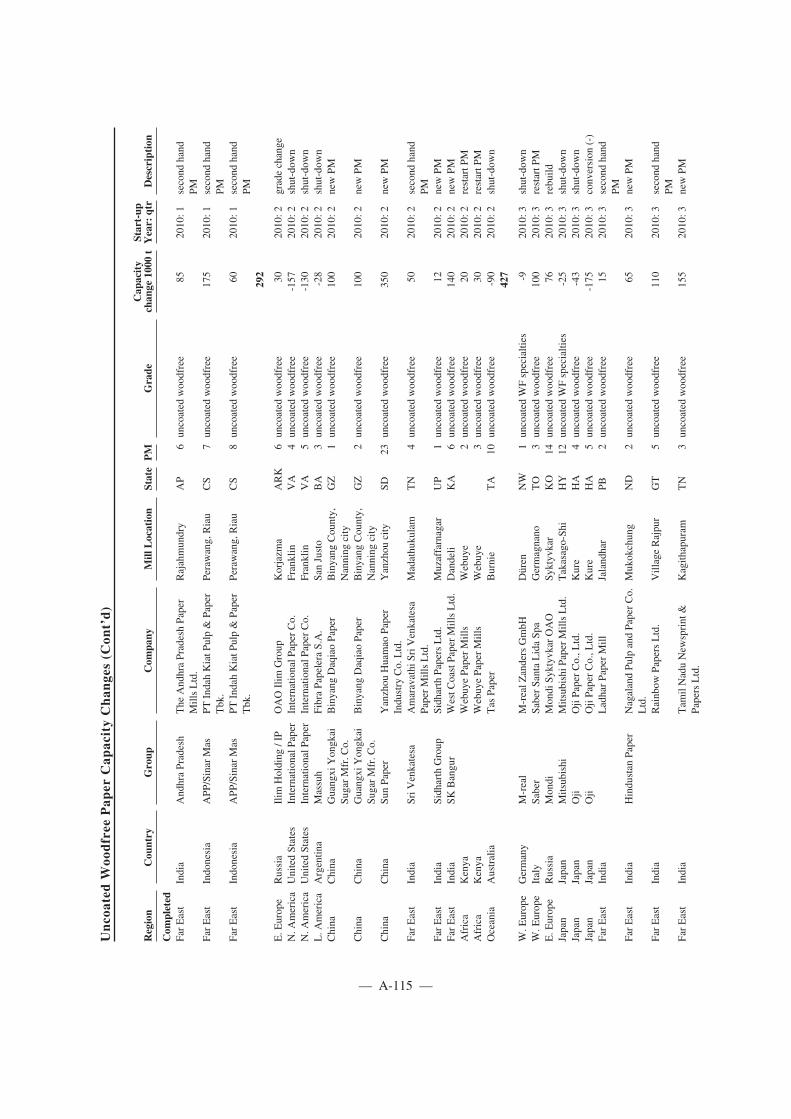
Unco
ated
Woo
dfree
Pap
erCap
acityChan
ges(C
ont’d)
Region
Cou
ntry
Group
Com
pany
Mill
Location
State
PM
Grade
Cap
acity
chan
ge1000
tStart-up
Year:
qtr
Description
Com
pleted
FarEast
India
AndhraPradesh
The
AndhraPradeshPaper
MillsLtd.
Rajahmundry
AP
6uncoated
woodfree
852010:1
second
hand
PMFarEast
Indonesia
APP
/Sinar
Mas
PTIndahKiatP
ulp&
Paper
Tbk.
Perawang,
Riau
CS
7uncoated
woodfree
175
2010:1
second
hand
PMFarEast
Indonesia
APP
/Sinar
Mas
PTIndahKiatP
ulp&
Paper
Tbk.
Perawang,
Riau
CS
8uncoated
woodfree
602010:1
second
hand
PM292
E.E
urope
Russia
Ilim
Holding
/IP
OAOIlim
Group
Korjazm
aARK
6uncoated
woodfree
302010:2
gradechange
N.A
merica
UnitedStates
InternationalP
aper
InternationalP
aper
Co.
Franklin
VA
4uncoated
woodfree
-157
2010:2
shut-dow
nN.A
merica
UnitedStates
InternationalP
aper
InternationalP
aper
Co.
Franklin
VA
5uncoated
woodfree
-130
2010:2
shut-dow
nL.A
merica
Argentin
aMassuh
FibraPapelera
S.A.
SanJusto
BA
3uncoated
woodfree
-28
2010:2
shut-dow
nChina
China
Guangxi
Yongkai
SugarMfr.C
o.Binyang
DaqiaoPaper
Binyang
County,
Nanning
city
GZ
1uncoated
woodfree
100
2010:2
newPM
China
China
Guangxi
Yongkai
SugarMfr.C
o.Binyang
DaqiaoPaper
Binyang
County,
Nanning
city
GZ
2uncoated
woodfree
100
2010:2
newPM
China
China
SunPaper
Yanzhou
Huamao
Paper
Industry
Co.
Ltd.
Yanzhou
city
SD23
uncoated
woodfree
350
2010:2
newPM
FarEast
India
SriV
enkatesa
Amaravathi
SriV
enkatesa
PaperMillsLtd.
Madathukulam
TN
4uncoated
woodfree
502010:2
second
hand
PMFarEast
India
Sidharth
Group
Sidharth
PapersLtd.
Muzaffarnagar
UP
1uncoated
woodfree
122010:2
newPM
FarEast
India
SKBangur
WestC
oastPaperMillsLtd.
Dandeli
KA
6uncoated
woodfree
140
2010:2
newPM
Africa
Kenya
WebuyePaperMills
Webuye
2uncoated
woodfree
202010:2
restartP
MAfrica
Kenya
WebuyePaperMills
Webuye
3uncoated
woodfree
302010:2
restartP
MOceania
Australia
Tas
Paper
Burnie
TA
10uncoated
woodfree
-90
2010:2
shut-dow
n427
W.E
urope
Germany
M-real
M-realZ
andersGmbH
Düren
NW
1uncoated
WFspecialties
-92010:3
shut-dow
nW.E
urope
Italy
Saber
SaberSantaLidaSp
aGermagnano
TO
3uncoated
woodfree
100
2010:3
restartP
ME.E
urope
Russia
Mondi
Mondi
SyktyvkarOAO
Syktyvkar
KO
14uncoated
woodfree
762010:3
rebuild
Japan
Japan
Mitsubishi
Mitsubishi
PaperMillsLtd.
Takasago-Sh
iHY
12uncoated
WFspecialties
-25
2010:3
shut-dow
nJapan
Japan
Oji
OjiPaperCo.,L
td.
Kure
HA
4uncoated
woodfree
-43
2010:3
shut-dow
nJapan
Japan
Oji
OjiPaperCo.,L
td.
Kure
HA
5uncoated
woodfree
-175
2010:3
conversion
(-)
FarEast
India
LadharPaperMill
Jalandhar
PB2
uncoated
woodfree
152010:3
second
hand
PMFarEast
India
Hindustan
Paper
NagalandPu
lpandPaperCo.
Ltd.
Mukokchung
ND
2uncoated
woodfree
652010:3
newPM
FarEast
India
Rainbow
PapersLtd.
VillageRajpur
GT
5uncoated
woodfree
110
2010:3
second
hand
PMFarEast
India
Tam
ilNaduNew
sprint
&PapersLtd.
Kagith
apuram
TN
3uncoated
woodfree
155
2010:3
newPM
— A-115 —

Unco
ated
Woo
dfree
Pap
erCap
acityChan
ges(C
ont’d)
Region
Cou
ntry
Group
Com
pany
Mill
Location
StatePM
Grade
Cap
acity
chan
ge1000
tStart-up
Year:
qtr
Description
Com
pleted
Africa
SouthAfrica,
Rep.o
fMondi
Mondi
Merebank
Merebank,Durban
KN
33uncoated
woodfree
-170
2010:3
shut-dow
n
99
W.E
urope
Germany
Drewsen
DrewsenSp
ezialpapiere
GmbH
&Co.
KG
Lachendorf
NS
5uncoated
WFspecialties
52010:4
rebuild
W.E
urope
Spain
Nueva
Papelera
deBesaya
S.A.
Torrelavega
CB
1uncoated
woodfree
802010:4
restartP
M
E.E
urope
Czech
Republic
Melecky
a.s.
Aloisov
1uncoated
woodfree
42010:4
restartP
ME.E
urope
Latvia
Papirfabrika
Ligatne
SIA
Ligatne
1uncoated
woodfreeboard
22010:4
rebuild
E.E
urope
Slovenia
RadecePapird.d.
Radece
6uncoated
WFspecialties
82010:4
newPM
N.A
merica
UnitedStates
Dom
tar
Dom
tarPaperCo.,L
LC
Plym
outh
NC
4uncoated
woodfree
-181
2010:4
shut-dow
nN.A
merica
UnitedStates
Fraser
Papers
Fraser
PapersInc.
Gorham
NH
1uncoated
woodfree
-42
2010:4
shut-dow
nN.A
merica
UnitedStates
Fraser
Papers
Fraser
PapersInc.
Gorham
NH
4uncoated
woodfree
-21
2010:4
shut-dow
nN.A
merica
UnitedStates
New
tonFalls
Fine
Paper
New
tonFalls
NY
4uncoated
woodfree
-73
2010:4
shut-dow
nChina
China
Guangxi
HuachengPaper
LaibinCity
GZ
1uncoated
woodfree
602010:4
newPM
China
China
Guangxi
HuachengPaper
LaibinCity
GZ
2uncoated
woodfree
602010:4
newPM
China
China
Guangxi
HuachengPaper
LaibinCity
GZ
3uncoated
woodfree
602010:4
newPM
China
China
Guangxi
HuachengPaper
LaibinCity
GZ
4uncoated
woodfree
602010:4
newPM
FarEast
Vietnam
BaiBangJointS
tock
Com
pany
KySo
nHO
1uncoated
woodfree
502010:4
second
hand
PM72
China
China
FujianNanping
Group
FujianNanping
PaperCo.,
Ltd.
Nanping
City
FU6uncoated
woodfree
-250
2010:..
gradechange
Decided
W.E
urope
Italy
Burgo
Burgo
Group
S.p.A.
Toscolano
BS
11uncoated
woodfree
-55
2011:1
shut-dow
nW.E
urope
Switzerland
Fortress
Group
LandqartA
GLandquart
1uncoated
WFspecialties
42011:1
rebuild
N.A
merica
UnitedStates
WausauPaperCorp.
Brainerd
MN
6uncoated
woodfree
-93
2011:1
conversion
(-)
China
China
Guangxi
Yongkai
SugarMfr.C
o.Guangxi
YongkaiSu
garand
Paper
Nanning
GZ
1uncoated
woodfree
200
2011:1
second
hand
PMChina
China
Minfeng
Minfeng
SpecialP
aper
Co.,
Ltd.
Jiaxing
ZH
20lw
uncoated
woodfree
32011:1
rebuild
China
China
NineDragons
NineDragons
Paper
Industries
(Taicang)Co.,L
td.Taicang
City
JG21
uncoated
woodfree
200
2011:1
conversion
(+)
China
China
Huatai
Shandong
HuataiP
aper
Co.,
Ltd.
Dongyin
City
SD8uncoated
woodfree
150
2011:1
newPM
China
China
YilinPaperCo.,L
tdXuchang
HE
6uncoated
woodfree
952011:1
newPM
China
China
Shandong
Chenm
ing
Zhanjiang
Chenm
ingPu
lp&
PaperCo.,L
td.
Zhanjiang
GD
1uncoated
woodfree
450
2011:1
newPM
954
— A-116 —

Unco
ated
Woo
dfree
Pap
erCap
acityChan
ges(C
ont’d)
Region
Cou
ntry
Group
Com
pany
Mill
Location
State
PM
Grade
Cap
acity
chan
ge1000
tStart-up
Year:
qtr
Description
Decided
China
China
Huatai
Anhui
HuataiF
orestP
ulp&
PaperCo.,L
td.
AnqingCity
AN
1uncoated
woodfree
130
2011:2
second
hand
PMChina
China
NineDragons
DongguanNineDragons
PaperIndustries
Co.,L
td.
DongguanCity
GD
28uncoated
woodfree
250
2011:2
newPM
China
China
Henan
Investment
Group
Zhumadianshi
BaiyunPaper
Co.,L
td.
ZhumadianCity
HE
8uncoated
woodfree
250
2011:2
newPM
FarEast
Korea,R
epublic
ofMoorim
Moorim
Pulp
&PaperCo
Ltd
Ulsan,K
yungnam
1uncoated
woodfree
220
2011:2
newPM
850
China
China
RGE/APR
ILAPR
ILFine
Paper
(Guangdong)
XinhuiD
istrict,
Jiangm
enGD
11uncoated
woodfree
450
2011:4
newPM
FarEast
Indonesia
APP
/Sinar
Mas
PTIndahKiatP
ulp&
Paper
Tbk.
Perawang,
Riau
CS
6uncoated
woodfree
200
2011:4
second
hand
PM650
FarEast
India
WhitefieldPaperMills
Tadipudi,West
Godavarid
ist.
AP
1uncoated
woodfree
210
2012:2
newPM
FarEast
Thailand
DoubleAGroup
DoubleA(1991)
Public
Com
pany
Lim
ited
Tha
Toom,
Prachinburi
3uncoated
woodfree
290
2012:2
newPM
500
FarEast
India
JKPaperLtd.
Jaykaypur
OA
6uncoated
woodfree
150
2012:4
newPM
FarEast
India
PurviB
haratP
aper
Choudwar
OA
1uncoated
woodfree
222012:4
newPM
172
Plann
edN.A
merica
UnitedStates
New
tonFalls
Fine
Paper
New
tonFalls
NY
4uncoated
woodfree
732011:2
restart
E.E
urope
Russia
Nem
anPu
lpandPaperMill
Nem
anKGD
10uncoated
woodfree
502011:9
newPM
China
China
Henan
Investment
Group
Henan
JiaozuoRuifeng
PaperCoLtd
Jiaozuo
HE
1uncoated
woodfree
300
2011:..
newPM
FarEast
India
ABCPaper
..1
uncoated
woodfree
100
2011:..
newPM
FarEast
India
SKBangur
Ram
aNew
sprint
&Papers
Ltd.
Magdalla
Port
GT
3uncoated
woodfree
602011:..
newPM
FarEast
India
Spaa
StrawBoard
Group
ShriJagannathPaperMills
..OA
1uncoated
woodfree
252011:..
second
hand
PMFarEast
Malaysia
Ballarpur
Industries
-BILT
SabahFo
restIndustries
Sdn.
Bhd.
Sipitang
SH1
uncoated
woodfree
252011:..
capacity
expansion
FarEast
Malaysia
Ballarpur
Industries
-BILT
SabahFo
restIndustries
Sdn.
Bhd.
Sipitang
SH2
uncoated
woodfree
252011:..
capacity
expansion
Africa
Tanzania
Mufindi
PaperMillsLtd.
Mgololo,M
ufindi
2uncoated
woodfree
302011:..
restart
FarEast
Vietnam
Vinapaco
Thanh
Hoa
PaperMill
Hau
Loc
District,
Thanh
Hoa
TH
1uncoated
woodfreeboard
180
2012:1
newPM
— A-117 —

Unco
ated
Woo
dfree
Pap
erCap
acityChan
ges(C
ont’d)
Region
Cou
ntry
Group
Com
pany
Mill
Location
State
PM
Grade
Cap
acity
chan
ge1000
tStart-up
Year:
qtr
Description
Plann
edE.E
urope
Latvia
Papirfabrika
Ligatne
SIA
Ligatne
1uncoated
woodfreeboard
162012:3
rebuild
FarEast
India
JKPaperLtd.
Jaykaypur
OA
2uncoated
woodfree
-72012:4
shut-dow
nFarEast
India
JKPaperLtd.
Jaykaypur
OA
4uncoated
woodfree
-16
2012:4
shut-dow
nFarEast
India
JKPaperLtd.
Jaykaypur
OA
5uncoated
woodfree
-27
2012:4
shut-dow
nFarEast
India
KohinoorGroup
M/sKohinoorPu
lp&
Paper
Pvt.Ltd
IndustrialGrowth
CentreatMatia
AM
1uncoated
woodfree
200
2012:4
newPM
W.E
urope
France
Exacompta
Clairefontaine
Papeteriede
MandeureS.A.
Mandeure
DS
3uncoated
WFspecialties
252012:..
newPM
E.E
urope
Russia
Ilim
Holding
/IP
OAOIlim
Group
Korjazm
aARK
7uncoated
woodfree
200
2012:..
newPM
L.A
merica
Cuba
Jatip
apJatib
onico,Santi
Spiritu
s1
uncoated
woodfree
352012:..
newPM
China
China
Guizhou
Chitianhua
Paper
IndustrialCo.,L
tdChishui
City
GU
1uncoated
woodfree
155
2012:..
newPM
China
China
Henan
Yinge
Group
Luohe
Yinge
Specialty
Paper
Luohe
HE
3uncoated
woodfree
200
2012:..
newPM
FarEast
Bangladesh
CreativePaperMills
..1
uncoated
woodfree
212012:..
newPM
FarEast
India
BengalP
aper
MillsCo.,L
td.
Raniganj
WB
3uncoated
woodfree
52012:..
restart
FarEast
India
Ballarpur
Industries
-BILT
BILTGraphicPaper
ProductsLim
ited
Ballarpur
MA
7uncoated
woodfree
40..
rebuild
;speed-
upFarEast
India
BengalP
aper
MillsCo.,L
td.
Raniganj
WB
6uncoated
woodfree
302012:..
restart
FarEast
India
Emam
iPaper
MillsLtd.
near
Kultik
iri
WB
1uncoated
woodfree
200
2012:..
newPM
FarEast
India
SikkaPapers(P)Ltd.
Him
alayan
mountains
1uncoated
woodfree
302012:..
newPM
FarEast
India
Hindustan
Paper
Hindustan
PaperCorporatio
nLim
ited
Kajag
Nagar
AM
1uncoated
woodfree
502012:..
capacity
expansion
FarEast
India
Hindustan
Paper
Hindustan
PaperCorporatio
nLim
ited
Kajag
Nagar
AM
2uncoated
woodfree
852012:..
capacity
expansion
FarEast
India
Hindustan
Paper
Jagdishpur
PaperMill
Sultanpur
City
UP
1uncoated
woodfree
300
2012:..
newPM
FarEast
Kazakhstan
Ilisky
Paper-Board
Plant
Boralday
3uncoated
woodfree
702012:..
second
hand
PME.E
urope
Russia
StoraEnso
StoraEnsoRussia
..,NizhniN
ovgorodNIZ
1uncoated
woodfree
550
2014
-newPM
L.A
merica
Brazil
InternationalP
aper
InternationalP
aper
doBrasil
Ltda.
TresLagoas
MS
2uncoated
woodfree
200
2014
-newPM
L.A
merica
Peru
IndustrialPapelera
Atlas
S.A.
Chosica,L
ima
4uncoated
woodfree
302014
-newPM
China
China
APP
/Sinar
Mas
GoldEastP
aper
(Jiangsu)
Co.,L
td.
Zhenjiang
City
JG5
uncoated
woodfree
300
2014
-newPM
China
China
APP
/Sinar
Mas
GoldEastP
aper
(Jiangsu)
Co.,L
td.
Zhenjiang
City
JG6
uncoated
woodfree
300
2014
-newPM
— A-118 —

Unco
ated
Woo
dfree
Pap
erCap
acityChan
ges(C
ont’d)
Region
Cou
ntry
Group
Com
pany
Mill
Location
State
PM
Grade
Cap
acity
chan
ge1000
tStart-up
Year:
qtr
Description
Plann
edChina
China
APP
/Sinar
Mas
GoldEastP
aper
(Jiangsu)
Co.,L
td.
Zhenjiang
City
JG7
uncoated
woodfree
300
2014
-newPM
China
China
APP
/Sinar
Mas
GoldEastP
aper
(Jiangsu)
Co.,L
td.
Zhenjiang
City
JG8
uncoated
woodfree
300
2014
-newPM
China
China
Guangxi
JindaxingPaper
Co.,L
td.
Nanning
City
GZ
99uncoated
woodfree
1000
2014
-newPM
China
China
Guangxi
Yongkai
SugarMfr.C
o.Guangxi
YongkaiSu
garand
Paper
Cencicity
GZ
1uncoated
woodfree
350
2014
-newPM
China
China
Nanning
PhoenixPu
lp&
PaperCo.
Ltd.
Nanning
City
GZ
3uncoated
woodfree
602014
-newPM
China
China
APP
/Sinar
Mas
SichuanJinanPu
lp&
Paper
YaanCity
SI2
uncoated
woodfree
150
2014
-newPM
China
China
Shandong
Chenm
ing
Wuhan
Chenm
ingHanyang
PaperCo.,L
td.
Wuhan
Economic&
TechnologyDev’t
Zone
HB
11uncoated
woodfree
300
2014
-newPM
China
China
APP
/Sinar
Mas
Zhenjiang
GoldRiver
Pulp
&PaperCo.
Ltd.
Zhenjiang
JG13
uncoated
woodfree
180
2014
-newPM
FarEast
India
BVRPaperIndustries
(India)
PVT.L
TD.
Kukatpally
AP
1uncoated
woodfree
352014
-second
hand
PMFarEast
India
Century
Pulp
&Paper
Bharuch
GT
7uncoated
woodfree
175
2014
-newPM
FarEast
India
Servall
Engineering
DanalakshmiP
aper
Mills(P)
Ltd.
Vilampatti
TN
3uncoated
woodfree
152014
-second
hand
PMFarEast
India
Hindustan
Paper
MandyaNationalP
aper
Mills
Lim
ited
Belagula
KA
1uncoated
woodfree
352014
-restart
FarEast
India
Star
PaperMills,Ltd.
Saharanpur
UP
5uncoated
woodfree
702014
-newPM
FarEast
Vietnam
Vinapaco
DongNaiPaperJoint-Stock
Com
pany
(Codigo)
BienHoa
City
,DongNai
DN
4uncoated
woodfree
302014
-second
hand
PM6860
— A-119 —

Coa
tedW
oodfree
Pap
erCap
acityChan
ges
Region
Cou
ntry
Group
Com
pany
Mill
Location
State
PM
Grade
Cap
acity
chan
ge1000
tStart-up
Year:
qtr
Description
Com
pleted
Nordic
Sweden
Arctic
Paper
Arctic
PaperHåfreströmsAB
Åsensbruk
2coated
woodfree
-50
2009:1
shut-dow
nNordic
Sweden
Arctic
Paper
Arctic
PaperHåfreströmsAB
Åsensbruk
6coated
woodfree
-110
2009:1
shut-dow
nW.E
urope
Germany
M-real
M-realZ
andersGmbH
BergischGladbach
NW
2coated
woodfree
-80
2009:1
gradechange
W.E
urope
Germany
M-real
M-realZ
andersGmbH
BergischGladbach
NW
2coated
woodfree
specialties
402009:1
gradechange
W.E
urope
Germany
M-real
M-realZ
andersGmbH
BergischGladbach
NW
2one-side
coated
woodfree
402009:1
gradechange
W.E
urope
Germany
M-real
M-realZ
andersGmbH
BergischGladbach
NW
3castcoated
woodfree
-30
2009:1
gradechange
W.E
urope
Germany
M-real
M-realZ
andersGmbH
BergischGladbach
NW
3coated
woodfree
-204
2009:1
gradechange
W.E
urope
Spain
AcondaPaperS.A.
Flaca
GA
3coated
woodfree
-15
2009:1
shut-dow
nW.E
urope
Spain
AcondaPaperS.A.
Flaca
GA
4coated
woodfree
-35
2009:1
shut-dow
nW.E
urope
Spain
AcondaPaperS.A.
Flaca
GA
4one-side
coated
woodfree
-25
2009:1
shut-dow
n
W.E
urope
Spain
Lecta
TorraspapelS.A.
Algeciras
CZ
1one-side
coated
woodfree
-41
2009:1
shut-dow
n
W.E
urope
Spain
Lecta
TorraspapelS.A.
Motril
GE
1coated
woodfree
-40
2009:1
gradechange
W.E
urope
Spain
Lecta
TorraspapelS.A.
Motril
GE
1one-side
coated
woodfree
402009:1
gradechange
W.E
urope
Spain
Lecta
TorraspapelS.A.
Sarriade
Ter
GA
4coated
woodfree
-110
2009:1
shut-dow
nN.A
merica
United
States
New
Page
Rum
ford
PaperCo.
Rum
ford
ME
12coated
woodfree
802009:1
gradechange
N.A
merica
United
States
New
Page
Rum
ford
PaperCo.
Rum
ford
ME
15coated
woodfree
165
2009:1
conversion
(+)
-375
W.E
urope
Austria
M-real
M-realH
allein
AG
Hallein
3coated
woodfree
-155
2009:2
shut-dow
nW.E
urope
Austria
M-real
M-realH
allein
AG
Hallein
4coated
woodfree
-160
2009:2
shut-dow
nW.E
urope
Belgium
Interm
illsBelgium
Malmedy
1one-side
coated
woodfree
-55
2009:2
shut-dow
n
W.E
urope
Germany
Mitsubishi
Mitsubishi
HiTec
PaperBielefeld
GmbH
Bielefeld
NW
1castcoated
woodfree
-20
2009:2
shut-dow
n
N.A
merica
United
States
SmartP
apersL.L.C.
Ham
ilton
OH
3castcoated
woodfree
-15
2009:2
shut-dow
n
FarEast
India
Hindustan
Paper
Hindustan
PaperCorporatio
nLim
ited
Cachar
AM
1coated
woodfree
-50
2009:2
shut-dow
n
-455
N.A
merica
United
States
InternationalP
aper
InternationalP
aper
Co.
Franklin
VA
1coated
woodfreeboard
-105
2009:3
shut-dow
n
N.A
merica
United
States
Sappi
SappiF
inePaperN.A
merica
Muskegon
MI
5coated
woodfree
-172
2009:3
shut-dow
n
— A-120 —

Coa
tedW
oodfree
Pap
erCap
acityChan
ges(C
ont’d)
Region
Cou
ntry
Group
Com
pany
Mill
Location
State
PM
Grade
Cap
acity
chan
ge1000
tStart-up
Year:
qtr
Description
Com
pleted
Japan
Japan
NipponPaperGroup
NipponDaishow
aPaperboard
Co.,
Ltd.
Otake
City
HA
6coated
woodfree
-80
2009:3
shut-dow
n
Japan
Japan
NipponPaperGroup
NipponPaperIndustries
Co.,L
td.
Iwakuni-Sh
iYI
5castcoated
woodfree
-20
2009:3
shut-dow
nJapan
Japan
NipponPaperGroup
NipponPaperIndustries
Co.,L
td.
Iwakuni-Sh
iYI
5coated
woodfree
-70
2009:3
shut-dow
nJapan
Japan
NipponPaperGroup
NipponPaperIndustries
Co.,L
td.
Tom
akom
aiHO
1coated
woodfree
-65
2009:3
shut-dow
n-512
W.E
urope
Austria
Sappi
SappiA
ustriaProduktio
nsGmbH
andCo.
KG
Gratkorn
9coated
woodfree
-47
2009:4
gradechange
W.E
urope
Germany
UPM
NordlandPapier
GmbH
Dörpen
NS
2coated
woodfree
752009:4
restartP
ML.A
merica
Brazil
Ahlstrom
Ahlstrom
Industriade
Papeis
EspeciaisS.A.
Jacarei
SP1
coated
woodfree
-12009:4
gradechange
L.A
merica
Brazil
Ahlstrom
Ahlstrom
Industriade
Papeis
EspeciaisS.A.
Jacarei
SP1
one-side
coated
woodfree
382009:4
gradechange
FarEast
India
Hindustan
Paper
Hindustan
New
sprint
Ltd.
Kottayam
KE
2coated
woodfree
402009:4
newPM
105
W.E
urope
Germany
Sappi
SappiS
tockstadt
Stockstadt
BA
2coated
woodfree
-215
2009:
tempshut
(restarted
2010)
N.A
merica
United
States
New
Page
Rum
ford
PaperCo.
Rum
ford
ME
10coated
woodfree
-158
2009:
tempshut
(restarted
2010)
-373
W.E
urope
France
VertarisS.A.S.
Voreppe
IE5
coated
woodfree
352010:1
restartP
MW.E
urope
France
VertarisS.A.S.
Voreppe
IE6
coated
woodfree
402010:1
restartP
MN.A
merica
United
States
New
Page
Rum
ford
PaperCo.
Rum
ford
ME
10coated
woodfree
158
2010:1
restartP
M
Japan
Japan
Oji
OjiPaperCo.,L
td.
AnanCity
TK
10coated
woodfree
-115
2010:1
shut-dow
nOceania
Australia
Tas
Paper
Burnie
TA
4coated
woodfree
-70
2010:1
shut-dow
n48
W.E
urope
Germany
Sappi
SappiS
tockstadt
Stockstadt
BA
2coated
woodfree
230
2010:2
restartP
MChina
China
APP
/Sinar
Mas
HainanJinhaiPu
lp&
Paper
Co.
Ltd
Yangpu,
Hainan
HN
2coated
woodfree
1000
2010:2
newPM
1230
China
China
Oji
JiangsuOjiPaperCo.,L
td.
Nantong
City
JG1
coated
woodfree
400
2010:3
newPM
Nordic
Finland
M-real
M-realC
orporatio
nSimpele
1one-side
coated
woodfree
-55
2010:4
shut-dow
n
W.E
urope
France
Souche
Papers
Anould
VS
1one-side
coated
woodfree
-50
2010:4
shut-dow
n
China
China
Guangxi
JindaxingPaperCo.,L
td.
Nanning
City
GZ
1coated
woodfree
200
2010:4
second
hand
PM
— A-121 —

Coa
tedW
oodfree
Pap
erCap
acityChan
ges(C
ont’d)
Region
Cou
ntry
Group
Com
pany
Mill
Location
State
PM
Grade
Cap
acity
chan
ge1000
tStart-up
Year:
qtr
Description
Com
pleted
FarEast
Vietnam
VietT
hang
Paper&
PackingCo.,
Ltd.
HaBinhPh
uong
Zone
HA
2coated
woodfree
502010:4
second
hand
PM
145
W.E
urope
Belgium
Burgo
Burgo
ArdennesS.A.
Virton
1coated
woodfree
-10
2010:..
Decided
China
China
China
Metallurgical
MCCMeiliPaperIndustry
Co.
Ltd.ZhongweiCounty,
Wuzhong
NH
21coated
woodfree
752011:1
newPM
China
China
Huatai
Shandong
HuataiP
aper
Co.,L
td.
Dongyin
City
SD8
coated
woodfree
350
2011:1
newPM
China
China
Shandong
Chenm
ing
ShouguangMeiLun
PaperCo.,L
td.Sh
ouguang
SD2
coated
woodfree
300
2011:1
newPM
725
FarEast
Korea,
Rep.
Moorim
Moorim
Pulp
&PaperCoLtd
Ulsan,K
yungnam
1coated
woodfree
230
2011:2
newPM
FarEast
Indonesia
APP
/Sinar
Mas
PTIndahKiatP
ulp&
PaperTbk.
Perawang,
Riau
CS
6coated
woodfree
200
2011:4
second
hand
PMFarEast
Vietnam
AnHoa
PaperJointS
tock
Co.
VinhLoi,T
uyen
Quang
TQ
1coated
woodfree
140
2012:1
newPM
Plann
edN.A
merica
United
States
New
Page
EscanabaPaperCo.
Escanaba
MI
3coated
woodfree
-177
2011:2
gradechange
(-)
N.A
merica
United
States
New
Page
EscanabaPaperCo.
Escanaba
MI
3one-side
coated
woodfree
100
2011:2
gradechange
(+)
E.E
urope
Russia
Ilim
Holding
/IP
OAOIlim
Group
Korjazm
aARK
7coated
woodfree
702012:..
newPM
E.E
urope
Russia
Aspek
near
Manturovo
KOS
1coated
woodfree
500
2014
-newPM
E.E
urope
Russia
Investlesprom
Vologda
PaperManufacturing
Mill
Sokol
VLG
11coated
woodfree
200
2014
-newPM
China
China
APP
/Sinar
Mas
Guangxi
Jingui
Pulp
&PaperCo.,
Ltd.
Qinzhou
City
GZ
2coated
woodfree
300
2014
-newPM
China
China
APP
/Sinar
Mas
HainanJinhaiPu
lp&
PaperCo.
Ltd
Yangpu,
Hainan
HN
1coated
woodfree
900
2014
-newPM
China
China
Oji
JiangsuOjiPaperCo.,L
td.
Nantong
City
JG2
coated
woodfree
400
2014
-newPM
China
China
StoraEnso
StoraEnsoSu
zhou
PaperCo.,L
td.
Suzhou
City
JG2
coated
woodfree
450
2014
-newPM
FarEast
India
Ballarpur
Industries
-BILT
BILTGraphicPaperProductsLtd
Pune
City
MA
2coated
woodfree
35..
rebuild
:speed-
upFarEast
India
Ballarpur
Industries
-BILT
BILTGraphicPaperProductsLtd
Pune
City
MA
3coated
woodfree
300
2014
-newPM
3078
— A-122 —

Contact Information
Vantaa/Singapore February 10, 2011
Support Material for Company Prospectus
Pöyry Management Consulting OyTimo SuhonenJaakonkatu 3, P.O.Box 4FI-01621 Vantaa, FinlandTel. +358 10 33 22600Mob. +358 40 82 40 522E-mail: [email protected]
— A-123 —

ISSUER
Ballarpur International Graphic Paper Holdings B.V.Paasheuvelweg 16
1105 BH Amsterdam ZuidoostThe Netherlands
JOINT LEAD MANAGERS AND JOINT BOOKRUNNERS
The Hongkong and Shanghai BankingCorporation Limited
Level 171 Queen’s Road
Central, Hong Kong
The Royal Bank of Scotland plc135 Bishopsgate
LondonEC2M 3UR
United Kingdom
TRUSTEE, PAYING AGENT, REGISTRAR, TRANSFER AGENT AND CALCULATION AGENT
The Bank of New York Mellon101 Barclay Street
New YorkNew York 10286
USA
LEGAL ADVISERS TO THE ISSUER
as to United States lawAllen & Overy
9th FloorThree Exchange Square, Central
Hong Kong
as to Dutch lawDLA Piper Nederland N.V.
Amstelveenseweg 6381081 JJ AmsterdamP.O. Box 75258
1070 AG AmsterdamThe Netherlands
as to Malaysian lawShearn Delamore & Co.
7th Floor, Wisma Hamzah-Kwong HingNo 1 Leboh Ampant50100 Kuala Lumpur
Malaysia
LEGAL ADVISERS TO THE JOINT LEAD MANAGERS
as to United States lawClifford ChanceOne George Street
19th FloorSingapore 049145
as to Indian lawLuthra & Luthra103, Ashoka EstateBarakhamba Road
New Delhi — 110 001India