bagel nash digital marketing plan
TRANSCRIPT

COURSE: BA (Hons) MarketingMODULE TITLE: Digital Marketing
TUTOR: Anderson LimaSTUDENT NAME: Ben Cherry (C3332515)
ASSIGNMENT: Component 1: Mobile Application Briefing PaperWORD COUNT: 1,096
DATE OF SUBMISSION: 12th January 2015
1

Contents Page
1.0 Introduction p2
2.0 Delivering value to customer segment p4
3.0 Procedures to develop the app p5
4.0 Key metrics to measure the effectiveness of the app p7
4.1 Acquisition p7
4.2 Engagement p7
4.3 Outcome p8
5.0 Bibliography p9
6.0 App screenshots p10
6.1 Budget & Piggy Bank Process p10
6.2 Sharing Tips p11
6.3 Deals & Discounts p11
2

1.0 Introduction
The purpose of this briefing paper is to introduce the Student Piggy Bank app, show how it delivers value to the customer segment, analyse the procedures went through to develop the app and key metrics to measure the effectiveness of the app.
3

2.0 Delivering value to customer segment
A mobile application is a standalone software that runs on top of a computer’s operating system (Contentious, 2011). Student Piggy Bank (SPB) is a new app aimed at University student who need help with budgeting there money. SPB will be launched across the UK with the main target of making it an essential app for students. Using Acorn (2014) the market is segmented as ‘Financially stretched- Student flats and halls of residence’.
A Mintel report in 2014 found that 54% of full-time university students are concerned about not having enough money. The app gives a place for students to control there money, save up with friends and share money saving tips with students across the UK.
“Students, are the most likely to say that they enjoy searching for discounts. This is partly because they will have the widest range of devices to be able to search for deals in a variety of online and offline channels but also, if they are students, it is probably demanded by their financial circumstances and the chance of finding a leisure experience which can be had at a hefty discount on its normal price is quite compelling.” (Mintel, 2013).
On there smartphones, every week 43% of students visit there online banking and 37% make purchases (ConsumerBarometer, 2014). This shows the money conscious side to students, with more checking there online accounts than making purchases. SPB adds value for students as it gives them a place to control there money as well as provide deals and discounts for businesses nearby.
81% of students use there smartphones weekly to visit social network sites (ConsumerBarometer, 2014) this shows how important creating shareable content is for this customer segment. For this reason, embedded in the app is the ability to add friends (see screenshot 6.2.2), communicate with them, share tips/deals (see screenshot 6.2.3) and also share a piggy bank with added friends (see screenshot 6.1.5). The social ability runs through the core of the app.
4

Figure 1.1Source: Mintel
Figure 1.2Source: Mintel
3.0 Procedures to develop the app
In terms of money management, University students can struggle with the large outflow of money. There is however no bugeting apps currently made for UK students on the app store; the development of the app therefore came from personal needs and experience.
To begin, research was conducted on students spending habits through a 2014 student lifestyles Mintel report. As shown in figure 1.1 there are a range of different expenditure for students with the main expense being rent and food/drink, the rest being built up from leisure activities and other personal purchases.
Figure 1.2 shows that the main reasons for students to go to university is to ‘study a specific subject that they are interested in’ and to also ‘get a better paid-job that requires specific qualifications’. Students however have concerns whilst at university which can hinder there learning, shown in figure 1.3 54% of students said that ‘not having enough money’ was a worry for them. These findings prove that a budgetting app would reduce students concerns when studying aswell as positively changing the £56 monthly savings seen in figure 1.1.
5
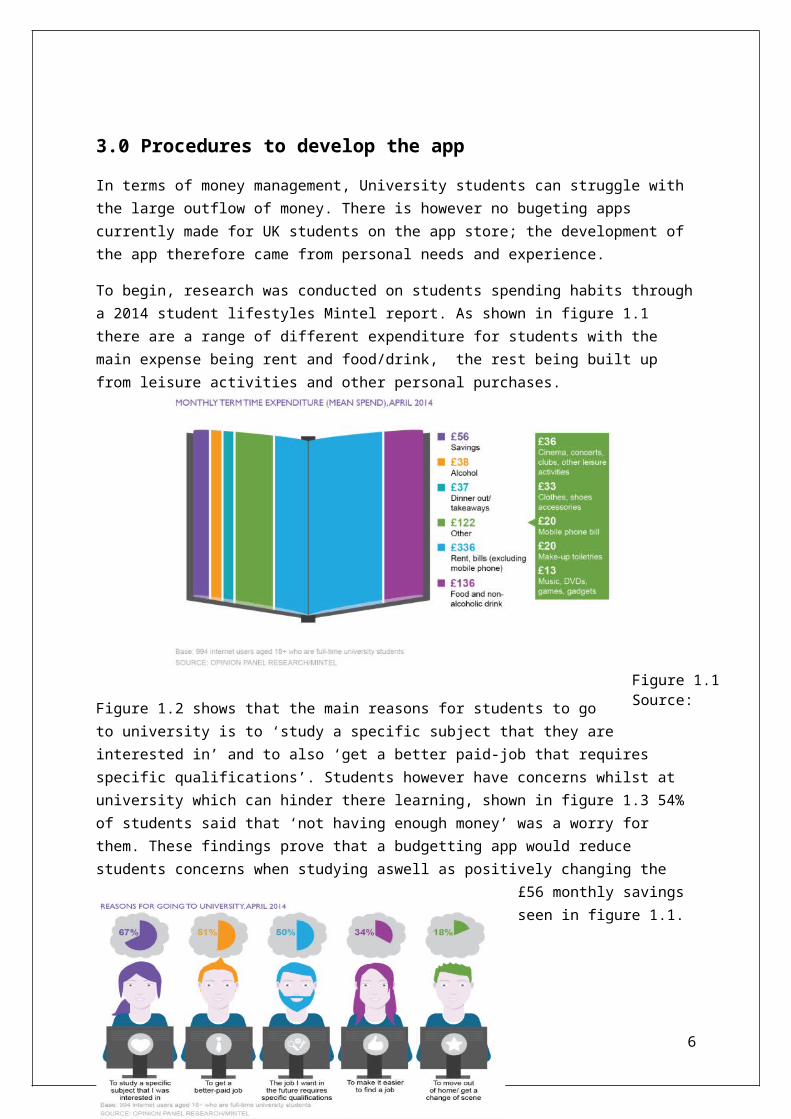
Figure 1.3Source: Mintel
When it came to making the app, the online app-creation tool Appshed was used. The idea was to deliver a solitary budget planner; a place for the student to look at the in and outflows of there money. However, it was felt that it was important to add value to the app. This was needed for two reasons; to give potential customers a greater amount of reasons to download the app and the second to give potential to make money from the app.
The idea, was to include a deals & discounts page, a place that businesses will post offers specifically targetted to students (see screenshots 6.3). This is a benefit for businesses as it gives them a place to target a large student audience it also helps the student stick to their budget.
In order to gain more downloads it was important to include a friends section; where students can add friends, share money saving tips and also save money with them in a joint piggy bank (see figure 6.1.5). There was also a section added for sharing money saving tips, not only with added friends but with students across the UK (see figure 6.2.1).
6

Figure 2.0Source: Singer, 2012
4.0 Key metrics to measure the effectiveness of the app
Regardless of the platform(s) your app lives on or the tools you use to measure it, it's critical to measure three key areas: acquisition, engagement, and outcomes (Singer, 2012).
At one time counting downloads was a sufficient way to evaluate the success of an app, but that's no longer the case. Download numbers do not necessarily reflect the actual number of people using an app, for example, nor the impact an app might have in a market (Albright, 2012).
4.1 Acquisition
Acquisition metrics show you how people are finding your app and whether they're continuing to use it (Singer, 2012). Within acquisition, the number of downloads will be measured from both the App Store and Google Play. According to Lacalytics (2014) 20% of apps are used only once after downloading. It is therefore necessary to make sure that those who downloaded the app remain engaged with it. To measure this, the number of daily launches will be monitored through Google Analytics (2014).
4.2 Engagement
Engagement metrics help you understand how users are interacting with your app so you can add more of what they like and remove what they don't (Singer, 2012). Here, users will be monitored by how they move through the app and how they get from the home page to where it is they are aiming to get to. For example, if it is found that users have to go through lots of pages in order to get from A to B, it would be important to shorten the sequence to improve the user friendliness.
In terms of engagement, SPB offers users the ability to post tips and share a piggy bank with friends. Consequently, the number of new posts and piggy banks made will be observed to see if these are popular features within the app.
7

4.3 Outcome
The Outcome is about how the app impacts the bottom line. It identifies the metrics that show the business value the app has created, and amplifies the areas that are showing the most value (Singer, 2012). SPB carries a space for businesses to advertise their student deals meaning that it would be possible to measure the number of click-trough’s onto the advertised pages site. This will be done to determine which advertisements and offers are most popular with the student market.
8

5.0 Bibliography
Acorn (2014). STUDENT FLATS AND HALLS OF RESIDENCE. [online] Available at: http://acorn.caci.co.uk/data/#t34_p1 [Accessed 11 Dec. 2014].
Albright, P. (2012). How do you measure the success of an app? Customer engagement is key. [online] FierceDeveloper. Available at: http://www.fiercedeveloper.com/story/how-do-you-measure-success-app-customer-engagement-key/2012-04-09 [Accessed 3 Dec. 2014].
Consumerbarometer.com, (2014). Consumer Barometer. [online] Available at: https://www.consumerbarometer.com/en/graph-builder/?question=M7b1&filter=country:united_kingdom%7CC1:16_24 [Accessed 2 Dec. 2014].
Contentious (2011) What’s a mobile app?. [online] Available at: http://www.contentious.com/2011/03/02/whats-a-mobile-app/ [Accessed 5 Dec. 2014].
Google (2014). Google Analytics Mobile Analytics And Reporting – Google Analytics. [online] Available at: http://www.google.co.uk/analytics/features/mobile-app-analytics.html [Accessed 3 Dec. 2014].
Localytics (2014). App Retention Improves - Apps Used Only Once Declines to 20%. [online] Available at: http://info.localytics.com/blog/app-retention-improves [Accessed 3 Dec. 2014].
Mintel (2013) Leisure Review-UK, [online] p.1. Available at: http://academic.mintel.com.ezproxy.leedsbeckett.ac.uk/display/638284/ [Accessed 1 Dec. 2014].
Singer, A. (2012). What You Should Know About Measuring Your Mobile App. [online] ClickZ. Available at: http://www.clickz.com/clickz/column/2213378/what-you-should-know-about-measuring-your-mobile-app [Accessed 1 Dec. 2014].
9

6.0 App screenshots
6.1 Budget & Piggy Bank Process
10
Budget
Figure 6.1.2: Expenses Figure 6.1.3: Income
Figure 6.1.5: Piggy Bank Figure 6.1.4: Budget
Figure 6.1.1: Home Page

6.2 Sharing Tips
6.3 Deals & Discounts
11
Figure: 6.2.1 Figure: 6.2.2 Figure: 6.2.1
Figure: 6.3.1 Figure: 6.3.2 Figure: 6.3.3

COMPONENT ONE END.
1

COURSE: BA (Hons) MarketingMODULE TITLE: Digital Marketing
TUTOR: Anderson LimaSTUDENT NAME: Ben Cherry (C3332515)
ASSIGNMENT: Component 2: Bagel Nash Digital Marketing PlanWORD COUNT: 3,865
DATE OF SUBMISSION: 12th January 2015
Executive Summary
1

This digital marketing report was commisioned to provide Bagel Nash with a series of practical suggestions as to how they can plan their digital growth in the UK for the next six months. The report is based on extensive research into the micro and macro environments identifying key issues and making recommendations on how to resolve them.
Research found that Bagel Nash currently has a website with a high bounce rate, social media page with a low number of followers and high SEO visibility. The propsed digital marketing aim and objectives were developed through thorough analysis of this research:
Aim: To acquire new customers to their digital platforms, retain existing digital customers as well as raising awareness of the product.
Create a mobile application for Bagel Nash and achieve 500 downloads by August ‘15.
Improve the website design and add social network links to the website in order to decrease the bounce rate from 56% to 45% by August ‘15.
Use more engaging social media content to increase social visibility from 183 to 300 by August ’15.
The objectives listed will be achieved using an STP, OVP and RACE strategies. The segment discussed is the 20-24 year old market, using a pull strategy and concentrated targeting for the ‘Rising Prosperity- Socialising young renters’ (Acorn, 2014). The objectives will be measured using tools relevant to the purpose.
Contents Page
2

Executive Summary p2
1.0 Introduction p6
1.1 Company Background p6
1.2 Digital Presence p6
1.3 Report Purpose p6
2.0 Summary of Content Analysis p7
2.1 Internal Analysis p7
2.1.1 Search Engine Optimisation p7
2.1.2 Website p7
2.1.3 Social Media p7
2.2 Macro Environment p7
2.3 Micro Environment p8
2.3.1 Customer Analysis p8
2.3.2 Competitor Analysis p8
2.3.2.1 SEO p8
2.3.2.2 Website p8
2.3.2.3 Social Media p9
2.4 TOWS Analysis p9
3.0 Objectives p11
3.1 Digital Marketing Objectives p11
3.2 Chaffey’s 5S Model p12
4.0 Strategy p13
4.1 STP p13
4.1.1 Segmentation p13
4.1.1.1 Customer Persona p13
4.1.2 Targeting p14
4.1.3 Positioning p15
4.1.1.1 Online Value Positioning p15
4.2 RACE Strategy p15
4.3 Ansoff’s Matrix p17
5.0 Tactics p18
3
5.1 Recommendation one: Website Design p18
5.2 Recommendation two: Engagement p18
5.3 Recommendation three: Mobile Application p19
5.4 Digital Marketing Mix p19
5.4.1 Promotion p20
5.4.2 People p20
5.4.3 Process p20
5.4.4 Physical Evidence p20
6.0 Implementation Plan p21
6.1 Gantt Chart p22
6.2 Budget p23
7.0 Control and Measurement p24
7.1 Objective one p24
7.2 Objective two p24
7.3 Objective three p24
8.0 Conclusion p25
9.0 Bibliography p26
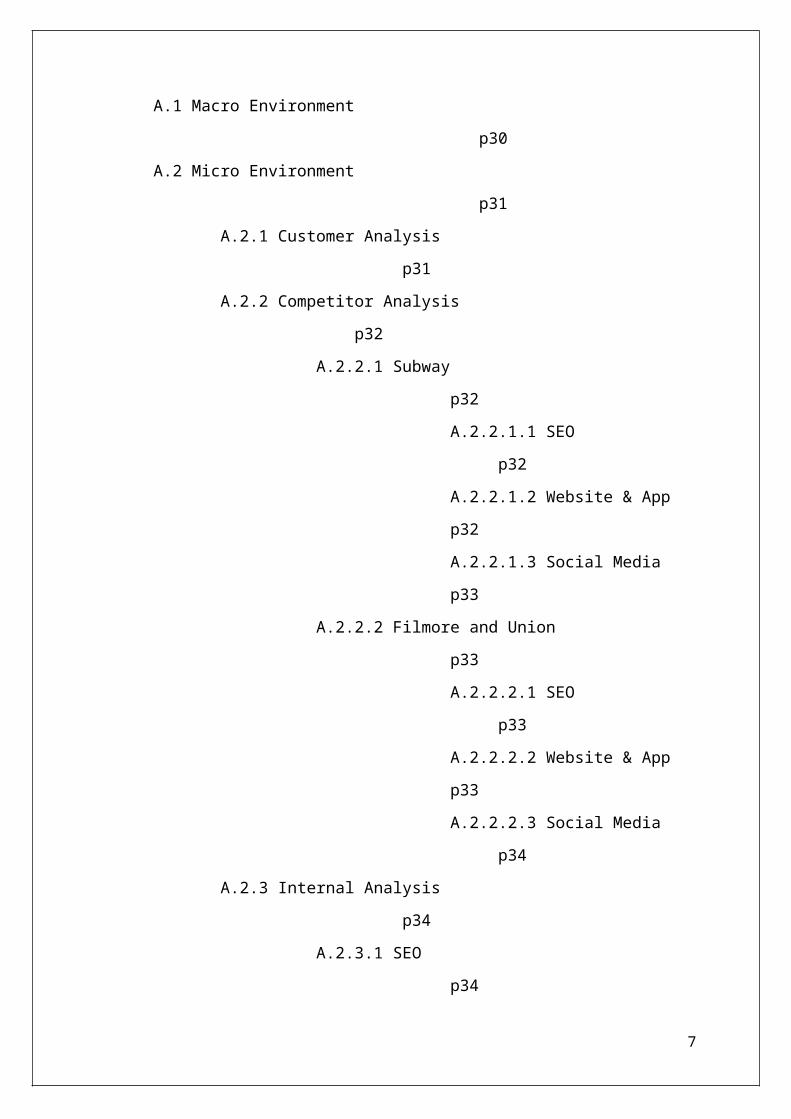
Appendix p30
A.1 Macro Environment p30
A.2 Micro Environment p31
A.2.1 Customer Analysis p31
A.2.2 Competitor Analysis p32
A.2.2.1 Subway p32
A.2.2.1.1 SEO p32
A.2.2.1.2 Website & App p32
A.2.2.1.3 Social Media p33
A.2.2.2 Filmore and Union p33
A.2.2.2.1 SEO p33
A.2.2.2.2 Website & App p33
A.2.2.2.3 Social Media p34
A.2.3 Internal Analysis p34
4

A.2.3.1 SEO p34
A.2.3.2 Website & App p34
A.2.3.3 Social Media p35
A.3 SWOT Summary p36
List of Tables
Table 2.1 TOWS Matrix p10
Table 3.1 SMART Objectives p11
Table 3.2 Chaffey’s 5S Model p12
Table 4.1 Customer Persona p14
Table 4.2 RACE Model p16
Table 4.3 Ansoff Matrix p17
Table 5.1 Marketing Mix p20
Table 6.1 Gantt chart p22
Table 6.2 Budget plan p23
Table A.2.1 PESTLE Analysis p30
Table A.2.2 Competitor Digital Comparison p32
Table A.3.1 SWOT Summary p36
List of Figures
Figure A.1.1 Subway Website p37
Figure A.1.2 Filmore and Union Website p37
Figure A.1.3 Filmore and Union Website p38
Figure A.1.4 Bagel Nash Website p38
Figure A.2.1 Bagel Nash Twitter p39
Figure A.2.2 Bagel Nash Twitter p39
Figure A.2.3 F&U Twitter p40
1.0 Introduction
5

1.1 Company Background
Bagel Nash is a British chain of bagel fast food restaurants founded in 1987 in Leeds, West Yorkshire, England. The company run 14 coffee shop/bagel bars: six in Leeds, one in Huddersfield, Derby, Nottingham and Hull, and two in Manchester and York. “As a business, we are totally committed to producing only the healthiest and freshest bakery products” (Bagel Nash, 2014).
1.2 Digital Presence
Bagel Nash is active on Facebook, Twitter and Instagram these platforms are used for digital communications. They have a clean and functioning website and also rank highly on relevant searches on search engines. The digital presence and activities of Bagel Nash are discussed in further depth in the appendix section A.2.3.
1.3 Report Purpose
This reports aims to provide Bagel Nash with practical and effective recommendations on how to grow their digital presence in the UK. It aims to retain existing customers that interact with Bagel Nash online and raise awareness of the product to capture new customers via response to the digital suggestions offered.
In-depth research will be provided into the internal strength and weaknesses and also highlight threats and opportunities found in the external environment. The report will offer recommendations that will be implemented over a six month period.
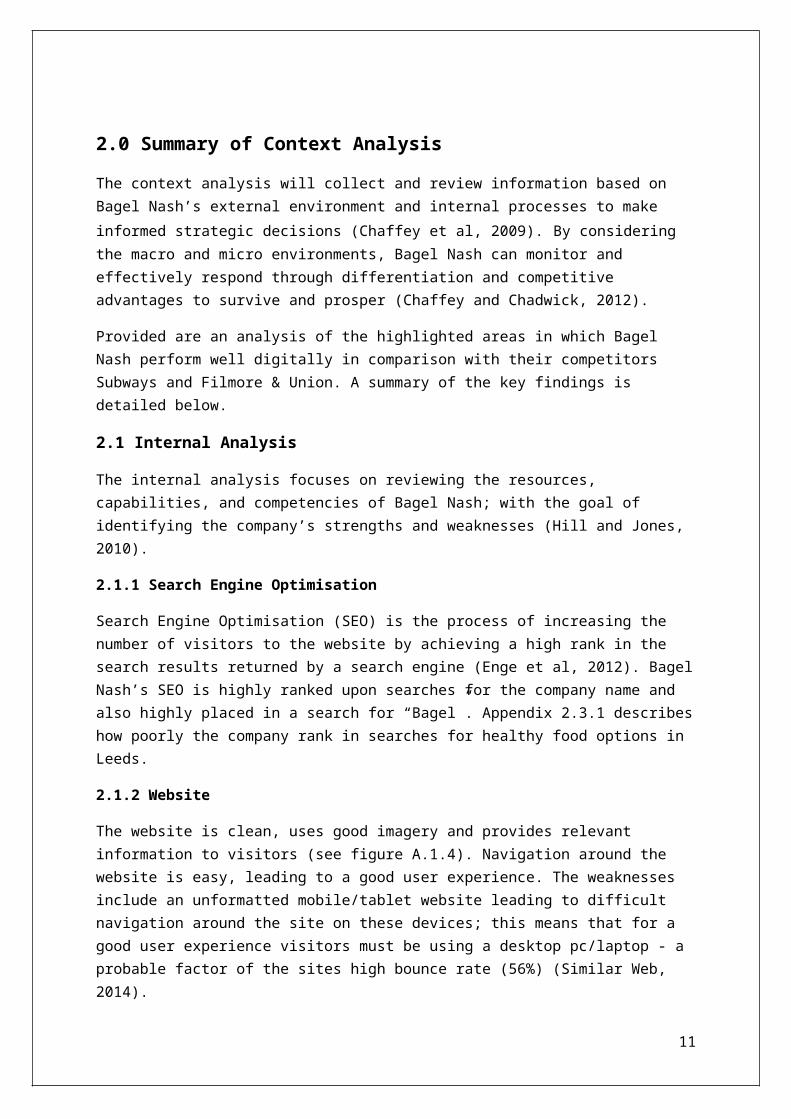
2.0 Summary of Context Analysis
6
The context analysis will collect and review information based on Bagel Nash’s external environment and internal processes to make informed strategic decisions (Chaffey et al, 2009). By considering the macro and micro environments, Bagel Nash can monitor and effectively respond through differentiation and competitive advantages to survive and prosper (Chaffey and Chadwick, 2012).
Provided are an analysis of the highlighted areas in which Bagel Nash perform well digitally in comparison with their competitors Subways and Filmore & Union. A summary of the key findings is detailed below.
2.1 Internal Analysis
The internal analysis focuses on reviewing the resources, capabilities, and competencies of Bagel Nash; with the goal of identifying the company’s strengths and weaknesses (Hill and Jones, 2010).
2.1.1 Search Engine Optimisation
Search Engine Optimisation (SEO) is the process of increasing the number of visitors to the website by achieving a high rank in the search results returned by a search engine (Enge et al, 2012). Bagel Nash’s SEO is highly ranked upon searches for the company name and also highly placed in a search for “Bagel”. Appendix 2.3.1 describes how poorly the company rank in searches for healthy food options in Leeds.
2.1.2 Website
The website is clean, uses good imagery and provides relevant information to visitors (see figure A.1.4). Navigation around the website is easy, leading to a good user experience. The weaknesses include an unformatted mobile/tablet website leading to difficult navigation around the site on these devices; this means that for a good user experience visitors must be using a desktop pc/laptop - a probable factor of the sites high bounce rate (56%) (Similar Web, 2014).
Although the majority of Bagel Nash’s advertising runs through the company’s social network account only Bagel Nash’s twitter page is promoted on the website. There is no indication of the sites Facebook and Instagram pages (see appendix A.2.3.2) (see figure A.1.4). Bagel Nash has no mobile application.
2.1.3 Social Media
Bagel Nash has a presence on Facebook, Twitter and Instagram and have a social visibility of 183 (Search Metrics, 2014). The pages are updates regularly, although the large majority of posts involve promotion rather than engaging content to involve followers (see appendix A.2.3.3) a possible factor in why Bagel Nash have a lower following in comparison to its competitors (see table A.2.2).
2.2 Macro Environment
This section is an analysis of Bagel Nash’s Macro Environment. The macro environment involves elements that do not have an immediate impact on the performance of an organisation, although they may in the longer term. Although the elements can influence Bagel Nash, it is not possible to control them (Baines, Fill, Page, 2011). In order to summarise the macro environment a PESTLE analysis has been produced (see section A.1; table A.2.1).
7

2.3 Micro Environment
This section considers Bagel Nash’s micro environment. The micro environment consists of the elements or forces that influence Bagel Nash directly (Jain, 2010). Included is an analysis of the customers and competitors.
2.3.1 Customer Analysis
It is expected that Bagel Nash target a wide range of segments in the market but for the purpose of this report, only one of these segments will be discussed. The segment that will be discussed is based on a Keynote (2014) report. The report states that younger age groups are the main visitors of sandwich shops with almost half (49%) of 20 to 24 year-olds making any number of visits to sandwich shops in 2013.
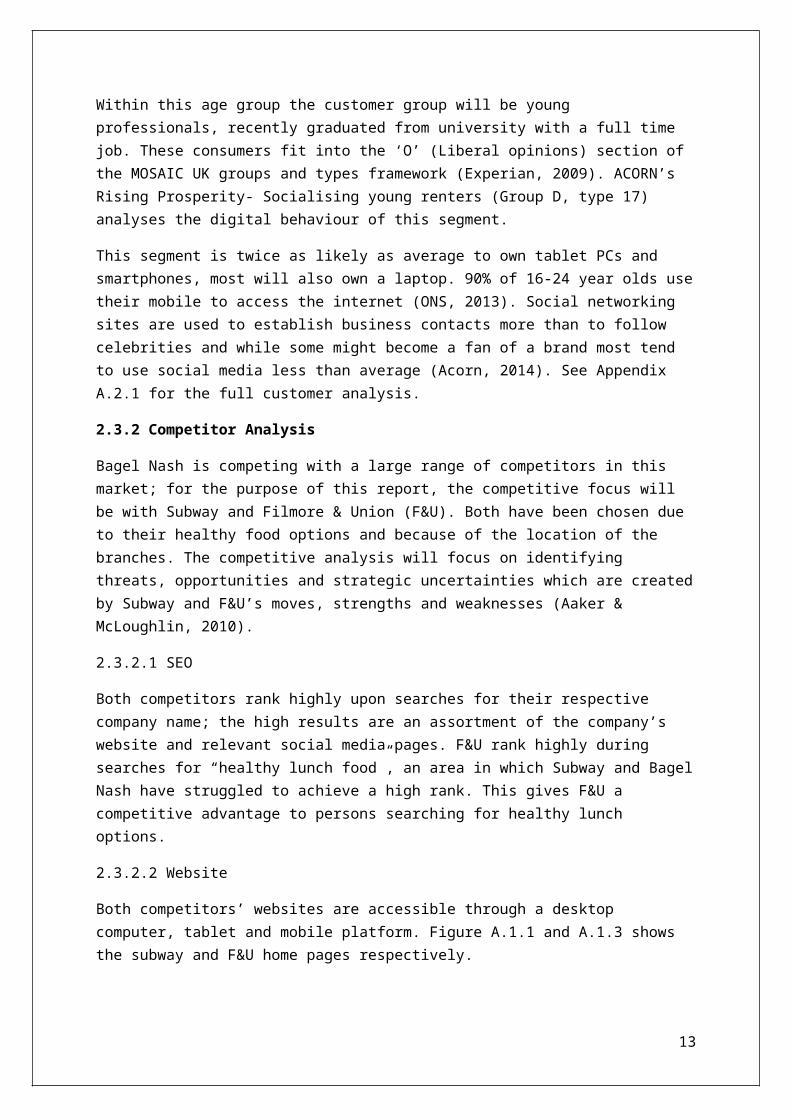
Within this age group the customer group will be young professionals, recently graduated from university with a full time job. These consumers fit into the ‘O’ (Liberal opinions) section of the MOSAIC UK groups and types framework (Experian, 2009). ACORN’s Rising Prosperity- Socialising young renters (Group D, type 17) analyses the digital behaviour of this segment.
This segment is twice as likely as average to own tablet PCs and smartphones, most will also own a laptop. 90% of 16-24 year olds use their mobile to access the internet (ONS, 2013). Social networking sites are used to establish business contacts more than to follow celebrities and while some might become a fan of a brand most tend to use social media less than average (Acorn, 2014). See Appendix A.2.1 for the full customer analysis.
2.3.2 Competitor Analysis
Bagel Nash is competing with a large range of competitors in this market; for the purpose of this report, the competitive focus will be with Subway and Filmore & Union (F&U). Both have been chosen due to their healthy food options and because of the location of the branches. The competitive analysis will focus on identifying threats, opportunities and strategic uncertainties which are created by Subway and F&U’s moves, strengths and weaknesses (Aaker & McLoughlin, 2010).
2.3.2.1 SEO
Both competitors rank highly upon searches for their respective company name; the high results are an assortment of the company’s website and relevant social media pages. F&U rank highly during searches for “healthy lunch food”, an area in which Subway and Bagel Nash have struggled to achieve a high rank. This gives F&U a competitive advantage to persons searching for healthy lunch options.
2.3.2.2 Website
Both competitors’ websites are accessible through a desktop computer, tablet and mobile platform. Figure A.1.1 and A.1.3 shows the subway and F&U home pages respectively.
Subway’s website is user friendly and easy to navigate; the tabbed navigation makes information easy to find. This improves the user experience, as seen in the websites bounce rate of just 26.5% and average page views of 6.81 (Similar Web, 2014).
8
Upon entering F&U’s website, the visitor is greeted with a pop up persuading them to subscribe in order to receive “updates and exclusive offers” (see figure A.1.2). This puts a negative impact on the user experience as it lengthens the time it takes the visitor to find the information that they need. With the average time spent on the site being nine seconds it is clear that this immediately puts visitors off entering.
The website itself is cluttered and information is spread over a large range of tabs. Within the tabs the content included is largely text based meaning visitors have to read large amounts of text to find information needed. This has a bad impact on the amount of page views and bounce rate seen in table A.2.2.
2.3.2.3 Social Media
As an international brand, Subway will carry a higher presence on social media (see table A.2.2). The table shows a far superior following on Twitter and Facebook in comparison, however Subway do not run an Instagram account (see appendix 2.2.1.3). F&U is active on a range of social media accounts. These accounts are updated and maintained irregularly, they see content posted weekly (see appendix A.2.2.2.3).
Both companies’ use their accounts to engage their followers and interact in order to resolve possible problems. Something that Bagel Nash does not offer (discussed in section 2.1.3).
2.4 TOWS Matrix
The TOWS matrix (see table 2.1) presents a mechanism for facilitating the linkages between company strengths and weaknesses and threats and opportunities of the environment (gathered in the SWOT summary (see section A.3)) (Proctor, 2014) the linkages matched create objectives and provide direction (Bamford & West, 2010).
9
10
STRENGTHs1. Bagel Nash rank high on
relevant searches on search engines.
2. The website is clean, well-functioning and easy to navigate.
3. Positive reviews on Trip Advisor.
4. The social media sites are used well to respond to customer enquiries effectively.
5. Bagel Nash is second on Google search for “Bagel”.
WEAKNESSES1. Do not currently have a
mobile application.2. Low amount of following on
all social networks.3. The website is not altered for
mobile and tablet use.4. Visitors spend little average
time on the website.5. No links on the website
directing customers to the Facebook and Instagram accounts.
6. Bagel Nash struggle to engage with their followers on social networks.
7. High bounce rate (56%).8. Bagel Nash is not ranked high
when searching for “healthy lunch food Leeds”.
OPPORTUNITIES1. On the App Store the Subway app
has negative reviews and Filmore and Union have no reviews.
2. The target segment is twice as likely as average to own tablet PCs and smartphones, most will also own a laptop.
3. 16-24 year olds are 2x more likely than average adult to be swayed by others opinions; they are influenced by reviews online.
4. The launch of Apple Pay (Early 2015) could change consumers’ perceptions and alleviate their security concerns.
5. Target segment is likely to have downloaded free and paid for apps.
(SO) OBJECTIVES
Implement the use of Apple Pay in branches upon its UK release (S3, O3, O4)
(WO) OBJECTIVES
Alter the mobile website to make it useable on these devices (W3, W4, W7, O2)
Create prominent links on the website to all Bagel Nash Social networking pages (W2, W5, O3)
Create a mobile application for Bagel Nash (W1, W3, O5)
Improve the company’s SEO involving searches in healthy foods (W8, O3)
THREATS1. On social networks, the
segment might become a fan of a brand but most tend to use social media less than average.
2. The increasing speed of social media means that information can be communicated internationally in a matter of minutes.
3. Both competitors have mobile applications.
4. Both competitors post content that aims to engage and interact.
(ST) OBJECTIVES
Continue to respond to customer enquiries quickly and create engaging conversation with followers (S4, T2)
(WT) OBJECTIVES
Create a mobile application for Bagel Nash (W1, W3, T3)
Include engageable content on social network accounts (W2, W6, T1, T3, T4)
Table 2.1: TOWS Analysis

3.0 Objectives
3.1 Digital Marketing Objectives
With the use of the TOWS matric, digital objectives have been created to aid Bagel Nash’s digital presence improvement. The objectives have been developed using the SMART framework (see table 3.1), this considers exactly what is to be achieved, where, when and with which audience (Fill, 2009). Also shown is how the performance will be measured using key performance indicators (KPI); this helps organisations to understand how well they are performing in relation to their objectives (Marr, 2014).
Objective Specific Measurable Achievable Realistic Timed TOWS KPI
1. Create a mobile application for Bagel Nash and achieve 500 downloads by August ‘15.
Create a mobile application.
Achieve 500 downloads.
Very achievable. Competitors’ apps show its success.
Many companies’ available to produce an app.
August 2015
W1, W3, O5
Number of app downloads
2. Improve the website design and add social network links to the website and in order to decrease the bounce rate from 56% to 45% by August ‘15.
Improve website formatting and add social network links.
Decrease bounce rate to 45%.
Easy to attain a website developer to update certain aspects of the site.
Many companies’ available to improve the website design.
August 2015
W3, W4, W7, O2
Bounce Rate
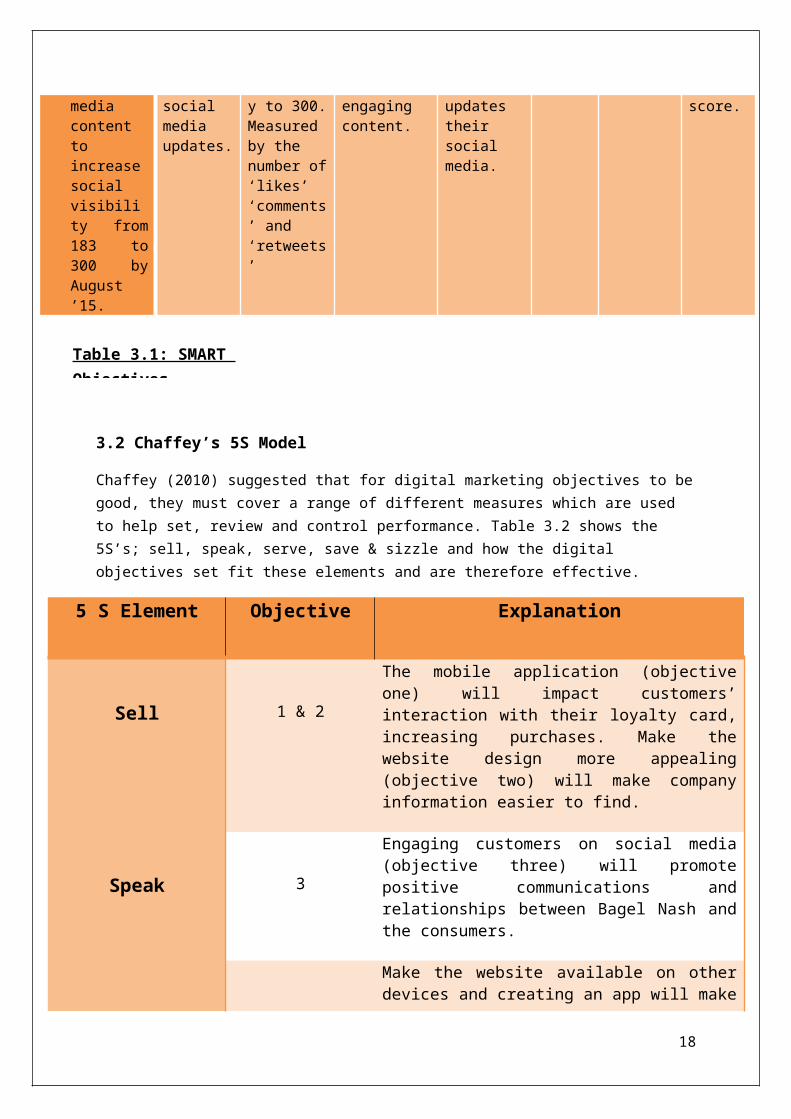
3. Use more engaging social media content to increase social visibility from 183 to 300 by August ’15.
Introduce more engaging social media updates.
Increase social visibility to 300. Measured by the number of ‘likes’ ‘comments’ and ‘retweets’
Time is available to add engaging content.
Bagel Nash already updates their social media.
August 2015
W2, W6, T1, T3, T4
Social visibility score.
11
Table 3.1: SMART Objectives

3.2 Chaffey’s 5S Model
Chaffey (2010) suggested that for digital marketing objectives to be good, they must cover a range of different measures which are used to help set, review and control performance. Table 3.2 shows the 5S’s; sell, speak, serve, save & sizzle and how the digital objectives set fit these elements and are therefore effective.
5 S Element Objective Explanation
Sell 1 & 2
The mobile application (objective one) will impact customers’ interaction with their loyalty card, increasing purchases. Make the website design more appealing (objective two) will make company information easier to find.
Speak 3
Engaging customers on social media (objective three) will promote positive communications and relationships between Bagel Nash and the consumers.
Serve 1, 2 & 3
Make the website available on other devices and creating an app will make company information easier to find. All objectives serve the customers by adding value and providing extra benefits.
Save 3The social media communication is a free platform to use, meaning the only cost included is labour.
Sizzle 1, 2 & 3
All objectives will extend the brand presence on digital platforms. Updates to the website and the creation of the app will reinforce and make the presence effective.
4.0 Strategy
12

For the three given objectives to be successfully met Bagel Nash will employ a pull strategy; this is suggested due to the nature of the recommendations provided. The pull strategy focuses its promotional efforts on end consumers (ensuring that there is valuable, quality content on Web sites and social media) (Lamb, Hair and McDaniel, n.d.).
1.1STP
In relation to digital marketing, STP can help develop more relevant digital communications by applying marketing personas by alternative tactical customer segmentation approaches (Smart Insights, 2013). The process consists of three activities; segmentation, targeting and positioning.
1.1.1 Segmentation
Segmentation involves grouping consumers with similar wants, needs and responses (Lilien, Rangaswamy and De Bruyn, 2013) segmentation is necessary because a single digital service is unlikely to meet the needs of all customers in the market (Fill, 2009). It can be assumed that Bagel Nash is targeting a wide range of segments, however for the purpose of this report, only one will be concentrated on.
As shown in the customer profile in appendix A.2.1, the concentrated segment will be graduates and young professionals aged 20-24. The assumption that this is a key segment is based on a Keynote (2014) report that found that younger age groups are the main visitors of sandwich shops with almost half (49%) of 20 to 24 year-olds making any number of visits to sandwich shops in 2013. This segment will be associated with ACORN’s Rising Prosperity- Socialising young renters (Group D, type 17) (Acorn, 2014).
In terms of the segments digital behaviour they are twice as likely as average to own tablet PC’s and smartphones, most will also own a laptop (ONS, 2013). They will share content, read blogs, and visit online dating sites. It is extremely unlikely any of these young people will not have gone online in the past week (Acorn, 2014).
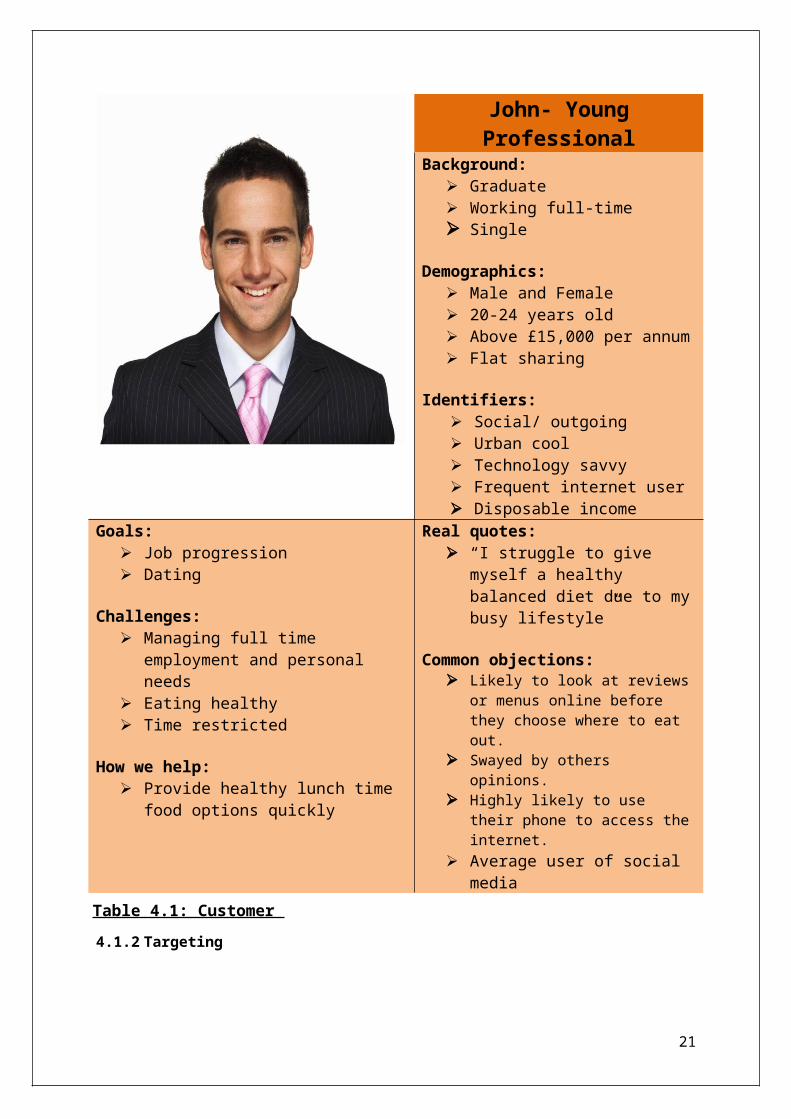
4.1.1.1 Customer persona
A customer persona is essentially a representative of a type of buyer that has been identified as having a specific interest in Bagel Nash or its products (Scott, 2010). Below, table 4.1 shows a buyer persona from the detailed segment.
John- Young Professional
Background:
13
Graduate Working full-time Single
Demographics: Male and Female 20-24 years old Above £15,000 per annum Flat sharing
Identifiers: Social/ outgoing Urban cool Technology savvy Frequent internet user Disposable income
Goals: Job progression Dating
Challenges: Managing full time employment and
personal needs Eating healthy Time restricted
How we help: Provide healthy lunch time food options
quickly
Real quotes: “I struggle to give myself a healthy
balanced diet due to my busy lifestyle”
Common objections: Likely to look at reviews or menus
online before they choose where to eat out.
Swayed by others opinions. Highly likely to use their phone to
access the internet. Average user of social media
1.1.2 Targeting
Valenzuela (2014) writes that there are four options after deciding which market to target. The four strategies are undifferentiated, differentiated, niche and micro-marketing.
Bagel Nash will adopt the niche (concentrated) targeting strategy to deliver a set of communications and marketing mix variables to meet their needs. Niche targeting targets only one segment; in Bagel Nash’s case 20-24 young professionals (see section 4.1.1). Focusing on one segment will warrant the use of the limited resources available as the resources will be used more effectively to attract the given segment.
1.1.3 Positioning
14
Table 4.1: Customer Persona

Positioning is the process that first occurs in the minds of consumers, but it is a marketer’s interest to try to influence the way consumers position the organisation (Strydom, 2004).
The positioning strategy will focus mainly on establishing them further as a healthy and fresh lunch time option. To ensure Bagel Nash appeals to the talked about target, they will focus on being an ‘urban’ and ‘trendy’ place to eat. It is also important for the consumers to feel connected to the brand. Bagel Nash can be positioned in this manner through developing an online value proposition (Chaffey & Chadwick, 2012).
1.1.3.1 Online value proposition (OVP)
A value proposition is a statement of the various benefits offered by a brand which create value for the consumer (Close et al., 2012) The OVP will define Bagel Nash’s online experience; and help to attach visitors on to the site/app by distinguishing from competitors.
Objective 2 (Improving the website design) will create a benefit over competitors as it will lower the bounce rate and match competitor’s strengths. The chosen segment are twice as likely to own tablets and smartphones (ONS, 2013) therefore the value of making the site visible on these devises is vital.
As this segment is more likely to be persuaded by others opinions (Kantar Media, 2013) on the social media pages (objective 3) Bagel Nash should retweet positive comments from customers; this would match F&U’s technique (see appendix A.2.2.2.3). Seeing positive remarks about Bagel Nash on person’s social media could attract new customers. On top of this content posted will engage the audience in order to connect and build a relationship with customers helping customer retention.
The app (objective 1) will provide visitors with easy access to Bagel Nash’s menu, offers and loyalty card. This adds value to the customer as it provides convenience.
1.2RACE Strategy
The RACE model provides access to the key strategies, which will allow Bagel Nash to establish how to position themselves and manage their marketing activities in a more structured way. RACE consists of four steps or online marketing activities designed to help brands engage their customers throughout the customer lifecycle (Chaffey, 2013). A RACE model funnel specific to Bagel Nash has been created to show how the proposed plan will acquire and retain existing digital customer (see table 4.2).
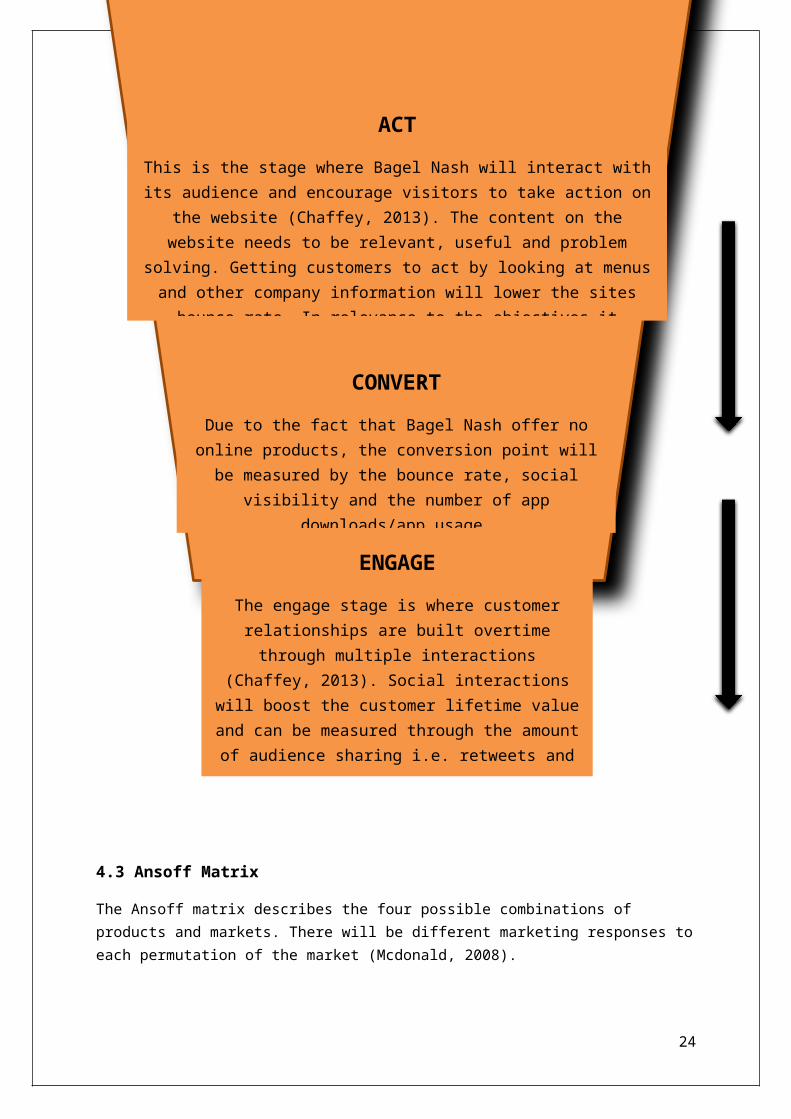
15REACH
Reach means building awareness of the brand, its products/services on other websites and in offline media in order to build traffic by driving visits to different web presences like the main site or social media sites (Chaffey, 2013). Bagel Nash currently amasses a
Table 4.2: RACE Model
4.3 Ansoff Matrix
16
REACH
Reach means building awareness of the brand, its products/services on other websites and in offline media in order to build traffic by driving visits to different web presences like the main site or social media sites (Chaffey, 2013). Bagel Nash currently amasses a
ACT
This is the stage where Bagel Nash will interact with its audience and encourage visitors to take action on the website (Chaffey, 2013). The content on the
website needs to be relevant, useful and problem solving. Getting customers to act by looking at menus and other company information will lower the sites
bounce rate. In relevance to the objectives it involves getting the audience to join the loyalty scheme and download the mobile application as well as interact
with the company on social media.
CONVERT
Due to the fact that Bagel Nash offer no online products, the conversion point will be measured by the bounce rate, social
visibility and the number of app downloads/app usage.
ENGAGE
The engage stage is where customer relationships are built overtime through multiple interactions (Chaffey,
2013). Social interactions will boost the customer lifetime value and can be measured through the amount
of audience sharing i.e. retweets and favourites on Twitter. This will be aided by the more engaging social
content.

The Ansoff matrix describes the four possible combinations of products and markets. There will be different marketing responses to each permutation of the market (Mcdonald, 2008).
The set of three objectives provided cover a market currently targeted by Bagel Nash therefore risk here is low. The purpose of this report is to acquire new and retain existing customers; objective two and three consequently focus on market penetration and market development. As Bagel Nash do not currently have a mobile application objective one has therefore been placed in the ‘new products’ section, a product aimed to improve the consumers experience (see table 4.3).
Existing Products New products
MARKET PENETRATIONObjective Two: Add social network links to the website and improve the website design in order to decrease the bounce rate from 56% to 45% by August ’15.
Objective Three: Use more engaging social media content to increase social visibility from 183 to 300 by August ’15.
PRODUCT PENETRATIONObjective One: Create a mobile application for Bagel Nash and achieve 500 downloads by August ’15.
MARKET DEVELOPMENT DIVERSIFICATION
1.0 Tactics
17
New Markets
Existing Markets
Table 4.3: Ansoff Matrix

1.1 Recommendation one- Website Design
In order to achieve objective two it is important for Bagel Nash to improve their website design, this will encourage visitors to stay and decrease the company’s bounce rate. The more relevant the site, the landing page, and offer, the more likely the visitor is to move forward rather than backward (Lee and Seda, 2009). In order to keep Bagel Nash website visitors clicking through the website it is recommended that they:
Have a clear call to action on the landing page- one of the biggest causes of a high bounce rate is visitor confusion (Mashable, 2013). Bagel Nash consequently needs to make areas of visitor interest easy to find. This involves renaming the tabbed pages on the header of the sites homepage- some of the current names do not depict what is within each tab. For example the “Love Bagels” tab stores the company menu; however this is unclear and adds to visitor confusion (see figure A.1.4). The target segment is likely to visit the website in order to browse the menu (Mintel, 2013) therefore this call to action should be present and clearly visible.
Format the mobile and tablet websites- Mobile users do not like to be forced to view a watered down version of a website and will generally leave or "bounce" from a website that is not formatted for mobile devices (LaDieu, 2014). It is therefore highly recommended that mobile and tablet websites are reformatted to add to the user experience and deter visitors from immediately exiting the website (increasing the bounce rate). This recommendation is reinforced by consumer barometers (2014) findings that the discussed segment is more likely to browse the internet on a smartphone or tablet in comparison to a computer. This has been influenced by the improvement of 4G technology, making it easier for the public to stay connected to the internet (Mintel, 2013)
Integrate social media on to the website- Due to Bagel Nash using use their social media as a promotional tool it is important to transfer website visitors to their social pages. Woodrow (2012) found that social media buttons should be displayed on the top, bottom or along the side of your home page. Bagel Nash currently only presents a link to the Twitter page and don’t offer links to Facebook and Instagram. It is advised that this is resolved in order to help achieve objective 3.
Promote the app- When the new mobile application is developed and made available it is recommended that a banner is placed on the company website detailing a reward for downloaders. This will help to achieve objective one.
1.2 Recommendation two- Engagement
While creating quality content is a must, it is important to engage your audience (Forbes, 2014). The following alterations will be made on social media to accomplish objective two:
Retweet customers positive feedback- As demonstrated by F&U’s twitter account (see figure A.2.3) they commonly retweet positive reviews and comments about the customers experience with the company. Retweets can be exploited as a form of word of mouth (Jansen et al, 2009). Retweeting is useful because it shows that Bagel Nash care about what its consumers think and write about it (Garzone and Ilie, n.d.). 16-24 year olds are twice as likely than an average adult to be swayed by
18

others opinions (Kantar Media, 2013), this is important as this technique would be effective for targeting the segment.
Change the content uploaded- If Bagel Nash is going to continue to use their social media to sell, they will struggle to gain followers (Smith, 2011). It is important that Bagel Nash try to engage with followers through more conversational means; i.e. talking to customers and posting content which isn’t directly promoting the product, however promote the company itself as a likeable brand. Simply asking a question before ending the tweet could lead to higher chance of engagement (Chan, 2014). Business Insider (2013) found that the best time for brands to tweet is between 1 and 3pm, Monday to Thursday, it is recommended that Bagel Nash update their social media within this bracket. The accounts should however be regularly monitored to quickly answer any customer queries.
Twitter competition- To entwine objectives one and three it is recommended that a competition is offered to the public. Lee (2012) suggests that Twitter competitions are more effective at building engagement than any other online (paid) investments. For example, a Twitter campaign urging customers to tweet a hashtag such as #BagelNashgiveaway and also sign up to the new loyalty scheme (by downloading the new app) which will put contestants in with a chance of winning a prize.
1.3 Recommendation three- Mobile application
In relation to objective three, a new free mobile application will be offered to the target market to provide a new method for customers to interact and access information about Bagel Nash. It is also advised that the loyalty scheme is built into the app, similar to the subway and F&U apps. ONS (2013) found that the target market is likely to download applications for their smartphones.
The loyalty scheme will be built into the app to further improve the user experience. Having the loyalty card on a mobile application makes it easier to carry around, and it makes it accessible for the consumer to see how many points or rewards they have gained. This proves a compelling reason for consumers to return to their favourite merchants (and the app) repeatedly in order to amass points (Allums, 2014).
1.4 Digital marketing mix
This section describes how the marketing mix is applied to Bagel Nash’s digital marketing strategies. The 7Ps help companies to review and define key issues that affect the marketing of its products and services and is often now referred to as the 7Ps framework for the digital marketing mix. Today, it’s recommended that the full 7Ps of the marketing mix are considered when reviewing competitive strategies (Smart Insights, 2013). Table 5.1 shows the impact that using these tactics will have on the marketing mix.
Due to the nature of this report and the recommendations provided, not all ‘P’s’ are relevant to what has been proposed. As seen in table 5.1 promotion, process and physical evidence are key digital mix areas for focusing on online.
19

Elements of Marketing Mix
Recommendation 1 Recommendation 2 Recommendation 3
ProductPromotion
PricePlace
People Process
Physical Evidence
1.4.1 Promotion
The website, app and social media pages will be used as communication tools to inform customers about company information, PR and special offers. These are effective methods as ONS (2013) found that 88%of 18-24 year olds use the internet daily.
1.4.2 People
The social media accounts will aim to respond to customer queries fast and effectively (see section 5.2). Although hard to achieve online, this will provide a personalised contact with the customer.
1.4.3 Process
Overall, all recommendations will improve the customers process. On the website, information will be easier to find; furthermore the customers will be able to access information easily on their smartphones and tablets (see section 5.1) improving the user experience on the website. The social media pages will be updated with relevant information and also answer any queries customers have making it easier to interact. Finally, the application will give customers a platform to review their loyalty card and explore offers and company information.
1.4.4 Physical Evidence
All three platforms are perceptible areas of Bagel Nash. Associations will therefore be made by customers between the app and website toward the brand as a whole. Consequently, creating better navigation and mobile access to the website and app will underpin the professional look of the company. Social media updates will reinforce this and content posted will register the brand as ‘urban’ and ‘trendy’.
20
Table 5.1: Marketing Mix
6.0 Implementation Plan
6.1 Gantt Chart
Table 6.1 is a Gantt chart which shows the dimensions of the project over a period a six month period, they show how the project will be phased over this period (CIM, 2004).
6.2 Budget
Bagel Nash have expressed that they have a budget of £30,000 for this six month project. Table 6.2 shows the predicted costs of implementing each objective.
21

22
Total Budget
£30,000
Month
February March April May June July
Digital Tools and Activity
Bagel Nash AppApp Development £2,500 £2,500 0 0 0 0 £5,000App Maintenance 0 0 £500 £500 £500 £500 £2,000Bagel Nash WebsiteMobile & tablet formatting
£4,000 0 0 0 0 0 £4,000
Website Development
0 £3,000 0 0 0 0 £3,000
Website Maintenance
0 0 £500 £500 £500 £500 £2,000
Social MediaSocial Media manager
£2,000 £2,000 £2,000 £2,000 £2,000 £2,000 £10,000
Competition 0 £500 0 0 0 0 £500Total Costs Per Month
£8,500 £8,000 £3,000 £3,000 £3,000 £3,000 £28,500
Total Cost: £28,500
23
Table 6.2: Budget Plan
7.0 Control and measurement
This section reviews how Bagel Nash will review the success and effectiveness of the digital marketing plan and determine whether the objective goals have been achieved. The objectives will be measured using their KPI’s shown in table 3.1 (see section 3.1).
7.1 Objective one
Create a mobile application for Bagel Nash and achieve 500 downloads by August ‘15.
Download numbers do not necessarily reflect the actual number of people using an app, for example, nor the impact an app might have in a market (Albright, 2012). The number of downloads will be measured from both the App Store and Google Play. According to Lacalytics (2014) 20% of apps are used only once after downloading. It is therefore necessary to make sure that those who downloaded the app remain engaged with it. To measure this, the number of daily launches will be monitored through Google Analytics (2014).
7.2 Objective two
Improve the website design and add social network links to the website and in order to decrease the bounce rate from 56% to 45% by August ‘15.
To measure objective two, Bagel Nash will use Google Analytics and Alexa to review the sites bounce rates and the improved effectiveness of the sites landing pages. This will be reviewed upon the original bounce rate of 56% with the aim of achieving one of 45% will the aid of the suggestion offered in section 5.1.
7.3 Objective three
Use more engaging social media content to increase social visibility from 183 to 300 by August ’15.
Objective three will ultimately be measured using Search Metrics to review their social visibility in comparison to the earlier figure. Other measurement for the engagement will involve the use of tools such as Facebook Insight and Twitter Analytics to measure the amount of shares, comments, retweets and mentions. To monitor the success of the Twitter competition (see section 5.2) Keyhole will be used.
24
8.0 Conclusion
The above digital marketing plan has provided Bagel Nash with a series of digital marketing objectives in order to acquire new customers while retaining existing customers through online platforms.
25

9.0 Bibliography
Aaker, D. & McLoughlin, D. [2010] Strategic Market Management: Global Perspectives. West Sussex, John Wiley & Sons Ltd.
Acorn, (2014). Socialising young renters. [online] Available at: http://acorn.caci.co.uk/data/#t17_p1 [Accessed 27 Nov. 2014].
Albright, P. (2012). How do you measure the success of an app? Customer engagement is key. [online] FierceDeveloper. Available at: http://www.fiercedeveloper.com/story/how-do-you-measure-success-app-customer-engagement-key/2012-04-09 [Accessed 20 Dec. 2014].
Allums, S. (2014). Designing mobile payment experiences. Sebastopol, CA: O'Reilly Media.
Baines, P., Fill, C. & Page, K. [2011] Marketing. 2nd edition. Oxford, Oxford University Press
Bagel Nash, (2014). Welcome to Bagel Nash. [online] Available at: http://bagelnash.com/ [Accessed 15 Dec. 2014].
Bamford, C. & West, P. [2010] Strategic Management: value creation, sustainability, and performance. USA, Southern-Western, Cengage Learning
Chaffey, D., Chadwick, F., Mayer, R. & Johnston, K. [2009] Internet Marketing: Strategy, Implementation and Practice. 4th edition. Harlow, Pearson Education Ltd.
Chaffey, D. & Chadwick F. [2012] Digital Marketing: Strategy, Implementation and Practice. 5th edition. Harlow, Pearson Education Ltd
Chaffey, D. (2013). Introducing RACE: a practical framework to improve your digital marketing. [online] Smart Insights. Available at: http://www.smartinsights.com/digital-marketing-strategy/race-a-practical-framework-to-improve-your-digital-marketing/ [Accessed 8 Dec. 2014].
Chan, R. (2014). 4 Effective Tips to Increase Visibility on Twitter – Social Media Rush. [online] Social Media Rush. Available at: http://www.socialmediarush.com/4-effective-tips-to-increase-visibility-on-twitter/ [Accessed 10 Dec. 2014].
CIM, (2004). CIM Revision Cards. Routledge.
Close, A., O'Guinn, T., Allen, C. and Semenik, R. (2012). Advertising and integrated brand promotion.
Consumerbarometer.com, (2014). Consumer Barometer. [online] Available at: https://www.consumerbarometer.com/en/graph-builder/?question=M4&filter=country:united_kingdom%7CC1:16_24 [Accessed 9 Dec. 2014].
Enge, E. et al (2012). The art of SEO. Second Edition. Sebastopol, CA: O'Reilly.
26
Experian, (2014). Mosaic United Kingdom. [online] Available at: http://www.experian.co.uk/assets/business-strategies/brochures/Mosaic_UK_2009_brochure.pdf [Accessed 27 Nov. 2014].
Fill, C. (2009) Marketing Communications: Interactivity, Communities and Content Fifth Edition Pearson Education Limited
Forbes, (2014). 7 Free Ways for Boosting Your Social Media Engagement. [online] Available at: http://www.forbes.com/sites/johnrampton/2014/09/22/7-free-ways-for-boosting-your-social-media-engagement/ [Accessed 13 Dec. 2014].
Garzone, G. and Ilie, C. (2014). Genres and genre theory in transition, Florida: BrownWalker Press.
Google (2014). Google Analytics Mobile Analytics And Reporting – Google Analytics. [online] Available at: http://www.google.co.uk/analytics/features/mobile-app-analytics.html [Accessed 20 Dec. 2014].
Hill, C. and Jones, G. (2010). Strategic management cases. Mason, OH: South-Western/Cengage Learning.
ICO (2014). Processing personal data fairly and lawfully (Principle 1) | ICO. [online] Available at: https://ico.org.uk/for-organisations/guide-to-data-protection/principle-1-fair-and-lawful/ [Accessed 26 Nov. 2014].
Jain, A. (2010). Principles of Marketing. V.K Enterprises, p.62.
Jansen, B. J. , Zhang, M., Sobel, K. & Chowdury, A. (2009). Twitter power: Tweets as Electronic Word of Mouth. Journal of the American Society for Information Science and Technology, vol. 60 (11)
Kantar Media [2013] Sixth Form & University Students: What a difference a few years make. Kantar Media. [Internet] Available from: <http://www.kantarmedia.co.uk/news-views/our-publications-(articles-and-white-papers)/sixth-form-university-students-what-a-difference-a-few-years-make/> [Accessed 28 Nov. 2014]
Key Note, (2013). Coffee & Sandwich Shops Market Update 2013. [online] Available at: http://www.keynote.co.uk.ezproxy.leedsbeckett.ac.uk/market-intelligence/view/product/10826/coffee-%26-sandwich-shops?medium=download [Accessed 27 Nov. 2014].
Key Note, (2014). Coffee & Sandwich Shops Market Report 2014. [online] Available at: http://www.keynote.co.uk.ezproxy.leedsbeckett.ac.uk/marketintelligence/view/product/11004/coffee-%26-sandwich-shops?highlight=sandwich&utm_source=kn.reports.search [Accessed 27 Nov. 2014].
27

LaDieu, N. (2014). 5 Benefits of Responsive Design. [online] Savvior. Available at: http://www.savvior.com/blog/5-benefits-of-responsive-design [Accessed 9 Dec. 2014].
Lamb, C., Hair, J. and McDaniel, C. (n.d.). MKTG 8.
Lee, K. and Seda, C. (2009). Search engine advertising. Berkeley, Calif: New Riders.
Lee, A. (2012). 4 Awesome Types of Successful Twitter Contests. [online] Jeffbullas's Blog. Available at: http://www.jeffbullas.com/2012/05/14/4-awesome-types-of-successful-twitter-contests/ [Accessed 10 Dec. 2014].
Lilien, G., Rangaswamy, A. and De Bruyn, A. (2013). Principles of Marketing Engineering. 2nd ed.
Localytics (2014). App Retention Improves - Apps Used Only Once Declines to 20%. [online] Available at: http://info.localytics.com/blog/app-retention-improves [Accessed 20 Dec. 2014].
Marr, B. (2014). Key Performance Indicators (KPIs) - explained: examples, reporting & case studies.... [online] Ap-institute.com. Available at: http://www.ap-institute.com/Key%20Performance%20Indicators.html [Accessed 7 Dec. 2014].
Mashable, (2013). How to Lower Your Site's Bounce Rate. [online] Available at: http://mashable.com/2013/11/22/bounce-rate-metrics/ [Accessed 9 Dec. 2014].
McDonald, M. (2008). Malcolm McDonald on marketing planning. London: Kogan Page.
Mintel (2012). Social Media: Food - UK - July 2012. [online] Available at: http://academic.mintel.com.ezproxy.leedsbeckett.ac.uk/display/618543/ [Accessed 26 Nov. 2014].
Mintel (2013) Digital Trends Winter – UK – December 2013 [Internet] Available at: http://academic.mintel.com.ezproxy.leedsmet.ac.uk/display/638324/ [Accessed 3 Dec 2014]
Mintel, (2014). E-Commerce - UK - July 2014. [online] Available at: http://academic.mintel.com.ezproxy.leedsbeckett.ac.uk/display/679707/?highlight [Accessed 27 Nov. 2014].
Mintel (2014). Digital Trends Winter - UK - December 2014. [online] Available at: http://academic.mintel.com.ezproxy.leedsbeckett.ac.uk/display/679695/ [Accessed 28 Nov. 2014].
Office of National Statistics. [2013] Internet Access Quarterly Update, Q4, 2013. ONS. [Internet] Available from: <http://www.ons.gov.uk/ons/rel/rdit2/internet-access-quarterly-update/2013-q4/stb-ia-q4-2013.html> [Accessed 28 Nov. 2014]
Scott, D. (2010). The new rules of marketing and PR. Hoboken, N.J.: John Wiley & Sons.
28

SimilarWeb, (2014). Web traffic insights for Bagelnash.com. [online] Available at: http://www.similarweb.com/website/bagelnash.com [Accessed 27 Nov. 2014].
Smart Insights, (2013). The Segmentation, Targeting and Positioning model. [online] Available at: http://www.smartinsights.com/digital-marketing-strategy/customer-segmentation-targeting/segmentation-targeting-positioning-model/ [Accessed 9 Dec. 2014].
Smart Insights, (2013). How to use the 7Ps of the Marketing Mix?. [online] Available at: http://www.smartinsights.com/digital-marketing-strategy/online-marketing-mix/how-to-use-the-7ps-marketing-mix/ [Accessed 10 Dec. 2014].
Smart Insights (2014). Using the PESTLE analysis model. [online] Available at: http://www.smartinsights.com/marketing-planning/marketing-models/pestle-analysis-model/ [Accessed 26 Nov. 2014].
Smith, D. (2011). Promote your business or cause using social media. [S.l.: Create Space].
Strydom, J. (2004). Introduction to marketing. Cape Town, South Africa: Juta.
Valenzuela, F. (2014). Marketing: A Snapshot. National Library of Australia.
29

PESTLE Factor Overview Impact and Importance
Factor How the factor could potentially effect Bagel Nash Time Frame Opportunity or Threat Potential Impact Importance
Social Only 27% of smartphone owners used this device to shop online in the last three months, as consumers continue to be wary about submitting payments details on mobile devices (Mintel, 2014).
Medium Threat Low Medium
Social Food brands are most commonly mentioned on Twitter, which accounts for three quarters of all mentions online (Mintel, 2012).
Long Opportunity High Medium
Social Growth in e and m commerce has led to an expected growth of 82% in total UK online retail sales between 2014-2019 (Mintel, 2014)
Long Opportunity Low Medium
Social As the age profile in Facebook grows, younger users are finding it less socially acceptable and are moving towards What’s App (Smart Insights, 2014).
Long Threat Increasing High
Social Consumers are now just as likely to have access to a tablet computer as they are a desktop PC, with household ownership reaching 54% and 55% respectively as of October 2014 (Mintel, 2014).
Long Opportunity Medium Low
Technological The increasing speed of social media means that information can be communicated internationally in a matter of minutes (Marketing Magazine, 2013).
Medium Threat Medium High
Technological The launch of Apple Pay (Early 2015) could change consumers’ perceptions and alleviate their security concerns (Mintel, 2014).
Long Opportunity Increasing Medium
Technological Consumers’ behaviour has seen an increased use of tablet and mobile browsing along with improved 4G technologies. These improvements mean that customer’ behaviour media consumption is shifting to the use of mobile technologies (Mintel, 2013).
- Opportunity Medium Medium
Legal The Data Protection Act requires you to process personal data fairly and lawfully (ICO, 2014)
Long Threat High High
30

31
Appendix
A.1 Macro Environment
Table A.2.1: PESTLE Analysis

A.2 Micro Environment
A.2.1 Customer Analysis
It can be expected that Bagel Nash target a wide range of segments in the market but for the purpose of this report, only one of these segments will be discussed. The segment that will be discussed is based on a Keynote (2014) report. The report states that younger age groups are the main visitors of sandwich shops with almost half (49%) of 20 to 24 year-olds making any number of visits to sandwich shops in 2013.
Younger age groups are likely to buy sandwiches from these premises on breaks from work (Keynote, 2014). As such, Bagel Nash’s service is built for ‘on the go’ consumers, in this case, lunch breaks from work. These consumers fit into the ‘O’ (Liberal opinions) section of the MOSAIC UK groups and types framework (Experian, 2009). This segment will geographically be located in the seven towns and cities in which Bagel Nash operates; however the higher amount will come from Leeds due to the larger amount of branches.
Within gender differences of visiting sandwich shops, there is little to separate the two. However, of the men who did visit sandwich shops, these were more likely to visit more frequently. In terms of social grade, those in grades B and C1 were the most likely to have visited sandwich shops in 2013 (37.6%), followed by those in social grade A. Consumers in the higher social grades have more available finances and so are more able to purchase lunches from sandwich shops, whereas those in the lower social grades are more likely to save money by taking the likes of a packed lunch to work (Keynote, 2014). Further market research found that this segment a higher percentage preferred to take away their food from the sandwich bar (24.5%) than eating in (15.1%) (Keynote, 2014). This information again emphases the consumers need for fast processing.
ACORN’s Rising Prosperity- Socialising young renters (Group D, type 17) analyses the digital behaviour of this segment. This segment is twice as likely as average to own tablet PCs and smartphones, most will also own a laptop. 90% of 16-24 year olds use their mobile to access the internet (ONS, 2013). They are more likely to have downloaded free and paid for apps to their phone, which they might use to access financial information, lifestyle and entertainment.
They are more likely than average to use their phone to locate shops and restaurants, access content with a QR scanner, use GPS, download music, and watch video. Their sociability extends to the internet. They will share content, read blogs, and visit online dating sites. It is extremely unlikely any of these young people will not have gone online in the past week (Acorn, 2014).
Social networking sites are used to establish business contacts more than to follow celebrities and while some might become a fan of a brand most tend to use social media less than average. Instead, these people will be out with their friends, having a meal, going to the cinema or a club, generally living a young social lifestyle (Acorn, 2014).
This segment is likely to look at reviews or menus online before they choose where to eat out (Mintel, 2013). 16-24 year olds are 2x more likely than average adult to be swayed by others opinions; they are influenced by reviews online (Kantar Media, 2013).
32

A.2.2 Competitor analysis
The sandwich and coffee market is faced with fragmentation and ongoing competition among brands and emerging competitors. The UK market has developed a strong market for coffee culture as well as a demand for sandwiches, lunch and breakfast items on the go (Key Note, 2014). Therefore it is clear that the competition within this market is fierce meaning there are many competitors for Bagel Nash. For the purpose of this report, the competitive focus will be with Subway and Filmore & Union.
Website visits
Page views
Time on site
Bounce Rate %
Twitter Followers
Facebook Likes
Instagram Followers
App
Bagel Nash 8k 1.72 00:00:32 56.41% 1.7k 1k 115 No
Subway 360k 6.81 00:03:18 26.48% 13.7k 447.5k - Yes
Filmore and Union
3k 1.22 00:00:09 81.25% 2.8k 2.4k 908 Yes
Subway has been chosen due to both presenting themselves as a healthy lunchtime option with the products that they offer and also the ‘eat fresh’ slogan. Filmore & Union have been chosen due to their healthy foods; shown in their slogan ‘eat clean: eat pure’ and because of their local branches in the Leeds area, the same as Bagel Nash.
A.2.2.1 Subway
A.2.2.1.1 Search Engine Optimisation
Subway is ranked top on Google when searching for “Subway”, also present on the first page are the company’s Facebook and Twitter accounts. It ranks third when searching “eat fresh” the company’s slogan. The highest traffic comes from searches including “subway” “subway menu” and “subway jobs”. Subway’s SEO visibility currently stands at 4,531 falling from 4,965 a month previous (Social Metrics, 2014).
A.2.2.1.2 Website & App
Subway’s website is accessible through a desktop computer, tablet and mobile platform. In order to create easier usability the mobile and tablet platforms have been adapted to improve the user experience. Figure A.1.1 shows the subway home page and mobile homepage.
The website is user friendly and easy to navigate; the tabbed navigation makes information easy to find. The website itself is very simplistic, it isn’t cluttered and it only presents information that is a needed by the visitor; this includes menus, offers, store locator and store information. This improves the user experience, as seen in the websites bounce rate of just 26.5% and average page views of 6.81 (Similar Web, 2014).
33
Table A.2.2: Competitor Digital Comparison

Subway also has a downloadable app for mobile and tablet; the app loads the customers loyalty card and monitors their current loyalty points balance. Reviews on the App Store suggest that an update is necessary for use on newer smartphone devices.
A.2.2.1.3 Social Media
As an international brand, it is expected that Subway will carry a higher presence on social media (see table A.2.2). The table shows a far superior following on Twitter and Facebook in comparison, however Subway do not run an Instagram account. Social visibility is 18,514,132 (Search Metrics, 2014).
Subway updates their social media accounts, on the majority, daily. However there are certain times where the page will not be updated for a longer length of time. On these pages Subway is updated with news, photos and promotions. Some of these posts invariably carry celebrity endorsement. The accounts offer some posts that interact and engage with its followers; however the majority of responses to customer complaints are automated, detailing the customer to contact them via telephone or application form. This shows their social media support to be indolent and unhelpful.
A.2.2.2 Filmore and Union
A.2.2.2.1 Search Engine Optimisation
Filmore and Union is ranked top when searching for “Filmore and union” and also when searching “Filmore”. Upon further searches, they operate poorly on location searches with a fifth page ranking on a search for “Victoria quarter Leeds”. However when searching “healthy lunch food leeds” F&U is located on the first page, on the top of the Google Maps list. F&U’s social visibility is currently 8 (Social Metrics, 2014) which is expectedly inferior to Subway.
A.2.2.2.2 Website & App
Filmore and Union’s website is compatible on desktop, tablet and mobile. As with Subway, the tablet and mobile platforms have been adapted to make usability easier (see figure A.1.3). Upon entering the website, the visitor is greeted with a pop up persuading them to subscribe in order to receive “updates and exclusive offers”. This puts a negative impact on the user experience as it lengthens the time it takes the visitor to find the information that they need. With the average time spent on the site being nine seconds it is clear that this immediately puts visitors off entering.
The website itself is cluttered and information is spread over a larger range of tabs. Within the tabs the content included is largely text based meaning visitors have to read large amounts of text to find information needed. For visitors the site has a lot of scrolling which has a bad impact on the amount of page views and bounce rate seen in table A.2.2.
Filmore and Union also have an app which allows users to monitor its e-loyalty card, receive special offers and browse menus. The app currently has no reviews on the App Store which suggests there haven’t been many downloads.
34

A.2.2.2.3 Social Media
F&U is active on a range of social media accounts; Facebook, Twitter, Instagram and Pinterest. These accounts are updated and maintained irregularly, they see content posted weekly, however this can on some occasions be done on a daily basis; social visibility is 1,886 (Search metrics, 2014). The Twitter account is most active with posts due to F&U ‘retweeting’ customers’ interaction with them. The accounts interact with visitors well, using a conversational approach to help resolve possible problems which engages and adds involvement.
Content uploaded includes photo’s, news and good well messages to followers.
A.2.3 Internal analysis- Bagel Nash
A.2.3.1 Search Engine Optimisation
Bagel Nash is top ranked on Google when searching for “Bagel Nash”, also prominent on the first page is a link to the Twitter account and also reviews. The company is ranked 5th on Google when searching just for “bagel”, seen to be the highest ranked food store. Bagel Nash is not using any paid visibility on Google.
On Bagel Nash’s website it is stated that they are “committed to producing the healthiest and freshest products” (Bagel Nash, 2014), it is therefore expected that their ranking will be high on searches for healthy lunch food in Leeds. However, the company have struggled to climb to a high ranking in searches involving healthy foods. In comparison to F&U, Bagel Nash are poorly visible, this gives F&U a competitive advantage due to both companies’ operating in the health foods market. The company’s SEO visibility current stands at 183 a 19 increase from the month previous (Search Metrics, 2014).
A.2.3.2 Website
The website is clean and fresh, it also uses good product imagery. The use of a tabbed navigation along the page header makes the operation for the user very easy (see figure A.1.4).
The weaknesses of the website are that it is accessible through a desktop computer, tablet and mobile platform. However, the site is not formatted accordingly to the device; the same format is used on all platforms. This makes the site difficult to navigate on mobile/tablet due to the smaller buttons and links; a possible factor in the sites high bounce rate of 86% (Similar Web, 2014). The website also contains a large abundance of information, presented using big sections of text which can dissuade visitors from reading.
A link to the company’s Twitter page is shown on the home page yet there is no indication towards Bagel Nash’s Facebook or Instagram accounts. The link to the Twitter account is also only shown on the home page; on competitors sites links to social media accounts are prominent at the header of all pages.
Bagel Nash does not currently have a mobile application to add value to its customer segment.
35

A.2.3.3 Social Media
Bagel Nash has a presence on Facebook, Twitter and Instagram. They respond quickly and effectively to all customer feedback and questions and have a social visibility of 1,583 (Search metrics, 2014). The social media accounts are updated daily with content that does not engage and serves to increase sales.
Bagel Nash struggle to involve customers, their social media presence is used to solely increase sales (see figure A.2.1), this gives little value to customers and it leads to a low level of customer involvement and engagement. Bagel Nash have no posts which are designed to engage customers, this explains Bagel Nash’s low level of following on all social networks in comparison to its competitors (see table A.2.2).
36

A.3 SWOT Summary
STRENGTHS WEAKNESS’ Bagel Nash rank high on relevant
searches on search engines. The website is clean, well-functioning
and easy to navigate. Positive reviews on Trip Advisor. The social media sites are used well to
respond to customer enquiries effectively.
Bagel Nash is second on Google search for “Bagel”.
Do not currently have a mobile application.
Low amount of following on all social networks.
Bagel Nash is not ranked high when searching for “healthy lunch food Leeds”.
The website is not altered for mobile and tablet use.
Visitors spend little average time on the website.
Bagel Nash struggle to engage with their followers on social networks.
High bounce rate (56%).
OPPORTUNITIES THREATS On the App Store the Subway app has
negative reviews and Filmore and Union have no reviews.
The target segment is twice as likely as average to own tablet PCs and smartphones, most will also own a laptop.
16-24 year olds are 2x more likely than average adult to be swayed by others opinions; they are influenced by reviews online.
The launch of Apple Pay (Early 2015) could change consumers’ perceptions and alleviate their security concerns (Mintel, 2014).
On social networks, the segment might become a fan of a brand but most tend to use social media less than average.
The increasing speed of social media means that information can be communicated internationally in a matter of minutes.
Both competitors have mobile applications.
Both competitors post content that aims to engage and interact with its followers.
37
Table A.3.1: SWOT Summary

Figures
38
Figure A.1.1: Subway Website
Figure A.1.2: Filmore & Union Website
Figure A.1.3: Filmore & Union Website
Figure A.1.4: Bagel Nash Website
39
Figure A.2.1: Bagel Nash Twitter
Figure A.2.2: Bagel Nash Twitter
40
Figure A.2.3: F&U Twitter