baethgen olis final doc uruguay paper - oecd · mainstreaming climate change responses in economic...
TRANSCRIPT
Unclassified ENV/EPOC/GF/SD/RD(2004)2/FINAL Organisation de Coopération et de Développement Economiques Organisation for Economic Co-operation and Development 07-Feb-2005 ________________________________________________________________________________________________________ English - Or. English ENVIRONMENT DIRECTORATE Environment Policy Committee
Global Forum on Sustainable Development
MAINSTREAMING CLIMATE CHANGE RESPONSES IN ECONOMIC DEVELOPMENT OF URUGUAY by Walter E. Baethgen and Daniel L. Martino
11-12 NOVEMBER 2004
JT00178089 Document complet disponible sur OLIS dans son format d'origine Complete document available on OLIS in its original format
EN
V/E
PO
C/G
F/SD
/RD
(2004)2/FIN
AL
U
nclassified
English - O
r. English

ENV/EPOC/GF/SD/RD(2004)2/FINAL
2
Copyright OECD, 2004
Application for permission to reproduce or translate all or part of this material should be addressed to the Head of Publications Service, OECD, 2 rue André Pascal, 75775 Paris, Cedex 16, France.
ENV/EPOC/GF/SD/RD(2004)2/FINAL
3
TABLE OF CONTENTS
1. Introduction ...................................................................................................................................... 5 2. General description of Uruguay ....................................................................................................... 5
2.1 Climate........................................................................................................................................ 5 2.2 Soils ............................................................................................................................................ 7 2.3 Natural ecosystems ..................................................................................................................... 7
3. Economic and policy contexts and characteristics of the agriculture, forestry, and energy sectors 8 3.1 Uruguay’s economic and policy context..................................................................................... 8 3.2 Agricultural and livestock sector ................................................................................................ 9 3.3 Forestry sector........................................................................................................................... 12 3.4 Energy sector ............................................................................................................................ 14
4. Assessment of current situation in Uruguay: GHG emissions, the global competitiveness index and the environmental sustainability index ............................................................................................... 17
4.1 Greenhouse gas emissions ........................................................................................................ 17 4.2 Global Competitiveness Index.................................................................................................. 19 4.3 Environmental Sustainability Index.......................................................................................... 20
5. Impacts of policies, plans and regulations on the climate change issue......................................... 21 6. Future options for mitigation in agriculture and forestry ............................................................... 24
6.1 Future options for forestry ........................................................................................................ 25 6.2 Future options for agriculture ................................................................................................... 28 6.3 Increasing the use of renewable energy sources from agriculture and forestry........................ 31
7. Conclusion...................................................................................................................................... 34
REFERENCES ............................................................................................................................................. 36
ANNEX 1. URUGUAY, BACKGROUND INFORMATION .................................................................... 38
ANNEX 2. LAWS, REGULATIONS AND PLANS IN URUGUAY AFFECTING THE ENVIRONMENT40
Boxes
Box 1. Forestry promotion policy based on Law No. 15939 ................................................................... 13

ENV/EPOC/GF/SD/RD(2004)2/FINAL
4

ENV/EPOC/GF/SD/RD(2004)2/FINAL
5
MAINSTREAMING CLIMATE CHANGE RESPONSES IN ECONOMIC DEVELOPMENT OF URUGUAY1
Walter E. Baethgen2, Daniel L. Martino3
1. Introduction
Located between two of the largest countries in South America, namely Brazil and Argentina, Uruguay has a relatively small territory (176,000 km2) and a population of approximately 3.2 million. With a vast proportion of its land under natural grasslands (approximately 80%), Uruguay’s economy is largely dependent, directly and indirectly, on the agricultural and livestock sector.
Similarly to most countries in the world during the last decade, the Uruguayan general public and the political administrations have become increasingly aware of global environmental threats such as climate change and atmospheric contamination. Since 1990 Uruguay started to develop national greenhouse gas (GHG) inventories using the IPCC methodology. These inventories have generated new interests regarding potential opportunities for the national agriculture, forestry and energy sectors to contribute to mitigating global climate change through activities that result in net CO2 sequestration.
The first objective of this article is to review the current situation regarding the opportunities for three sectors in Uruguay to address climate change. To this end, we assess Uruguay’s GHG emissions and economic performance before reviewing policies, plans and regulations which resulted in land use changes and new forested areas with significant implications for climate change. A second objective of the article is to explore possible legal actions and programs that can result in both socioeconomic development and an increased ability to mitigate climate change. This objective is met by exploring recent policies, plans and regulations that explicitly consider global environmental issues and the climate change mitigation potential of the agriculture, forestry and energy sectors.
2. General description of Uruguay
2.1 Climate
Located entirely within the temperate zone, Uruguay has a fairly uniform climate. Seasonal variations are pronounced, but extremes in temperature are rare. The annual mean temperature varies from 16ºC in the South-East to 20ºC in the North-East. Precipitation is fairly evenly distributed throughout the year, and annual amounts increase from southeast (about 1000 mm) to northwest (about 1300 mm). The northern region typically presents two peaks in precipitations, one in the fall and one in the spring, while 1. Suggested citation: Baethgen, Walter E. and Daniel L. Martino (2004), Mainstreaming Climate Change
Responses in Economic Development of Uruguay, paper presented at the OECD Global Forum on Sustainable Development: Development and Climate Change, ENV/EPOC/GF/SD/RD(2004)2/FINAL, OECD, Paris.
2. Director, Latin America & Caribbean Program, International Research Institute for Climate Prediction (IRI).
3. Carbosur Consulting, Montevideo, Uruguay.
The opinions expressed in this paper are those of the individual authors and do not necessarily reflect the views of their organisations or of the OECD.

ENV/EPOC/GF/SD/RD(2004)2/FINAL
6
the southern and eastern regions show less pronounced cycles with a weak peak in the winter months. High winds are common during the winter and spring, and wind shifts are sudden and pronounced. Summer winds from the ocean however have the salutary effect of tempering warm daytime temperatures (Hudson and Meditz 1990). Natural risks in Uruguay are mainly linked to climate events.
Recent studies have documented changes in the coastal climate and environment, although no causes have been identified (UNFCCC, 1999). These changes include: a) an increase of 200 mm in precipitation in Montevideo since 1883, which became more evident during the period 1961-1990 (Bidegain and Deshayes, 1992); b) an increase of 0.5°C in air temperature and a decrease of 0.07 kPa in mean atmospheric pressure (Nagy et al., 1996); c) for the period 1961-1990, an increase in mean summer temperatures (Panario and Bidegain, 1996); and d) during the last decades, an increase of 30% in the streamflow of the Río de la Plata and a decrease in mean annual salinity along the coast (Nagy et al., 1996).
Climate in Uruguay is characterized by a large interannual and interseasonal variability, and consequently floods as well as droughts are frequent. For example, severe droughts have happened twice in the last twenty years (1988 and 1999). It is well established by the scientific community that a considerable proportion of this interannual variability is affected by the El Niño/Southern Oscillation (ENSO). Other factors known or suspected to affect climate variability in Uruguay are the Atlantic Ocean and the rainfall in the Pantanal. Table 1 shows the typical variability found in monthly rainfall (coefficient of variation ranges from 60% to 70%).
Table 1. Mean precipitation and variability in SW Uruguay (1960 – 2001)
Month Mean Std. Dev. Max. Value Min. Value (mm) (mm) (mm) (mm) January 72.1 38.9 193.4 8.1 February 72.9 54.3 186.7 0.1 March 80 52 244.4 4.8 April 105.3 65.5 280.6 13.5 May 111.5 69.3 401.3 23.7 June 102.1 68.8 275.1 9.7 July 93.4 59.3 229.6 22.5 August 115.1 81.3 299.2 30.1 September 122.2 83.5 441.6 29.6 October 84.6 61.2 239.7 8.5 November 81.7 57.7 198.3 3.7 December 69.8 44.7 157.3 0.0
Source: R. Romero, INIA 2001, personal communication
Rainfall events are frequently of high intensity with consequent low infiltration-runoff ratio. Runoff annual average is estimated at 300 mm (30% of the rainfall) and summer runoff is less than 0.15 liters/second/km2. The country has plenty hydrological surface resources approximately evenly distributed throughout the territory due to the dynamic of hydrological cycle components. Water resource use is not regulated, therefore water levels in streams and lakes decrease significantly in the summer.
The annual average of potential evapotranspiration is 1000 mm in the North-West and 800 mm in the South-East, with great interseasonal variation and relatively low interannual change. Both the high variability in rainfall and the seasonal variation of potential evapotranspiration cause frequent water deficits in soils during mid-spring and summer, and water excess in winter. For example, severe droughts

ENV/EPOC/GF/SD/RD(2004)2/FINAL
7
have happened twice in the last twenty years (1988 and 1999). The water deficit intensity is also affected by the soils water storage capacity, which varies from 50 mm in shallow soils on granite and basalt parent materials covering 47% of the land to 400 mm in deep soils which cover 38% of the territory.
2.2 Soils
Uruguay has one of the highest proportions in the world of naturally fertile soils. Most of the soils are classified as Mollisols, according to the Soil Taxonomy system of the United States Department of Agriculture. However, among this class, soils vary across the country due to differences in the geological properties of the parent materials, the landscape form and location, and drainage conditions. Predominant characteristics of the soils are: high content of organic matter, existence of a clayey horizon (B horizon) at variable depths and with light or moderate acidity (pH = 5.5 – 6.5) in the surface horizons. Schematically, they can be grouped in three main classes:
• heavy textured soils with high clay content, high organic matter content, and a B-horizon at 30-40 cm or deeper;
• soils with deep surface horizons of high sand content and weak structure (major risks of degradation-desertification) and relatively low level of organic matter, with low permeable B-horizons at 70-80 cm;
• shallow soils (30 cm or less of total depth), mainly developed on basaltic and granite rocks, frequently associated to steep slopes, and characterized by high risk of erosion-degradation.
The high variability of rainfall, and consequent periods of water excess and deficits, result in desertification. Desertification is manifested through soil erosion and degradation of pastures and water resources affecting land productivity and water availability for different uses.
Although soil degradation occurs across the country, it is more severe in the regions with annual crop production where erosion can be the first step to a gradual desertification process. Desertification is a virtually irreversible process and one of the most important environmental problems with regards to the natural resources of this country.
Natural factors – such as high-intensity rainfall - and human activities – such as intensification of agricultural mechanization, unsuited farming and production processes, monocultures – cause soil degradation to varying degrees. A process of desertification has started in Uruguay leading to, among others, the degradation and destruction of plant cover, the compacting and exhaust of agricultural soils, and loss of biological diversity.
Since the 1980s Uruguay has encouraged the adoption of agricultural practices to avoid, stop and revert soil degradation through laws and regulations.
2.3 Natural ecosystems
In 1992, a national environmental study identified four basic natural ecosystems in Uruguay:
• Grasslands: They are the predominant ecosystem in the country covering about 85% of the land. Grasslands are heterogeneous herb communities with more than 400 species of annual and perennial grasses and legumes of summer and winter seasonal growth.

ENV/EPOC/GF/SD/RD(2004)2/FINAL
8
• Forests: Natural forest occupies approximately a 3.5% of the national territory (about 667,000 ha). There are four basic types of native forests:
− The Riparian or fluvial forest which lives on the edges of water courses throughout the country and are characterized by very exuberant growth.
− The Ravine forest which corresponds to the formations of the so-called “subtropical patches” that origins in the north of the country.
− The Highland forest which is located on the hills of the south of the country and characterized by low height and twisted trunks. On the hillsides, the highland forest becomes stubbier, constituting the shrubs.
− The Palm trees, which live in two main areas. The east and southeast of Uruguay predominantly has Butiá Palm tree (Butiá capitata), an endemic species of this zone, and the northeast region predominantly has the Yatay palm tree (Butiá yatay), a patch that spreads into Argentina and Paraguay. Other palm species (such as pindó and caranday) are integrated to the formations of ravine forest.
• Wetlands: Wetlands in Uruguay are low lands which are sporadically or permanently flooded. They regulate and purify (filter) the hydrologic system by controlling erosion, and also constitute the habitat of a large number of animal and plant species, in particular migratory birds. The largest areas of wetlands in Uruguay are located in the East (basin of Laguna Merín and coast of Rocha), in the west (Uruguay River), and in the south (Santa Lucía river and low coast of the la Plata river).
• Coastal ecosystems: These are characterized by the presence of sandy and rocky soils distributed along the coasts of the La Plata River and the Atlantic Ocean. The most common vegetation in this ecosystem is the psammophilous species, some shrubby forest of tamarisks (Tamarix pentandra), guava-trees (Mircianthes cisplatensis, M. pungens) and coronillas (Scutia buxifolia).
These four ecosystems have been strongly altered due to urbanization and tourism. However, there are still few areas that maintain their original characteristics with minor modifications, such as some isolated regions on the Atlantic coast in Rocha.
3. Economic and policy contexts and characteristics of the agriculture, forestry, and energy sectors
3.1 Uruguay’s economic and policy context
Uruguay’s economy is largely dependent – directly and indirectly – on the agriculture and livestock sector. In fact, approximately 85% of Uruguayan land is suitable for agricultural production, one of the largest proportions in the world. Although the contribution of agriculture to the GDP is only 9%, agricultural products constitute about 65% of the value of the total exports (45% from livestock and 20% from crops). If manufactured goods from agriculture are included, this contribution increases to 85%. Livestock production is the most important agricultural activity covering 90% of the land, and generating 60% of the total agricultural value and 70% of the total agricultural exports.
Uruguay’s economy also relies to a large extent on the service sector, including trade, tourism, financial and insurance services, real estate, and services to companies. Tourism generated an estimated US$300 million in 1989, equivalent to 22% of merchandise exports, and depended mainly on visitors from
ENV/EPOC/GF/SD/RD(2004)2/FINAL
9
Argentina (Hudson and Meditz 1990). New developments in this sector are responsible for a decoupling trend between energy consumption and GDP in recent years. Changes are also underway in the energy structure of the country, as regional interconnections in natural gas and electricity are being developed with neighbouring countries.
Uruguay’s economic policies evolved from being based on the development of livestock production through open-market policies during the first quarter of the 20th century to protectionism and import substitution through tariff barriers and currency exchange regulations oriented to increasing production and achieving trade surpluses after a financial crisis in 1929. Until the 1950s, the small internal market limited the potential for sustained growth and the industrial sector was inefficient and small in scale. The high inflation rates during 1950-1980, combined with import substitution policies, caused a decrease in real exchange rates, which in turn reduced the value of agricultural exports. As a result farmers received low prices for their products.4 The government reacted by initiating a number of programmes and policies aimed at stimulating agricultural intensification.
During the late 1980's and 1990's most government policies reverted to the establishment of an open-market economy, which can be seen for example in Uruguay’s attempt to consolidate its economic liberalisation through regional integration by means of the MERCOSUR (Common Market of the South). The elimination of most or all of the subsidized programs for agricultural production, combined with low world market prices for cereals and livestock products, created a difficult environment for small farmers, which led to an increase in migration away from rural areas.
Two recent phases of impacts on the national economy resulting from regional integration can be identified. The first period, up to 1999 was characterized by an accelerated national economic growth. The GDP during 1985-1999 increased at an annual accumulative rate of 3.1% and the export of goods and services increased at an annual accumulative rate of 6.8%. By the end of the decade however, the economic situation changed drastically. The second period was marked by macroeconomic changes in the MERCOSUR region (first the devaluation of the Brazilian currency, later the collapse of Argentina’s financial sector) which resulted in a decline in export good prices, a 3.4% reduction of the GNP in 1999, an increase in unemployment rates to a historical maximum of almost 20%, the devaluation of the national currency by more than 100% in less than a year, and a dramatic increase of the proportion of households below the poverty line.
Yet, during the last two decades, Uruguay underwent some social and demographic changes that are similar to those of the industrialized countries. For instance, Uruguay’s annual income per capita is approximately U$S 5,700 and Uruguay has also one of the most equalitarian income distribution in Latin America. Further, the country is ranked second in Latin America in terms of its UN Human Development Index and first for its UN Human Poverty Index.
3.2 Agricultural and livestock sector
3.2.1 Annual crop production
The total area of annual crops increased from the beginning of the 20th century until the 1970’s. Main crops include wheat and barley in winter, and rice, maize, sorghum, sunflower and soybeans in the summer. The sown area with wheat, traditionally the most important annual crop, peaked in 1965 at almost 550 thousand ha. Most of the other main crops (except for rice and barley) also had their highest sown
4. For example the World Bank (1986) estimated that in the 1970's Argentinean wheat and maize growers
were receiving less than 60% of the world market price. Coffee growers in Brazil and Colombia received less than 50% of the world market price.
ENV/EPOC/GF/SD/RD(2004)2/FINAL
10
areas during the 1960s and early 1970s. Technology use during these decades was quite low: farmers preferred the traditional, stable but low yielding varieties and fertilizers were used rarely. As the main objective during this early stage was to supply the internal market and limit imports, the increase in production was mainly due to the availability of low interest credit programs (often of negative real terms) and benefits related to price policies for import substitution. Such policies presented several disadvantages: (a) they tended to favor only the larger commercial farmers which worsened the already inadequate land distribution, (b) a significant portion of the low-cost funds for agricultural development was often diverted to other uses, (c) the subsidy programs resulted in large increases in foreign debt, and (d) the mechanization incentives resulted in lower demand for agricultural labor increasing rural poverty and stimulating rural migration to metropolitan areas.
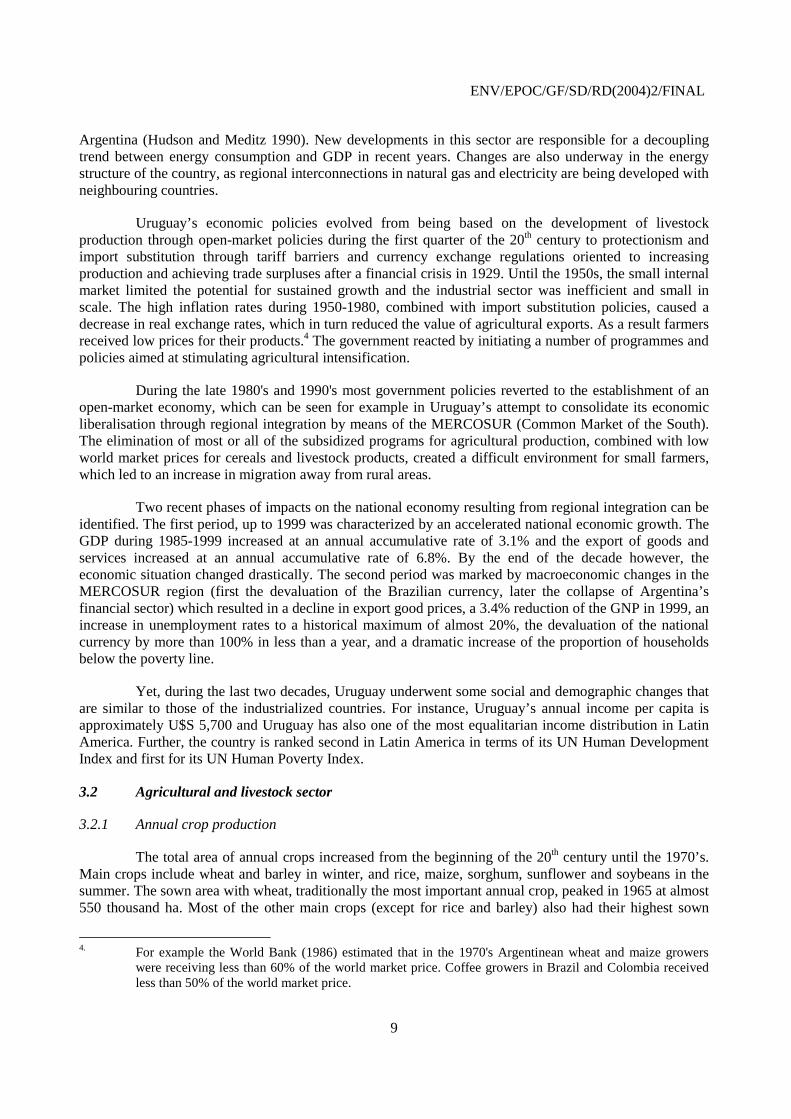
Two important changes occurred during the late 1970s and the 1980s that drastically affected the production of annual crops. First, the national research centers developed technology packages (rotation with pastures, fertilizer use, high-yield and disease resistant crop varieties) that allowed farmers to obtain much higher yields. Second, markets started to be liberalized, subsidies and low-cost credits were cut, and domestic market prices started to follow international prices. Consequently, most of the small and medium-size farmers stopped producing annual crops and the sown areas of most crops started to decline. This was the case for wheat, which saw its area decrease in the last 40 years from about 500 thousand ha to about 200 thousand ha (Figure 1), but the total national production remained around 400 thousand tons due to increased productivity. Similar trends are found in most of the other annual crops, with the exception of rice and barley. These two crops increased their total sown areas consistently. Most of the remaining crop producers are large and medium-size farmers using improved technology, and although the areas decreased, national total production tended to remain about the same.
Over the last 10-15 years the Soil Conservation Law has played an important role in encouraging reduced or conservationist tillage which has had the ancillary benefit of boosting the potential for soil carbon sequestration. During the 1990s the area of annual crops under no-tillage systems grew from zero to more than 50% of the summer crop sown area.
Figure 1. Development of areas cultivated with wheat and rice (1960-2001)
3.2.2 Livestock production
Almost 80% of agricultural land is used for extensive livestock production based on the natural grasslands. Only 17% of the livestock producing areas include some type of improvement in the pastures: either no-till sown legumes and fertilized with phosphate fertilizers, and/or sown with annual grasses

ENV/EPOC/GF/SD/RD(2004)2/FINAL
11
(ryegrass and oats) or mixtures of grasses and legumes (such as ryegrass, fescue, white and red clover, birdsfoot trefoil). The remaining land is still under natural grasslands. Feedlots or other types of animal confinements are almost non-existent and the use of hormones in any animal species is forbidden by law (Decree 915/988, December 1988). This results in one of the most “natural” beef and wool production systems of the world, and constitutes a great economic opportunity in the global market for Uruguay that has yet to be realized. However, on the other hand such extensive livestock production systems have also led to very low productivity levels. Consequently, national development programs over the past few decades have been oriented at intensifying the beef and wool production. The main challenge in this respect is to envision systems resulting in higher productivity while maintaining the natural characteristic of the livestock production and preserving or improving the natural resource base.
In the 1960s, the government initiated a large program funded by the World Bank to increase beef and wool productivity. The program involved introducing grasses and legumes as well as applying phosphate fertilizers. These measures resulted in an increase in the breeding rate and a reduction in the slaughtering age. However, the results did not meet expectations since, in some cases, the introduced pasture species did not persist as long as expected. In other cases, other species took advantage of the increased nitrogen content of the soils caused by the introduction of legumes. Also, where the pastures were well established, the management practices were often aimed at short-term economic gain and not at optimal pasture use. By doing this, farmers optimized the financial return in the short term sacrificing the longer term production stability. Finally, the vast majority of the improved pastures were used for the fattening process and very few to the breeding stage, and therefore, there was an unbalanced development of the entire beef production process. Although some technological limitations still need to be overcome (e.g. the increase in the persistence of the improved pastures), the areas of improved pastures in Uruguay seem to be more dependent on economic circumstances, namely the low price of beef received by farmers for a long period. During the 1990s, when internal prices improved and the regional and international markets opened, the area of improved pastures increased rapidly and consistently. Consequently, all beef production indicators improved, such as early slaughtering age, higher pregnancy rate, higher proportion of productive categories.
3.2.3 Other production in the agricultural and livestock sector
Similar to agriculture, dairy production was also initially directed at the domestic market. The opening of markets in the 1970s led to drastic changes in the sector: total national production increased from 700 million liters in the early 1970s to almost 1,500 million liters by 2000. The improved systems are based on sown pasture mixtures of grasses and legumes, and on the use of silage and some concentrates. Productivity also improved by increasing the proportion in the herd of milking cows in production. 90% of the total produced milk is processed in farmers cooperatives spread all over the country but more concentrated in the southern and western regions. All the production exceeding domestic demand is exported, and Uruguay is now one of the largest dairy exporters of the developing world. The exported products that generate the largest income are cheeses and powdered milk, followed by butter, fresh milk and cream.
The final component of Uruguay’s agriculture and livestock sector is sheep farming, which is traditionally aimed at wool production. Until the 1980s the national sheep herd used to include more than 20 million heads, but has been continuously decreasing due to unfavorable wool prices. Sheep production has also been changing and is being more oriented at producing meat. During periods of high wool prices, 70% of the sheep farming income came from wool production and 30% from meat. In recent years, given the low wool prices, the proportion has changed to 55% and 45% respectively.
ENV/EPOC/GF/SD/RD(2004)2/FINAL
12
3.3 Forestry sector
Tree planting was first introduced in the country in the late 19th century. Small areas of Eucalyptus were established in ranch farms, with the objective of providing shade and shelter for the cattle, and obtaining wood for building fences and for cooking. Today, thousands of these small patches of trees are found all over the country. At the same time, pine trees, and to a lesser extent eucalypts, were established on coastal areas in the south to stabilize sand dunes. These coastal forests are not harvested, although they are frequently disrupted by summer fires mainly caused by tourists. Together, forests planted in ranch farms and in coastal dunes add up to an area of 90 thousand ha.
Commercial forestry did not start until the middle of the 20th century, when the first large scale plantations were established. These first investors included pension funds, small pulp mills, other private investors, and the national utility company (UTE). In 1967, the first regulation on commercial forest plantations was enacted (Law No. 13723) to provide incentives to invest in plantations through a partial exemption on income tax proportional to the annually planted area. This resulted in a doubling of annual planting rate to 2,750 ha/yr during the period from 1968 to 1979, after which the law was abolished.
Demand for wood also increased significantly as a result of the oil crises of the 1970's and 1980's as most industries in the country switched from fossil fuels to firewood. This exerted a large pressure on native forests (Uruguay 1992). Demand for firewood increased from 1.3 million m3/year in 1973 to 3.0 million m3/year in 1987 (FAO, 1987). By 1988, commercial forest plantations covered 31 thousand ha distributed all over the country. Most of this area consisted of short rotation eucalypts (10-12 years) and pines (25-30 years), planted with very precarious technology based on poor genetic materials, intensive soil tillage, mechanical weeding, and lack of use of fertilizers. These plantations frequently suffered from damage caused by cattle grazing on young stands. Growth rates were relatively low, with mean annual increments ranging between 15 and 25 m3/ha/yr for eucalypts and from 15 to 20 m3/ha/yr for pines. A large proportion of low grade timber was usually obtained, and firewood and pulplogs were the main products.
In 1987, the adoption of a forestry promotion policy, based on a set of instruments contained in Law No. 15939, boosted forestry activities in the country (see Box 1). The central objectives of this policy were to create new sources for exports and a sustainable supply of firewood while stopping the deforestation process that was taking place at increasing rates. This policy was highly successful, and resulted in a remarkable growth of forested area (Figure 2), with an estimated total investment, including a significant amount from foreign sources, of more than US$ 1 billion in the 1990's. This new policy also changed the traditional forestry. New technological practices were adopted, resulting in better quality, more vigorous, and more homogeneous tree stands. Productivity was increased by up to 100% as compared to pre-1987 forestry. Modern concepts, such as long-term planning, environmental management systems and high concerns for working conditions and other social impacts were introduced in forest company management. Good sustainability standards were achieved, and several companies have obtained, or are in the process of obtaining, FSC or ISO 14,000 certification.5
5. The Forest Stewardship Council (FSC) certification is a voluntary procedure in which the ecological,
economic and social aspects of forest management are evaluated against a global set of 10 principles and criteria for good forest stewardship. Forest enterprises that meet these criteria are awarded with a certificate. The International Organization for Standardization (ISO) 14000 standard is primarily concerned with "environmental management" meaning the certified organization tries to minimize harmful effects on the environment caused by its activities.

ENV/EPOC/GF/SD/RD(2004)2/FINAL
13
Box 1. Forestry promotion policy based on Law No. 15939
This policy adopted in 1987 had the following main features:
• Forestry growth to be based on projects subject to approval by Forestry Bureau (Dirección Forestal), designated as the National Forestry Authority. Eligibility criteria include location, tree species and planting density, among others.
• The regulation promotes forests to be established on “Forestry Priority Soils” (location criterion). These soils include 3.6 million ha of low agricultural productivity and/or high susceptibility to erosion or degradation, located in certain areas of the country with potential to develop timber production, transport and manufacturing centres. A package of financial incentives was offered to prospect investors, including:
land property tax exemption for all planted areas;
permanent exemption of income tax and other taxes and levies;
12-year exemption of any new taxes or levies to be created;
a cash subsidy equivalent to 50% of estimated plantation cost;
duty free imports of goods to be applied to approved projects;
soft credits for planting, with a grace period of 10 years for both principal and interests;
corporations allowed to buy land if forestry is their main activity (otherwise, land property is nominative in Uruguay);
forest ownership is separated from land ownership, which provides flexibility for using financial mechanisms; a later regulation allowed land rental contracts for up to 30 years for forestry activity (for other purposes, maximum legal is 15 years);
investors allowed to deduct up to 30% of their income tax payments from other activities for investments made in forestry projects; similar benefit is provided to buyers of Uruguay’s external debt bonds.
• Prohibition of harvesting native forests, with the exception of wood supply for farms, and properly justified cases, subject to approval by Forestry Bureau.
• Enforcement of a number of fire and pest prevention measures.
• “Climate benefits” of forests to be promoted recognized in introductory message of the Executive Power to Parliament, and in article 4 of Law No. 15939. A study made by JICA (1991) estimated that planting 100,000 ha over the period 1991-95 would offset approximately 50% of CO2 emissions by burning fossil fuels in Uruguay.

ENV/EPOC/GF/SD/RD(2004)2/FINAL
14
Figure 2. Evolution of commercial forest plantation area in Uruguay during the period from 1975 to 2002, and projected business-as-usual new plantations until 2010
1975 1980 1985 1990 1995 2000 2005 2010
Year
0
100
200
300
400
500
600
700
800
900
Pla
ntat
ion
For
est A
rea
(tho
usan
d ha
)
Law No. 15939
According to Forestry Bureau projections, timber harvest from plantations is expected to reach 10 million m3/year by 2008. The annual planting rate has been decreasing during the last few years, and the announced gradual suppression of government subsidy will probably reduce it further. A plausible scenario is to reach an area of 800 thousand ha by 2010, with a timber harvest of 18-20 million m3/year by 2020. Given the current species composition, rotation length and management systems 59% of the annual production are used as pulpwood, whereas 11 and 22% constitutes high and low grade saw-logs/veneer-logs, respectively (van Hoff, 2001).
Forestry development has already had a very positive socio-economic impact. According to Ramos and Cabrera (2001), 3,000 new jobs were created in the 1990's, and this figure is expected to rise to 18 thousand by 2020. State revenues from taxes during the period 1990-2020 would average US$ 22 million/year. Gross sectoral product is expected to increase from US$ 100 million/year between 1990 and 1999 to US$ 600 million/yr by 2015. These authors estimated that net present value of 1990-2020 cash flow, discounted at 10% annual rate, would amount to US$ 907 million, compared to an estimated US$ 177 million that would have been generated by the displaced livestock production. These figures consider all production phases from planting through first processing.
3.4 Energy sector
Energy consumption has increased from 1700 ktoe/year to 2500 ktoe/year over the last 35 years (Figure 3), with electricity consumption exhibiting the highest growth rate. During the period 1965-2000, electricity use in Uruguay rose almost continually from 119 to 552 ktoe/year, which is equivalent to an annual rate of 4.5 %. Much of the increase occurred during the last 15 years and was strongly linked to strong economic growth and relatively low oil prices. The economic recession that Uruguay has experienced since 1999 has led in a decrease in energy use. Current level of per capita energy use in Uruguay (0.8 toe/person) is only about one half that for neighboring countries.

ENV/EPOC/GF/SD/RD(2004)2/FINAL
15
Figure 3 also shows a decoupling between GDP and energy consumption in Uruguay. During the period 1965-2000, GDP more than doubled while energy consumption increased by only 50%. As a result, the energy intensity of the economy, measured as the amount of energy consumed per unit of GDP, dropped by 32%. This trend is related to Uruguay’s economic development increasing reliance on the service sector. For this reason, Uruguay is a unique developing country, with a relatively low energy use considering its income level and its temperate climate.
Figure 3. Relative evolution of GDP and total energy consumption in Uruguay (Uruguay, 2000)
1960 1970 1980 1990 2000 2010
Year
0
50
100
150
200
250
GD
P o
r en
erg
y co
nsu
mp
tio
n (
1965
=100
)
Energy
GDP
Energy/GDP
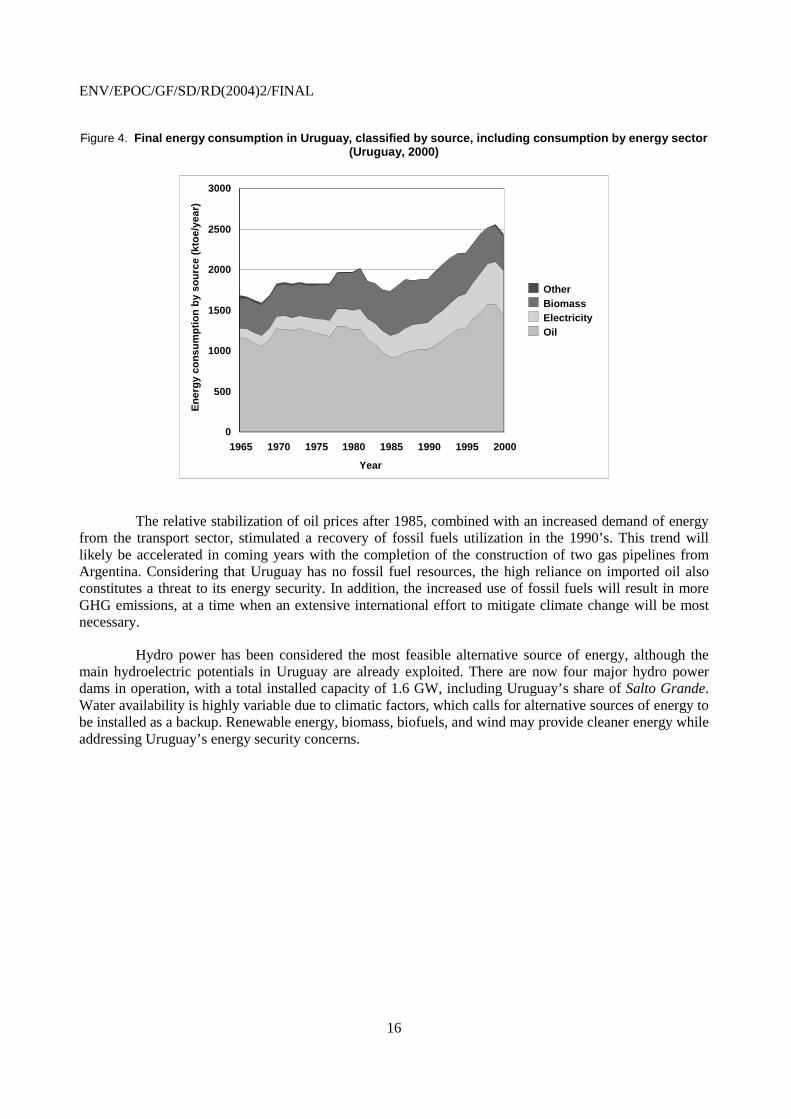
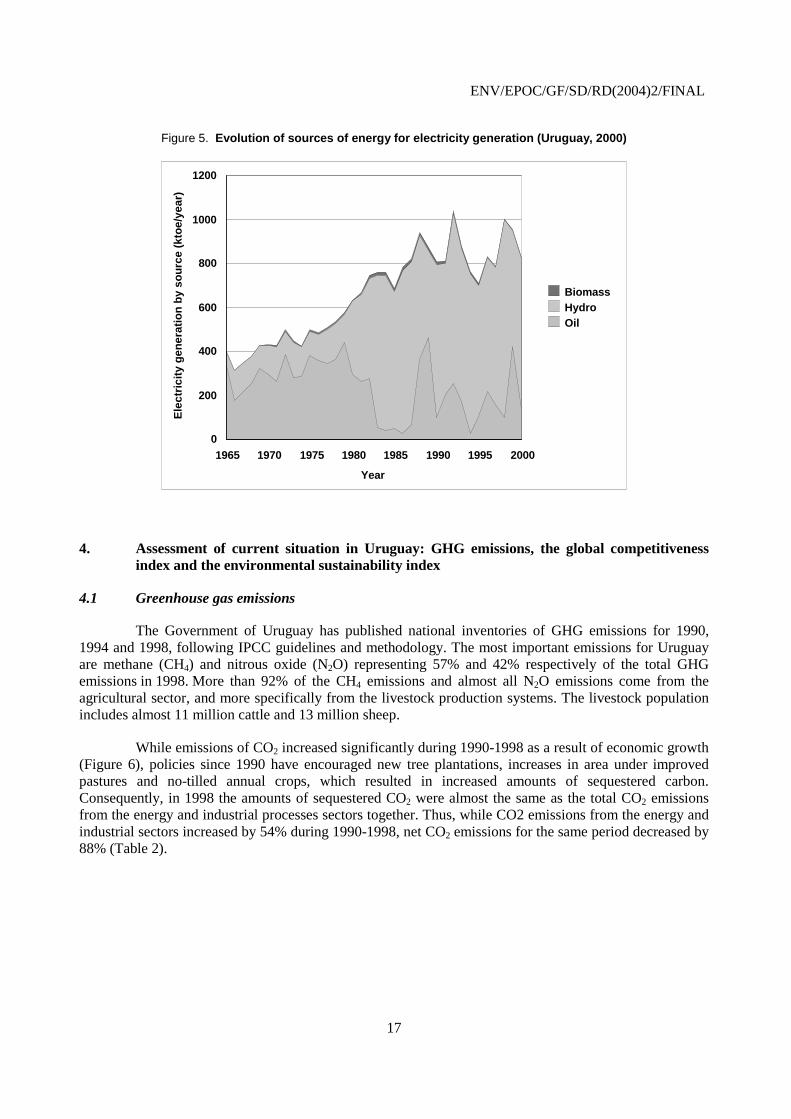
Oil has traditionally been the dominant source of consumer energy, providing more than half of the total final energy (Figure 4). After the oil crises of the 1970’s and 1980’s, the relative importance of fossil fuels in the energy matrix decreased, mainly due to the construction of Salto Grande dam on Uruguay river, a large binational project shared with Argentina, with 1.9 GW installed capacity, that started operating in 1979 (Figure 5). Substitution of fossil fuels by firewood in the industrial and, to a lesser extent, in the residential sector also contributed to the decline in fossil fuel use. The use of biomass peaked in 1985, reaching 30% of total final energy.
ENV/EPOC/GF/SD/RD(2004)2/FINAL
16
Figure 4. Final energy consumption in Uruguay, classified by source, including consumption by energy sector (Uruguay, 2000)
1965 1970 1975 1980 1985 1990 1995 2000
Year
0
500
1000
1500
2000
2500
3000E
ner
gy
con
sum
pti
on
by
sou
rce
(kto
e/ye
ar)
OtherBiomassElectricityOil
The relative stabilization of oil prices after 1985, combined with an increased demand of energy
from the transport sector, stimulated a recovery of fossil fuels utilization in the 1990’s. This trend will likely be accelerated in coming years with the completion of the construction of two gas pipelines from Argentina. Considering that Uruguay has no fossil fuel resources, the high reliance on imported oil also constitutes a threat to its energy security. In addition, the increased use of fossil fuels will result in more GHG emissions, at a time when an extensive international effort to mitigate climate change will be most necessary.
Hydro power has been considered the most feasible alternative source of energy, although the main hydroelectric potentials in Uruguay are already exploited. There are now four major hydro power dams in operation, with a total installed capacity of 1.6 GW, including Uruguay’s share of Salto Grande. Water availability is highly variable due to climatic factors, which calls for alternative sources of energy to be installed as a backup. Renewable energy, biomass, biofuels, and wind may provide cleaner energy while addressing Uruguay’s energy security concerns.
ENV/EPOC/GF/SD/RD(2004)2/FINAL
17
Figure 5. Evolution of sources of energy for electricity generation (Uruguay, 2000)
1965 1970 1975 1980 1985 1990 1995 2000
Year
0
200
400
600
800
1000
1200E
lect
rici
ty g
ener
atio
n b
y so
urc
e (k
toe/
year
)
BiomassHydroOil
4. Assessment of current situation in Uruguay: GHG emissions, the global competitiveness index and the environmental sustainability index
4.1 Greenhouse gas emissions
The Government of Uruguay has published national inventories of GHG emissions for 1990, 1994 and 1998, following IPCC guidelines and methodology. The most important emissions for Uruguay are methane (CH4) and nitrous oxide (N2O) representing 57% and 42% respectively of the total GHG emissions in 1998. More than 92% of the CH4 emissions and almost all N2O emissions come from the agricultural sector, and more specifically from the livestock production systems. The livestock population includes almost 11 million cattle and 13 million sheep.
While emissions of CO2 increased significantly during 1990-1998 as a result of economic growth (Figure 6), policies since 1990 have encouraged new tree plantations, increases in area under improved pastures and no-tilled annual crops, which resulted in increased amounts of sequestered carbon. Consequently, in 1998 the amounts of sequestered CO2 were almost the same as the total CO2 emissions from the energy and industrial processes sectors together. Thus, while CO2 emissions from the energy and industrial sectors increased by 54% during 1990-1998, net CO2 emissions for the same period decreased by 88% (Table 2).

ENV/EPOC/GF/SD/RD(2004)2/FINAL
18
Table 2. GHG emissions for 1990, 1994 and 1998
a) CO2, CH4 and N2O emissions in kTon/year
Sources and Sinks CO2 CH4 N2O(kTon gas/year) (kTon gas/year) (kTon gas/year)
1990 1994 1998 1990 1994 1998 1990 1994 1998Energy 3608 3930 5384 0.71 0.7 0.89 0.06 0.08 0.11Industrial Processes 230 279 518Agriculture 612 678 698 31.5 32.4 37.5Land Use Change and Forestry 1972 -865 -3945Changes in soil Carbon content -3357 -3808 -1662Waste 51.82 58.13 60.13 0.22 0.22 0.22
Total 2453 -464 295 665 737 759 31.8 32.5 37.6
b) CO2, CH4 and N2O emissions in kTon/year CO2-equivalent
1990 1994 1998 GWP 1990 1994 1998 1990 1994 1998
CO2 2,453 -464 295 1 2,453 -464 295 9.3 -1.9 1.1
CH4 665 737 759 21 13,955 15,473 15,939 53.1 61.7 57.1
N2O 32 32 38 310 9,852 10,069 11,659 37.5 40.1 41.8
26,260 25,078 27,894 100 100 100
Agriculture is the sector responsible for most of the country’s GHG emissions. At the same time, agriculture and forestry have shown to be the sectors with the strongest ability to reduce net emissions through CO2 sequestration. The structural changes resulting from recent economic difficulties offer the opportunity for considering new alternatives for development programs, including those that reflect changes in traditional paradigms. In this sense Uruguay can offer a number of environmental services of global relevance that can also contribute to the country’s development. The possibility of increasing the use of renewable energy sources is also interesting as the recent increase in GHG emissions mainly came from increased use of energy from fossil fuels.

ENV/EPOC/GF/SD/RD(2004)2/FINAL
19
Figure 6. Uruguay’s GDP and CO2 emissions from the energy and industrial processes sectors
Year
1988 1990 1992 1994 1996 1998 2000
GD
P (
mill
ion
US
$)
0
5000
10000
15000
20000
25000
30000
To
tal CO
2 Em
ission
s (kTo
n g
as)
0
1000
2000
3000
4000
5000
6000
7000
GDP (million US $)Total CO2 Emissions
4.2 Global Competitiveness Index
The Global Competitiveness Report 2002-2003, developed by the World Economic Forum (2001-2002), has examined the growth prospects of about 80 countries and compared strengths and weaknesses of national economies. The instruments it uses include the Growth Competitiveness Index (GCI) and Microeconomic Competitiveness Index (MCI).
The calculation of the GCI index takes into consideration three components: a Technology Index (TI), a Public Institutions Index (PII), and a Macroeconomic Environment Index (MEI). Through technological progress countries may achieve a higher standard of living, for example through a higher rate of capital accumulation. However this does not guarantee a continuous high economic growth. Public institutions play a crucial role in ensuring the protection of property rights, the objective resolution of contract and other legal disputes, in improving the efficiency of government spending, operations, and transparency at all levels. In the absence of good governance, the division of labor is likely to be impeded and the allocation of resources inefficient. Monetary and fiscal policies, combined with the stability of financial institutions, have important effects on short-term economic dynamics as well as on the long-term capacity to grow.
In the case of most developed countries, the TI, PII, and MEI show similar rank values. However, in the case of Uruguay there are important variations among them: TI rank is 50, PII is 20 and MEI is 73. These results indicate the unbalanced situation in the country with respect to its general policies and programs, and also point at the sectors where efforts should be enhanced to ensure sustainable development. The PII is in the same range as countries like Japan, United States and Sweden. The country’s efforts should therefore be oriented to improve technology and to establish better economic and financial policies.
Interestingly, the results also show that the Argentinean crisis – which made Argentina drop from rank 43 to 63 in the GCI in only one year - was not strongly felt in Uruguay, at least at the time when the index was calculated (Table 3). However, it is very likely that Uruguay will drop in ranking in 2003. Further, the results reveal an important deterioration of the MCI which made Uruguay go from rank 42 to 65 in one year.

ENV/EPOC/GF/SD/RD(2004)2/FINAL
20
Table 3. Growth Competitiveness Index and the Microeconomic Competitiveness Index (2002) for the first ten ranked countries, for Uruguay and for six other countries in South America.
Growth Competitiveness Index (GCI) Rankings Microeconomic Competitiveness Index (MCI) Rankings
Country GCI Ranking GCI Ranking Country MCI Ranking MCI Ranking
2002 2001 2002 2001
United States 1 2 United States 1 2
Finland 2 1 Finland 2 1
Taiwan 3 7 United Kingdom 3 7
Singapore 4 4 Germany 4 4
Sweden 5 9 Switzerland 5 5
Switzerland 6 15 Sweden 6 6
Australia 7 5 Netherlands 7 3
Canada 8 3 Denmark 8 8
Norway 9 6 Singapore 9 9
Denmark 10 14 Canada 10 12
Chile 20 27 Chile 31 29
Uruguay 42 46 Brazil 33 30
Brazil 46 44 Uruguay 62 45
Argentina 63 49 Argentina 65 54
Paraguay 72 72 Paraguay 76 70
Ecuador 73 68 Ecuador 77 72
Bolivia 78 67 Bolivia 79 75
4.3 Environmental Sustainability Index
The Environmental Sustainability Index (ESI) was developed by the Universities of Yale and Columbia (USA) and measures overall progress towards environmental sustainability. The ESI scores are based upon a set of 20 core “indicators”, each of which combines two to eight variables. These indicators are grouped into five categories:
• environmental systems;
• environmental stresses;
• human vulnerability to environmental risks;
• a society's institutional capacity to respond to environmental threats; and
• a nation's stewardship of the shared resources of the global commons.
Among the 20 indicators that comprise the ESI are factors such as urban air quality, water, and the stingency of environmental regulation. The study builds on 68 underlying databases, representing the most comprehensive publicly available collection of environmental indicators.
Just as the GDP provides a broad-gauge indicator of economic success, the ESI expresses a country’s capacity to sustain environmental strength by a single number ranging from 0 to100. Much like a cumulative grade point average for the environment, this number provides a comprehensive snapshot of a country’s likely environmental quality over the next generation or two. The ESI permits cross-national

ENV/EPOC/GF/SD/RD(2004)2/FINAL
21
comparisons of environmental progress in a systematic and quantitative fashion. During the World Economical Forum in 2002, results of ESI ranks were presented for 142 countries and Uruguay occupied the sixth place with 66.0 (Table 4).
An important characteristic of the ESI is that it allows posing pressing policy questions, such as: is good environmental performance always associated with economic success? The ESI suggests it is not as several countries – including developed countries - with similar GDP per capita are ranked widely apart by the ESI (e.g. Finland and Belgium). This suggests that a country’s economic status does not necessarily predict its environmental success. Uruguay is also an example of the wide differences that can be found between the economic and environmental performances: in early 2002 Uruguay was ranked 40 with regards to its GDP per capita, whereas it was ranked 6 in the ESI. These differences in rank values should help to understand which policies have been working well and which have not, and to identify opportunities for a more balanced and sustainable growth.
Table 4. Environmental Sustainability Index 2002: First 10 ranked countries
Rank Country ESI Value 1 Finland 73.9 2 Norway 73.0 3 Sweden 72.6 4 Canada 70.6 5 Switzerland 66.5 6 Uruguay 66.0 7 Austria 64.2 8 Iceland 63.9 9 Costa Rica 63.2 10 Latvia 63.0
5. Impacts of policies, plans and regulations on the climate change issue
Climate change has been increasingly considered in Uruguay policy processes. Up to the 1980’s, a number of programmes, while not explicitly addressing to climate change, resulted in land use changes that enhanced carbon sequestration. In the late 1980s already, a transition towards fuller integration of climate change issues in the political and development agendas was felt. Today, many laws, decrees, programs, plans and regulations explicitly include the consideration of climate change related issues.6
Early government actions (laws, regulations, programs) in the agriculture and livestock sector were oriented at improving the existing natural grasslands, the backbone of the livestock production. The most common means were tax exemptions and low-interest credit programs for introducing legumes, grasses and phosphate fertilizers. These actions had significant impacts on the areas with improved pastures, which doubled between the 1950s and the late 1970s. However, as discussed earlier, these actions were not followed by similar increases in livestock productivity, mainly due to economic reasons. For example, the prices that farmers received for beef during the early 1970s were less than 60% of the corresponding international market price. Consequently farmers were not stimulated to invest in technological improvements and the new improved pastures were often managed in ways that did not optimize their stability and long term productivity. Also, during the 1970s and until the mid 1980s, the total area of improved pastures remained about the same.
Although livestock productivity did not change substantially, government plans and regulations had an important impact on the increased capacity of the agricultural soils to sequester carbon. The
6. Annex 2 includes a list and short description of the most relevant programs, laws and regulations of each
one of these three stages.

ENV/EPOC/GF/SD/RD(2004)2/FINAL
22
increase in the area under sown pastures (mixtures of grasses and legumes), and the improvement of large areas of natural grasslands (introducing legume species and phosphorous fertilizers) raised the soil nitrogen content increasing the soil carbon levels in the previously nitrogen-limited grassland soils. From the perspective of GHG emissions these early stages were characterized by a) an increases in the amount of carbon sequestered in the soils mainly due to an increase in the nitrogen content of the grasslands soils; and b) small or no changes in the methane emissions from livestock since the beef and wool productivity stagnated between the 1960s and the early 1980s.
With regard to annual crop production, the early national policies were aimed at substituting imports through low interest loans and other incentives. Consequently, the area of most crops increased consistently since the early 1900s and reached a maximum in the late 1970s. As discussed earlier, farmers typically used low technology packages (few or no fertilizers, low-yielding varieties). Although the vast majority of the farmers involved in annual crop production were also livestock producers, they used to manage each production type in separate areas of their farms. It was therefore common to have fields that were sown to annual crops year after year, and once in a while the fields were left in fallow. Finally, all the tillage was done with conventional equipment, and there was a tendency to over till the fields in order to eliminate competing weeds and to create fine seedbeds. Until the late 1980s, when rural credit was conditioned to soil conservation practices, no actions were taken to prevent or avoid soil erosion or degradation.
The combination of conventional tillage, continuous crops in the same fields, and low crop yields with consequent low residues returning to the soils had devastating consequences for the soils. A study conducted by Baethgen et al. (2001) for the World Bank estimated that by the 1980s soils in Uruguay had probably lost 50-60% of their original carbon content due to these agronomic practices. This period was thus characterized by strongly negative soil carbon balances, and soils acted as net sources of CO2. More recently, at during the 1980s and 1999s, a combination of improvements in internal prices of livestock products and opening of the regional and international markets resulted in a rapid increase in the area of improved pastures.
Considering the whole effect of early and recent actions on the pastures, the total area of improved and sown pastures during 1966-2000 increased at an average annual rate of 35,000 ha/year. However, the annual rate for the last 10 years was more than 3 times higher: 117,000 ha/year. With regards to annual crop production, during the period 1966-2000 the total sown area decreased at an annual rate of 14 thousand ha/year, and in 2000 the total area was less than half that of the early 1970s. In addition, the Soil Conservation Law passed in 1982, allowed the national bank (Banco de la República) to condition its rural credit program to the application of soil conservationist technologies. This resulted in a wide application of soil management techniques aimed at avoiding and/or reverting soil degradation and erosion, as well as at reducing soil organic matter decomposition, which also increased soil carbon levels. For example, the increase in annual crop areas with reduced tillage (up to early 1990s) and with no till (since mid 1990s) resulted in increases in carbon sequestered in soils since the 1990s at an estimated rate of 200 – 600 kg C / ha per year or 700 – 2,200 kg CO2 / ha per year (Figure 7), where the estimated range depends on the soil texture and previous land use (Baethgen et al., 2001). It should be noted that this estimated increase in CO2 sequestration is the cumulative effect of improving tillage methods and including pastures in rotation with annual crops.

ENV/EPOC/GF/SD/RD(2004)2/FINAL
23
Figure 7. Estimated changes in soil carbon content during 1970-2000 for different scenarios (combinations of soil types and previous land uses, pristine soil carbon content was approximately 5,000 g C/m2)
Source: Baethgen et al. 2001
As a result of the new improved pastures and the use of conservationist techniques of soil tillage, the estimated amount of carbon sequestered in soils during 1966-2000 increased at an average rate of 1.5 million ton C/year. Due to the recent legal actions and programs, however, the rate of soil carbon sequestration for the last 20 years was about 1.8 million ton C/year (Figure 8 and Table 5).
Figure 8. Changes in the soil carbon content due to changes in the land uses (improved pastures and no-tilled crops)
Source: Baethgen et al. 2001

ENV/EPOC/GF/SD/RD(2004)2/FINAL
24
Table 5. Annual rate of change in the soil carbon content in four periods of approximately 20 years (expressed in million ton C/year and in million ton CO2 equivalent/year)
Source: Baethgen et al. 2001
6. Future options for mitigation in agriculture and forestry
The increase in the area of improved pastures, the decrease in the area of annual crops, and the use of better tillage practices in the remaining area of crop production have already resulted in increases in the soil carbon sequestration that compensated the total CO2 emissions from the energy and industrial processes sectors. In addition, the large growth of forest plantation area after 1990, combined with a very high tree biomass productivity and relatively low initial soil carbon contents, resulted in significant removal of atmospheric CO2. A study by Uruguay’s Ministry of Environment (Uruguay, 2002a) estimated that the cumulative net carbon sequestration7 by forestry during the period 1988-2000 was 27.4 Mt CO2. The same study projected an additional net sequestration of 108.6 Mt CO2 during the period 2001-2012.
The vigorous forestry development achieved in the last few years will have climate change implications beyond the removal of CO2 from the atmosphere. One of them is the creation of a new, abundant and clean source of energy. Further, residues from forest harvesting and wood manufacturing could be used for heat and power generation, and eventually, for biofuel production, offsetting GHG emissions from fossil fuel burning. In addition, the large timber production expected for coming years has the potential to induce cultural changes related with construction materials. Construction in Uruguay is largely based on energy-intensive materials, such as bricks, cement, metals and plastic. Availability of wood products of acceptable quality, combined with development of wood manufacturing capacity, may result in an increased use of wood as a construction material. This will extend the time residence of carbon in wood products and will have a positive impact on energy efficiency due to higher thermal insulation and lower energy use in production of wood, as compared to currently used materials. Also, the use of locally produced wood products would reduce emissions associated with international freight.
Total carbon sequestration, pooling all land-based activities (grasslands, agricultural soils and forests) amounts at present to an estimated 14-15 Mt CO2 per year, or about 2.5 times total annual CO2 emissions in the country. Considering all GHGs, carbon sequestration offsets approximately 50% of emissions. An ambitious challenge now is to identify activities that would contribute to the sustainable development of the country, and at the same time increase the country’s ability to contribute to net mitigation of climate change. The next sections explore both options, detailing activities that should be considered as components of an integrated approach, rather than individual options.
7. The net carbon sequestration is the stock change minus additional emissions due to site preparation and
additional use of fossil fuels.

ENV/EPOC/GF/SD/RD(2004)2/FINAL
25
6.1 Future options for forestry
6.1.1 Carbon sequestration by forest plantations
The current forestry area (0.7 million ha) covers only about one fifth of total area of soils designated for forestry priority (3.6 million ha). These soils have relatively low agricultural productivity, and to some extent have been subjected to management practices, such as overgrazing and tillage, leading to degradation and erosion processes. A large part of the remaining forestry priority area (2.9 million ha) is suitable for implementing commercially viable forestry projects. Forestry policy has recently been modified. Plantation subsidy, one of the key incentives offered by the government, will be gradually suppressed, starting in 2004, until its complete elimination in 2007. On the one hand, the phasing out of subsidies will likely result in reduced establishment of new plantations. On the other hand, prospects for carbon markets may act as an incentive for attracting new investors, with potential to offset the negative consequences of subsidy suppression.
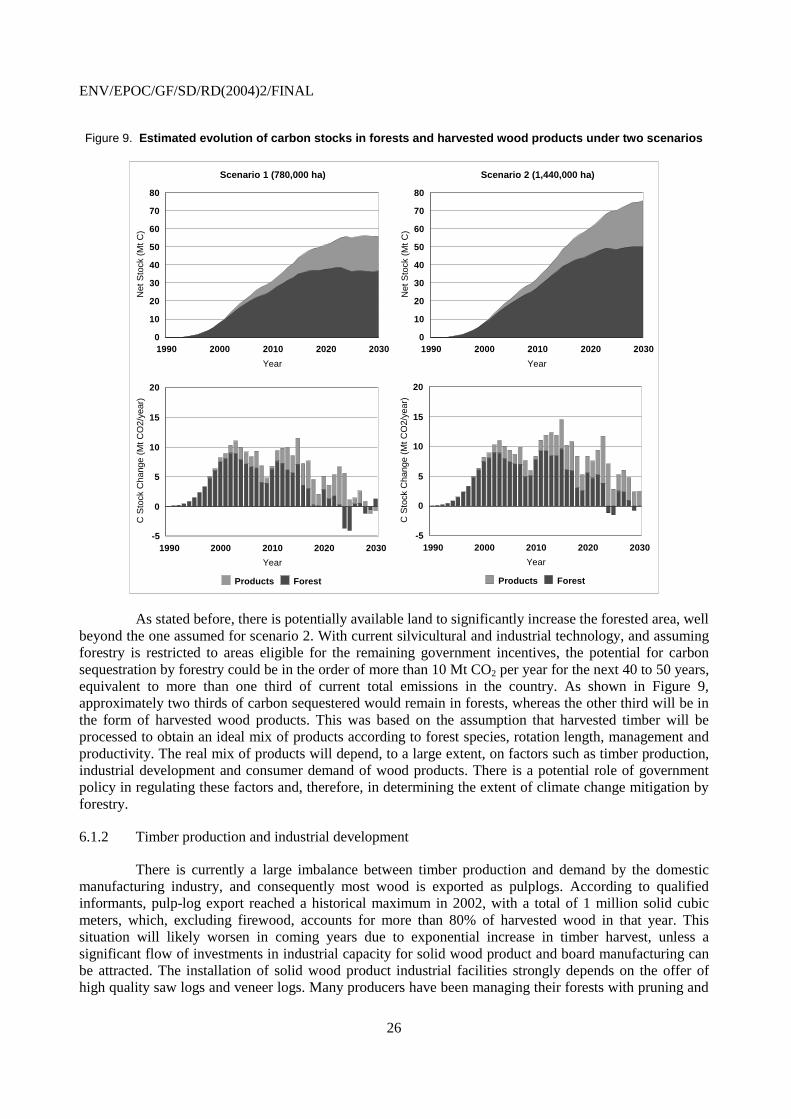
For this study, the extent of carbon sequestration by plantation forests was estimated for two scenarios: first, a conservative scenario (1), which is characterized by a virtual termination of afforestation with plantation areas reaching 780 thousand ha by 2030; and second, an alternative scenario (2), which represents the case in which carbon finance induces a flow of investment into new plantations, with forest areas reaching 1,440 thousand ha in 2030. Estimations were based on the model developed by Loza-Balbuena (2002), modified to consider: a) soil and litter carbon stocks; b) harvested wood products pool; c) additional CO2 emissions due to fossil fuel burning; and d) reduction of methane and nitrous oxide emissions due to displacement of cattle production. Carbon sequestration during 1990-2030 was estimated at 207 and 280 Mt CO2 for scenarios 1 and 2, respectively. This would be equivalent to offsetting 17% and 23%, respectively, of total GHG emissions in Uruguay during that same period, assuming there is no increase in those emissions with time. Results of the simulations are shown in Figure 9.
ENV/EPOC/GF/SD/RD(2004)2/FINAL
26
Figure 9. Estimated evolution of carbon stocks in forests and harvested wood products under two scenarios
1990 2000 2010 2020 2030
Year
0
10
20
30
40
50
60
70
80
Net
Sto
ck (
Mt C
)
Scenario 1 (780,000 ha)
1990 2000 2010 2020 2030
Year
0
10
20
30
40
50
60
70
80
Net
Sto
ck (
Mt C
)
Scenario 2 (1,440,000 ha)
1990 2000 2010 2020 2030
Year
-5
0
5
10
15
20
C S
tock
Cha
nge
(Mt C
O2/
year
)
Products Forest
1990 2000 2010 2020 2030
Year
-5
0
5
10
15
20
C S
tock
Cha
nge
(Mt C
O2/
year
)
Products Forest
As stated before, there is potentially available land to significantly increase the forested area, well beyond the one assumed for scenario 2. With current silvicultural and industrial technology, and assuming forestry is restricted to areas eligible for the remaining government incentives, the potential for carbon sequestration by forestry could be in the order of more than 10 Mt CO2 per year for the next 40 to 50 years, equivalent to more than one third of current total emissions in the country. As shown in Figure 9, approximately two thirds of carbon sequestered would remain in forests, whereas the other third will be in the form of harvested wood products. This was based on the assumption that harvested timber will be processed to obtain an ideal mix of products according to forest species, rotation length, management and productivity. The real mix of products will depend, to a large extent, on factors such as timber production, industrial development and consumer demand of wood products. There is a potential role of government policy in regulating these factors and, therefore, in determining the extent of climate change mitigation by forestry.
6.1.2 Timber production and industrial development
There is currently a large imbalance between timber production and demand by the domestic manufacturing industry, and consequently most wood is exported as pulplogs. According to qualified informants, pulp-log export reached a historical maximum in 2002, with a total of 1 million solid cubic meters, which, excluding firewood, accounts for more than 80% of harvested wood in that year. This situation will likely worsen in coming years due to exponential increase in timber harvest, unless a significant flow of investments in industrial capacity for solid wood product and board manufacturing can be attracted. The installation of solid wood product industrial facilities strongly depends on the offer of high quality saw logs and veneer logs. Many producers have been managing their forests with pruning and
ENV/EPOC/GF/SD/RD(2004)2/FINAL
27
thinning to obtain knot-free, high diameter logs, suitable for high-value wood products. The availability of these logs is now becoming significant in volume. There are already plans for creating new industrial capacity in the coming years. However, for the sake of both economic development and climate change mitigation, it would be necessary to promote a much more aggressive industrial investment flow, including manufacturing of products using sawmill residues.
To pursue such large industrial investment, a much more rapid increase in the volume of high quality logs would be necessary. There are currently no specific policies in place to promote forest management practices aimed at that objective. One major obstacle is the inexistence of long-term (i.e. 20+ year) loans that would fit biological with financial cycles. State-owned Banco de la República could consider implementing such loans. Alternatively, a government subsidy, similar to the former plantation subsidy, could be implemented to promote silvicultural management practices that would result in future larger fiscal returns, along with short-term socio-economic development. There are at least two factors that could lead to greater productivities and, therefore, increased carbon sequestration rates. The first factor is the increase in spring-summer rainfall that has been occurring in the SE region of South America during the last 20 years. If permanent, this would cause large increases in net primary productivity of the region’s ecosystems. The other factor, which can be influenced by government policy, is silvicultural technology development. Research programs in the areas of plant breeding, fertilizer use, silviculture management and forest diversification should be strengthened.
6.1.3 Consumer demand for wood products
Demand for wood products will be increasingly driven by foreign markets. The expected high availability of nationally produced wood provides the opportunity for stimulating demand for wood products in the local market, which would bring about positive contributions to the global climate change mitigation effort and, at the same time, would have positive associated socio-economic effects. Use of wood for structural rather than just decorative components of home construction should be a major driving force for increased demand. The major challenge for achieving this will be to break deep-rooted cultural barriers related to the absence of natural suitable wood resources in Uruguay, and to the fact that migrants, who originally made up more than 90% of the country’s population came from sites in Spain, Italy and other places, where wood was not used as a construction material. Two components of cultural barriers against use of wood in homes are the generalized perception that wood construction is of poor quality and short-lived; and concerns about the risk of home fires. Policies for increasing use of wood should thus aim at breaking those barriers, and be designed to produce significant results in the long run.
One step towards this long-term objective would involve the use of wood to substitute for cement, bricks and metals, for road signaling and fencing, bridges, public walkways and playgrounds. Wood use could also be encouraged for construction of public buildings and of state-promoted homes. Also, the use of wood in private homes could be encouraged by means of specific policies addressing special conditions for mortgages and fire insurance. Education and research should be two key components of any policies promoting the use of wood in construction and other uses of long-life products. Universities and technical schools should be encouraged to emphasize the benefits of wood materials in their teaching and research programs. A government promoted system for standardization of wood products should be implemented. Last, but not least, fire prevention should start being included in primary schools and general public education programs.

ENV/EPOC/GF/SD/RD(2004)2/FINAL
28
6.2 Future options for agriculture
6.2.1 Livestock production systems
A recent study conducted by the World Bank (Rosegrant et al. 2001) describes the trends in meat consumption during the last few decades as a “revolution.” The report states that the magnitude of changes occurring in the developing world in the last 20-30 years indicate an extraordinary dietary change for the emerging middle class in developing countries. Per capita meat consumption in the developed world rose from 59 kg in 1967 to 78 kg in 1997, while it more than doubled in the developing world, from 11 kg in 1967 to 24 kg in 1997. Rosegrant et al. (2001) also studied the projected demand for meat during the next two decades, and estimated that it will rise by 92% in the developing countries, led by Asia and Latin America. It is expected that China alone will account for more than 40% of additional meat demand worldwide. The report also states that the projected international meat trade will expand tremendously in the next 20 years. The United States, Latin America, and the member countries of the European Union are expected to be the three main meat exporters by 2020, and all will experience significant increases in the value of their meat exports. For example the projected Latin American meat exports will expand by 80% by 2020.
These results suggest that Uruguay, a net beef exporter, will confront a scenario with good opportunities to expand its meat production and trade during the next 20 years. Expanding beef production will require maintaining or even accelerating the current rates of pasture improvement (currently 117,000 ha per year of new improved pastures are sown). Therefore, this favorable future scenario alone should guarantee an improvement of the carbon sequestration situation in pastures. As discussed earlier the changes in land use during the last 20 years resulted in net carbon sequestration rates of 6.6 million tons CO2/year. This figure is the result of simultaneous changes in the areas under improved pastures, natural grasslands and annual crops, some resulting in increases and some resulting in decreases of the soil carbon content. In order to study possible responses of the livestock production sector to this growth in meat demand, the in-depth study defines a possible scenario by 2020 of doubling the area of improved pastures (124, thousand ha per year, compared to 117, thousand ha per year of the last 10 years). This doubling of improved pasture was estimated as if it was to be done at the expense of natural grasslands. It should be noted that from the carbon balance stand point this is a very conservative estimation, since the carbon content of soils under natural grasslands is higher than for example of soils under annual crops. The estimated increase in improved pastures would result in net carbon sequestration rates of 5.02 million CO2 tons/year (compared to the estimated 6.6 ton CO2 / year for the period 1980-2000).
The increased area of improved pastures would also result in a higher carrying capacity of the land and a new composition of the national herd. It should be noted that the dairy production in Uruguay is currently quite intensive, and therefore no major changes were expected for the next 20 years. However, major changes are expected in the beef and wool sub-sectors. The expected new herd composition will result from an increase in bovines of more than 30%, and of sheep of 39%. Since the diet of a portion of the national herd would improve given the increases in improved pastures, the scenario also included better productivity indexes (higher birth rates, weaning rates, earlier average slaughtering age, etc.). Thus, livestock production was estimated to be 70% higher than the current production by 2020.8
However, higher livestock populations would also result in higher methane emissions. In order to estimate the increased methane emissions, current emission factors (in kg CH4/head per year) for each animal category were used. Given 30% more cattle and 40% more sheep, methane emissions would increase by 64,700 ton/year. Thus, the projected changes in improved pastures, the consequent increase in
8. These estimates are derived from discussions with experts from the Ministry of Agriculture of Uruguay
(M. Methol and J. Peyrou, OPYPA, MAF).

ENV/EPOC/GF/SD/RD(2004)2/FINAL
29
the carrying capacity and the new herd composition would allow for a growth in 70% in livestock production, but only a 10% increase in methane emissions. Using the IPCC global warming potential for methane (56 times higher than CO2) the increased emissions of methane for the improved pasture scenario is equivalent to 3.6 million Ton CO2/year. The net CO2 balance after subtracting the carbon sequestered by the new improved pastures is negative by about 1.4 million Ton CO2/year (Table 6).
In addition, the level of methane emissions from ruminants is mainly dependent on the quality of their diet: the lower the quality the higher the amount of produced methane. The animal age also affects the methane emission level: usually the younger and more efficient animals produce less methane per kg of live weight than the older ones. The 2020 scenario for improved pasture would lead to a better ruminant diet and a higher proportion of younger animals in the national herd. Therefore, it is reasonable to assume that the emission factor (CH4 per head per year) in the new scenario would be lower than currently. Presently, there are no measured values of methane emissions from ruminants fed with different types of pastures. A new research project is currently being conducted by INIA (Uruguay) and EPA (USA) to measure these emissions. Table 6 shows that if the emission factor of cattle and sheep in the new scenario were reduced by 5% or 10%, the new CO2 balance would be a net sequestration of 3.15 million and 4.91 Ton CO2/year, respectively.
Table 6. Estimated CO2 balance for a doubling in the area under improved pastures by 2020 with current CH4 emission factor and with 5% and 10% decrease
Note: a negative CO2 balance indicates net sequestration.
A final note should be made regarding the impact of improved pastures on the soil carbon balances: the expected changes in soil carbon due to the increase in the area of new pastures were calculated with current pasture composition. The changes in soil carbon under improved pastures depend on the botanical composition and on the persistence of the pastures. As discussed in section 8.1.1, pastures have been managed in ways that do not optimize their persistence due to unbalanced botanical composition (i.e., legumes tend to disappear after the second year). It can reasonably be assumed that in the next 20 years research will come up with better technologies and better adapted pastures and farmers will improve pasture management. Therefore, it can be expected that the amount of carbon in soils under improved pastures will also increase. Assuming that the newly improved pastures result in a 5% higher uptake of carbon in the soil than under current pastures, the new CO2 balance for the national livestock production system would result in net sequestration of 5 million Ton CO2/year.
The results of this exercise suggest the direction in which future policies and development plans should be aimed. If the World Bank’s predictions are correct, and world meat demand increases in the next 20 years, it is logical to expect that the market will stimulate farmers to improve the productivity of their herds. Therefore, the area of improved pastures is likely to increase without any governmental actions. However, the government can undertake policy measures in two areas, which can result in increased net sequestration. On the one hand, research should be aimed at technologies improving the productivity and

ENV/EPOC/GF/SD/RD(2004)2/FINAL
30
persistence of the sown pastures. This would improve livestock productivity and also increase the amount of carbon stored in the soils. On the other hand, actions should be taken regarding methane emissions. First, Uruguay needs sufficient national data on emissions from different animal species fed with different diets. Second, technologies should be explored that reduce the amount of methane emitted by ruminants.
6.2.2 Annual crops
According to the study conducted by the World Bank discussed earlier (Rosegrant et al. 2001), global cereal demand is also expected to grow within the next 20 years: 49% in the developing and 13 % in the developed world. This increase in cereal production is expected to be due to higher yields, since cereal areas are expected to grow only in Sub-Saharan Africa and Latin America. An addition, soybean production is expected to grow in Latin America by more than 80% in next two decades as a result of increases in Brazil and Argentina. The World Bank study points at MERCOSUR as one of the regions with best potential to increase its grain production. Given the expected rise in demand, it is estimated that the annual crop area will increase. The arable land in Uruguay is approximately 3.5 million hectares. Historically, the maximum area of the country sown with annual crops has been approximately 1.4 million, indicating a large potential for growth. It is also expected that the mean yields obtained by farmers will continue to grow, thanks to the application of new technologies, including the expansion of irrigated crop areas.
While increasing the annual crop area, it is important to ensure the conservation of soils. Development plans and legal actions must aim at stimulating the use of minimum or no-till practices. The characteristic mixed crop-livestock production systems of Uruguay are expected to be maintained during coming decades. Therefore, it is also expected that annual crops will alternate with sown pastures (grasses and legumes), a key condition to ensure adequate return levels of carbon and plant nutrients to the soils. The cumulative effect of applying improved technologies and increasing the area of no-till cropping systems rotating with sown pastures is expected to be higher crop yields and more sustainable production systems. At the same time, if growth in the no-tilled cropping areas is accompanied by a proportional growth in the area of sown pastures, these same actions would enhance the carbon sequestration capacity of the agricultural soils. Finally, in case of a global carbon market, these practices could also generate additional income to farmers through carbon certificate trading.
Two paths are possible to ensure an enhancement or maintenance of the carbon sequestration capacity of the agricultural soils: (a) convert as much area as possible of the croplands that are currently under conventional tillage to no-till systems, and (b) ensure that the growth in new areas of annual crops is followed by a proportional increase in the areas with sown improved pastures.
No-till practices have already been adopted in more than 30 % of agricultural areas, mainly due to economic advantages (reduced cost of production) and practical reasons (better opportunities to perform field operations on time). The Soil Conservation Law (passed in 1982) and the accompanying education campaign on preventing soil erosion were also driving factors. Further adoption of the no-till system may be stimulated by recognizing its environmental services such as carbon sequestration or biodiversity enhancement. For example, at current annual crop yield levels, the conversion of soils under conventional tillage to no-till enhances the soil carbon content by about 10%. However, increasing crop yields with improved cultivars, adequate fertility and water management would also increase the amount of residues left in the soil, and therefore the carbon content would also be higher. During the last 20 years, most crop yields have increased by 30-80%, and maize and sunflower have increased by 100-200%. It is therefore reasonable to expect that the crop yields will continue to increase, although at lower rates. In order to estimate the impact of different agricultural practices, four possible scenarios were envisioned for 2020, given a doubling of the 2000 annual crop areas (to 1.06 million ha).

ENV/EPOC/GF/SD/RD(2004)2/FINAL
31
The results shown in Table 7 indicate the importance of both, increasing the crop productivity which results in increased crop residues returning to the soil (moving from scenario 1 to scenario 2), and the importance of increasing the area under no-till systems (moving from scenario 2 to scenario 3). However, the largest impact on the ability to sequester carbon is achieved by increasing the area under improved pastures (moving from scenario 3 to 4). Adding the increased methane emissions due to changes in the national herd as discussed in the previous section will result in net CO2 sequestration of 2.37 million tons CO2/year (under current CH4 emission factors) or 4.12 million tons CO2/year (under 5% reduction of current CH4 emission factors). In addition, increasing the area under no till would have positive impacts on the whole agricultural sector. First, no-till would lead to a decline in fuel use (which would further reduce CO2 emissions), and a decline in production costs. Second, losses from soil erosion could be reduced and less sediment would drift into streams and rivers.
Table 7. Net carbon and CO2 balances for four scenarios varying in crop productivity, annual crop areas under no-till and conventional tillage, and area under improved pastures
Scenario 1 Scenario 2 Scenario 3 Scenario 4 Crop productivity as of 2000 +20% +20% +20% Annual crop areas under conventional tillage 50% 50% 25% 25% Annual crop areas under no-till 50% 50% 75% 75% Area under improved pastures as of 2000 as of 2000 as of 2000 +100% Million t C/year 0.725 -0.131 -0.264 -1.633 Million t CO2/year 2.660 -0.480 -0.966 -5.988 Note: positive values indicate net emission and negative values indicate net sequestration.
6.3 Increasing the use of renewable energy sources from agriculture and forestry
Uruguay’s economic growth during the last 40 years displayed a decreasing correlation with its energy use, although energy consumption has been rising over the last 15 years by 2.3% annually, mainly driven by a rise in electricity and diesel fuel consumption. These trends are expected to continue (Uruguay 2002b). Unlike other countries in the region, GHG emissions from fossil fuel use have been almost completely decoupled from economic growth: during the period 1965-2000 Uruguay’s economy grew by 120%, whereas CO2 emissions remained stable at 4-6 Mt CO2/year (ca. 2 t CO2/person/year), with a slight increasing trend in the last few years (Figure 10).

ENV/EPOC/GF/SD/RD(2004)2/FINAL
32
Figure 10. Evolution of fossil-fuel related CO2 emissions in Uruguay and several South American countries
1950 1960 1970 1980 1990 2000
0
50
100
150
200
250
300
350A
nn
ual
fo
ssil
fuel
CO
2 em
issi
on
s (M
t C
O2)
Argentina
Chile
Uruguay
Brasil
Bolivia
Paraguay
1950 1960 1970 1980 1990 2000
0
10
20
30
40
50
60
70
Ann
ual f
ossi
l fue
l CO
2 em
issi
ons
(Mt C
O2)
Chile
Uruguay
Bolivia
Paraguay
Source: adapted from Marland et al. 2003
Energy consumption is expected to increase in the next 12 years at a rate of at least 2% per year (Uruguay 2002b) mainly driven by the services sector, residential consumers and agri-industry (including wood manufacturing). Since hydroelectricity capacity is fully utilized, additional demand will likely be satisfied by natural gas. The government is planning to promote the construction of a new 150 MW thermal plant based on natural gas. This plant alone, when in full operation, would increase emissions by 0.8 Mt CO2/year i.e. an increase of 10% in the current emission level. Using natural gas to meet the additional demands for electricity would entail other problems besides the associated increase in GHG

ENV/EPOC/GF/SD/RD(2004)2/FINAL
33
emissions. Uruguay has already a large dependence on foreign energy sources (60% of the total energy is imported), which would worsen in case of an extensive use of natural gas. Also gas supply may be erratic with frequent shortages in winter months, precisely when demand is highest. Finally, centralized electricity generation based on large thermal plants is inefficient and may cause negative environmental impacts. Government policy should therefore aim at reducing, and eventually eliminating, the country’s dependence on foreign, environment-damaging fuels. Agriculture and forestry activities provide two major options, towards that objective, through substitution of fossil fuels with fast growing energy sources: mineral diesel and electricity.
6.3.1 Electricity from biomass
Wood and crop residues could provide enough energy to meet the increases in demand and thus, help maintain Uruguay’s energy-related emissions at its currently low levels. Since 1997, private-company electricity generation has been possible, although transmission and distribution remain State monopolies. Private generators can sell electricity only to large consumers (i.e., consumers with installed capacity of more than 0.5 MW), paying a transmission fee to UTE, the State utility. Wood for energy could be obtained from harvest residues (i.e., logs with reduced diameters), from industry residues (sawdust, chips, etc.), or from plantations specifically designed for energy purposes. By 2008, total supply from these three sources could amount to more than 5 million m3/year, which is enough to feed electricity generation units with a total power of 150 MW, plus a variable supply of heat in cogeneration facilities. Unlike the projected gas-fueled electricity plant, biomass-fueled generation will be highly decentralized, with several small plants of 1-5 MW dispersed over the territory, at short distances from forests or industrial sites.
Rice husks could be an additional raw material for electricity. As shown in Figure 1, rice production has been continually increasing over the last 40 years, having reached 1 million ton per year. There are several rice mills in the East and North West regions, where most rice fields are located. A small, but increasing, proportion of produced rice is being exported without local processing. There are approximately 120 thousand tons of husks potentially available for electricity generation each year. This could supply a few generation plants of 1-5 MW. Electricity production from wood and rice husks would have positive effects in terms of national trade balance, GDP, rural development, and employment. It would also improve the logistics of transmission and distribution, thus reducing energy losses due to long-distance transportation. Also, given the lack of investment capital, the gradual creation of biomass-fueled electricity generation is more feasible and seems more adequate than investing in a large natural gas plant right away.
The main obstacle facing electricity from biomass is its relatively high costs compared to hydro or electricity imported from Argentina. Thus, there is a need for policy development that recognizes the positive environmental and socio-economic impacts of biomass electricity, which are currently not considered by the market. One possible measure is the creation of a subsidy for renewable energy. Another measure to promote the production of biomass electricity could be to add transmission fees according to real electricity transportation distances. In this way, a private generator would be able to optimize location of the generation site according to the distance to potential buyers.
6.3.2 Biofuels
Diesel oil is the preferred fuel used in the transport and agriculture sectors in Uruguay. Annual consumption is approximately 750 million liters, causing emissions of 1.9 Mt CO2 per year. Almost one half of the diesel used is imported, whereas the other half is produced locally from imported oil. Thus, fuel is completely obtained from foreign sources. Therefore, the national economy is quite vulnerable to fluctuations in international oil prices. Oil crops have traditionally been planted in the Western region of Uruguay. Sunflower and soybean are currently the main crops, covering an area of 250 thousand ha

ENV/EPOC/GF/SD/RD(2004)2/FINAL
34
(2002/03 season). Vegetable oil is also obtained from rice industry residues. Other oil crops such as canola may become significant in coming years. Total grain production for the 2002/03 season is expected to be 200 thousand tons of sunflowers and 150 thousand tons of soybeans. A fraction of this production (50 thousand tons of sunflowers) is processed by the local oil industry, the rest being exported with little added value. Bio-diesel could be produced from nationally produced vegetable oil, and blended with mineral diesel. Trucks and farm tractors are designed for using mineral diesel fuel. Bio-diesel mixtures of up to 20% (B20 grade) could be used without any engine adaptations. The use of higher-grade mixtures or even pure bio-diesel would require new engines, or engine modifications in currently used equipment. Producing enough bio-diesel to mix with the entire diesel fuel consumed in the country would take a large oil crop area (more than 300 thousand ha of soybean or 220 thousand ha of sunflower exclusively for fuel production). Achieving this objective would take a period of possibly more than ten years, and would avoid the emission of 0.4 Mt CO2/year, or 7% of the current CO2 emissions from fossil-fuel burning.
Besides climate change mitigation, a policy aiming at the complete adoption of B20 bio-diesel would have positive environmental and socio-economic impacts such as the creation of jobs, particularly in rural areas, thus contributing to stopping or reversing current migration trends from these areas to cities; the reduction of Uruguay’s dependence on foreign oil; the improvement of the agricultural sector through the diversification of markets for oil grains; extended lifetime of tractor and truck engines by using bio-diesel; and finally reduced emissions of fine-particulate matter, ozone and sulfur oxides resulting from fuel burning, thus reducing incidence of cardio-respiratory and other diseases, particularly in populated centers. Similar to biomass electricity, the adoption of bio-diesel while desirable in terms of sustainable development faces high costs relative to mineral diesel. A study by OPYPA (2001) showed that only when the ratio of mineral oil to oil grain prices is extraordinarily high, as witnessed during early 2001, bio-diesel would be competitive under free market conditions. A recently passed law (No. 17567) entitles the Executive Power to grant tax exemptions to nationally produced alternative fuels. This may become a good policy tool, since mineral diesel is already heavily taxed. One possible measure would be to reduce taxes on the mineral diesel component of bio-diesel mixtures.
7. Conclusion
Uruguay has several contextual characteristics that differentiate it from most other developing countries. It is located in a temperate region, has a relatively low population and population density, and at the same time its per-capita income and social infrastructure are closer to many industrialized countries than to the developing world. The Environmental Sustainability Index also ranks Uruguay’s among the top ten countries in the world. Further, like many developing countries, a significant part of its national economy is dependent – directly and indirectly – on natural resources including forestry, agriculture and livestock. These sectors offer considerable potential for mitigating climate change through carbon sequestration. Natural resource management therefore is a critical link in Uruguay’s efforts to help mitigate climate change.
The real opportunities for mainstreaming responses to climate change in national planning lie within the context of sectoral, environmental, and economic policies. This analysis has highlighted Uruguay’s efforts and potentials for mainstreaming carbon-sequestration within the agricultural, forestry, and energy sectors.
A significant intersection between sectoral and climate change priorities can be seen in the area of CO2 sequestration in the agriculture and livestock, and forestry sectors which are responsible for more than 80% of GHG emissions. What has been remarkable in the case of Uruguay is the impact of sectoral policies that were driven by conservation or economic development objectives on carbon-sequestration. Policies like the Soil Management Law passed in 1982 allowed the National Bank to condition its rural credit program to the application of soil conservation technologies, which had the ancillary benefit of
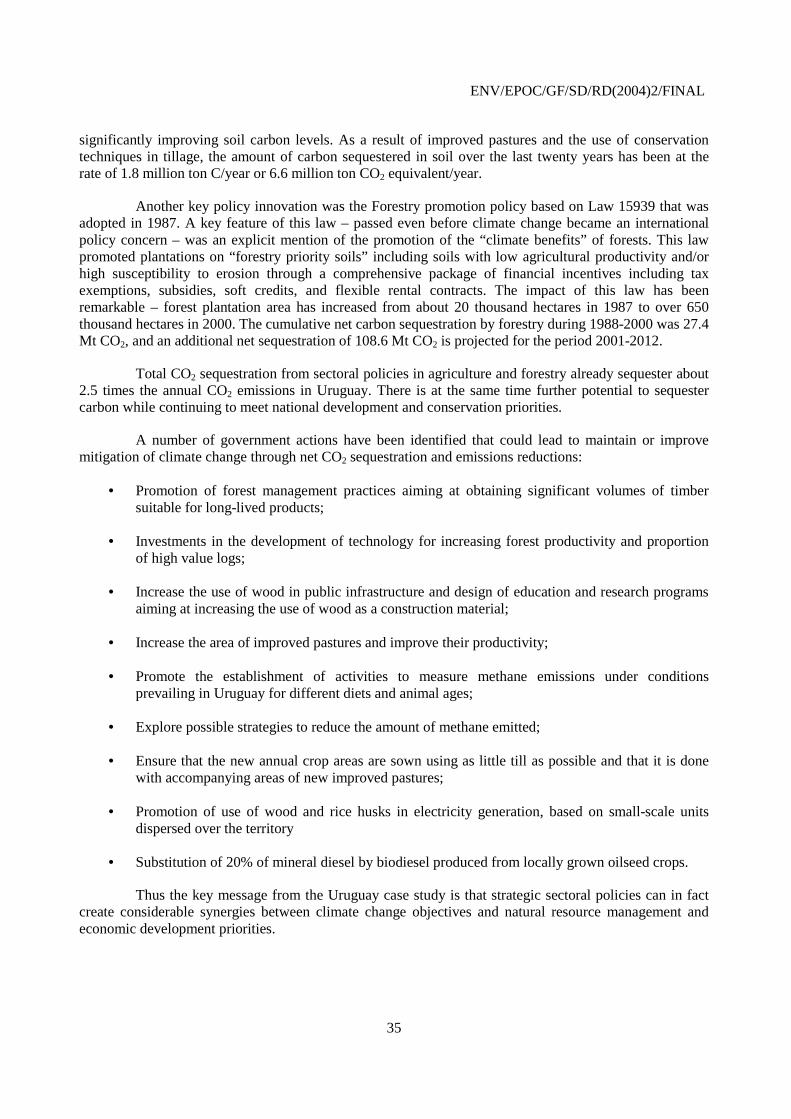
ENV/EPOC/GF/SD/RD(2004)2/FINAL
35
significantly improving soil carbon levels. As a result of improved pastures and the use of conservation techniques in tillage, the amount of carbon sequestered in soil over the last twenty years has been at the rate of 1.8 million ton C/year or 6.6 million ton CO2 equivalent/year.
Another key policy innovation was the Forestry promotion policy based on Law 15939 that was adopted in 1987. A key feature of this law – passed even before climate change became an international policy concern – was an explicit mention of the promotion of the “climate benefits” of forests. This law promoted plantations on “forestry priority soils” including soils with low agricultural productivity and/or high susceptibility to erosion through a comprehensive package of financial incentives including tax exemptions, subsidies, soft credits, and flexible rental contracts. The impact of this law has been remarkable – forest plantation area has increased from about 20 thousand hectares in 1987 to over 650 thousand hectares in 2000. The cumulative net carbon sequestration by forestry during 1988-2000 was 27.4 Mt CO2, and an additional net sequestration of 108.6 Mt CO2 is projected for the period 2001-2012.
Total CO2 sequestration from sectoral policies in agriculture and forestry already sequester about 2.5 times the annual CO2 emissions in Uruguay. There is at the same time further potential to sequester carbon while continuing to meet national development and conservation priorities.
A number of government actions have been identified that could lead to maintain or improve mitigation of climate change through net CO2 sequestration and emissions reductions:
• Promotion of forest management practices aiming at obtaining significant volumes of timber suitable for long-lived products;
• Investments in the development of technology for increasing forest productivity and proportion of high value logs;
• Increase the use of wood in public infrastructure and design of education and research programs aiming at increasing the use of wood as a construction material;
• Increase the area of improved pastures and improve their productivity;
• Promote the establishment of activities to measure methane emissions under conditions prevailing in Uruguay for different diets and animal ages;
• Explore possible strategies to reduce the amount of methane emitted;
• Ensure that the new annual crop areas are sown using as little till as possible and that it is done with accompanying areas of new improved pastures;
• Promotion of use of wood and rice husks in electricity generation, based on small-scale units dispersed over the territory
• Substitution of 20% of mineral diesel by biodiesel produced from locally grown oilseed crops.
Thus the key message from the Uruguay case study is that strategic sectoral policies can in fact create considerable synergies between climate change objectives and natural resource management and economic development priorities.

ENV/EPOC/GF/SD/RD(2004)2/FINAL
36
REFERENCES
Bidegain, M. and C. Deshayes (1992): Aspects of Secular Climatic Variability of the Precipitation in Uruguay (South America). Work presented at the First Spanish-American Congress of Meteorology, Fifth Inter-American Congress of Meteorology, Salamanca, Spain.
FAO (1987): Forest Products Yearbook 1987, Rome.
Hudson, R.A. and S.W. Meditz (eds.) (1990): Uruguay, A Country Study. Federal Research Division, Library of Congress.
JICA (1991): Plan quinquenal de forestación nacional de la República Oriental del Uruguay. Informe final, Marzo de 1991.
Loza-Balbuena, I. (2002): The impact of carbon trading on afforestation projects in Uruguay. M.Sc. Thesis, New Zealand School of Forestry, University of Canterbury.
Marland, G., Boden, T. A. and Andres, R. J. (2003): Global, regional and national fossil fuel CO2 emissions. Online Trends http://cdiac.ornl.gov/trends/emis/em_cont.htm (site visited in January 2003).
Nagy, G.J., A. Acuña, M. Gómez, C.M. Martínez, V. Severova, J. López Laborde, A.C. Perdomo, and E.A. Forbes (1996): Vulnerability of the North Coast of the Rio de la Plata to the Variability of Short and Long Term River Currents Fluctuations. Presented at the workshop on Vulnerability and Adaptation to Climate Change in Latin America, April 22-24, Montevideo, Uruguay.
OPYPA (2001): Evaluación de la producción y consumo de biodiesel en Uruguay. In: MGAP/OPYPA, Anuario 2001.
Panario, D. and M. Bidegain (1996): Evolution of the prairie in Uruguay and the potential effects of climate change. In: Vulnerability and Adaptation to Climate Change in Latin America, C. Ramos Mañé (ed.). Climate Research Special Issue 9(1-2).
Ramos, A. and Cabrera, R. (2001): El impacto del desarrollo forestal en Uruguay. Sociedad de Productores Forestales, Montevideo, Uruguay.
Rosegrant, M.; M. S. Paisner and S. Meijer (2001): Long Term Prospects for Agriculture and the Resource Base. Rural Strategy Background Paper #1, World Bank Rural Development Department.
UNFCCC (1999): First National Communication on Climate Change for Uruguay. United Nations Framework Convention on Climate Change, www.unfccc.int, accessed January 2003.
Uruguay (1992): Estudio ambiental nacional. Plan de acción ambiental, OEA/BID, Washington DC.

ENV/EPOC/GF/SD/RD(2004)2/FINAL
37
Uruguay (2000): Balance energético nacional. Ministerio de Industria y Energía, Dirección Nacional de Energía.
Uruguay (2002a): Estudio de apoyo a la aplicación del Mecanismo para el Desarrollo Limpio del Protocolo de Kioto en Uruguay. MVOTMA-DINAMA/IDRC. Montevideo.
Uruguay (2002b): Estudio de prospectiva tecnológica. Sector Energía. Presidencia de la República/UNIDO.
van Hoff, E. (2001): Estado actual del manejo forestal en Uruguay. In : FAO, Informacion y análisis para el manejo forestal sostenible: integrando esfuerzos nacionales e internacionales en 13 países tropicales en América Latina. Santiago, Chile, http://www.rlc.fao.org/proyecto/rla133ec/default.htm (site visited 6 February 2003).
World Economic Forum (2001-2002): Global Competitiveness Report 2001-2002, www.weforum.org.
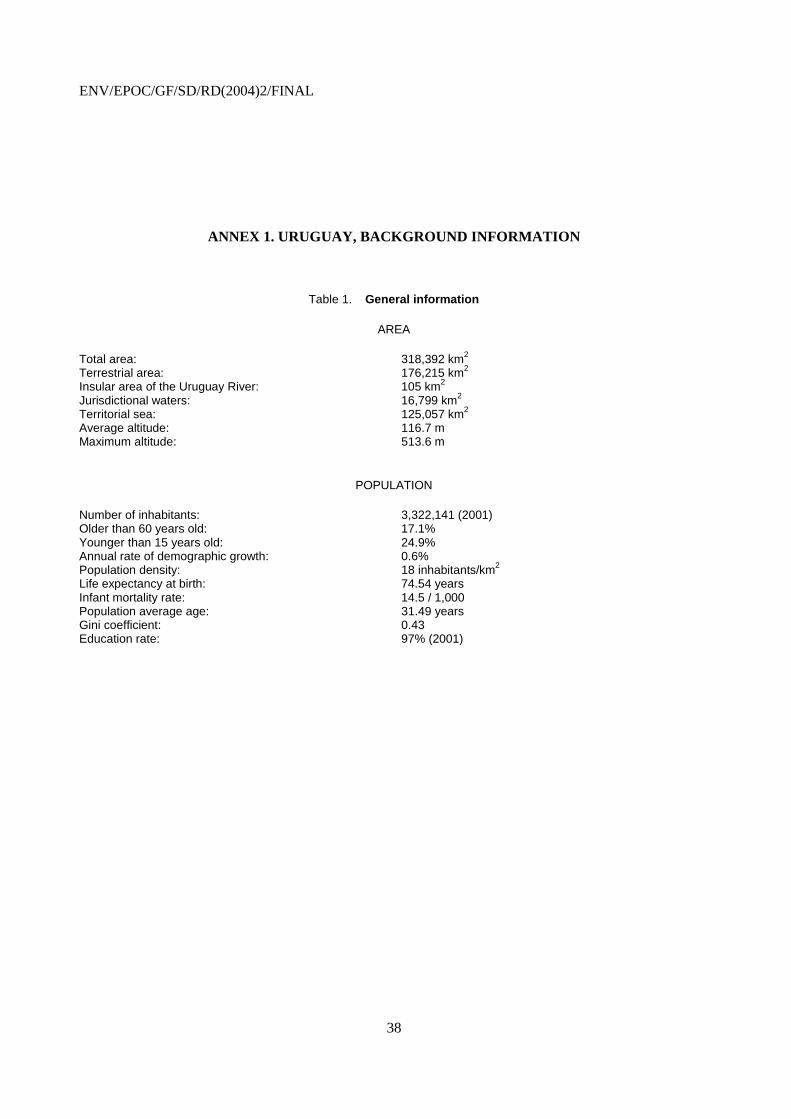
ENV/EPOC/GF/SD/RD(2004)2/FINAL
38
ANNEX 1. URUGUAY, BACKGROUND INFORMATION
Table 1. General information
AREA
Total area: 318,392 km2 Terrestrial area: 176,215 km2 Insular area of the Uruguay River: 105 km2 Jurisdictional waters: 16,799 km2 Territorial sea: 125,057 km2 Average altitude: 116.7 m Maximum altitude: 513.6 m
POPULATION
Number of inhabitants: 3,322,141 (2001) Older than 60 years old: 17.1% Younger than 15 years old: 24.9% Annual rate of demographic growth: 0.6% Population density: 18 inhabitants/km2 Life expectancy at birth: 74.54 years Infant mortality rate: 14.5 / 1,000 Population average age: 31.49 years Gini coefficient: 0.43 Education rate: 97% (2001)

ENV/EPOC/GF/SD/RD(2004)2/FINAL
39
Table 2. General economic indicators
GDP (2001): 18,661 million US $ GDP Per Capita (2001): 5,718 US $ GDP Composition by Sector: agriculture and fisheries: 10.2% manufacturing, industry and mining: 18.1% electricity, gas and water: 4.4% construction: 3.4% transport, communications: 11.6% commerce, restaurants and hotels: 13.3% financial services, insurance, housing and business services:
23.7%
other services: 15.3% Inflation: 3.58% (2001) (112% 2002-2003) Economical active population: 1,269,400 (2001) Unemployment rate: 15.3% (2001) Exports (2001): 2,060 (million US $) Main products:
Meat, rice and other grain; leather, furs and leather products; food, drinks and tobacco; wool and woolen manufactured products; plastic material, rubber and its manufactured products.
Main business partners: Brazil (21,3%), Argentina (15,4%), European Union (18,8%), Asia (10,1%), USA (8,3%), Middle East (4,0%)
Imports (2001): 3,061 (million US $) Main products:
Machinery and appliances, electronics; chemical products; oil and derivatives; transportation materials.
Main business partners: Argentina (23.1%), Brazil (20.4%), European Union (18.1%), USA (8.9%), Asia (10.4%)
Table 3. General social indicators (2001)
(a) General
Population with health coverage: 95% Number of inhabitants per doctor: 267 Population supplied with drinking water: 87% Electrification rate: 98% Number of cars per 100 inhabitants: 20
(b) Communications
Digital telephony net: 100% Telephone lines per 100 inhabitants: 43 (2001) Cellular telephones per 100 inhabitants: 15 (2001) Internet penetration: 14% (2001) Hosts (density per 10,000 inhabitants): 114 (2000) (Source: Instituto Nacional de Estadística, Oficina de Planeamiento y Presupuesto Presidencia de la República)

ENV/EPOC/GF/SD/RD(2004)2/FINAL
40
ANNEX 2. LAWS, REGULATIONS AND PLANS IN URUGUAY AFFECTING THE ENVIRONMENT
(a) Early actions that promoted the improvement of pastures (before 1990)
Law 12.394, July 1957, “Agricultural Production Improvement”
A plan for technological improvement of the agricultural production was declared of National interest, and financial resources were provided for technical and economical assistance to farmers to increase livestock production promoting among other:
− Improve the soil fertility through fertilizer use
− Introduction of productive pastures (legumes) in the natural grasslands
− Promote adequate grazing and forage conservation (hay and/or silage)
Law 12.746, August 1969, “Plan for Agricultural Improvement”
Created special financial funds to establish practices leading to pasture improvement (namely, the fund created rural credit plans which had negative real interest rates)
Law 13.301, November 1964, “Plan for Agricultural Investment”
Established subsidies for promoting the use of fertilizers as well as the production and use of improved pasture seeds.
Law 14.948, November 1979, “Tax Reform”
This law allowed farmers to deduct from their taxes the incurred cost of following items (among others):
− Pasture seeds
− Phosphate fertilizers
− Tillage for sowing pastures
− Pasture hay and silage
(b) Early actions that promoted the conservation of natural resources
Law 13.667, June 1968, “Soil and Water Conservation”
Oriented to promote, protect and regulate the adequate use and conservation of soils and waters (surface and subsurface). Farmers were required to apply mandatory soil management practices (as defined

ENV/EPOC/GF/SD/RD(2004)2/FINAL
41
by the Ministry of Agriculture), to avoid and/or revert soil degradation and to avoid soil erosion. The law also promoted the adoption of preventive practices to preserve soil fertility and soil water (e.g., contour tillage), and prohibited certain practices and crops in certain areas of the country.
Law 15.239, December 1981, “Soil and Water Use and Conservation”
Defined the government’s role for preventing and controlling soil erosion and degradation, floods, and sedimentation in watercourses, lakes and lagoons.
The document regulating this law, introduced specific soil management practices including reduced tillage, the precursor in Uruguay of no-till agriculture.
Also in the context of the regulation of the Soil Conservation Law, the Faculty of Agronomy (University of Uruguay) created the Department of Soil Conservation, as specific theme within the Edaphology and Hydrology area.
Another important result of the Soil Conservation law was the agreement between the Ministry of Agriculture and Fisheries and the BROU, the National bank that provides credit for crop production. Through this agreement the bank conditioned agricultural credit for farming to the application of soil conservation practices.
Finally, it is important to point out that in the mid ’90, specially with the support of the Program of Natural Resources Management and Irrigation Development (PRENADER), promotion of soil conservation practices drastically increased. In the context of this Program, research programs were funded to determine efficient methods for land recovery and erosion control, and to generate information on the use of no-till technology in livestock production systems (dairy and beef). These actions resulted in global investment of more than 50 million US $, funded by the Uruguayan Government with financial support of the World Bank.
Transition to environmental and climate-change specific regulations
Law 15.939, November 1987, “Promotion of Forestry”
Promoted afforestation on soils designated as of ‘forestry priority’ because of their low productivity, or their degradation due to previous use, or their high risk of erosion. Incentives included tax exemption on land property, other fiscal incentives, a plantation subsidy, soft, long-term credits and duty-free imports of forestry machinery and other equipments. This law also completely banned logging of natural forests in Uruguay.
Development of the current environmental legal framework (post 1990)
Until 1992, the National legal system related to the environment was oriented to reinforce the environmental normative preservation established in the National Constitution of 1967. In its Chapter 2, article 47 related to the recognition and settlement of the Constitutional Rights and Duties, secured all people the right to live in an environment free from pollution, imposing the Estate the duty of surveillance, so that this right is not affected and protect this way the preservation of nature.
In this context, some sectorial norms were approved which were laterally related to environmental protection. However, during the last decade the Uruguayan environmental legislation reached a significant degree of development with the approval of a number of rules included in Principle 11 of the Rio Declaration of 1992. A key moment in the history of the environmental legal system is the year 1996 when

ENV/EPOC/GF/SD/RD(2004)2/FINAL
42
the environmental dimension was included in the Constitution of the Republic, the maximum political and juridical expression in the Uruguayan administration.
Key environmental laws and regulations in Uruguay
Chapter 2, article 47, National Constitution of 1967. Recognition and settlement of the Constitutional Rights and Duties, secured all people the right to live in an environment free from pollution, imposing the Estate the duty of watching it, so that this right is not affected and protect this way the preservation of nature.
Mended Article 47 of the Constitution of the Republic through the constitutional reform promulgated by Constitutional Law the 14th. January 1997. This determined the environmental protection of general interest. Under this framework, it was established that all persons must abstain from executing any act that causes depredation and it is an Estate duty to foresee sanctions for the transgressors.
Law 16,466 of Environmental Impact Assessment was approved in 1994, following the recommendation established in the Principle 17 of the Rio Declaration of 1992. Designated the MVOTMA as the responsible authority in the topic. The Law of Environmental Impact Assessment marked a transcendent target, reinforcing the inclusion of environmental aspects since the last constitutional reform. Besides instituting a general regime of EIA in the Uruguayan Law, the law establishes “of general and national interest the environmental protection against any kind of depredation, destruction or pollution as well as the prevention of the negative or harmful environmental impact and, in this case, the recovery of the damaged environment by human activities” (Article 1º).
This legislation also complemented environmental rules of different sectors related to specific environmental aspects, such as:
− Creation of the National System of Natural Protected Areas approved by Law 17,234 in 2000
− Law 17,283 of 28th. November 2000, denominated General Law of Environmental Protection (LGPA), probably the most important juridical advance. Regulates the article 47 of the Constitution of the Republic, establishing this way in its article 6º, the basis of the national environmental policy. This law expresses the right of the people to be protected in the enjoyment of a healthy and balanced environment and introduces the concept of environmentally sustainable development in the Uruguayan legislation. It establishes the principles of awareness and preparedness, participation and transectoriality, as well as the availability and accessibility to environmental information, which are mentioned both in the Rio Declaration in 1992 and the 21 Agenda.
Other laws and regulations specifically oriented to environmental issues
Law 16.134, September 1990, Creation of the National Division for the Environment
Created with the objective of: executing, supervising, and evaluating all plans of environmental protection.
Law 16.517, July 1994, “Instrumentation and application of the UNFCCC”
The Ministry for Housing, Territorial Ordinance, and the Environment (MVOTMA) is recognized as the National authority for the instrumentation and application of the United Nations Framework Convention on Climate Change.

ENV/EPOC/GF/SD/RD(2004)2/FINAL
43
Decree 7827/94, December 1994, Creation of the Climate Change Unit (MVOTMA)
The Ministry for the Environment establishes the Climate Change Unit within the Environmental Division with the following responsibilities:
− Elaborate and maintain National inventories of GHG emissions
− Establish the needed relationships with International and Intergovernmental agencies in charge of implementing the UNFCC
− Promote the application of technologies with proven efficacy to reduce and prevent GHG emissions, in coordination with the public and private sectors.
− Obtain National and International information on technologies and processes to reduce emissions and disseminate the pertinent information at the National level
− Promote and enhance human capacity building and awareness in the subject of climate change
Law 17.279, November 2000, Ratification of the Kyoto Protocol
Law 17.283, November 2000, “Environmental Protection”
Specifies the National interest for:
− “protecting the environment, air, water, soil and landscape quality”
− “protecting the biodiversity, configuration and structure of the coastlines”.
− “preventing, eliminating, mitigating and compensating negative environmental impacts”
This law allowed the government to take administrative actions against agents producing negative environmental impacts, as well as to provide economical incentives to agents involved in actions considered environmentally beneficial.
The law also banned the direct or indirect release or emissions of materials, substances or energy to the atmosphere, at higher levels than those defined by the MVOTMA (Ministry for the Environment). It also established that the Ministry for the Environment will define the actions for mitigation of and adaptation to climate change, and especially regulate the GHG emissions.
Decree 9 July 2001, “Climate Change Unit defined as the executing agency for CDM”
Establishes that the Climate Change Unit (CCU) of the Ministry for the Environment is the National authority and the executing agency for applying the Clean Development Mechanism defined in article 12 of the Kyoto Protocol.
Law 17.567, October 2002, “Production of Alternative , Renewable Energy Sources as Substitutes for Petroleum”
This law declares National interest the production of alternative, renewable energy sources elaborated with National materials of pant or animal origin. The law also authorizes the government to fully or

ENV/EPOC/GF/SD/RD(2004)2/FINAL
44
partially exonerate all taxes to alternative fuels obtained with domestic products and of plant/animal sources.
Recent research, development and capacity building projects on environmental issues
The explicit inclusion of environmental issues, and more specifically climate change and GHG emissions in the National political agenda resulted in two major consequences:
− These subjects started to be an even more important issue of general interest for the Uruguayan population
− Resources (National and International) started to be invested in research, development and capacity building projects dealing with these subjects
Some examples of the latter include:
Institutional Strengthening for the Application of the UNFCC (partially funded by UNDP and UNEP)
Project outputs:
− National Inventories of Greenhouse Gas Emissions (1990 and 1994)
− National Communication to the Conference of the Parties
− Human capacity building (training of the Ministry’s staff members)
− Public dissemination of general issues on climate change, GHG emissions
− Workshops for exploring alternatives for climate change mitigation (agricultural and energy sectors)
− Analyses for industrial processes and waste sectors
Vulnerability and Adaptation to Climate Change (partially funded by the US Country Studies Program)
Project Outputs: Publications
Mitigation of Methane Emissions in a Landfill (partially funded by GEF)
The objective of the project is to generate electricity with biogas from a landfill in the eastern region of Uruguay (close to the tourist resort area Punta de Este). The project’s targets are:
− Recover 54 million m3 of biogas
− Capture 19 million ton CH4
− Generate 84 million kwh of electric power
− Avoid emissions of 129,000 ton of carbon to the atmosphere

ENV/EPOC/GF/SD/RD(2004)2/FINAL
45
Institutional Strengthening for the Second National Communication (partially funded by GEF and UNDP)
The objectives of the project are:
− Elaborate the Second National Communication including a comparative National inventory of GHG emissions for 1990, 1994 and 1998.
− Identify general actions for mitigation and adaptation to climate change.
− Identify, stimulate, facilitate and protect the investments and adoption of technologies that contribute to reduce GHG emissions.
Developing a GHG accounting system for Uruguayan plantation forests and harvested wood products (funded by the New Zealand Latin America Technical Cooperation Fund)
The general objective of the project is to assist Uruguayan government and private forest organizations in their process of building capacities to actively participate in the international carbon trading and take advantage of the opportunities that will be open as soon as the Kyoto Protocol enters into force. As Uruguay has an important potential for carbon sequestration in forests, investments in CDM projects and income from certified emission reduction trade will considerably contribute to the economic and social sustainable development.
The specific objective of the project is to strengthen national human skills and capacities to design and implement a GHG accounting system in the forest sector, considered to be a necessary step to take advantage of the above mentioned opportunities. These objectives will be achieved through the transfer of the vast experience that New Zealand has in terms of climate change, carbon sequestration and bioenergy issues related to forest plantations.
Mitigation of Methane Emissions by Ruminants in Uruguay (partially funded by the US Environmental Protection Agency –EPA- Global Change Division)
Project Objectives
− To adapt the SF6 technique for measuring methane emissions from beef and dairy cattle.
− To produce the first measurements of actual methane emissions by cattle in different production systems, ranging from extensive on natural grassland to intensive (sown pastures and/or grain-fed animals).
− To assess different mitigation methods, particularly adjusting feed quality.
− To generate information needed for improving the quality of the National Inventories of Greenhouse Gas Emissions produced by the Uruguayan Government.