background ozone: challenges in science and policy
TRANSCRIPT

Background Ozone: Challenges in Science and
Policy
January 31, 2019
Congressional Research Service
https://crsreports.congress.gov
R45482
Congressional Research Service
SUMMARY
Background Ozone: Challenges in Science and Policy Exposure to ozone, a common air pollutant, has been linked to early death, plant and
crop damage, and damage to property. The U.S. Environmental Protection Agency
(EPA) sets National Ambient Air Quality Standards (NAAQS) for ground-level ozone to
protect human health and welfare with, by law, a “margin of safety.” States that contain
areas with ozone concentrations above these standards must develop plans to reduce
emissions and improve air quality. However, states have direct control only over emission sources located within
their borders.
The Clean Air Act (CAA) requires EPA to re-evaluate the NAAQS every five years to include the latest science
and technological advancements. Studies reporting the human health impacts of ozone increasingly suggest that
ozone exposure may not be completely safe at any level. With the potential for a NAAQS re-evaluation leading to
science-based recommendations for a tighter standard, some stakeholders have expressed increasing concern that
future—and even current—ozone standards could be difficult to meet due to the contribution of “background
ozone,” which arises from a variety of sources described in this report. In some areas of the United States,
background ozone may be approaching 70 parts per billion (ppb) on some days, the current level of the NAAQS.
Some Members of Congress have expressed interest in adverse health effects that occur at or below the current
standard, challenges some nonattainment areas may have in meeting current standards, and particularly the
responsibilities for meeting the health standard, given interstate and international transport. EPA’s review of the
ozone NAAQS is underway and set to be completed in 2020, with background ozone contributions suggested as a
topic to be addressed. Congress may have an interest in better understanding scientific capabilities, needs, and
efforts to improve understanding of contributions from background sources, as well as options for regulatory
responses.
Defining Background Ozone
Three terms are used for different types of background ozone, and distinguishing among them can be important
for regulatory purposes.
1. Natural background. Ozone concentrations that would be present without any human influence or
contribution from anywhere on the globe. Natural background includes contributions from wildfires,
vegetation, lightning, ozone in the stratosphere, and global methane concentrations. Contributions to
background ozone from wildfires and methane have been increasing over the past several decades.
2. North American background. Ozone concentrations absent human-caused emissions from North
America. North American background includes all sources in natural background plus ozone from
international sources outside North America. Studies suggest that Asian emissions may be contributing to
ozone in the United States, especially in Western states, but that those contributions may be beginning to
decrease.
3. United States background. Ozone concentrations absent human-caused emissions from the United
States. U.S. background includes all sources in North American background plus ozone formed from
emission sources in Mexico and Canada.
Challenges in Estimating Background Ozone
The CAA provides alternative regulatory options for areas that successfully demonstrate significant
influence from some specific sources of natural background ozone on ozone exceedences. However, such
demonstrations may be difficult to conduct and reliably assess, given data and analytical challenges:
R45482
January 31, 2019
Tammy M. Thompson Analyst in Environmental Policy

Background Ozone: Challenges in Science and Policy
Congressional Research Service
Emissions inventories. Current understanding of the amount, location, and type of pollutant
emissions from many types of sources is insufficient. Therefore inventories typically provide
estimations, which may not be precise enough for apportioning contributions.
Weather data. Meteorological data (i.e., wind speed, wind direction, temperature, cloud cover,
humidity, etc.) are not currently measured at a fine enough spatial scale to adequately represent
relevant weather processes.
Ambient air quality measurements. Data on pollutant concentrations are limited, which
increases the challenge of understanding ozone formation and movement. Fine spatial and
temporal measurements are needed both horizontally across the surface and vertically to higher
levels of the atmosphere.
Source contribution variability. Background ozone source contributions change by year, season,
day, and hour and from location to location. This makes it difficult to project future contributions,
including when contributions will be relevant to attainment status.
This report provides information on sources of background ozone, presents key challenges in addressing
these sources, and discusses potential options to overcome these challenges.

Background Ozone: Challenges in Science and Policy
Congressional Research Service
Contents
Introduction ..................................................................................................................................... 1
Defining Background Ozone ........................................................................................................... 3
Different Types of Background Ozone...................................................................................... 6 Natural Background (NB) ................................................................................................... 6 North American Background (NAB) .................................................................................. 8 U.S. Background (USB) ..................................................................................................... 8
Challenges in Estimating Background Ozone ................................................................................. 9
Trends in Background Ozone Contributions ................................................................................. 10
Regulatory Relief Options for Some “Natural Sources” .......................................................... 11
Issues for Congress ........................................................................................................................ 12
Figures
Figure 1. NAAQS Ozone Nonattainment Areas .............................................................................. 4
Figure 2. Atmospheric Transport Processes for Ozone ................................................................... 6
Figure 3. Area Burned and Annual Count of Wildfires Larger Than 1,000 Acres, 1984-
2015 ............................................................................................................................................. 11
No table of figures entries found.
No table of figures entries found.
Tables
No table of figures entries found.
No table of figures entries found.
No table of figures entries found.
Appendixes
No table of contents entries found.
Contacts
Author Contact Information .......................................................................................................... 14
Background Ozone: Challenges in Science and Policy
Congressional Research Service R45482 · VERSION 1 · NEW 1
Introduction Exposure to ozone (often referred to as “smog”), regardless of where that ozone originates, has
been linked to negative human health effects, including respiratory ailments and premature
death.1 Children, the elderly, and persons with respiratory illnesses are particularly susceptible to
adverse health impacts from ozone exposure. EPA estimates that ozone exposure was responsible
for more than 15,000 premature deaths in the United States in 2007 based on 2006-2008 average
ambient ozone concentrations.2 Ozone has also been linked to plant damage and decreases in crop
yield.3
Concentrations of ozone at the ground level, originally considered a local issue, is increasingly
recognized as a global challenge. Ozone is not emitted directly but is formed in the atmosphere
from chemical reactions of nitrogen oxides (NOx) with volatile organic compounds (VOCs, a type
of hydrocarbon) in the presence of sunlight. NOx and VOCs are known as “precursor” emissions,
and their relative contributions to the formation of ozone depends on a number of factors,
including weather conditions and concentrations of other pollutants. The lifetime of ozone in the
atmosphere ranges from hours to weeks, providing time—under the right conditions—for
pollution emitted in one location to affect the health and welfare of populations far downwind
(see Figure 2).
While local emissions of ozone precursors are still the dominant source of ozone in many areas,
state and local air quality agencies face ozone pollution arising from sources outside of their
jurisdictional control (“background ozone”). As will be described and discussed in this report,
potential long-range transport of air pollutants presents a challenge to downwind communities. It
can also be an opportunity for cooperation among localities, states, and countries.
The Clean Air Act (CAA) directs the U.S. Environmental Protection Agency (EPA) to establish
National Ambient Air Quality Standards (NAAQS) to protect public health (primary standards)
and welfare (secondary standards). The law directs that “the attainment and maintenance of
[primary standards] are requisite to protect the public health.”4 While the standards are set to limit
adverse impacts, EPA acknowledges that these standards do not suggest that concentrations below
these levels present zero risk.5 The NAAQS set limits for the concentrations in ambient air of six
common “criteria” pollutants: lead, nitrogen oxides, sulfur dioxide, carbon monoxide, particulate
1 The Environmental Protection Agency (EPA) evaluated the extensive body of published literature and published its
findings in an Integrated Science Assessment (ISA). See EPA, Office of Research and Development, Integrated
Science Assessment for Ozone and Related Photochemical Oxidants, 2013, pp. 2-49, https://www.epa.gov/isa/
integrated-science-assessment-isa-ozone-and-related-photochemical-oxidants. The report concluded, “The current body
of evidence indicates that there is likely to be a causal relationship between short-term exposure to O3 and total
mortality [and] respiratory effects.”
2 EPA, Health Risk and Exposure Assessment for Ozone, August 2014, Section 8.1.2, https://www.epa.gov/naaqs/
ozone-o3-standards-risk-and-exposure-assessments-review-completed-2015.
3 J. Reilly et al., “Global Economic Effects of Changes in Crops, Pasture, and Forests Due to Changing Climate,
Carbon Dioxide, and Ozone,” Energy Policy, vol. 35, no. 11 (2007), pp. 5370-5383.
4 According to Section 109(b)(1) of the CAA, the NAAQS “shall be ambient air quality standards the attainment and
maintenance of which in the judgment of the Administrator, based on such criteria and allowing an adequate margin of
safety, are requisite to protect the public health. Such primary standards may be revised in the same manner as
promulgated.”
5 EPA, Integrated Science Assessment for Ozone and Related Photochemical Oxidants, p. lxxvi: “The CAA does not
require the Administrator to establish a primary NAAQS at a zero-risk level or at background concentration levels.”
Background Ozone: Challenges in Science and Policy
Congressional Research Service R45482 · VERSION 1 · NEW 2
matter, and ozone.6 There is no evidence of a safe level of ozone exposure below which no
adverse health effects occur. However, uncertainty between exposure and health response
increases at very low ozone concentrations—that is, below 20 parts per billion (ppb).7
Air quality monitoring stations in the United States measure concentrations of the six criteria
pollutants, and these measurements are used to determine whether locations meet the NAAQS. If
a monitor measures concentrations above the standard for any of those six pollutants for an
averaging time specified in the NAAQS,8 the area around that monitor may face a
“nonattainment” designation for that pollutant. Once designated nonattainment, the state
containing that area must propose a plan to bring the area into attainment of the NAAQS. These
State Implementation Plans (SIPs) require approval by EPA.9
State air quality regulators develop SIPs to attain NAAQS for ambient air in their states, and they
have jurisdiction only over the sources of emissions within their borders. The levels of pollution
flowing into nonattainment regions, generally referred to as “background pollution,” may be
making it more difficult for some areas of the United States to meet attainment. Congress
recognized this challenge when it enacted the original CAA, adding the “good neighbor
provision,” which addressed interstate transport of human-caused air pollution that contributes to
nonattainment. For detailed information about domestic air transport, see CRS Report R45299,
The Clean Air Act’s Good Neighbor Provision: Overview of Interstate Air Pollution Control, by
Kate C. Shouse.
The CAA also mandates EPA to review the NAAQS every five years and revise them as
appropriate.10 EPA completed its most recent review of the ozone standard in 2015, when it
lowered the standard from 75 ppb to 70 ppb.11 EPA reported that it has begun the next ozone
NAAQS review and that it intends to complete it by 2020.12 The procedure for reviewing and
setting the NAAQS explicitly does not consider what sources contribute to total ozone, including
background sources.
In 2018, EPA announced plans to streamline the NAAQS review process and obtain Clean Air
Scientific Advisory Committee advice regarding background pollution and potential adverse
effects from NAAQS compliance strategies.13 EPA’s “Back-to-Basics” memorandum described
6 Criteria pollutants are those that EPA has determined “may reasonably be anticipated to endanger public health or
welfare” and whose presence in “ambient air results from numerous or diverse mobile or stationary sources.” CAA
§108(a)(1), codified at 42 U.S.C. §7408(a)(1). EPA determined that the following pollutants meet the Section 108
criteria: (1) carbon monoxide, (2) lead, (3) nitrogen dioxide, (4) ground-level ozone, (5) particulate matter, and (6)
sulfur dioxide.
7 National Research Council, Estimating Mortality Risk Reduction and Economic Benefits from Controlling Ozone Air
Pollution (Washington, DC: National Academies Press, 2008), https://doi.org/10.17226/12198.
8 Pollutant measurement averaging time for attainment determination depends on NAAQS, which depends on the
pollutant being measured and the health response of interest (i.e., human acute health, human long-term impacts,
ecological impacts). See “Pollution Exposure Averaging Metrics” text box on page 10 for more discussion on pollution
averaging time. A single detection of an ambient air concentration exceeding a NAAQS number does not indicate a
“non-attainment” situation.
9 For more information about the NAAQS, nonattainment requirements, and SIPs, see the corresponding sections of
CRS Report RL30853, Clean Air Act: A Summary of the Act and Its Major Requirements, by James E. McCarthy.
10 CAA §109(d); 42 U.S.C. §7409(d).
11 EPA, “National Ambient Air Quality Standards for Ozone: Final Rule,” October 1, 2015, http://www3.epa.gov/
ozonepollution/actions.html. The rule appeared in the Federal Register on October 26, 2015, at 80 Federal Register
65292.
12 Respondent EPA’s Final Status Report at 4, Murray Energy Corp. v. EPA, No. 15-1385 (D.C. Cir. Aug. 1, 2018).
13 E. Scott Pruitt, EPA Administrator, “Back-to-Basics Process for Reviewing National Ambient Air Quality

Background Ozone: Challenges in Science and Policy
Congressional Research Service R45482 · VERSION 1 · NEW 3
concerns that background levels of pollution pose a challenge to meeting NAAQS standards. The
memorandum noted a call from certain state regulators for advice on how to treat background
ozone, stating that “state environmental agencies have sought this advice, citing the ‘absolute
need for a valid source of information about background concentrations.’” Additionally, EPA
created a task force to develop “additional flexibilities for states to comply with the ozone
standard.”14
Much of the focus of ozone transport and control has historically been on upwind domestic
sources. Members of Congress may have an interest in better understanding background ozone
from natural and international sources, particularly as EPA reviews the 2015 ozone standard.
Contributions from sources of background ozone may become important as states with
nonattainment areas develop SIPs that attempt to quantify these contributions and consider ways
to address them. To assist Congress in understanding these issues, this report defines background
ozone, focusing on natural and international sources, and describes what is currently known about
these sources. The report then goes on to discuss the limitations in the scientific community’s
understanding and options for deepening that understanding.
Defining Background Ozone This report will discuss background air pollution primarily in the context of ground-level ozone.
As of 2018, with the 2015 ozone standard set at 70 ppb, there are 52 areas in the United States
designated “nonattainment” for ozone (see Figure 1). Current research suggests that natural
sources and sources outside the United States may contribute to total ozone in those areas at
certain times.15 Many of the issues discussed here are not unique to ozone, however, and may
apply to other pollutants covered by NAAQS, and any potential actions taken to understand or
reduce background ozone may also reduce background concentrations of other pollutants.
Standards,” memorandum to EPA assistant administrators, May 9, 2018, https://www.epa.gov/sites/production/files/
2018-05/documents/image2018-05-09-173219.pdf.
14 EPA, “Final Report on Review of Agency Actions That Potentially Burden the Safe, Efficient Development of
Domestic Energy Resources Under Executive Order 13783,” October 25, 2017, https://www.epa.gov/sites/production/
files/2017-10/documents/eo-13783-final-report-10-25-2017.pdf.
15 For example, See D. A. Jaffe et al., “Scientific Assessment of Background Ozone over the U.S.: Implications for Air
Quality Management,” Elementa Science of the Anthropocene, vol. 6, no. 56 (2018).

Background Ozone: Challenges in Science and Policy
Congressional Research Service R45482 · VERSION 1 · NEW 4
Figure 1. NAAQS Ozone Nonattainment Areas
8-hour* Ozone (2015 Standard: 70 ppb)
Source: EPA Green Book GIS Download: https://www.epa.gov/green-book/green-book-gis-download.
Notes: NAAQS, ozone nonattainment updated as of September 26, 2018. Alaska and Hawaii do not contain any
areas of ozone nonattainment. *Ozone nonattainment designations are determined using the three-year average
of the fourth-highest daily maximum eight-hour averaged ozone concentration measured at a regulatory air
quality monitor. See “Pollution Exposure Averaging Metrics” on page 10 for more details.
This report deals exclusively with ozone measured at ground level and its adverse health and
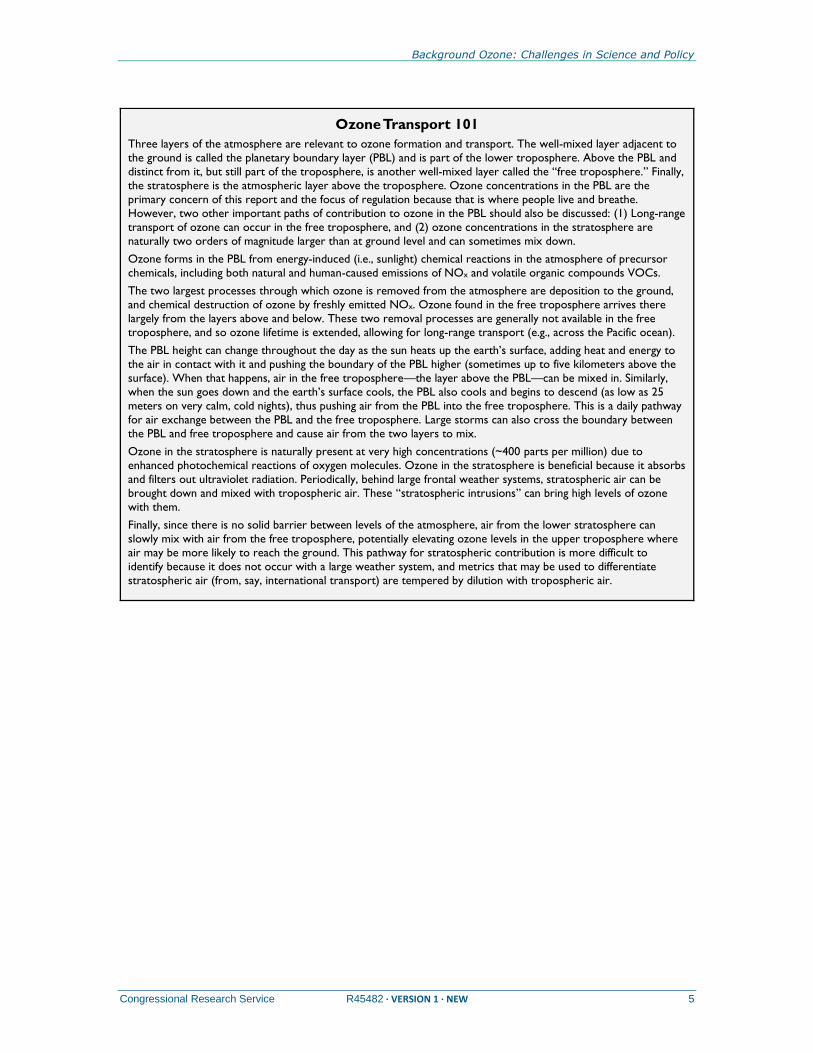
material effects.16 Ozone Transport 101 and Figure 2 provide additional information about ozone
in different layers of the atmosphere and how each layer may interact with, or contribute to,
ozone at ground level.
16 The ground-level ozone for which the NAAQS is established should not be confused with stratospheric ozone.
Background Ozone: Challenges in Science and Policy
Congressional Research Service R45482 · VERSION 1 · NEW 5
Ozone Transport 101
Three layers of the atmosphere are relevant to ozone formation and transport. The well-mixed layer adjacent to
the ground is called the planetary boundary layer (PBL) and is part of the lower troposphere. Above the PBL and
distinct from it, but still part of the troposphere, is another well-mixed layer called the “free troposphere.” Finally,
the stratosphere is the atmospheric layer above the troposphere. Ozone concentrations in the PBL are the
primary concern of this report and the focus of regulation because that is where people live and breathe.
However, two other important paths of contribution to ozone in the PBL should also be discussed: (1) Long-range
transport of ozone can occur in the free troposphere, and (2) ozone concentrations in the stratosphere are
naturally two orders of magnitude larger than at ground level and can sometimes mix down.
Ozone forms in the PBL from energy-induced (i.e., sunlight) chemical reactions in the atmosphere of precursor
chemicals, including both natural and human-caused emissions of NOx and volatile organic compounds VOCs.
The two largest processes through which ozone is removed from the atmosphere are deposition to the ground,
and chemical destruction of ozone by freshly emitted NOx. Ozone found in the free troposphere arrives there
largely from the layers above and below. These two removal processes are generally not available in the free
troposphere, and so ozone lifetime is extended, allowing for long-range transport (e.g., across the Pacific ocean).
The PBL height can change throughout the day as the sun heats up the earth’s surface, adding heat and energy to
the air in contact with it and pushing the boundary of the PBL higher (sometimes up to five kilometers above the
surface). When that happens, air in the free troposphere—the layer above the PBL—can be mixed in. Similarly,
when the sun goes down and the earth’s surface cools, the PBL also cools and begins to descend (as low as 25
meters on very calm, cold nights), thus pushing air from the PBL into the free troposphere. This is a daily pathway
for air exchange between the PBL and the free troposphere. Large storms can also cross the boundary between
the PBL and free troposphere and cause air from the two layers to mix.
Ozone in the stratosphere is naturally present at very high concentrations (~400 parts per million) due to
enhanced photochemical reactions of oxygen molecules. Ozone in the stratosphere is beneficial because it absorbs
and filters out ultraviolet radiation. Periodically, behind large frontal weather systems, stratospheric air can be
brought down and mixed with tropospheric air. These “stratospheric intrusions” can bring high levels of ozone
with them.
Finally, since there is no solid barrier between levels of the atmosphere, air from the lower stratosphere can
slowly mix with air from the free troposphere, potentially elevating ozone levels in the upper troposphere where
air may be more likely to reach the ground. This pathway for stratospheric contribution is more difficult to
identify because it does not occur with a large weather system, and metrics that may be used to differentiate
stratospheric air (from, say, international transport) are tempered by dilution with tropospheric air.

Background Ozone: Challenges in Science and Policy
Congressional Research Service R45482 · VERSION 1 · NEW 6
Figure 2. Atmospheric Transport Processes for Ozone
Source: Congressional Research Service.
Different Types of Background Ozone
EPA defined natural background (NB) and U.S. background (USB) in the final 2015 ozone rule
(the chemical notation of ozone is O3):
NB is defined as the O3 that would exist in the absence of any manmade precursor
emissions. USB is defined as that O3 that would exist in the absence of any manmade
emissions inside the U.S. This includes anthropogenic emissions outside the U.S. as well
as naturally occurring ozone.17
A third term, North American background, is also defined in this report for added clarity. Each is
explained in more detail below.
Natural Background (NB)
Natural background ozone is what the average concentration of ground-level ozone would be
without any human influence. Ozone forms naturally in the lower levels of the atmosphere due to
natural emissions of precursors from sources including lightning, vegetation, wildfires, and
methane. Transport of ozone vertically from the stratosphere to the atmospheric layer at ground
level (called stratospheric intrusions) is a fifth major source. No air pollution monitors today are
able measure true present day NB because human contributions to the formation of ozone are so
widespread globally. The only way to estimate NB is with global scale atmospheric chemistry
simulation models with inputs representing conditions without human influence.
17 80 Federal Register 65327, note 84.

Background Ozone: Challenges in Science and Policy
Congressional Research Service R45482 · VERSION 1 · NEW 7
The remainder of this section summarizes the five major contributors to NB. A key point is that
the estimated contributions presented are uncertain and are very dependent on both location and
timing. The “Challenges in Estimating Background Ozone” section discusses specific challenges
and uncertainties associated with the data and the modeling projects.
1. Lightning (NOx). Lightning flashes cause naturally occurring nitrogen and
oxygen in the atmosphere to react and generate NOx molecules. Lightning and
the resulting emissions occur primarily during the warmer months and are
released in the free troposphere, which is above the well-mixed ground layer (see
Figure 2). There is data to suggest that lightning contributes to daily, as well as
seasonal average, ozone concentrations in high impact areas.18
2. Vegetation (VOCs). Trees release VOCs as a byproduct of photosynthesis.
Biogenic VOCs from vegetation are the largest emissions source of VOCs in the
United States, making up about 70% of the total inventory.19 Vegetation
emissions are largest during the spring and summer, when plants are actively
growing. For plants and trees that have leaves only seasonally, emissions decline
as leaves drop and photosynthesis ends.
3. Wildfires (VOCs and NOx). Wildfires release both NOx and VOCs (as well as
fine particles), but the amount and the reactivity of the polluting emissions
depend on the type of fuel that is burning and how quickly and how hot the fire
burns. Controlled/prescribed fires tend to burn cooler and release fewer
pollutants. Current research suggests that active fires contribute to daily as well
as seasonal average ozone concentrations.20 Research to improve emissions
inventories from fire events is ongoing.
4. Stratospheric intrusions. Ozone occurs naturally in the stratosphere at very high
concentrations and can occasionally be transported down to lower atmospheric
levels during certain weather events (see text box “Ozone Transport 101” for
more information about atmospheric layers and vertical transport of ozone).
Stratospheric intrusions are more likely to affect ground-level concentrations at
high elevation sites in the western United States, simply because these areas are
closer to the stratosphere. These events are more common in winter and spring
months because the large storms that cause them are more likely to occur in late
winter and spring.
5. Methane. Methane has not been traditionally considered an ozone precursor
because it does not react quickly to produce ozone. Nonetheless, it will over time
react and contribute to background ozone. Methane’s atmospheric lifetime is on
the order of a decade, compared to a timescale of months to days for other VOCs,
and so it is considered well-mixed globally by the time it contributes to the
formation of ozone. It is accumulating in the atmosphere as well, raising
background ozone concentrations. This ozone contribution is considered
approximately spatially uniform and is increasing as methane concentrations
18 Jaffe et al., “Scientific Assessment of Background Ozone over the U.S.”; S. F. Mueller and J. W. Mallard,
“Contributions of Natural Emissions to Ozone and PM2.5 as Simulated by the Community Multiscale Air Quality
(CMAQ) Model,” Environmental Science and Technology, vol. 45 (2011), pp. 4817-4823.
19 EPA, “Profile of Version 1 of the 2014 National Emissions Inventory,” 2017, pp. 3-5, https://www.epa.gov/sites/
production/files/2017-04/documents/2014neiv1_profile_final_april182017.pdf.
20 L. Zhang et al., “Sources Contributing to Background Surface Ozone in the US Intermountain West,” Atmospheric
Chemistry and Physics, vol. 14 (2014), pp. 5295-5309.

Background Ozone: Challenges in Science and Policy
Congressional Research Service R45482 · VERSION 1 · NEW 8
increase.21 The major source contributors to global methane are natural
production by bacteria in anaerobic (oxygen-free) conditions in natural wetlands
or in agriculture, fossil fuel emissions leaking or venting either naturally or from
energy development, and incomplete combustion of biomass or carbon.22
North American Background (NAB)
North American background (NAB) is the estimated concentration of ozone that excludes the
effects of all human-caused emissions in North America. NAB includes all NB sources as well as
human-caused sources of emissions from countries outside of North America.23 Air quality
monitors located at sites on the western coast of the United States are not consistently reliable
measures of NAB for two reasons: (1) Air circulation can bring continental air over the Pacific
Ocean and then back into North America. (2) If meteorological conditions are favorable, ozone
pollution formed from emissions in North America can have a long enough lifetime to travel all
the way around the globe and re-enter North America from the west. Therefore, like NB,
modeling is the best way to estimate NAB.
Human-caused sources outside of North America are currently dominated by Asian emissions.
Estimates of Asian contribution to background ozone in the United States are highly time- and
location-specific. Asian precursor emissions, and resulting ozone, travel across the Pacific Ocean
in the free troposphere (see Figure 2). However, because this pollution is traveling at higher
elevations, it is more likely to impact cities and locations in the western United States located at
higher elevations.
These upper-level air flows from areas in Asia are also more likely to affect the United States in
the late winter, spring, and early summer due to seasonal variability in hemisphere-scale
circulation patterns. Asian emissions begin to taper off in late winter, and a July/August monsoon
season in eastern China reduces formation of ozone in late summer.24 These features suggest that
the maximum impact from Asian pollution would likely occur in late winter/early spring.
U.S. Background (USB)
U.S. background (USB) includes all contributions from NB and NAB plus all human-caused
emissions from Mexico and Canada. In the publication of the most recent NAAQS for ozone,
EPA generically defined background ozone as USB:
The term “background” O3 is often used to refer to O3 that originates from natural sources
of O3 (e.g., wildfires and stratospheric O3 intrusions) and O3 precursors, as well as from
man-made international emissions of O3 precursors. Using the term generically, however,
can lead to confusion as to what sources of O3 are being considered. Relevant to the O3
implementation provisions of the CAA, we define background O3 the same way the EPA
21 A. M. Fiore et al., “Characterizing the Tropospheric Ozone Response to Methane Emission Controls and the Benefits
to Climate and Air Quality,” Journal of Geophysical Research: Atmospheres, vol. 113, no. D8 (2008).
22 S. Kirschke et al., “Three Decades of Global Methane Sources and Sinks,” Nature Geoscience, vol. 6 (2013), pp.
813-823.
23 Prior to the analysis conducted for the 2015 ozone NAAQS review, EPA referred to what they called “Policy-
Relevant Background,” which is equivalent by definition to NAB. The term is no longer used.
24 M. Lin et al., “Multi-Scale Model Analysis of Boundary Layer Ozone over East Asia,” Atmospheric Chemistry and
Physics, vol. 9, no. 10 (2009).

Background Ozone: Challenges in Science and Policy
Congressional Research Service R45482 · VERSION 1 · NEW 9
defines USB: O3 that would exist in the absence of any man-made emissions inside the
U.S.25
Mexican and Canadian emissions primarily impact locations on the borders of those two
countries, with maximum contribution estimates from one study of about 30 ppb to border
cities.26 Model estimates of the contribution of USB to total ozone range from 25 ppb to 50 ppb,
with the highest values in the inter-mountain West, based on an EPA review of model data.27
Challenges in Estimating Background Ozone The contribution of background ozone to total local ozone concentrations varies from location to
location, day to day, and even hour to hour. These variations are driven both by changes in
pollutant emissions from sources and by changing weather patterns that influence the chemistry
and physical transport of the pollutants. There is also uncertainty associated with measuring or
estimating these driving forces behind background ozone contributions.
As mentioned, estimates of source contributions to background ozone rely on computer models
that simulate atmospheric chemistry and transport and the resulting pollution. These models rely
on large datasets of emissions inventories and meteorological data, both with detailed hourly and
location-specific data. These input data are often not available at the temporal and spatial
resolution needed, and so estimates and/or simplifications must be made, which increases
uncertainty. Atmospheric measurements of ozone concentrations are then compared to model
output to evaluate how well the model is performing. However, measurement data of the
pollutants being modeled are also limited, which increases the challenge associated with
evaluating the performance of the model in capturing ozone formation and movement.
Modeling studies estimating background ozone and source attribution often present results as
seasonal averages or represent time periods that may not be of specific use to regulators. See text
box “Pollution Exposure Averaging Metrics” for additional information about averaging metrics.
Retrospective studies face all the challenges mentioned. Forecasting studies face the additional
challenge of attempting to model the future based on historical patterns and current conditions,
adding another level of uncertainty.
Pollution Exposure Averaging Metrics
The NAAQS for ozone is currently set at 70 ppb. “Attainment” of this NAAQS, however, is based on the three-
year average of the fourth-highest daily maximum eight-hour ozone concentration measured at regulatory air
quality monitors. Using the fourth-highest annual value may help protect areas from being penalized by high ozone
conditions that are uncommon. Calculating the three-year average allows for a buffer against years with
meteorological conditions that may be especially conducive to ozone. Daily maximum eight-hour averages
represent both average short-term exposure and a source or cause that is consistent throughout the day.
As mentioned, ozone concentrations change by year, day, and hour and from location to location. Background
ozone source contributions in any location can have a similarly high level of variability. Also, studies have found no
correlation between high total ozone days and days with high background ozone contributions.28 These issues
25 80 Federal Register 65327, https://www.federalregister.gov/d/2015-26594/p-1320.
26 H. Wang et al., “Surface Ozone Background in the United States: Canadian and Mexican Pollution Influences,”
Atmospheric Environment, vol. 43, no. 6 (2009), pp. 1310-1319; A. M. Fiore et al., “Estimating North American
Background Ozone in U.S. Surface Air with Two Independent Global Models: Variability, Uncertainties, and
Recommendations,” Atmospheric Environment, vol. 96 (2014), pp. 284-300.
27 EPA, “Implementation of the 2015 Primary Ozone NAAQS: Issues Associated with Background Ozone,”
https://www.epa.gov/ozone-pollution/background-ozone-workshop-and-information.
28 EPA, “Implementation of the 2015 Primary Ozone NAAQS.”
Background Ozone: Challenges in Science and Policy
Congressional Research Service R45482 · VERSION 1 · NEW 10
make it difficult to extrapolate historical background ozone impacts in a way that is informative to forecasting the
future impacts of background ozone on attainment. One way of addressing temporal variability and contribution
uncertainty is to average estimated ozone contributions across time. For this reason, many background ozone
analyses present impacts as monthly or “seasonal” average impacts: the total contribution from a particular
background source averaged over the months of the year that represent meteorological conditions conducive to
ozone formation (warm, sunny, clear skies and low wind), also referred to as an ozone season. However, while
seasonal average contribution may provide information about the relative total contributions and trends from
various sources—and therefore which sources might be of more interest for research attention—seasonal
average contributions do not provide information about how a particular source may impact the specific days with
high ozone that determine attainment.
Trends in Background Ozone Contributions According to EPA, NOx emissions from electricity generating units have decreased 81%
nationally compared to 1990 levels due in part to the acid rain program and ozone transport
rules.29 While these reductions have resulted in total ozone decreases across most of the United
States, models suggest that temperature increases in many areas of the United States during that
same time frame have negated what would have been additional ozone benefits.30
Decreasing trends in total ozone concentrations measured at regulatory monitors between 1990
and 2010 generally occur in the eastern United States.31 Many western monitors do not show
similar trends in total ozone over the same time period despite similar reductions in NOx from the
power sector and individual personal vehicles. The lack of a decreasing ozone trend at many
monitors in the West could be due to a number of causes: increasing seasonal average
temperatures, an increase in incidents of fire since 1986, emissions from oil and gas development,
increasing contributions from international transport of air pollution, and increasing global
methane concentrations.32
According to the 2017 U.S. National Climate Assessment,33 on average since 1986 in the United
States, the number of wildfires and the burn duration have both quadrupled. The number of acres
burned has increased six-fold, compared to 1970 to 1986. The report also indicates that total NOx
emissions from fire events are expected to increase with fire temperature, duration, and area
burned. Figure 3 shows the annual count, and total area burned of all wildfires larger than 1,000
acres from 1984 through 2015.
29 According to summaries available at EPA, “2016 Program Progress—Cross-State Air Pollution Rule and Acid Rain
Program,” https://www3.epa.gov/airmarkets/progress/reports/index.html; EPA, “2016 Progress Report: Cross-State Air
Pollution Rule and Acid Rain Program,” 2016, pp. 7-8, “Program Basics,” https://www3.epa.gov/airmarkets/progress/
reports/pdfs/2016_full_report.pdf.
30 J. L. Gamble (ed.) et al., “Analyses of the Effects of Global Change on Human Health and Welfare and Human
Systems,” EPA, 2008, https://www.globalchange.gov/browse/reports/sap-46-analyses-effects-global-change-human-
health-and-welfare-and-human-systems; M. Lin et al., “U.S. Surface Ozone Trends and Extremes from 1980 to 2014:
Quantifying the Roles of Rising Asian Emissions, Domestic Controls, Wildfires, and Climate,” Atmospheric Chemistry
and Physics, vol. 17 (2017), pp. 2943-2970.
31 O. R. Cooper et al., “Long‐Term Ozone Trends at Rural Ozone Monitoring Sites Across the United States, 1990-
2010,” Journal of Geophysical Research: Atmospheres, vol. 117, no. D22 (2012).
32 Cooper et al., “Long‐Term Ozone Trends at Rural Ozone Monitoring Sites Across the United States;” Lin et al.,
“U.S. Surface Ozone Trends and Extremes from 1980 to 2014,” pp. 2943-2970.
33 M. F. Wehner et al., “Droughts, Floods, and Wildfires,” in Climate Science Special Report: Fourth National Climate
Assessment, U.S. Global Change Research Program, vol. 1 (2017), pp. 231-256, https://science2017.globalchange.gov/
chapter/8/.https://science2017.globalchange.gov/chapter/8/.

Background Ozone: Challenges in Science and Policy
Congressional Research Service R45482 · VERSION 1 · NEW 11
Figure 3. Area Burned and Annual Count of Wildfires Larger Than 1,000 Acres, 1984-
2015
Source: J. Eidenshink et al., “A Project for Monitoring Trends in Burn Severity,” Fire Ecology, vol. 3, no. 1 (2007),
pp. 3-21.
While emission inventories from Asia are highly uncertain—and outdated in some modeling
cases—several sources of data suggest that Asian emissions, and potentially their impact on U.S.
air quality, have peaked. Projections of fossil fuel combustion in Asian countries suggest
uncertainty about peaking, although the Chinese government recently announced a target of a
15% reduction in NOx emissions by 2020 compared to 2015 emissions.34 A review of
measurements of baseline ozone35 taken at monitors along the western coast of North America
show that, after two decades of increasing trends, ozone flowing into the continental United
States from the west stopped increasing in the mid-2000s and has begun to decrease.36 However,
since about 2000, ozone levels measured at a rural site in Alaska have been increasing, with the
source suspected in part to be transport of East Asian air.37
Regulatory Relief Options for Some “Natural Sources”
Demonstrations of high ozone directly related to wildfires and stratospheric intrusions may be
eligible for exclusion from an ozone attainment calculation under the Exceptional Event Rule of
34 State Council, “Three-Year Action Plan for Winning the Blue Sky War” (Guo Fa [2018] No. 22, June 27, 2018) (in
Chinese), http://www.gov.cn/zhengce/content/2018-07/03/content_5303158.htm. See related LOC document at
http://www.loc.gov/law/foreign-news/article/china-2020-air-pollution-action-plan-released/.
35 Baseline ozone is a term used more generally to describe measured ozone in locations where there is no direct
influence of local emissions.
36 D. D. Parrish et al., “Reversal of Long-Term Trends in Baseline Ozone Concentrations at the North American West
Coast,” Geophysical Research Letters, vol. 44 (2017), pp. 10,675-10,681.
37 D. F. McGlynn et al., “Understanding Long-Term Variations in Surface Ozone in United States National Parks,”
Atmosphere, vol. 9, no. 125 (2018).
Background Ozone: Challenges in Science and Policy
Congressional Research Service R45482 · VERSION 1 · NEW 12
the CAA.38 In order to facilitate successful demonstrations of exceptional events, EPA released a
final guidance document in 2016 for preparations of exceptional events demonstrations for
wildfires.39 A draft guidance document was released in August 2018 covering the preparation of
exceptional events demonstrations for stratospheric ozone intrusions. These documents outline
expectations, but they do not provide the specific modeling platforms or tools required to conduct
the successful demonstrations.
State, local, and tribal co-regulators recommended to EPA that the agency develop a similar
guidance document for international emissions.40 Under Section 179B of the CAA, a
demonstration of contribution by international sources may reduce attainment demonstration
requirements in SIPs but does not provide regulatory relief from a potential nonattainment
designation.41
Issues for Congress Several issues may arise for congressional deliberations with regard to background ozone
pollution. Stakeholders suggest challenges with meeting the NAAQS, in part due to the difficulty
of reducing ozone in areas with potentially large contributions from background sources and in
part due to lack of data availability to conduct demonstrations of those background contributions.
Congress may seek to understand the progress of research on background ozone as EPA revisits
the NAAQS for ozone.
EPA released a state of the science background ozone white paper to stakeholders and requested
feedback on major issues.42 The House Committee on Science, Space and Technology revisited
the issue when its Subcommittee on Environment held a hearing on background ozone on June
21, 2018.43 The following four points summarize the opinions and policy and scientific challenges
brought forth both by stakeholder responses to the EPA white paper44 and by the testimony from
invited stakeholders at the recent background ozone hearing:
1. Some states, especially states in the western United States, have asserted that
natural and non-U.S. sources of ozone and precursors have increased the ozone
concentrations in their states.
2. Current statutory and regulatory options to address natural and non-U.S. sources
often require technical data, modeling, and analyses that may be cost prohibitive.
38 “Treatment of Air Quality Monitoring Data influenced by Exceptional Events,” 40 CFR 50.14(b)(6).
39 EPA, “Guidance on the Preparation of Exceptional Events Demonstrations for Wildfire Events That May Influence
Ozone Concentrations,” 2016, https://www.epa.gov/sites/production/files/2016-09/documents/
exceptional_events_guidance_9-16-16_final.pdf.
40 Many state and regional level air quality policy leaders and interested parties provided feedback to the white paper,
and those comments were summarized by EPA and are available at https://www.epa.gov/sites/production/files/2016-
03/documents/bgo3-high-level-summary.pdf. Additional written comments from stakeholders can be found in a
separate EPA docket available at http://www.regulations.gov (Docket ID No. EPA-HQ-OAR-2016-0097).
41 42 U.S.C. 7509a.
42 EPA, “Implementation of the 2015 Primary Ozone NAAQS.”
43 See U.S. Congress, House Committee on Science, Space, and Technology, Subcommittee on Environment, State
Perspectives on Regulating Background Ozone, 115th Cong., 2nd sess., June 21, 2018.
44 Many state and regional level air quality policy leaders and interested parties provided feedback to the white paper,
and those comments were summarized by EPA and are available at https://www.epa.gov/sites/production/files/2016-
03/documents/bgo3-high-level-summary.pdf. Additional written comments from stakeholders can be found in a
separate EPA docket available at http://www.regulations.gov (Docket ID No. EPA-HQ-OAR-2016-0097).

Background Ozone: Challenges in Science and Policy
Congressional Research Service R45482 · VERSION 1 · NEW 13
3. Modeling results that attempt to quantify levels of contribution from sources are
uncertain, and they represent historical, or average, impacts.
4. In most locations, especially urban locations, many studies (including the
whitepaper published by EPA45) have shown that local sources contribute a large
part to total local ozone.
Most recently, the U.S. Court of Appeals for the D.C. Circuit considered whether EPA should take
background ozone into account when setting NAAQS. The case has not been decided at the time
this report was published.
A potential avenue for Congress to address gaps in the scientific understanding of background
ozone is through research and development. Therefore, Congress may consider funding
implications of the following recommendations, made by stakeholders in the scientific and
regulatory communities, that are intended to improve the understanding of contributions from
background ozone:46
International engagement and/or cooperation at the federal level and through
research collaborations that may improve understanding of non-U.S.
contributions to U.S. air quality and may increase cooperation for pollution
reduction goals.
Increased monitoring at ground level and at higher levels in the atmosphere,
through state or federal regulatory air quality monitoring projects or research
campaigns, to aid in analysis of background ozone trends and improve
confidence in the performance of the models used to estimate background
contributions.
Additional research and development into model estimates of background ozone,
representing additional weather patterns (i.e., El Nino/La Nina patterns can
influence background ozone), and model simplification schemes to provide more
information about the variability associated with background ozone
contributions.
Finally, Congress may consider the role that methane plays in air quality. Methane is a precursor
to ozone, and so methane emission reductions have been suggested as one option to reduce global
background concentrations of ozone.47 Additionally, ozone itself is a strong greenhouse gas.
EPA’s review of the ozone NAAQS is underway and set to be completed in 2020, with
background ozone contributions suggested as a topic to be addressed. Congress may conduct
oversight as EPA carries out this effort.
45 EPA, “Implementation of the 2015 Primary Ozone NAAQS.”
46 Many state and regional level air quality policy leaders and interested parties provided feedback to the white paper,
and those comments were summarized by EPA and are available at https://www.epa.gov/sites/production/files/2016-
03/documents/bgo3-high-level-summary.pdf. Additional written comments from stakeholders can be found in a
separate EPA docket available at http://www.regulations.gov (Docket ID No. EPA-HQ-OAR-2016-0097).
47 A. M. Fiore et al., “Characterizing the Tropospheric Ozone Response to Methane Emission Controls and the Benefits
to Climate and Air Quality,” Journal of Geophysical Research: Atmospheres, vol. 113, no. D8 (2008).

Background Ozone: Challenges in Science and Policy
Congressional Research Service R45482 · VERSION 1 · NEW 14
Author Information
Tammy M. Thompson
Analyst in Environmental Policy
Disclaimer
This document was prepared by the Congressional Research Service (CRS). CRS serves as nonpartisan
shared staff to congressional committees and Members of Congress. It operates solely at the behest of and
under the direction of Congress. Information in a CRS Report should not be relied upon for purposes other
than public understanding of information that has been provided by CRS to Members of Congress in
connection with CRS’s institutional role. CRS Reports, as a work of the United States Government, are not
subject to copyright protection in the United States. Any CRS Report may be reproduced and distributed in
its entirety without permission from CRS. However, as a CRS Report may include copyrighted images or
material from a third party, you may need to obtain the permission of the copyright holder if you wish to
copy or otherwise use copyrighted material.