b2: wetland function assessment forms - oregon.gov 23, 2018 · consider only paved roads expected...
TRANSCRIPT

B2: Wetland Function Assessment Forms

CoverPg: Basic Description of Assessment ORWAP version 2.0.2 May 2012Site Name: Table Rock Investigator Name: L.Cleveland and B. SahatjianDate of Field Assessment: 9/11/2014County: JacksonNearest Town: White CityLatitude (decimal degrees): 42.4760Longitude (decimal degrees): -122.9630TRS, quarter/quarter section and tax lot(s) TRS: 36S 2W 5; Q-Q Section:O-NWNE; Taxlot:
10161941Approximate size of the Assessment Area (AA, in acres) 0.01AA as percent of entire wetland (approx.) 100%If delineated, DSL file number (WD #) if known n/a
Debenger Brader loams, 1 to 15 percent slopes
Debenger Brader loams, 1 to 15 percent slopesCoker Clay, 0 to 3 percent slopesCoker Clay, 1 to 5 percent slopes
PEM
HGM Class (Scores worksheet will suggest a class; see manual section 2.4.2)
Slope
If tidal, the tidal phase during most of visit: n/aWhat percent (approx.) of the wetland were you able to visit? 100%What percent (approx.) of the AA were you able to visit? 100%Have you attended an ORWAP training session? If so, indicate approximate month & year.How many wetlands have you assessed previously using ORWAP (approx.)?
Soil Map Units within the AA (list these in approx. rank order by area, from WSS web site or published county survey; see manual)
Soil Map Units surrounding and contiguous to the AA (list all present in approx. rank order by area; see manual)
Cowardin Systems & Classes (indicate all present, based on field visit and/or aerial imagery): Systems: Palustrine =P, Riverine =R, Lacustrine =L, Estuarine =EClasses: Emergent =EM, Scrub-Shrub =SS, Forested =FO, Aquatic Bed (incl. SAV) =AB, Open Water =OW, Unconsolidated Bottom =UB, Unconsolidated Shore =US
Version 2.0.2. April 2010.

1
2
3
45
67
8
9
10111213141516
171819202122
A B C D EDate: Site Name:
# Indicator Conditions Data Explanations, Definitions
The AA is all or part of a mitigation site used explicitly to offset impacts elsewhere (0= no, 1= yes)
0
(no information) 0The AA is part of or contiguous to a wetland on which public or private organizational funds were spent to preserve, create, restore, or enhance habitat mainly as part of a voluntary effort not used explicitly to offset impacts elsewhere (0= no, 1= yes)
0
(no information) 0D3 Historically Lacking Trees This AA (a) is not along (or in the biennial floodplain of) a large stream or river where riparian
woodlands would be typical and (b) had a Presettlement vegetation class not dominated by trees as indicated by the Wetlands Explorer web site: www.oregonexplorer.info/wetlands/ORWAP . Enter 1 if both are true, 0= if not.
0 If the openness of the surrounding landscape is due almost entirely to agriculture and other human activities occurring within the past century, do not answer affirmatively. This question is used as a classification variable mainly to set appropriate expectations for the extent of surrounding forest cover. [INVc,FAc,FRc,SBMc,PD,CQc,SENSc]
D4 Enclosed by Roads Draw a circle of radius of 2 miles centered on the AA. Within that circle, do paved roads completely encircle the AA? (0= no, 1= yes)
0 See illustration in Appendix A of the manual. Consider only paved roads expected to have at least 1 vehicle per hour, and which are visible in aerial imagery regardless of width. Presence of culverts or bridges along the roads is irrelevant. Do not consider other potential barriers to wildlife movement (e.g., large rivers, fields). A circle of any radius can be placed on aerial imagery at http://tnm2beta.cr.usgs.gov/viewer . Click on Imagery, then GIS Toolbox, Advanced, RangeRing. [AM-,SBM-,Stress+]
The distance from the center of the AA to the nearest road with an average daytime traffic rate of at least 1 vehicle/ minute is:>1 mile 00.5- 1 mile 01000-2600 ft 0500-1000 ft 0100-500 ft 0<100 ft 1Draw a circle of radius of 2 miles centered on the AA. Including the AA itself, the cumulative amount of forest (regardless of patch sizes) is:<5% of the circle 05 to 20% 120 to 50% 050 to 80% 0>80% 0
Forested= woody vegetation currently taller than 20 ft, and with >70% canopy closure. [SBM+]
D5 Estimate the traffic rate using your judgment and considering the road width, local population, alternate routes, and other factors. [AM-,WBN-,SBM-, PD-,STR+]
Distance to Nearest Busy Road
Forest Landscape Extent
Office Data Form (OF). ORWAP version 2.0.2 May 2012. Answering many of the following questions requires viewing aerial imagery and maps, covering an area up to within 2 miles of the AA. In the Data column, change the 0 (false) to a 1 (true) for the best choice, or for multiple choices where allowed and so indicated. Do not write in any shaded parts of this data form. Questions whose cells in column D have a "W" MUST be answered only for the ENTIRE wetland. Italicized indicators pertain only to wetland values. Although some land cover types (e.g., crops) can vary greatly from year to year, report only the conditions known to prevail during the majority of the past 5 years, or if unknown, then the conditions found in the available aerial imagery. Please do not attempt to fill out this data form until you're familiar with the accompanying manual.
D2
D1
D6
Mitigation Investment
Conservation Investment
[PUv+]
voluntary= WRP, CRP, land trust easements with partial public funding, etc. Locations of some sites are shown online at: http://www.conservationregistry.org/ . Also, locations of OWEB-funded projects are mapped at http://www.oregonexplorer.info/owri_vistool/Intro.aspx [PUv+]
Form OF, Version 2.0.2, April 2010 242

23
24
252627
2829303132
33
3435363738
39
40
41
424344454647
A B C D EThe minimum distance from the AA edge to the closest forested tract or corridor larger than 100 acres is:
<100 ft, or 100-300 ft and not separated from the AA by stretches of open water, bare ground, lawn, or impervious surface that are wider than 150 ft.
0
100-300 ft and separated from the AA by stretches of open water, bare ground, lawn, or impervious surface that are wider than 150 ft.
0
300-1000 ft 0>1000 ft 1
D8 The largest patch or corridor within 0.5 mile of the AA edge that is forested (and not separated from the AA by roads, fields, etc. that create a gap wider than 150 ft), occupies:
<1 acre of forest 11-10 acres 010-100 acres 0100-1000 acres 0>1000 acres 0
D9 Within a 2-mile radius measured from the center of the AA, the percent of the land that has natural land cover (see definition on right) is:
<5% of the land 05 to 20% of the land 020 to 60% of the land 060 to 90% of the land 1>90% of the land 0
D10 Within a 2-mile radius measured from the center of the AA, the area that is not "natural land cover" or water is mostly:impervious surface, e.g., paved road, parking lot, building, exposed rock 0
bare pervious surface, e.g., dirt or gravel road, plowed fields, dunes, recent clearcut or landslide
0
cultivated row crops, orchards, vineyards, tree plantations 1artificially landscaped areas or lawn 0grassland grazed or mowed to a height usually shorter than 4 inches 0other 0(none of above; land cover is >90% natural land cover) 0
Forest Tract Proximity
Size of Nearby Forest
Natural Land Cover Extent
Type of Land Cover Alteration
Natural land cover includes wooded areas, native prairies, sagebrush, vegetated wetlands, as well as relatively unmanaged commercial lands such as ryegrass fields, hayfields, lightly grazed pastures, timber harvest areas, and rangeland. It does not include water, row crops (vegetable, orchards, Christmas tree farms), residential areas, golf courses, recreational fields, pavement, bare soil, rock, bare sand, or gravel or dirt roads. Natural land cover is not the same as native vegetation. It frequently includes a dominance of non-native plants (e.g., cheat grass, Himalayan blackberry). Although some land cover types (e.g., crops) can vary greatly from year to year, report only the conditions known to prevail during the majority of the past 5 years, or if unknown, then the conditions found in the available aerial imagery. [AM+,SBM+)
[POLv-,AM+,SBM+]
D7 forested tract= a land cover patch that has >70% tree cover. A corridor is simply an elongated forested patch that is not narrower than 150 ft at any point. "Not separated" from the AA means not separated by roads or other features that create a tree canopy gap wider than 150 ft. [SBM+]
The patch or corridor may either be entirely or only partially within the 0.5 mile distance. Disqualify any patch or corridor of forest where canopy thins to <70% cover, or where the forested patch becomes separated from the AA by a tree canopy gap of >150 ft or where the forested corridor narrows to less than 150 ft width. See diagram in Appendix A of the manual. Patch area can be measured at http://tnm2beta.cr.usgs.gov/viewer (GIS Toolbox, Advanced) or estimated online in GoogleEarth using the following guidelines: 1 acre is about: 200 ft on a side (if square)10 acres is about: 660 ft on a side100 acres is about: 0.5 mile on a side1000 acres is about: 1 mile on a side [SBM+]
Form OF, Version 2.0.2, April 2010 342

48
49
50
51
5253
545556575859
60
61626364
656667686970
71
72737475
A B C D ED11 The minimum distance from the AA edge to the edge of the closest tract or corridor of natural
(not necessarily native) land cover larger than 100 acres, is:
<100 ft, or the AA contains >100 acres of vegetation, or >100 acres of natural land cover is connected to the AA and is not separated from it by stretches of open water, bare ground, lawn, or impervious surface that are wider than 150 ft.
1
<100 ft, but separated from the wetland by stretches of open water, bare ground, lawn, or impervious surface that are wider than 150 ft.
0
100-300 ft; and not separated from the wetland by stretches of open water, bare ground, lawn, or impervious surface that are wider than 150 ft.
0
100-300 ft, but separated from the wetland by stretches of open water, bare ground, lawn, or impervious surface that are wider than 150 ft.
0
NONE of the above 0D12 The largest patch or corridor that is natural land cover and is within 0.5 mile of the AA edge,
and not separated from the AA by roads etc. that create gaps wider than 150 ft, occupies:
<1 acre 01-10 acres 010-100 acres 0100-1000 acres 1>1000 acres 0
D13 Within 0.5 mile of the center of the AA, the AA and vegetation of the same form that is contiguous to the AA together provide (select all that apply):
the largest patch of currently ungrazed, unmowed, and unshaded herbaceous vegetation 1the largest patch of unshaded shrubland (excluding plantations) 0the largest patch of deciduous or evergreen trees (excluding plantations) 0NONE of above 0
D14 Draw a circle of radius of 2 miles centered on the AA. The amount of herbaceous openland is:
<5% of the land 05 to 20% 020 to 50% 150 to 80% 0>80% 0
D15 The distance from the AA edge to the closest patch of herbaceous openland larger than 1 acre is:
<100 ft, or the AA contains >1 acre of such cover, or is contiguous to >1 acre of such cover 1
100 to 300 ft 0300 to 1000 ft 0>1000 ft 0
Proximity to Natural Land Cover
Size of Largest Nearby Tract or Corridor of Natural Land Cover
See definition of herbaceous openland above, and photographs in Appendix A of manual.. Must be in flat terrain. [POLv+,WBF+]
Natural land cover includes wooded areas, native prairies, sagebrush, vegetated wetlands, as well as relatively unmanaged commercial lands such as ryegrass fields, hayfields, lightly grazed pastures, timber harvest areas, and rangeland. It does not include water, row crops (vegetable, orchards, Christmas tree farms), residential areas, golf courses, recreational fields, pavement, bare soil, rock, bare sand, or gravel or dirt roads. Natural land cover is not the same as native vegetation. It frequently includes a dominance of non-native plants (e.g., cheatgrass, Himalayan blackberry). [POL+,INV+,AM+,SBM+,Sens-]
This question will require field verification. In all cases, the patch may be entirely within the wetland, or may cover only part of the wetland but extend into contiguous upland. Likewise the patches to which it is being compared may be entirely or only partially within the 0.5 mile radius. There is no minimum size limit. [POLv+,AMv+,WBNv+,SBMv+,PDv+]
The patch or corridor may either be entirely or only partially within the 0.5 mile distance. Disqualify any patch or corridor of natural land cover where it becomes separated from the AA by a gap of >150 ft, if the gap is comprised of impervious surface, bare dirt, or lawn, or if the natural land corridor narrows to less than 150 ft. [POL+,AM+,WBN+,SBM+, Sens-]1 acre is about: 200 ft on a side (if square)10 acres is about: 660 ft on a side100 acres is about: 0.5 mile on a side1000 acres is about: 1 mile on a side
Herbaceous openland can include (for example) pasture, herbaceous wetland, meadow, prairie, ryegrass fields, row crops, plowed land, herbaceous rangeland, golf courses, grassed airports, and hayfields but only if they are known to be in flat terrain (almost no noticeable slope). Do not include open water of lakes, ponds, or rivers. See photographs in Appendix A of manual. In dry parts of the state, croplands in flat areas are often irrigated and are distinctly greener in aerial images. [POLv+,WBF+]
Herbaceous Open Land in Landscape
Proximity to Open Land
Local Wetland Uniqueness
Form OF, Version 2.0.2, April 2010 442
76777879808182
83848586878889
9091929394959697
9899
100101102103
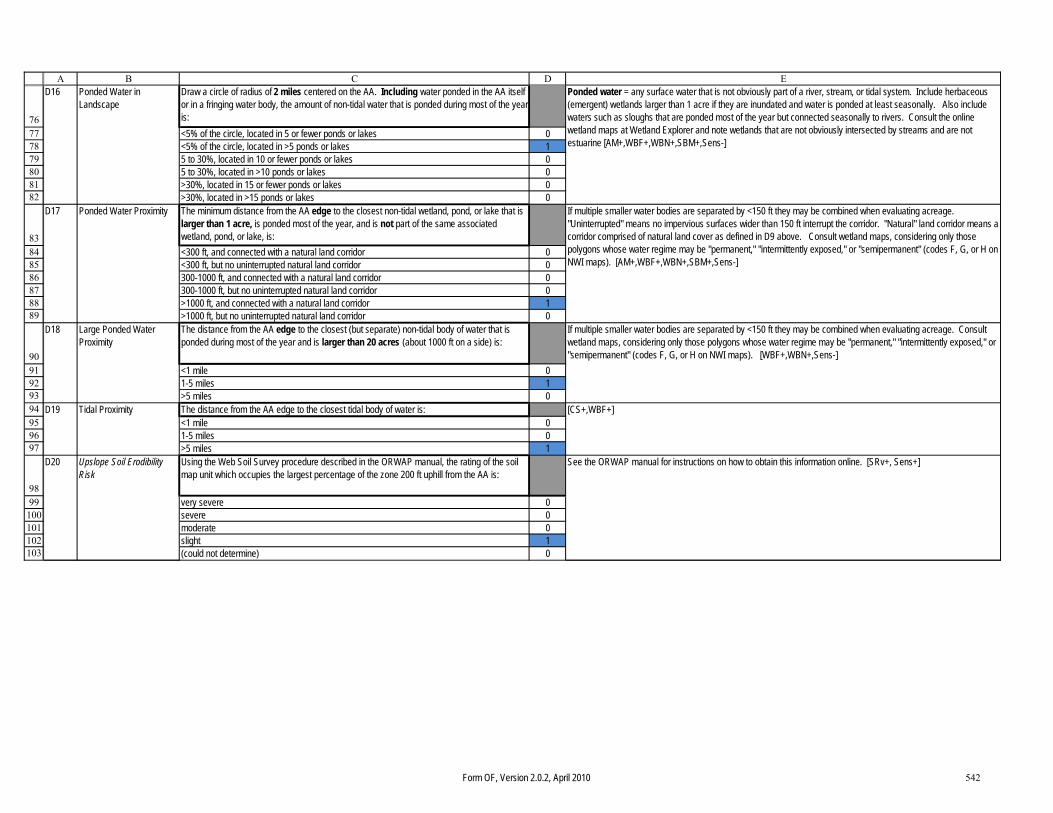
A B C D ED16 Draw a circle of radius of 2 miles centered on the AA. Including water ponded in the AA itself
or in a fringing water body, the amount of non-tidal water that is ponded during most of the year is:<5% of the circle, located in 5 or fewer ponds or lakes 0<5% of the circle, located in >5 ponds or lakes 15 to 30%, located in 10 or fewer ponds or lakes 05 to 30%, located in >10 ponds or lakes 0>30%, located in 15 or fewer ponds or lakes 0>30%, located in >15 ponds or lakes 0
D17 The minimum distance from the AA edge to the closest non-tidal wetland, pond, or lake that is larger than 1 acre, is ponded most of the year, and is not part of the same associated wetland, pond, or lake, is:<300 ft, and connected with a natural land corridor 0<300 ft, but no uninterrupted natural land corridor 0300-1000 ft, and connected with a natural land corridor 0300-1000 ft, but no uninterrupted natural land corridor 0>1000 ft, and connected with a natural land corridor 1>1000 ft, but no uninterrupted natural land corridor 0
D18 The distance from the AA edge to the closest (but separate) non-tidal body of water that is ponded during most of the year and is larger than 20 acres (about 1000 ft on a side) is:
<1 mile 01-5 miles 1>5 miles 0
D19 The distance from the AA edge to the closest tidal body of water is:<1 mile 01-5 miles 0>5 miles 1
D20 Using the Web Soil Survey procedure described in the ORWAP manual, the rating of the soil map unit which occupies the largest percentage of the zone 200 ft uphill from the AA is:
very severe 0severe 0moderate 0slight 1(could not determine) 0
Ponded Water in Landscape
See the ORWAP manual for instructions on how to obtain this information online. [SRv+, Sens+]
Ponded water = any surface water that is not obviously part of a river, stream, or tidal system. Include herbaceous (emergent) wetlands larger than 1 acre if they are inundated and water is ponded at least seasonally. Also include waters such as sloughs that are ponded most of the year but connected seasonally to rivers. Consult the online wetland maps at Wetland Explorer and note wetlands that are not obviously intersected by streams and are not estuarine [AM+,WBF+,WBN+,SBM+,Sens-]
If multiple smaller water bodies are separated by <150 ft they may be combined when evaluating acreage. "Uninterrupted" means no impervious surfaces wider than 150 ft interrupt the corridor. "Natural" land corridor means a corridor comprised of natural land cover as defined in D9 above. Consult wetland maps, considering only those polygons whose water regime may be "permanent," "intermittently exposed," or "semipermanent" (codes F, G, or H on NWI maps). [AM+,WBF+,WBN+,SBM+,Sens-]
Large Ponded Water Proximity
Tidal Proximity
Upslope Soil Erodibility Risk
Ponded Water Proximity
[CS+,WBF+]
If multiple smaller water bodies are separated by <150 ft they may be combined when evaluating acreage. Consult wetland maps, considering only those polygons whose water regime may be "permanent," "intermittently exposed," or "semipermanent" (codes F, G, or H on NWI maps). [WBF+,WBN+,Sens-]
Form OF, Version 2.0.2, April 2010 542

104105106107108109110
111
112
113
114115116
117118119120121122
A B C D ED21 Using the Web Soil Survey AOI tool to measure it, what is the area of the largest patch of
emergent, shrub, or forest vegetation within the entire wetland of which the AA is a part? Use just the dominant class. See instructions in last column.
<0.1 acre 10.1 - 1 acre 01 to 10 acres 010 to 100 acres 0100 to 1000 acres 0>1000 acres 0
D22 From the Wetlands Explorer web site (see Manual), note the 12-digit code number for this wetland's HUC6 (Hydrologic Unit Code, i.e., watershed). Then turn to the HUC4, HUC5, and HUC6 worksheets in the ORWAP_SuppInfo file. Compare the extent of the wetland's dominant vegetation form (from above) with that of the largest wetlands of the same class in the same HUC4 (first 8 digits), the same HUC5 (first 10 digits), and the same HUC6 (12 digits). Enter "1" for all that apply below:
the vegetated part of this wetland is as large or larger than any of its class mapped in its HUC4 watershed
0
the vegetated part of this wetland is as large or larger than any of its class mapped in its HUC5 watershed
0
the vegetated part of this wetland is as large or larger than any of its class mapped in its HUC6 watershed
0
none of above 1data are inadequate (NWI mapping not >90% completed in HUC) 0
D23 Turn to the HUCbest worksheet in the ORWAP_SuppInfo file. Using the HUC code noted from the web site, is this AA located in one of the HUCs that are listed as having a large diversity of wetland types relative to area of wetlands (column 3), or a large number (column 4) or area (column 5) of wetlands relative to area of the HUC? Enter "1" for all that apply below:
yes, for the HUC4 watershed 0yes, for the HUC5 watershed 0yes, for the HUC6 watershed 1none of above 0data are inadequate (NWI mapping not completed in HUC) 0
"type diversity" was based on Cowardin system and class (e.g., Palustrine emergent). Note that data are lacking for some HUCs. Because the diversity of types, number of wetlands, and proportional area of wetlands are highly intercorrelated, the criteria used to define "large" were based on the residuals of regression of those variables against wetland area or numbers in the associated HUC. Thus, the relative rather than the absolute number of types or number of wetlands in the HUC was the basis for judging "large," and the top 5% of the residuals was used to identify the most outstanding wetlands in each category. [AM+, WBF+, WBN,+ SBM]+
When drawing the polygon around the patch, exclude vegetation of the same patch type if separated by a gap created by open water, a road, dike, or upland that is wider than 150 ft. [WBF+, WBN+, SBM+, POL+, Sens-]
"of its type" means Cowardin system and class. First determine size importance in HUC6 and if criteria met, then also screen for importance in HUC5 and if met then in HUC4. Alternatively, instead of checking the worksheets, you may go to the Wetland Explorer web site, locate this wetland, activate the boundaries for wetlands plus the HUC4, 5, and 6, and then determine visually if this is the largest wetland of its class. Note that data are lacking for some HUCs. Also note that a HUC4 is the same as an 8-digit HUC, a HUC5 is the same as a 10-digit HUC, and a HUC6 is the same as a 12-digit HUC. [WBFv+, WBNv+, SBMv+]
Wetland Size Uniqueness in Watershed
Extent of Dominant Vegetation Class in Wetland
Wetland Number & Diversity Uniqueness
Form OF, Version 2.0.2, April 2010 642
123
124
125
126
127
128
129
130
131
132
133
134
135
A B C D E
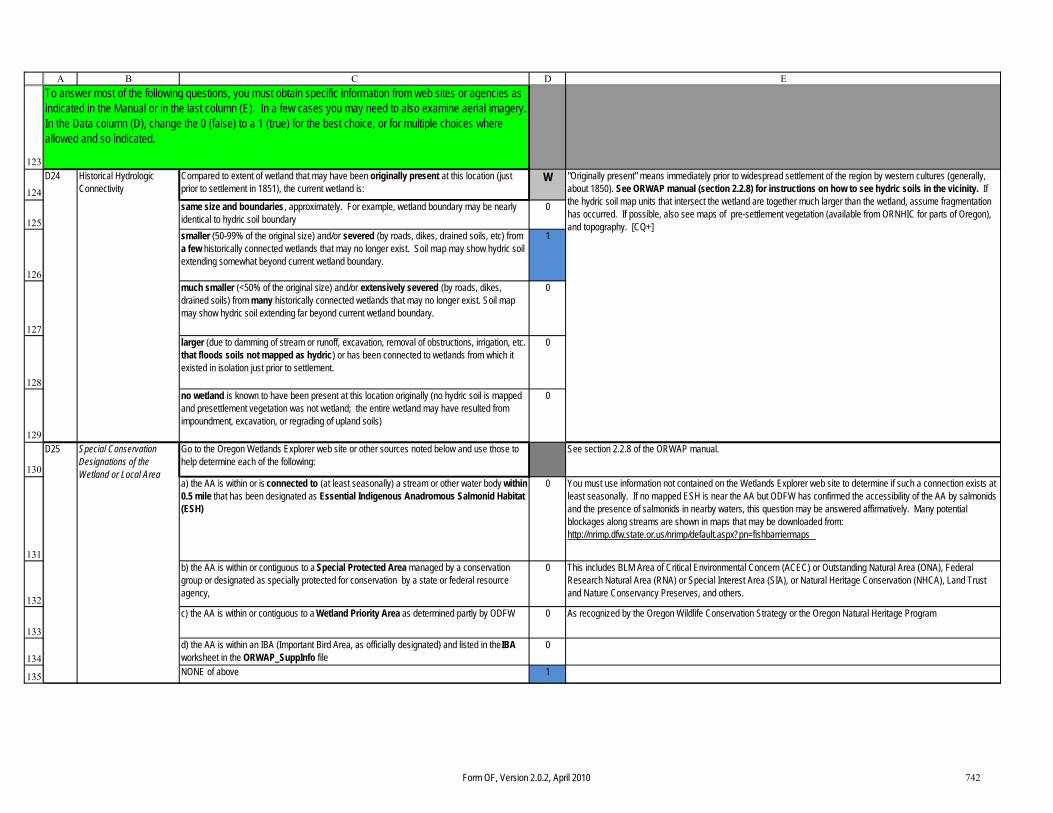
D24 Compared to extent of wetland that may have been originally present at this location (just prior to settlement in 1851), the current wetland is:
W
same size and boundaries, approximately. For example, wetland boundary may be nearly identical to hydric soil boundary
0
smaller (50-99% of the original size) and/or severed (by roads, dikes, drained soils, etc) from a few historically connected wetlands that may no longer exist. Soil map may show hydric soil extending somewhat beyond current wetland boundary.
1
much smaller (<50% of the original size) and/or extensively severed (by roads, dikes, drained soils) from many historically connected wetlands that may no longer exist. Soil map may show hydric soil extending far beyond current wetland boundary.
0
larger (due to damming of stream or runoff, excavation, removal of obstructions, irrigation, etc. that floods soils not mapped as hydric) or has been connected to wetlands from which it existed in isolation just prior to settlement.
0
no wetland is known to have been present at this location originally (no hydric soil is mapped and presettlement vegetation was not wetland; the entire wetland may have resulted from impoundment, excavation, or regrading of upland soils)
0
D25 Go to the Oregon Wetlands Explorer web site or other sources noted below and use those to help determine each of the following:
See section 2.2.8 of the ORWAP manual.
a) the AA is within or is connected to (at least seasonally) a stream or other water body within 0.5 mile that has been designated as Essential Indigenous Anadromous Salmonid Habitat (ESH)
0 You must use information not contained on the Wetlands Explorer web site to determine if such a connection exists at least seasonally. If no mapped ESH is near the AA but ODFW has confirmed the accessibility of the AA by salmonids and the presence of salmonids in nearby waters, this question may be answered affirmatively. Many potential blockages along streams are shown in maps that may be downloaded from: http://nrimp.dfw.state.or.us/nrimp/default.aspx?pn=fishbarriermaps
b) the AA is within or contiguous to a Special Protected Area managed by a conservation group or designated as specially protected for conservation by a state or federal resource agency,
0 This includes BLM Area of Critical Environmental Concern (ACEC) or Outstanding Natural Area (ONA), Federal Research Natural Area (RNA) or Special Interest Area (SIA), or Natural Heritage Conservation (NHCA), Land Trust and Nature Conservancy Preserves, and others.
c) the AA is within or contiguous to a Wetland Priority Area as determined partly by ODFW 0 As recognized by the Oregon Wildlife Conservation Strategy or the Oregon Natural Heritage Program
d) the AA is within an IBA (Important Bird Area, as officially designated) and listed in the IBA worksheet in the ORWAP_SuppInfo file
0
NONE of above 1
"Originally present" means immediately prior to widespread settlement of the region by western cultures (generally, about 1850). See ORWAP manual (section 2.2.8) for instructions on how to see hydric soils in the vicinity. If the hydric soil map units that intersect the wetland are together much larger than the wetland, assume fragmentation has occurred. If possible, also see maps of pre-settlement vegetation (available from ORNHIC for parts of Oregon), and topography. [CQ+]
Historical Hydrologic Connectivity
To answer most of the following questions, you must obtain specific information from web sites or agencies as indicated in the Manual or in the last column (E). In a few cases you may need to also examine aerial imagery. In the Data column (D), change the 0 (false) to a 1 (true) for the best choice, or for multiple choices where allowed and so indicated.
Special Conservation Designations of the Wetland or Local Area
Form OF, Version 2.0.2, April 2010 742

136
137
138
139
140
141
142143
144
145
146147148
149
150
151152153
154
155
156157
158
A B C D ED26 According to the Wetlands Explorer web site, the score for occurrences of rare non-
anadromous fish species in the vicinity of this AA is:
high (≥ 0.75 for maximum score, or ≥ 0.90 for this group's score sum), or there is a recent (within 5 yrs) onsite observation of any of these species by a qualified observer under conditions similar to what now occur
1
intermediate (i.e., not as described above or below) 0
low (≤ 0.33 for both the maximum score this group's score sum, but not 0 for both) 0
zero for both this group's maximum and its sum score, and no recent onsite observation of these species by a qualified observer under conditions similar to what now occur
0
D27 According to the Wetlands Explorer web site, the score for occurrences of rare invertebrate species in the vicinity of this AA is: high (≥ 0.75 for maximum score, or for this group's score sum), or there is a recent onsite observation of any of these species by a qualified observer under conditions similar to what now occur
0
low (< 0.75 for maximum score AND for this group's score sum, but not 0 for both) 1zero for both this group's maximum and its sum score, and no recent onsite observation of these species by a qualified observer under conditions similar to what now occur
0
D28 According to the Wetlands Explorer web site, the score for occurrences of rare amphibian or reptile species in the vicinity of this AA is: high (≥ 0.60 for maximum score, or >0.90 for score sum), or there is a recent onsite observation of any of these species by a qualified observer under conditions similar to what now occur
0
intermediate (i.e., not as described above or below) 0low (≤ 0.21 for maximum score AND <0.15 for score sum, but not 0 for both) 1zero for both this group's maximum and its sum score, and no recent onsite observation of these species by a qualified observer under conditions similar to what now occur
0
D29 According to the Wetlands Explorer web site, the score for occurrences of rare nesting waterbird species in the vicinity of this AA is: high (≥ 0.60 for maximum score, or ≥1.00 for this group's score sum), or there is a recent onsite observation of any of these species by a qualified observer under conditions similar to what now occur
0
intermediate (i.e., not as described above or below) 0low (≤ 0.09 for maximum score and for score sum, but not 0 for both) 0zero for both this group's maximum and its sum score, and no recent onsite observation of these species by a qualified observer under conditions similar to what now occur
1
D30 According to the Wetlands Explorer web site, the score for occurrences of rare non-breeding (feeding) waterbird species in the vicinity of this AA is: high (≥ 0.33 for maximum score, or there is a recent onsite observation of any of these species by a qualified observer under conditions similar to what now occur
0
low (< 0.33 for maximum score and for score sum, but not 0 for both) 0zero for both this group's maximum and its sum score, and no recent onsite observation of these species by a qualified observer under conditions similar to what now occur
1
Species include: Painted Turtle (S2), Northwestern Pond Turtle (S2), Clouded Salamander (S3), Oregon Slender Salamander (S2), Larch Mountain Salamander (S2), Siskiyou Mountains Salamander (S2), Cope's Giant Salamander (S2), Cascade Torrent Salamander (S3), Columbia Torrent Salamander (S3), Coastal Tailed Frog (S3), Inland Tailed Frog (S2), Northern Red-legged Frog (S3), Foothill Yellow-legged Frog (S2), Cascades Frog (S3), Northern Leopard Frog (S1), Oregon Spotted Frog (S2), Columbia Spotted Frog (S2), Great Basin Back-collared Lizard (S3), Desert Horned Lizard (S3), Night Snake (S3), Common Kingsnake (S3), Ground Snake (S3). [AMv+]
Species include Pit-Klamath brook lamprey (S3), Miller Lake lamprey (S1), Klamath lamprey (S3), Malheur mottled sculpin (S3), Margined sculpin (S3), Slender sculpin (S3), Alvord chub (S2), Tui chub (S), Borax Lake chub (S1), Speckled dace (SS), Oregon chub (S2), Umpqua chub (S2), Modoc sucker (S1), Klamath smallscale sucker (SS), Warner sucker (S1), Shortnose sucker (S1), Pit Sculpin (S1), Klamath Lake Sculpin (S3), Bull Trout (S3), Blue Chub (S3), Umpqua Dace (S3), Lahontan Redside (S2), Klamath Largescale Sucker (S3), Tahoe Sucker (S1), Lost River Sucker (S1), Sacramento Perch (S3). Note that for some of these species, only specific geographic populations are designated. S1 is the most imperiled, S3 less so, according to ratings by the Oregon Natural Heritage Information Center. [FRv+]
Species include: Red-necked Grebe (S1), Am. White Pelican (S2), Snowy Egret (S2), Barrow's Goldeneye (S3), Bufflehead (S2), Yellow Rail (S1), Sandhill Crane (S3), Snowy Plover (S2), Black-necked Stilt (SS), Long-billed Curlew (S3), Franklin's Gull (S2), Caspian Tern (SS). [WBNv+]
"Non-breeding" mainly refers to waterbird feeding during migration and winter. [WBFv+]Feeding (Non-breeding) Waterbird Species of Conservation Concern
Amphibian or Reptile of Conservation Concern
Nesting Waterbird Species of Conservation Concern
Invertebrate Species of Conservation Concern
Non-anadromous Fish Species of Conservation Concern
Form OF, Version 2.0.2, April 2010 842

159
160
161
162
163
164
165166
167
168169
170
171
172
173
174
175
176
177
178179
A B C D ED31 According to the Wetlands Explorer web site, the score for occurrences of rare songbird,
raptor, or mammal species in the vicinity of this AA is:
high (≥ 0.60 for maximum score, or >1.13 for score sum), or there is a recent onsite observation of any of these species by a qualified observer under conditions similar to what now occur
0
intermediate (i.e., not as described above or below) 1
low (≤ 0.09 for maximum score AND <0.13 for score sum, but not 0 for both) 0
zero for both this group's maximum and its sum score, and no recent onsite observation of these species by a qualified observer under conditions similar to what now occur
0
D32 According to the Wetlands Explorer web site, the score for occurrences of rare plant species in the vicinity of this AA is: high (≥ 0.75 for maximum score, or > 4.00 for score sum), or there is a recent onsite observation of any of these species by a qualified observer under conditions similar to what now occur
0
intermediate (i.e., not as described above or below) 1low (≤ 0.12 for maximum score AND < 0.20 for score sum, but not 0 for both) 0
zero for both this group's maximum and its sum score, and no recent onsite observation of these species by a qualified observer under conditions similar to what now occur
0
D33 According to the Wetlands Explorer web site:The AA is tidal, or is either (a) not within a 100-yr floodplain of a river, or (b) there are no inhabited buildings or cropland within 2 miles downslope that are within the 100-yr floodplain. Mark "1" then SKIP TO D35.
1
Inhabited buildings within 1 mile downslope from the AA also are within the 100-yr floodplain 0
Croplands but no inhabited buildings are within 1 mile downslope from the AA, and that cropland is also within the 100-yr floodplain
0
Inhabited buildings within 1-2 miles downslope from the AA are also are within the 100-yr floodplain
0
Croplands but no inhabited buildings are within 1-2 miles downslope from the AA, and that cropland is also within the 100-yr floodplain
0
No floodplain data are available, and damage from river floods has not been known to have occurred within 2 miles downgradient. Mark "1" then SKIP to D35.
0
D34
Between the AA and any floodable buildings or cropland located within 2 miles downslope:river flow is regulated and there are many seasonally ponded areas capable of storing water. 0
river flow is regulated or there are many seasonally ponded areas capable of storing water. 0
NONE of the above 0
Downslope Storage
Do not consider pasture or hayfields to be "cropland." See the ORWAP manual for instructions on how to obtain this information online at http://www.oregonexplorer.info/wetlands/ORWAP [WSv+]
[PDv+]
Floodable Property
"Seasonally ponded areas" includes (for example) detention ponds, reservoirs, and depressional wetlands [WSv-]
Songbird, Raptor, Mammal Species of Conservation Concern
Species include: Bald Eagle (SS), Northern Goshawk (S3), Swainson's Hawk (S3), Ferruginous Hawk (S3), Peregrine Falcon (S1), Band-tailed Pigeon (S3), Flammulated Owl (S3), Burrowing Owl (S3), Spotted Owl (S3), Great Gray Owl (S3), Short-Eared Owl (SS), Common Nighthawk (SS), Lewis's Woodpecker (S3), White-Headed Woodpecker (S2), Black-Backed Woodpecker (S3), American Three-toed Woodpecker (S3), Pileated Woodpecker (SS), Olive-sided Flycatcher (S3), Willow Flycatcher (SS), Horned Lark (SS), Purple Martin (S2), White-breasted (Slender-billed) Nuthatch (SS), Blue-gray Gnatcatcher (S3), Varied Thrush (SS), Loggerhead Shrike (S3), Yellow-breasted Chat (SS), Chipping Sparrow (SS), Brewer's Sparrow (SS), Vesper Sparrow (SS), Sage Sparrow (SS), Grasshopper Sparrow (S2), Western Meadowlark (SS), Fringed Myotis (S2), Long-Legged Myotis (S3), California Myotis (S3), Silver-haired Bat (S3), Hoary Bat (S3), Spotted Bat (S2), Townsend's Big-eared Bat (S2), Pallid Bat (S2), Red Tree Vole (S3), Kit Fox (S1), Ringtail (S3), American Marten (S3), Fisher (S2), Columbian White-Tailed Deer (SS) . [SBMv+]
Plant Species of Conservation Concern
Form OF, Version 2.0.2, April 2010 942

180
181
182
183
184
185186
187
188
189190191192
193
194
195
196
197198199200
A B C D ED35 According to Wetlands Explorer map showing this AA's position within its HUC4 (8-digit)
watershed, the AA is [see last column and Manual for specific guidance]:
in the upper one-third of its watershed 0
in the middle one-third of its watershed 1
in the lower one-third of its watershed 0
D36 Based on the definition and protocol in the ORWAP manual, the area of the wetland of which this AA is a part, relative to the wetland's contributing area (CA) is:
W
<1% of its CA (true if wetland is tidal, or along major river, or has many tributaries, or gets substantial water drawn from other surface water bodies, e.g., flood irrigation)
0
1 to 10% of its CA 110 to 100% of its CA 0
Larger than the area of its CA (wetland has essentially no CA, e.g., isolated by dikes with no input channels, or is in terrain so flat that a CA can't be delineated). SKIP TO D40.
0
D37 The proportion of the CA comprised of buildings, roads, parking lots, other pavement, exposed bedrock, and other impervious surface is about :
W
>25% 010 to 25% 0<10%, or wetland is tidal 1
D38 The cumulative area of seasonally ponded areas in the same CA is: WMuch (>10x) greater than the area of this wetland (plus any contiguous pond or lake), or inflow is strongly regulated by dams etc.
0
Somewhat greater than the area of this wetland (plus any contiguous pond or lake) and flows to wetland are not strongly regulated
0
Less than the area of this wetland (plus any contiguous pond or lake), or wetland is tidal, or no upslope wetlands/ ponds and no inflow regulation
1
D39 A relatively large proportion of the precipitation that falls farther upslope in the CA reaches this wetland quickly as runoff (surface water), as indicated by the following: (a) input channel is present, (b) CA slopes are steep, (c) input channels have been straightened, (d) upslope wetlands have been ditched extensively, (e) land cover is mostly non-forest, and/or (f) most CA soils are shallow and/or have high runoff coefficients). This statement is:
W
Mostly true 0Somewhat true 0Mostly untrue, or wetland is tidal 1
Contributing Area (CA) Percent
"Seasonally ponded area" includes (for example) detention ponds, reservoirs, and depressional wetlands [WSv-,SRv-,PRv-,NRv-]
Unvegetated Surface in the Contributing Area
Upslope Storage
[WSv+,SRv+,PRv+,NRv+]Transport From Upslope
Relative Elevation in Watershed
1) Which end of the HUC4 is the bottom? Where streams join, the “V” that they form on the map points towards bottom of the HUC.2) If the AA is closer to the HUC4's outlet than to its upper end, and is closer to the river or large stream that exits at the bottom of the HUC4 than it is to the boundary (margin) of the HUC4, then check "lower 1/3” If not near that river, check "middle 1/3".3) If the AA is not in a 100-yr floodplain, is closer to the HUC4 upper end than to its outlet, and is closer to the boundary (margin) of the HUC4 than to the river or large stream that exits at the bottom of the HUC4, then check "upper 1/3” 4) For all other conditions, check "middle 1/3".
The CA is basically the upslope area that has the potential to deliver water to the wetland. The CA boundary typically does not cross any streams or ditches except the one at the wetland outlet (if any). Remember that if the wetland is flooded as little as once every 2 years by river flow, the CA includes all upslope areas that feed that river. If the wetland is on the fringe of a pond or lake, compare the area of that water body to its contributing area -- not the area of the wetland compared to only the wetland's contributing area. For most wetlands, and especially ones containing tributaries, the first choice will be the most appropriate. For AA's that are intercepted by a mapped stream, delineation and area calculation for the CA will be done automatically at this USGS web site: http://streamstats.usgs.gov/orstreamstats/index.asp . Enter the coordinates, zoom to scale of 1:24000 or finer, click on the stream, and click on Basin Delineation, then BasinChar. [WSv+,SRv+,PRv+,NRv+, Sens+]
[WSv-,SRv-,PRv-,NRv-]
Form OF, Version 2.0.2, April 2010 1042

201202203204205206207
208209210211212213
214
215
216217218219220221222223
224
225226
227228229230231232233
A B C D ED40 Within 1 mile upstream from the wetland, at least one of the major sources of surface water to
this wetland (at least seasonally) has been designated as Water Quality Limited (303d) for at least one of the parameters below. Obtain from web site only -- do not guess. Select all that apply.
W
total suspended solids (TSS), sedimentation, or turbidity 0phosphorus 0nitrate or ammonia 0toxics, dioxin, heavy metals (iron, manganese, lead, zinc, etc.) 0temperature 0None of above, or degraded water cannot reach wetland, or no data. 1
D41 Within 1 mile downstream or downslope from this wetland, there is at least one stream or other water body that has been designated as Water Quality Limited (303d) for at least one of the parameters below. The water body need not be connected to the AA. Obtain from web site only -- do not guess. Select all that apply.
W
total suspended solids (TSS), sedimentation, or turbidity 0phosphorus 0nitrate or ammonia 0toxics, dioxin, heavy metals (iron, manganese, lead, zinc, etc.) 0temperature 0None of above, or no data. Mark "1" then SKIP TO D43. 1
D42 At least part of the AA is connected to the downstream 303d water mentioned in D41 above:
for 9 or more continuous months annually (persistent water in a stream, ditch, lake, or other water body)
0
intermittently (at least once annually, but for less than 9 months continually) 0Not connected, or connected less than annually 0
D43 According to the ODEQ LASAR database, the AA is within:the source area for a surface-water drinking water (DW) source 0the source area for a groundwater drinking water source 0Neither of above 1
D44 The AA is (select all that apply):within a designated Groundwater Management Area (ODEQ), see maps in Appendix A of ORWAP manual.
0
within a designated Sole Source Aquifer area (EPA): the North Florence Dunal Aquifer. See map downloadable from: http://oregonstatelands.us/DSL/WETLAND/or_wet_prot.shtml
0
NONE of above 1D45 According to the PRISM Data Explorer (see ORWAP manual for instructions), annual
precipitation in the vicinity of the wetland has normally been:
<10 inches per year 010-12 inches per year 013-19 inches per year 020-47 inches per year 148-77 inches per year 0>77 inches per year 0
[NRv+]
Obtain online as explained in Manual from: http://gisdev.nacse.org/prism/nn/index.phtml These categories reflect the 10th, 25th, 50th, 75th, and 90th percentiles of all points in a comprehensive spatial grid of annual precipitation points in Oregon, for the years 1971-2000. [INVv+,AMv+,WBFv+,WBNv+,SBMv+,PDv+,Sens-]
Mean Annual Precipitation
Groundwater Risk Designations
Known Water Quality Issues in the Input Water
See the ORWAP manual (section 2.2.7) for instructions on how to obtain this information online at http://deq12.deq.state.or.us/lasar2/default.aspx [SRv+,PRv+,NRv+,TRv+,INV-,WBF-,WBN-,STR+]
See the ORWAP manual (section 2.2.7) for instructions on how to obtain this information online at http://deq12.deq.state.or.us/lasar2/default.aspx [SRv+,PRv+,NRv+,TRv+,INV-,WBF-,WBN-,STR+]
persistent water= flows for more than 9 months during most years. [SRv+,PRv+,NRv+,TRv+,INV-,WBF-,WBN-,STR+]
See the ORWAP manual (section 2.2.7) for instructions on obtaining this online from http://deq12.deq.state.or.us/lasar2/default.aspx [NRv+]
Drinking Water Source (DEQ)
Known Water Quality Issues Below the Wetland
Type of Outflow Connection to 303d
Form OF, Version 2.0.2, April 2010 1142

234235236237238
239240241242243244245
246247
248
249250251252253
254
A B C D ED46 The phosphorus loading rank of the county in which the AA is located is: (select one); see
WQprob worksheet in ORWAP SuppInfo file. top 4 in Oregon (Marion, Malheur, Umatilla, Linn) 0top 18 (see Table 6 in WQprob worksheet in file ORWAP_SuppInfo) 0bottom 18 (see Table 6 in WQprob worksheet) 1bottom 4 (Josephine, Hood River, Lincoln, Clatsop) 0
D47 The nitrogen loading rank of the county in which the AA is located is: (select one); see WQprob worksheet in ORWAP SuppInfo file. top 4 in Oregon (Marion, Malheur, Umatilla, Linn) 0top 18 (see Table 7 in WQprob worksheet) 0bottom 18 (see Table 7 in WQprob worksheet) 1bottom 4 (Curry, Josephine, Lincoln, Clatsop) 0
D48 The AA's relative position in the estuary is (SKIP if nontidal):lower 1/3 (often on a bay and distant from the head-of-tide of a major river; includes most saline tidal wetlands)
0
mid 1/3 0upper 1/3 (near the head-of-tide of a major river; includes most brackish and fresh tidal wetlands)
0
D49 The usual maximum water-surface salinity during high tide in summer in the main channel or bay closest to the AA is (SKIP if nontidal):>30 parts per thousand (undiluted seawater) 05-30 ppt (mesohaline, polyhaline) 00.5 - 5 ppt (oligohaline) 0<0.5 ppt (fresh) 0no data for nearby locations found at the ODEQ LASAR web site or from other sources 0
Answer these final two questions only if the AA is tidal.Estuarine Position
County Rank for Phosphorus Loading
If you don't know it, determine which county the wetland is in from the ODEQ web site ttp://deq12.deq.state.or.us/lasar2/default.aspx as explained in Manual. Data used for these rankings are from a national survey by USGS and represent the combined inputs (kg of P per sq. km.) from fertilizer (2001) and livestock (average of the years 1982, 1987, 1992, and 1997). [PRv+]
County Rank for Nitrogen Loading
Refer to Estuary Salinity maps at http://oregonstatelands.us/DSL/WETLAND/or_wet_prot.shtml or (preferably) determine this from field measurement or from data at the ODEQ LASAR web site (see ORWAP manual for instructions on accessing those data). [SR-,PR-,CS+,OE+,FA-,PD-]
Determine county from a map or online from http://deq12.deq.state.or.us/lasar2/default.aspx as explained in Manual. Data used for these rankings are from a national survey by USGS and represent the combined inputs (kg of N per sq. km.) from fertilizer, livestock, and atmospheric deposition of N during 2001. [NRv+]
[WSv+,PR+,PD+]
Salinity
Form OF, Version 2.0.2, April 2010 1242

1
2
3
4
5
6
7
8
9
10
11
12
13
A B C D EDate: Site Name: Investigator:
# Indicator Conditions Data Explanations, Definitions
Does the AA contain, or is it part of, any of these wetland types? Mark "1" next to all that apply. W
Tidal wetland: receives tidal water at least once during a normal year, regardless of salinity, and dominated by emergent or woody vegetation.
0 tidal = level of surface water fluctuates every ~6 hours on a daily basis in response to tides. [All functions, as classifier]
Lacustrine wetland: an undiked non-tidal wetland bordering a body of standing open water that is >20 acres.
0 open water = surface water that contains no vegetation (except perhaps floating-leaved or completely submersed species). [WBN+]
Fringe wetland: an undiked "shoreline" wetland bordering persistent open water that is >3 times wider than the wetland (includes most tidal, lacustrine, large riverine, some others).
0 [WSv-, T-, FA+,FR+, WBF+]
NONE of above 1
F2 Does the AA contain, or is it part of, any of these wetland types? Mark "1" next to all that apply. Consult the "Rare Wetland Type" reported for the general vicinity by the Oregon Explorer web site, but be aware that those may not apply to the exact AA you have delimited.
W
Bog or Fen: contains a sponge-like organic soil layer which covers most of the AA AND often has extensive cover of sedges and/or broad-leaved evergreen shrubs (e.g., Ledum ). Often lacks tributaries, being fed mainly by groundwater and/or direct precipitation.
0 [CS+,Sens+]
Playa, Salt Flat, or Alkaline Lake: a non-tidal ponded water body usually having saline (salinity >1 ppt or conductivity >1000 µS ) or alkaline (conductivity >2000 µS and pH >9) conditions and large seasonal water level fluctuations (if inputs-outputs unregulated). If a playa or salt flat, vegetation cover is sparse and plants typical of saline or alkaline conditions (e.g., Distichlis , Atriplex ) are common.
0 See file ORWAP_SuppInfo, worksheet P_Salt for species typically occurring in tidal or saline conditions. [PR+,CS+,INV+,FA-,FR-,AM-,WBF+]
Hot spring (anywhere in Oregon): a wetland where discharging groundwater in summer is >10 degrees (F) warmer than the expected water temperature.
0 [FA-]
Native wet prairie (west of the Cascade crest): a seasonally inundated wetland, usually without a naturally-occurring inlet or outlet, and dominated primarily by native graminoids often including species in column E.
0 Deschampsia caespitosa, Danthonia californica, Camassia quamash, Triteleia hyacinthina, Carex densa, C. aperta, and/or C. unilateralis [PDv,CQc]
Presence of Specific Wetland Types
Wetland Type of Conservation Concern
Field F data form. ORWAP version 2.0.2 May 2012. In the Data column, change the 0 (false) to a 1 (true) for the best choice, or for multiple choices where allowed and so indicated. Answer these questions primarily based on your onsite observations and interpretations. Do not write in any shaded parts of this data form. Answering some questions accurately may require conferring with the landowner or other knowledgable persons, and/or reviewing aerial imagery. Although accuracy will be greater if questions are answered for the entire wetland (not limiting only to the part potentially affected by a project), most questions may be answered for just part of a wetland-- the assessment area (AA). HOWEVER, questions with a W in the gray box in column D must be answered for the ENTIRE wetland of which the AA is a part.
F1
Form FieldF version 2.0.2 April 2010

14
15
16
17
18
19
20
2122
A B C D EVernal pool (Willamette Valley): a seasonally inundated wetland, underlain by hardpan or claypan, with hummocky micro-relief, usually without a naturally-occurring inlet or outlet, and with native plant species distinctly different from those in slightly higher areas, and often including species in column E.
0 Downingia elegans, Isoetes nuttallii, Triteleia hyacinthina, Eleocharis spp., Eryngium petiolatum, Plagiobothrys figuratus, Plagiobothrys scouleri, Grindelia nana, Veronica peregrina, Lasthenia glaberrima , Cicendia quadrangularis, Kickxia elatine, Gnaphalium palustre, and/or Callitriche spp.[PDv]
Vernal pool (Medford area): a seasonally inundated acidic wetland, underlain by hardpan, with hummocky micro-relief, usually without a naturally-occurring inlet or outlet, and having concentric rings of similar native vegetation, often including species in column E.
0 Downingia vina, Isoetes nuttalli, Pilularia americana, Triteleia hyacinthina, Eleocharis spp., Eryngium petiolatum, Plagiobothrys brachteatus, Plagiobothrys scouleri, Grindelia nana, Veronica peregrina, Alopecurus saccatus, Lasthenia californica, Deschampsia danthonioides, and/or Callitriche spp. [PDv]
Vernal pool (Modoc basalt & Columbia Plateau): a seasonally inundated wetland, usually without a naturally-occurring inlet or outlet, located on shallow basalt bedrock and often having species in column E.
0 Blennosperma nanum, Camassia quamash, Epilobium densiflorum, Callitriche marginata, Cicendia quadrangularis, Eryngium vaseyi, Psilocarphus brevissimus, and/or Sedella pumila. [PDv]
Interdunal wetland (Coastal ecoregion): a seasonally inundated wetland, usually without a naturally-occurring inlet or outlet, located between sand dunes where wind has scoured the sand down to the water table (deflation plain), and often with significant cover of native species in column E.
0 Carex obnupta, Argentina egedii, Juncus lesueurii, J. nevadensis, J. falcatus, Sisyrinchium californicum, and/or Salix hookeriana [PDv]
Mature forested wetland (anywhere): a wetland in which mean diameter of trees (d.b.h., FACW and FAC species only) exceeds 18 inches, and/or the average age of trees exceeds 80 years, or there are >5 trees/acre with diameter >32 inches.
0 To qualify, the diameter of >18 inches must be the mean measured from at least 10 trees. [PDv]
Ultramafic soil wetland (mainly southwestern Oregon): a low-elevation wetland, usually with a sponge-like organic soil layer, occurring in an area with exposed serpentine or peridotite rock, and/or in soils with very low Ca:Mg ratios.
0 [PDv]
Wooded tidal wetlands with >30% cover of trees and shrubs. A wetland inundated at least once annually by tides and often dominated by woody plant species.
0 The plant species may include Sitka spruce, crabapple, and/or others [PDv]
Undiked tidal freshwater wetland: an emergent or wooded wetland inundated at least once annually by tides and with surface salinity <0.5 ppt during most of spring and summer, and which has never been diked.
0 [PDv]
NONE of above 1
Form FieldF version 2.0.2 April 2010

23
242526272829
30
31
32
33
34
3536
37
383940
41
424344454647
A B C D E
The percent of the vegetated part of the AA that is "low marsh" (covered by tidal water for part of almost every day) is:>95% of the AA 050-95% of the AA 025-50% of the AA 01-25% of the AA 0<1% or none of the AA (high marsh only) 0This tidal wetland is (select one): Wcontiguous to a non-tidal palustrine wetland that contains surface water at least seasonally, and mostly not separated by a dike or other barrier, allowing fish access to both wetlands during spring.
0
contiguous to a non-tidal palustrine wetland that contains surface water at least seasonally, but mostly separated by a dike or other barrier, yet still allowing fish access to both wetlands during spring.
0
not contiguous to a non-tidal palustrine wetland that contains surface water, but has an inflowing stream that allows fish during the springtime to access a non-tidal wetland < 1 mile upstream.
0
not contiguous to a non-tidal palustrine wetland that contains surface water, but has an inflowing stream that allows fish during the springtime to access a non-tidal wetland > 1 mile upstream.
0
not contiguous to a non-tidal palustrine wetland, and lacks an inflowing non-tidal stream that provides fish access to an upstream wetland that contains surface water at least seasonally.
0
Select one:during 4 of the last 5 years most of the AA has been covered year-round with surface water, but that part went mostly dry during at least one unusual event.
0
during 4 of the last 5 years most of the AA has been dry year-round on the surface (i.e., saturated only below the surface), but during at least one unusual event most of that part was flooded, even if only briefly.
1
neither of above 0unknown 0
F6 Saturated-only Wetland No part of the AA is ever inundated (contains at least 1 inch of water above the land surface) for more than 14 consecutive days during a normal year. That is, it is a saturated-only wetland. If true, mark "1" here, then SKIP TO F39 (Herbaceous Extent)
0 [classifier for all functions]
During normal years, the percent of the AA that is inundated only seasonally (more than 14 consecutive days but no more than 9 months, or in tidal wetlands is "high marsh" that is inundated by tides fewer than half the days in any month) is:
>75% of the AA 050-75% of the AA 025-50% of the AA 05-25% of the AA 1<5% of the AA, or none 0
Tidal-Nontidal Hydroconnectivity
Interrupted Hydroperiod
Include any natural channels within the marsh that are inundated at least once daily by tide. See file ORWAP_SuppInfo, worksheet P_LowTidal. [WS-,OE+,POL-,INV+,FA+,FR+,WBF+,WBN-,SBM-,PD-]
contiguous= abutting, with no major physical separation that prohibits free exchange or flow of surface water, if any is present. See diagram in Appendix A of the manual. [FA+,WBF+,WBN+,PD+]
[PR-,NR-,CS-,OE+,INV+,FR-,WBF+,WBN+,PD+]
Low Marsh
Seasonal Water Extent Flood marks (algal mats, adventitious roots, debris lines, ice scour, etc.) are often evident when not fully inundated. Also, such areas often have a larger proportion of upland and annual (vs. perennial) plant species. Vegetation may be patterned in concentric or parallel zones, as one moves outward & away from the deepest part of the wetland or channel. Although useful only as a general guide, the NRCS county soil survey descriptions of the predominant soil types usually includes information on flooding frequency and saturation persistence. [WS+,SR+,NR+,CS+,OE+,INV-,FA+, AM-, Sens+]
F3
F4
F5
F7
Is part of the site tidal? If yes, answer next 2 questions. If no, SKIP TO # F5.
Form FieldF version 2.0.2 April 2010

4849505152
5354
55
56
57
58
59
60
61
62
63
64
65
66
6768
A B C D EWhen the AA’s surface water is at its lowest annual level, the percent of the AA still containing surface water (whether obscured by vegetation or not) is: >95% of the AA 050-95% of the AA 025-50% of the AA 01-25% of the AA 0None of the above, and the AA contains or is part of a fringe wetland, SKIP to F10 0
None of the above, and not a fringe wetland, SKIP to F10 1When the AA’s surface water is at its lowest annual level (for tidal wetlands = annual lowest tide), the percent of the surface water that is in or connected to flowing channels that exit the AA, compared to surface water that is outside of channels and their floodplains (e.g., in small depressions that do not connect annually to the channel if any), is:
all (100%) located in channels, swales, or other areas with a surface water connection to a river, lake, or estuary at all times of year
0
75-99% in or connected to channels, swales, or contiguous lake/ estuary, 1-25% in isolated pools 0
50-75% in or connected to channels, swales, or other areas with a surface water connection to a river, lake, or estuary at all times of year, 25-50% in isolated pools
0
25-50% in or connected to channels, swales, or other areas with a surface water connection to a river, lake, or estuary at all times of year, 50-75% in isolated pools
0
1-25% in or connected to channels, swales, or other areas with a surface water connection to a river, lake, or estuary at all times of year, 75-99% in isolated pools
0
all located in isolated pools or a single isolated pond from which no surface water exits when levels are lowest
0
During the wettest time of a normal year , the percent of the surface water that is in or connected to ditches, swales, or flowing channels that exit the AA, compared to surface water that is in isolated pools that do not connect annually to channels or swales (if any), is:
all (100%) located in channels, swales, or in other areas with a wet-season surface connection to channels or to a contiguous lake or estuary
0
75-99% in or connected to channels, swales, or contiguous lake/ estuary, 1-25% in isolated pools 0
50-75% in or connected to channels, swales, or contiguous lake/ estuary, 25-50% in isolated pools 0
25-50% in or connected to channels, swales, or contiguous lake/ estuary, 50-75% in isolated pools 0
1-25% in or connected to channels, swales, or contiguous lake/ estuary, 75-99% in isolated pools 0
all located in isolated pools or a single isolated pond from which no surface water exits 1
Onsite Surface Water Isolation (Wet Season)
Extent of Persistent Surface Water (Dry Season)
Onsite Surface Water Isolation (Dry Season)
For tidal sites, consider the condition at annual lowest tide. See DSL web site for general maps of waters that may be tidal. Swales and channels are areas that have surface flow for at least 2 consecutive days per year. Swales are less distinct (broader and flatter in cross-section) than channels. [WS+, SR+,PR+,NR+,OE-,T-, INV+,FA-,FR+,AM+,WBF+,WBN+,Sens+]
For tidal sites, consider the condition that would exist at annual lowest tide. Indicators of persistence may include fish, some dragonflies, beaver, and muskrat. In the county soil survey, the NRCS descriptions of the predominant soil types may include information on saturation persistence in those types. [WS-,PR-,NR-,CS-,POL-,INV+,FR+,AM+,WBF+,WBN+,SB-]
For tidal sites, consider the condition at mean high tide. See DSL web site for general maps of waters that may be tidal. Swales and channels are areas that have surface flow for at least 2 consecutive days per year. Swales are less distinct (broader and flatter in cross-section) than channels. Sites fed by unregulated streams that descend on north-facing slopes tend to remain wet longer into the summer, especially in montane snow-fed areas.[WS+, SR+,PR+,NR+,CS+,OE-,INV+,FA-,FR+,AM+,WBF+]
F9
F10
F8
Form FieldF version 2.0.2 April 2010

697071727374
7576777879
80
81
82
83
84
85
86878889
90
91
A B C D EF11 During most years, the difference in surface water level between the driest and wettest time of year
in most of the area that is not inundated year-round is:
>6 ft change 03-6 ft change 01-3 ft change 00.5 - 1 ft change 0<0.5 ft or no change (stable) 1
F12 When present, surface water in most of the AA is usually:
>6 ft deep 02-6 ft deep 01-2 ft deep 00.5 - 1 ft deep 0<0.5 ft deep (but >0) 1
F13 When present, surface water in most of the AA usually consists of (select one):
One depth class (use the classes in F12) that comprises >90% of the AA’s inundated area 1
One depth class that comprises >50% of the AA's inundated area 0
Neither of above 0
F14 Ponded nontidal water deeper than 3 ft covers at least 1 acre or >5% of the AA during (check all that apply):
most of the period (generally, November-April) when waterfowl are migrating or wintering, and/ or amphibians are in aquatic phases
0
most of the period (generally, May-August) when waterfowl are breeding 0neither of above (no ponded water >3 ft deep is that extensive) 1impossible to tell 0Visualize the extent and distribution of ponded open water within the AA, relative to the distribution of the most dominant form of partly-submerged vegetation (herbaceous or woody, with stems and leaves >4" above the water surface). Visualize this as it occurs during May of most years. In the table to the right, first estimate the percent open water (left column) in the AA, then its distribution (secondary header). Select the highest applicable number and enter it in column D. See photographs in Appendix A of manual. If the AA has no ponded water during May, score it "1." If this is a fringe wetland, assume Open Water is >70%.
1
Note: Ponded open water is surface water that is not visibly flowing and contains no vegetation (except perhaps floating-leaved or completely submersed species) and is not beneath a canopy of trees or shrubs. For tidal sites, consider the condition at average mid-tide.
Predominant Water Fluctuation Range
Depth Class Distribution
Deep Spots
Predominant Depth Class
Open Water Interspersion With Partly Inundated Vegetation
Estimate these proportions by considering the gradient and microtopography of the site. See diagram in Appendix A of the manual. For tidal waters, estimate at mean high tide. [INV+,FR+,WBF+,WBN+]
[AM+, WBN+]
[NR+,OE+,INV+,FA+,FR+,WBF+,WBN+]
[WS+,PR-,NR+,CS-,OE+,INV-, AM-,WBN-]
"Usually" means the majority of the weeks during which the AA is at least partly inundated. This question is asking about the spatial median depth that occurs during most of that time, even if inundation is only seasonal or temporary. If inundation in most but not all of the AA is brief, the answer will be based on the depth of the most persistently inundated part of the AA. Include surface water in channels and ditches as well as ponded areas. See diagram in Appendix A of the manual. For tidal sites, assess the condition as it exists at mean high tide. [SR+,PR+,CS-,OE-,T+,INV-,FA+,FR+,WBF-,WBN-,PD-,Sens-]
F15
Form FieldF version 2.0.2 April 2010
9293
94
9596
97
98
99
100101
102103104105
106
107
108109
110
111
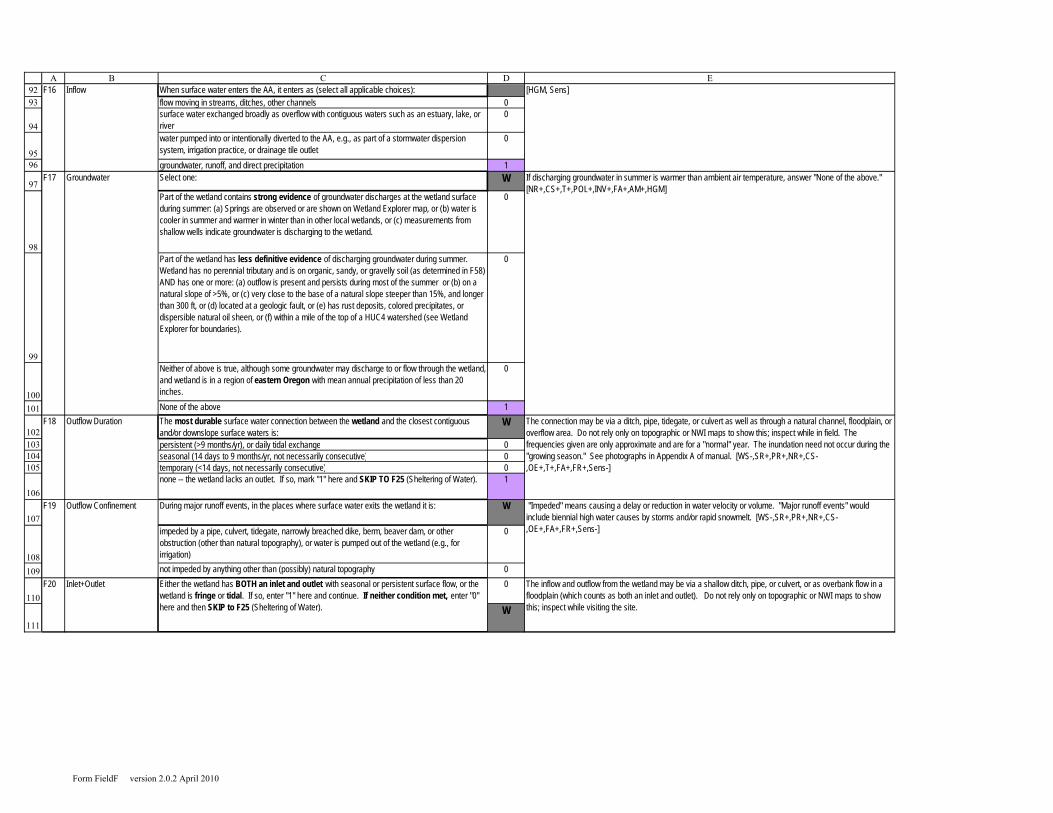
A B C D EF16 When surface water enters the AA, it enters as (select all applicable choices):
flow moving in streams, ditches, other channels 0surface water exchanged broadly as overflow with contiguous waters such as an estuary, lake, or river
0
water pumped into or intentionally diverted to the AA, e.g., as part of a stormwater dispersion system, irrigation practice, or drainage tile outlet
0
groundwater, runoff, and direct precipitation 1F17 Select one: W
Part of the wetland contains strong evidence of groundwater discharges at the wetland surface during summer: (a) Springs are observed or are shown on Wetland Explorer map, or (b) water is cooler in summer and warmer in winter than in other local wetlands, or (c) measurements from shallow wells indicate groundwater is discharging to the wetland.
0
Part of the wetland has less definitive evidence of discharging groundwater during summer. Wetland has no perennial tributary and is on organic, sandy, or gravelly soil (as determined in F58) AND has one or more: (a) outflow is present and persists during most of the summer or (b) on a natural slope of >5%, or (c) very close to the base of a natural slope steeper than 15%, and longer than 300 ft, or (d) located at a geologic fault, or (e) has rust deposits, colored precipitates, or dispersible natural oil sheen, or (f) within a mile of the top of a HUC4 watershed (see Wetland Explorer for boundaries).
0
Neither of above is true, although some groundwater may discharge to or flow through the wetland, and wetland is in a region of eastern Oregon with mean annual precipitation of less than 20 inches.
0
None of the above 1F18 The most durable surface water connection between the wetland and the closest contiguous
and/or downslope surface waters is:W
persistent (>9 months/yr), or daily tidal exchange 0seasonal (14 days to 9 months/yr, not necessarily consecutive) 0temporary (<14 days, not necessarily consecutive) 0none -- the wetland lacks an outlet. If so, mark "1" here and SKIP TO F25 (Sheltering of Water). 1
F19 During major runoff events, in the places where surface water exits the wetland it is: W
impeded by a pipe, culvert, tidegate, narrowly breached dike, berm, beaver dam, or other obstruction (other than natural topography), or water is pumped out of the wetland (e.g., for irrigation)
0
not impeded by anything other than (possibly) natural topography 00
W
Groundwater
Outflow Duration
Inlet+Outlet
Outflow Confinement
Inflow
The connection may be via a ditch, pipe, tidegate, or culvert as well as through a natural channel, floodplain, or overflow area. Do not rely only on topographic or NWI maps to show this; inspect while in field. The frequencies given are only approximate and are for a "normal" year. The inundation need not occur during the "growing season." See photographs in Appendix A of manual. [WS-,SR+,PR+,NR+,CS-,OE+,T+,FA+,FR+,Sens-]
The inflow and outflow from the wetland may be via a shallow ditch, pipe, or culvert, or as overbank flow in a floodplain (which counts as both an inlet and outlet). Do not rely only on topographic or NWI maps to show this; inspect while visiting the site.
If discharging groundwater in summer is warmer than ambient air temperature, answer "None of the above." [NR+,CS+,T+,POL+,INV+,FA+,AM+,HGM]
"Impeded" means causing a delay or reduction in water velocity or volume. "Major runoff events" would include biennial high water causes by storms and/or rapid snowmelt. [WS-,SR+,PR+,NR+,CS-,OE+,FA+,FR+,Sens-]
[HGM, Sens]
F20 Either the wetland has BOTH an inlet and outlet with seasonal or persistent surface flow, or the wetland is fringe or tidal. If so, enter "1" here and continue. If neither condition met, enter "0" here and then SKIP to F25 (Sheltering of Water).
Form FieldF version 2.0.2 April 2010
112
113
114
115
116
117
118
119
120
121122123124125126
127128129130131132133
134135136137138139140
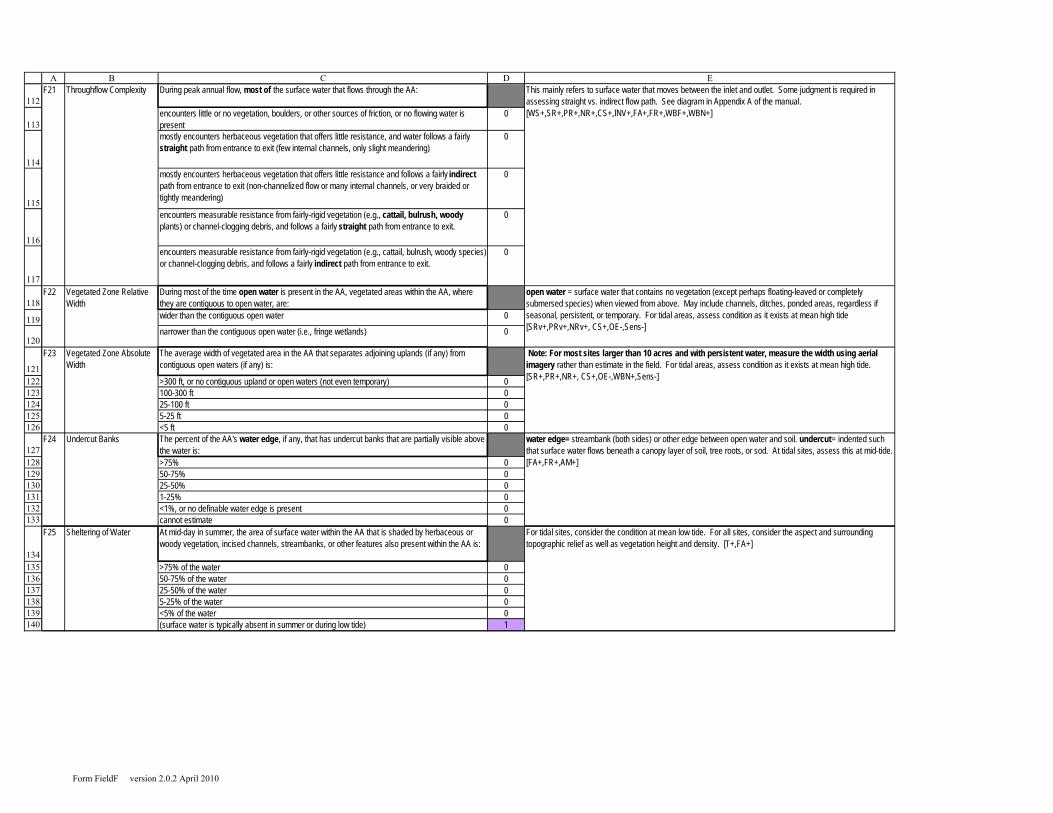
A B C D EDuring peak annual flow, most of the surface water that flows through the AA:
encounters little or no vegetation, boulders, or other sources of friction, or no flowing water is present
0
mostly encounters herbaceous vegetation that offers little resistance, and water follows a fairly straight path from entrance to exit (few internal channels, only slight meandering)
0
mostly encounters herbaceous vegetation that offers little resistance and follows a fairly indirect path from entrance to exit (non-channelized flow or many internal channels, or very braided or tightly meandering)
0
encounters measurable resistance from fairly-rigid vegetation (e.g., cattail, bulrush, woody plants) or channel-clogging debris, and follows a fairly straight path from entrance to exit.
0
encounters measurable resistance from fairly-rigid vegetation (e.g., cattail, bulrush, woody species) or channel-clogging debris, and follows a fairly indirect path from entrance to exit.
0
F22 During most of the time open water is present in the AA, vegetated areas within the AA, where they are contiguous to open water, are:wider than the contiguous open water 0
narrower than the contiguous open water (i.e., fringe wetlands) 0
F23 The average width of vegetated area in the AA that separates adjoining uplands (if any) from contiguous open waters (if any) is:
>300 ft, or no contiguous upland or open waters (not even temporary) 0100-300 ft 025-100 ft 05-25 ft 0<5 ft 0
F24 The percent of the AA's water edge, if any, that has undercut banks that are partially visible above the water is:>75% 050-75% 025-50% 01-25% 0<1%, or no definable water edge is present 0cannot estimate 0
F25 At mid-day in summer, the area of surface water within the AA that is shaded by herbaceous or woody vegetation, incised channels, streambanks, or other features also present within the AA is:
>75% of the water 050-75% of the water 025-50% of the water 05-25% of the water 0<5% of the water 0(surface water is typically absent in summer or during low tide) 1
Sheltering of Water
Vegetated Zone Absolute Width
Throughflow Complexity
Vegetated Zone Relative Width
For tidal sites, consider the condition at mean low tide. For all sites, consider the aspect and surrounding topographic relief as well as vegetation height and density. [T+,FA+]
This mainly refers to surface water that moves between the inlet and outlet. Some judgment is required in assessing straight vs. indirect flow path. See diagram in Appendix A of the manual. [WS+,SR+,PR+,NR+,CS+,INV+,FA+,FR+,WBF+,WBN+]
open water = surface water that contains no vegetation (except perhaps floating-leaved or completely submersed species) when viewed from above. May include channels, ditches, ponded areas, regardless if seasonal, persistent, or temporary. For tidal areas, assess condition as it exists at mean high tide [SRv+,PRv+,NRv+, CS+,OE-,Sens-]
Note: For most sites larger than 10 acres and with persistent water, measure the width using aerial imagery rather than estimate in the field. For tidal areas, assess condition as it exists at mean high tide. [SR+,PR+,NR+, CS+,OE-,WBN+,Sens-]
Undercut Banks water edge= streambank (both sides) or other edge between open water and soil. undercut= indented such that surface water flows beneath a canopy layer of soil, tree roots, or sod. At tidal sites, assess this at mid-tide. [FA+,FR+,AM+]
F21
Form FieldF version 2.0.2 April 2010

141142143
144
145
146147
148
149150151152153154
155
156
157158
159
160
161
162163
A B C D EF26 The number of downed wood pieces thicker than 4 inches that remain only partly underwater
during most of the spring or early summer, thus potentially serving as basking sites for turtles, birds, or frogs, is:Several 0Few or none, or AA never has any surface water at that time 1
F27 Select all that apply: WDuring early summer the wetland contains a floating vegetation mat suitable for nesting birds and isolated from the shore by water depths >3 ft. Or AA is an island with similar isolation and a gently-sloping water edge that is mostly vegetated.
0
During early summer the wetland contains (or is) an island with a gently-sloping water edge, that is mostly bare and is isolated from the shore by water depths >3 ft.
0
Neither of above 1F28 The maximum extent of mudflats or unwooded shortgrass areas within the AA during shorebird
migration and wintering (generally August through through April (and for tidal AAs, during mean low tide) is usually:
none, or <100 sq. ft, and there are none that cover >10,000 sq. ft anywhere within 300 ft of the AA 1
none, or <100 sq. ft, but some that cover >10,000 are within 300 ft of the AA 0100-1000 sq. ft. within AA 01000 – 10,000 sq. ft. within AA 0>10,000 sq. ft within AA 0
F29 Which of the following is most true:Wind or boats frequently generate waves of >1 ft near the AA, those waves are intercepted by the wetland, and structures behind the AA are protected from wave erosion
0
Wind or boats frequently generate waves of >1 ft near the AA, those waves are intercepted by the wetland, but there are no structures behind the wetland
0
Neither wind nor boats frequently generate waves of >1 ft near the AA 1
Select all that apply:a regularly-used boat dock is present within or contiguous to the AA 0
a regularly-used boat dock is not within the AA, but there is one within 300 ft of the AA and there is a persistent or tidal surface connection between the dock and the AA
0
large ships that empty ballast water are regularly present in nearby contiguous waters 0
the AA has a persistent or tidal surface water connection (>9 mos./yr, via ditch, pipe, channel, tidegate, or floodplain) to a nearby perennial stream, river, lake, or estuary
0
none of the above 1
Vectors for Waterborne Pests
Waves
Shorebird Feeding Habitats
For tidal sites, consider the condition at mean high tide. Only the wood that is at or above the water surface is assessed because of the impracticality of assessing underwater wood accurately when using a rapid assessment method. [FA+,FR+,AM+,WBF+,SBM+]
Abovewater Wood
Islands
F30
These areas must have (a) no vegetation (bare/ fallow), or herbaceous cover comprised mainly of grasses shorter than 4 inches during some part of this period, and (b) soils are saturated or are covered with <1" of water during some part of this period, and (c) no detectable surrounding slope (e.g., not the bottom of an incised dry channel), and (d) no substantial areas of shrubs or trees. See photograph in Appendix A of manual.This addresses needs of most migratory sandpipers, plovers, stilts, avocets, curlews, and godwits. [WBF+]
Erosive wave conditions often occur where adjoining open water has a fetch (uninterrupted distance) of greater than approximately 1 mile in the direction of the strongest and most frequent wind. [SRv+, PD-, STR+]
island = terrestrial or wetland area larger than 400 sq.ft, and smaller than 1 sq. mi, and separated from "mainland" by water deeper than 3 ft over a distance of >50 ft during early summer. [AM+,WBF+,WBN+]
[SRv+, FA-,FR-,AM-,PD-,STR+]
Form FieldF version 2.0.2 April 2010

164165166
167
168169
170
171
172
173
174
175
176177178179180
181182
183184185186
187
188189
A B C D EThe following are known or likely to have reproducing populations in this AA, its wetland, or in water bodies within 300 ft that connect to the AA at least seasonally . Select all that apply:
non-native amphibians (e.g., bullfrog) or reptiles (e.g., red-ear slider) 0carp 0other non-native fish (e.g., bass, gambusia, walleye, crappie, brook trout) 0
non-native invertebrates (e.g., New Zealand mudsnail, mitten crab, rusty crayfish) 0
nutria 0none of above, or unknown 1
F32 Ice-free During most years, most of the AA's surface water does not freeze, or freezes for fewer than 4 continuous weeks, or surface water is absent most winters.
0 [WS+,PR+,NR+,CS+,OE+,FR+,WBF+,Sens-]
0
F34 No Scum During most summers, less than 80% of the AA's water surface is covered by floating algae, duckweed, and other non-rooted aquatic plants, AND no major fish kills occur. If no surface water is present in summer, mark "1" in column D.
0 If wetland can be visited only during winter, it may not be possible to answer this question with much certainty unless local sources are contacted or indicators (e.g., dried remains of algae) are found. [PR+,FA+,PD+,CQ+]
SAV (submerged & floating-leaved aquatic vegetation) occupies an annual maximum of:
>95% of the surface water area 050-95% of the surface water area 025-50% of the surface water area 05-25% of the surface water area 0<5% of the surface water area. Mark "1" here and SKIP TO F39 (Herbaceous Extent). 1
F36 The areal cover of SAV at mid-summer is comprised of:mostly invasive SAV species (see list in column E). Mark "1" here and underline the species in column E. Then SKIP to F39.
0
mostly non-invasive species 0impossible to tell 0
F37 Considering just the SAV species that are native:one or two of those species together comprise >50% of the SAV cover. Mark "1" here and write names of dominant species in column E.
0
no two of the native SAV species together comprise >50% of the SAV cover 0
impossible to tell 0
SAV Native Species Dominance
Submerged & Floating-leaved Aquatic Vegetation (SAV)
SAV Invasive vs. Non-invasive Cover
For F32 to 34, if the statement is true, enter a "1" in column D. Otherwise that should be a "0"
[PD-, CQ-, Sens-]
During most of the summer , the AA contains more than 0.25 acre of ponded non-tidal surface water that is deeper than 1 ft, or is within 300 ft of such an area and the intervening habitat is not developed (roads, etc.). Or nesting within the AA by ducks, geese, or swans has been proven.
SAV = herbaceous plants that characteristically grow at or below the water surface, i.e., whose leaves are primarily and characteristically under or on the water surface during most of the part of the growing season when surface water is present. Some species are rooted in the sediment whereas others are not. If pond lily (Nuphar ) is the predominant species, consider its maximum extent only during the period when surface water is present beneath the leaves. For tidal sites, consider the condition during mean high tide. [INV+,FA+,FR+,AM+,WBF+,PDc,CQc,SENSc]
F35
Non-native Aquatic Animals
Ponded ThresholdF33
Invasive SAV species include: Egeria densa (Brazilian elodea), Hydrilla verticillata , Myriophyllum aquaticum (parrotfeather watermilfoil), Cabomba caroliniana (fanwort), Nymphaea odorata (white pondlily). For known distributions of these in your county, see: http://www.weedmapper.org/maps.html [PD-,CQ-,Sens-]
Assume non-native fish to be present if wetland is associated with a nearby reservoir, fish pond, or perennial stream flowing through an agricultural or residential area. Assume bullfrog, nutria, and/or carp to be present if (a) the AA contains persistent water or is flooded seasonally by an adjoining body of permanent water, and (b) not a forested wetland, and (c) in western Oregon, elevation is lower than about 3000 ft. In the ORWAP_SuppInfo file, see Inverts_Exo worksheet for more complete list of non-native invertebrates or Oregon, and WetVerts worksheet for more complete list of fish that are not native to Oregon. You may also consult: http://nas.er.usgs.gov/queries/default.aspx http://www.dfw.state.or.us/conservationstrategy/invasive_species.asp [INV-,FA-,FR-,AM-,CQ-]
F31
[WBN+]
Form FieldF version 2.0.2 April 2010

190
191
192193
194
195196197198199
200
201202203204205
206
207
208
209210211
212
213
214215216
217
A B C D EOf all the SAV species in this AA:all are species that are common among Oregon's wetlands and lakes. 0at least one native species is a SAV plant that is not common among Oregon's wetlands and lakes, and it covers >1% of the SAV area or >100 sq. ft. See file ORWAP_SuppInfo, worksheet P_UnCom. Mark "1" in next column and write names of the species in column E.
0
impossible to tell 0
F39 The areal cover of herbaceous plants during mid-summer is:
>95% of the vegetated part of the AA 150-95% of the vegetated part of the AA 025-50% of the vegetated part of the AA 05-25% of the vegetated part of the AA 0<5% of the vegetated part of the AA. Mark "1" here and SKIP TO F44 (Woody Extent). 0
F40 When the areal cover of herbaceous plants is at an annual maximum, those plants are:
overwhelmingly graminoids (>80% cover of grasslike plants) 1mostly graminoids (50-80% cover) 0mostly non-graminoids (e.g., forbs, ferns) (50-80%) 0overwhelmingly (>80%) non-graminoids 0
F41 The maximum annual areal cover of herbaceous plants is:
overwhelmingly (>80% cover) non-native species, of which >10% are species considered invasive (see column E). Mark "1" in next column and write names of dominant invasive species in column E. Then SKIP to F43.
0
overwhelmingly (>80% cover) non-native species, but <10% are considered invasive (see column E). Mark "1" in next column and write names of dominant non-native species in column E. Then SKIP to F43.
0
mostly (50-80%) non-native species, regardless of invasiveness. Mark "1" and SKIP to F43. 0
mostly (50-80%) native species 0overwhelmingly (>80%) native species 1
F42 Of just the herbaceous (forb and graminoid) species that are native:one or two native species together comprise >50% of the areal cover of native herbaceous plants at any time during the year. Mark "1" in next column and write names of dominant native species in column E.
1
no two of the native species together comprise >50% of the areal cover of native herbaceous plants
0
F43 Of all the herbaceous species in this AA:all are species that are common among Oregon's wetlands. 1at least one native species is not common among Oregon's wetlands and it covers >1% of the AA's herbaceous area or >100 sq. ft (either contiguous or scattered). See file ORWAP_SuppInfo, worksheet P_UnCom. Mark "1" in next column and write names of the species in column E.
0
Herbaceous Species Dominance
Herbaceous Extent
Graminoid vs. Forb Cover
Herbaceous Native vs. Non-native Cover
Herbaceous Plant Species Ubiquity
SAV Species Ubiquity
Note: In the next 4 questions, "herbaceous" does not include SAV or herbaceous plants growing under a woody canopy, unless that canopy covers >80% of the vegetated part of the AA. If the AA is farmed, estimate herbaceous cover (including crops) as it would exist under maximum cover conditions during the majority of the last 5 years.
F38 [PD-, CQ-, Sens-]
This question and several others (F37, 38, 42, 48, 49) are used as "placeholders" until a Floristic Quality Assessment index can be developed for Oregon. Much information on distribution and frequencies of plant species is available from the Oregon Flora Project: www.oregonflora.org/ [POL-,PD-,CQ-,Sens-]
graminoids= grasses, sedges, rushes, reeds, burreed, cat-tail, and other grasslike plants . Remember to focus only on plants not beneath a woody canopy, unless that canopy occupies >80% of the AA. If possible this should be assessed during mid-summer. [POLL-]
In the file ORWAP_SuppInfo, see P_Invas worksheet for list of invasives and P_Exo for non-native species list. For known distributions of invasive plants in your county, see: http://www.weedmapper.org/maps.html Remember to focus only on plants not beneath a woody canopy. [POL-,PD-,CQ-,Sens-]
Remember to focus only on plants not beneath a woody canopy. [POL-,PD-,CQ-,Sens-]
herbaceous = forbs, graminoids, ferns, liverworts, moss. Can include crops. Do not include submersed and floating-leaved aquatics (SAV) in the category of "herbaceous", or when defining the "vegetated part" of the site. Note: For sites larger than 10 acres, this should be determined from aerial imagery rather than estimated in the field. [POLc,INV+,WBF+,WBN+,PDc, CQc,SENSc]
Form FieldF version 2.0.2 April 2010

218219220221222223
224
225226227228
229
230
231
232
233234
235
236
237238239240
241
242243244
245
A B C D EF44 Within the AA, woody vegetation (shrubs, trees, woody vines) occupies:
>95% of the vegetated part of the AA 050-95% of the vegetated AA 025-50% of the vegetated AA 05-25% of the vegetated AA 0<5% of the vegetated AA 1
F45 Where surface water is present during the wettest time of year , the AA's woody vegetation occupies:>95% of the area within 100 ft of the surface water 0
50-95% of the area within 100 ft of surface water 025-50% of the area within 100 ft of surface water 05-25% of the area within 100 ft of surface water 0<5% of the area within 100 ft of surface water; mark "1" here. If F44 is also <5%, then SKIP TO F50 (Woody Diameter Classes).
1
F46 The woody vegetation (if any) within the AA is:
clumped in fairly distinct bands or patches mostly separate from herbaceous vegetation, and most patches or bands are large (>1 acre including contiguous upland woody veg). Or nearly the entire AA is wooded. Isolated shrubs or trees are few.
0
clumped in fairly distinct bands or patches mostly separate from herbaceous vegetation, and most patches are small (<1 acre including contiguous upland woody veg).
0
dispersed quite evenly amid the herbaceous vegetation, in many small patches, or many isolated shrubs or trees.
0
F47 Within parts of the AA having shrubs or woody vines, the areal cover is: overwhelmingly (>80%) non-natives that are categorized as invasive (see column E). Mark "1" in next column and write names of dominant invasives in column E. Then SKIP to F49.
0
overwhelmingly other non-natives. Mark "1" in next column and write names of dominant non-native shrubs/ vines in column E. Then SKIP to F49.
0
mostly (50-80%) non-natives. Mark "1" in next column and write names of dominant non-native shrubs/ vines in column E. Then SKIP to F49.
0
mostly (50-80%) natives 0overwhelmingly (>80%) natives 0
F48 Of just the shrub & woody vine species that are native:one or two of the native species together comprise >80% of the native shrub & vine cover. Mark "1" in next column and write names of dominant species in column E.
0
no two of the native species together comprise >80% of the native shrub & vine cover 0
F49 Of all the shrub & woody vine species in this AA:all are species that are common among Oregon's wetlands. 0at least one native species is not common among Oregon's wetlands and it covers >1% of the AA or >100 sq. ft See file ORWAP_SuppInfo, worksheet P_UnCom. Mark "1" in next column and write species in column E.
0
Shrub & Vine Species Dominance
Shrub & Vine Species Ubiquity
Woody Extent Along Water Edge
Cover of Woody Invasives
Woody Distribution
Woody Extent Within the AA
[POL-,PD-,CQ-,Sens-]
Note: For sites larger than 10 acres, this should be determined from aerial imagery rather than estimated only in the field. Vines are twining or climbing plants with relatively long stems, and can be either woody or herbaceous. Include Himalayan blackberry. [CS+,POLc,SBM+,PDc,CQc,SENSc]
[SBM+]
"contiguous to" means separated by less than one tree height. The separation may be caused by herbaceous vegetation, persistent water, roads, buildings, or bare soil, but not shrubs. [SBM+, CQ+, Sens+]
In the file ORWAP_SuppInfo, see P_Invas worksheet for list of invasives and P_Exo for non-native species list. Woody invasives include: Hedera helix, Ailanthus altissima, Buddleja spp., Cytisus spp., Rubus armeniacus (discolor), Rubus laciniatus, Tamarix spp., Umbellularia californica, Robinia pseudoacacia. For known distribution of some invasives in your county see: http://www.weedmapper.org/maps.html [POL-,PD-,CQ-,Sens-]
[POL-,PD-,CQ-,Sens-]
Form FieldF version 2.0.2 April 2010

246247248249250251252253254255256257
258
259260261262263264
265
266
267268269270
271272273274275276
277278279
A B C D EF50 Select all the types occupying >5% of the wooded part of the AA or >5% of its wooded upland
edge if any. deciduous 1-4" diameter and >3 ft tall 0evergreen 1-4" diameter and >3 ft tall 0deciduous 4-9" diameter 0evergreen 4-9" diameter 0dead standing 4-9" diameter 0deciduous 9-21" diameter 0evergreen 9-21" diameter 0dead standing 9-21" diameter 0deciduous >21" diameter 0evergreen >21" diameter 0dead standing >21" diameter 0Lacks woody vegetation, or none of above occupy >5% of the wooded part of the AA or 5% of the length of the upland edge.
1
F51 Within the vegetated part of the AA, the cover of nitrogen-fixing plants (e.g., alder, sweetgale, legumes) is:<1% or none 11-25% 025-50% 050-75% 0>75% 0
F52 The percent of the vegetated part of the AA, excluding areas that are never inundated , which contains one or more of these plants: Alisma spp., Beckmannia spp., Polygonum spp. (natives only), Potomogeton (Stuckenia) spp., Ruppia spp., Sagittaria spp., Sparganium spp., Zostera spp., is:
<1% or none, and none are known to occur commonly within the same wetland or within 300 ft of this AA
1
<1% or none, but some are known to occur commonly within the same wetland or within 300 ft of this AA
0
1-10% 010-50% 0>50% 0
F53 The last time that >5% of the AA's vegetation cover was burned or harvested for hay or timber was:0-12 months ago, and this occurs almost annually within part of the AA 00-12 months ago, but was not an annual (or near-annual) event 01-5 years ago 0>5 years ago, or never 0unknown 1
F54 Within the stratum (herbaceous, shrub, or tree) that covers the most onsite area, the wetland plants during maximum annual cover condition are mostly:
of nearly uniform height (+ or - 20% of average) 1of very diverse heights (e.g., short & tall forbs, short & mid-height grasses) 0
History of Fire or Vegetation Removal
Height Uniformity of Dominant Stratum
N Fixers
Waterfowl Food Plants
Woody Diameter Classes wooded upland edge= where woody plants are located within one tree-height of the wetland-upland boundary. Measurements are the d.b.h., which is the tree diameter at 4.5 ft above the ground. If visited only in winter, consider "dead standing trees" to be those that are mainly without bark. Include woody vines such as Himalayan blackberry. [CS+,POL+,INV+,AM+,WBN+,SBM+,Sens+]
[WBF+,WBN+]
[PR-,NR-,CS-,OE+,POL-,WBF+,PD+]
e.g., If dominantly herbaceous, then "diverse heights" might include both short and tall forbs, some non-woody vines, and mid-height graminoids. See photograph of a vertically diverse herbaceous stratum in Appendix A of manual. [POL+,INV+,WBN+,SBM+, PD+]
For a more complete list see file ORWAP_SuppInfo, worksheet NFIX. Do not include algae.
Form FieldF version 2.0.2 April 2010

280
281
282
283
284
285
286
287
288
289290291
292
293
294
295
296
297298299
300301
302303
A B C D EF55 Consider the parts of the AA that usually are not inundated in May, or are inundated by tides at
least once annually. Viewed from 6 inches above the soil surface , the condition in most of this area during May is:little or no (<5%) bare ground or plant litter (thatch) is visible between erect stems or under canopy. This can occur if ground surface is extensively blanketed by moss, graminoids with great stem densities, or plants with ground-hugging foliage.
0
some (5-20%) bare ground or litter is visible. Herbaceous plants have moderate stem densities and do not closely hug the ground.
1
much (20-50%) bare ground or plant litter is visible. Low stem density and/or tall plants with little near-ground foliage. May be mostly woody plants, woody vines, cattail, bulrush, sparse annuals.
0
mostly (>50%) bare ground or accumulated plant litter. Or, during May the entire AA is constantly under water.
0
F56 Most of the edge between the wetland and upland is (select one): W
Linear: a significant proportion of the wetland's upland edge is straight, as in wetlands bounded by partly or wholly by dikes or roads
0
Convoluted: Wetland perimeter is many times longer than maximum width of the wetland, with many alcoves and indentations ("fingers")
0
Intermediate: Wetland's perimeter either (a) is only mildly convoluted, or (b) mixed -- contains about lengths of linear and convoluted segments.
1
F57 The extent of inclusions of upland within the AA (as indicated by their topography, plants, and/or soils) is:Many (e.g., wetland-upland "mosaic") 0Few or none 1
F58 The composition of the soil in the soil pit at the ground surface (uppermost soil layer and excluding the duff layer, see protocol in ORWAP Manual, section 2.3.2 ) is:
duff layer= leaves, woody material, and live or dead roots, moss that has undergone partial decomposition. [PR,NR,CS,OE, PD, Sen]
Loamy : includes silt, silt loam, loam, sandy loam 0
Clayey : includes clay, clay loam, silty clay, silty clay loam, sandy clay, sandy clay loam 1
Organic : includes muck, mucky peat, peat, and mucky mineral 0
Coarse : includes sand, loamy sand, gravel, cobble, stones, boulders, fluvents, fluvaquents, riverwash
0
F59 The number of downed wood pieces longer than 6 ft and with diameter >6", and not persistently submerged, is:Several ( >5 if AA is >10 acres, or >2 for smaller AAs) 0Few or none 1
F60 The number of animal burrows, mounds, hummocks, boulders, upturned trees, islands, natural levees, dry channels, pits, wide soil cracks, and microdepressions (in parts of the AA that lack persistent water) is:Several (extensive micro-topography) 0Few or none (minimal microtopography; <1% of the area that isn't persistently inundated); e.g., many flat sites having a single hydroperiod
1
Intermediate 0
Downed Wood
Soil Composition in the Soil Pit
Upland Edge Shape Complexity
Upland Inclusions
Bare Ground & Accumulated Plant Litter
Ground Irregularity
See illustrations in Appendix A of the ORWAP manual . [NR+,SBM+]
[NR+,AM+,SBM+]
Estimates of "plant litter" cover should include only the litter and woody debris that would be visible from a height of 6 inches above the soil surface. Emphasis should be on plant litter that has remained from prior years ("thatch"), not recent. Erect plant stems should not be counted as plant litter, even if dead. "Bare ground" that is present under a tree or shrub canopy should be counted. It includes unvegetated soil, rock, sand, or mud between stems if any. See photographs in Appendix A of manual for examples. Wetlands that are dominated by annual plant species tend to have more extensive areas that are bare or covered only by plant litter, during minimum annual cover conditions. [SR-,PR-,NR-,CS-,OE-,POL-,INV-.AM-,SBM-,Sens+]
include driftwood. [POL+,INV+,AM+,SBM+]
"microtopography" refers mainly to vertical relief of <1 m and is represented only by inorganic features, except where plants have created depressions or mounds of soil. See photographs in Appendix A of manual for examples. [WS+,SR+,PR+,NR+,CS+,POL+,INV+,AM+,SBM+,PD+]
Form FieldF version 2.0.2 April 2010

304305306307
308
309
310
311
312313314315316317318319320321322
323324325
326
327
328
329
330331
A B C D EF61 The gradient along most of the AA's water flow paths (both sheet and channel flow) is:
>10% 06-10% 02-5% 1Flat (<2%, no slope or flow is ever apparent, or AA is an estuarine fringe wetland). Includes most depressional sites
0
F62 Fish Access From Offsite Small fish (e.g., stickleback, minnow) from elsewhere in the watershed can access part of this AA for at least 2 days during most years or are known to already be present onsite.
0 Although incomplete, the species maps may be helpful at: http://map.streamnet.org/ or http://query.streamnet.org/ [INV-,FA+,FR+,AM-,WBF+]
F63 Nesting or Roosting Structures
Within the AA or within its wetland or within 300 ft of AA, there are bridges, buildings, caves, or ledges with openings/ crevices, well-maintained bird or bat boxes, elevated platforms, or other artificial structures suitable for nesting by some native bird or bat species.
0 e.g., open buildings for barn swallows, bridges for cliff swallows, wood duck boxes, goose nesting platforms, sheltered places for bees and wasps [POL+,SBM+]
F64 Cliffs, Banks, or Beaver In the AA or within its wetland or within 100 ft of the AA, there are elevated terrestrial features such as cliffs, stream banks, excavated pits, or pumice walls (but not riprap) that extend at least 6 ft nearly vertically, are unvegetated, and potentially contain crevices or other substrate suitable for nesting or den areas. Or there is evidence that beaver have used this AA (e.g., gnawed limbs).
0 [POL+,SBM+]
F65 The maximum percent of the wetland that is visible from the best vantage point on public roads, public parking lots, public buildings, or public paved paths that adjoin or are within 300 ft of the AA (select one) is:>50% 125-50% 0<25% 0
F66 Most of the AA is (select one):in public ownership 0in private ownership 1
F67 For most of the AA, permission for access is normally given or allowed:to anyone, mostly unrestricted 0to anyone, but significant restrictions (e.g., limited dates, permit required) 0only on a case-by-case basis, but with few other restrictions 0only on a case-by-case basis, with restrictions (e.g., limited dates, permit required) 1
seldom or never 0(do not know) 0
F68 Assuming access permission was granted, select all statements that are true of this AA as it currently exists:Walking is physically possible in >5% of the AA during most of year, e.g., free of deep water and dense shrub thickets
1
All or part of the AA (or an area within sight of the AA and within 100 ft) would be physically accessible to people in wheelchairs, e.g., paved and flat
0
Maintained roads, parking areas, or foot-trails are within 30 ft of the AA, or the AA can be accessed most of the year by boat
0
F69 Plants, animals, or water in the AA have been monitored for >2 years, unrelated to any regulatory requirements, and data are available to the public. Or the AA is part of an area that has been designated by an agency or institution as a benchmark, reference, or status-trends monitoring area.
0
(do not know) 0
Ownership
Public Access
Sustained Scientific Use
Non-consumptive Uses - Actual or Potential
Internal Gradient
Visibility
[PU+]
[PU+]
[PU+]
In all cases, this question assumes that permission for access may be limited to certain activities. [PU+]
[PU+]
Except in isolated wetlands (no outlets), this is not the same as the shoreline slope. It is the elevational difference between highest and lowest points within the site, divided by the flow-distance between them and converted to percent. If most of the surface water is impounded within the site, the gradient is the gradient of the water surface, not the gradient of the submerged substrate. See diagram in Appendix A. If available, use a clinometer to measure this. [WS-,SR-,PR-,NR-,CS-,OE+,AM-,WBF-,WBN-]
Form FieldF version 2.0.2 April 2010

332333334335336337338339340341342
343344345346
347348349350351
352353354
355356
357358359360361
362363364365
366
A B C D EF70 Recent evidence was found within the AA of the following potentially-sustainable consumptive
uses. Select all that apply.low-impact commercial timber harvest 0low-impact grazing 0commercial harvesting of hay or mushrooms 0waterfowl hunting or furbearer trapping 0fishing (including shellfish harvest) 0None of the above 1
F71 Wells that currently provide drinking water are:Within 500 ft and downslope from the AA or at same elevation 0500-1000 ft and downslope or at same elevation 0>1000 ft downslope, or none downslope, or AA is tidal, or no information 1
F72 Excessive accumulation of sediment has caused frequent problems for large boats, with shoaling necessitating frequent dredging, in waters that are located:
contiguous to the AA, or <1 mile downslope from the AA 01-5 miles downslope 0>5 miles downslope, or no shoaling, or no boats, or no information 1
F73 The percent of the AA's vegetation cover that normally grows taller than 4 inches but which has been persistently reduced to less than that height by mowing (many times per year), plowing, and/or grazing by domestic or wild animals is:
>95% 050-90% 05-50% 0<5%, or grazing/ mowing does not cause the described condition 1
F74 The part of the AA almost never visited by humans during an average year probably comprises:
>95% of the AA 150-95% 05-50% and inhabited building is within 300 ft of the AA, or <5% and no inhabited building is within 300 ft of the AA
0
none of the above 0F75 The part of the AA visited by humans almost daily for several weeks during an average year
probably comprises:
>95% of the AA 050-95% 05-50% 0<5% 1
F76 Along the AA's boundary with upland, the percent of the upland edge (within 10 ft of AA) that is occupied by species that are marked as invasive in the Plants worksheet is:
most (>50%) of the upland edge 1much (5-50%) of the upland edge 0some (1-5%) of the upland edge 0none of the upland edge (invasives apparently absent), or AA is not within 10 ft of upland 0
Domestic Wells
Devegetation
Consumptive Uses (Provisioning Services)
Core Area 2
Weed Source Along Upland Edge
Core Area 1
Sediment Removal
If unknown, assume this is true if there is an inhabited structure within the specified distance and the neighborhood is known to not be connected to a municipal drinking water system (e.g., is outside an Urban Growth Boundary), or if crops are irrigated annually and the site is distant from a major water body. [NRv+]
"Low impact" means adherence to Best Management Practices such as those defined by NRCS and other agencies. Evidence may consist of direct observation, or presence of physical evidence (e.g., recently cut stumps, fishing lures, shell cases), or communication with the land owner or manager. [PS+]
[SRv+]
[OE-,INV-,AM-,WBN-,SBM-,PD-,CQ-]
Judge this based on proximity to population centers, roads, trails, accessibility of the AA to the public, wetland size, usual water depth, and physical evidence of human visitation. Exclude visits that are not likely to continue and/or that are not an annual occurrence, e.g., by construction or monitoring crews. See diagram in Appendix A of the manual. [AM+,WBF+,WBN+,SBM+,PD+,STR-]
Exclude visits that are not likely to continue and/or that are not an annual occurrence, e.g., by construction or monitoring crews. See diagram in Appendix A of the manual. [AM-,WBF-,WBN-,SBM-,PD-,STR+]
Some of the most common invaders along upland edges of Oregon wetlands are Himalayan blackberry, knotweed, sweetbrier rose, Russian olive, English ivy, nightshade, pepperweed, medusahead, white clover, ryegrass, quackgrass, false brome, bentgrass, dandelion, oxeye daisy, pennyroyal, bull and creeping thistles, tansy ragwort, poison hemlock, and teasel. See file ORWAP_SuppInfo, worksheet P_Invas. If a plant cannot be identified to species (e.g., winter conditions) but its genus contains an invasive species, assume the unidentified plant to also be invasive. If vegetation is so senesced that apparently dominant edge species cannot be identified even to genus, answer "none". [PD-,STR+]
Form FieldF version 2.0.2 April 2010

367368369370371372
373374375376377
378379380
381382383384385
386387388389390391
392
393394395396
A B C D EF77 Within 100 ft upslope of the AA's wetland-upland boundary, the percent of the upland that
contains natural (not necessarily native) land cover is:
>90%, or there is no upland boundary 160 to 90% 030 to 60% 05 to 30% 0<5% 0
F78 Within 100 ft upslope of the AA's wetland-upland boundary, the upland land cover that is not natural (as defined above) is mostly:
impervious surface, e.g., paved road, parking lot, building, exposed rock 0bare pervious surface, e.g., dirt road, dike, dunes, recent clearcut, landslide 1cultivated row crops or orchard 0artificially landscaped areas or lawn 0grain fields, or grassland grazed or mowed to a height usually shorter than 4 inches 0
other 0(buffer is >90% natural land cover or AA occupies all of an island) 0
F79 Along the AA's wetland-upland boundary and extending 100 ft uphill, the slope of the land is mostly:<1% (flat -- almost no noticeable slope, or there is no upland boundary) 02-5% 15-30% 0>30% 0
F80 Within 10 ft of ponded surface water (if any) in early summer, the percent of the herbaceous area (wetland or upland) that has a gentle or moderate slope (less than 5% slope) is:
>75% 050-75% 025-50% 01-25% 0<1%, 0 (ponded surface water in early summer covers <1% of AA, or AA is tidal, or no herbaceous vegetation is present near ponded water)
1
F81 How likely is it that any or all of this AA will persist as a wetland (not necessarily of the same type) if an existing dike or berm, water control structure (e.g., dam, weir), or pumping/ diversion system that now helps sustain it -- and is within 1 mile of the AA -- was removed or became inoperable?
Very likely, or no such feature is present (greater sustainability potential) 1Somewhat likely -- part but not all of the AA would remain a wetland 0Unlikely or not at all (lower sustainability potential) 0
Natural Land Cover in Buffer
Independently Sustainable Hydrology
Buffer Slope
Edge Slope
Type of Land Cover Alteration in Buffer
[INV-,FA-,AM-,WBN-,SBM-,PD-,STR+]
See diagram in Appendix A of the manual. If several isolated pools are present in early summer, estimate the percent of their collective shorelines that has such a gentle slope. [AM-,WBN-]
If all such human activities and structures disappeared, would the site still be a wetland? [WSv,SRv,PRv,NRv,INVv,AMv,WBFv,WBNv,SBMv,PDv+]
Natural land cover includes wooded areas, sagebrush, vegetated wetlands, prairies, as well as relatively unmanaged commercial lands such as hayfields, lightly grazed pastures, and most rangeland. It does not include water, row crops (vegetable, orchards, Christmas tree farms), residential areas, lawn, pavement, bare soil, gravel or dirt roads. Natural land cover is not the same as native vegetation or undisturbed soil. It frequently includes a dominance of non-native plants (e.g., ryegrass, Himalayan blackberry). If the entire site is an island without an upland edge, select the last choice. [POL+,INV+,FA+,FR+,AM+,WBN+,SBM+,PD+,Sens-]
See diagram in Appendix A of the manual. If the described area contains a disturbance feature, estimate instead the slope between the wetland-upland boundary and the most extensive such feature. Disturbance feature = building, paved area, recently cleared area, dirt road, lawn, intensely grazed pasture, orchard, vineyard, annually-harvested row crops [Sens+]
Form FieldF version 2.0.2 April 2010

Site Name: Investigator: Date:
Severe (3 points) Medium (2 points) Mild (1 point) Pts
Spatial extent of resulting wetter condition >95% of AA or >95% of its upland edge (if any)
5-95% of AA or 5-95% of its upland edge (if any)
<5% of AA and <5% of its upland edge (if any)
0
When most of AA's wetter condition began <3 yrs ago 3-9 yrs ago 10-100 yrs ago 0
Score the following 2 rows only if the wetter conditions began within past 10 years, and only for the part of the AA that got wetter.
Inundation now vs. previously persistent vs. seldom persistent vs. seasonal slightly longer or more often 0
Average water level increase >1 ft 6-12" <6 inches 0
sum= 0
final score= 0
Severe (3 pts) Medium (2 pts) Mild (1 pt) Pts
Spatial extent of resulting wetter condition >20% of the AA 5-20% of the AA <5% of the AA 0
When most of AA's wetter condition began <3 yrs ago 3-9 yrs ago 10-100 yrs ago 0
Score the following 2 rows only if the wetter conditions began within past 10 years, and only for the part of the AA that got wetter.
Inundation now vs. previously persistent vs. seldom persistent vs. seasonal slightly longer or more often 0
Average water level increase >1 ft 6-12" <6 inches 0
sum= 0final score= 0
S1
S2
changes not related directly to humans, e.g., beaverIf any items were checked above, then for each row of the table below, assign points (3, 2, or 1) in the last column that describe the combined maximum effect of those items in creating a wetter water regime that still persists in the AA. To estimate that, contrast it with the condition if checked items never occurred or were no longer present. The sum and final score will computeautomatically.
If any items were checked above, then for each row of the table below, assign points (3, 2, or 1) in the last column that describe the combined maximum effect of those items in creating a wetter water regime in the AA. To estimate that, contrast it with the condition if checked items never occurred or were no longer present.
Wetter Water Regime - Internal CausesIn the last column, place an X next to any item that is likely to have caused a part of the AA to be inundated more extensively, more frequently, more deeply, and/or for longer duration than it would be without that item or activity. (The items you check are not used automatically by ORWAP. They are included simply so they may be considered when evaluating the factors in the table beneath them).
an impounding dam, dike, levee, weir, berm, road fill, or tidegate -- within or downgradient from the AA, or raising of outlet culvert elevation.
plugging of ditches or drain tile that otherwise would drain the AA (as part of intentional restoration, or due to lack of maintenance, sedimentation, etc.)
excavation within the AA, e.g., artificial pond, dead-end ditch
vegetation removal (e.g., logging) within the AA
Field S data form. ORWAP version 2.0.2 May 2012
0 if Sum= 0, (1 pt) if Sum= 1-4. (2 pt) if 5-6. (3 pt) if 7-8. (4 pt) if 9-10. (5 pt) if >10.
0 if Sum= 0, (1 pt) if Sum= 1-4. (2 pt) if 5-6. (3 pt) if 7-8. (4 pt) if 9-10. (5 pt) if >10.
excavation or reflooding of upland soils that adjoined the AA, thus expanding the area of the AA
removal of a water control structure or blockage in tributary upstream from the AA
compaction (e.g., ruts) and/or subsidence of the AA's substrate as a result of machinery, livestock, or off road vehicles
changes in the CA that are not related directly to humans, e.g., channel migration, landslides, forest die-offs, seismic activity
removal of timber or phreatophytes in the CA or along the AA's tributaries
In the last column, place an X next to any item occurring in the CA (including channels flowing into the AA) that is likely to have caused a part of the AA to be inundated more extensively, more frequently, more deeply, and/or for longer duration than it would be without that item or activity. Remember that if the AA is flooded as little as once every 2 years by river flow, the CA includes all upstream areas of that river.
pavement, ditches, or drain tile in the CA that incidentally increase the transport of water into the AA
* Score these 2 rows only for the part of the AA that got wetter, and only if the wetter conditions began within past 10 yrs
Wetter Water Regime - External Causes
subsidies from stormwater, wastewater effluent, septic system leakage, or irrigation water (direct or via seepage)
* Score this row only for the part of the AA that got wetter, and only if the wetter conditions began within past 10 yrs
Form FieldS version 2.0.2 April 2010

Drier Water Regime - Internal Causes
Severe (3 pts) Medium (2 pt) Mild (1 pt)
Spatial extent of AA's resulting drier condition >95% of AA or >95% of its upland edge (if any)
5-95% of AA or 5-95% of its upland edge (if any)
<5% of AA and <5% of its upland edge (if any)
0
When most of AA's drier condition began <3 yrs ago 3-9 yrs ago 10-100 yrs ago 0
Score the following 2 rows only if the drier conditions began within past 10 years, and only for the part of the AA that got drier.Inundation now vs. previously seldom vs. persistent seasonal vs. persistent slightly shorter or less often 0
Water level decrease >1 ft 6-12" <6 inches 0
sum= 0final score= 0
Severe (3 pts) Medium (2 pts) Mild (1 pt)Spatial extent of AA's resulting drier condition >20% of the AA 5-20% of the AA <5% of the AA 0
When most of AA;s drier condition began <3 yrs ago 3-9 yrs ago 10-100 yrs ago 0
Score the following 2 rows only if the drier conditions began within past 10 years, and only for the part of the AA that got drier.
Inundation now vs. previously seldom vs. persistent seasonal vs. persistent slightly shorter or less often 0
Water level decrease >1 ft 1-12" <1 inch 0
sum= 0final score= 0
S3
S4
changes not related directly to humans
instream water withdrawals from tributaries whose water would otherwise reach the AA
ditches or drain tile in the AA or along its edge that accelerate outflow from the AA lowering or enlargement of a surface water exit point (e.g., culvert) or modification of a water level control structure, resulting in quicker drainage
Drier Water Regime - External CausesIn the last column, place an X next to any item within the CA (including channels flowing into the AA) that is likely to have caused a part of the AA to be inundated less extensively, less deeply, less frequently, and/or for shorter duration that it would be without those.
If any items were checked above, then for each row of the table below assign points (3, 2, or 1) in the last column that describe the combined maximum effect of those items in creating a drier water regime in the AA. To estimate that, contrast it with the condition if checked items never occurred or were no longer present.
proliferation of phreatophytes (woody plants with deep roots and high transpiration, e.g., juniper, autumn olive) or crops with high transpiration rates that are near the AA
accelerated downcutting or channelization of an adjacent or internal channel (cut below the historical water table level)
withdrawals (e.g., pumping) of natural surface or ground water directly out of the AA (not its tributaries) placement of fill material
groundwater withdrawals that divert water that would otherwise reach the AA
relocation of natural tributaries whose water would otherwise reach the AA a dam, dike, levee, weir, berm, or tidegate that interferes with natural inflow to the AA
deep ripping (e.g., with plows) that severs an underlying hydrologically-confining soil layer
0 if Sum= 0, (1 pt) if Sum= 1-4. (2 pt) if 5-6. (3 pt) if 7-8. (4 pt) if 9-10. (5 pt) if >10.
If any items were checked above, then for each row of the table below assign points (3, 2, or 1) in the last column that describe the combined maximum effect of those items in creating a drier water regime in the AA. To estimate that, contrast it with the condition if checked items never occurred or were no longer present.
0 if Sum= 0, (1 pt) if Sum= 1-4. (2 pt) if 5-6. (3 pt) if 7-8. (4 pt) if 9-10. (5 pt) if >10.
In the last column, place an X next to any item located within or immediately adjacent to the AA, that is likely to have caused a part of the AA to be inundated less extensively, less deeply, less frequently, and/or for shorter duration that it would be without that item.
Form FieldS version 2.0.2 April 2010
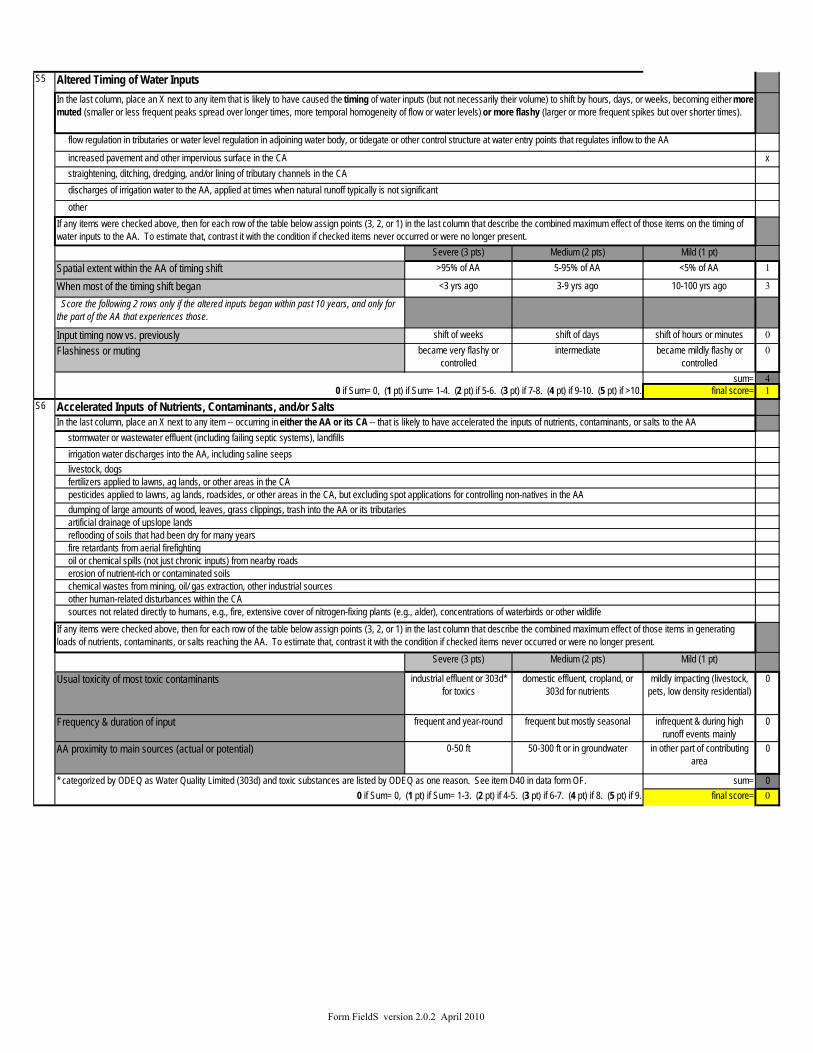
Altered Timing of Water Inputs
x
Severe (3 pts) Medium (2 pts) Mild (1 pt)Spatial extent within the AA of timing shift >95% of AA 5-95% of AA <5% of AA 1
When most of the timing shift began <3 yrs ago 3-9 yrs ago 10-100 yrs ago 3
Score the following 2 rows only if the altered inputs began within past 10 years, and only for the part of the AA that experiences those.
Input timing now vs. previously shift of weeks shift of days shift of hours or minutes 0
Flashiness or muting became very flashy or controlled
intermediate became mildly flashy or controlled
0
sum= 4final score= 1
Severe (3 pts) Medium (2 pts) Mild (1 pt)
Usual toxicity of most toxic contaminants industrial effluent or 303d* for toxics
domestic effluent, cropland, or 303d for nutrients
mildly impacting (livestock, pets, low density residential)
0
Frequency & duration of input frequent and year-round frequent but mostly seasonal infrequent & during high runoff events mainly
0
AA proximity to main sources (actual or potential) 0-50 ft 50-300 ft or in groundwater in other part of contributing area
0
sum= 0final score= 0
S5
S60 if Sum= 0, (1 pt) if Sum= 1-4. (2 pt) if 5-6. (3 pt) if 7-8. (4 pt) if 9-10. (5 pt) if >10.
0 if Sum= 0, (1 pt) if Sum= 1-3. (2 pt) if 4-5. (3 pt) if 6-7. (4 pt) if 8. (5 pt) if 9.
fertilizers applied to lawns, ag lands, or other areas in the CA
dumping of large amounts of wood, leaves, grass clippings, trash into the AA or its tributaries artificial drainage of upslope lands
stormwater or wastewater effluent (including failing septic systems), landfillsIn the last column, place an X next to any item -- occurring in either the AA or its CA -- that is likely to have accelerated the inputs of nutrients, contaminants, or salts to the AA
* categorized by ODEQ as Water Quality Limited (303d) and toxic substances are listed by ODEQ as one reason. See item D40 in data form OF.
increased pavement and other impervious surface in the CA
reflooding of soils that had been dry for many years fire retardants from aerial firefighting
straightening, ditching, dredging, and/or lining of tributary channels in the CA discharges of irrigation water to the AA, applied at times when natural runoff typically is not significant
irrigation water discharges into the AA, including saline seeps
erosion of nutrient-rich or contaminated soils
Accelerated Inputs of Nutrients, Contaminants, and/or Salts
In the last column, place an X next to any item that is likely to have caused the timing of water inputs (but not necessarily their volume) to shift by hours, days, or weeks, becoming either more muted (smaller or less frequent peaks spread over longer times, more temporal homogeneity of flow or water levels) or more flashy (larger or more frequent spikes but over shorter times).
otherIf any items were checked above, then for each row of the table below assign points (3, 2, or 1) in the last column that describe the combined maximum effect of those items on the timing of water inputs to the AA. To estimate that, contrast it with the condition if checked items never occurred or were no longer present.
flow regulation in tributaries or water level regulation in adjoining water body, or tidegate or other control structure at water entry points that regulates inflow to the AA
livestock, dogs
other human-related disturbances within the CA sources not related directly to humans, e.g., fire, extensive cover of nitrogen-fixing plants (e.g., alder), concentrations of waterbirds or other wildlifeIf any items were checked above, then for each row of the table below assign points (3, 2, or 1) in the last column that describe the combined maximum effect of those items in generating loads of nutrients, contaminants, or salts reaching the AA. To estimate that, contrast it with the condition if checked items never occurred or were no longer present.
chemical wastes from mining, oil/ gas extraction, other industrial sources
oil or chemical spills (not just chronic inputs) from nearby roads
pesticides applied to lawns, ag lands, roadsides, or other areas in the CA, but excluding spot applications for controlling non-natives in the AA
Form FieldS version 2.0.2 April 2010

Severe (3 pts) Medium (2 pts) Mild (1 pt)Erosion in CA extensive evidence, high
intensity*potentially (based on high-
intensity* land use) or scattered evidence
potentially (based on low-intensity* land use) with little
or no direct evidence
0
Recentness of significant soil disturbance in the CA current & ongoing 1-12 months ago >1 yr ago 0
Duration of sediment inputs to the AA frequent and year-round frequent but mostly seasonal infrequent & during high runoff events mainly
0
AA proximity to actual or potential sources 0-50 ft, or farther but on steep erodible slopes
50-300 ft in other part of contributing area
0
sum= 0
final score= 0
Severe (3 pts) Medium (2 pts) Mild (1 pt)Spatial extent of altered soil >95% of AA or >95% of its
upland edge (if any)5-95% of AA or 5-95% of its
upland edge (if any)<5% of AA and <5% of its
upland edge (if any)0
Recentness of significant soil alteration in AA current & ongoing 1-12 months ago >1 yr ago 0
Duration long-lasting, minimal veg recovery
long-lasting but mostly revegetated
short-term, revegetated, not intense
0
Timing of soil alteration frequent and year-round frequent but mostly seasonal infrequent & mainly during scattered events
0
sum= 0
final score= 0
S7
S8
In the last column, place an X next to any item present in the CA that is likely to have elevated the load of waterborne or windborne sediment reaching the AA from its CA. erosion from plowed fields, fill, timber harvest, dirt roads, vegetation clearing, fires
other human-related disturbances within the CA
erosion from livestock or foot traffic in the CA stormwater or wastewater effluent sediment from gravel mining, other mining, oil/ gas extraction
erosion from construction, in-channel machinery in the CA
Excessive Sediment Loading from Contributing Area
excavation
accelerated channel downcutting or headcutting of tributaries due to altered land use
erosion from off-road vehicles in the CA
natural processes within the CA, e.g., streambank erosion, landslides, erosion of erosion-prone soils especially following fire, floods
0 if Sum= 0, (1 pt) if Sum= 1-4. (2 pt) if 5-6. (3 pt) if 7-8. (4 pt) if 9-10. (5 pt) if >10.
If any items were checked above, then for each row of the table below assign points (3, 2, or 1) in the last column that describe the combined maximum effect of those items in increasing the amount or transport of sediment into the AA. To estimate that, contrast it with the condition if checked items never occurred or were no longer present.
livestock and other sediment- or soil-disturbing animals, e.g., carp, nutria, wild boar, people on foot fill or riprap, excluding small amounts of upland soils containing organic amendments (compost, etc.) or small amounts of topsoil imported from another wetland tillage, plowing (but excluding disking for enhancement of native plants)
If any items were checked above, then for each row of the table below assign points (3, 2, or 1) in the last column that describe the combined maximum effect of those items in altering the AA's soils. To estimate that, contrast it with the soil condition if checked items never occurred or were no longer present.
* high-intensity= plowing, grading, excavation, erosion with or without veg removal; low-intensity= veg removal only with little or no apparent erosion or disturbance of soil or sediment
artificial water level or flow manipulations sufficient to cause erosion or stir bottom sediments
Soil or Sediment Alteration Within the Assessment AreaIn the last column, place an X next to any item present in the AA that is likely to have compacted, eroded, or otherwise altered the AA's soil compaction from machinery, off-road vehicles, or mountain bikes, especially during wetter periods leveling or other grading not to the natural contour
dredging in or adjacent to the AA boat traffic in or adjacent to the AA and sufficient to cause shore erosion or stir bottom sediments
0 if Sum= 0, (1 pt) if Sum= 1-4. (2 pt) if 5-6. (3 pt) if 7-8. (4 pt) if 9-10. (5 pt) if >10.
natural processes within the AA, e.g., trampling by concentrated wildlife, shore or streambank erosion, landslides, normal erosion of erosion-prone soils especially following fire, floods.
Form FieldS version 2.0.2 April 2010

Severe (3 pts) Medium (2 pts) Mild (1 pt)Spatial extent of veg removal >95% of AA or >95% of its
water edge5-95% of AA or 5-95% of its water
edge<5% of AA and <5% of its
water edge if any0
Frequency of significant veg removal regularly during most of the year
a few times a year annual or less 0
Biomass recovery after each removal > 20 yrs 2-20 yrs <2 yrs 0
sum= 0final score= 0
S9
If any items were checked above, then for each row of the table below assign points (3, 2, or 1) in the last column that describe the combined maximum effect of those items on the amount of vegetation cover in the AA.
removal of woody debris
natural processes concentrated within the AA, e.g., wind & wave scouring, windthrow, insect or disease infestations, fires, beaver damage, natural erosion, intensive grazing by deer, elk, geese.
plowing, regrading
0 if Sum= 0, (1 pt) if Sum= 1-3. (2 pt) if 4-5. (3 pt) if 6-7. (4 pt) if 8. (5 pt) if 9.
Vegetated Cover Removal Within the Assessment Area
herbicides, excepting spot applications for controlling non-native plants in the AA
shading from large artificial structure, e.g., bridge, boardwalk, dock other human-related disturbances within the AA
In the last column, place an X next to any item present in the AA that is likely to have caused less canopy or ground cover, or less vegetation biomass, or less wood generally. If only the species composition (not total cover or biomass) changed, do not check any of these items.
mowing
clearing, logging, excepting removal of woody vegetation from native prairies grazing by livestock
Form FieldS version 2.0.2 April 2010

ORWAP SCORES SHEET version 2.0.2 May 2012Site Name:Investigator Name:Date of Field Assessment:Latitude (decimal degrees): Longitude (decimal degrees):
Specific Functions:Relative Effectiveness of
the FunctionRelative Values of the Function
Water Storage & Delay (WS) 1.25 2.58Sediment Retention & Stabilization (SR) 10.00 4.46Phosphorus Retention (PR) 10.00 5.01Nitrate Removal & Retention (NR) 10.00 4.39Thermoregulation (T) 0.00 0.00Carbon Sequestration (CS) 1.52Organic Matter Export (OE) 0.00Aquatic Invertebrate Habitat (INV) 6.61 7.00Anadromous Fish Habitat (FA) 0.00 4.22Non-anadromous Fish Habitat (FR) 0.98 10.00Amphibian & Reptile Habitat (AM) 6.75 8.00Waterbird Feeding Habitat (WBF) 4.22 4.67Waterbird Nesting Habitat (WBN) 0.00 3.50Songbird, Raptor, & Mammal Habitat (SBM) 5.14 6.67Pollinator Habitat (POL) 5.89 5.00Native Plant Diversity (PD) 5.16 7.00
GROUPED FUNCTIONS Group Scores (functions)Group Scores
(values)Hydrologic Function (WS) 1.25 2.58Water Quality Group (WQ) 10.00 5.01Carbon Sequestration (CS) 1.52Fish Support Group (FISH) 0.98 10.00Aquatic Support Group (AQ) 6.75 8.00Terrestrial Support Group (TERR) 5.89 7.00Public Use & Recognition (PU) 2.26Provisioning Services (PS) 0.00
OTHER ATTRIBUTESWetland Ecological Condition (CQ) 6.59Wetland Stressors (STR) 1.25Wetland Sensitivity (SEN) 10.00
HGM Class - Relative Probabilities (select max)
Estuarine 0.00Riverine 0.00Slope 4.48Flat 0.00Depressional 0.00Lacustrine 0.00
(identical to Water Storage and Delay function and value scores)(maximum of scores for SR, PR, NR, and T)
(maximum of scores for OE, AM, INV, WBF, and WBN)(maximum of scores for FA and FR)
(click on this cell to see this attribute defined)(click on this cell to see this attribute defined)
(maximum of scores for PD, POL, and SBM)
(identical to Carbon Sequestration score above)
Wetland A - Table Rock SubstationL.Cleveland and B. Sahatjian9/11/2014
-122.963

CoverPg: Basic Description of Assessment ORWAP version 2.0.2 May 2012Site Name: Table Rock Investigator Name: L.Cleveland and B. SahatjianDate of Field Assessment: 9/10/2014County: JacksonNearest Town: White CityLatitude (decimal degrees): 42.4760Longitude (decimal degrees): -122.9660TRS, quarter/quarter section and tax lot(s) TRS: 36S 2W 5; Q-Q Section:O-NENW; Taxlot:
10161957Approximate size of the Assessment Area (AA, in acres) 4.68AA as percent of entire wetland (approx.) 100%If delineated, DSL file number (WD #) if known n/a
Debenger-Brader loams, 1 to 15 percent slopesCoker Clay, 0 to 3 percent slopes
Gregory silty clay loam, 0 to 3 percent slopes
Debenger-Brader loams, 1 to 15 percent slopesCoker Clay, 0 to 3 percent slopes
Gregory silty clay loam, 0 to 3 percent slopesCarney clay, 1 to 5 percent slopes
PEM
HGM Class (Scores worksheet will suggest a class; see manual section 2.4.2) Flat
If tidal, the tidal phase during most of visit: n/aWhat percent (approx.) of the wetland were you able to visit? 100%What percent (approx.) of the AA were you able to visit? 100%Have you attended an ORWAP training session? If so, indicate approximate month & year.How many wetlands have you assessed previously using ORWAP (approx.)?
Soil Map Units within the AA (list these in approx. rank order by area, from WSS web site or published county survey; see manual)
Soil Map Units surrounding and contiguous to the AA (list all present in approx. rank order by area; see manual)
Cowardin Systems & Classes (indicate all present, based on field visit and/or aerial imagery): Systems: Palustrine =P, Riverine =R, Lacustrine =L, Estuarine =EClasses: Emergent =EM, Scrub-Shrub =SS, Forested =FO, Aquatic Bed (incl. SAV) =AB, Open Water =OW, Unconsolidated Bottom =UB, Unconsolidated Shore =US
Comments about the site or this ORWAP assessment (attach extra page if desired):
Version 2.0.2. April 2010.
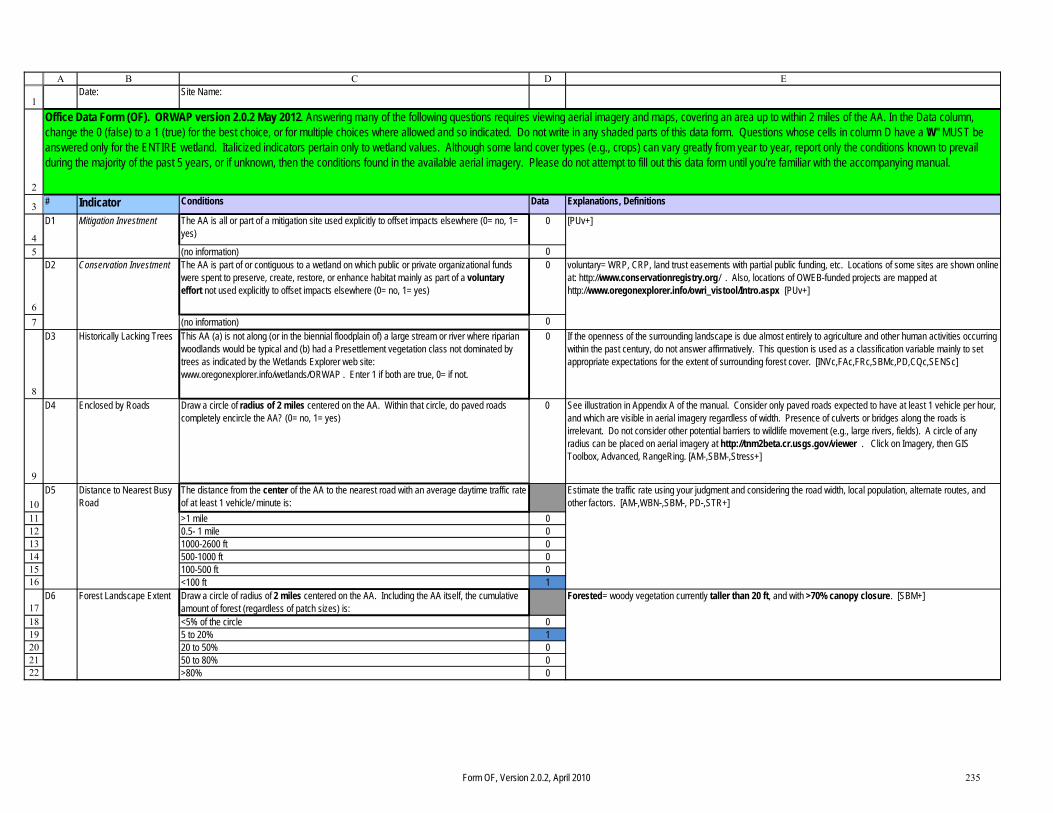
1
2
3
45
67
8
9
10111213141516
171819202122
A B C D EDate: Site Name:
# Indicator Conditions Data Explanations, Definitions
The AA is all or part of a mitigation site used explicitly to offset impacts elsewhere (0= no, 1= yes)
0
(no information) 0The AA is part of or contiguous to a wetland on which public or private organizational funds were spent to preserve, create, restore, or enhance habitat mainly as part of a voluntary effort not used explicitly to offset impacts elsewhere (0= no, 1= yes)
0
(no information) 0D3 Historically Lacking Trees This AA (a) is not along (or in the biennial floodplain of) a large stream or river where riparian
woodlands would be typical and (b) had a Presettlement vegetation class not dominated by trees as indicated by the Wetlands Explorer web site: www.oregonexplorer.info/wetlands/ORWAP . Enter 1 if both are true, 0= if not.
0 If the openness of the surrounding landscape is due almost entirely to agriculture and other human activities occurring within the past century, do not answer affirmatively. This question is used as a classification variable mainly to set appropriate expectations for the extent of surrounding forest cover. [INVc,FAc,FRc,SBMc,PD,CQc,SENSc]
D4 Enclosed by Roads Draw a circle of radius of 2 miles centered on the AA. Within that circle, do paved roads completely encircle the AA? (0= no, 1= yes)
0 See illustration in Appendix A of the manual. Consider only paved roads expected to have at least 1 vehicle per hour, and which are visible in aerial imagery regardless of width. Presence of culverts or bridges along the roads is irrelevant. Do not consider other potential barriers to wildlife movement (e.g., large rivers, fields). A circle of any radius can be placed on aerial imagery at http://tnm2beta.cr.usgs.gov/viewer . Click on Imagery, then GIS Toolbox, Advanced, RangeRing. [AM-,SBM-,Stress+]
The distance from the center of the AA to the nearest road with an average daytime traffic rate of at least 1 vehicle/ minute is:>1 mile 00.5- 1 mile 01000-2600 ft 0500-1000 ft 0100-500 ft 0<100 ft 1Draw a circle of radius of 2 miles centered on the AA. Including the AA itself, the cumulative amount of forest (regardless of patch sizes) is:<5% of the circle 05 to 20% 120 to 50% 050 to 80% 0>80% 0
Office Data Form (OF). ORWAP version 2.0.2 May 2012. Answering many of the following questions requires viewing aerial imagery and maps, covering an area up to within 2 miles of the AA. In the Data column, change the 0 (false) to a 1 (true) for the best choice, or for multiple choices where allowed and so indicated. Do not write in any shaded parts of this data form. Questions whose cells in column D have a "W" MUST be answered only for the ENTIRE wetland. Italicized indicators pertain only to wetland values. Although some land cover types (e.g., crops) can vary greatly from year to year, report only the conditions known to prevail during the majority of the past 5 years, or if unknown, then the conditions found in the available aerial imagery. Please do not attempt to fill out this data form until you're familiar with the accompanying manual.
D2
D1
D6
Mitigation Investment
Conservation Investment
[PUv+]
voluntary= WRP, CRP, land trust easements with partial public funding, etc. Locations of some sites are shown online at: http://www.conservationregistry.org/ . Also, locations of OWEB-funded projects are mapped at http://www.oregonexplorer.info/owri_vistool/Intro.aspx [PUv+]
D5 Estimate the traffic rate using your judgment and considering the road width, local population, alternate routes, and other factors. [AM-,WBN-,SBM-, PD-,STR+]
Distance to Nearest Busy Road
Forest Landscape Extent Forested= woody vegetation currently taller than 20 ft, and with >70% canopy closure. [SBM+]
Form OF, Version 2.0.2, April 2010 235

23
24
252627
2829303132
33
3435363738
39
40
41
424344454647
A B C D EThe minimum distance from the AA edge to the closest forested tract or corridor larger than 100 acres is:
<100 ft, or 100-300 ft and not separated from the AA by stretches of open water, bare ground, lawn, or impervious surface that are wider than 150 ft.
0
100-300 ft and separated from the AA by stretches of open water, bare ground, lawn, or impervious surface that are wider than 150 ft.
0
300-1000 ft 0>1000 ft 1
D8 The largest patch or corridor within 0.5 mile of the AA edge that is forested (and not separated from the AA by roads, fields, etc. that create a gap wider than 150 ft), occupies:
<1 acre of forest 11-10 acres 010-100 acres 0100-1000 acres 0>1000 acres 0
D9 Within a 2-mile radius measured from the center of the AA, the percent of the land that has natural land cover (see definition on right) is:
<5% of the land 05 to 20% of the land 020 to 60% of the land 060 to 90% of the land 1>90% of the land 0
D10 Within a 2-mile radius measured from the center of the AA, the area that is not "natural land cover" or water is mostly:impervious surface, e.g., paved road, parking lot, building, exposed rock 0
bare pervious surface, e.g., dirt or gravel road, plowed fields, dunes, recent clearcut or landslide
0
cultivated row crops, orchards, vineyards, tree plantations 1artificially landscaped areas or lawn 0grassland grazed or mowed to a height usually shorter than 4 inches 0other 0(none of above; land cover is >90% natural land cover) 0
D7 forested tract= a land cover patch that has >70% tree cover. A corridor is simply an elongated forested patch that is not narrower than 150 ft at any point. "Not separated" from the AA means not separated by roads or other features that create a tree canopy gap wider than 150 ft. [SBM+]
The patch or corridor may either be entirely or only partially within the 0.5 mile distance. Disqualify any patch or corridor of forest where canopy thins to <70% cover, or where the forested patch becomes separated from the AA by a tree canopy gap of >150 ft or where the forested corridor narrows to less than 150 ft width. See diagram in Appendix A of the manual. Patch area can be measured at http://tnm2beta.cr.usgs.gov/viewer (GIS Toolbox, Advanced) or estimated online in GoogleEarth using the following guidelines: 1 acre is about: 200 ft on a side (if square)10 acres is about: 660 ft on a side100 acres is about: 0.5 mile on a side1000 acres is about: 1 mile on a side [SBM+]
Natural land cover includes wooded areas, native prairies, sagebrush, vegetated wetlands, as well as relatively unmanaged commercial lands such as ryegrass fields, hayfields, lightly grazed pastures, timber harvest areas, and rangeland. It does not include water, row crops (vegetable, orchards, Christmas tree farms), residential areas, golf courses, recreational fields, pavement, bare soil, rock, bare sand, or gravel or dirt roads. Natural land cover is not the same as native vegetation. It frequently includes a dominance of non-native plants (e.g., cheat grass, Himalayan blackberry). Although some land cover types (e.g., crops) can vary greatly from year to year, report only the conditions known to prevail during the majority of the past 5 years, or if unknown, then the conditions found in the available aerial imagery. [AM+,SBM+)
[POLv-,AM+,SBM+]
Forest Tract Proximity
Size of Nearby Forest
Natural Land Cover Extent
Type of Land Cover Alteration
Form OF, Version 2.0.2, April 2010 335
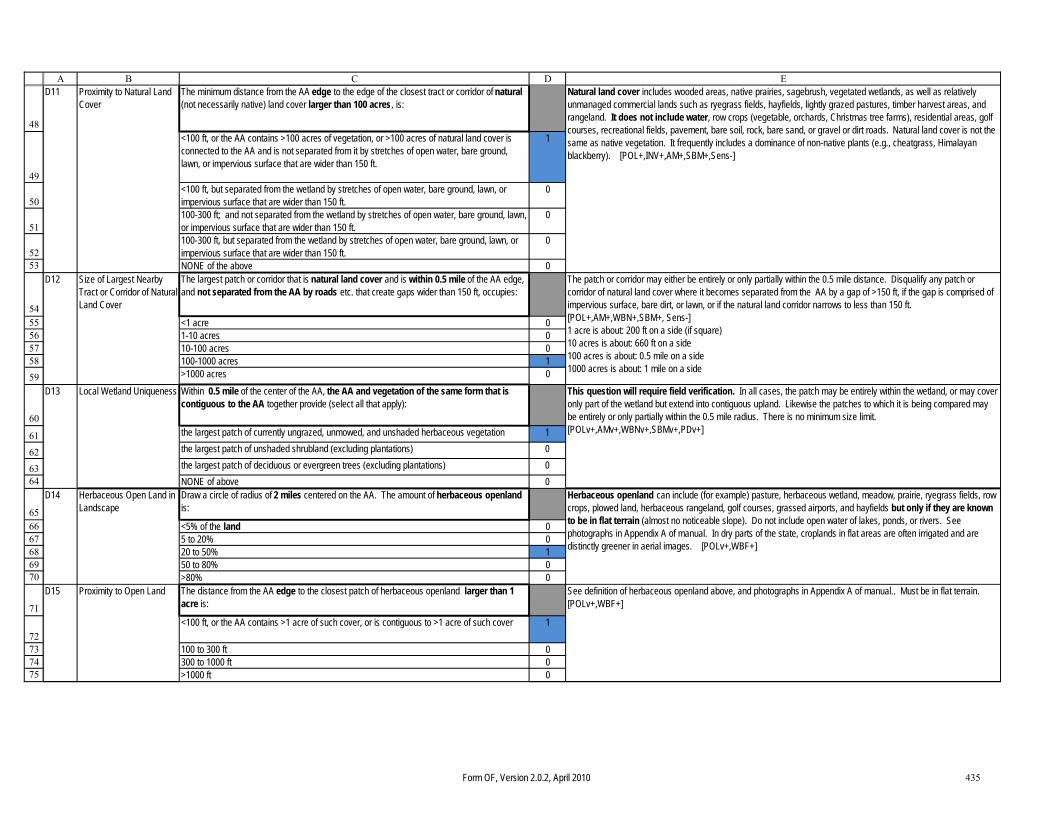
48
49
50
51
5253
545556575859
60
61626364
656667686970
71
72737475
A B C D ED11 The minimum distance from the AA edge to the edge of the closest tract or corridor of natural
(not necessarily native) land cover larger than 100 acres, is:
<100 ft, or the AA contains >100 acres of vegetation, or >100 acres of natural land cover is connected to the AA and is not separated from it by stretches of open water, bare ground, lawn, or impervious surface that are wider than 150 ft.
1
<100 ft, but separated from the wetland by stretches of open water, bare ground, lawn, or impervious surface that are wider than 150 ft.
0
100-300 ft; and not separated from the wetland by stretches of open water, bare ground, lawn, or impervious surface that are wider than 150 ft.
0
100-300 ft, but separated from the wetland by stretches of open water, bare ground, lawn, or impervious surface that are wider than 150 ft.
0
NONE of the above 0D12 The largest patch or corridor that is natural land cover and is within 0.5 mile of the AA edge,
and not separated from the AA by roads etc. that create gaps wider than 150 ft, occupies:
<1 acre 01-10 acres 010-100 acres 0100-1000 acres 1>1000 acres 0
D13 Within 0.5 mile of the center of the AA, the AA and vegetation of the same form that is contiguous to the AA together provide (select all that apply):
the largest patch of currently ungrazed, unmowed, and unshaded herbaceous vegetation 1the largest patch of unshaded shrubland (excluding plantations) 0the largest patch of deciduous or evergreen trees (excluding plantations) 0NONE of above 0
D14 Draw a circle of radius of 2 miles centered on the AA. The amount of herbaceous openland is:
<5% of the land 05 to 20% 020 to 50% 150 to 80% 0>80% 0
D15 The distance from the AA edge to the closest patch of herbaceous openland larger than 1 acre is:
<100 ft, or the AA contains >1 acre of such cover, or is contiguous to >1 acre of such cover 1
100 to 300 ft 0300 to 1000 ft 0>1000 ft 0
Local Wetland Uniqueness
Herbaceous Open Land in Landscape
Proximity to Open Land
Natural land cover includes wooded areas, native prairies, sagebrush, vegetated wetlands, as well as relatively unmanaged commercial lands such as ryegrass fields, hayfields, lightly grazed pastures, timber harvest areas, and rangeland. It does not include water, row crops (vegetable, orchards, Christmas tree farms), residential areas, golf courses, recreational fields, pavement, bare soil, rock, bare sand, or gravel or dirt roads. Natural land cover is not the same as native vegetation. It frequently includes a dominance of non-native plants (e.g., cheatgrass, Himalayan blackberry). [POL+,INV+,AM+,SBM+,Sens-]
This question will require field verification. In all cases, the patch may be entirely within the wetland, or may cover only part of the wetland but extend into contiguous upland. Likewise the patches to which it is being compared may be entirely or only partially within the 0.5 mile radius. There is no minimum size limit. [POLv+,AMv+,WBNv+,SBMv+,PDv+]
The patch or corridor may either be entirely or only partially within the 0.5 mile distance. Disqualify any patch or corridor of natural land cover where it becomes separated from the AA by a gap of >150 ft, if the gap is comprised of impervious surface, bare dirt, or lawn, or if the natural land corridor narrows to less than 150 ft. [POL+,AM+,WBN+,SBM+, Sens-]1 acre is about: 200 ft on a side (if square)10 acres is about: 660 ft on a side100 acres is about: 0.5 mile on a side1000 acres is about: 1 mile on a side
Herbaceous openland can include (for example) pasture, herbaceous wetland, meadow, prairie, ryegrass fields, row crops, plowed land, herbaceous rangeland, golf courses, grassed airports, and hayfields but only if they are known to be in flat terrain (almost no noticeable slope). Do not include open water of lakes, ponds, or rivers. See photographs in Appendix A of manual. In dry parts of the state, croplands in flat areas are often irrigated and are distinctly greener in aerial images. [POLv+,WBF+]
See definition of herbaceous openland above, and photographs in Appendix A of manual.. Must be in flat terrain. [POLv+,WBF+]
Proximity to Natural Land Cover
Size of Largest Nearby Tract or Corridor of Natural Land Cover
Form OF, Version 2.0.2, April 2010 435

76777879808182
83848586878889
9091929394959697
9899
100101102103
A B C D ED16 Draw a circle of radius of 2 miles centered on the AA. Including water ponded in the AA itself
or in a fringing water body, the amount of non-tidal water that is ponded during most of the year is:<5% of the circle, located in 5 or fewer ponds or lakes 0<5% of the circle, located in >5 ponds or lakes 15 to 30%, located in 10 or fewer ponds or lakes 05 to 30%, located in >10 ponds or lakes 0>30%, located in 15 or fewer ponds or lakes 0>30%, located in >15 ponds or lakes 0
D17 The minimum distance from the AA edge to the closest non-tidal wetland, pond, or lake that is larger than 1 acre, is ponded most of the year, and is not part of the same associated wetland, pond, or lake, is:<300 ft, and connected with a natural land corridor 0<300 ft, but no uninterrupted natural land corridor 0300-1000 ft, and connected with a natural land corridor 0300-1000 ft, but no uninterrupted natural land corridor 0>1000 ft, and connected with a natural land corridor 1>1000 ft, but no uninterrupted natural land corridor 0
D18 The distance from the AA edge to the closest (but separate) non-tidal body of water that is ponded during most of the year and is larger than 20 acres (about 1000 ft on a side) is:
<1 mile 01-5 miles 1>5 miles 0
D19 The distance from the AA edge to the closest tidal body of water is:<1 mile 01-5 miles 0>5 miles 1
D20 Using the Web Soil Survey procedure described in the ORWAP manual, the rating of the soil map unit which occupies the largest percentage of the zone 200 ft uphill from the AA is:
very severe 0severe 0moderate 0slight 1(could not determine) 0
If multiple smaller water bodies are separated by <150 ft they may be combined when evaluating acreage. Consult wetland maps, considering only those polygons whose water regime may be "permanent," "intermittently exposed," or "semipermanent" (codes F, G, or H on NWI maps). [WBF+,WBN+,Sens-]
Ponded Water Proximity
[CS+,WBF+]
Ponded water = any surface water that is not obviously part of a river, stream, or tidal system. Include herbaceous (emergent) wetlands larger than 1 acre if they are inundated and water is ponded at least seasonally. Also include waters such as sloughs that are ponded most of the year but connected seasonally to rivers. Consult the online wetland maps at Wetland Explorer and note wetlands that are not obviously intersected by streams and are not estuarine [AM+,WBF+,WBN+,SBM+,Sens-]
If multiple smaller water bodies are separated by <150 ft they may be combined when evaluating acreage. "Uninterrupted" means no impervious surfaces wider than 150 ft interrupt the corridor. "Natural" land corridor means a corridor comprised of natural land cover as defined in D9 above. Consult wetland maps, considering only those polygons whose water regime may be "permanent," "intermittently exposed," or "semipermanent" (codes F, G, or H on NWI maps). [AM+,WBF+,WBN+,SBM+,Sens-]
Large Ponded Water Proximity
Tidal Proximity
Upslope Soil Erodibility Risk
See the ORWAP manual for instructions on how to obtain this information online. [SRv+, Sens+]
Ponded Water in Landscape
Form OF, Version 2.0.2, April 2010 535

104105106107108109110
111
112
113
114115116
117118119120121122
A B C D ED21 Using the Web Soil Survey AOI tool to measure it, what is the area of the largest patch of
emergent, shrub, or forest vegetation within the entire wetland of which the AA is a part? Use just the dominant class. See instructions in last column.
<0.1 acre 00.1 - 1 acre 01 to 10 acres 110 to 100 acres 0100 to 1000 acres 0>1000 acres 0
D22 From the Wetlands Explorer web site (see Manual), note the 12-digit code number for this wetland's HUC6 (Hydrologic Unit Code, i.e., watershed). Then turn to the HUC4, HUC5, and HUC6 worksheets in the ORWAP_SuppInfo file. Compare the extent of the wetland's dominant vegetation form (from above) with that of the largest wetlands of the same class in the same HUC4 (first 8 digits), the same HUC5 (first 10 digits), and the same HUC6 (12 digits). Enter "1" for all that apply below:
the vegetated part of this wetland is as large or larger than any of its class mapped in its HUC4 watershed
0
the vegetated part of this wetland is as large or larger than any of its class mapped in its HUC5 watershed
0
the vegetated part of this wetland is as large or larger than any of its class mapped in its HUC6 watershed
0
none of above 1data are inadequate (NWI mapping not >90% completed in HUC) 0
D23 Turn to the HUCbest worksheet in the ORWAP_SuppInfo file. Using the HUC code noted from the web site, is this AA located in one of the HUCs that are listed as having a large diversity of wetland types relative to area of wetlands (column 3), or a large number (column 4) or area (column 5) of wetlands relative to area of the HUC? Enter "1" for all that apply below:
yes, for the HUC4 watershed 0yes, for the HUC5 watershed 0yes, for the HUC6 watershed 1none of above 0data are inadequate (NWI mapping not completed in HUC) 0
Wetland Number & Diversity Uniqueness
When drawing the polygon around the patch, exclude vegetation of the same patch type if separated by a gap created by open water, a road, dike, or upland that is wider than 150 ft. [WBF+, WBN+, SBM+, POL+, Sens-]
"of its type" means Cowardin system and class. First determine size importance in HUC6 and if criteria met, then also screen for importance in HUC5 and if met then in HUC4. Alternatively, instead of checking the worksheets, you may go to the Wetland Explorer web site, locate this wetland, activate the boundaries for wetlands plus the HUC4, 5, and 6, and then determine visually if this is the largest wetland of its class. Note that data are lacking for some HUCs. Also note that a HUC4 is the same as an 8-digit HUC, a HUC5 is the same as a 10-digit HUC, and a HUC6 is the same as a 12-digit HUC. [WBFv+, WBNv+, SBMv+]
Wetland Size Uniqueness in Watershed
Extent of Dominant Vegetation Class in Wetland
"type diversity" was based on Cowardin system and class (e.g., Palustrine emergent). Note that data are lacking for some HUCs. Because the diversity of types, number of wetlands, and proportional area of wetlands are highly intercorrelated, the criteria used to define "large" were based on the residuals of regression of those variables against wetland area or numbers in the associated HUC. Thus, the relative rather than the absolute number of types or number of wetlands in the HUC was the basis for judging "large," and the top 5% of the residuals was used to identify the most outstanding wetlands in each category. [AM+, WBF+, WBN,+ SBM]+
Form OF, Version 2.0.2, April 2010 635

123
124
125
126
127
128
129
130
131
132
133
134
135
A B C D E
D24 Compared to extent of wetland that may have been originally present at this location (just prior to settlement in 1851), the current wetland is:
W
same size and boundaries, approximately. For example, wetland boundary may be nearly identical to hydric soil boundary
0
smaller (50-99% of the original size) and/or severed (by roads, dikes, drained soils, etc) from a few historically connected wetlands that may no longer exist. Soil map may show hydric soil extending somewhat beyond current wetland boundary.
1
much smaller (<50% of the original size) and/or extensively severed (by roads, dikes, drained soils) from many historically connected wetlands that may no longer exist. Soil map may show hydric soil extending far beyond current wetland boundary.
0
larger (due to damming of stream or runoff, excavation, removal of obstructions, irrigation, etc. that floods soils not mapped as hydric) or has been connected to wetlands from which it existed in isolation just prior to settlement.
0
no wetland is known to have been present at this location originally (no hydric soil is mapped and presettlement vegetation was not wetland; the entire wetland may have resulted from impoundment, excavation, or regrading of upland soils)
0
D25 Go to the Oregon Wetlands Explorer web site or other sources noted below and use those to help determine each of the following:
See section 2.2.8 of the ORWAP manual.
a) the AA is within or is connected to (at least seasonally) a stream or other water body within 0.5 mile that has been designated as Essential Indigenous Anadromous Salmonid Habitat (ESH)
0 You must use information not contained on the Wetlands Explorer web site to determine if such a connection exists at least seasonally. If no mapped ESH is near the AA but ODFW has confirmed the accessibility of the AA by salmonids and the presence of salmonids in nearby waters, this question may be answered affirmatively. Many potential blockages along streams are shown in maps that may be downloaded from: http://nrimp.dfw.state.or.us/nrimp/default.aspx?pn=fishbarriermaps
b) the AA is within or contiguous to a Special Protected Area managed by a conservation group or designated as specially protected for conservation by a state or federal resource agency,
0 This includes BLM Area of Critical Environmental Concern (ACEC) or Outstanding Natural Area (ONA), Federal Research Natural Area (RNA) or Special Interest Area (SIA), or Natural Heritage Conservation (NHCA), Land Trust and Nature Conservancy Preserves, and others.
c) the AA is within or contiguous to a Wetland Priority Area as determined partly by ODFW 0 As recognized by the Oregon Wildlife Conservation Strategy or the Oregon Natural Heritage Program
d) the AA is within an IBA (Important Bird Area, as officially designated) and listed in the IBA worksheet in the ORWAP_SuppInfo file
0
NONE of above 1
Special Conservation Designations of the Wetland or Local Area
"Originally present" means immediately prior to widespread settlement of the region by western cultures (generally, about 1850). See ORWAP manual (section 2.2.8) for instructions on how to see hydric soils in the vicinity. If the hydric soil map units that intersect the wetland are together much larger than the wetland, assume fragmentation has occurred. If possible, also see maps of pre-settlement vegetation (available from ORNHIC for parts of Oregon), and topography. [CQ+]
Historical Hydrologic Connectivity
To answer most of the following questions, you must obtain specific information from web sites or agencies as indicated in the Manual or in the last column (E). In a few cases you may need to also examine aerial imagery. In the Data column (D), change the 0 (false) to a 1 (true) for the best choice, or for multiple choices where allowed and so indicated.
Form OF, Version 2.0.2, April 2010 735

136
137
138
139
140
141
142143
144
145
146147148
149
150
151152153
154
155
156157
158
A B C D ED26 According to the Wetlands Explorer web site, the score for occurrences of rare non-
anadromous fish species in the vicinity of this AA is:
high (≥ 0.75 for maximum score, or ≥ 0.90 for this group's score sum), or there is a recent (within 5 yrs) onsite observation of any of these species by a qualified observer under conditions similar to what now occur
1
intermediate (i.e., not as described above or below) 0
low (≤ 0.33 for both the maximum score this group's score sum, but not 0 for both) 0
zero for both this group's maximum and its sum score, and no recent onsite observation of these species by a qualified observer under conditions similar to what now occur
0
D27 According to the Wetlands Explorer web site, the score for occurrences of rare invertebrate species in the vicinity of this AA is: high (≥ 0.75 for maximum score, or for this group's score sum), or there is a recent onsite observation of any of these species by a qualified observer under conditions similar to what now occur
0
low (< 0.75 for maximum score AND for this group's score sum, but not 0 for both) 1zero for both this group's maximum and its sum score, and no recent onsite observation of these species by a qualified observer under conditions similar to what now occur
0
D28 According to the Wetlands Explorer web site, the score for occurrences of rare amphibian or reptile species in the vicinity of this AA is: high (≥ 0.60 for maximum score, or >0.90 for score sum), or there is a recent onsite observation of any of these species by a qualified observer under conditions similar to what now occur
0
intermediate (i.e., not as described above or below) 0low (≤ 0.21 for maximum score AND <0.15 for score sum, but not 0 for both) 1zero for both this group's maximum and its sum score, and no recent onsite observation of these species by a qualified observer under conditions similar to what now occur
0
D29 According to the Wetlands Explorer web site, the score for occurrences of rare nesting waterbird species in the vicinity of this AA is: high (≥ 0.60 for maximum score, or ≥1.00 for this group's score sum), or there is a recent onsite observation of any of these species by a qualified observer under conditions similar to what now occur
0
intermediate (i.e., not as described above or below) 0low (≤ 0.09 for maximum score and for score sum, but not 0 for both) 0zero for both this group's maximum and its sum score, and no recent onsite observation of these species by a qualified observer under conditions similar to what now occur
1
D30 According to the Wetlands Explorer web site, the score for occurrences of rare non-breeding (feeding) waterbird species in the vicinity of this AA is: high (≥ 0.33 for maximum score, or there is a recent onsite observation of any of these species by a qualified observer under conditions similar to what now occur
0
low (< 0.33 for maximum score and for score sum, but not 0 for both) 0zero for both this group's maximum and its sum score, and no recent onsite observation of these species by a qualified observer under conditions similar to what now occur
1
Invertebrate Species of Conservation Concern
Non-anadromous Fish Species of Conservation Concern
Amphibian or Reptile of Conservation Concern
Nesting Waterbird Species of Conservation Concern
"Non-breeding" mainly refers to waterbird feeding during migration and winter. [WBFv+]Feeding (Non-breeding) Waterbird Species of Conservation Concern
Species include Pit-Klamath brook lamprey (S3), Miller Lake lamprey (S1), Klamath lamprey (S3), Malheur mottled sculpin (S3), Margined sculpin (S3), Slender sculpin (S3), Alvord chub (S2), Tui chub (S), Borax Lake chub (S1), Speckled dace (SS), Oregon chub (S2), Umpqua chub (S2), Modoc sucker (S1), Klamath smallscale sucker (SS), Warner sucker (S1), Shortnose sucker (S1), Pit Sculpin (S1), Klamath Lake Sculpin (S3), Bull Trout (S3), Blue Chub (S3), Umpqua Dace (S3), Lahontan Redside (S2), Klamath Largescale Sucker (S3), Tahoe Sucker (S1), Lost River Sucker (S1), Sacramento Perch (S3). Note that for some of these species, only specific geographic populations are designated. S1 is the most imperiled, S3 less so, according to ratings by the Oregon Natural Heritage Information Center. [FRv+]
Species include: Red-necked Grebe (S1), Am. White Pelican (S2), Snowy Egret (S2), Barrow's Goldeneye (S3), Bufflehead (S2), Yellow Rail (S1), Sandhill Crane (S3), Snowy Plover (S2), Black-necked Stilt (SS), Long-billed Curlew (S3), Franklin's Gull (S2), Caspian Tern (SS). [WBNv+]
Species include: Painted Turtle (S2), Northwestern Pond Turtle (S2), Clouded Salamander (S3), Oregon Slender Salamander (S2), Larch Mountain Salamander (S2), Siskiyou Mountains Salamander (S2), Cope's Giant Salamander (S2), Cascade Torrent Salamander (S3), Columbia Torrent Salamander (S3), Coastal Tailed Frog (S3), Inland Tailed Frog (S2), Northern Red-legged Frog (S3), Foothill Yellow-legged Frog (S2), Cascades Frog (S3), Northern Leopard Frog (S1), Oregon Spotted Frog (S2), Columbia Spotted Frog (S2), Great Basin Back-collared Lizard (S3), Desert Horned Lizard (S3), Night Snake (S3), Common Kingsnake (S3), Ground Snake (S3). [AMv+]
Form OF, Version 2.0.2, April 2010 835

159
160
161
162
163
164
165166
167
168169
170
171
172
173
174
175
176
177
178179
A B C D ED31 According to the Wetlands Explorer web site, the score for occurrences of rare songbird,
raptor, or mammal species in the vicinity of this AA is:
high (≥ 0.60 for maximum score, or >1.13 for score sum), or there is a recent onsite observation of any of these species by a qualified observer under conditions similar to what now occur
0
intermediate (i.e., not as described above or below) 1
low (≤ 0.09 for maximum score AND <0.13 for score sum, but not 0 for both) 0
zero for both this group's maximum and its sum score, and no recent onsite observation of these species by a qualified observer under conditions similar to what now occur
0
D32 According to the Wetlands Explorer web site, the score for occurrences of rare plant species in the vicinity of this AA is: high (≥ 0.75 for maximum score, or > 4.00 for score sum), or there is a recent onsite observation of any of these species by a qualified observer under conditions similar to what now occur
0
intermediate (i.e., not as described above or below) 1low (≤ 0.12 for maximum score AND < 0.20 for score sum, but not 0 for both) 0
zero for both this group's maximum and its sum score, and no recent onsite observation of these species by a qualified observer under conditions similar to what now occur
0
D33 According to the Wetlands Explorer web site:The AA is tidal, or is either (a) not within a 100-yr floodplain of a river, or (b) there are no inhabited buildings or cropland within 2 miles downslope that are within the 100-yr floodplain. Mark "1" then SKIP TO D35.
1
Inhabited buildings within 1 mile downslope from the AA also are within the 100-yr floodplain 0
Croplands but no inhabited buildings are within 1 mile downslope from the AA, and that cropland is also within the 100-yr floodplain
0
Inhabited buildings within 1-2 miles downslope from the AA are also are within the 100-yr floodplain
0
Croplands but no inhabited buildings are within 1-2 miles downslope from the AA, and that cropland is also within the 100-yr floodplain
0
No floodplain data are available, and damage from river floods has not been known to have occurred within 2 miles downgradient. Mark "1" then SKIP to D35.
0
D34
Between the AA and any floodable buildings or cropland located within 2 miles downslope:river flow is regulated and there are many seasonally ponded areas capable of storing water. 0
river flow is regulated or there are many seasonally ponded areas capable of storing water. 0
NONE of the above 0
Plant Species of Conservation Concern
Floodable Property
"Seasonally ponded areas" includes (for example) detention ponds, reservoirs, and depressional wetlands [WSv-]
Songbird, Raptor, Mammal Species of Conservation Concern
Species include: Bald Eagle (SS), Northern Goshawk (S3), Swainson's Hawk (S3), Ferruginous Hawk (S3), Peregrine Falcon (S1), Band-tailed Pigeon (S3), Flammulated Owl (S3), Burrowing Owl (S3), Spotted Owl (S3), Great Gray Owl (S3), Short-Eared Owl (SS), Common Nighthawk (SS), Lewis's Woodpecker (S3), White-Headed Woodpecker (S2), Black-Backed Woodpecker (S3), American Three-toed Woodpecker (S3), Pileated Woodpecker (SS), Olive-sided Flycatcher (S3), Willow Flycatcher (SS), Horned Lark (SS), Purple Martin (S2), White-breasted (Slender-billed) Nuthatch (SS), Blue-gray Gnatcatcher (S3), Varied Thrush (SS), Loggerhead Shrike (S3), Yellow-breasted Chat (SS), Chipping Sparrow (SS), Brewer's Sparrow (SS), Vesper Sparrow (SS), Sage Sparrow (SS), Grasshopper Sparrow (S2), Western Meadowlark (SS), Fringed Myotis (S2), Long-Legged Myotis (S3), California Myotis (S3), Silver-haired Bat (S3), Hoary Bat (S3), Spotted Bat (S2), Townsend's Big-eared Bat (S2), Pallid Bat (S2), Red Tree Vole (S3), Kit Fox (S1), Ringtail (S3), American Marten (S3), Fisher (S2), Columbian White-Tailed Deer (SS) . [SBMv+]
Do not consider pasture or hayfields to be "cropland." See the ORWAP manual for instructions on how to obtain this information online at http://www.oregonexplorer.info/wetlands/ORWAP [WSv+]
[PDv+]
Downslope Storage
Form OF, Version 2.0.2, April 2010 935

180
181
182
183
184
185186
187
188
189190191192
193
194
195
196
A B C D ED35 According to Wetlands Explorer map showing this AA's position within its HUC4 (8-digit)
watershed, the AA is [see last column and Manual for specific guidance]:
in the upper one-third of its watershed 0
in the middle one-third of its watershed 1
in the lower one-third of its watershed 0
D36 Based on the definition and protocol in the ORWAP manual, the area of the wetland of which this AA is a part, relative to the wetland's contributing area (CA) is:
W
<1% of its CA (true if wetland is tidal, or along major river, or has many tributaries, or gets substantial water drawn from other surface water bodies, e.g., flood irrigation)
0
1 to 10% of its CA 010 to 100% of its CA 1
Larger than the area of its CA (wetland has essentially no CA, e.g., isolated by dikes with no input channels, or is in terrain so flat that a CA can't be delineated). SKIP TO D40.
0
D37 The proportion of the CA comprised of buildings, roads, parking lots, other pavement, exposed bedrock, and other impervious surface is about :
W
>25% 010 to 25% 0<10%, or wetland is tidal 1
D38 The cumulative area of seasonally ponded areas in the same CA is: WMuch (>10x) greater than the area of this wetland (plus any contiguous pond or lake), or inflow is strongly regulated by dams etc.
0
Somewhat greater than the area of this wetland (plus any contiguous pond or lake) and flows to wetland are not strongly regulated
0
Less than the area of this wetland (plus any contiguous pond or lake), or wetland is tidal, or no upslope wetlands/ ponds and no inflow regulation
1
[WSv-,SRv-,PRv-,NRv-]
1) Which end of the HUC4 is the bottom? Where streams join, the “V” that they form on the map points towards bottom of the HUC.2) If the AA is closer to the HUC4's outlet than to its upper end, and is closer to the river or large stream that exits at the bottom of the HUC4 than it is to the boundary (margin) of the HUC4, then check "lower 1/3” If not near that river, check "middle 1/3".3) If the AA is not in a 100-yr floodplain, is closer to the HUC4 upper end than to its outlet, and is closer to the boundary (margin) of the HUC4 than to the river or large stream that exits at the bottom of the HUC4, then check "upper 1/3” 4) For all other conditions, check "middle 1/3".
The CA is basically the upslope area that has the potential to deliver water to the wetland. The CA boundary typically does not cross any streams or ditches except the one at the wetland outlet (if any). Remember that if the wetland is flooded as little as once every 2 years by river flow, the CA includes all upslope areas that feed that river. If the wetland is on the fringe of a pond or lake, compare the area of that water body to its contributing area -- not the area of the wetland compared to only the wetland's contributing area. For most wetlands, and especially ones containing tributaries, the first choice will be the most appropriate. For AA's that are intercepted by a mapped stream, delineation and area calculation for the CA will be done automatically at this USGS web site: http://streamstats.usgs.gov/orstreamstats/index.asp . Enter the coordinates, zoom to scale of 1:24000 or finer, click on the stream, and click on Basin Delineation, then BasinChar. [WSv+,SRv+,PRv+,NRv+, Sens+]
Relative Elevation in Watershed
Contributing Area (CA) Percent
"Seasonally ponded area" includes (for example) detention ponds, reservoirs, and depressional wetlands [WSv-,SRv-,PRv-,NRv-]
Unvegetated Surface in the Contributing Area
Upslope Storage
Form OF, Version 2.0.2, April 2010 1035
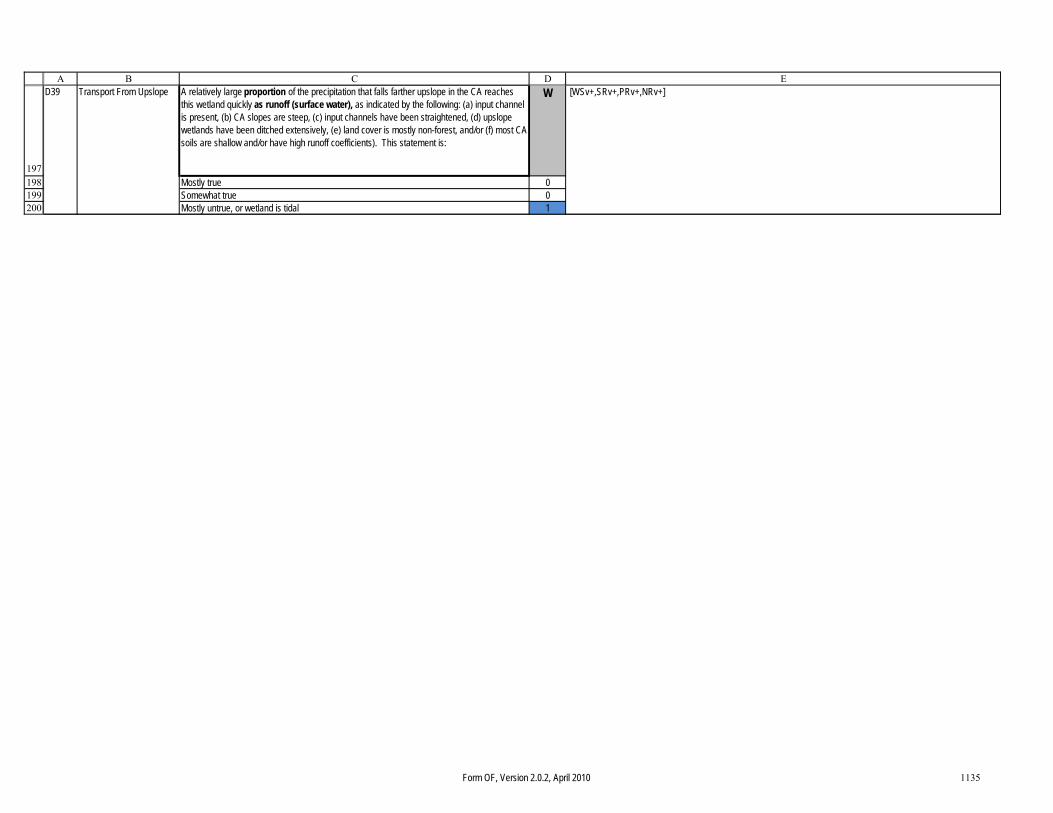
197198199200
A B C D ED39 A relatively large proportion of the precipitation that falls farther upslope in the CA reaches
this wetland quickly as runoff (surface water), as indicated by the following: (a) input channel is present, (b) CA slopes are steep, (c) input channels have been straightened, (d) upslope wetlands have been ditched extensively, (e) land cover is mostly non-forest, and/or (f) most CA soils are shallow and/or have high runoff coefficients). This statement is:
W
Mostly true 0Somewhat true 0Mostly untrue, or wetland is tidal 1
Transport From Upslope [WSv+,SRv+,PRv+,NRv+]
Form OF, Version 2.0.2, April 2010 1135

201202203204205206207
208209210211212213
214
215
216217218219220221222223
224
225226
227228229230231232233
A B C D ED40 Within 1 mile upstream from the wetland, at least one of the major sources of surface water to
this wetland (at least seasonally) has been designated as Water Quality Limited (303d) for at least one of the parameters below. Obtain from web site only -- do not guess. Select all that apply.
W
total suspended solids (TSS), sedimentation, or turbidity 0phosphorus 0nitrate or ammonia 0toxics, dioxin, heavy metals (iron, manganese, lead, zinc, etc.) 0temperature 0None of above, or degraded water cannot reach wetland, or no data. 1
D41 Within 1 mile downstream or downslope from this wetland, there is at least one stream or other water body that has been designated as Water Quality Limited (303d) for at least one of the parameters below. The water body need not be connected to the AA. Obtain from web site only -- do not guess. Select all that apply.
W
total suspended solids (TSS), sedimentation, or turbidity 0phosphorus 0nitrate or ammonia 0toxics, dioxin, heavy metals (iron, manganese, lead, zinc, etc.) 0temperature 0None of above, or no data. Mark "1" then SKIP TO D43. 1
D42 At least part of the AA is connected to the downstream 303d water mentioned in D41 above:
for 9 or more continuous months annually (persistent water in a stream, ditch, lake, or other water body)
0
intermittently (at least once annually, but for less than 9 months continually) 0Not connected, or connected less than annually 0
D43 According to the ODEQ LASAR database, the AA is within:the source area for a surface-water drinking water (DW) source 0the source area for a groundwater drinking water source 0Neither of above 1
D44 The AA is (select all that apply):within a designated Groundwater Management Area (ODEQ), see maps in Appendix A of ORWAP manual.
0
within a designated Sole Source Aquifer area (EPA): the North Florence Dunal Aquifer. See map downloadable from: http://oregonstatelands.us/DSL/WETLAND/or_wet_prot.shtml
0
NONE of above 1D45 According to the PRISM Data Explorer (see ORWAP manual for instructions), annual
precipitation in the vicinity of the wetland has normally been:
<10 inches per year 010-12 inches per year 013-19 inches per year 020-47 inches per year 148-77 inches per year 0>77 inches per year 0
Type of Outflow Connection to 303d
Drinking Water Source (DEQ)
Known Water Quality Issues Below the Wetland
See the ORWAP manual (section 2.2.7) for instructions on how to obtain this information online at http://deq12.deq.state.or.us/lasar2/default.aspx [SRv+,PRv+,NRv+,TRv+,INV-,WBF-,WBN-,STR+]
See the ORWAP manual (section 2.2.7) for instructions on how to obtain this information online at http://deq12.deq.state.or.us/lasar2/default.aspx [SRv+,PRv+,NRv+,TRv+,INV-,WBF-,WBN-,STR+]
persistent water= flows for more than 9 months during most years. [SRv+,PRv+,NRv+,TRv+,INV-,WBF-,WBN-,STR+]
See the ORWAP manual (section 2.2.7) for instructions on obtaining this online from http://deq12.deq.state.or.us/lasar2/default.aspx [NRv+]
Groundwater Risk Designations
Known Water Quality Issues in the Input Water
Mean Annual Precipitation
[NRv+]
Obtain online as explained in Manual from: http://gisdev.nacse.org/prism/nn/index.phtml These categories reflect the 10th, 25th, 50th, 75th, and 90th percentiles of all points in a comprehensive spatial grid of annual precipitation points in Oregon, for the years 1971-2000. [INVv+,AMv+,WBFv+,WBNv+,SBMv+,PDv+,Sens-]
Form OF, Version 2.0.2, April 2010 1235

234235236237238
239240241242243244245
246247
248
249250251252253
254
A B C D ED46 The phosphorus loading rank of the county in which the AA is located is: (select one); see
WQprob worksheet in ORWAP SuppInfo file. top 4 in Oregon (Marion, Malheur, Umatilla, Linn) 0top 18 (see Table 6 in WQprob worksheet in file ORWAP_SuppInfo) 0bottom 18 (see Table 6 in WQprob worksheet) 1bottom 4 (Josephine, Hood River, Lincoln, Clatsop) 0
D47 The nitrogen loading rank of the county in which the AA is located is: (select one); see WQprob worksheet in ORWAP SuppInfo file. top 4 in Oregon (Marion, Malheur, Umatilla, Linn) 0top 18 (see Table 7 in WQprob worksheet) 0bottom 18 (see Table 7 in WQprob worksheet) 1bottom 4 (Curry, Josephine, Lincoln, Clatsop) 0
D48 The AA's relative position in the estuary is (SKIP if nontidal):lower 1/3 (often on a bay and distant from the head-of-tide of a major river; includes most saline tidal wetlands)
0
mid 1/3 0upper 1/3 (near the head-of-tide of a major river; includes most brackish and fresh tidal wetlands)
0
D49 The usual maximum water-surface salinity during high tide in summer in the main channel or bay closest to the AA is (SKIP if nontidal):>30 parts per thousand (undiluted seawater) 05-30 ppt (mesohaline, polyhaline) 00.5 - 5 ppt (oligohaline) 0<0.5 ppt (fresh) 0no data for nearby locations found at the ODEQ LASAR web site or from other sources 0
Salinity Refer to Estuary Salinity maps at http://oregonstatelands.us/DSL/WETLAND/or_wet_prot.shtml or (preferably) determine this from field measurement or from data at the ODEQ LASAR web site (see ORWAP manual for instructions on accessing those data). [SR-,PR-,CS+,OE+,FA-,PD-]
Determine county from a map or online from http://deq12.deq.state.or.us/lasar2/default.aspx as explained in Manual. Data used for these rankings are from a national survey by USGS and represent the combined inputs (kg of N per sq. km.) from fertilizer, livestock, and atmospheric deposition of N during 2001. [NRv+]
[WSv+,PR+,PD+]
County Rank for Nitrogen Loading
If you don't know it, determine which county the wetland is in from the ODEQ web site ttp://deq12.deq.state.or.us/lasar2/default.aspx as explained in Manual. Data used for these rankings are from a national survey by USGS and represent the combined inputs (kg of P per sq. km.) from fertilizer (2001) and livestock (average of the years 1982, 1987, 1992, and 1997). [PRv+]
Estuarine Position
County Rank for Phosphorus Loading
Answer these final two questions only if the AA is tidal.
Form OF, Version 2.0.2, April 2010 1335

1
2
3
4
5
6
7
8
9
10
11
12
13
A B C D EDate: Site Name: Investigator:
# Indicator Conditions Data Explanations, Definitions
Does the AA contain, or is it part of, any of these wetland types? Mark "1" next to all that apply. W
Tidal wetland: receives tidal water at least once during a normal year, regardless of salinity, and dominated by emergent or woody vegetation.
0 tidal = level of surface water fluctuates every ~6 hours on a daily basis in response to tides. [All functions, as classifier]
Lacustrine wetland: an undiked non-tidal wetland bordering a body of standing open water that is >20 acres.
0 open water = surface water that contains no vegetation (except perhaps floating-leaved or completely submersed species). [WBN+]
Fringe wetland: an undiked "shoreline" wetland bordering persistent open water that is >3 times wider than the wetland (includes most tidal, lacustrine, large riverine, some others).
0 [WSv-, T-, FA+,FR+, WBF+]
NONE of above 1
F2 Does the AA contain, or is it part of, any of these wetland types? Mark "1" next to all that apply. Consult the "Rare Wetland Type" reported for the general vicinity by the Oregon Explorer web site, but be aware that those may not apply to the exact AA you have delimited.
W
Bog or Fen: contains a sponge-like organic soil layer which covers most of the AA AND often has extensive cover of sedges and/or broad-leaved evergreen shrubs (e.g., Ledum ). Often lacks tributaries, being fed mainly by groundwater and/or direct precipitation.
0 [CS+,Sens+]
Playa, Salt Flat, or Alkaline Lake: a non-tidal ponded water body usually having saline (salinity >1 ppt or conductivity >1000 µS ) or alkaline (conductivity >2000 µS and pH >9) conditions and large seasonal water level fluctuations (if inputs-outputs unregulated). If a playa or salt flat, vegetation cover is sparse and plants typical of saline or alkaline conditions (e.g., Distichlis , Atriplex ) are common.
0 See file ORWAP_SuppInfo, worksheet P_Salt for species typically occurring in tidal or saline conditions. [PR+,CS+,INV+,FA-,FR-,AM-,WBF+]
Hot spring (anywhere in Oregon): a wetland where discharging groundwater in summer is >10 degrees (F) warmer than the expected water temperature.
0 [FA-]
Native wet prairie (west of the Cascade crest): a seasonally inundated wetland, usually without a naturally-occurring inlet or outlet, and dominated primarily by native graminoids often including species in column E.
0 Deschampsia caespitosa, Danthonia californica, Camassia quamash, Triteleia hyacinthina, Carex densa, C. aperta, and/or C. unilateralis [PDv,CQc]
Field F data form. ORWAP version 2.0.2 May 2012. In the Data column, change the 0 (false) to a 1 (true) for the best choice, or for multiple choices where allowed and so indicated. Answer these questions primarily based on your onsite observations and interpretations. Do not write in any shaded parts of this data form. Answering some questions accurately may require conferring with the landowner or other knowledgable persons, and/or reviewing aerial imagery. Although accuracy will be greater if questions are answered for the entire wetland (not limiting only to the part potentially affected by a project), most questions may be answered for just part of a wetland-- the assessment area (AA). HOWEVER, questions with a W in the gray box in column D must be answered for the ENTIRE wetland of which the AA is a part.
F1 Presence of Specific Wetland Types
Wetland Type of Conservation Concern
Form FieldF version 2.0.2 April 2010

14
15
16
17
18
19
20
2122
A B C D EVernal pool (Willamette Valley): a seasonally inundated wetland, underlain by hardpan or claypan, with hummocky micro-relief, usually without a naturally-occurring inlet or outlet, and with native plant species distinctly different from those in slightly higher areas, and often including species in column E.
0 Downingia elegans, Isoetes nuttallii, Triteleia hyacinthina, Eleocharis spp., Eryngium petiolatum, Plagiobothrys figuratus, Plagiobothrys scouleri, Grindelia nana, Veronica peregrina, Lasthenia glaberrima , Cicendia quadrangularis, Kickxia elatine, Gnaphalium palustre, and/or Callitriche spp.[PDv]
Vernal pool (Medford area): a seasonally inundated acidic wetland, underlain by hardpan, with hummocky micro-relief, usually without a naturally-occurring inlet or outlet, and having concentric rings of similar native vegetation, often including species in column E.
0 Downingia vina, Isoetes nuttalli, Pilularia americana, Triteleia hyacinthina, Eleocharis spp., Eryngium petiolatum, Plagiobothrys brachteatus, Plagiobothrys scouleri, Grindelia nana, Veronica peregrina, Alopecurus saccatus, Lasthenia californica, Deschampsia danthonioides, and/or Callitriche spp. [PDv]
Vernal pool (Modoc basalt & Columbia Plateau): a seasonally inundated wetland, usually without a naturally-occurring inlet or outlet, located on shallow basalt bedrock and often having species in column E.
0 Blennosperma nanum, Camassia quamash, Epilobium densiflorum, Callitriche marginata, Cicendia quadrangularis, Eryngium vaseyi, Psilocarphus brevissimus, and/or Sedella pumila. [PDv]
Interdunal wetland (Coastal ecoregion): a seasonally inundated wetland, usually without a naturally-occurring inlet or outlet, located between sand dunes where wind has scoured the sand down to the water table (deflation plain), and often with significant cover of native species in column E.
0 Carex obnupta, Argentina egedii, Juncus lesueurii, J. nevadensis, J. falcatus, Sisyrinchium californicum, and/or Salix hookeriana [PDv]
Mature forested wetland (anywhere): a wetland in which mean diameter of trees (d.b.h., FACW and FAC species only) exceeds 18 inches, and/or the average age of trees exceeds 80 years, or there are >5 trees/acre with diameter >32 inches.
0 To qualify, the diameter of >18 inches must be the mean measured from at least 10 trees. [PDv]
Ultramafic soil wetland (mainly southwestern Oregon): a low-elevation wetland, usually with a sponge-like organic soil layer, occurring in an area with exposed serpentine or peridotite rock, and/or in soils with very low Ca:Mg ratios.
0 [PDv]
Wooded tidal wetlands with >30% cover of trees and shrubs. A wetland inundated at least once annually by tides and often dominated by woody plant species.
0 The plant species may include Sitka spruce, crabapple, and/or others [PDv]
Undiked tidal freshwater wetland: an emergent or wooded wetland inundated at least once annually by tides and with surface salinity <0.5 ppt during most of spring and summer, and which has never been diked.
0 [PDv]
NONE of above 1
Form FieldF version 2.0.2 April 2010

23
242526272829
30
31
32
33
34
3536
37
383940
41
424344454647
A B C D E
The percent of the vegetated part of the AA that is "low marsh" (covered by tidal water for part of almost every day) is:>95% of the AA 050-95% of the AA 025-50% of the AA 01-25% of the AA 0<1% or none of the AA (high marsh only) 0This tidal wetland is (select one): Wcontiguous to a non-tidal palustrine wetland that contains surface water at least seasonally, and mostly not separated by a dike or other barrier, allowing fish access to both wetlands during spring.
0
contiguous to a non-tidal palustrine wetland that contains surface water at least seasonally, but mostly separated by a dike or other barrier, yet still allowing fish access to both wetlands during spring.
0
not contiguous to a non-tidal palustrine wetland that contains surface water, but has an inflowing stream that allows fish during the springtime to access a non-tidal wetland < 1 mile upstream.
0
not contiguous to a non-tidal palustrine wetland that contains surface water, but has an inflowing stream that allows fish during the springtime to access a non-tidal wetland > 1 mile upstream.
0
not contiguous to a non-tidal palustrine wetland, and lacks an inflowing non-tidal stream that provides fish access to an upstream wetland that contains surface water at least seasonally.
0
Select one:during 4 of the last 5 years most of the AA has been covered year-round with surface water, but that part went mostly dry during at least one unusual event.
0
during 4 of the last 5 years most of the AA has been dry year-round on the surface (i.e., saturated only below the surface), but during at least one unusual event most of that part was flooded, even if only briefly.
0
neither of above 1unknown 0
F6 Saturated-only Wetland No part of the AA is ever inundated (contains at least 1 inch of water above the land surface) for more than 14 consecutive days during a normal year. That is, it is a saturated-only wetland. If true, mark "1" here, then SKIP TO F39 (Herbaceous Extent)
0 [classifier for all functions]
During normal years, the percent of the AA that is inundated only seasonally (more than 14 consecutive days but no more than 9 months, or in tidal wetlands is "high marsh" that is inundated by tides fewer than half the days in any month) is:
>75% of the AA 050-75% of the AA 125-50% of the AA 05-25% of the AA 0<5% of the AA, or none 0
F3
F4
F5
F7
Is part of the site tidal? If yes, answer next 2 questions. If no, SKIP TO # F5.
Flood marks (algal mats, adventitious roots, debris lines, ice scour, etc.) are often evident when not fully inundated. Also, such areas often have a larger proportion of upland and annual (vs. perennial) plant species. Vegetation may be patterned in concentric or parallel zones, as one moves outward & away from the deepest part of the wetland or channel. Although useful only as a general guide, the NRCS county soil survey descriptions of the predominant soil types usually includes information on flooding frequency and saturation persistence. [WS+,SR+,NR+,CS+,OE+,INV-,FA+, AM-, Sens+]
Seasonal Water Extent
Interrupted Hydroperiod
Include any natural channels within the marsh that are inundated at least once daily by tide. See file ORWAP_SuppInfo, worksheet P_LowTidal. [WS-,OE+,POL-,INV+,FA+,FR+,WBF+,WBN-,SBM-,PD-]
contiguous= abutting, with no major physical separation that prohibits free exchange or flow of surface water, if any is present. See diagram in Appendix A of the manual. [FA+,WBF+,WBN+,PD+]
[PR-,NR-,CS-,OE+,INV+,FR-,WBF+,WBN+,PD+]
Low Marsh
Tidal-Nontidal Hydroconnectivity
Form FieldF version 2.0.2 April 2010

4849505152
5354
55
56
57
58
59
60
61
62
63
64
65
66
6768
A B C D EWhen the AA’s surface water is at its lowest annual level, the percent of the AA still containing surface water (whether obscured by vegetation or not) is: >95% of the AA 050-95% of the AA 025-50% of the AA 01-25% of the AA 0None of the above, and the AA contains or is part of a fringe wetland, SKIP to F10 0
None of the above, and not a fringe wetland, SKIP to F10 1When the AA’s surface water is at its lowest annual level (for tidal wetlands = annual lowest tide), the percent of the surface water that is in or connected to flowing channels that exit the AA, compared to surface water that is outside of channels and their floodplains (e.g., in small depressions that do not connect annually to the channel if any), is:
all (100%) located in channels, swales, or other areas with a surface water connection to a river, lake, or estuary at all times of year
0
75-99% in or connected to channels, swales, or contiguous lake/ estuary, 1-25% in isolated pools 0
50-75% in or connected to channels, swales, or other areas with a surface water connection to a river, lake, or estuary at all times of year, 25-50% in isolated pools
0
25-50% in or connected to channels, swales, or other areas with a surface water connection to a river, lake, or estuary at all times of year, 50-75% in isolated pools
0
1-25% in or connected to channels, swales, or other areas with a surface water connection to a river, lake, or estuary at all times of year, 75-99% in isolated pools
0
all located in isolated pools or a single isolated pond from which no surface water exits when levels are lowest
0
During the wettest time of a normal year , the percent of the surface water that is in or connected to ditches, swales, or flowing channels that exit the AA, compared to surface water that is in isolated pools that do not connect annually to channels or swales (if any), is:
all (100%) located in channels, swales, or in other areas with a wet-season surface connection to channels or to a contiguous lake or estuary
0
75-99% in or connected to channels, swales, or contiguous lake/ estuary, 1-25% in isolated pools 0
50-75% in or connected to channels, swales, or contiguous lake/ estuary, 25-50% in isolated pools 0
25-50% in or connected to channels, swales, or contiguous lake/ estuary, 50-75% in isolated pools 0
1-25% in or connected to channels, swales, or contiguous lake/ estuary, 75-99% in isolated pools 0
all located in isolated pools or a single isolated pond from which no surface water exits 1
F9
F10
F8
For tidal sites, consider the condition at annual lowest tide. See DSL web site for general maps of waters that may be tidal. Swales and channels are areas that have surface flow for at least 2 consecutive days per year. Swales are less distinct (broader and flatter in cross-section) than channels. [WS+, SR+,PR+,NR+,OE-,T-, INV+,FA-,FR+,AM+,WBF+,WBN+,Sens+]
For tidal sites, consider the condition that would exist at annual lowest tide. Indicators of persistence may include fish, some dragonflies, beaver, and muskrat. In the county soil survey, the NRCS descriptions of the predominant soil types may include information on saturation persistence in those types. [WS-,PR-,NR-,CS-,POL-,INV+,FR+,AM+,WBF+,WBN+,SB-]
For tidal sites, consider the condition at mean high tide. See DSL web site for general maps of waters that may be tidal. Swales and channels are areas that have surface flow for at least 2 consecutive days per year. Swales are less distinct (broader and flatter in cross-section) than channels. Sites fed by unregulated streams that descend on north-facing slopes tend to remain wet longer into the summer, especially in montane snow-fed areas.[WS+, SR+,PR+,NR+,CS+,OE-,INV+,FA-,FR+,AM+,WBF+]
Extent of Persistent Surface Water (Dry Season)
Onsite Surface Water Isolation (Dry Season)
Onsite Surface Water Isolation (Wet Season)
Form FieldF version 2.0.2 April 2010
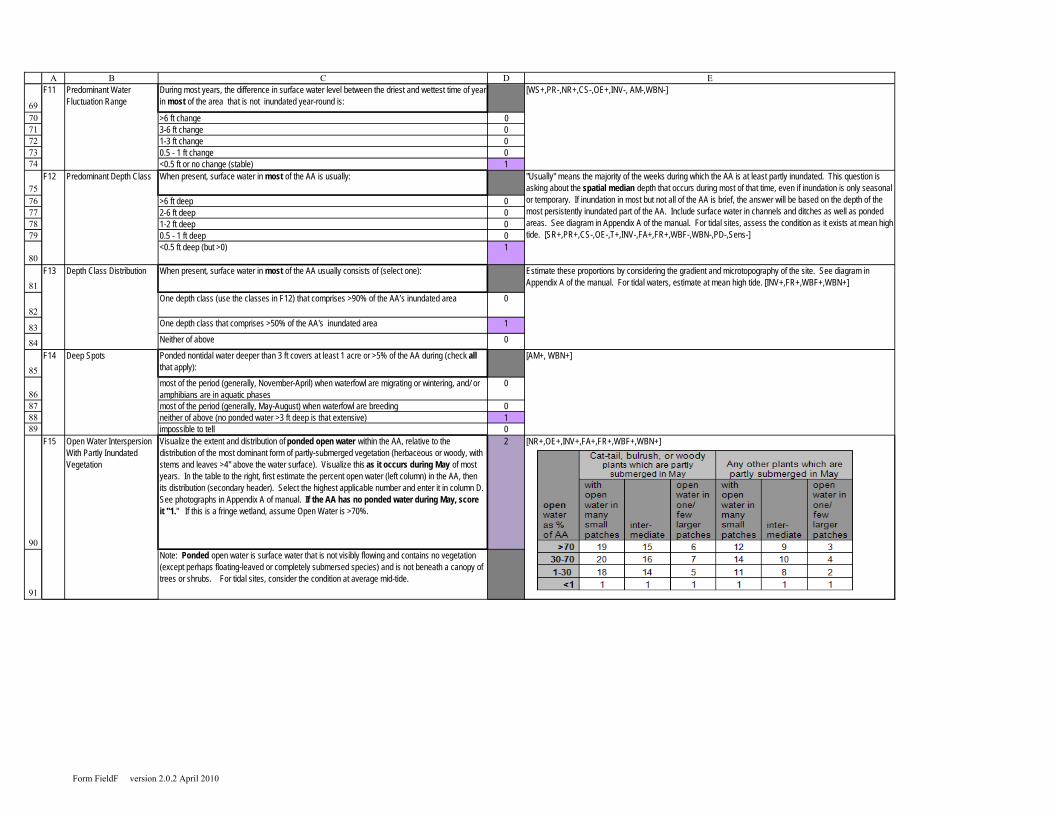
697071727374
7576777879
80
81
82
83
84
85
86878889
90
91
A B C D EF11 During most years, the difference in surface water level between the driest and wettest time of year
in most of the area that is not inundated year-round is:
>6 ft change 03-6 ft change 01-3 ft change 00.5 - 1 ft change 0<0.5 ft or no change (stable) 1
F12 When present, surface water in most of the AA is usually:
>6 ft deep 02-6 ft deep 01-2 ft deep 00.5 - 1 ft deep 0<0.5 ft deep (but >0) 1
F13 When present, surface water in most of the AA usually consists of (select one):
One depth class (use the classes in F12) that comprises >90% of the AA’s inundated area 0
One depth class that comprises >50% of the AA's inundated area 1
Neither of above 0
F14 Ponded nontidal water deeper than 3 ft covers at least 1 acre or >5% of the AA during (check all that apply):
most of the period (generally, November-April) when waterfowl are migrating or wintering, and/ or amphibians are in aquatic phases
0
most of the period (generally, May-August) when waterfowl are breeding 0neither of above (no ponded water >3 ft deep is that extensive) 1impossible to tell 0Visualize the extent and distribution of ponded open water within the AA, relative to the distribution of the most dominant form of partly-submerged vegetation (herbaceous or woody, with stems and leaves >4" above the water surface). Visualize this as it occurs during May of most years. In the table to the right, first estimate the percent open water (left column) in the AA, then its distribution (secondary header). Select the highest applicable number and enter it in column D. See photographs in Appendix A of manual. If the AA has no ponded water during May, score it "1." If this is a fringe wetland, assume Open Water is >70%.
2
Note: Ponded open water is surface water that is not visibly flowing and contains no vegetation (except perhaps floating-leaved or completely submersed species) and is not beneath a canopy of trees or shrubs. For tidal sites, consider the condition at average mid-tide.
F15
[WS+,PR-,NR+,CS-,OE+,INV-, AM-,WBN-]
"Usually" means the majority of the weeks during which the AA is at least partly inundated. This question is asking about the spatial median depth that occurs during most of that time, even if inundation is only seasonal or temporary. If inundation in most but not all of the AA is brief, the answer will be based on the depth of the most persistently inundated part of the AA. Include surface water in channels and ditches as well as ponded areas. See diagram in Appendix A of the manual. For tidal sites, assess the condition as it exists at mean high tide. [SR+,PR+,CS-,OE-,T+,INV-,FA+,FR+,WBF-,WBN-,PD-,Sens-]
[NR+,OE+,INV+,FA+,FR+,WBF+,WBN+]
Estimate these proportions by considering the gradient and microtopography of the site. See diagram in Appendix A of the manual. For tidal waters, estimate at mean high tide. [INV+,FR+,WBF+,WBN+]
[AM+, WBN+]
Open Water Interspersion With Partly Inundated Vegetation
Depth Class Distribution
Deep Spots
Predominant Depth Class
Predominant Water Fluctuation Range
Form FieldF version 2.0.2 April 2010

9293
94
9596
97
98
99
100101
102103104105
106
107
108109
110
111
A B C D EF16 When surface water enters the AA, it enters as (select all applicable choices):
flow moving in streams, ditches, other channels 0surface water exchanged broadly as overflow with contiguous waters such as an estuary, lake, or river
0
water pumped into or intentionally diverted to the AA, e.g., as part of a stormwater dispersion system, irrigation practice, or drainage tile outlet
0
groundwater, runoff, and direct precipitation 1F17 Select one: W
Part of the wetland contains strong evidence of groundwater discharges at the wetland surface during summer: (a) Springs are observed or are shown on Wetland Explorer map, or (b) water is cooler in summer and warmer in winter than in other local wetlands, or (c) measurements from shallow wells indicate groundwater is discharging to the wetland.
0
Part of the wetland has less definitive evidence of discharging groundwater during summer. Wetland has no perennial tributary and is on organic, sandy, or gravelly soil (as determined in F58) AND has one or more: (a) outflow is present and persists during most of the summer or (b) on a natural slope of >5%, or (c) very close to the base of a natural slope steeper than 15%, and longer than 300 ft, or (d) located at a geologic fault, or (e) has rust deposits, colored precipitates, or dispersible natural oil sheen, or (f) within a mile of the top of a HUC4 watershed (see Wetland Explorer for boundaries).
0
Neither of above is true, although some groundwater may discharge to or flow through the wetland, and wetland is in a region of eastern Oregon with mean annual precipitation of less than 20 inches.
0
None of the above 1F18 The most durable surface water connection between the wetland and the closest contiguous
and/or downslope surface waters is:W
persistent (>9 months/yr), or daily tidal exchange 0seasonal (14 days to 9 months/yr, not necessarily consecutive) 0temporary (<14 days, not necessarily consecutive) 0none -- the wetland lacks an outlet. If so, mark "1" here and SKIP TO F25 (Sheltering of Water). 1
F19 During major runoff events, in the places where surface water exits the wetland it is: W
impeded by a pipe, culvert, tidegate, narrowly breached dike, berm, beaver dam, or other obstruction (other than natural topography), or water is pumped out of the wetland (e.g., for irrigation)
0
not impeded by anything other than (possibly) natural topography 00
W
Either the wetland has BOTH an inlet and outlet with seasonal or persistent surface flow, or the wetland is fringe or tidal. If so, enter "1" here and continue. If neither condition met, enter "0" here and then SKIP to F25 (Sheltering of Water).
F20
[HGM, Sens]
"Impeded" means causing a delay or reduction in water velocity or volume. "Major runoff events" would include biennial high water causes by storms and/or rapid snowmelt. [WS-,SR+,PR+,NR+,CS-,OE+,FA+,FR+,Sens-]
If discharging groundwater in summer is warmer than ambient air temperature, answer "None of the above." [NR+,CS+,T+,POL+,INV+,FA+,AM+,HGM]
The connection may be via a ditch, pipe, tidegate, or culvert as well as through a natural channel, floodplain, or overflow area. Do not rely only on topographic or NWI maps to show this; inspect while in field. The frequencies given are only approximate and are for a "normal" year. The inundation need not occur during the "growing season." See photographs in Appendix A of manual. [WS-,SR+,PR+,NR+,CS-,OE+,T+,FA+,FR+,Sens-]
The inflow and outflow from the wetland may be via a shallow ditch, pipe, or culvert, or as overbank flow in a floodplain (which counts as both an inlet and outlet). Do not rely only on topographic or NWI maps to show this; inspect while visiting the site.
Outflow Confinement
Inflow
Outflow Duration
Inlet+Outlet
Groundwater
Form FieldF version 2.0.2 April 2010

112
113
114
115
116
117
118
119
120
121122123124125126
127128129130131132133
134135136137138139140
A B C D EDuring peak annual flow, most of the surface water that flows through the AA:
encounters little or no vegetation, boulders, or other sources of friction, or no flowing water is present
0
mostly encounters herbaceous vegetation that offers little resistance, and water follows a fairly straight path from entrance to exit (few internal channels, only slight meandering)
0
mostly encounters herbaceous vegetation that offers little resistance and follows a fairly indirect path from entrance to exit (non-channelized flow or many internal channels, or very braided or tightly meandering)
0
encounters measurable resistance from fairly-rigid vegetation (e.g., cattail, bulrush, woody plants) or channel-clogging debris, and follows a fairly straight path from entrance to exit.
0
encounters measurable resistance from fairly-rigid vegetation (e.g., cattail, bulrush, woody species) or channel-clogging debris, and follows a fairly indirect path from entrance to exit.
0
F22 During most of the time open water is present in the AA, vegetated areas within the AA, where they are contiguous to open water, are:wider than the contiguous open water 0
narrower than the contiguous open water (i.e., fringe wetlands) 0
F23 The average width of vegetated area in the AA that separates adjoining uplands (if any) from contiguous open waters (if any) is:
>300 ft, or no contiguous upland or open waters (not even temporary) 0100-300 ft 025-100 ft 05-25 ft 0<5 ft 0
F24 The percent of the AA's water edge, if any, that has undercut banks that are partially visible above the water is:>75% 050-75% 025-50% 01-25% 0<1%, or no definable water edge is present 0cannot estimate 0
F25 At mid-day in summer, the area of surface water within the AA that is shaded by herbaceous or woody vegetation, incised channels, streambanks, or other features also present within the AA is:
>75% of the water 050-75% of the water 025-50% of the water 05-25% of the water 0<5% of the water 0(surface water is typically absent in summer or during low tide) 1
F21 This mainly refers to surface water that moves between the inlet and outlet. Some judgment is required in assessing straight vs. indirect flow path. See diagram in Appendix A of the manual. [WS+,SR+,PR+,NR+,CS+,INV+,FA+,FR+,WBF+,WBN+]
open water = surface water that contains no vegetation (except perhaps floating-leaved or completely submersed species) when viewed from above. May include channels, ditches, ponded areas, regardless if seasonal, persistent, or temporary. For tidal areas, assess condition as it exists at mean high tide [SRv+,PRv+,NRv+, CS+,OE-,Sens-]
Note: For most sites larger than 10 acres and with persistent water, measure the width using aerial imagery rather than estimate in the field. For tidal areas, assess condition as it exists at mean high tide. [SR+,PR+,NR+, CS+,OE-,WBN+,Sens-]
Undercut Banks water edge= streambank (both sides) or other edge between open water and soil. undercut= indented such that surface water flows beneath a canopy layer of soil, tree roots, or sod. At tidal sites, assess this at mid-tide. [FA+,FR+,AM+]
Vegetated Zone Relative Width
For tidal sites, consider the condition at mean low tide. For all sites, consider the aspect and surrounding topographic relief as well as vegetation height and density. [T+,FA+]
Vegetated Zone Absolute Width
Throughflow Complexity
Sheltering of Water
Form FieldF version 2.0.2 April 2010

141142143
144
145
146147
148
149150151152153154
155
156
157158
159
160
161
162163
A B C D EF26 The number of downed wood pieces thicker than 4 inches that remain only partly underwater
during most of the spring or early summer, thus potentially serving as basking sites for turtles, birds, or frogs, is:Several 0Few or none, or AA never has any surface water at that time 1
F27 Select all that apply: WDuring early summer the wetland contains a floating vegetation mat suitable for nesting birds and isolated from the shore by water depths >3 ft. Or AA is an island with similar isolation and a gently-sloping water edge that is mostly vegetated.
0
During early summer the wetland contains (or is) an island with a gently-sloping water edge, that is mostly bare and is isolated from the shore by water depths >3 ft.
0
Neither of above 1F28 The maximum extent of mudflats or unwooded shortgrass areas within the AA during shorebird
migration and wintering (generally August through through April (and for tidal AAs, during mean low tide) is usually:
none, or <100 sq. ft, and there are none that cover >10,000 sq. ft anywhere within 300 ft of the AA 1
none, or <100 sq. ft, but some that cover >10,000 are within 300 ft of the AA 0100-1000 sq. ft. within AA 01000 – 10,000 sq. ft. within AA 0>10,000 sq. ft within AA 0
F29 Which of the following is most true:Wind or boats frequently generate waves of >1 ft near the AA, those waves are intercepted by the wetland, and structures behind the AA are protected from wave erosion
0
Wind or boats frequently generate waves of >1 ft near the AA, those waves are intercepted by the wetland, but there are no structures behind the wetland
0
Neither wind nor boats frequently generate waves of >1 ft near the AA 1
Select all that apply:a regularly-used boat dock is present within or contiguous to the AA 0
a regularly-used boat dock is not within the AA, but there is one within 300 ft of the AA and there is a persistent or tidal surface connection between the dock and the AA
0
large ships that empty ballast water are regularly present in nearby contiguous waters 0
the AA has a persistent or tidal surface water connection (>9 mos./yr, via ditch, pipe, channel, tidegate, or floodplain) to a nearby perennial stream, river, lake, or estuary
0
none of the above 1
These areas must have (a) no vegetation (bare/ fallow), or herbaceous cover comprised mainly of grasses shorter than 4 inches during some part of this period, and (b) soils are saturated or are covered with <1" of water during some part of this period, and (c) no detectable surrounding slope (e.g., not the bottom of an incised dry channel), and (d) no substantial areas of shrubs or trees. See photograph in Appendix A of manual.This addresses needs of most migratory sandpipers, plovers, stilts, avocets, curlews, and godwits. [WBF+]
Erosive wave conditions often occur where adjoining open water has a fetch (uninterrupted distance) of greater than approximately 1 mile in the direction of the strongest and most frequent wind. [SRv+, PD-, STR+]
island = terrestrial or wetland area larger than 400 sq.ft, and smaller than 1 sq. mi, and separated from "mainland" by water deeper than 3 ft over a distance of >50 ft during early summer. [AM+,WBF+,WBN+]
[SRv+, FA-,FR-,AM-,PD-,STR+]F30
For tidal sites, consider the condition at mean high tide. Only the wood that is at or above the water surface is assessed because of the impracticality of assessing underwater wood accurately when using a rapid assessment method. [FA+,FR+,AM+,WBF+,SBM+]
Abovewater Wood
Islands
Vectors for Waterborne Pests
Waves
Shorebird Feeding Habitats
Form FieldF version 2.0.2 April 2010
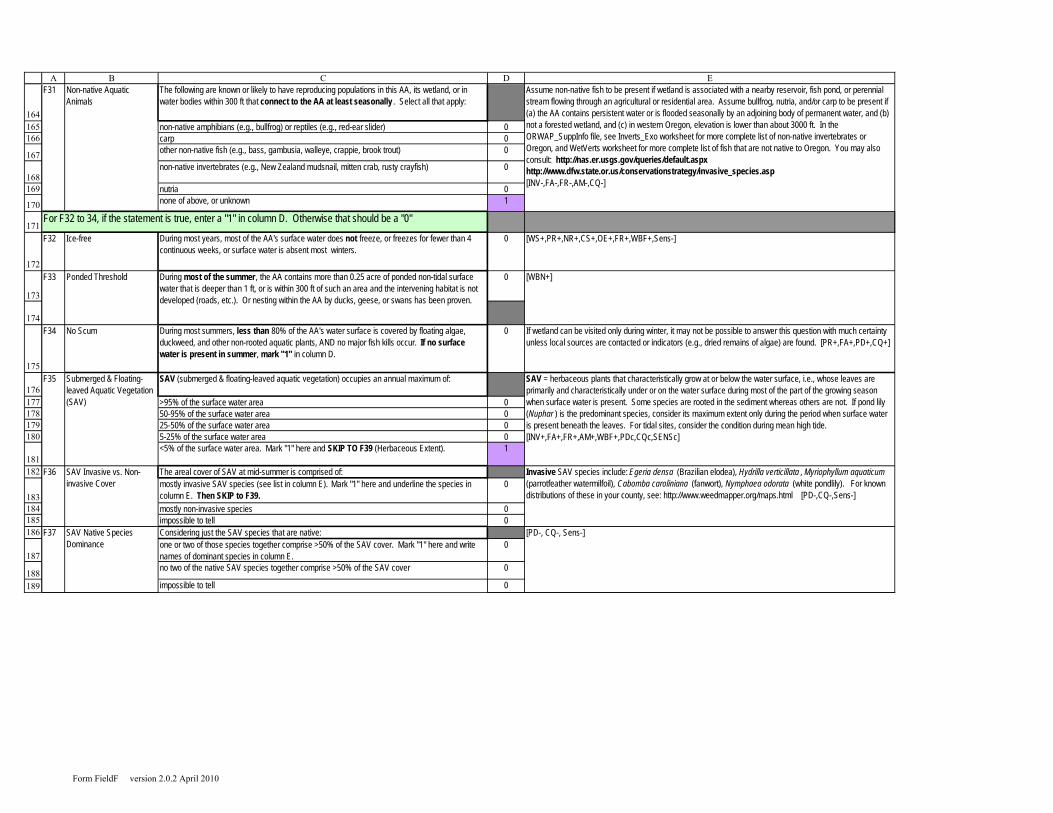
164165166
167
168169
170
171
172
173
174
175
176177178179180
181182
183184185186
187
188189
A B C D EThe following are known or likely to have reproducing populations in this AA, its wetland, or in water bodies within 300 ft that connect to the AA at least seasonally . Select all that apply:
non-native amphibians (e.g., bullfrog) or reptiles (e.g., red-ear slider) 0carp 0other non-native fish (e.g., bass, gambusia, walleye, crappie, brook trout) 0
non-native invertebrates (e.g., New Zealand mudsnail, mitten crab, rusty crayfish) 0
nutria 0none of above, or unknown 1
F32 Ice-free During most years, most of the AA's surface water does not freeze, or freezes for fewer than 4 continuous weeks, or surface water is absent most winters.
0 [WS+,PR+,NR+,CS+,OE+,FR+,WBF+,Sens-]
0
F34 No Scum During most summers, less than 80% of the AA's water surface is covered by floating algae, duckweed, and other non-rooted aquatic plants, AND no major fish kills occur. If no surface water is present in summer, mark "1" in column D.
0 If wetland can be visited only during winter, it may not be possible to answer this question with much certainty unless local sources are contacted or indicators (e.g., dried remains of algae) are found. [PR+,FA+,PD+,CQ+]
SAV (submerged & floating-leaved aquatic vegetation) occupies an annual maximum of:
>95% of the surface water area 050-95% of the surface water area 025-50% of the surface water area 05-25% of the surface water area 0<5% of the surface water area. Mark "1" here and SKIP TO F39 (Herbaceous Extent). 1
F36 The areal cover of SAV at mid-summer is comprised of:mostly invasive SAV species (see list in column E). Mark "1" here and underline the species in column E. Then SKIP to F39.
0
mostly non-invasive species 0impossible to tell 0
F37 Considering just the SAV species that are native:one or two of those species together comprise >50% of the SAV cover. Mark "1" here and write names of dominant species in column E.
0
no two of the native SAV species together comprise >50% of the SAV cover 0
impossible to tell 0
[WBN+]
F31
Invasive SAV species include: Egeria densa (Brazilian elodea), Hydrilla verticillata , Myriophyllum aquaticum (parrotfeather watermilfoil), Cabomba caroliniana (fanwort), Nymphaea odorata (white pondlily). For known distributions of these in your county, see: http://www.weedmapper.org/maps.html [PD-,CQ-,Sens-]
Assume non-native fish to be present if wetland is associated with a nearby reservoir, fish pond, or perennial stream flowing through an agricultural or residential area. Assume bullfrog, nutria, and/or carp to be present if (a) the AA contains persistent water or is flooded seasonally by an adjoining body of permanent water, and (b) not a forested wetland, and (c) in western Oregon, elevation is lower than about 3000 ft. In the ORWAP_SuppInfo file, see Inverts_Exo worksheet for more complete list of non-native invertebrates or Oregon, and WetVerts worksheet for more complete list of fish that are not native to Oregon. You may also consult: http://nas.er.usgs.gov/queries/default.aspx http://www.dfw.state.or.us/conservationstrategy/invasive_species.asp [INV-,FA-,FR-,AM-,CQ-]
F35
Non-native Aquatic Animals
Ponded ThresholdF33
[PD-, CQ-, Sens-]
During most of the summer , the AA contains more than 0.25 acre of ponded non-tidal surface water that is deeper than 1 ft, or is within 300 ft of such an area and the intervening habitat is not developed (roads, etc.). Or nesting within the AA by ducks, geese, or swans has been proven.
SAV = herbaceous plants that characteristically grow at or below the water surface, i.e., whose leaves are primarily and characteristically under or on the water surface during most of the part of the growing season when surface water is present. Some species are rooted in the sediment whereas others are not. If pond lily (Nuphar ) is the predominant species, consider its maximum extent only during the period when surface water is present beneath the leaves. For tidal sites, consider the condition during mean high tide. [INV+,FA+,FR+,AM+,WBF+,PDc,CQc,SENSc]
SAV Invasive vs. Non-invasive Cover
For F32 to 34, if the statement is true, enter a "1" in column D. Otherwise that should be a "0"
SAV Native Species Dominance
Submerged & Floating-leaved Aquatic Vegetation (SAV)
Form FieldF version 2.0.2 April 2010

190
191
192193
194
195196197198199
200
201202203204205
206
207
208
209210211
212
213
214215216
217
A B C D EOf all the SAV species in this AA:all are species that are common among Oregon's wetlands and lakes. 0at least one native species is a SAV plant that is not common among Oregon's wetlands and lakes, and it covers >1% of the SAV area or >100 sq. ft. See file ORWAP_SuppInfo, worksheet P_UnCom. Mark "1" in next column and write names of the species in column E.
0
impossible to tell 0
F39 The areal cover of herbaceous plants during mid-summer is:
>95% of the vegetated part of the AA 050-95% of the vegetated part of the AA 125-50% of the vegetated part of the AA 05-25% of the vegetated part of the AA 0<5% of the vegetated part of the AA. Mark "1" here and SKIP TO F44 (Woody Extent). 0
F40 When the areal cover of herbaceous plants is at an annual maximum, those plants are:
overwhelmingly graminoids (>80% cover of grasslike plants) 1mostly graminoids (50-80% cover) 0mostly non-graminoids (e.g., forbs, ferns) (50-80%) 0overwhelmingly (>80%) non-graminoids 0
F41 The maximum annual areal cover of herbaceous plants is:
overwhelmingly (>80% cover) non-native species, of which >10% are species considered invasive (see column E). Mark "1" in next column and write names of dominant invasive species in column E. Then SKIP to F43.
0
overwhelmingly (>80% cover) non-native species, but <10% are considered invasive (see column E). Mark "1" in next column and write names of dominant non-native species in column E. Then SKIP to F43.
1
mostly (50-80%) non-native species, regardless of invasiveness. Mark "1" and SKIP to F43. 0
mostly (50-80%) native species 0overwhelmingly (>80%) native species 0
F42 Of just the herbaceous (forb and graminoid) species that are native:one or two native species together comprise >50% of the areal cover of native herbaceous plants at any time during the year. Mark "1" in next column and write names of dominant native species in column E.
1
no two of the native species together comprise >50% of the areal cover of native herbaceous plants
0
F43 Of all the herbaceous species in this AA:all are species that are common among Oregon's wetlands. 1at least one native species is not common among Oregon's wetlands and it covers >1% of the AA's herbaceous area or >100 sq. ft (either contiguous or scattered). See file ORWAP_SuppInfo, worksheet P_UnCom. Mark "1" in next column and write names of the species in column E.
0
herbaceous = forbs, graminoids, ferns, liverworts, moss. Can include crops. Do not include submersed and floating-leaved aquatics (SAV) in the category of "herbaceous", or when defining the "vegetated part" of the site. Note: For sites larger than 10 acres, this should be determined from aerial imagery rather than estimated in the field. [POLc,INV+,WBF+,WBN+,PDc, CQc,SENSc]
This question and several others (F37, 38, 42, 48, 49) are used as "placeholders" until a Floristic Quality Assessment index can be developed for Oregon. Much information on distribution and frequencies of plant species is available from the Oregon Flora Project: www.oregonflora.org/ [POL-,PD-,CQ-,Sens-]
graminoids= grasses, sedges, rushes, reeds, burreed, cat-tail, and other grasslike plants . Remember to focus only on plants not beneath a woody canopy, unless that canopy occupies >80% of the AA. If possible this should be assessed during mid-summer. [POLL-]
In the file ORWAP_SuppInfo, see P_Invas worksheet for list of invasives and P_Exo for non-native species list. For known distributions of invasive plants in your county, see: http://www.weedmapper.org/maps.html Remember to focus only on plants not beneath a woody canopy. [POL-,PD-,CQ-,Sens-]
Remember to focus only on plants not beneath a woody canopy. [POL-,PD-,CQ-,Sens-]
[PD-, CQ-, Sens-]F38
Note: In the next 4 questions, "herbaceous" does not include SAV or herbaceous plants growing under a woody canopy, unless that canopy covers >80% of the vegetated part of the AA. If the AA is farmed, estimate herbaceous cover (including crops) as it would exist under maximum cover conditions during the majority of the last 5 years.
Herbaceous Native vs. Non-native Cover
Herbaceous Plant Species Ubiquity
SAV Species Ubiquity
Herbaceous Extent
Graminoid vs. Forb Cover
Herbaceous Species Dominance
Form FieldF version 2.0.2 April 2010

218219220221222223
224
225226227228
229
230
231
232
233234
235
236
237238239240
241
242243244
245
A B C D EF44 Within the AA, woody vegetation (shrubs, trees, woody vines) occupies:
>95% of the vegetated part of the AA 050-95% of the vegetated AA 025-50% of the vegetated AA 05-25% of the vegetated AA 0<5% of the vegetated AA 1
F45 Where surface water is present during the wettest time of year , the AA's woody vegetation occupies:>95% of the area within 100 ft of the surface water 0
50-95% of the area within 100 ft of surface water 025-50% of the area within 100 ft of surface water 05-25% of the area within 100 ft of surface water 0<5% of the area within 100 ft of surface water; mark "1" here. If F44 is also <5%, then SKIP TO F50 (Woody Diameter Classes).
1
F46 The woody vegetation (if any) within the AA is:
clumped in fairly distinct bands or patches mostly separate from herbaceous vegetation, and most patches or bands are large (>1 acre including contiguous upland woody veg). Or nearly the entire AA is wooded. Isolated shrubs or trees are few.
0
clumped in fairly distinct bands or patches mostly separate from herbaceous vegetation, and most patches are small (<1 acre including contiguous upland woody veg).
0
dispersed quite evenly amid the herbaceous vegetation, in many small patches, or many isolated shrubs or trees.
0
F47 Within parts of the AA having shrubs or woody vines, the areal cover is: overwhelmingly (>80%) non-natives that are categorized as invasive (see column E). Mark "1" in next column and write names of dominant invasives in column E. Then SKIP to F49.
0
overwhelmingly other non-natives. Mark "1" in next column and write names of dominant non-native shrubs/ vines in column E. Then SKIP to F49.
0
mostly (50-80%) non-natives. Mark "1" in next column and write names of dominant non-native shrubs/ vines in column E. Then SKIP to F49.
0
mostly (50-80%) natives 0overwhelmingly (>80%) natives 0
F48 Of just the shrub & woody vine species that are native:one or two of the native species together comprise >80% of the native shrub & vine cover. Mark "1" in next column and write names of dominant species in column E.
0
no two of the native species together comprise >80% of the native shrub & vine cover 0
F49 Of all the shrub & woody vine species in this AA:all are species that are common among Oregon's wetlands. 0at least one native species is not common among Oregon's wetlands and it covers >1% of the AA or >100 sq. ft See file ORWAP_SuppInfo, worksheet P_UnCom. Mark "1" in next column and write species in column E.
0
[POL-,PD-,CQ-,Sens-]
[SBM+]
"contiguous to" means separated by less than one tree height. The separation may be caused by herbaceous vegetation, persistent water, roads, buildings, or bare soil, but not shrubs. [SBM+, CQ+, Sens+]
In the file ORWAP_SuppInfo, see P_Invas worksheet for list of invasives and P_Exo for non-native species list. Woody invasives include: Hedera helix, Ailanthus altissima, Buddleja spp., Cytisus spp., Rubus armeniacus (discolor), Rubus laciniatus, Tamarix spp., Umbellularia californica, Robinia pseudoacacia. For known distribution of some invasives in your county see: http://www.weedmapper.org/maps.html [POL-,PD-,CQ-,Sens-]
[POL-,PD-,CQ-,Sens-]
Note: For sites larger than 10 acres, this should be determined from aerial imagery rather than estimated only in the field. Vines are twining or climbing plants with relatively long stems, and can be either woody or herbaceous. Include Himalayan blackberry. [CS+,POLc,SBM+,PDc,CQc,SENSc]
Woody Extent Along Water Edge
Cover of Woody Invasives
Woody Distribution
Woody Extent Within the AA
Shrub & Vine Species Dominance
Shrub & Vine Species Ubiquity
Form FieldF version 2.0.2 April 2010

246247248249250251252253254255256257
258
259260261262263264
265
266
267268269270
271272273274275276
277278279
A B C D EF50 Select all the types occupying >5% of the wooded part of the AA or >5% of its wooded upland
edge if any. deciduous 1-4" diameter and >3 ft tall 0evergreen 1-4" diameter and >3 ft tall 0deciduous 4-9" diameter 0evergreen 4-9" diameter 0dead standing 4-9" diameter 0deciduous 9-21" diameter 0evergreen 9-21" diameter 0dead standing 9-21" diameter 0deciduous >21" diameter 0evergreen >21" diameter 0dead standing >21" diameter 0Lacks woody vegetation, or none of above occupy >5% of the wooded part of the AA or 5% of the length of the upland edge.
1
F51 Within the vegetated part of the AA, the cover of nitrogen-fixing plants (e.g., alder, sweetgale, legumes) is:<1% or none 11-25% 025-50% 050-75% 0>75% 0
F52 The percent of the vegetated part of the AA, excluding areas that are never inundated , which contains one or more of these plants: Alisma spp., Beckmannia spp., Polygonum spp. (natives only), Potomogeton (Stuckenia) spp., Ruppia spp., Sagittaria spp., Sparganium spp., Zostera spp., is:
<1% or none, and none are known to occur commonly within the same wetland or within 300 ft of this AA
1
<1% or none, but some are known to occur commonly within the same wetland or within 300 ft of this AA
0
1-10% 010-50% 0>50% 0
F53 The last time that >5% of the AA's vegetation cover was burned or harvested for hay or timber was:0-12 months ago, and this occurs almost annually within part of the AA 00-12 months ago, but was not an annual (or near-annual) event 01-5 years ago 0>5 years ago, or never 0unknown 1
F54 Within the stratum (herbaceous, shrub, or tree) that covers the most onsite area, the wetland plants during maximum annual cover condition are mostly:
of nearly uniform height (+ or - 20% of average) 1of very diverse heights (e.g., short & tall forbs, short & mid-height grasses) 0
For a more complete list see file ORWAP_SuppInfo, worksheet NFIX. Do not include algae.
[WBF+,WBN+]
[PR-,NR-,CS-,OE+,POL-,WBF+,PD+]
e.g., If dominantly herbaceous, then "diverse heights" might include both short and tall forbs, some non-woody vines, and mid-height graminoids. See photograph of a vertically diverse herbaceous stratum in Appendix A of manual. [POL+,INV+,WBN+,SBM+, PD+]
wooded upland edge= where woody plants are located within one tree-height of the wetland-upland boundary. Measurements are the d.b.h., which is the tree diameter at 4.5 ft above the ground. If visited only in winter, consider "dead standing trees" to be those that are mainly without bark. Include woody vines such as Himalayan blackberry. [CS+,POL+,INV+,AM+,WBN+,SBM+,Sens+]
Woody Diameter Classes
Waterfowl Food Plants
N Fixers
History of Fire or Vegetation Removal
Height Uniformity of Dominant Stratum
Form FieldF version 2.0.2 April 2010

280
281
282
283
284
285
286
287
288
289290291
292
293
294
295
296
297298299
300301
302303
A B C D EF55 Consider the parts of the AA that usually are not inundated in May, or are inundated by tides at
least once annually. Viewed from 6 inches above the soil surface , the condition in most of this area during May is:little or no (<5%) bare ground or plant litter (thatch) is visible between erect stems or under canopy. This can occur if ground surface is extensively blanketed by moss, graminoids with great stem densities, or plants with ground-hugging foliage.
0
some (5-20%) bare ground or litter is visible. Herbaceous plants have moderate stem densities and do not closely hug the ground.
1
much (20-50%) bare ground or plant litter is visible. Low stem density and/or tall plants with little near-ground foliage. May be mostly woody plants, woody vines, cattail, bulrush, sparse annuals.
0
mostly (>50%) bare ground or accumulated plant litter. Or, during May the entire AA is constantly under water.
0
F56 Most of the edge between the wetland and upland is (select one): W
Linear: a significant proportion of the wetland's upland edge is straight, as in wetlands bounded by partly or wholly by dikes or roads
0
Convoluted: Wetland perimeter is many times longer than maximum width of the wetland, with many alcoves and indentations ("fingers")
0
Intermediate: Wetland's perimeter either (a) is only mildly convoluted, or (b) mixed -- contains about lengths of linear and convoluted segments.
1
F57 The extent of inclusions of upland within the AA (as indicated by their topography, plants, and/or soils) is:Many (e.g., wetland-upland "mosaic") 0Few or none 1
F58 The composition of the soil in the soil pit at the ground surface (uppermost soil layer and excluding the duff layer, see protocol in ORWAP Manual, section 2.3.2 ) is:
duff layer= leaves, woody material, and live or dead roots, moss that has undergone partial decomposition. [PR,NR,CS,OE, PD, Sen]
Loamy : includes silt, silt loam, loam, sandy loam 0
Clayey : includes clay, clay loam, silty clay, silty clay loam, sandy clay, sandy clay loam 1
Organic : includes muck, mucky peat, peat, and mucky mineral 0
Coarse : includes sand, loamy sand, gravel, cobble, stones, boulders, fluvents, fluvaquents, riverwash
0
F59 The number of downed wood pieces longer than 6 ft and with diameter >6", and not persistently submerged, is:Several ( >5 if AA is >10 acres, or >2 for smaller AAs) 0Few or none 1
F60 The number of animal burrows, mounds, hummocks, boulders, upturned trees, islands, natural levees, dry channels, pits, wide soil cracks, and microdepressions (in parts of the AA that lack persistent water) is:Several (extensive micro-topography) 0Few or none (minimal microtopography; <1% of the area that isn't persistently inundated); e.g., many flat sites having a single hydroperiod
1
Intermediate 0
include driftwood. [POL+,INV+,AM+,SBM+]
"microtopography" refers mainly to vertical relief of <1 m and is represented only by inorganic features, except where plants have created depressions or mounds of soil. See photographs in Appendix A of manual for examples. [WS+,SR+,PR+,NR+,CS+,POL+,INV+,AM+,SBM+,PD+]
See illustrations in Appendix A of the ORWAP manual . [NR+,SBM+]
[NR+,AM+,SBM+]
Estimates of "plant litter" cover should include only the litter and woody debris that would be visible from a height of 6 inches above the soil surface. Emphasis should be on plant litter that has remained from prior years ("thatch"), not recent. Erect plant stems should not be counted as plant litter, even if dead. "Bare ground" that is present under a tree or shrub canopy should be counted. It includes unvegetated soil, rock, sand, or mud between stems if any. See photographs in Appendix A of manual for examples. Wetlands that are dominated by annual plant species tend to have more extensive areas that are bare or covered only by plant litter, during minimum annual cover conditions. [SR-,PR-,NR-,CS-,OE-,POL-,INV-.AM-,SBM-,Sens+]
Ground Irregularity
Bare Ground & Accumulated Plant Litter
Downed Wood
Soil Composition in the Soil Pit
Upland Edge Shape Complexity
Upland Inclusions
Form FieldF version 2.0.2 April 2010

304305306307
308
309
310
311
312313314315316317318319320321322
323324325
326
327
328
329
330331
A B C D EF61 The gradient along most of the AA's water flow paths (both sheet and channel flow) is:
>10% 06-10% 02-5% 0Flat (<2%, no slope or flow is ever apparent, or AA is an estuarine fringe wetland). Includes most depressional sites
1
F62 Fish Access From Offsite Small fish (e.g., stickleback, minnow) from elsewhere in the watershed can access part of this AA for at least 2 days during most years or are known to already be present onsite.
0 Although incomplete, the species maps may be helpful at: http://map.streamnet.org/ or http://query.streamnet.org/ [INV-,FA+,FR+,AM-,WBF+]
F63 Nesting or Roosting Structures
Within the AA or within its wetland or within 300 ft of AA, there are bridges, buildings, caves, or ledges with openings/ crevices, well-maintained bird or bat boxes, elevated platforms, or other artificial structures suitable for nesting by some native bird or bat species.
0 e.g., open buildings for barn swallows, bridges for cliff swallows, wood duck boxes, goose nesting platforms, sheltered places for bees and wasps [POL+,SBM+]
F64 Cliffs, Banks, or Beaver In the AA or within its wetland or within 100 ft of the AA, there are elevated terrestrial features such as cliffs, stream banks, excavated pits, or pumice walls (but not riprap) that extend at least 6 ft nearly vertically, are unvegetated, and potentially contain crevices or other substrate suitable for nesting or den areas. Or there is evidence that beaver have used this AA (e.g., gnawed limbs).
0 [POL+,SBM+]
F65 The maximum percent of the wetland that is visible from the best vantage point on public roads, public parking lots, public buildings, or public paved paths that adjoin or are within 300 ft of the AA (select one) is:>50% 125-50% 0<25% 0
F66 Most of the AA is (select one):in public ownership 0in private ownership 1
F67 For most of the AA, permission for access is normally given or allowed:to anyone, mostly unrestricted 0to anyone, but significant restrictions (e.g., limited dates, permit required) 0only on a case-by-case basis, but with few other restrictions 0only on a case-by-case basis, with restrictions (e.g., limited dates, permit required) 0
seldom or never 1(do not know) 0
F68 Assuming access permission was granted, select all statements that are true of this AA as it currently exists:Walking is physically possible in >5% of the AA during most of year, e.g., free of deep water and dense shrub thickets
1
All or part of the AA (or an area within sight of the AA and within 100 ft) would be physically accessible to people in wheelchairs, e.g., paved and flat
0
Maintained roads, parking areas, or foot-trails are within 30 ft of the AA, or the AA can be accessed most of the year by boat
0
F69 Plants, animals, or water in the AA have been monitored for >2 years, unrelated to any regulatory requirements, and data are available to the public. Or the AA is part of an area that has been designated by an agency or institution as a benchmark, reference, or status-trends monitoring area.
0
(do not know) 0
[PU+]
[PU+]
In all cases, this question assumes that permission for access may be limited to certain activities. [PU+]
[PU+]
Except in isolated wetlands (no outlets), this is not the same as the shoreline slope. It is the elevational difference between highest and lowest points within the site, divided by the flow-distance between them and converted to percent. If most of the surface water is impounded within the site, the gradient is the gradient of the water surface, not the gradient of the submerged substrate. See diagram in Appendix A. If available, use a clinometer to measure this. [WS-,SR-,PR-,NR-,CS-,OE+,AM-,WBF-,WBN-]
[PU+]
Visibility
Internal Gradient
Sustained Scientific Use
Non-consumptive Uses - Actual or Potential
Ownership
Public Access
Form FieldF version 2.0.2 April 2010

332333334335336337338339340341342
343344345346
347348349350351
352353354
355356
357358359360361
362363364365
366
A B C D EF70 Recent evidence was found within the AA of the following potentially-sustainable consumptive
uses. Select all that apply.low-impact commercial timber harvest 0low-impact grazing 0commercial harvesting of hay or mushrooms 0waterfowl hunting or furbearer trapping 0fishing (including shellfish harvest) 0None of the above 1
F71 Wells that currently provide drinking water are:Within 500 ft and downslope from the AA or at same elevation 0500-1000 ft and downslope or at same elevation 0>1000 ft downslope, or none downslope, or AA is tidal, or no information 1
F72 Excessive accumulation of sediment has caused frequent problems for large boats, with shoaling necessitating frequent dredging, in waters that are located:
contiguous to the AA, or <1 mile downslope from the AA 01-5 miles downslope 0>5 miles downslope, or no shoaling, or no boats, or no information 1
F73 The percent of the AA's vegetation cover that normally grows taller than 4 inches but which has been persistently reduced to less than that height by mowing (many times per year), plowing, and/or grazing by domestic or wild animals is:
>95% 050-90% 05-50% 0<5%, or grazing/ mowing does not cause the described condition 1
F74 The part of the AA almost never visited by humans during an average year probably comprises:
>95% of the AA 150-95% 05-50% and inhabited building is within 300 ft of the AA, or <5% and no inhabited building is within 300 ft of the AA
0
none of the above 0F75 The part of the AA visited by humans almost daily for several weeks during an average year
probably comprises:
>95% of the AA 050-95% 05-50% 0<5% 1
F76 Along the AA's boundary with upland, the percent of the upland edge (within 10 ft of AA) that is occupied by species that are marked as invasive in the Plants worksheet is:
most (>50%) of the upland edge 1much (5-50%) of the upland edge 0some (1-5%) of the upland edge 0none of the upland edge (invasives apparently absent), or AA is not within 10 ft of upland 0
[OE-,INV-,AM-,WBN-,SBM-,PD-,CQ-]
Judge this based on proximity to population centers, roads, trails, accessibility of the AA to the public, wetland size, usual water depth, and physical evidence of human visitation. Exclude visits that are not likely to continue and/or that are not an annual occurrence, e.g., by construction or monitoring crews. See diagram in Appendix A of the manual. [AM+,WBF+,WBN+,SBM+,PD+,STR-]
Exclude visits that are not likely to continue and/or that are not an annual occurrence, e.g., by construction or monitoring crews. See diagram in Appendix A of the manual. [AM-,WBF-,WBN-,SBM-,PD-,STR+]
Some of the most common invaders along upland edges of Oregon wetlands are Himalayan blackberry, knotweed, sweetbrier rose, Russian olive, English ivy, nightshade, pepperweed, medusahead, white clover, ryegrass, quackgrass, false brome, bentgrass, dandelion, oxeye daisy, pennyroyal, bull and creeping thistles, tansy ragwort, poison hemlock, and teasel. See file ORWAP_SuppInfo, worksheet P_Invas. If a plant cannot be identified to species (e.g., winter conditions) but its genus contains an invasive species, assume the unidentified plant to also be invasive. If vegetation is so senesced that apparently dominant edge species cannot be identified even to genus, answer "none". [PD-,STR+]
[SRv+]
If unknown, assume this is true if there is an inhabited structure within the specified distance and the neighborhood is known to not be connected to a municipal drinking water system (e.g., is outside an Urban Growth Boundary), or if crops are irrigated annually and the site is distant from a major water body. [NRv+]
"Low impact" means adherence to Best Management Practices such as those defined by NRCS and other agencies. Evidence may consist of direct observation, or presence of physical evidence (e.g., recently cut stumps, fishing lures, shell cases), or communication with the land owner or manager. [PS+]
Consumptive Uses (Provisioning Services)
Core Area 2
Weed Source Along Upland Edge
Core Area 1
Sediment Removal
Domestic Wells
Devegetation
Form FieldF version 2.0.2 April 2010

367368369370371372
373374375376377
378379380
381382383384385
386387388389390391
392
393394395396
A B C D EF77 Within 100 ft upslope of the AA's wetland-upland boundary, the percent of the upland that
contains natural (not necessarily native) land cover is:
>90%, or there is no upland boundary 060 to 90% 130 to 60% 05 to 30% 0<5% 0
F78 Within 100 ft upslope of the AA's wetland-upland boundary, the upland land cover that is not natural (as defined above) is mostly:
impervious surface, e.g., paved road, parking lot, building, exposed rock 0bare pervious surface, e.g., dirt road, dike, dunes, recent clearcut, landslide 1cultivated row crops or orchard 0artificially landscaped areas or lawn 0grain fields, or grassland grazed or mowed to a height usually shorter than 4 inches 0
other 0(buffer is >90% natural land cover or AA occupies all of an island) 0
F79 Along the AA's wetland-upland boundary and extending 100 ft uphill, the slope of the land is mostly:<1% (flat -- almost no noticeable slope, or there is no upland boundary) 02-5% 15-30% 0>30% 0
F80 Within 10 ft of ponded surface water (if any) in early summer, the percent of the herbaceous area (wetland or upland) that has a gentle or moderate slope (less than 5% slope) is:
>75% 050-75% 025-50% 01-25% 0<1%, 0 (ponded surface water in early summer covers <1% of AA, or AA is tidal, or no herbaceous vegetation is present near ponded water)
1
F81 How likely is it that any or all of this AA will persist as a wetland (not necessarily of the same type) if an existing dike or berm, water control structure (e.g., dam, weir), or pumping/ diversion system that now helps sustain it -- and is within 1 mile of the AA -- was removed or became inoperable?
Very likely, or no such feature is present (greater sustainability potential) 1Somewhat likely -- part but not all of the AA would remain a wetland 0Unlikely or not at all (lower sustainability potential) 0
See diagram in Appendix A of the manual. If several isolated pools are present in early summer, estimate the percent of their collective shorelines that has such a gentle slope. [AM-,WBN-]
If all such human activities and structures disappeared, would the site still be a wetland? [WSv,SRv,PRv,NRv,INVv,AMv,WBFv,WBNv,SBMv,PDv+]
Natural land cover includes wooded areas, sagebrush, vegetated wetlands, prairies, as well as relatively unmanaged commercial lands such as hayfields, lightly grazed pastures, and most rangeland. It does not include water, row crops (vegetable, orchards, Christmas tree farms), residential areas, lawn, pavement, bare soil, gravel or dirt roads. Natural land cover is not the same as native vegetation or undisturbed soil. It frequently includes a dominance of non-native plants (e.g., ryegrass, Himalayan blackberry). If the entire site is an island without an upland edge, select the last choice. [POL+,INV+,FA+,FR+,AM+,WBN+,SBM+,PD+,Sens-]
See diagram in Appendix A of the manual. If the described area contains a disturbance feature, estimate instead the slope between the wetland-upland boundary and the most extensive such feature. Disturbance feature = building, paved area, recently cleared area, dirt road, lawn, intensely grazed pasture, orchard, vineyard, annually-harvested row crops [Sens+]
[INV-,FA-,AM-,WBN-,SBM-,PD-,STR+]Type of Land Cover Alteration in Buffer
Independently Sustainable Hydrology
Buffer Slope
Edge Slope
Natural Land Cover in Buffer
Form FieldF version 2.0.2 April 2010

Site Name: Investigator: Date:
Severe (3 points) Medium (2 points) Mild (1 point) Pts
Spatial extent of resulting wetter condition >95% of AA or >95% of its upland edge (if any)
5-95% of AA or 5-95% of its upland edge (if any)
<5% of AA and <5% of its upland edge (if any)
0
When most of AA's wetter condition began <3 yrs ago 3-9 yrs ago 10-100 yrs ago 0
Score the following 2 rows only if the wetter conditions began within past 10 years, and only for the part of the AA that got wetter.
Inundation now vs. previously persistent vs. seldom persistent vs. seasonal slightly longer or more often 0
Average water level increase >1 ft 6-12" <6 inches 0
sum= 0
final score= 0
Severe (3 pts) Medium (2 pts) Mild (1 pt) Pts
Spatial extent of resulting wetter condition >20% of the AA 5-20% of the AA <5% of the AA 0
When most of AA's wetter condition began <3 yrs ago 3-9 yrs ago 10-100 yrs ago 0
Score the following 2 rows only if the wetter conditions began within past 10 years, and only for the part of the AA that got wetter.
Inundation now vs. previously persistent vs. seldom persistent vs. seasonal slightly longer or more often 0
Average water level increase >1 ft 6-12" <6 inches 0
sum= 0final score= 0
In the last column, place an X next to any item occurring in the CA (including channels flowing into the AA) that is likely to have caused a part of the AA to be inundated more extensively, more frequently, more deeply, and/or for longer duration than it would be without that item or activity. Remember that if the AA is flooded as little as once every 2 years by river flow, the CA includes all upstream areas of that river.
pavement, ditches, or drain tile in the CA that incidentally increase the transport of water into the AA
* Score these 2 rows only for the part of the AA that got wetter, and only if the wetter conditions began within past 10 yrs
Wetter Water Regime - External Causes
subsidies from stormwater, wastewater effluent, septic system leakage, or irrigation water (direct or via seepage)
* Score this row only for the part of the AA that got wetter, and only if the wetter conditions began within past 10 yrs
Field S data form. ORWAP version 2.0.2 May 2012
0 if Sum= 0, (1 pt) if Sum= 1-4. (2 pt) if 5-6. (3 pt) if 7-8. (4 pt) if 9-10. (5 pt) if >10.
0 if Sum= 0, (1 pt) if Sum= 1-4. (2 pt) if 5-6. (3 pt) if 7-8. (4 pt) if 9-10. (5 pt) if >10.
excavation or reflooding of upland soils that adjoined the AA, thus expanding the area of the AA
removal of a water control structure or blockage in tributary upstream from the AA
compaction (e.g., ruts) and/or subsidence of the AA's substrate as a result of machinery, livestock, or off road vehicles
changes in the CA that are not related directly to humans, e.g., channel migration, landslides, forest die-offs, seismic activity
removal of timber or phreatophytes in the CA or along the AA's tributaries
Wetter Water Regime - Internal CausesIn the last column, place an X next to any item that is likely to have caused a part of the AA to be inundated more extensively, more frequently, more deeply, and/or for longer duration than it would be without that item or activity. (The items you check are not used automatically by ORWAP. They are included simply so they may be considered when evaluating the factors in the table beneath them).
an impounding dam, dike, levee, weir, berm, road fill, or tidegate -- within or downgradient from the AA, or raising of outlet culvert elevation.
plugging of ditches or drain tile that otherwise would drain the AA (as part of intentional restoration, or due to lack of maintenance, sedimentation, etc.)
excavation within the AA, e.g., artificial pond, dead-end ditch
vegetation removal (e.g., logging) within the AA
changes not related directly to humans, e.g., beaverIf any items were checked above, then for each row of the table below, assign points (3, 2, or 1) in the last column that describe the combined maximum effect of those items in creating a wetter water regime that still persists in the AA. To estimate that, contrast it with the condition if checked items never occurred or were no longer present. The sum and final score will computeautomatically.
If any items were checked above, then for each row of the table below, assign points (3, 2, or 1) in the last column that describe the combined maximum effect of those items in creating a wetter water regime in the AA. To estimate that, contrast it with the condition if checked items never occurred or were no longer present.
S1
S2
Form FieldS version 2.0.2 April 2010
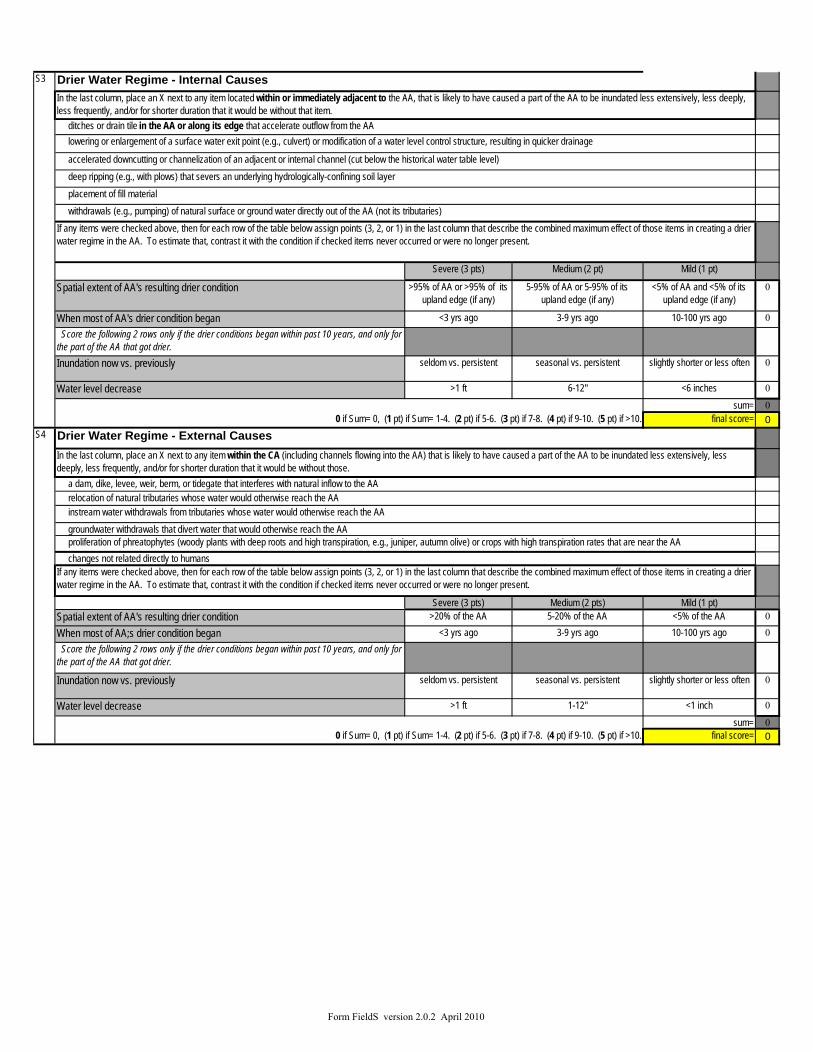
Drier Water Regime - Internal Causes
Severe (3 pts) Medium (2 pt) Mild (1 pt)
Spatial extent of AA's resulting drier condition >95% of AA or >95% of its upland edge (if any)
5-95% of AA or 5-95% of its upland edge (if any)
<5% of AA and <5% of its upland edge (if any)
0
When most of AA's drier condition began <3 yrs ago 3-9 yrs ago 10-100 yrs ago 0
Score the following 2 rows only if the drier conditions began within past 10 years, and only for the part of the AA that got drier.Inundation now vs. previously seldom vs. persistent seasonal vs. persistent slightly shorter or less often 0
Water level decrease >1 ft 6-12" <6 inches 0
sum= 0final score= 0
Severe (3 pts) Medium (2 pts) Mild (1 pt)Spatial extent of AA's resulting drier condition >20% of the AA 5-20% of the AA <5% of the AA 0
When most of AA;s drier condition began <3 yrs ago 3-9 yrs ago 10-100 yrs ago 0
Score the following 2 rows only if the drier conditions began within past 10 years, and only for the part of the AA that got drier.
Inundation now vs. previously seldom vs. persistent seasonal vs. persistent slightly shorter or less often 0
Water level decrease >1 ft 1-12" <1 inch 0
sum= 0final score= 0
In the last column, place an X next to any item located within or immediately adjacent to the AA, that is likely to have caused a part of the AA to be inundated less extensively, less deeply, less frequently, and/or for shorter duration that it would be without that item.
0 if Sum= 0, (1 pt) if Sum= 1-4. (2 pt) if 5-6. (3 pt) if 7-8. (4 pt) if 9-10. (5 pt) if >10.
groundwater withdrawals that divert water that would otherwise reach the AA
relocation of natural tributaries whose water would otherwise reach the AA a dam, dike, levee, weir, berm, or tidegate that interferes with natural inflow to the AA
deep ripping (e.g., with plows) that severs an underlying hydrologically-confining soil layer
0 if Sum= 0, (1 pt) if Sum= 1-4. (2 pt) if 5-6. (3 pt) if 7-8. (4 pt) if 9-10. (5 pt) if >10.
If any items were checked above, then for each row of the table below assign points (3, 2, or 1) in the last column that describe the combined maximum effect of those items in creating a drier water regime in the AA. To estimate that, contrast it with the condition if checked items never occurred or were no longer present.
ditches or drain tile in the AA or along its edge that accelerate outflow from the AA lowering or enlargement of a surface water exit point (e.g., culvert) or modification of a water level control structure, resulting in quicker drainage
Drier Water Regime - External CausesIn the last column, place an X next to any item within the CA (including channels flowing into the AA) that is likely to have caused a part of the AA to be inundated less extensively, less deeply, less frequently, and/or for shorter duration that it would be without those.
If any items were checked above, then for each row of the table below assign points (3, 2, or 1) in the last column that describe the combined maximum effect of those items in creating a drier water regime in the AA. To estimate that, contrast it with the condition if checked items never occurred or were no longer present.
proliferation of phreatophytes (woody plants with deep roots and high transpiration, e.g., juniper, autumn olive) or crops with high transpiration rates that are near the AA
accelerated downcutting or channelization of an adjacent or internal channel (cut below the historical water table level)
withdrawals (e.g., pumping) of natural surface or ground water directly out of the AA (not its tributaries) placement of fill material
instream water withdrawals from tributaries whose water would otherwise reach the AA
changes not related directly to humans
S3
S4
Form FieldS version 2.0.2 April 2010

Altered Timing of Water Inputs
x
Severe (3 pts) Medium (2 pts) Mild (1 pt)Spatial extent within the AA of timing shift >95% of AA 5-95% of AA <5% of AA 1
When most of the timing shift began <3 yrs ago 3-9 yrs ago 10-100 yrs ago 0
Score the following 2 rows only if the altered inputs began within past 10 years, and only for the part of the AA that experiences those.
Input timing now vs. previously shift of weeks shift of days shift of hours or minutes 1
Flashiness or muting became very flashy or controlled
intermediate became mildly flashy or controlled
1
sum= 3final score= 1
x
Severe (3 pts) Medium (2 pts) Mild (1 pt)
Usual toxicity of most toxic contaminants industrial effluent or 303d* for toxics
domestic effluent, cropland, or 303d for nutrients
mildly impacting (livestock, pets, low density residential)
1
Frequency & duration of input frequent and year-round frequent but mostly seasonal infrequent & during high runoff events mainly
1
AA proximity to main sources (actual or potential) 0-50 ft 50-300 ft or in groundwater in other part of contributing area
1
sum= 3final score= 1
If any items were checked above, then for each row of the table below assign points (3, 2, or 1) in the last column that describe the combined maximum effect of those items on the timing of water inputs to the AA. To estimate that, contrast it with the condition if checked items never occurred or were no longer present.
flow regulation in tributaries or water level regulation in adjoining water body, or tidegate or other control structure at water entry points that regulates inflow to the AA
livestock, dogs
other human-related disturbances within the CA sources not related directly to humans, e.g., fire, extensive cover of nitrogen-fixing plants (e.g., alder), concentrations of waterbirds or other wildlifeIf any items were checked above, then for each row of the table below assign points (3, 2, or 1) in the last column that describe the combined maximum effect of those items in generating loads of nutrients, contaminants, or salts reaching the AA. To estimate that, contrast it with the condition if checked items never occurred or were no longer present.
chemical wastes from mining, oil/ gas extraction, other industrial sources
oil or chemical spills (not just chronic inputs) from nearby roads
pesticides applied to lawns, ag lands, roadsides, or other areas in the CA, but excluding spot applications for controlling non-natives in the AA
other
In the last column, place an X next to any item that is likely to have caused the timing of water inputs (but not necessarily their volume) to shift by hours, days, or weeks, becoming either more muted (smaller or less frequent peaks spread over longer times, more temporal homogeneity of flow or water levels) or more flashy (larger or more frequent spikes but over shorter times).
erosion of nutrient-rich or contaminated soils
Accelerated Inputs of Nutrients, Contaminants, and/or Salts
increased pavement and other impervious surface in the CA
reflooding of soils that had been dry for many years fire retardants from aerial firefighting
straightening, ditching, dredging, and/or lining of tributary channels in the CA discharges of irrigation water to the AA, applied at times when natural runoff typically is not significant
irrigation water discharges into the AA, including saline seeps
dumping of large amounts of wood, leaves, grass clippings, trash into the AA or its tributaries artificial drainage of upslope lands
stormwater or wastewater effluent (including failing septic systems), landfillsIn the last column, place an X next to any item -- occurring in either the AA or its CA -- that is likely to have accelerated the inputs of nutrients, contaminants, or salts to the AA
* categorized by ODEQ as Water Quality Limited (303d) and toxic substances are listed by ODEQ as one reason. See item D40 in data form OF.
0 if Sum= 0, (1 pt) if Sum= 1-4. (2 pt) if 5-6. (3 pt) if 7-8. (4 pt) if 9-10. (5 pt) if >10.
0 if Sum= 0, (1 pt) if Sum= 1-3. (2 pt) if 4-5. (3 pt) if 6-7. (4 pt) if 8. (5 pt) if 9.
fertilizers applied to lawns, ag lands, or other areas in the CA
S5
S6
Form FieldS version 2.0.2 April 2010

Severe (3 pts) Medium (2 pts) Mild (1 pt)Erosion in CA extensive evidence, high
intensity*potentially (based on high-
intensity* land use) or scattered evidence
potentially (based on low-intensity* land use) with little
or no direct evidence
0
Recentness of significant soil disturbance in the CA current & ongoing 1-12 months ago >1 yr ago 0
Duration of sediment inputs to the AA frequent and year-round frequent but mostly seasonal infrequent & during high runoff events mainly
0
AA proximity to actual or potential sources 0-50 ft, or farther but on steep erodible slopes
50-300 ft in other part of contributing area
0
sum= 0
final score= 0
Severe (3 pts) Medium (2 pts) Mild (1 pt)Spatial extent of altered soil >95% of AA or >95% of its
upland edge (if any)5-95% of AA or 5-95% of its
upland edge (if any)<5% of AA and <5% of its
upland edge (if any)0
Recentness of significant soil alteration in AA current & ongoing 1-12 months ago >1 yr ago 0
Duration long-lasting, minimal veg recovery
long-lasting but mostly revegetated
short-term, revegetated, not intense
0
Timing of soil alteration frequent and year-round frequent but mostly seasonal infrequent & mainly during scattered events
0
sum= 0
final score= 0
dredging in or adjacent to the AA boat traffic in or adjacent to the AA and sufficient to cause shore erosion or stir bottom sediments
0 if Sum= 0, (1 pt) if Sum= 1-4. (2 pt) if 5-6. (3 pt) if 7-8. (4 pt) if 9-10. (5 pt) if >10.
natural processes within the AA, e.g., trampling by concentrated wildlife, shore or streambank erosion, landslides, normal erosion of erosion-prone soils especially following fire, floods. artificial water level or flow manipulations sufficient to cause erosion or stir bottom sediments
Soil or Sediment Alteration Within the Assessment AreaIn the last column, place an X next to any item present in the AA that is likely to have compacted, eroded, or otherwise altered the AA's soil compaction from machinery, off-road vehicles, or mountain bikes, especially during wetter periods leveling or other grading not to the natural contour
* high-intensity= plowing, grading, excavation, erosion with or without veg removal; low-intensity= veg removal only with little or no apparent erosion or disturbance of soil or sediment
If any items were checked above, then for each row of the table below assign points (3, 2, or 1) in the last column that describe the combined maximum effect of those items in altering the AA's soils. To estimate that, contrast it with the soil condition if checked items never occurred or were no longer present.
excavation
accelerated channel downcutting or headcutting of tributaries due to altered land use
erosion from off-road vehicles in the CA
natural processes within the CA, e.g., streambank erosion, landslides, erosion of erosion-prone soils especially following fire, floods
0 if Sum= 0, (1 pt) if Sum= 1-4. (2 pt) if 5-6. (3 pt) if 7-8. (4 pt) if 9-10. (5 pt) if >10.
If any items were checked above, then for each row of the table below assign points (3, 2, or 1) in the last column that describe the combined maximum effect of those items in increasing the amount or transport of sediment into the AA. To estimate that, contrast it with the condition if checked items never occurred or were no longer present.
livestock and other sediment- or soil-disturbing animals, e.g., carp, nutria, wild boar, people on foot fill or riprap, excluding small amounts of upland soils containing organic amendments (compost, etc.) or small amounts of topsoil imported from another wetland tillage, plowing (but excluding disking for enhancement of native plants)
Excessive Sediment Loading from Contributing AreaIn the last column, place an X next to any item present in the CA that is likely to have elevated the load of waterborne or windborne sediment reaching the AA from its CA. erosion from plowed fields, fill, timber harvest, dirt roads, vegetation clearing, fires
other human-related disturbances within the CA
erosion from livestock or foot traffic in the CA stormwater or wastewater effluent sediment from gravel mining, other mining, oil/ gas extraction
erosion from construction, in-channel machinery in the CA
S7
S8
Form FieldS version 2.0.2 April 2010

Severe (3 pts) Medium (2 pts) Mild (1 pt)Spatial extent of veg removal >95% of AA or >95% of its
water edge5-95% of AA or 5-95% of its water
edge<5% of AA and <5% of its
water edge if any0
Frequency of significant veg removal regularly during most of the year
a few times a year annual or less 0
Biomass recovery after each removal > 20 yrs 2-20 yrs <2 yrs 0
sum= 0final score= 0
In the last column, place an X next to any item present in the AA that is likely to have caused less canopy or ground cover, or less vegetation biomass, or less wood generally. If only the species composition (not total cover or biomass) changed, do not check any of these items.
mowing
clearing, logging, excepting removal of woody vegetation from native prairies grazing by livestock
0 if Sum= 0, (1 pt) if Sum= 1-3. (2 pt) if 4-5. (3 pt) if 6-7. (4 pt) if 8. (5 pt) if 9.
Vegetated Cover Removal Within the Assessment Area
herbicides, excepting spot applications for controlling non-native plants in the AA
shading from large artificial structure, e.g., bridge, boardwalk, dock other human-related disturbances within the AA natural processes concentrated within the AA, e.g., wind & wave scouring, windthrow, insect or disease infestations, fires, beaver damage, natural erosion, intensive grazing by deer, elk, geese.
plowing, regrading
If any items were checked above, then for each row of the table below assign points (3, 2, or 1) in the last column that describe the combined maximum effect of those items on the amount of vegetation cover in the AA.
removal of woody debris
S9
Form FieldS version 2.0.2 April 2010

ORWAP SCORES SHEET version 2.0.2 May 2012Site Name:Investigator Name:Date of Field Assessment:Latitude (decimal degrees): Longitude (decimal degrees):
Specific Functions:Relative Effectiveness of
the FunctionRelative Values of the Function
Water Storage & Delay (WS) 3.75 2.42Sediment Retention & Stabilization (SR) 10.00 4.10Phosphorus Retention (PR) 10.00 4.89Nitrate Removal & Retention (NR) 10.00 4.31Thermoregulation (T) 0.00 0.00Carbon Sequestration (CS) 1.65Organic Matter Export (OE) 0.00Aquatic Invertebrate Habitat (INV) 5.80 7.00Anadromous Fish Habitat (FA) 0.00 4.73Non-anadromous Fish Habitat (FR) 1.00 10.00Amphibian & Reptile Habitat (AM) 6.59 8.00Waterbird Feeding Habitat (WBF) 4.73 4.67Waterbird Nesting Habitat (WBN) 0.00 3.50Songbird, Raptor, & Mammal Habitat (SBM) 5.10 6.67Pollinator Habitat (POL) 5.23 5.00Native Plant Diversity (PD) 2.90 7.00
GROUPED FUNCTIONS Group Scores (functions)Group Scores
(values)Hydrologic Function (WS) 3.75 2.42Water Quality Group (WQ) 10.00 4.89Carbon Sequestration (CS) 1.65Fish Support Group (FISH) 1.00 10.00Aquatic Support Group (AQ) 6.59 8.00Terrestrial Support Group (TERR) 5.23 7.00Public Use & Recognition (PU) 1.90Provisioning Services (PS) 0.00
OTHER ATTRIBUTESWetland Ecological Condition (CQ) 5.96Wetland Stressors (STR) 2.62Wetland Sensitivity (SEN) 10.00
HGM Class - Relative Probabilities (select max)
Estuarine 0.00Riverine 0.00Slope 4.17Flat 8.33Depressional 1.11Lacustrine 0.00
(identical to Carbon Sequestration score above)
Wetland B - Table Rock SubstationL.Cleveland and B. Sahatjian9/10/2014
-122.966
(identical to Water Storage and Delay function and value scores)(maximum of scores for SR, PR, NR, and T)
(maximum of scores for OE, AM, INV, WBF, and WBN)(maximum of scores for FA and FR)
(click on this cell to see this attribute defined)(click on this cell to see this attribute defined)
(maximum of scores for PD, POL, and SBM)

CoverPg: Basic Description of Assessmenty
2012Site Name: Table Rock Investigator Name: L.Cleveland and B. SahatjianDate of Field Assessment: 9/10/2014County: JacksonNearest Town: White CityLatitude (decimal degrees): 42.4760Longitude (decimal degrees): -122.9660TRS, quarter/quarter section and tax lot(s) TRS: 36S 2W 5; Q-Q Section:O-
NENW; Taxlot: 10161957Approximate size of the Assessment Area (AA, in acres) 0.09AA as percent of entire wetland (approx.) 100%If delineated, DSL file number (WD #) if known n/a
Coker clay, 0 to 3 percent slopes
Coker clay, 0 to 3 percent slopes
PEM
HGM Class (Scores worksheet will suggest a class; see manual section 2.4.2) Flat
If tidal, the tidal phase during most of visit: n/aWhat percent (approx.) of the wetland were you able to visit? 100%What percent (approx.) of the AA were you able to visit? 100%Have you attended an ORWAP training session? If so, indicate approximate month & year.How many wetlands have you assessed previously using ORWAP (approx.)?
Soil Map Units within the AA (list these in approx. rank order by area, from WSS web site or published county survey; see manual)
Soil Map Units surrounding and contiguous to the AA (list all present in approx. rank order by area; see manual)
Cowardin Systems & Classes (indicate all present, based on field visit and/or aerial imagery): Systems: Palustrine =P, Riverine =R, Lacustrine =L, Estuarine =EClasses: Emergent =EM, Scrub-Shrub =SS, Forested =FO, Aquatic Bed (incl. SAV) =AB, Open Water =OW, Unconsolidated Bottom =UB, Unconsolidated Shore =US
Comments about the site or this ORWAP assessment (attach extra page if desired):
Version 2.0.2. April 2010.

1
2
3
45
67
8
9
10111213141516
171819202122
A B C D EDate: Site Name:
# Indicator Conditions Data Explanations, Definitions
The AA is all or part of a mitigation site used explicitly to offset impacts elsewhere (0= no, 1= yes)
0
(no information) 0The AA is part of or contiguous to a wetland on which public or private organizational funds were spent to preserve, create, restore, or enhance habitat mainly as part of a voluntary effort not used explicitly to offset impacts elsewhere (0= no, 1= yes)
0
(no information) 0D3 Historically Lacking Trees This AA (a) is not along (or in the biennial floodplain of) a large stream or river where riparian
woodlands would be typical and (b) had a Presettlement vegetation class not dominated by trees as indicated by the Wetlands Explorer web site: www.oregonexplorer.info/wetlands/ORWAP . Enter 1 if both are true, 0= if not.
0 If the openness of the surrounding landscape is due almost entirely to agriculture and other human activities occurring within the past century, do not answer affirmatively. This question is used as a classification variable mainly to set appropriate expectations for the extent of surrounding forest cover. [INVc,FAc,FRc,SBMc,PD,CQc,SENSc]
D4 Enclosed by Roads Draw a circle of radius of 2 miles centered on the AA. Within that circle, do paved roads completely encircle the AA? (0= no, 1= yes)
0 See illustration in Appendix A of the manual. Consider only paved roads expected to have at least 1 vehicle per hour, and which are visible in aerial imagery regardless of width. Presence of culverts or bridges along the roads is irrelevant. Do not consider other potential barriers to wildlife movement (e.g., large rivers, fields). A circle of any radius can be placed on aerial imagery at http://tnm2beta.cr.usgs.gov/viewer . Click on Imagery, then GIS Toolbox, Advanced, RangeRing. [AM-,SBM-,Stress+]
The distance from the center of the AA to the nearest road with an average daytime traffic rate of at least 1 vehicle/ minute is:>1 mile 00.5- 1 mile 01000-2600 ft 0500-1000 ft 1100-500 ft 0<100 ft 0Draw a circle of radius of 2 miles centered on the AA. Including the AA itself, the cumulative amount of forest (regardless of patch sizes) is:<5% of the circle 05 to 20% 120 to 50% 050 to 80% 0>80% 0
Forested= woody vegetation currently taller than 20 ft, and with >70% canopy closure. [SBM+]
D5 Estimate the traffic rate using your judgment and considering the road width, local population, alternate routes, and other factors. [AM-,WBN-,SBM-, PD-,STR+]
Distance to Nearest Busy Road
Forest Landscape Extent
Office Data Form (OF). ORWAP version 2.0.2 May 2012. Answering many of the following questions requires viewing aerial imagery and maps, covering an area up to within 2 miles of the AA. In the Data column, change the 0 (false) to a 1 (true) for the best choice, or for multiple choices where allowed and so indicated. Do not write in any shaded parts of this data form. Questions whose cells in column D have a "W" MUST be answered only for the ENTIRE wetland. Italicized indicators pertain only to wetland values. Although some land cover types (e.g., crops) can vary greatly from year to year, report only the conditions known to prevail during the majority of the past 5 years, or if unknown, then the conditions found in the available aerial imagery. Please do not attempt to fill out this data form until you're familiar with the accompanying manual.
D2
D1
D6
Mitigation Investment
Conservation Investment
[PUv+]
voluntary= WRP, CRP, land trust easements with partial public funding, etc. Locations of some sites are shown online at: http://www.conservationregistry.org/ . Also, locations of OWEB-funded projects are mapped at http://www.oregonexplorer.info/owri_vistool/Intro.aspx [PUv+]
Form OF, Version 2.0.2, April 2010 234

23
24
252627
2829303132
33
3435363738
39
40
41
424344454647
A B C D EThe minimum distance from the AA edge to the closest forested tract or corridor larger than 100 acres is:
<100 ft, or 100-300 ft and not separated from the AA by stretches of open water, bare ground, lawn, or impervious surface that are wider than 150 ft.
0
100-300 ft and separated from the AA by stretches of open water, bare ground, lawn, or impervious surface that are wider than 150 ft.
0
300-1000 ft 0>1000 ft 1
D8 The largest patch or corridor within 0.5 mile of the AA edge that is forested (and not separated from the AA by roads, fields, etc. that create a gap wider than 150 ft), occupies:
<1 acre of forest 11-10 acres 010-100 acres 0100-1000 acres 0>1000 acres 0
D9 Within a 2-mile radius measured from the center of the AA, the percent of the land that has natural land cover (see definition on right) is:
<5% of the land 05 to 20% of the land 020 to 60% of the land 060 to 90% of the land 1>90% of the land 0
D10 Within a 2-mile radius measured from the center of the AA, the area that is not "natural land cover" or water is mostly:impervious surface, e.g., paved road, parking lot, building, exposed rock 0
bare pervious surface, e.g., dirt or gravel road, plowed fields, dunes, recent clearcut or landslide
0
cultivated row crops, orchards, vineyards, tree plantations 1artificially landscaped areas or lawn 0grassland grazed or mowed to a height usually shorter than 4 inches 0other 0(none of above; land cover is >90% natural land cover) 0
Forest Tract Proximity
Size of Nearby Forest
Natural Land Cover Extent
Type of Land Cover Alteration
Natural land cover includes wooded areas, native prairies, sagebrush, vegetated wetlands, as well as relatively unmanaged commercial lands such as ryegrass fields, hayfields, lightly grazed pastures, timber harvest areas, and rangeland. It does not include water, row crops (vegetable, orchards, Christmas tree farms), residential areas, golf courses, recreational fields, pavement, bare soil, rock, bare sand, or gravel or dirt roads. Natural land cover is not the same as native vegetation. It frequently includes a dominance of non-native plants (e.g., cheat grass, Himalayan blackberry). Although some land cover types (e.g., crops) can vary greatly from year to year, report only the conditions known to prevail during the majority of the past 5 years, or if unknown, then the conditions found in the available aerial imagery. [AM+,SBM+)
[POLv-,AM+,SBM+]
D7 forested tract= a land cover patch that has >70% tree cover. A corridor is simply an elongated forested patch that is not narrower than 150 ft at any point. "Not separated" from the AA means not separated by roads or other features that create a tree canopy gap wider than 150 ft. [SBM+]
The patch or corridor may either be entirely or only partially within the 0.5 mile distance. Disqualify any patch or corridor of forest where canopy thins to <70% cover, or where the forested patch becomes separated from the AA by a tree canopy gap of >150 ft or where the forested corridor narrows to less than 150 ft width. See diagram in Appendix A of the manual. Patch area can be measured at http://tnm2beta.cr.usgs.gov/viewer (GIS Toolbox, Advanced) or estimated online in GoogleEarth using the following guidelines: 1 acre is about: 200 ft on a side (if square)10 acres is about: 660 ft on a side100 acres is about: 0.5 mile on a side1000 acres is about: 1 mile on a side [SBM+]
Form OF, Version 2.0.2, April 2010 334

48
49
50
51
5253
545556575859
60
61626364
656667686970
71
72737475
A B C D ED11 The minimum distance from the AA edge to the edge of the closest tract or corridor of natural
(not necessarily native) land cover larger than 100 acres, is:
<100 ft, or the AA contains >100 acres of vegetation, or >100 acres of natural land cover is connected to the AA and is not separated from it by stretches of open water, bare ground, lawn, or impervious surface that are wider than 150 ft.
1
<100 ft, but separated from the wetland by stretches of open water, bare ground, lawn, or impervious surface that are wider than 150 ft.
0
100-300 ft; and not separated from the wetland by stretches of open water, bare ground, lawn, or impervious surface that are wider than 150 ft.
0
100-300 ft, but separated from the wetland by stretches of open water, bare ground, lawn, or impervious surface that are wider than 150 ft.
0
NONE of the above 0D12 The largest patch or corridor that is natural land cover and is within 0.5 mile of the AA edge,
and not separated from the AA by roads etc. that create gaps wider than 150 ft, occupies:
<1 acre 01-10 acres 010-100 acres 0100-1000 acres 1>1000 acres 0
D13 Within 0.5 mile of the center of the AA, the AA and vegetation of the same form that is contiguous to the AA together provide (select all that apply):
the largest patch of currently ungrazed, unmowed, and unshaded herbaceous vegetation 1the largest patch of unshaded shrubland (excluding plantations) 0the largest patch of deciduous or evergreen trees (excluding plantations) 0NONE of above 0
D14 Draw a circle of radius of 2 miles centered on the AA. The amount of herbaceous openland is:
<5% of the land 05 to 20% 020 to 50% 150 to 80% 0>80% 0
D15 The distance from the AA edge to the closest patch of herbaceous openland larger than 1 acre is:
<100 ft, or the AA contains >1 acre of such cover, or is contiguous to >1 acre of such cover 1
100 to 300 ft 0300 to 1000 ft 0>1000 ft 0
Proximity to Natural Land Cover
Size of Largest Nearby Tract or Corridor of Natural Land Cover
See definition of herbaceous openland above, and photographs in Appendix A of manual.. Must be in flat terrain. [POLv+,WBF+]
Natural land cover includes wooded areas, native prairies, sagebrush, vegetated wetlands, as well as relatively unmanaged commercial lands such as ryegrass fields, hayfields, lightly grazed pastures, timber harvest areas, and rangeland. It does not include water, row crops (vegetable, orchards, Christmas tree farms), residential areas, golf courses, recreational fields, pavement, bare soil, rock, bare sand, or gravel or dirt roads. Natural land cover is not the same as native vegetation. It frequently includes a dominance of non-native plants (e.g., cheatgrass, Himalayan blackberry). [POL+,INV+,AM+,SBM+,Sens-]
This question will require field verification. In all cases, the patch may be entirely within the wetland, or may cover only part of the wetland but extend into contiguous upland. Likewise the patches to which it is being compared may be entirely or only partially within the 0.5 mile radius. There is no minimum size limit. [POLv+,AMv+,WBNv+,SBMv+,PDv+]
The patch or corridor may either be entirely or only partially within the 0.5 mile distance. Disqualify any patch or corridor of natural land cover where it becomes separated from the AA by a gap of >150 ft, if the gap is comprised of impervious surface, bare dirt, or lawn, or if the natural land corridor narrows to less than 150 ft. [POL+,AM+,WBN+,SBM+, Sens-]1 acre is about: 200 ft on a side (if square)10 acres is about: 660 ft on a side100 acres is about: 0.5 mile on a side1000 acres is about: 1 mile on a side
Herbaceous openland can include (for example) pasture, herbaceous wetland, meadow, prairie, ryegrass fields, row crops, plowed land, herbaceous rangeland, golf courses, grassed airports, and hayfields but only if they are known to be in flat terrain (almost no noticeable slope). Do not include open water of lakes, ponds, or rivers. See photographs in Appendix A of manual. In dry parts of the state, croplands in flat areas are often irrigated and are distinctly greener in aerial images. [POLv+,WBF+]
Herbaceous Open Land in Landscape
Proximity to Open Land
Local Wetland Uniqueness
Form OF, Version 2.0.2, April 2010 434

76777879808182
83848586878889
9091929394959697
9899
100101102103
A B C D ED16 Draw a circle of radius of 2 miles centered on the AA. Including water ponded in the AA itself
or in a fringing water body, the amount of non-tidal water that is ponded during most of the year is:<5% of the circle, located in 5 or fewer ponds or lakes 0<5% of the circle, located in >5 ponds or lakes 15 to 30%, located in 10 or fewer ponds or lakes 05 to 30%, located in >10 ponds or lakes 0>30%, located in 15 or fewer ponds or lakes 0>30%, located in >15 ponds or lakes 0
D17 The minimum distance from the AA edge to the closest non-tidal wetland, pond, or lake that is larger than 1 acre, is ponded most of the year, and is not part of the same associated wetland, pond, or lake, is:<300 ft, and connected with a natural land corridor 0<300 ft, but no uninterrupted natural land corridor 0300-1000 ft, and connected with a natural land corridor 0300-1000 ft, but no uninterrupted natural land corridor 0>1000 ft, and connected with a natural land corridor 1>1000 ft, but no uninterrupted natural land corridor 0
D18 The distance from the AA edge to the closest (but separate) non-tidal body of water that is ponded during most of the year and is larger than 20 acres (about 1000 ft on a side) is:
<1 mile 01-5 miles 1>5 miles 0
D19 The distance from the AA edge to the closest tidal body of water is:<1 mile 01-5 miles 0>5 miles 1
D20 Using the Web Soil Survey procedure described in the ORWAP manual, the rating of the soil map unit which occupies the largest percentage of the zone 200 ft uphill from the AA is:
very severe 0severe 0moderate 0slight 1(could not determine) 0
Ponded Water in Landscape
See the ORWAP manual for instructions on how to obtain this information online. [SRv+, Sens+]
Ponded water = any surface water that is not obviously part of a river, stream, or tidal system. Include herbaceous (emergent) wetlands larger than 1 acre if they are inundated and water is ponded at least seasonally. Also include waters such as sloughs that are ponded most of the year but connected seasonally to rivers. Consult the online wetland maps at Wetland Explorer and note wetlands that are not obviously intersected by streams and are not estuarine [AM+,WBF+,WBN+,SBM+,Sens-]
If multiple smaller water bodies are separated by <150 ft they may be combined when evaluating acreage. "Uninterrupted" means no impervious surfaces wider than 150 ft interrupt the corridor. "Natural" land corridor means a corridor comprised of natural land cover as defined in D9 above. Consult wetland maps, considering only those polygons whose water regime may be "permanent," "intermittently exposed," or "semipermanent" (codes F, G, or H on NWI maps). [AM+,WBF+,WBN+,SBM+,Sens-]
Large Ponded Water Proximity
Tidal Proximity
Upslope Soil Erodibility Risk
Ponded Water Proximity
[CS+,WBF+]
If multiple smaller water bodies are separated by <150 ft they may be combined when evaluating acreage. Consult wetland maps, considering only those polygons whose water regime may be "permanent," "intermittently exposed," or "semipermanent" (codes F, G, or H on NWI maps). [WBF+,WBN+,Sens-]
Form OF, Version 2.0.2, April 2010 534

104105106107108109110
111
112
113
114115116
117118119120121122
A B C D ED21 Using the Web Soil Survey AOI tool to measure it, what is the area of the largest patch of
emergent, shrub, or forest vegetation within the entire wetland of which the AA is a part? Use just the dominant class. See instructions in last column.
<0.1 acre 10.1 - 1 acre 01 to 10 acres 010 to 100 acres 0100 to 1000 acres 0>1000 acres 0
D22 From the Wetlands Explorer web site (see Manual), note the 12-digit code number for this wetland's HUC6 (Hydrologic Unit Code, i.e., watershed). Then turn to the HUC4, HUC5, and HUC6 worksheets in the ORWAP_SuppInfo file. Compare the extent of the wetland's dominant vegetation form (from above) with that of the largest wetlands of the same class in the same HUC4 (first 8 digits), the same HUC5 (first 10 digits), and the same HUC6 (12 digits). Enter "1" for all that apply below:
the vegetated part of this wetland is as large or larger than any of its class mapped in its HUC4 watershed
0
the vegetated part of this wetland is as large or larger than any of its class mapped in its HUC5 watershed
0
the vegetated part of this wetland is as large or larger than any of its class mapped in its HUC6 watershed
0
none of above 1data are inadequate (NWI mapping not >90% completed in HUC) 0
D23 Turn to the HUCbest worksheet in the ORWAP_SuppInfo file. Using the HUC code noted from the web site, is this AA located in one of the HUCs that are listed as having a large diversity of wetland types relative to area of wetlands (column 3), or a large number (column 4) or area (column 5) of wetlands relative to area of the HUC? Enter "1" for all that apply below:
yes, for the HUC4 watershed 0yes, for the HUC5 watershed 0yes, for the HUC6 watershed 1none of above 0data are inadequate (NWI mapping not completed in HUC) 0
"type diversity" was based on Cowardin system and class (e.g., Palustrine emergent). Note that data are lacking for some HUCs. Because the diversity of types, number of wetlands, and proportional area of wetlands are highly intercorrelated, the criteria used to define "large" were based on the residuals of regression of those variables against wetland area or numbers in the associated HUC. Thus, the relative rather than the absolute number of types or number of wetlands in the HUC was the basis for judging "large," and the top 5% of the residuals was used to identify the most outstanding wetlands in each category. [AM+, WBF+, WBN,+ SBM]+
When drawing the polygon around the patch, exclude vegetation of the same patch type if separated by a gap created by open water, a road, dike, or upland that is wider than 150 ft. [WBF+, WBN+, SBM+, POL+, Sens-]
"of its type" means Cowardin system and class. First determine size importance in HUC6 and if criteria met, then also screen for importance in HUC5 and if met then in HUC4. Alternatively, instead of checking the worksheets, you may go to the Wetland Explorer web site, locate this wetland, activate the boundaries for wetlands plus the HUC4, 5, and 6, and then determine visually if this is the largest wetland of its class. Note that data are lacking for some HUCs. Also note that a HUC4 is the same as an 8-digit HUC, a HUC5 is the same as a 10-digit HUC, and a HUC6 is the same as a 12-digit HUC. [WBFv+, WBNv+, SBMv+]
Wetland Size Uniqueness in Watershed
Extent of Dominant Vegetation Class in Wetland
Wetland Number & Diversity Uniqueness
Form OF, Version 2.0.2, April 2010 634

123
124
125
126
127
128
129
130
131
132
133
134
135
A B C D E
D24 Compared to extent of wetland that may have been originally present at this location (just prior to settlement in 1851), the current wetland is:
W
same size and boundaries, approximately. For example, wetland boundary may be nearly identical to hydric soil boundary
0
smaller (50-99% of the original size) and/or severed (by roads, dikes, drained soils, etc) from a few historically connected wetlands that may no longer exist. Soil map may show hydric soil extending somewhat beyond current wetland boundary.
1
much smaller (<50% of the original size) and/or extensively severed (by roads, dikes, drained soils) from many historically connected wetlands that may no longer exist. Soil map may show hydric soil extending far beyond current wetland boundary.
0
larger (due to damming of stream or runoff, excavation, removal of obstructions, irrigation, etc. that floods soils not mapped as hydric) or has been connected to wetlands from which it existed in isolation just prior to settlement.
0
no wetland is known to have been present at this location originally (no hydric soil is mapped and presettlement vegetation was not wetland; the entire wetland may have resulted from impoundment, excavation, or regrading of upland soils)
0
D25 Go to the Oregon Wetlands Explorer web site or other sources noted below and use those to help determine each of the following:
See section 2.2.8 of the ORWAP manual.
a) the AA is within or is connected to (at least seasonally) a stream or other water body within 0.5 mile that has been designated as Essential Indigenous Anadromous Salmonid Habitat (ESH)
0 You must use information not contained on the Wetlands Explorer web site to determine if such a connection exists at least seasonally. If no mapped ESH is near the AA but ODFW has confirmed the accessibility of the AA by salmonids and the presence of salmonids in nearby waters, this question may be answered affirmatively. Many potential blockages along streams are shown in maps that may be downloaded from: http://nrimp.dfw.state.or.us/nrimp/default.aspx?pn=fishbarriermaps
b) the AA is within or contiguous to a Special Protected Area managed by a conservation group or designated as specially protected for conservation by a state or federal resource agency,
0 This includes BLM Area of Critical Environmental Concern (ACEC) or Outstanding Natural Area (ONA), Federal Research Natural Area (RNA) or Special Interest Area (SIA), or Natural Heritage Conservation (NHCA), Land Trust and Nature Conservancy Preserves, and others.
c) the AA is within or contiguous to a Wetland Priority Area as determined partly by ODFW 0 As recognized by the Oregon Wildlife Conservation Strategy or the Oregon Natural Heritage Program
d) the AA is within an IBA (Important Bird Area, as officially designated) and listed in the IBA worksheet in the ORWAP_SuppInfo file
0
NONE of above 1
"Originally present" means immediately prior to widespread settlement of the region by western cultures (generally, about 1850). See ORWAP manual (section 2.2.8) for instructions on how to see hydric soils in the vicinity. If the hydric soil map units that intersect the wetland are together much larger than the wetland, assume fragmentation has occurred. If possible, also see maps of pre-settlement vegetation (available from ORNHIC for parts of Oregon), and topography. [CQ+]
Historical Hydrologic Connectivity
To answer most of the following questions, you must obtain specific information from web sites or agencies as indicated in the Manual or in the last column (E). In a few cases you may need to also examine aerial imagery. In the Data column (D), change the 0 (false) to a 1 (true) for the best choice, or for multiple choices where allowed and so indicated.
Special Conservation Designations of the Wetland or Local Area
Form OF, Version 2.0.2, April 2010 734

136
137
138
139
140
141
142143
144
145
146147148
149
150
151152153
154
155
156157
158
A B C D ED26 According to the Wetlands Explorer web site, the score for occurrences of rare non-
anadromous fish species in the vicinity of this AA is:
high (≥ 0.75 for maximum score, or ≥ 0.90 for this group's score sum), or there is a recent (within 5 yrs) onsite observation of any of these species by a qualified observer under conditions similar to what now occur
1
intermediate (i.e., not as described above or below) 0
low (≤ 0.33 for both the maximum score this group's score sum, but not 0 for both) 0
zero for both this group's maximum and its sum score, and no recent onsite observation of these species by a qualified observer under conditions similar to what now occur
0
D27 According to the Wetlands Explorer web site, the score for occurrences of rare invertebrate species in the vicinity of this AA is: high (≥ 0.75 for maximum score, or for this group's score sum), or there is a recent onsite observation of any of these species by a qualified observer under conditions similar to what now occur
0
low (< 0.75 for maximum score AND for this group's score sum, but not 0 for both) 1zero for both this group's maximum and its sum score, and no recent onsite observation of these species by a qualified observer under conditions similar to what now occur
0
D28 According to the Wetlands Explorer web site, the score for occurrences of rare amphibian or reptile species in the vicinity of this AA is: high (≥ 0.60 for maximum score, or >0.90 for score sum), or there is a recent onsite observation of any of these species by a qualified observer under conditions similar to what now occur
0
intermediate (i.e., not as described above or below) 0low (≤ 0.21 for maximum score AND <0.15 for score sum, but not 0 for both) 1zero for both this group's maximum and its sum score, and no recent onsite observation of these species by a qualified observer under conditions similar to what now occur
0
D29 According to the Wetlands Explorer web site, the score for occurrences of rare nesting waterbird species in the vicinity of this AA is: high (≥ 0.60 for maximum score, or ≥1.00 for this group's score sum), or there is a recent onsite observation of any of these species by a qualified observer under conditions similar to what now occur
0
intermediate (i.e., not as described above or below) 0low (≤ 0.09 for maximum score and for score sum, but not 0 for both) 0zero for both this group's maximum and its sum score, and no recent onsite observation of these species by a qualified observer under conditions similar to what now occur
1
D30 According to the Wetlands Explorer web site, the score for occurrences of rare non-breeding (feeding) waterbird species in the vicinity of this AA is: high (≥ 0.33 for maximum score, or there is a recent onsite observation of any of these species by a qualified observer under conditions similar to what now occur
0
low (< 0.33 for maximum score and for score sum, but not 0 for both) 0zero for both this group's maximum and its sum score, and no recent onsite observation of these species by a qualified observer under conditions similar to what now occur
1
Species include: Painted Turtle (S2), Northwestern Pond Turtle (S2), Clouded Salamander (S3), Oregon Slender Salamander (S2), Larch Mountain Salamander (S2), Siskiyou Mountains Salamander (S2), Cope's Giant Salamander (S2), Cascade Torrent Salamander (S3), Columbia Torrent Salamander (S3), Coastal Tailed Frog (S3), Inland Tailed Frog (S2), Northern Red-legged Frog (S3), Foothill Yellow-legged Frog (S2), Cascades Frog (S3), Northern Leopard Frog (S1), Oregon Spotted Frog (S2), Columbia Spotted Frog (S2), Great Basin Back-collared Lizard (S3), Desert Horned Lizard (S3), Night Snake (S3), Common Kingsnake (S3), Ground Snake (S3). [AMv+]
Species include Pit-Klamath brook lamprey (S3), Miller Lake lamprey (S1), Klamath lamprey (S3), Malheur mottled sculpin (S3), Margined sculpin (S3), Slender sculpin (S3), Alvord chub (S2), Tui chub (S), Borax Lake chub (S1), Speckled dace (SS), Oregon chub (S2), Umpqua chub (S2), Modoc sucker (S1), Klamath smallscale sucker (SS), Warner sucker (S1), Shortnose sucker (S1), Pit Sculpin (S1), Klamath Lake Sculpin (S3), Bull Trout (S3), Blue Chub (S3), Umpqua Dace (S3), Lahontan Redside (S2), Klamath Largescale Sucker (S3), Tahoe Sucker (S1), Lost River Sucker (S1), Sacramento Perch (S3). Note that for some of these species, only specific geographic populations are designated. S1 is the most imperiled, S3 less so, according to ratings by the Oregon Natural Heritage Information Center. [FRv+]
Species include: Red-necked Grebe (S1), Am. White Pelican (S2), Snowy Egret (S2), Barrow's Goldeneye (S3), Bufflehead (S2), Yellow Rail (S1), Sandhill Crane (S3), Snowy Plover (S2), Black-necked Stilt (SS), Long-billed Curlew (S3), Franklin's Gull (S2), Caspian Tern (SS). [WBNv+]
"Non-breeding" mainly refers to waterbird feeding during migration and winter. [WBFv+]Feeding (Non-breeding) Waterbird Species of Conservation Concern
Amphibian or Reptile of Conservation Concern
Nesting Waterbird Species of Conservation Concern
Invertebrate Species of Conservation Concern
Non-anadromous Fish Species of Conservation Concern
Form OF, Version 2.0.2, April 2010 834

159
160
161
162
163
164
165166
167
168169
170
171
172
173
174
175
176
177
178179
A B C D ED31 According to the Wetlands Explorer web site, the score for occurrences of rare songbird,
raptor, or mammal species in the vicinity of this AA is:
high (≥ 0.60 for maximum score, or >1.13 for score sum), or there is a recent onsite observation of any of these species by a qualified observer under conditions similar to what now occur
0
intermediate (i.e., not as described above or below) 1
low (≤ 0.09 for maximum score AND <0.13 for score sum, but not 0 for both) 0
zero for both this group's maximum and its sum score, and no recent onsite observation of these species by a qualified observer under conditions similar to what now occur
0
D32 According to the Wetlands Explorer web site, the score for occurrences of rare plant species in the vicinity of this AA is: high (≥ 0.75 for maximum score, or > 4.00 for score sum), or there is a recent onsite observation of any of these species by a qualified observer under conditions similar to what now occur
0
intermediate (i.e., not as described above or below) 1low (≤ 0.12 for maximum score AND < 0.20 for score sum, but not 0 for both) 0
zero for both this group's maximum and its sum score, and no recent onsite observation of these species by a qualified observer under conditions similar to what now occur
0
D33 According to the Wetlands Explorer web site:The AA is tidal, or is either (a) not within a 100-yr floodplain of a river, or (b) there are no inhabited buildings or cropland within 2 miles downslope that are within the 100-yr floodplain. Mark "1" then SKIP TO D35.
1
Inhabited buildings within 1 mile downslope from the AA also are within the 100-yr floodplain 0
Croplands but no inhabited buildings are within 1 mile downslope from the AA, and that cropland is also within the 100-yr floodplain
0
Inhabited buildings within 1-2 miles downslope from the AA are also are within the 100-yr floodplain
0
Croplands but no inhabited buildings are within 1-2 miles downslope from the AA, and that cropland is also within the 100-yr floodplain
0
No floodplain data are available, and damage from river floods has not been known to have occurred within 2 miles downgradient. Mark "1" then SKIP to D35.
0
D34
Between the AA and any floodable buildings or cropland located within 2 miles downslope:river flow is regulated and there are many seasonally ponded areas capable of storing water. 0
river flow is regulated or there are many seasonally ponded areas capable of storing water. 0
NONE of the above 0
Downslope Storage
Do not consider pasture or hayfields to be "cropland." See the ORWAP manual for instructions on how to obtain this information online at http://www.oregonexplorer.info/wetlands/ORWAP [WSv+]
[PDv+]
Floodable Property
"Seasonally ponded areas" includes (for example) detention ponds, reservoirs, and depressional wetlands [WSv-]
Songbird, Raptor, Mammal Species of Conservation Concern
Species include: Bald Eagle (SS), Northern Goshawk (S3), Swainson's Hawk (S3), Ferruginous Hawk (S3), Peregrine Falcon (S1), Band-tailed Pigeon (S3), Flammulated Owl (S3), Burrowing Owl (S3), Spotted Owl (S3), Great Gray Owl (S3), Short-Eared Owl (SS), Common Nighthawk (SS), Lewis's Woodpecker (S3), White-Headed Woodpecker (S2), Black-Backed Woodpecker (S3), American Three-toed Woodpecker (S3), Pileated Woodpecker (SS), Olive-sided Flycatcher (S3), Willow Flycatcher (SS), Horned Lark (SS), Purple Martin (S2), White-breasted (Slender-billed) Nuthatch (SS), Blue-gray Gnatcatcher (S3), Varied Thrush (SS), Loggerhead Shrike (S3), Yellow-breasted Chat (SS), Chipping Sparrow (SS), Brewer's Sparrow (SS), Vesper Sparrow (SS), Sage Sparrow (SS), Grasshopper Sparrow (S2), Western Meadowlark (SS), Fringed Myotis (S2), Long-Legged Myotis (S3), California Myotis (S3), Silver-haired Bat (S3), Hoary Bat (S3), Spotted Bat (S2), Townsend's Big-eared Bat (S2), Pallid Bat (S2), Red Tree Vole (S3), Kit Fox (S1), Ringtail (S3), American Marten (S3), Fisher (S2), Columbian White-Tailed Deer (SS) . [SBMv+]
Plant Species of Conservation Concern
Form OF, Version 2.0.2, April 2010 934

180
181
182
183
184
185186
187
188
189190191192
193
194
195
196
197198199200
A B C D ED35 According to Wetlands Explorer map showing this AA's position within its HUC4 (8-digit)
watershed, the AA is [see last column and Manual for specific guidance]:
in the upper one-third of its watershed 0
in the middle one-third of its watershed 1
in the lower one-third of its watershed 0
D36 Based on the definition and protocol in the ORWAP manual, the area of the wetland of which this AA is a part, relative to the wetland's contributing area (CA) is:
W
<1% of its CA (true if wetland is tidal, or along major river, or has many tributaries, or gets substantial water drawn from other surface water bodies, e.g., flood irrigation)
0
1 to 10% of its CA 110 to 100% of its CA 0
Larger than the area of its CA (wetland has essentially no CA, e.g., isolated by dikes with no input channels, or is in terrain so flat that a CA can't be delineated). SKIP TO D40.
0
D37 The proportion of the CA comprised of buildings, roads, parking lots, other pavement, exposed bedrock, and other impervious surface is about :
W
>25% 010 to 25% 0<10%, or wetland is tidal 1
D38 The cumulative area of seasonally ponded areas in the same CA is: WMuch (>10x) greater than the area of this wetland (plus any contiguous pond or lake), or inflow is strongly regulated by dams etc.
0
Somewhat greater than the area of this wetland (plus any contiguous pond or lake) and flows to wetland are not strongly regulated
0
Less than the area of this wetland (plus any contiguous pond or lake), or wetland is tidal, or no upslope wetlands/ ponds and no inflow regulation
1
D39 A relatively large proportion of the precipitation that falls farther upslope in the CA reaches this wetland quickly as runoff (surface water), as indicated by the following: (a) input channel is present, (b) CA slopes are steep, (c) input channels have been straightened, (d) upslope wetlands have been ditched extensively, (e) land cover is mostly non-forest, and/or (f) most CA soils are shallow and/or have high runoff coefficients). This statement is:
W
Mostly true 0Somewhat true 0Mostly untrue, or wetland is tidal 1
Contributing Area (CA) Percent
"Seasonally ponded area" includes (for example) detention ponds, reservoirs, and depressional wetlands [WSv-,SRv-,PRv-,NRv-]
Unvegetated Surface in the Contributing Area
Upslope Storage
[WSv+,SRv+,PRv+,NRv+]Transport From Upslope
Relative Elevation in Watershed
1) Which end of the HUC4 is the bottom? Where streams join, the “V” that they form on the map points towards bottom of the HUC.2) If the AA is closer to the HUC4's outlet than to its upper end, and is closer to the river or large stream that exits at the bottom of the HUC4 than it is to the boundary (margin) of the HUC4, then check "lower 1/3” If not near that river, check "middle 1/3".3) If the AA is not in a 100-yr floodplain, is closer to the HUC4 upper end than to its outlet, and is closer to the boundary (margin) of the HUC4 than to the river or large stream that exits at the bottom of the HUC4, then check "upper 1/3” 4) For all other conditions, check "middle 1/3".
The CA is basically the upslope area that has the potential to deliver water to the wetland. The CA boundary typically does not cross any streams or ditches except the one at the wetland outlet (if any). Remember that if the wetland is flooded as little as once every 2 years by river flow, the CA includes all upslope areas that feed that river. If the wetland is on the fringe of a pond or lake, compare the area of that water body to its contributing area -- not the area of the wetland compared to only the wetland's contributing area. For most wetlands, and especially ones containing tributaries, the first choice will be the most appropriate. For AA's that are intercepted by a mapped stream, delineation and area calculation for the CA will be done automatically at this USGS web site: http://streamstats.usgs.gov/orstreamstats/index.asp . Enter the coordinates, zoom to scale of 1:24000 or finer, click on the stream, and click on Basin Delineation, then BasinChar. [WSv+,SRv+,PRv+,NRv+, Sens+]
[WSv-,SRv-,PRv-,NRv-]
Form OF, Version 2.0.2, April 2010 1034

201202203204205206207
208209210211212213
214
215
216217218219220221222223
224
225226
227228229230231232233
A B C D ED40 Within 1 mile upstream from the wetland, at least one of the major sources of surface water to
this wetland (at least seasonally) has been designated as Water Quality Limited (303d) for at least one of the parameters below. Obtain from web site only -- do not guess. Select all that apply.
W
total suspended solids (TSS), sedimentation, or turbidity 0phosphorus 0nitrate or ammonia 0toxics, dioxin, heavy metals (iron, manganese, lead, zinc, etc.) 0temperature 0None of above, or degraded water cannot reach wetland, or no data. 1
D41 Within 1 mile downstream or downslope from this wetland, there is at least one stream or other water body that has been designated as Water Quality Limited (303d) for at least one of the parameters below. The water body need not be connected to the AA. Obtain from web site only -- do not guess. Select all that apply.
W
total suspended solids (TSS), sedimentation, or turbidity 0phosphorus 0nitrate or ammonia 0toxics, dioxin, heavy metals (iron, manganese, lead, zinc, etc.) 0temperature 0None of above, or no data. Mark "1" then SKIP TO D43. 1
D42 At least part of the AA is connected to the downstream 303d water mentioned in D41 above:
for 9 or more continuous months annually (persistent water in a stream, ditch, lake, or other water body)
0
intermittently (at least once annually, but for less than 9 months continually) 0Not connected, or connected less than annually 0
D43 According to the ODEQ LASAR database, the AA is within:the source area for a surface-water drinking water (DW) source 0the source area for a groundwater drinking water source 0Neither of above 1
D44 The AA is (select all that apply):within a designated Groundwater Management Area (ODEQ), see maps in Appendix A of ORWAP manual.
0
within a designated Sole Source Aquifer area (EPA): the North Florence Dunal Aquifer. See map downloadable from: http://oregonstatelands.us/DSL/WETLAND/or_wet_prot.shtml
0
NONE of above 1D45 According to the PRISM Data Explorer (see ORWAP manual for instructions), annual
precipitation in the vicinity of the wetland has normally been:
<10 inches per year 010-12 inches per year 013-19 inches per year 020-47 inches per year 148-77 inches per year 0>77 inches per year 0
[NRv+]
Obtain online as explained in Manual from: http://gisdev.nacse.org/prism/nn/index.phtml These categories reflect the 10th, 25th, 50th, 75th, and 90th percentiles of all points in a comprehensive spatial grid of annual precipitation points in Oregon, for the years 1971-2000. [INVv+,AMv+,WBFv+,WBNv+,SBMv+,PDv+,Sens-]
Mean Annual Precipitation
Groundwater Risk Designations
Known Water Quality Issues in the Input Water
See the ORWAP manual (section 2.2.7) for instructions on how to obtain this information online at http://deq12.deq.state.or.us/lasar2/default.aspx [SRv+,PRv+,NRv+,TRv+,INV-,WBF-,WBN-,STR+]
See the ORWAP manual (section 2.2.7) for instructions on how to obtain this information online at http://deq12.deq.state.or.us/lasar2/default.aspx [SRv+,PRv+,NRv+,TRv+,INV-,WBF-,WBN-,STR+]
persistent water= flows for more than 9 months during most years. [SRv+,PRv+,NRv+,TRv+,INV-,WBF-,WBN-,STR+]
See the ORWAP manual (section 2.2.7) for instructions on obtaining this online from http://deq12.deq.state.or.us/lasar2/default.aspx [NRv+]
Drinking Water Source (DEQ)
Known Water Quality Issues Below the Wetland
Type of Outflow Connection to 303d
Form OF, Version 2.0.2, April 2010 1134

234235236237238
239240241242243244245
246247
248
249250251252253
254
A B C D ED46 The phosphorus loading rank of the county in which the AA is located is: (select one); see
WQprob worksheet in ORWAP SuppInfo file. top 4 in Oregon (Marion, Malheur, Umatilla, Linn) 0top 18 (see Table 6 in WQprob worksheet in file ORWAP_SuppInfo) 0bottom 18 (see Table 6 in WQprob worksheet) 1bottom 4 (Josephine, Hood River, Lincoln, Clatsop) 0
D47 The nitrogen loading rank of the county in which the AA is located is: (select one); see WQprob worksheet in ORWAP SuppInfo file. top 4 in Oregon (Marion, Malheur, Umatilla, Linn) 0top 18 (see Table 7 in WQprob worksheet) 0bottom 18 (see Table 7 in WQprob worksheet) 1bottom 4 (Curry, Josephine, Lincoln, Clatsop) 0
D48 The AA's relative position in the estuary is (SKIP if nontidal):lower 1/3 (often on a bay and distant from the head-of-tide of a major river; includes most saline tidal wetlands)
0
mid 1/3 0upper 1/3 (near the head-of-tide of a major river; includes most brackish and fresh tidal wetlands)
0
D49 The usual maximum water-surface salinity during high tide in summer in the main channel or bay closest to the AA is (SKIP if nontidal):>30 parts per thousand (undiluted seawater) 05-30 ppt (mesohaline, polyhaline) 00.5 - 5 ppt (oligohaline) 0<0.5 ppt (fresh) 0no data for nearby locations found at the ODEQ LASAR web site or from other sources 0
Answer these final two questions only if the AA is tidal.Estuarine Position
County Rank for Phosphorus Loading
If you don't know it, determine which county the wetland is in from the ODEQ web site ttp://deq12.deq.state.or.us/lasar2/default.aspx as explained in Manual. Data used for these rankings are from a national survey by USGS and represent the combined inputs (kg of P per sq. km.) from fertilizer (2001) and livestock (average of the years 1982, 1987, 1992, and 1997). [PRv+]
County Rank for Nitrogen Loading
Refer to Estuary Salinity maps at http://oregonstatelands.us/DSL/WETLAND/or_wet_prot.shtml or (preferably) determine this from field measurement or from data at the ODEQ LASAR web site (see ORWAP manual for instructions on accessing those data). [SR-,PR-,CS+,OE+,FA-,PD-]
Determine county from a map or online from http://deq12.deq.state.or.us/lasar2/default.aspx as explained in Manual. Data used for these rankings are from a national survey by USGS and represent the combined inputs (kg of N per sq. km.) from fertilizer, livestock, and atmospheric deposition of N during 2001. [NRv+]
[WSv+,PR+,PD+]
Salinity
Form OF, Version 2.0.2, April 2010 1234

1
2
3
4
5
6
7
8
9
10
11
12
13
A B C D EDate: Site Name: Investigator:
# Indicator Conditions Data Explanations, Definitions
Does the AA contain, or is it part of, any of these wetland types? Mark "1" next to all that apply. W
Tidal wetland: receives tidal water at least once during a normal year, regardless of salinity, and dominated by emergent or woody vegetation.
0 tidal = level of surface water fluctuates every ~6 hours on a daily basis in response to tides. [All functions, as classifier]
Lacustrine wetland: an undiked non-tidal wetland bordering a body of standing open water that is >20 acres.
0 open water = surface water that contains no vegetation (except perhaps floating-leaved or completely submersed species). [WBN+]
Fringe wetland: an undiked "shoreline" wetland bordering persistent open water that is >3 times wider than the wetland (includes most tidal, lacustrine, large riverine, some others).
0 [WSv-, T-, FA+,FR+, WBF+]
NONE of above 1
F2 Does the AA contain, or is it part of, any of these wetland types? Mark "1" next to all that apply. Consult the "Rare Wetland Type" reported for the general vicinity by the Oregon Explorer web site, but be aware that those may not apply to the exact AA you have delimited.
W
Bog or Fen: contains a sponge-like organic soil layer which covers most of the AA AND often has extensive cover of sedges and/or broad-leaved evergreen shrubs (e.g., Ledum ). Often lacks tributaries, being fed mainly by groundwater and/or direct precipitation.
0 [CS+,Sens+]
Playa, Salt Flat, or Alkaline Lake: a non-tidal ponded water body usually having saline (salinity >1 ppt or conductivity >1000 µS ) or alkaline (conductivity >2000 µS and pH >9) conditions and large seasonal water level fluctuations (if inputs-outputs unregulated). If a playa or salt flat, vegetation cover is sparse and plants typical of saline or alkaline conditions (e.g., Distichlis , Atriplex ) are common.
0 See file ORWAP_SuppInfo, worksheet P_Salt for species typically occurring in tidal or saline conditions. [PR+,CS+,INV+,FA-,FR-,AM-,WBF+]
Hot spring (anywhere in Oregon): a wetland where discharging groundwater in summer is >10 degrees (F) warmer than the expected water temperature.
0 [FA-]
Native wet prairie (west of the Cascade crest): a seasonally inundated wetland, usually without a naturally-occurring inlet or outlet, and dominated primarily by native graminoids often including species in column E.
0 Deschampsia caespitosa, Danthonia californica, Camassia quamash, Triteleia hyacinthina, Carex densa, C. aperta, and/or C. unilateralis [PDv,CQc]
Presence of Specific Wetland Types
Wetland Type of Conservation Concern
Field F data form. ORWAP version 2.0.2 May 2012. In the Data column, change the 0 (false) to a 1 (true) for the best choice, or for multiple choices where allowed and so indicated. Answer these questions primarily based on your onsite observations and interpretations. Do not write in any shaded parts of this data form. Answering some questions accurately may require conferring with the landowner or other knowledgable persons, and/or reviewing aerial imagery. Although accuracy will be greater if questions are answered for the entire wetland (not limiting only to the part potentially affected by a project), most questions may be answered for just part of a wetland-- the assessment area (AA). HOWEVER, questions with a W in the gray box in column D must be answered for the ENTIRE wetland of which the AA is a part.
F1
Form FieldF version 2.0.2 April 2010

14
15
16
17
18
19
20
2122
A B C D EVernal pool (Willamette Valley): a seasonally inundated wetland, underlain by hardpan or claypan, with hummocky micro-relief, usually without a naturally-occurring inlet or outlet, and with native plant species distinctly different from those in slightly higher areas, and often including species in column E.
0 Downingia elegans, Isoetes nuttallii, Triteleia hyacinthina, Eleocharis spp., Eryngium petiolatum, Plagiobothrys figuratus, Plagiobothrys scouleri, Grindelia nana, Veronica peregrina, Lasthenia glaberrima , Cicendia quadrangularis, Kickxia elatine, Gnaphalium palustre, and/or Callitriche spp.[PDv]
Vernal pool (Medford area): a seasonally inundated acidic wetland, underlain by hardpan, with hummocky micro-relief, usually without a naturally-occurring inlet or outlet, and having concentric rings of similar native vegetation, often including species in column E.
0 Downingia vina, Isoetes nuttalli, Pilularia americana, Triteleia hyacinthina, Eleocharis spp., Eryngium petiolatum, Plagiobothrys brachteatus, Plagiobothrys scouleri, Grindelia nana, Veronica peregrina, Alopecurus saccatus, Lasthenia californica, Deschampsia danthonioides, and/or Callitriche spp. [PDv]
Vernal pool (Modoc basalt & Columbia Plateau): a seasonally inundated wetland, usually without a naturally-occurring inlet or outlet, located on shallow basalt bedrock and often having species in column E.
0 Blennosperma nanum, Camassia quamash, Epilobium densiflorum, Callitriche marginata, Cicendia quadrangularis, Eryngium vaseyi, Psilocarphus brevissimus, and/or Sedella pumila. [PDv]
Interdunal wetland (Coastal ecoregion): a seasonally inundated wetland, usually without a naturally-occurring inlet or outlet, located between sand dunes where wind has scoured the sand down to the water table (deflation plain), and often with significant cover of native species in column E.
0 Carex obnupta, Argentina egedii, Juncus lesueurii, J. nevadensis, J. falcatus, Sisyrinchium californicum, and/or Salix hookeriana [PDv]
Mature forested wetland (anywhere): a wetland in which mean diameter of trees (d.b.h., FACW and FAC species only) exceeds 18 inches, and/or the average age of trees exceeds 80 years, or there are >5 trees/acre with diameter >32 inches.
0 To qualify, the diameter of >18 inches must be the mean measured from at least 10 trees. [PDv]
Ultramafic soil wetland (mainly southwestern Oregon): a low-elevation wetland, usually with a sponge-like organic soil layer, occurring in an area with exposed serpentine or peridotite rock, and/or in soils with very low Ca:Mg ratios.
0 [PDv]
Wooded tidal wetlands with >30% cover of trees and shrubs. A wetland inundated at least once annually by tides and often dominated by woody plant species.
0 The plant species may include Sitka spruce, crabapple, and/or others [PDv]
Undiked tidal freshwater wetland: an emergent or wooded wetland inundated at least once annually by tides and with surface salinity <0.5 ppt during most of spring and summer, and which has never been diked.
0 [PDv]
NONE of above 1
Form FieldF version 2.0.2 April 2010

23
242526272829
30
31
32
33
34
3536
37
383940
41
424344454647
A B C D E
The percent of the vegetated part of the AA that is "low marsh" (covered by tidal water for part of almost every day) is:>95% of the AA 050-95% of the AA 025-50% of the AA 01-25% of the AA 0<1% or none of the AA (high marsh only) 0This tidal wetland is (select one): Wcontiguous to a non-tidal palustrine wetland that contains surface water at least seasonally, and mostly not separated by a dike or other barrier, allowing fish access to both wetlands during spring.
0
contiguous to a non-tidal palustrine wetland that contains surface water at least seasonally, but mostly separated by a dike or other barrier, yet still allowing fish access to both wetlands during spring.
0
not contiguous to a non-tidal palustrine wetland that contains surface water, but has an inflowing stream that allows fish during the springtime to access a non-tidal wetland < 1 mile upstream.
0
not contiguous to a non-tidal palustrine wetland that contains surface water, but has an inflowing stream that allows fish during the springtime to access a non-tidal wetland > 1 mile upstream.
0
not contiguous to a non-tidal palustrine wetland, and lacks an inflowing non-tidal stream that provides fish access to an upstream wetland that contains surface water at least seasonally.
0
Select one:during 4 of the last 5 years most of the AA has been covered year-round with surface water, but that part went mostly dry during at least one unusual event.
0
during 4 of the last 5 years most of the AA has been dry year-round on the surface (i.e., saturated only below the surface), but during at least one unusual event most of that part was flooded, even if only briefly.
1
neither of above 0unknown 0
F6 Saturated-only Wetland No part of the AA is ever inundated (contains at least 1 inch of water above the land surface) for more than 14 consecutive days during a normal year. That is, it is a saturated-only wetland. If true, mark "1" here, then SKIP TO F39 (Herbaceous Extent)
1 [classifier for all functions]
During normal years, the percent of the AA that is inundated only seasonally (more than 14 consecutive days but no more than 9 months, or in tidal wetlands is "high marsh" that is inundated by tides fewer than half the days in any month) is:
>75% of the AA 050-75% of the AA 025-50% of the AA 05-25% of the AA 0<5% of the AA, or none 1
Tidal-Nontidal Hydroconnectivity
Interrupted Hydroperiod
Include any natural channels within the marsh that are inundated at least once daily by tide. See file ORWAP_SuppInfo, worksheet P_LowTidal. [WS-,OE+,POL-,INV+,FA+,FR+,WBF+,WBN-,SBM-,PD-]
contiguous= abutting, with no major physical separation that prohibits free exchange or flow of surface water, if any is present. See diagram in Appendix A of the manual. [FA+,WBF+,WBN+,PD+]
[PR-,NR-,CS-,OE+,INV+,FR-,WBF+,WBN+,PD+]
Low Marsh
Seasonal Water Extent Flood marks (algal mats, adventitious roots, debris lines, ice scour, etc.) are often evident when not fully inundated. Also, such areas often have a larger proportion of upland and annual (vs. perennial) plant species. Vegetation may be patterned in concentric or parallel zones, as one moves outward & away from the deepest part of the wetland or channel. Although useful only as a general guide, the NRCS county soil survey descriptions of the predominant soil types usually includes information on flooding frequency and saturation persistence. [WS+,SR+,NR+,CS+,OE+,INV-,FA+, AM-, Sens+]
F3
F4
F5
F7
Is part of the site tidal? If yes, answer next 2 questions. If no, SKIP TO # F5.
Form FieldF version 2.0.2 April 2010

4849505152
5354
55
56
57
58
59
60
61
62
63
64
65
66
6768
A B C D EWhen the AA’s surface water is at its lowest annual level, the percent of the AA still containing surface water (whether obscured by vegetation or not) is: >95% of the AA 050-95% of the AA 025-50% of the AA 01-25% of the AA 0None of the above, and the AA contains or is part of a fringe wetland, SKIP to F10 0
None of the above, and not a fringe wetland, SKIP to F10 1When the AA’s surface water is at its lowest annual level (for tidal wetlands = annual lowest tide), the percent of the surface water that is in or connected to flowing channels that exit the AA, compared to surface water that is outside of channels and their floodplains (e.g., in small depressions that do not connect annually to the channel if any), is:
all (100%) located in channels, swales, or other areas with a surface water connection to a river, lake, or estuary at all times of year
0
75-99% in or connected to channels, swales, or contiguous lake/ estuary, 1-25% in isolated pools 0
50-75% in or connected to channels, swales, or other areas with a surface water connection to a river, lake, or estuary at all times of year, 25-50% in isolated pools
0
25-50% in or connected to channels, swales, or other areas with a surface water connection to a river, lake, or estuary at all times of year, 50-75% in isolated pools
0
1-25% in or connected to channels, swales, or other areas with a surface water connection to a river, lake, or estuary at all times of year, 75-99% in isolated pools
0
all located in isolated pools or a single isolated pond from which no surface water exits when levels are lowest
0
During the wettest time of a normal year , the percent of the surface water that is in or connected to ditches, swales, or flowing channels that exit the AA, compared to surface water that is in isolated pools that do not connect annually to channels or swales (if any), is:
all (100%) located in channels, swales, or in other areas with a wet-season surface connection to channels or to a contiguous lake or estuary
0
75-99% in or connected to channels, swales, or contiguous lake/ estuary, 1-25% in isolated pools 0
50-75% in or connected to channels, swales, or contiguous lake/ estuary, 25-50% in isolated pools 0
25-50% in or connected to channels, swales, or contiguous lake/ estuary, 50-75% in isolated pools 0
1-25% in or connected to channels, swales, or contiguous lake/ estuary, 75-99% in isolated pools 0
all located in isolated pools or a single isolated pond from which no surface water exits 1
Onsite Surface Water Isolation (Wet Season)
Extent of Persistent Surface Water (Dry Season)
Onsite Surface Water Isolation (Dry Season)
For tidal sites, consider the condition at annual lowest tide. See DSL web site for general maps of waters that may be tidal. Swales and channels are areas that have surface flow for at least 2 consecutive days per year. Swales are less distinct (broader and flatter in cross-section) than channels. [WS+, SR+,PR+,NR+,OE-,T-, INV+,FA-,FR+,AM+,WBF+,WBN+,Sens+]
For tidal sites, consider the condition that would exist at annual lowest tide. Indicators of persistence may include fish, some dragonflies, beaver, and muskrat. In the county soil survey, the NRCS descriptions of the predominant soil types may include information on saturation persistence in those types. [WS-,PR-,NR-,CS-,POL-,INV+,FR+,AM+,WBF+,WBN+,SB-]
For tidal sites, consider the condition at mean high tide. See DSL web site for general maps of waters that may be tidal. Swales and channels are areas that have surface flow for at least 2 consecutive days per year. Swales are less distinct (broader and flatter in cross-section) than channels. Sites fed by unregulated streams that descend on north-facing slopes tend to remain wet longer into the summer, especially in montane snow-fed areas.[WS+, SR+,PR+,NR+,CS+,OE-,INV+,FA-,FR+,AM+,WBF+]
F9
F10
F8
Form FieldF version 2.0.2 April 2010

697071727374
7576777879
80
81
82
83
84
85
86878889
90
91
A B C D EF11 During most years, the difference in surface water level between the driest and wettest time of year
in most of the area that is not inundated year-round is:
>6 ft change 03-6 ft change 01-3 ft change 00.5 - 1 ft change 0<0.5 ft or no change (stable) 1
F12 When present, surface water in most of the AA is usually:
>6 ft deep 02-6 ft deep 01-2 ft deep 00.5 - 1 ft deep 0<0.5 ft deep (but >0) 1
F13 When present, surface water in most of the AA usually consists of (select one):
One depth class (use the classes in F12) that comprises >90% of the AA’s inundated area 0
One depth class that comprises >50% of the AA's inundated area 0
Neither of above 1
F14 Ponded nontidal water deeper than 3 ft covers at least 1 acre or >5% of the AA during (check all that apply):
most of the period (generally, November-April) when waterfowl are migrating or wintering, and/ or amphibians are in aquatic phases
0
most of the period (generally, May-August) when waterfowl are breeding 0neither of above (no ponded water >3 ft deep is that extensive) 1impossible to tell 0Visualize the extent and distribution of ponded open water within the AA, relative to the distribution of the most dominant form of partly-submerged vegetation (herbaceous or woody, with stems and leaves >4" above the water surface). Visualize this as it occurs during May of most years. In the table to the right, first estimate the percent open water (left column) in the AA, then its distribution (secondary header). Select the highest applicable number and enter it in column D. See photographs in Appendix A of manual. If the AA has no ponded water during May, score it "1." If this is a fringe wetland, assume Open Water is >70%.
1
Note: Ponded open water is surface water that is not visibly flowing and contains no vegetation (except perhaps floating-leaved or completely submersed species) and is not beneath a canopy of trees or shrubs. For tidal sites, consider the condition at average mid-tide.
Predominant Water Fluctuation Range
Depth Class Distribution
Deep Spots
Predominant Depth Class
Open Water Interspersion With Partly Inundated Vegetation
Estimate these proportions by considering the gradient and microtopography of the site. See diagram in Appendix A of the manual. For tidal waters, estimate at mean high tide. [INV+,FR+,WBF+,WBN+]
[AM+, WBN+]
[NR+,OE+,INV+,FA+,FR+,WBF+,WBN+]
[WS+,PR-,NR+,CS-,OE+,INV-, AM-,WBN-]
"Usually" means the majority of the weeks during which the AA is at least partly inundated. This question is asking about the spatial median depth that occurs during most of that time, even if inundation is only seasonal or temporary. If inundation in most but not all of the AA is brief, the answer will be based on the depth of the most persistently inundated part of the AA. Include surface water in channels and ditches as well as ponded areas. See diagram in Appendix A of the manual. For tidal sites, assess the condition as it exists at mean high tide. [SR+,PR+,CS-,OE-,T+,INV-,FA+,FR+,WBF-,WBN-,PD-,Sens-]
F15
Form FieldF version 2.0.2 April 2010

9293
94
9596
97
98
99
100101
102103104105
106
107
108109
110
111
A B C D EF16 When surface water enters the AA, it enters as (select all applicable choices):
flow moving in streams, ditches, other channels 0surface water exchanged broadly as overflow with contiguous waters such as an estuary, lake, or river
0
water pumped into or intentionally diverted to the AA, e.g., as part of a stormwater dispersion system, irrigation practice, or drainage tile outlet
0
groundwater, runoff, and direct precipitation 1F17 Select one: W
Part of the wetland contains strong evidence of groundwater discharges at the wetland surface during summer: (a) Springs are observed or are shown on Wetland Explorer map, or (b) water is cooler in summer and warmer in winter than in other local wetlands, or (c) measurements from shallow wells indicate groundwater is discharging to the wetland.
0
Part of the wetland has less definitive evidence of discharging groundwater during summer. Wetland has no perennial tributary and is on organic, sandy, or gravelly soil (as determined in F58) AND has one or more: (a) outflow is present and persists during most of the summer or (b) on a natural slope of >5%, or (c) very close to the base of a natural slope steeper than 15%, and longer than 300 ft, or (d) located at a geologic fault, or (e) has rust deposits, colored precipitates, or dispersible natural oil sheen, or (f) within a mile of the top of a HUC4 watershed (see Wetland Explorer for boundaries).
0
Neither of above is true, although some groundwater may discharge to or flow through the wetland, and wetland is in a region of eastern Oregon with mean annual precipitation of less than 20 inches.
0
None of the above 1F18 The most durable surface water connection between the wetland and the closest contiguous
and/or downslope surface waters is:W
persistent (>9 months/yr), or daily tidal exchange 0seasonal (14 days to 9 months/yr, not necessarily consecutive) 0temporary (<14 days, not necessarily consecutive) 0none -- the wetland lacks an outlet. If so, mark "1" here and SKIP TO F25 (Sheltering of Water). 1
F19 During major runoff events, in the places where surface water exits the wetland it is: W
impeded by a pipe, culvert, tidegate, narrowly breached dike, berm, beaver dam, or other obstruction (other than natural topography), or water is pumped out of the wetland (e.g., for irrigation)
0
not impeded by anything other than (possibly) natural topography 00
W
Groundwater
Outflow Duration
Inlet+Outlet
Outflow Confinement
Inflow
The connection may be via a ditch, pipe, tidegate, or culvert as well as through a natural channel, floodplain, or overflow area. Do not rely only on topographic or NWI maps to show this; inspect while in field. The frequencies given are only approximate and are for a "normal" year. The inundation need not occur during the "growing season." See photographs in Appendix A of manual. [WS-,SR+,PR+,NR+,CS-,OE+,T+,FA+,FR+,Sens-]
The inflow and outflow from the wetland may be via a shallow ditch, pipe, or culvert, or as overbank flow in a floodplain (which counts as both an inlet and outlet). Do not rely only on topographic or NWI maps to show this; inspect while visiting the site.
If discharging groundwater in summer is warmer than ambient air temperature, answer "None of the above." [NR+,CS+,T+,POL+,INV+,FA+,AM+,HGM]
"Impeded" means causing a delay or reduction in water velocity or volume. "Major runoff events" would include biennial high water causes by storms and/or rapid snowmelt. [WS-,SR+,PR+,NR+,CS-,OE+,FA+,FR+,Sens-]
[HGM, Sens]
F20 Either the wetland has BOTH an inlet and outlet with seasonal or persistent surface flow, or the wetland is fringe or tidal. If so, enter "1" here and continue. If neither condition met, enter "0" here and then SKIP to F25 (Sheltering of Water).
Form FieldF version 2.0.2 April 2010

112
113
114
115
116
117
118
119
120
121122123124125126
127128129130131132133
134135136137138139140
A B C D EDuring peak annual flow, most of the surface water that flows through the AA:
encounters little or no vegetation, boulders, or other sources of friction, or no flowing water is present
0
mostly encounters herbaceous vegetation that offers little resistance, and water follows a fairly straight path from entrance to exit (few internal channels, only slight meandering)
0
mostly encounters herbaceous vegetation that offers little resistance and follows a fairly indirect path from entrance to exit (non-channelized flow or many internal channels, or very braided or tightly meandering)
0
encounters measurable resistance from fairly-rigid vegetation (e.g., cattail, bulrush, woody plants) or channel-clogging debris, and follows a fairly straight path from entrance to exit.
0
encounters measurable resistance from fairly-rigid vegetation (e.g., cattail, bulrush, woody species) or channel-clogging debris, and follows a fairly indirect path from entrance to exit.
0
F22 During most of the time open water is present in the AA, vegetated areas within the AA, where they are contiguous to open water, are:wider than the contiguous open water 0
narrower than the contiguous open water (i.e., fringe wetlands) 0
F23 The average width of vegetated area in the AA that separates adjoining uplands (if any) from contiguous open waters (if any) is:
>300 ft, or no contiguous upland or open waters (not even temporary) 0100-300 ft 025-100 ft 05-25 ft 0<5 ft 0
F24 The percent of the AA's water edge, if any, that has undercut banks that are partially visible above the water is:>75% 050-75% 025-50% 01-25% 0<1%, or no definable water edge is present 0cannot estimate 0
F25 At mid-day in summer, the area of surface water within the AA that is shaded by herbaceous or woody vegetation, incised channels, streambanks, or other features also present within the AA is:
>75% of the water 050-75% of the water 025-50% of the water 05-25% of the water 0<5% of the water 0(surface water is typically absent in summer or during low tide) 1
Sheltering of Water
Vegetated Zone Absolute Width
Throughflow Complexity
Vegetated Zone Relative Width
For tidal sites, consider the condition at mean low tide. For all sites, consider the aspect and surrounding topographic relief as well as vegetation height and density. [T+,FA+]
This mainly refers to surface water that moves between the inlet and outlet. Some judgment is required in assessing straight vs. indirect flow path. See diagram in Appendix A of the manual. [WS+,SR+,PR+,NR+,CS+,INV+,FA+,FR+,WBF+,WBN+]
open water = surface water that contains no vegetation (except perhaps floating-leaved or completely submersed species) when viewed from above. May include channels, ditches, ponded areas, regardless if seasonal, persistent, or temporary. For tidal areas, assess condition as it exists at mean high tide [SRv+,PRv+,NRv+, CS+,OE-,Sens-]
Note: For most sites larger than 10 acres and with persistent water, measure the width using aerial imagery rather than estimate in the field. For tidal areas, assess condition as it exists at mean high tide. [SR+,PR+,NR+, CS+,OE-,WBN+,Sens-]
Undercut Banks water edge= streambank (both sides) or other edge between open water and soil. undercut= indented such that surface water flows beneath a canopy layer of soil, tree roots, or sod. At tidal sites, assess this at mid-tide. [FA+,FR+,AM+]
F21
Form FieldF version 2.0.2 April 2010

141142143
144
145
146147
148
149150151152153154
155
156
157158
159
160
161
162163
A B C D EF26 The number of downed wood pieces thicker than 4 inches that remain only partly underwater
during most of the spring or early summer, thus potentially serving as basking sites for turtles, birds, or frogs, is:Several 0Few or none, or AA never has any surface water at that time 1
F27 Select all that apply: WDuring early summer the wetland contains a floating vegetation mat suitable for nesting birds and isolated from the shore by water depths >3 ft. Or AA is an island with similar isolation and a gently-sloping water edge that is mostly vegetated.
0
During early summer the wetland contains (or is) an island with a gently-sloping water edge, that is mostly bare and is isolated from the shore by water depths >3 ft.
0
Neither of above 1F28 The maximum extent of mudflats or unwooded shortgrass areas within the AA during shorebird
migration and wintering (generally August through through April (and for tidal AAs, during mean low tide) is usually:
none, or <100 sq. ft, and there are none that cover >10,000 sq. ft anywhere within 300 ft of the AA 0
none, or <100 sq. ft, but some that cover >10,000 are within 300 ft of the AA 1100-1000 sq. ft. within AA 01000 – 10,000 sq. ft. within AA 0>10,000 sq. ft within AA 0
F29 Which of the following is most true:Wind or boats frequently generate waves of >1 ft near the AA, those waves are intercepted by the wetland, and structures behind the AA are protected from wave erosion
0
Wind or boats frequently generate waves of >1 ft near the AA, those waves are intercepted by the wetland, but there are no structures behind the wetland
0
Neither wind nor boats frequently generate waves of >1 ft near the AA 1
Select all that apply:a regularly-used boat dock is present within or contiguous to the AA 0
a regularly-used boat dock is not within the AA, but there is one within 300 ft of the AA and there is a persistent or tidal surface connection between the dock and the AA
0
large ships that empty ballast water are regularly present in nearby contiguous waters 0
the AA has a persistent or tidal surface water connection (>9 mos./yr, via ditch, pipe, channel, tidegate, or floodplain) to a nearby perennial stream, river, lake, or estuary
0
none of the above 1
Vectors for Waterborne Pests
Waves
Shorebird Feeding Habitats
For tidal sites, consider the condition at mean high tide. Only the wood that is at or above the water surface is assessed because of the impracticality of assessing underwater wood accurately when using a rapid assessment method. [FA+,FR+,AM+,WBF+,SBM+]
Abovewater Wood
Islands
F30
These areas must have (a) no vegetation (bare/ fallow), or herbaceous cover comprised mainly of grasses shorter than 4 inches during some part of this period, and (b) soils are saturated or are covered with <1" of water during some part of this period, and (c) no detectable surrounding slope (e.g., not the bottom of an incised dry channel), and (d) no substantial areas of shrubs or trees. See photograph in Appendix A of manual.This addresses needs of most migratory sandpipers, plovers, stilts, avocets, curlews, and godwits. [WBF+]
Erosive wave conditions often occur where adjoining open water has a fetch (uninterrupted distance) of greater than approximately 1 mile in the direction of the strongest and most frequent wind. [SRv+, PD-, STR+]
island = terrestrial or wetland area larger than 400 sq.ft, and smaller than 1 sq. mi, and separated from "mainland" by water deeper than 3 ft over a distance of >50 ft during early summer. [AM+,WBF+,WBN+]
[SRv+, FA-,FR-,AM-,PD-,STR+]
Form FieldF version 2.0.2 April 2010

164165166
167
168169
170
171
172
173
174
175
176177178179180
181182
183184185186
187
188189
A B C D EThe following are known or likely to have reproducing populations in this AA, its wetland, or in water bodies within 300 ft that connect to the AA at least seasonally . Select all that apply:
non-native amphibians (e.g., bullfrog) or reptiles (e.g., red-ear slider) 0carp 0other non-native fish (e.g., bass, gambusia, walleye, crappie, brook trout) 0
non-native invertebrates (e.g., New Zealand mudsnail, mitten crab, rusty crayfish) 0
nutria 0none of above, or unknown 1
F32 Ice-free During most years, most of the AA's surface water does not freeze, or freezes for fewer than 4 continuous weeks, or surface water is absent most winters.
0 [WS+,PR+,NR+,CS+,OE+,FR+,WBF+,Sens-]
0
F34 No Scum During most summers, less than 80% of the AA's water surface is covered by floating algae, duckweed, and other non-rooted aquatic plants, AND no major fish kills occur. If no surface water is present in summer, mark "1" in column D.
0 If wetland can be visited only during winter, it may not be possible to answer this question with much certainty unless local sources are contacted or indicators (e.g., dried remains of algae) are found. [PR+,FA+,PD+,CQ+]
SAV (submerged & floating-leaved aquatic vegetation) occupies an annual maximum of:
>95% of the surface water area 050-95% of the surface water area 025-50% of the surface water area 05-25% of the surface water area 0<5% of the surface water area. Mark "1" here and SKIP TO F39 (Herbaceous Extent). 1
F36 The areal cover of SAV at mid-summer is comprised of:mostly invasive SAV species (see list in column E). Mark "1" here and underline the species in column E. Then SKIP to F39.
0
mostly non-invasive species 0impossible to tell 0
F37 Considering just the SAV species that are native:one or two of those species together comprise >50% of the SAV cover. Mark "1" here and write names of dominant species in column E.
0
no two of the native SAV species together comprise >50% of the SAV cover 0
impossible to tell 0
SAV Native Species Dominance
Submerged & Floating-leaved Aquatic Vegetation (SAV)
SAV Invasive vs. Non-invasive Cover
For F32 to 34, if the statement is true, enter a "1" in column D. Otherwise that should be a "0"
[PD-, CQ-, Sens-]
During most of the summer , the AA contains more than 0.25 acre of ponded non-tidal surface water that is deeper than 1 ft, or is within 300 ft of such an area and the intervening habitat is not developed (roads, etc.). Or nesting within the AA by ducks, geese, or swans has been proven.
SAV = herbaceous plants that characteristically grow at or below the water surface, i.e., whose leaves are primarily and characteristically under or on the water surface during most of the part of the growing season when surface water is present. Some species are rooted in the sediment whereas others are not. If pond lily (Nuphar ) is the predominant species, consider its maximum extent only during the period when surface water is present beneath the leaves. For tidal sites, consider the condition during mean high tide. [INV+,FA+,FR+,AM+,WBF+,PDc,CQc,SENSc]
F35
Non-native Aquatic Animals
Ponded ThresholdF33
Invasive SAV species include: Egeria densa (Brazilian elodea), Hydrilla verticillata , Myriophyllum aquaticum (parrotfeather watermilfoil), Cabomba caroliniana (fanwort), Nymphaea odorata (white pondlily). For known distributions of these in your county, see: http://www.weedmapper.org/maps.html [PD-,CQ-,Sens-]
Assume non-native fish to be present if wetland is associated with a nearby reservoir, fish pond, or perennial stream flowing through an agricultural or residential area. Assume bullfrog, nutria, and/or carp to be present if (a) the AA contains persistent water or is flooded seasonally by an adjoining body of permanent water, and (b) not a forested wetland, and (c) in western Oregon, elevation is lower than about 3000 ft. In the ORWAP_SuppInfo file, see Inverts_Exo worksheet for more complete list of non-native invertebrates or Oregon, and WetVerts worksheet for more complete list of fish that are not native to Oregon. You may also consult: http://nas.er.usgs.gov/queries/default.aspx http://www.dfw.state.or.us/conservationstrategy/invasive_species.asp [INV-,FA-,FR-,AM-,CQ-]
F31
[WBN+]
Form FieldF version 2.0.2 April 2010

190
191
192193
194
195196197198199
200
201202203204205
206
207
208
209210211
212
213
214215216
217
A B C D EOf all the SAV species in this AA:all are species that are common among Oregon's wetlands and lakes. 0at least one native species is a SAV plant that is not common among Oregon's wetlands and lakes, and it covers >1% of the SAV area or >100 sq. ft. See file ORWAP_SuppInfo, worksheet P_UnCom. Mark "1" in next column and write names of the species in column E.
0
impossible to tell 0
F39 The areal cover of herbaceous plants during mid-summer is:
>95% of the vegetated part of the AA 150-95% of the vegetated part of the AA 025-50% of the vegetated part of the AA 05-25% of the vegetated part of the AA 0<5% of the vegetated part of the AA. Mark "1" here and SKIP TO F44 (Woody Extent). 0
F40 When the areal cover of herbaceous plants is at an annual maximum, those plants are:
overwhelmingly graminoids (>80% cover of grasslike plants) 1mostly graminoids (50-80% cover) 0mostly non-graminoids (e.g., forbs, ferns) (50-80%) 0overwhelmingly (>80%) non-graminoids 0
F41 The maximum annual areal cover of herbaceous plants is:
overwhelmingly (>80% cover) non-native species, of which >10% are species considered invasive (see column E). Mark "1" in next column and write names of dominant invasive species in column E. Then SKIP to F43.
0
overwhelmingly (>80% cover) non-native species, but <10% are considered invasive (see column E). Mark "1" in next column and write names of dominant non-native species in column E. Then SKIP to F43.
0
mostly (50-80%) non-native species, regardless of invasiveness. Mark "1" and SKIP to F43. 0
mostly (50-80%) native species 0overwhelmingly (>80%) native species 1
F42 Of just the herbaceous (forb and graminoid) species that are native:one or two native species together comprise >50% of the areal cover of native herbaceous plants at any time during the year. Mark "1" in next column and write names of dominant native species in column E.
1
no two of the native species together comprise >50% of the areal cover of native herbaceous plants
0
F43 Of all the herbaceous species in this AA:all are species that are common among Oregon's wetlands. 1at least one native species is not common among Oregon's wetlands and it covers >1% of the AA's herbaceous area or >100 sq. ft (either contiguous or scattered). See file ORWAP_SuppInfo, worksheet P_UnCom. Mark "1" in next column and write names of the species in column E.
0
Herbaceous Species Dominance
Herbaceous Extent
Graminoid vs. Forb Cover
Herbaceous Native vs. Non-native Cover
Herbaceous Plant Species Ubiquity
SAV Species Ubiquity
Note: In the next 4 questions, "herbaceous" does not include SAV or herbaceous plants growing under a woody canopy, unless that canopy covers >80% of the vegetated part of the AA. If the AA is farmed, estimate herbaceous cover (including crops) as it would exist under maximum cover conditions during the majority of the last 5 years.
F38 [PD-, CQ-, Sens-]
This question and several others (F37, 38, 42, 48, 49) are used as "placeholders" until a Floristic Quality Assessment index can be developed for Oregon. Much information on distribution and frequencies of plant species is available from the Oregon Flora Project: www.oregonflora.org/ [POL-,PD-,CQ-,Sens-]
graminoids= grasses, sedges, rushes, reeds, burreed, cat-tail, and other grasslike plants . Remember to focus only on plants not beneath a woody canopy, unless that canopy occupies >80% of the AA. If possible this should be assessed during mid-summer. [POLL-]
In the file ORWAP_SuppInfo, see P_Invas worksheet for list of invasives and P_Exo for non-native species list. For known distributions of invasive plants in your county, see: http://www.weedmapper.org/maps.html Remember to focus only on plants not beneath a woody canopy. [POL-,PD-,CQ-,Sens-]
Remember to focus only on plants not beneath a woody canopy. [POL-,PD-,CQ-,Sens-]
herbaceous = forbs, graminoids, ferns, liverworts, moss. Can include crops. Do not include submersed and floating-leaved aquatics (SAV) in the category of "herbaceous", or when defining the "vegetated part" of the site. Note: For sites larger than 10 acres, this should be determined from aerial imagery rather than estimated in the field. [POLc,INV+,WBF+,WBN+,PDc, CQc,SENSc]
Form FieldF version 2.0.2 April 2010

218219220221222223
224
225226227228
229
230
231
232
233234
235
236
237238239240
241
242243244
245
A B C D EF44 Within the AA, woody vegetation (shrubs, trees, woody vines) occupies:
>95% of the vegetated part of the AA 050-95% of the vegetated AA 025-50% of the vegetated AA 05-25% of the vegetated AA 0<5% of the vegetated AA 1
F45 Where surface water is present during the wettest time of year , the AA's woody vegetation occupies:>95% of the area within 100 ft of the surface water 0
50-95% of the area within 100 ft of surface water 025-50% of the area within 100 ft of surface water 05-25% of the area within 100 ft of surface water 0<5% of the area within 100 ft of surface water; mark "1" here. If F44 is also <5%, then SKIP TO F50 (Woody Diameter Classes).
1
F46 The woody vegetation (if any) within the AA is:
clumped in fairly distinct bands or patches mostly separate from herbaceous vegetation, and most patches or bands are large (>1 acre including contiguous upland woody veg). Or nearly the entire AA is wooded. Isolated shrubs or trees are few.
0
clumped in fairly distinct bands or patches mostly separate from herbaceous vegetation, and most patches are small (<1 acre including contiguous upland woody veg).
0
dispersed quite evenly amid the herbaceous vegetation, in many small patches, or many isolated shrubs or trees.
0
F47 Within parts of the AA having shrubs or woody vines, the areal cover is: overwhelmingly (>80%) non-natives that are categorized as invasive (see column E). Mark "1" in next column and write names of dominant invasives in column E. Then SKIP to F49.
0
overwhelmingly other non-natives. Mark "1" in next column and write names of dominant non-native shrubs/ vines in column E. Then SKIP to F49.
0
mostly (50-80%) non-natives. Mark "1" in next column and write names of dominant non-native shrubs/ vines in column E. Then SKIP to F49.
0
mostly (50-80%) natives 0overwhelmingly (>80%) natives 0
F48 Of just the shrub & woody vine species that are native:one or two of the native species together comprise >80% of the native shrub & vine cover. Mark "1" in next column and write names of dominant species in column E.
0
no two of the native species together comprise >80% of the native shrub & vine cover 0
F49 Of all the shrub & woody vine species in this AA:all are species that are common among Oregon's wetlands. 0at least one native species is not common among Oregon's wetlands and it covers >1% of the AA or >100 sq. ft See file ORWAP_SuppInfo, worksheet P_UnCom. Mark "1" in next column and write species in column E.
0
Shrub & Vine Species Dominance
Shrub & Vine Species Ubiquity
Woody Extent Along Water Edge
Cover of Woody Invasives
Woody Distribution
Woody Extent Within the AA
[POL-,PD-,CQ-,Sens-]
Note: For sites larger than 10 acres, this should be determined from aerial imagery rather than estimated only in the field. Vines are twining or climbing plants with relatively long stems, and can be either woody or herbaceous. Include Himalayan blackberry. [CS+,POLc,SBM+,PDc,CQc,SENSc]
[SBM+]
"contiguous to" means separated by less than one tree height. The separation may be caused by herbaceous vegetation, persistent water, roads, buildings, or bare soil, but not shrubs. [SBM+, CQ+, Sens+]
In the file ORWAP_SuppInfo, see P_Invas worksheet for list of invasives and P_Exo for non-native species list. Woody invasives include: Hedera helix, Ailanthus altissima, Buddleja spp., Cytisus spp., Rubus armeniacus (discolor), Rubus laciniatus, Tamarix spp., Umbellularia californica, Robinia pseudoacacia. For known distribution of some invasives in your county see: http://www.weedmapper.org/maps.html [POL-,PD-,CQ-,Sens-]
[POL-,PD-,CQ-,Sens-]
Form FieldF version 2.0.2 April 2010

246247248249250251252253254255256257
258
259260261262263264
265
266
267268269270
271272273274275276
277278279
A B C D EF50 Select all the types occupying >5% of the wooded part of the AA or >5% of its wooded upland
edge if any. deciduous 1-4" diameter and >3 ft tall 0evergreen 1-4" diameter and >3 ft tall 0deciduous 4-9" diameter 0evergreen 4-9" diameter 0dead standing 4-9" diameter 0deciduous 9-21" diameter 0evergreen 9-21" diameter 0dead standing 9-21" diameter 0deciduous >21" diameter 0evergreen >21" diameter 0dead standing >21" diameter 0Lacks woody vegetation, or none of above occupy >5% of the wooded part of the AA or 5% of the length of the upland edge.
1
F51 Within the vegetated part of the AA, the cover of nitrogen-fixing plants (e.g., alder, sweetgale, legumes) is:<1% or none 11-25% 025-50% 050-75% 0>75% 0
F52 The percent of the vegetated part of the AA, excluding areas that are never inundated , which contains one or more of these plants: Alisma spp., Beckmannia spp., Polygonum spp. (natives only), Potomogeton (Stuckenia) spp., Ruppia spp., Sagittaria spp., Sparganium spp., Zostera spp., is:
<1% or none, and none are known to occur commonly within the same wetland or within 300 ft of this AA
1
<1% or none, but some are known to occur commonly within the same wetland or within 300 ft of this AA
0
1-10% 010-50% 0>50% 0
F53 The last time that >5% of the AA's vegetation cover was burned or harvested for hay or timber was:0-12 months ago, and this occurs almost annually within part of the AA 00-12 months ago, but was not an annual (or near-annual) event 01-5 years ago 0>5 years ago, or never 0unknown 1
F54 Within the stratum (herbaceous, shrub, or tree) that covers the most onsite area, the wetland plants during maximum annual cover condition are mostly:
of nearly uniform height (+ or - 20% of average) 1of very diverse heights (e.g., short & tall forbs, short & mid-height grasses) 0
History of Fire or Vegetation Removal
Height Uniformity of Dominant Stratum
N Fixers
Waterfowl Food Plants
Woody Diameter Classes wooded upland edge= where woody plants are located within one tree-height of the wetland-upland boundary. Measurements are the d.b.h., which is the tree diameter at 4.5 ft above the ground. If visited only in winter, consider "dead standing trees" to be those that are mainly without bark. Include woody vines such as Himalayan blackberry. [CS+,POL+,INV+,AM+,WBN+,SBM+,Sens+]
[WBF+,WBN+]
[PR-,NR-,CS-,OE+,POL-,WBF+,PD+]
e.g., If dominantly herbaceous, then "diverse heights" might include both short and tall forbs, some non-woody vines, and mid-height graminoids. See photograph of a vertically diverse herbaceous stratum in Appendix A of manual. [POL+,INV+,WBN+,SBM+, PD+]
For a more complete list see file ORWAP_SuppInfo, worksheet NFIX. Do not include algae.
Form FieldF version 2.0.2 April 2010

280
281
282
283
284
285
286
287
288
289290291
292
293
294
295
296
297298299
300301
302303
A B C D EF55 Consider the parts of the AA that usually are not inundated in May, or are inundated by tides at
least once annually. Viewed from 6 inches above the soil surface , the condition in most of this area during May is:little or no (<5%) bare ground or plant litter (thatch) is visible between erect stems or under canopy. This can occur if ground surface is extensively blanketed by moss, graminoids with great stem densities, or plants with ground-hugging foliage.
0
some (5-20%) bare ground or litter is visible. Herbaceous plants have moderate stem densities and do not closely hug the ground.
1
much (20-50%) bare ground or plant litter is visible. Low stem density and/or tall plants with little near-ground foliage. May be mostly woody plants, woody vines, cattail, bulrush, sparse annuals.
0
mostly (>50%) bare ground or accumulated plant litter. Or, during May the entire AA is constantly under water.
0
F56 Most of the edge between the wetland and upland is (select one): W
Linear: a significant proportion of the wetland's upland edge is straight, as in wetlands bounded by partly or wholly by dikes or roads
0
Convoluted: Wetland perimeter is many times longer than maximum width of the wetland, with many alcoves and indentations ("fingers")
0
Intermediate: Wetland's perimeter either (a) is only mildly convoluted, or (b) mixed -- contains about lengths of linear and convoluted segments.
1
F57 The extent of inclusions of upland within the AA (as indicated by their topography, plants, and/or soils) is:Many (e.g., wetland-upland "mosaic") 0Few or none 1
F58 The composition of the soil in the soil pit at the ground surface (uppermost soil layer and excluding the duff layer, see protocol in ORWAP Manual, section 2.3.2 ) is:
duff layer= leaves, woody material, and live or dead roots, moss that has undergone partial decomposition. [PR,NR,CS,OE, PD, Sen]
Loamy : includes silt, silt loam, loam, sandy loam 0
Clayey : includes clay, clay loam, silty clay, silty clay loam, sandy clay, sandy clay loam 1
Organic : includes muck, mucky peat, peat, and mucky mineral 0
Coarse : includes sand, loamy sand, gravel, cobble, stones, boulders, fluvents, fluvaquents, riverwash
0
F59 The number of downed wood pieces longer than 6 ft and with diameter >6", and not persistently submerged, is:Several ( >5 if AA is >10 acres, or >2 for smaller AAs) 0Few or none 1
F60 The number of animal burrows, mounds, hummocks, boulders, upturned trees, islands, natural levees, dry channels, pits, wide soil cracks, and microdepressions (in parts of the AA that lack persistent water) is:Several (extensive micro-topography) 0Few or none (minimal microtopography; <1% of the area that isn't persistently inundated); e.g., many flat sites having a single hydroperiod
1
Intermediate 0
Downed Wood
Soil Composition in the Soil Pit
Upland Edge Shape Complexity
Upland Inclusions
Bare Ground & Accumulated Plant Litter
Ground Irregularity
See illustrations in Appendix A of the ORWAP manual . [NR+,SBM+]
[NR+,AM+,SBM+]
Estimates of "plant litter" cover should include only the litter and woody debris that would be visible from a height of 6 inches above the soil surface. Emphasis should be on plant litter that has remained from prior years ("thatch"), not recent. Erect plant stems should not be counted as plant litter, even if dead. "Bare ground" that is present under a tree or shrub canopy should be counted. It includes unvegetated soil, rock, sand, or mud between stems if any. See photographs in Appendix A of manual for examples. Wetlands that are dominated by annual plant species tend to have more extensive areas that are bare or covered only by plant litter, during minimum annual cover conditions. [SR-,PR-,NR-,CS-,OE-,POL-,INV-.AM-,SBM-,Sens+]
include driftwood. [POL+,INV+,AM+,SBM+]
"microtopography" refers mainly to vertical relief of <1 m and is represented only by inorganic features, except where plants have created depressions or mounds of soil. See photographs in Appendix A of manual for examples. [WS+,SR+,PR+,NR+,CS+,POL+,INV+,AM+,SBM+,PD+]
Form FieldF version 2.0.2 April 2010

304305306307
308
309
310
311
312313314315316317318319320321322
323324325
326
327
328
329
330331
A B C D EF61 The gradient along most of the AA's water flow paths (both sheet and channel flow) is:
>10% 06-10% 02-5% 0Flat (<2%, no slope or flow is ever apparent, or AA is an estuarine fringe wetland). Includes most depressional sites
1
F62 Fish Access From Offsite Small fish (e.g., stickleback, minnow) from elsewhere in the watershed can access part of this AA for at least 2 days during most years or are known to already be present onsite.
0 Although incomplete, the species maps may be helpful at: http://map.streamnet.org/ or http://query.streamnet.org/ [INV-,FA+,FR+,AM-,WBF+]
F63 Nesting or Roosting Structures
Within the AA or within its wetland or within 300 ft of AA, there are bridges, buildings, caves, or ledges with openings/ crevices, well-maintained bird or bat boxes, elevated platforms, or other artificial structures suitable for nesting by some native bird or bat species.
0 e.g., open buildings for barn swallows, bridges for cliff swallows, wood duck boxes, goose nesting platforms, sheltered places for bees and wasps [POL+,SBM+]
F64 Cliffs, Banks, or Beaver In the AA or within its wetland or within 100 ft of the AA, there are elevated terrestrial features such as cliffs, stream banks, excavated pits, or pumice walls (but not riprap) that extend at least 6 ft nearly vertically, are unvegetated, and potentially contain crevices or other substrate suitable for nesting or den areas. Or there is evidence that beaver have used this AA (e.g., gnawed limbs).
0 [POL+,SBM+]
F65 The maximum percent of the wetland that is visible from the best vantage point on public roads, public parking lots, public buildings, or public paved paths that adjoin or are within 300 ft of the AA (select one) is:>50% 125-50% 0<25% 0
F66 Most of the AA is (select one):in public ownership 0in private ownership 1
F67 For most of the AA, permission for access is normally given or allowed:to anyone, mostly unrestricted 0to anyone, but significant restrictions (e.g., limited dates, permit required) 0only on a case-by-case basis, but with few other restrictions 0only on a case-by-case basis, with restrictions (e.g., limited dates, permit required) 0
seldom or never 1(do not know) 0
F68 Assuming access permission was granted, select all statements that are true of this AA as it currently exists:Walking is physically possible in >5% of the AA during most of year, e.g., free of deep water and dense shrub thickets
1
All or part of the AA (or an area within sight of the AA and within 100 ft) would be physically accessible to people in wheelchairs, e.g., paved and flat
0
Maintained roads, parking areas, or foot-trails are within 30 ft of the AA, or the AA can be accessed most of the year by boat
0
F69 Plants, animals, or water in the AA have been monitored for >2 years, unrelated to any regulatory requirements, and data are available to the public. Or the AA is part of an area that has been designated by an agency or institution as a benchmark, reference, or status-trends monitoring area.
0
(do not know) 0
Ownership
Public Access
Sustained Scientific Use
Non-consumptive Uses - Actual or Potential
Internal Gradient
Visibility
[PU+]
[PU+]
[PU+]
In all cases, this question assumes that permission for access may be limited to certain activities. [PU+]
[PU+]
Except in isolated wetlands (no outlets), this is not the same as the shoreline slope. It is the elevational difference between highest and lowest points within the site, divided by the flow-distance between them and converted to percent. If most of the surface water is impounded within the site, the gradient is the gradient of the water surface, not the gradient of the submerged substrate. See diagram in Appendix A. If available, use a clinometer to measure this. [WS-,SR-,PR-,NR-,CS-,OE+,AM-,WBF-,WBN-]
Form FieldF version 2.0.2 April 2010
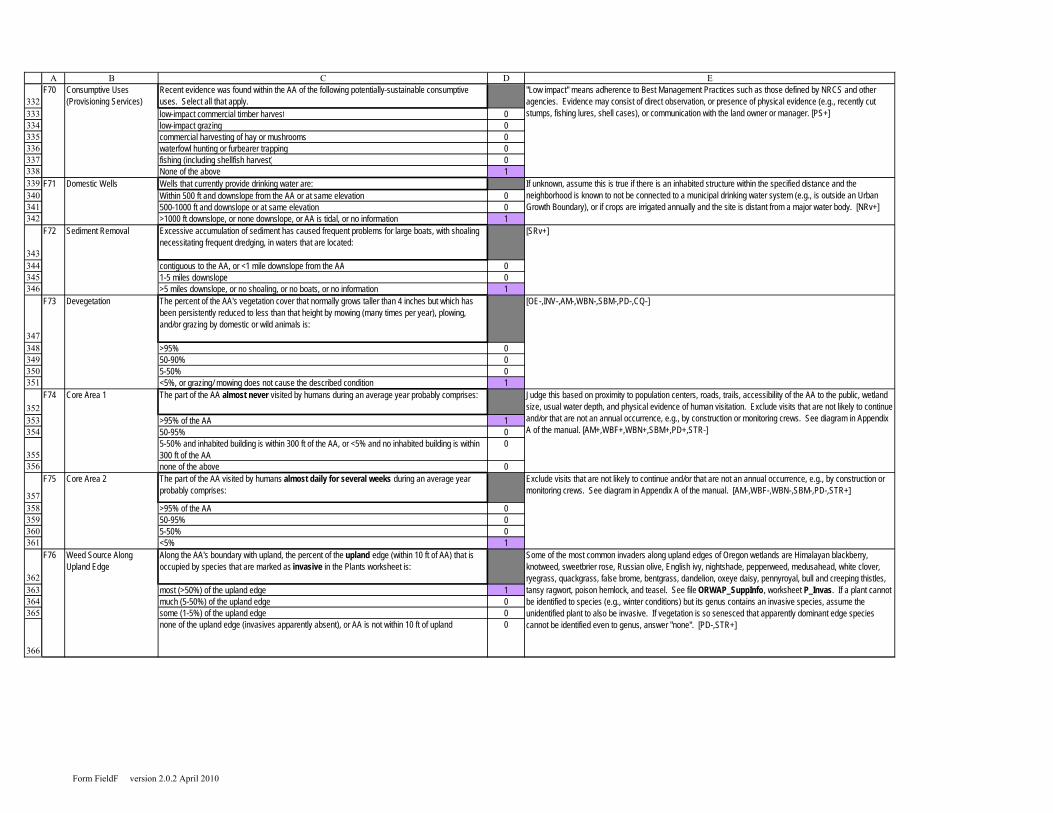
332333334335336337338339340341342
343344345346
347348349350351
352353354
355356
357358359360361
362363364365
366
A B C D EF70 Recent evidence was found within the AA of the following potentially-sustainable consumptive
uses. Select all that apply.low-impact commercial timber harvest 0low-impact grazing 0commercial harvesting of hay or mushrooms 0waterfowl hunting or furbearer trapping 0fishing (including shellfish harvest) 0None of the above 1
F71 Wells that currently provide drinking water are:Within 500 ft and downslope from the AA or at same elevation 0500-1000 ft and downslope or at same elevation 0>1000 ft downslope, or none downslope, or AA is tidal, or no information 1
F72 Excessive accumulation of sediment has caused frequent problems for large boats, with shoaling necessitating frequent dredging, in waters that are located:
contiguous to the AA, or <1 mile downslope from the AA 01-5 miles downslope 0>5 miles downslope, or no shoaling, or no boats, or no information 1
F73 The percent of the AA's vegetation cover that normally grows taller than 4 inches but which has been persistently reduced to less than that height by mowing (many times per year), plowing, and/or grazing by domestic or wild animals is:
>95% 050-90% 05-50% 0<5%, or grazing/ mowing does not cause the described condition 1
F74 The part of the AA almost never visited by humans during an average year probably comprises:
>95% of the AA 150-95% 05-50% and inhabited building is within 300 ft of the AA, or <5% and no inhabited building is within 300 ft of the AA
0
none of the above 0F75 The part of the AA visited by humans almost daily for several weeks during an average year
probably comprises:
>95% of the AA 050-95% 05-50% 0<5% 1
F76 Along the AA's boundary with upland, the percent of the upland edge (within 10 ft of AA) that is occupied by species that are marked as invasive in the Plants worksheet is:
most (>50%) of the upland edge 1much (5-50%) of the upland edge 0some (1-5%) of the upland edge 0none of the upland edge (invasives apparently absent), or AA is not within 10 ft of upland 0
Domestic Wells
Devegetation
Consumptive Uses (Provisioning Services)
Core Area 2
Weed Source Along Upland Edge
Core Area 1
Sediment Removal
If unknown, assume this is true if there is an inhabited structure within the specified distance and the neighborhood is known to not be connected to a municipal drinking water system (e.g., is outside an Urban Growth Boundary), or if crops are irrigated annually and the site is distant from a major water body. [NRv+]
"Low impact" means adherence to Best Management Practices such as those defined by NRCS and other agencies. Evidence may consist of direct observation, or presence of physical evidence (e.g., recently cut stumps, fishing lures, shell cases), or communication with the land owner or manager. [PS+]
[SRv+]
[OE-,INV-,AM-,WBN-,SBM-,PD-,CQ-]
Judge this based on proximity to population centers, roads, trails, accessibility of the AA to the public, wetland size, usual water depth, and physical evidence of human visitation. Exclude visits that are not likely to continue and/or that are not an annual occurrence, e.g., by construction or monitoring crews. See diagram in Appendix A of the manual. [AM+,WBF+,WBN+,SBM+,PD+,STR-]
Exclude visits that are not likely to continue and/or that are not an annual occurrence, e.g., by construction or monitoring crews. See diagram in Appendix A of the manual. [AM-,WBF-,WBN-,SBM-,PD-,STR+]
Some of the most common invaders along upland edges of Oregon wetlands are Himalayan blackberry, knotweed, sweetbrier rose, Russian olive, English ivy, nightshade, pepperweed, medusahead, white clover, ryegrass, quackgrass, false brome, bentgrass, dandelion, oxeye daisy, pennyroyal, bull and creeping thistles, tansy ragwort, poison hemlock, and teasel. See file ORWAP_SuppInfo, worksheet P_Invas. If a plant cannot be identified to species (e.g., winter conditions) but its genus contains an invasive species, assume the unidentified plant to also be invasive. If vegetation is so senesced that apparently dominant edge species cannot be identified even to genus, answer "none". [PD-,STR+]
Form FieldF version 2.0.2 April 2010

367368369370371372
373374375376377
378379380
381382383384385
386387388389390391
392
393394395396
A B C D EF77 Within 100 ft upslope of the AA's wetland-upland boundary, the percent of the upland that
contains natural (not necessarily native) land cover is:
>90%, or there is no upland boundary 160 to 90% 030 to 60% 05 to 30% 0<5% 0
F78 Within 100 ft upslope of the AA's wetland-upland boundary, the upland land cover that is not natural (as defined above) is mostly:
impervious surface, e.g., paved road, parking lot, building, exposed rock 0bare pervious surface, e.g., dirt road, dike, dunes, recent clearcut, landslide 1cultivated row crops or orchard 0artificially landscaped areas or lawn 0grain fields, or grassland grazed or mowed to a height usually shorter than 4 inches 0
other 0(buffer is >90% natural land cover or AA occupies all of an island) 0
F79 Along the AA's wetland-upland boundary and extending 100 ft uphill, the slope of the land is mostly:<1% (flat -- almost no noticeable slope, or there is no upland boundary) 02-5% 15-30% 0>30% 0
F80 Within 10 ft of ponded surface water (if any) in early summer, the percent of the herbaceous area (wetland or upland) that has a gentle or moderate slope (less than 5% slope) is:
>75% 050-75% 025-50% 01-25% 0<1%, 0 (ponded surface water in early summer covers <1% of AA, or AA is tidal, or no herbaceous vegetation is present near ponded water)
1
F81 How likely is it that any or all of this AA will persist as a wetland (not necessarily of the same type) if an existing dike or berm, water control structure (e.g., dam, weir), or pumping/ diversion system that now helps sustain it -- and is within 1 mile of the AA -- was removed or became inoperable?
Very likely, or no such feature is present (greater sustainability potential) 1Somewhat likely -- part but not all of the AA would remain a wetland 0Unlikely or not at all (lower sustainability potential) 0
Natural Land Cover in Buffer
Independently Sustainable Hydrology
Buffer Slope
Edge Slope
Type of Land Cover Alteration in Buffer
[INV-,FA-,AM-,WBN-,SBM-,PD-,STR+]
See diagram in Appendix A of the manual. If several isolated pools are present in early summer, estimate the percent of their collective shorelines that has such a gentle slope. [AM-,WBN-]
If all such human activities and structures disappeared, would the site still be a wetland? [WSv,SRv,PRv,NRv,INVv,AMv,WBFv,WBNv,SBMv,PDv+]
Natural land cover includes wooded areas, sagebrush, vegetated wetlands, prairies, as well as relatively unmanaged commercial lands such as hayfields, lightly grazed pastures, and most rangeland. It does not include water, row crops (vegetable, orchards, Christmas tree farms), residential areas, lawn, pavement, bare soil, gravel or dirt roads. Natural land cover is not the same as native vegetation or undisturbed soil. It frequently includes a dominance of non-native plants (e.g., ryegrass, Himalayan blackberry). If the entire site is an island without an upland edge, select the last choice. [POL+,INV+,FA+,FR+,AM+,WBN+,SBM+,PD+,Sens-]
See diagram in Appendix A of the manual. If the described area contains a disturbance feature, estimate instead the slope between the wetland-upland boundary and the most extensive such feature. Disturbance feature = building, paved area, recently cleared area, dirt road, lawn, intensely grazed pasture, orchard, vineyard, annually-harvested row crops [Sens+]
Form FieldF version 2.0.2 April 2010

Site Name: Investigator: Date:
Severe (3 points) Medium (2 points) Mild (1 point) Pts
Spatial extent of resulting wetter condition >95% of AA or >95% of its upland edge (if any)
5-95% of AA or 5-95% of its upland edge (if any)
<5% of AA and <5% of its upland edge (if any)
0
When most of AA's wetter condition began <3 yrs ago 3-9 yrs ago 10-100 yrs ago 0
Score the following 2 rows only if the wetter conditions began within past 10 years, and only for the part of the AA that got wetter.
Inundation now vs. previously persistent vs. seldom persistent vs. seasonal slightly longer or more often 0
Average water level increase >1 ft 6-12" <6 inches 0
sum= 0
final score= 0
Severe (3 pts) Medium (2 pts) Mild (1 pt) Pts
Spatial extent of resulting wetter condition >20% of the AA 5-20% of the AA <5% of the AA 0
When most of AA's wetter condition began <3 yrs ago 3-9 yrs ago 10-100 yrs ago 0
Score the following 2 rows only if the wetter conditions began within past 10 years, and only for the part of the AA that got wetter.
Inundation now vs. previously persistent vs. seldom persistent vs. seasonal slightly longer or more often 0
Average water level increase >1 ft 6-12" <6 inches 0
sum= 0final score= 0
S1
S2
changes not related directly to humans, e.g., beaverIf any items were checked above, then for each row of the table below, assign points (3, 2, or 1) in the last column that describe the combined maximum effect of those items in creating a wetter water regime that still persists in the AA. To estimate that, contrast it with the condition if checked items never occurred or were no longer present. The sum and final score will computeautomatically.
If any items were checked above, then for each row of the table below, assign points (3, 2, or 1) in the last column that describe the combined maximum effect of those items in creating a wetter water regime in the AA. To estimate that, contrast it with the condition if checked items never occurred or were no longer present.
Wetter Water Regime - Internal CausesIn the last column, place an X next to any item that is likely to have caused a part of the AA to be inundated more extensively, more frequently, more deeply, and/or for longer duration than it would be without that item or activity. (The items you check are not used automatically by ORWAP. They are included simply so they may be considered when evaluating the factors in the table beneath them).
an impounding dam, dike, levee, weir, berm, road fill, or tidegate -- within or downgradient from the AA, or raising of outlet culvert elevation.
plugging of ditches or drain tile that otherwise would drain the AA (as part of intentional restoration, or due to lack of maintenance, sedimentation, etc.)
excavation within the AA, e.g., artificial pond, dead-end ditch
vegetation removal (e.g., logging) within the AA
Field S data form. ORWAP version 2.0.2 May 2012
0 if Sum= 0, (1 pt) if Sum= 1-4. (2 pt) if 5-6. (3 pt) if 7-8. (4 pt) if 9-10. (5 pt) if >10.
0 if Sum= 0, (1 pt) if Sum= 1-4. (2 pt) if 5-6. (3 pt) if 7-8. (4 pt) if 9-10. (5 pt) if >10.
excavation or reflooding of upland soils that adjoined the AA, thus expanding the area of the AA
removal of a water control structure or blockage in tributary upstream from the AA
compaction (e.g., ruts) and/or subsidence of the AA's substrate as a result of machinery, livestock, or off road vehicles
changes in the CA that are not related directly to humans, e.g., channel migration, landslides, forest die-offs, seismic activity
removal of timber or phreatophytes in the CA or along the AA's tributaries
In the last column, place an X next to any item occurring in the CA (including channels flowing into the AA) that is likely to have caused a part of the AA to be inundated more extensively, more frequently, more deeply, and/or for longer duration than it would be without that item or activity. Remember that if the AA is flooded as little as once every 2 years by river flow, the CA includes all upstream areas of that river.
pavement, ditches, or drain tile in the CA that incidentally increase the transport of water into the AA
* Score these 2 rows only for the part of the AA that got wetter, and only if the wetter conditions began within past 10 yrs
Wetter Water Regime - External Causes
subsidies from stormwater, wastewater effluent, septic system leakage, or irrigation water (direct or via seepage)
* Score this row only for the part of the AA that got wetter, and only if the wetter conditions began within past 10 yrs
Form FieldS version 2.0.2 April 2010

Drier Water Regime - Internal Causes
Severe (3 pts) Medium (2 pt) Mild (1 pt)
Spatial extent of AA's resulting drier condition >95% of AA or >95% of its upland edge (if any)
5-95% of AA or 5-95% of its upland edge (if any)
<5% of AA and <5% of its upland edge (if any)
0
When most of AA's drier condition began <3 yrs ago 3-9 yrs ago 10-100 yrs ago 0
Score the following 2 rows only if the drier conditions began within past 10 years, and only for the part of the AA that got drier.Inundation now vs. previously seldom vs. persistent seasonal vs. persistent slightly shorter or less often 0
Water level decrease >1 ft 6-12" <6 inches 0
sum= 0final score= 0
Severe (3 pts) Medium (2 pts) Mild (1 pt)Spatial extent of AA's resulting drier condition >20% of the AA 5-20% of the AA <5% of the AA 0
When most of AA;s drier condition began <3 yrs ago 3-9 yrs ago 10-100 yrs ago 0
Score the following 2 rows only if the drier conditions began within past 10 years, and only for the part of the AA that got drier.
Inundation now vs. previously seldom vs. persistent seasonal vs. persistent slightly shorter or less often 0
Water level decrease >1 ft 1-12" <1 inch 0
sum= 0final score= 0
S3
S4
changes not related directly to humans
instream water withdrawals from tributaries whose water would otherwise reach the AA
ditches or drain tile in the AA or along its edge that accelerate outflow from the AA lowering or enlargement of a surface water exit point (e.g., culvert) or modification of a water level control structure, resulting in quicker drainage
Drier Water Regime - External CausesIn the last column, place an X next to any item within the CA (including channels flowing into the AA) that is likely to have caused a part of the AA to be inundated less extensively, less deeply, less frequently, and/or for shorter duration that it would be without those.
If any items were checked above, then for each row of the table below assign points (3, 2, or 1) in the last column that describe the combined maximum effect of those items in creating a drier water regime in the AA. To estimate that, contrast it with the condition if checked items never occurred or were no longer present.
proliferation of phreatophytes (woody plants with deep roots and high transpiration, e.g., juniper, autumn olive) or crops with high transpiration rates that are near the AA
accelerated downcutting or channelization of an adjacent or internal channel (cut below the historical water table level)
withdrawals (e.g., pumping) of natural surface or ground water directly out of the AA (not its tributaries) placement of fill material
groundwater withdrawals that divert water that would otherwise reach the AA
relocation of natural tributaries whose water would otherwise reach the AA a dam, dike, levee, weir, berm, or tidegate that interferes with natural inflow to the AA
deep ripping (e.g., with plows) that severs an underlying hydrologically-confining soil layer
0 if Sum= 0, (1 pt) if Sum= 1-4. (2 pt) if 5-6. (3 pt) if 7-8. (4 pt) if 9-10. (5 pt) if >10.
If any items were checked above, then for each row of the table below assign points (3, 2, or 1) in the last column that describe the combined maximum effect of those items in creating a drier water regime in the AA. To estimate that, contrast it with the condition if checked items never occurred or were no longer present.
0 if Sum= 0, (1 pt) if Sum= 1-4. (2 pt) if 5-6. (3 pt) if 7-8. (4 pt) if 9-10. (5 pt) if >10.
In the last column, place an X next to any item located within or immediately adjacent to the AA, that is likely to have caused a part of the AA to be inundated less extensively, less deeply, less frequently, and/or for shorter duration that it would be without that item.
Form FieldS version 2.0.2 April 2010

Altered Timing of Water Inputs
Severe (3 pts) Medium (2 pts) Mild (1 pt)Spatial extent within the AA of timing shift >95% of AA 5-95% of AA <5% of AA 0
When most of the timing shift began <3 yrs ago 3-9 yrs ago 10-100 yrs ago 0
Score the following 2 rows only if the altered inputs began within past 10 years, and only for the part of the AA that experiences those.
Input timing now vs. previously shift of weeks shift of days shift of hours or minutes 0
Flashiness or muting became very flashy or controlled
intermediate became mildly flashy or controlled
0
sum= 0final score= 0
Severe (3 pts) Medium (2 pts) Mild (1 pt)
Usual toxicity of most toxic contaminants industrial effluent or 303d* for toxics
domestic effluent, cropland, or 303d for nutrients
mildly impacting (livestock, pets, low density residential)
0
Frequency & duration of input frequent and year-round frequent but mostly seasonal infrequent & during high runoff events mainly
0
AA proximity to main sources (actual or potential) 0-50 ft 50-300 ft or in groundwater in other part of contributing area
0
sum= 0final score= 0
S5
S60 if Sum= 0, (1 pt) if Sum= 1-4. (2 pt) if 5-6. (3 pt) if 7-8. (4 pt) if 9-10. (5 pt) if >10.
0 if Sum= 0, (1 pt) if Sum= 1-3. (2 pt) if 4-5. (3 pt) if 6-7. (4 pt) if 8. (5 pt) if 9.
fertilizers applied to lawns, ag lands, or other areas in the CA
dumping of large amounts of wood, leaves, grass clippings, trash into the AA or its tributaries artificial drainage of upslope lands
stormwater or wastewater effluent (including failing septic systems), landfillsIn the last column, place an X next to any item -- occurring in either the AA or its CA -- that is likely to have accelerated the inputs of nutrients, contaminants, or salts to the AA
* categorized by ODEQ as Water Quality Limited (303d) and toxic substances are listed by ODEQ as one reason. See item D40 in data form OF.
increased pavement and other impervious surface in the CA
reflooding of soils that had been dry for many years fire retardants from aerial firefighting
straightening, ditching, dredging, and/or lining of tributary channels in the CA discharges of irrigation water to the AA, applied at times when natural runoff typically is not significant
irrigation water discharges into the AA, including saline seeps
erosion of nutrient-rich or contaminated soils
Accelerated Inputs of Nutrients, Contaminants, and/or Salts
In the last column, place an X next to any item that is likely to have caused the timing of water inputs (but not necessarily their volume) to shift by hours, days, or weeks, becoming either more muted (smaller or less frequent peaks spread over longer times, more temporal homogeneity of flow or water levels) or more flashy (larger or more frequent spikes but over shorter times).
otherIf any items were checked above, then for each row of the table below assign points (3, 2, or 1) in the last column that describe the combined maximum effect of those items on the timing of water inputs to the AA. To estimate that, contrast it with the condition if checked items never occurred or were no longer present.
flow regulation in tributaries or water level regulation in adjoining water body, or tidegate or other control structure at water entry points that regulates inflow to the AA
livestock, dogs
other human-related disturbances within the CA sources not related directly to humans, e.g., fire, extensive cover of nitrogen-fixing plants (e.g., alder), concentrations of waterbirds or other wildlifeIf any items were checked above, then for each row of the table below assign points (3, 2, or 1) in the last column that describe the combined maximum effect of those items in generating loads of nutrients, contaminants, or salts reaching the AA. To estimate that, contrast it with the condition if checked items never occurred or were no longer present.
chemical wastes from mining, oil/ gas extraction, other industrial sources
oil or chemical spills (not just chronic inputs) from nearby roads
pesticides applied to lawns, ag lands, roadsides, or other areas in the CA, but excluding spot applications for controlling non-natives in the AA
Form FieldS version 2.0.2 April 2010
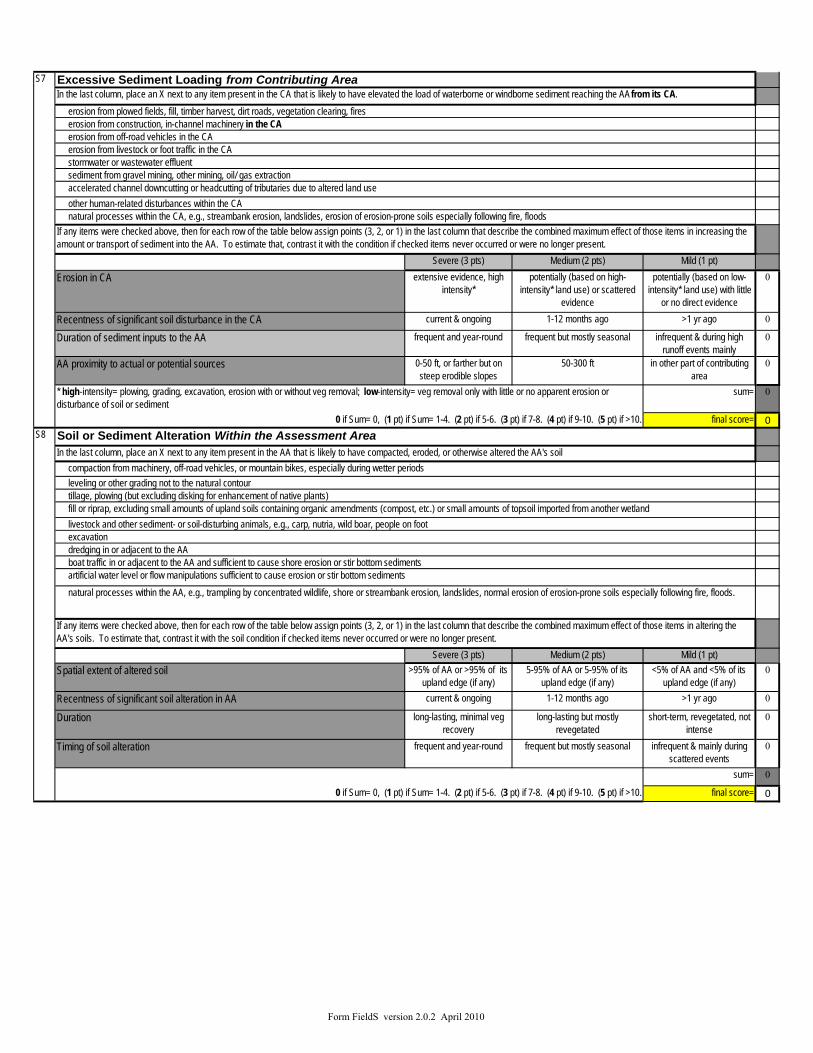
Severe (3 pts) Medium (2 pts) Mild (1 pt)Erosion in CA extensive evidence, high
intensity*potentially (based on high-
intensity* land use) or scattered evidence
potentially (based on low-intensity* land use) with little
or no direct evidence
0
Recentness of significant soil disturbance in the CA current & ongoing 1-12 months ago >1 yr ago 0
Duration of sediment inputs to the AA frequent and year-round frequent but mostly seasonal infrequent & during high runoff events mainly
0
AA proximity to actual or potential sources 0-50 ft, or farther but on steep erodible slopes
50-300 ft in other part of contributing area
0
sum= 0
final score= 0
Severe (3 pts) Medium (2 pts) Mild (1 pt)Spatial extent of altered soil >95% of AA or >95% of its
upland edge (if any)5-95% of AA or 5-95% of its
upland edge (if any)<5% of AA and <5% of its
upland edge (if any)0
Recentness of significant soil alteration in AA current & ongoing 1-12 months ago >1 yr ago 0
Duration long-lasting, minimal veg recovery
long-lasting but mostly revegetated
short-term, revegetated, not intense
0
Timing of soil alteration frequent and year-round frequent but mostly seasonal infrequent & mainly during scattered events
0
sum= 0
final score= 0
S7
S8
In the last column, place an X next to any item present in the CA that is likely to have elevated the load of waterborne or windborne sediment reaching the AA from its CA. erosion from plowed fields, fill, timber harvest, dirt roads, vegetation clearing, fires
other human-related disturbances within the CA
erosion from livestock or foot traffic in the CA stormwater or wastewater effluent sediment from gravel mining, other mining, oil/ gas extraction
erosion from construction, in-channel machinery in the CA
Excessive Sediment Loading from Contributing Area
excavation
accelerated channel downcutting or headcutting of tributaries due to altered land use
erosion from off-road vehicles in the CA
natural processes within the CA, e.g., streambank erosion, landslides, erosion of erosion-prone soils especially following fire, floods
0 if Sum= 0, (1 pt) if Sum= 1-4. (2 pt) if 5-6. (3 pt) if 7-8. (4 pt) if 9-10. (5 pt) if >10.
If any items were checked above, then for each row of the table below assign points (3, 2, or 1) in the last column that describe the combined maximum effect of those items in increasing the amount or transport of sediment into the AA. To estimate that, contrast it with the condition if checked items never occurred or were no longer present.
livestock and other sediment- or soil-disturbing animals, e.g., carp, nutria, wild boar, people on foot fill or riprap, excluding small amounts of upland soils containing organic amendments (compost, etc.) or small amounts of topsoil imported from another wetland tillage, plowing (but excluding disking for enhancement of native plants)
If any items were checked above, then for each row of the table below assign points (3, 2, or 1) in the last column that describe the combined maximum effect of those items in altering the AA's soils. To estimate that, contrast it with the soil condition if checked items never occurred or were no longer present.
* high-intensity= plowing, grading, excavation, erosion with or without veg removal; low-intensity= veg removal only with little or no apparent erosion or disturbance of soil or sediment
artificial water level or flow manipulations sufficient to cause erosion or stir bottom sediments
Soil or Sediment Alteration Within the Assessment AreaIn the last column, place an X next to any item present in the AA that is likely to have compacted, eroded, or otherwise altered the AA's soil compaction from machinery, off-road vehicles, or mountain bikes, especially during wetter periods leveling or other grading not to the natural contour
dredging in or adjacent to the AA boat traffic in or adjacent to the AA and sufficient to cause shore erosion or stir bottom sediments
0 if Sum= 0, (1 pt) if Sum= 1-4. (2 pt) if 5-6. (3 pt) if 7-8. (4 pt) if 9-10. (5 pt) if >10.
natural processes within the AA, e.g., trampling by concentrated wildlife, shore or streambank erosion, landslides, normal erosion of erosion-prone soils especially following fire, floods.
Form FieldS version 2.0.2 April 2010
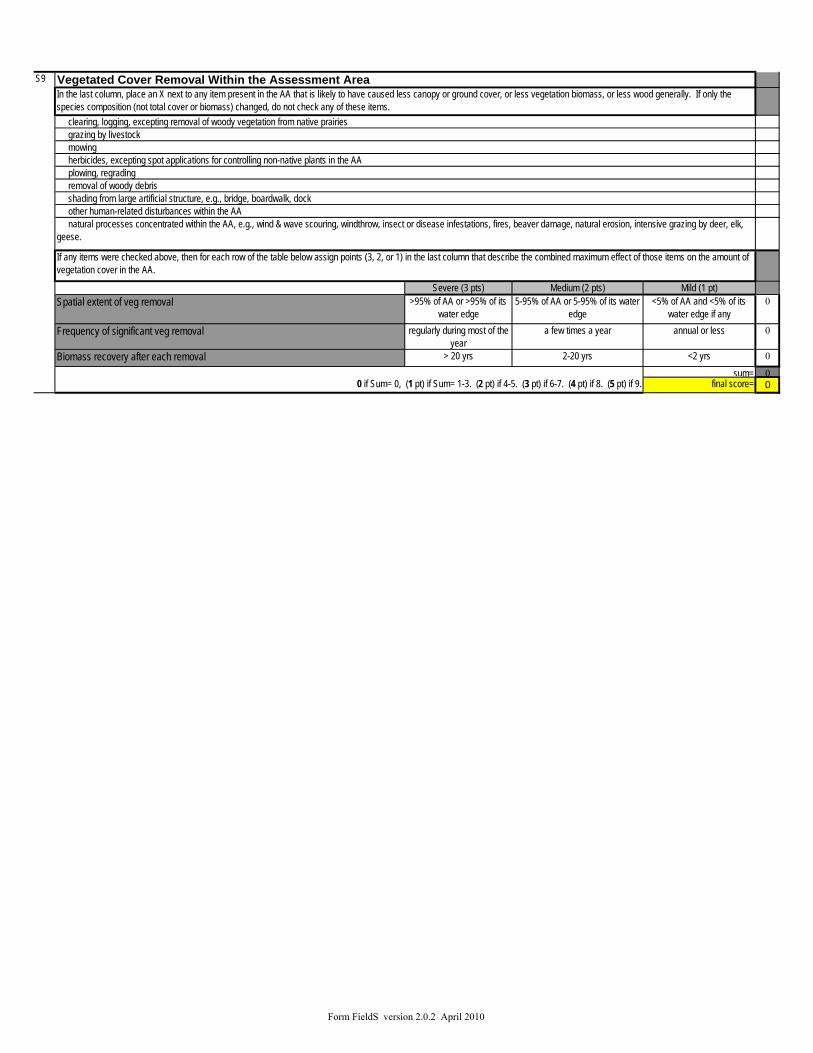
Severe (3 pts) Medium (2 pts) Mild (1 pt)Spatial extent of veg removal >95% of AA or >95% of its
water edge5-95% of AA or 5-95% of its water
edge<5% of AA and <5% of its
water edge if any0
Frequency of significant veg removal regularly during most of the year
a few times a year annual or less 0
Biomass recovery after each removal > 20 yrs 2-20 yrs <2 yrs 0
sum= 0final score= 0
S9
If any items were checked above, then for each row of the table below assign points (3, 2, or 1) in the last column that describe the combined maximum effect of those items on the amount of vegetation cover in the AA.
removal of woody debris
natural processes concentrated within the AA, e.g., wind & wave scouring, windthrow, insect or disease infestations, fires, beaver damage, natural erosion, intensive grazing by deer, elk, geese.
plowing, regrading
0 if Sum= 0, (1 pt) if Sum= 1-3. (2 pt) if 4-5. (3 pt) if 6-7. (4 pt) if 8. (5 pt) if 9.
Vegetated Cover Removal Within the Assessment Area
herbicides, excepting spot applications for controlling non-native plants in the AA
shading from large artificial structure, e.g., bridge, boardwalk, dock other human-related disturbances within the AA
In the last column, place an X next to any item present in the AA that is likely to have caused less canopy or ground cover, or less vegetation biomass, or less wood generally. If only the species composition (not total cover or biomass) changed, do not check any of these items.
mowing
clearing, logging, excepting removal of woody vegetation from native prairies grazing by livestock
Form FieldS version 2.0.2 April 2010

ORWAP SCORES SHEET version 2.0.2 May 2012Site Name:Investigator Name:Date of Field Assessment:Latitude (decimal degrees): Longitude (decimal degrees):
Specific Functions:Relative Effectiveness of
the FunctionRelative Values of the Function
Water Storage & Delay (WS) 0.00 2.58Sediment Retention & Stabilization (SR) 10.00 4.67Phosphorus Retention (PR) 10.00 5.01Nitrate Removal & Retention (NR) 10.00 4.39Thermoregulation (T) 0.00 0.00Carbon Sequestration (CS) 1.11Organic Matter Export (OE) 0.00Aquatic Invertebrate Habitat (INV) 7.78 7.00Anadromous Fish Habitat (FA) 0.00 4.29Non-anadromous Fish Habitat (FR) 0.00 10.00Amphibian & Reptile Habitat (AM) 5.56 8.00Waterbird Feeding Habitat (WBF) 4.29 4.67Waterbird Nesting Habitat (WBN) 0.00 3.50Songbird, Raptor, & Mammal Habitat (SBM) 4.43 6.67Pollinator Habitat (POL) 5.56 5.00Native Plant Diversity (PD) 5.10 7.00
GROUPED FUNCTIONS Group Scores (functions)Group Scores
(values)Hydrologic Function (WS) 0.00 2.58Water Quality Group (WQ) 10.00 5.01Carbon Sequestration (CS) 1.11Fish Support Group (FISH) 0.00 10.00Aquatic Support Group (AQ) 7.78 8.00Terrestrial Support Group (TERR) 5.56 7.00Public Use & Recognition (PU) 1.90Provisioning Services (PS) 0.00
OTHER ATTRIBUTESWetland Ecological Condition (CQ) 6.31Wetland Stressors (STR) 1.33Wetland Sensitivity (SEN) 10.00
HGM Class - Relative Probabilities (select max)
Estuarine 0.00Riverine 0.00Slope 5.42Flat 9.17Depressional 2.22Lacustrine 0.00
(identical to Water Storage and Delay function and value scores)(maximum of scores for SR, PR, NR, and T)
(maximum of scores for OE, AM, INV, WBF, and WBN)(maximum of scores for FA and FR)
(click on this cell to see this attribute defined)(click on this cell to see this attribute defined)
(maximum of scores for PD, POL, and SBM)
(identical to Carbon Sequestration score above)
L.Cleveland and B. Sahatjian9/10/2014
-122.966

-122.963042.4760,
10/6/2014 6:22:39 PM
Rare Wetland Type
Average Annual Precipitation
Watershed (HUC6):
Presettlement Vegetation Class:
Watershed Information
Location Information
Uniqueness of Watershed by Size/Type
HUC Best *
View Salinity Maps (pdf)
(within 1 mile)
Soil Information
View Important Bird Areas (Audubon) .pdf
Hydologic Landscape Class
Within? Layer
No 100-yr Floodplain
No Special Protected Area
No Wetland Priority Site
Yes 300ft of a Spring
No 100ft of Essential Salmonid Habitat
No Mapped Wetland
Sams Creek-Rogue River (171003080203)
Roemer fescue
Vernal Pool
22.46 inches
Dry
Soil Symbol 44C
Soil Name
YesHydric Rating
Hydric Percent 5
Debenger-Brader loams, 1 to 15 percent slopes
Farmland Class Farmland of statewide importance
Erosion - very severe limitations that restrict the choice of plants, require very careful management, or both
Dom. Cond. Non-irrigated Capability Class
Erosion hazard: Moderate
EST, em, lgFW, s/f, lgFW, em, lg EST, em, lgHUC Code HUC Name (Acres) (Acres) (Acres) (Acres)
HUC4: 17100308 43.61569Middle Rogue 213.61957 0 0
HUC5: 1710030802 43.61569Rogue River-Gold Hill 213.61957 0 0
HUC6: 171003080203 8.34208Rogue River-Sams Creek 17.94038 0 0
[abbreviations: FW- freshwater (wetland); em- Emergent; lg- largest; s/f- Shrub/Forested; EST- Estuarine (wetland)
HUC Code Is HUC Best?HUC Name Greatest Criteria Met
HUC4: 17100308 Non/a n/a
HUC5: 1710030802 Non/a n/a
HUC6: 171003080203 YesRogue River-Sams Creek type diversity
This report was generated using the ORWAP Map Viewer, a tool of the Oregon Explorer (http://oregonexplorer.info).

Element of Occurrence Record(s) in HUC6
Rare Species Scores
Element of Occurrence (Rare Species)
Max ScoreRare Species Type Sum Score
0.33 0.33Anadromous Fish Species
0.45 0.90Non-anadromous Fish Species
0.08 0.08Amphibian & Reptile Species
0.00 0.00Feeding Waterbirds
0.00 0.00Nesting Waterbirds
0.33 0.97Songbirds, Raptors, and Mammals
0.55 0.55Invertebrate Species
0.55 1.43Plant Species
0.00 0.00All other species
Total Score: 4.26
1
Strix occidentalis caurina
Northern spotted owl [3 occurences]
ORBIC State Status: S3
ODFW Strategy Species: No
G3T3ORBIC Global Status:
2
Plagiobothrys greenei
Greene's popcorn flower [6 occurences]
ORBIC State Status: S2?
ODFW Strategy Species: No
G4ORBIC Global Status:
3
Agrostis hendersonii
Henderson's bentgrass [1 occurences]
ORBIC State Status: SH
ODFW Strategy Species: No
G1QORBIC Global Status:
4
Lanx alta
Highcap lanx (snail) [1 occurences]
ORBIC State Status: S1
ODFW Strategy Species: No
G2ORBIC Global Status:
5
Melanerpes lewis
Lewis's woodpecker [1 occurences]
ORBIC State Status: S2S3B
ODFW Strategy Species: Yes
G4ORBIC Global Status:
6
Lampropeltis zonata
California mountain kingsnake [1 occurences]
At Lat/Long No EO Records
Within 1 mile 4 EO Records
In HUC6 watershed 23 EO Records
This report was generated using the ORWAP Map Viewer, a tool of the Oregon Explorer (http://oregonexplorer.info).

"Type diversity" is the number of unique NWI codes in the watershed (e.g., PEMA, PEMC, PEMCx) and excluded types that have no vegetation component (e.g., PUBH, R3US2).
* HUC Best: Oregon watersheds (HUC4, HUC5, HUC6) with greatest type diversity, proportional area, or density of wetlands according to available National Wetland Inventory maps.
Lampropeltis zonata
California mountain kingsnake [1 occurences]
ORBIC State Status: S3S4
ODFW Strategy Species: No
G4G5ORBIC Global Status:
7
Plagiobothrys austiniae
Austin's plagiobothrys [3 occurences]
ORBIC State Status: S2?
ODFW Strategy Species: No
G4ORBIC Global Status:
8
Falco peregrinus anatum
American peregrine falcon [1 occurences]
ORBIC State Status: S2B
ODFW Strategy Species: No
G4T4ORBIC Global Status:
9
Antrozous pallidus
Pallid bat [1 occurences]
ORBIC State Status: S2
ODFW Strategy Species: Yes
G5ORBIC Global Status:
10
Oncorhynchus kisutch pop. 2
Coho salmon (Southern Oregon/Northern California Coasts ESU) [1
ORBIC State Status: S2
ODFW Strategy Species: No
G4T2QORBIC Global Status:
11
Oncorhynchus mykiss pop. 24
Steelhead (Klamath Mountains Province ESU, summer run) [1
ORBIC State Status: S2S3
ODFW Strategy Species: No
G5T2T3QORBIC Global Status:
12
Carex serratodens
Saw-tooth sedge [1 occurences]
ORBIC State Status: S3
ODFW Strategy Species: No
G5ORBIC Global Status:
13
Oncorhynchus mykiss pop. 25
Steelhead (Klamath Mountains Province ESU, winter run) [1
ORBIC State Status: S2S3
ODFW Strategy Species: No
G5T3QORBIC Global Status:
14
Meconella oregana
White meconella [1 occurences]
ORBIC State Status: S1
ODFW Strategy Species: No
G2G3ORBIC Global Status:
View wildlife list Sams Creek-Rogue River (171003080203)
This report was generated using the ORWAP Map Viewer, a tool of the Oregon Explorer (http://oregonexplorer.info).

* The digital maps used to determine this do not show many wetlands or cover the entire state. Data were compiled only from watersheds that have been at least 90% mapped by NWI (see worksheets for HUC4, 5, and 6). Data were received in November 2008 from ORBIC.
"Proportional Area" is the proportion of the watershed's total area occupied by vegetated wetlands as mapped by NWI.
component (e.g., PUBH, R3US2). "Density" is the number of vegetated NWI polygons divided by the acreage of the watershed; many of these polygons may be contiguous with each other, forming a single wetland.
*METHODS: The above 3 metrics can be strongly correlated with watershed size and with each other. To minimize that bias, the rankings of the residuals from a regression analysis were used, rather than simply the top-ranking watersheds, to identify the most "important" watersheds for each metric at each scale. That is, the watersheds were identified that were in the top 5% in terms of variety of mapped wetland types for watersheds of that size, the largest area of mapped wetlands as a proportion of the watershed area for watersheds of that size, and/or the greatest number of mapped wetland polygons for watersheds with that much wetland area.
ORBIC State/Global Status: Scale from 1 to 5. 1=critically imperiled, 2=imperiled, 3=rare, uncommon or threatened but no immediately imperiled, 4=not rare and apparentlysecure, 5=demonstrably widespread. A number preceded by a "T" means that it is the rank for the trinomial. A "Q"
This report was generated using the ORWAP Map Viewer, a tool of the Oregon Explorer (http://oregonexplorer.info).

B3: Stream Duration Assessment Method Forms


Appendix C
Ground Level Photographs
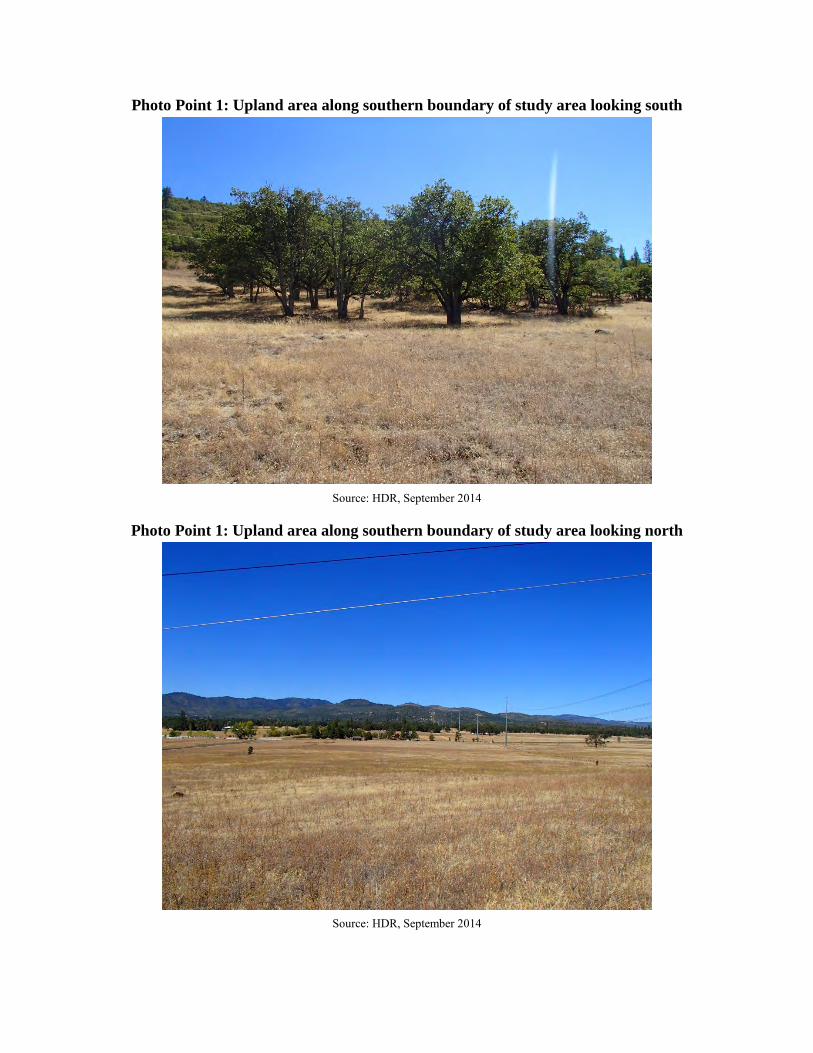
Photo Point 1: Upland area along southern boundary of study area looking south
Source: HDR, September 2014
Photo Point 1: Upland area along southern boundary of study area looking north
Source: HDR, September 2014
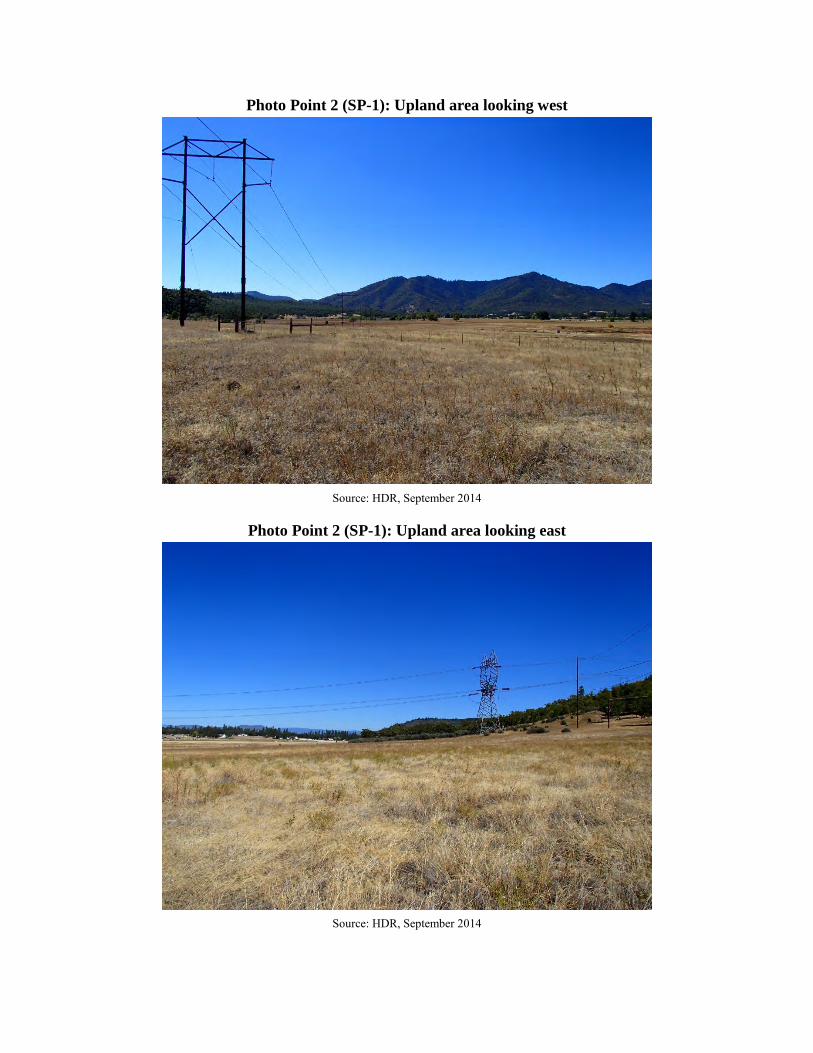
Photo Point 2 (SP-1): Upland area looking west
Source: HDR, September 2014
Photo Point 2 (SP-1): Upland area looking east
Source: HDR, September 2014

Photo Point 2 (SP-1): Upland area looking north
Source: HDR, September 2014
Photo Point 3 (SP-2): Upland area looking north
Source: HDR, September 2014

Photo Point 3 (SP-2): Upland area looking west
Source: HDR, September 2014
Photo Point 3 (SP-2): Upland area looking east
Source: HDR, September 2014

Photo Point 3 (SP-2): Upland area looking south
Source: HDR, September 2014
Photo Point 7 (SP-3): Upland area looking east
Source: HDR, September 2014

Photo Point 10 (SP-4): Upland area with pile of rocky debris looking southeast
Source: HDR, September 2014
Photo Point 11 (SP-4): Upland area with teasel covered berm looking west
Source: HDR, September 2014

Photo Point 14 (SP-7): Upland area adjacent to Wetland B looking south
Source: HDR, September 2014
Photo Point 14 (SP-7): Wetland/upland boundary of Wetland B looking west
Source: HDR, September 2014

Photo Point 14 (SP-7): Wetland/upland boundary of Wetland B looking north
Source: HDR, September 2014
Photo Point 15 (SP-10): Upland area adjacent to Wetland B looking west
Source: HDR, September 2014

Photo Point 15 (SP-10): Wetland B looking north
Source: HDR, September 2014
Photo Point 15 (SP-10): Upland area adjacent to Wetland B looking south
Source: HDR, September 2014

Photo Point 17 (SP-11): Wetland/upland boundary (approximate boundary shown) of Wetland B looking east
Source: HDR, September 2014
Photo Point 17 (SP-11): Wetland B looking west
Source: HDR, September 2014

Photo Point 17 (SP-11): Wetland/upland boundary (approximate boundary shown) of Wetland B looking south
Source: HDR, September 2014
Photo Point 19 (SP-14): Wetland C looking east
Source: HDR, September 2014

Photo Point 19 (SP-14): Wetland/upland boundary (approximate boundary shown) of Wetland C looking south
Source: HDR, September 2014
Photo Point 19 (SP-14): Wetland C looking west
Source: HDR, September 2014

Photo Point 20: Water-stained vegetation in Wetland B looking west
Source: HDR, September 2014
Photo Point 21: Artificial stock pond in Wetland B looking southeast
Source: HDR, September 2014

Photo Point 22 (SP-17): Upland area adjacent to Wetland B looking east
Source: HDR, September 2014
Photo Point 22 (SP-17): Wetland B looking south
Source: HDR, September 2014

Photo Point 23 (SP-18): Wetland B looking south
Source: HDR, September 2014
Photo Point 23 (SP-18): Wetland B looking west
Source: HDR, September 2014

Photo Point 23 (SP-18): Upland area adjacent to Wetland B looking east
Source: HDR, September 2014
Photo Point 24 (SP-24): Upland area looking north
Source: HDR, September 2014

Photo Point 24 (SP-24): Upland area looking south
Source: HDR, September 2014
Photo Point 25 (SP-25): Vegetative patch in upland area looking east
Source: HDR, September 2014
Photo Point 26 (SP-26): Upland area looking south
Source: HDR, September 2014
Photo Point 26 (SP-26): Upland area looking north
Source: HDR, September 2014
Photo Point 27 (SP-29): Upland area in southeast quadrant of study area looking north
Source: HDR, September 2014
Photo Point 27 (SP-29): Upland area in southeast quadrant of study area looking south
Source: HDR, September 2014

Photo Point 28: Upland area in southeast quadrant of study area looking north
Source: HDR, September 2014
Photo Point 30: Upland area along western boundary of study area looking north
Source: HDR, September 2014
Photo Point 30: Upland area along western boundary of study area looking south
Source: HDR, September 2014
Photo Point 31: Overview of study area looking southwest
Source: HDR, September 2014

Photo Point 32 (SP-28): Upland area adjacent to Wetland A looking south
Source: HDR, September 2014
Photo Point 32 (SP-28): Wetland/upland boundary (approximate boundary shown) of Wetland A looking north
Source: HDR, September 2014

Photo Point 33: Upland area looking northwest
Source: HDR, September 2014
Photo Point 34: Roadside ditch looking west
Source: HDR, September 2014
Photo Point 36: Roadside ditch looking west
Source: HDR, September 2014
Photo Point 37: Metal culvert in roadside ditch looking southeast
Source: HDR, September 2014

Photo Point 39: Roadside ditch looking west
Source: HDR, September 2014
Photo Point 40: Roadside ditch looking west
Source: HDR, September 2014
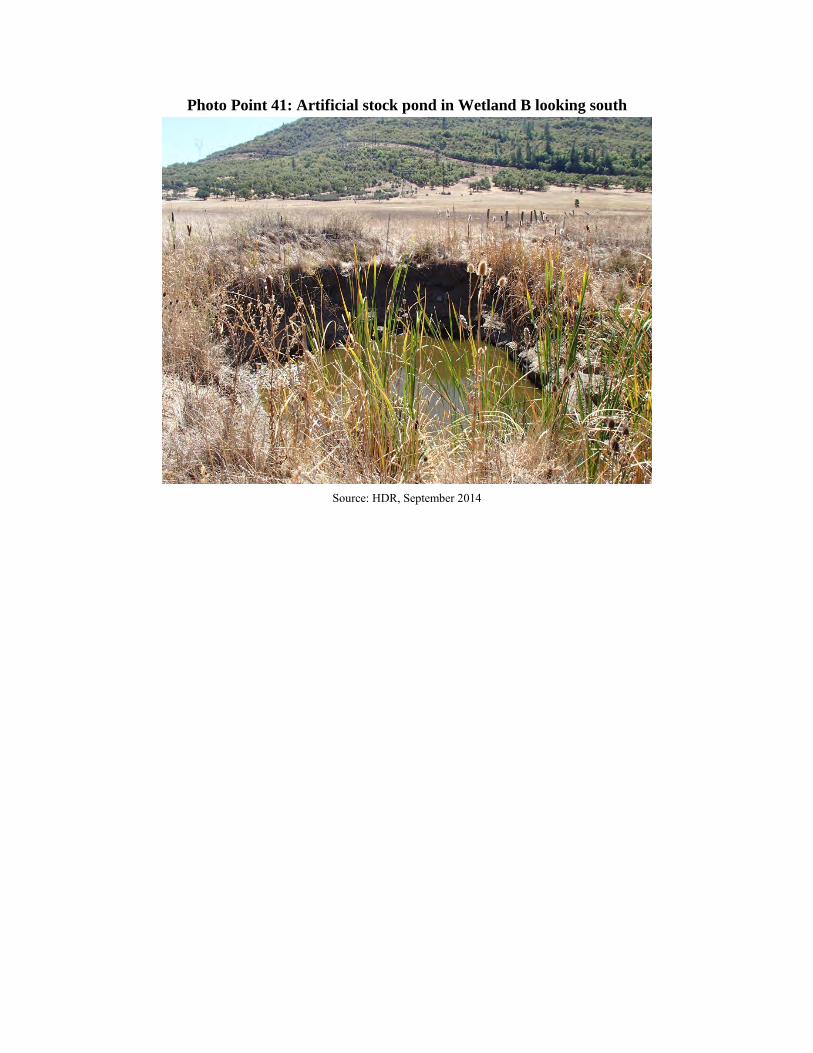
Photo Point 41: Artificial stock pond in Wetland B looking south
Source: HDR, September 2014

Appendix D
Additional Tables and Information
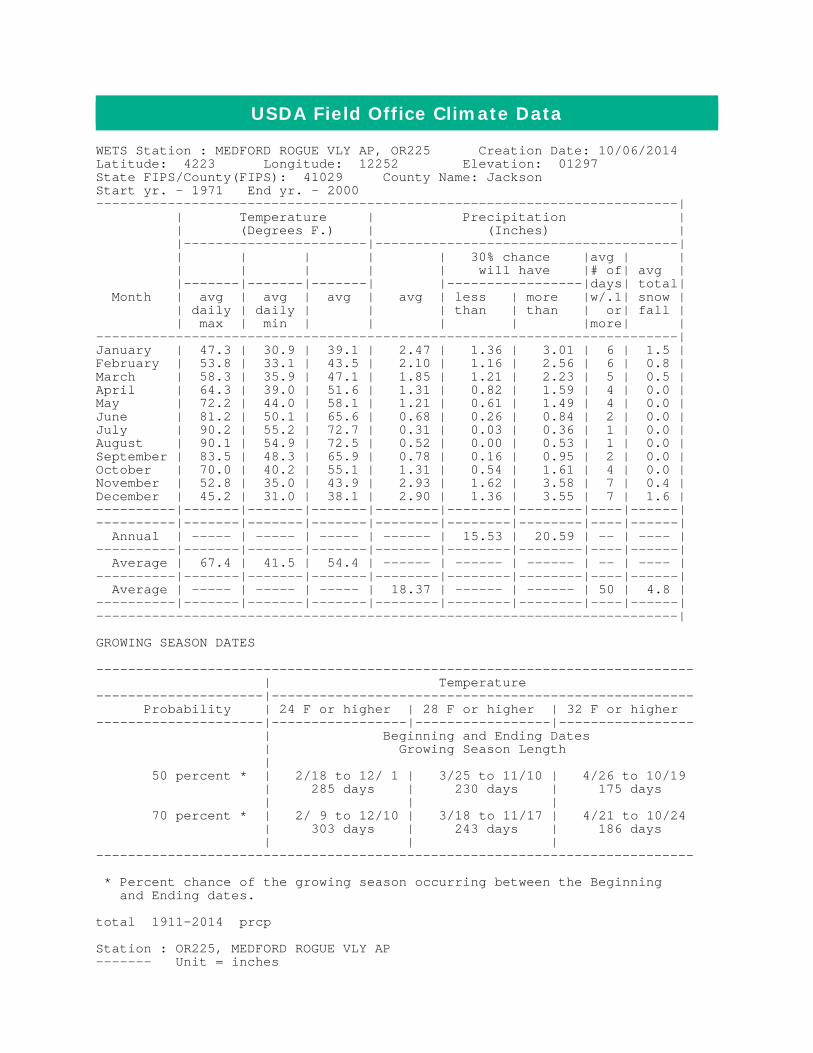
USDA Field Office Climate Data WETS Station : MEDFORD ROGUE VLY AP, OR225 Creation Date: 10/06/2014 Latitude: 4223 Longitude: 12252 Elevation: 01297 State FIPS/County(FIPS): 41029 County Name: Jackson Start yr. - 1971 End yr. - 2000 -------------------------------------------------------------------------| | Temperature | Precipitation | | (Degrees F.) | (Inches) | |-----------------------|--------------------------------------| | | | | | 30% chance |avg | | | | | | | will have |# of| avg | |-------|-------|-------| |-----------------|days| total| Month | avg | avg | avg | avg | less | more |w/.1| snow | | daily | daily | | | than | than | or| fall | | max | min | | | | |more| | -------------------------------------------------------------------------| January | 47.3 | 30.9 | 39.1 | 2.47 | 1.36 | 3.01 | 6 | 1.5 | February | 53.8 | 33.1 | 43.5 | 2.10 | 1.16 | 2.56 | 6 | 0.8 | March | 58.3 | 35.9 | 47.1 | 1.85 | 1.21 | 2.23 | 5 | 0.5 | April | 64.3 | 39.0 | 51.6 | 1.31 | 0.82 | 1.59 | 4 | 0.0 | May | 72.2 | 44.0 | 58.1 | 1.21 | 0.61 | 1.49 | 4 | 0.0 | June | 81.2 | 50.1 | 65.6 | 0.68 | 0.26 | 0.84 | 2 | 0.0 | July | 90.2 | 55.2 | 72.7 | 0.31 | 0.03 | 0.36 | 1 | 0.0 | August | 90.1 | 54.9 | 72.5 | 0.52 | 0.00 | 0.53 | 1 | 0.0 | September | 83.5 | 48.3 | 65.9 | 0.78 | 0.16 | 0.95 | 2 | 0.0 | October | 70.0 | 40.2 | 55.1 | 1.31 | 0.54 | 1.61 | 4 | 0.0 | November | 52.8 | 35.0 | 43.9 | 2.93 | 1.62 | 3.58 | 7 | 0.4 | December | 45.2 | 31.0 | 38.1 | 2.90 | 1.36 | 3.55 | 7 | 1.6 | ----------|-------|-------|-------|--------|--------|--------|----|------| ----------|-------|-------|-------|--------|--------|--------|----|------| Annual | ----- | ----- | ----- | ------ | 15.53 | 20.59 | -- | ---- | ----------|-------|-------|-------|--------|--------|--------|----|------| Average | 67.4 | 41.5 | 54.4 | ------ | ------ | ------ | -- | ---- | ----------|-------|-------|-------|--------|--------|--------|----|------| Average | ----- | ----- | ----- | 18.37 | ------ | ------ | 50 | 4.8 | ----------|-------|-------|-------|--------|--------|--------|----|------| -------------------------------------------------------------------------| GROWING SEASON DATES --------------------------------------------------------------------------- | Temperature ---------------------|----------------------------------------------------- Probability | 24 F or higher | 28 F or higher | 32 F or higher ---------------------|-----------------|-----------------|----------------- | Beginning and Ending Dates | Growing Season Length | 50 percent * | 2/18 to 12/ 1 | 3/25 to 11/10 | 4/26 to 10/19 | 285 days | 230 days | 175 days | | | 70 percent * | 2/ 9 to 12/10 | 3/18 to 11/17 | 4/21 to 10/24 | 303 days | 243 days | 186 days | | | --------------------------------------------------------------------------- * Percent chance of the growing season occurring between the Beginning and Ending dates. total 1911-2014 prcp Station : OR225, MEDFORD ROGUE VLY AP ------- Unit = inches

yr jan feb mar apr may jun jul aug sep oct nov dec annl ------- ----- ----- ----- ----- ----- ----- ----- ----- ----- ----- ----- ----- 11 M0.03 1.27 1.49 0.71 0.24 0.00 1.13 0.43 1.67 1.88 8.85 12 3.59 2.63 1.66 4.40 2.45 2.19 0.20 0.07 1.11 1.10 3.38 2.06 24.84 13 3.52 0.10 0.43 2.45 1.72 3.09 2.74 0.08 0.46 0.62 2.82 1.91 19.94 14 5.34 0.61 0.42 1.43 1.35 0.66 0.19 0.00 0.87 2.20 1.02 0.56 14.65 15 1.34 2.46 0.90 1.64 1.39 0.12 0.30 0.02 0.03 0.40 2.96 2.24 13.80 16 2.01 1.51 1.76 1.66 0.69 0.73 1.15 0.66 0.37 0.28 1.99 1.71 14.52 17 1.94 3.37 1.88 1.25 1.01 0.06 0.00 0.09 0.30 0.00 4.26 2.75 16.91 18 2.17 2.64 1.69 0.39 0.54 0.01 0.03 0.25 1.67 1.57 2.29 1.44 14.69 19 2.14 4.30 1.76 1.15 0.03 0.00 0.03 0.03 0.66 0.60 1.87 2.57 15.14 20 0.42 0.22 1.44 0.99 0.96 1.81 0.24 0.36 0.99 1.20 4.27 3.43 16.33 21 3.12 3.33 1.06 0.75 2.47 0.10 0.00 0.00 0.04 0.86 3.54 0.94 16.21 22 1.76 2.33 1.84 0.61 1.22 0.56 0.00 0.00 0.50 1.48 1.35 5.36 17.01 23 1.63 0.38 0.41 1.00 0.58 0.69 0.59 0.89 0.99 2.00 0.87 1.53 11.56 24 0.51 2.23 0.74 0.38 0.15 0.21 0.00 0.97 0.92 4.89 3.15 3.44 17.59 25 1.70 2.07 1.04 1.88 0.95 0.83 0.00 0.29 1.92 0.29 1.82 1.73 14.52 26 1.47 2.03 0.00 0.57 0.73 0.05 0.22 0.52 0.16 2.62 6.66 3.06 18.09 27 2.58 3.87 1.87 1.20 0.92 0.43 0.34 0.00 0.81 0.91 4.42 1.64 18.99 28 2.08 0.73 3.24 0.99 0.01 0.82 0.00 0.00 1.23 1.28 1.11 2.84 14.33 29 1.47 0.24 0.93 1.54 0.41 2.54 0.00 0.00 0.00 1.14 0.02 6.45 14.74 30 2.45 1.59 0.49 1.09 0.82 0.12 0.00 0.00 1.58 0.30 2.17 1.06 11.67 31 1.39 1.06 1.16 1.23 0.23 3.49 0.00 0.00 1.23 1.74 3.12 4.21 18.86 32 2.03 0.26 2.43 2.44 3.05 1.77 0.04 0.12 0.00 0.70 3.64 2.93 19.41 33 3.36 1.15 0.91 0.63 1.41 0.15 0.00 0.02 0.31 1.13 0.03 1.99 11.09 34 2.70 0.76 1.15 1.11 0.99 0.83 0.02 0.02 0.31 2.48 3.44 2.18 15.99 35 2.12 1.94 1.26 2.05 0.07 0.00 0.32 0.31 0.26 2.20 0.93 3.60 15.06 36 6.67 2.68 0.42 1.52 1.62 0.86 0.58 0.00 0.35 0.00 0.01 2.48 17.19 37 2.10 3.23 2.48 2.56 1.63 1.71 0.30 0.04 1.15 2.26 5.69 3.49 26.64 38 2.83 4.65 3.34 1.32 0.23 0.01 0.03 0.00 0.58 0.79 2.25 2.18 18.21 39 1.92 1.25 1.52 0.29 1.22 0.40 0.34 0.00 0.26 2.15 0.06 6.71 16.12 40 1.85 5.36 4.19 0.69 0.57 0.62 0.14 0.00 2.31 2.06 2.23 3.41 23.43 41 2.15 1.93 1.03 1.64 2.15 1.69 0.06 0.20 1.21 1.35 2.65 7.97 24.03 42 2.19 2.33 0.53 0.86 3.69 0.64 0.00 0.09 0.16 0.82 8.62 5.87 25.80 43 6.44 0.86 1.51 2.17 0.67 1.85 0.00 0.31 0.04 3.68 1.26 1.36 20.15 44 1.70 2.01 1.57 1.97 0.66 1.51 0.17 0.31 0.80 1.54 3.14 0.74 16.12 45 1.65 3.90 1.98 0.43 4.58 0.52 0.00 1.13 0.46 1.26 5.34 3.95 25.20 46 3.00 1.54 1.49 1.07 0.96 0.18 0.11 0.00 0.23 1.90 3.99 1.28 15.75 47 1.11 1.22 1.79 0.64 0.91 2.26 1.35 0.30 0.16 3.00 1.99 1.34 16.07 48 4.80 2.05 2.20 2.31 1.63 2.90 0.38 0.16 0.30 1.27 2.57 3.69 24.26 49 0.51 2.53 1.08 0.16 1.74 0.00 0.00 0.00 0.54 1.89 1.82 1.19 11.46 50 5.96 1.18 2.03 0.58 0.43 1.27 0.00 0.00 0.72 9.16 2.16 5.13 28.62 51 4.05 2.72 0.82 0.73 0.51 0.00 0.00 0.27 0.22 3.48 2.43 4.77 20.00 52 3.20 2.88 1.20 0.25 1.27 1.73 0.04 0.47 0.64 0.14 1.30 5.58 18.70 53 5.49 2.04 1.50 0.55 3.60 1.16 0.00 0.52 1.57 1.42 5.09 2.62 25.56 54 6.18 1.69 0.84 0.94 0.33 1.25 0.00 0.40 1.18 0.51 0.68 2.25 16.25 55 1.31 0.63 1.03 1.04 0.18 0.07 0.01 0.00 0.83 2.19 3.85 8.77 19.91 56 5.88 4.95 1.31 0.64 4.18 0.80 0.94 0.32 0.64 5.89 0.91 2.32 28.78 57 1.70 2.99 5.54 0.36 1.10 0.03 0.16 0.00 0.80 1.64 2.28 3.92 20.52 58 5.63 5.37 1.83 0.40 1.01 2.72 1.35 0.14 0.28 0.42 1.63 2.51 23.29 59 1.99 2.78 0.88 0.59 1.40 0.27 0.00 0.28 0.29 0.61 0.16 1.17 10.42 60 2.35 4.12 4.40 0.67 1.97 0.00 0.09 0.03 0.18 0.38 4.70 1.71 20.60 61 1.12 2.74 3.05 0.96 1.86 0.34 0.10 0.15 0.93 2.38 3.42 2.60 19.65 62 1.69 1.05 1.55 0.81 0.80 0.15 0.00 1.00 0.76 6.27 4.37 4.68 23.13 63 1.75 2.47 0.88 2.25 2.23 0.92 0.15 0.26 0.26 1.40 5.25 1.05 18.87 64 5.60 0.21 2.70 0.37 0.82 0.79 0.97 0.10 0.15 0.90 3.75 12.72 29.08 65 4.30 0.70 0.41 3.07 0.31 1.05 0.03 1.52 0.00 0.46 2.56 3.71 18.12 66 4.80 0.37 1.70 0.45 0.20 0.37 1.63 0.19 1.88 0.76 5.89 2.80 21.04 67 5.44 1.14 2.08 1.72 0.96 0.27 0.00 0.00 0.28 2.34 1.04 3.40 18.67 68 1.86 2.95 0.90 0.38 1.05 0.06 0.00 1.33 0.32 0.62 3.04 2.78 15.29 69 6.16 1.46 0.29 0.60 1.62 1.31 0.02 0.00 0.62 2.46 0.49 5.44 20.47 70 6.19 1.70 1.13 1.44 0.34 0.59 0.00 0.34 0.22 1.39 6.57 3.36 23.27 71 3.68 1.43 2.72 1.34 1.13 0.97 0.07 0.28 1.24 0.61 3.43 2.45 19.35 72 3.55 2.49 3.62 0.94 1.61 1.59 0.00 0.36 0.52 1.21 1.50 3.23 20.62 73 1.98 0.54 1.58 0.76 0.45 0.06 0.04 0.03 0.64 2.79 7.01 3.02 18.90 74 4.32 2.78 3.26 1.70 0.22 0.00 0.10 0.00 0.00 1.17 1.13 3.91 18.59 75 2.64 2.64 3.97 1.27 0.24 0.38 0.22 0.54 0.65 2.21 1.85 2.74 19.35 76 1.62 2.21 1.13 1.67 0.11 0.04 0.84 2.83 0.90 0.18 0.43 0.36 12.32 77 1.17 0.67 1.12 0.81 2.37 0.53 0.23 0.36 4.22 0.96 4.91 4.81 22.16 78 1.53 2.45 2.03 1.26 1.59 1.02 0.54 1.46 1.68 0.01 1.50 0.66 15.73 79 2.81 1.54 0.83 2.24 1.42 0.55 0.02 0.63 0.32 3.98 3.17 2.73 20.24 80 2.59 1.78 1.27 1.75 0.69 1.22 0.02 0.00 0.18 1.52 2.28 2.59 15.89 81 0.54 1.72 1.23 0.55 1.17 0.47 0.41 0.00 0.52 1.23 6.05 8.02 21.91 82 1.43 3.64 2.30 0.87 0.00 0.85 0.07 0.03 0.97 1.60 2.17 5.31 19.24 83 0.92 5.67 3.21 1.12 0.81 0.66 0.59 2.21 2.05 1.21 4.97 6.73 30.15 84 0.19 2.50 2.05 1.11 0.39 0.79 0.16 0.40 0.51 1.93 6.56 1.96 18.55 85 0.23 1.58 1.22 0.39 1.00 0.37 0.00 0.02 1.53 1.50 2.02 0.83 10.69 86 1.99 5.22 1.02 0.23 1.19 0.45 0.00 0.00 2.31 1.49 2.45 0.72 17.07 87 2.89 2.24 1.34 0.45 0.95 0.12 1.34 0.00 0.00 0.00 1.68 3.77 14.78 88 2.53 0.20 0.57 1.07 1.51 1.04 0.00 0.02 0.22 0.12 5.14 1.28 13.70 89 2.33 0.78 3.94 2.42 1.01 0.16 0.00 0.41 1.94 0.71 0.71 0.68 15.09 90 2.94 1.06 1.49 0.82 1.86 0.17 0.11 0.99 0.13 1.29 1.52 1.12 13.50

91 1.55 1.73 2.42 1.07 1.84 0.68 1.10 0.22 0.00 0.39 2.42 1.08 14.50 92 0.84 0.63 0.42 1.10 1.30 2.62 0.58 0.00 0.06 2.37 1.54 3.52 14.98 93 2.65 1.37 1.25 1.83 2.63 1.23 0.66 1.21 0.00 0.66 0.68 2.43 16.60 94 1.06 1.21 1.35 0.58 0.57 0.12 0.21 0.00 0.83 0.46 4.64 1.07 12.10 95 3.76 0.40 2.63 2.49 0.54 1.54 1.17 0.00 0.12 0.20 1.26 7.66 21.77 96 5.44 2.96 1.55 1.30 2.89 0.22 0.30 0.08 0.49 2.20 4.04 9.94 31.41 97 3.44 1.11 1.00 1.98 1.09 1.42 0.02 1.39 0.83 2.19 2.10 1.36 17.93 98 4.78 3.27 2.73 2.25 4.26 0.67 0.00 0.00 0.05 1.81 7.67 1.23 28.72 99 3.65 4.32 0.81 0.44 0.66 0.00 0.04 2.03 0.00 1.72 1.94 0.89 16.50 0 5.00 2.76 1.52 3.59 0.75 0.43 0.58 0.07 0.38 1.51 1.24 0.98 18.81 1 1.00 0.82 1.55 1.15 0.40 0.38 0.19 0.03 0.79 0.19 4.16 4.35 15.01 2 1.59 1.65 1.33 1.49 0.53 0.03 0.08 0.00 0.53 0.16 3.42 7.19 18.00 3 2.48 1.74 2.52 3.53 0.86 0.00 0.00 0.76 0.86 0.05 2.38 4.66 19.84 4 2.98 3.35 1.27 0.75 1.27 0.18 0.00 0.52 0.04 2.90 1.70 4.13 19.09 5 1.60 0.30 1.77 2.16 2.97 0.68 0.07 0.00 0.48 0.39 5.93 7.07 23.42 6 5.12 1.94 2.19 1.26 1.51 0.81 0.00 0.00 0.06 0.38 3.78 4.75 21.80 7 1.66 3.57 0.97 1.34 0.27 0.20 0.62 0.23 0.59 2.06 2.81 2.78 17.10 8 3.77 0.54 1.85 0.69 1.20 0.09 0.00 0.04 0.01 0.40 2.29 2.93 13.81 9 1.52 0.91 1.57 0.35 2.18 1.14 0.00 0.38 0.08 0.65 1.22 1.81 11.81 10 2.77 1.03 2.10 2.92 1.53 1.00 0.00 0.86 0.79 2.06 1.94 4.31 21.31 11 1.73 1.23 4.26 2.12 2.20 0.69 0.60 0.00 0.01 0.65 1.99 0.94 16.42 12 2.76 2.19 3.72 1.92 1.10 2.36 0.07 0.00 0.00 1.96 5.13 5.66 26.87 13 0.96 0.49 0.56 1.04 0.69 0.39 0.00 0.42 2.76 0.20 1.12 0.36 8.99 14 0.78 4.55 3.50 0.82 0.47 0.54 0.10 0.63 2.04 M0.00 13.43 ----------
Product generated by ACIS - NOAA Regional Climate Centers.

Appendix E
Literature Cited
Adamus, Paul, Janet Morlan, and Kathy Verble.
2010 Manual for the Oregon Rapid Wetland Assessment Protocol (ORWAP). Version 2.0.2. Oregon Department of State Lands, Salem, Oregon.
Cowardin, L.M., Carter, V., Golet, F.C., and E.T. LaRoe.
1979 Classification of Wetlands and Deepwater Habitats of the United States. Washington, D.C: Government Printing Office.
Environmental Laboratory
1987 Corps of Engineers Wetland Delineation Manual. Vicksburg, MS., U.S. Army Engineer Waterways Experiment Station, Technical Report Y-87-1.
2010 Regional Supplement to the Corps of Engineers Wetland Delineation Manual: Western Mountains, Valleys, and Coast Region (Version 2.0). Vicksburg, MS., U.S. Army Engineer Research and Development Center, ERDC/EL-10-3.
2014 State of Oregon 2014 Wetland Plant List. Lichvar, R.W., M. Butterw ick, N.C. Melvin, and W.N. Kirchner. 2014. The National Wetland Plant List: 2014 Update of Wetland Ratings. Phytoneuron 2014-41: 1-42. Vicksburg, MS., U.S. Army Engineer Research and Development Center, Cold Regions Research and Engineering Laboratory, ERDC/CRREL.
HDR
2010. Gold Ray Dam Project, Final Environmental Assessment.
Hitchcock, C. L. and A. Cronquist.
1973 Flora of the Pacific Northwest, University of Washington Press.
Johnson, David R.
1993 Soil Survey of Jackson County Area, Oregon. Prepared for the United States Department of Agriculture, Soil Conservation Service.
Munsell Color Services.
2009 Munsell Soil Color Charts. Revised Edition. New York: GretagMacbeth.
Nadeau, T-L.
2011 Streamflow Duration Assessment Method for Oregon, U.S. Environmental Protection Agency, Region 10, Document No. EPA 910-R-11-002.

National Oceanic and Atmospheric Administration (NOAA).
2014 NOAA National Weather Service Forecast Office Observed Weather Reports: Medford. http://www.nws.noaa.gov/climate/index.php?wfo=pqr. Accessed October 6, 2014.
Oregon Watershed Enhancement Board (OWEB).
2001 Oregon Watershed Assessment Manual: Appendix A-Ecoregion Descriptions. http://www.oregon.gov/OWEB/docs/pubs/wa_manual99/apdx1-ecoregions.pdf
Thorson, T.D., S.A. Bryce, D.A. Lammers, A.J. Woods, J.M. Omernik, J. Kagan, D.E. Pater, and J.A. Comstock.
2003 Ecoregions of Oregon. Color poster with map (map scale 1:1,500,000), descriptive text, summary tables, and photographs. U.S. Geological Survey, Reston, Virginia.U.S.
U.S. Army Corps of Engineers (USACE).
1987 U.S. Army Corps of Engineers Wetlands Delineation Manual. Technical Report Y-87-1. U.S. Army Corps of Engineers, Waterways Experiment Station, Vicksburg, Mississippi.
2005 Regulatory Guidance Letter (RGL) 05-05 Ordinary High Water Mark Identification. December 2005.
U.S. Department of Agriculture, National Resource Conservation Service (NRCS).
2011 Field Indicators of Hydric Soils in the United States, A Guide for Identifying and Delineating Hydric Soils, Version 7.0.
2014a USDA Field Office Climate Data. WETS Station: Medford Rogue Vly AP, OR225. http://agacis.rcc-acis.org/41029/wets/results. Accessed October 3, 2014.
2014b OR632-Jackson County Area, Oregon, Parts of Jackson and Klamath Counties: Hydric Soil List - All Components. http://websoilsurvey.nrcs.usda.gov/app/WebSoilSurvey.aspx. Accessed October 6, 2014.
2014c PLANTS Database. http://plants.usda.gov/java. Accessed October 3, 2014.
2014d Watershed Boundary Dataset (WBD) for Oregon GIS shapefile. http://datagateway.nrcs.usda.gov/ Accessed October 1, 2014.
U.S. Environmental Protection Agency (EPA).
2013a Level IV Ecoregions of the Conterminous United States GIS shapefile. Published April 16, 2013. ftp://ftp.epa.gov/wed/ecoregions/us/Eco_Level_IV_US.htm

2013b Level III Ecoregions of the Conterminous United States GIS shapefile. Published April 16, 2013. ftp://ftp.epa.gov/wed/ecoregions/us/Eco_Level_III_US.htm
U.S. Geological Survey (USGS).
1983 Sams Valley, Oregon Quadrangle. Historic Topographic Map Collection, Scale 1:24,000. http://ngmdb.usgs.gov/maps/TopoView/. Accessed October 6, 2014.
U.S. Fish and Wildlife Service (USFWS).
2014 National Wetland Inventory Wetlands Mapper. http://www.fws.gov/wetlands/Data/Mapper.html. Accessed October 6, 2014.

Attachment A-2:
Supplemental Wetland Delineation Update Memo

PacifiCorp | Sam’s Valley Reinforcement Project MEMO
Memo Date: Tuesday, September 08, 2015
Project: Sam’s Valley Reinforcement Project
To: Lauren Brown, DSL; John Aniello, Brian King, Jordon Messinger; PacifiCorp,
From: Mike Witter, Matt Hutchinson, HDR
Subject: Wetland Delineation Report Update
1.0 Introduction This memorandum was written to amend data that were originally presented in the Wetlands and Waters Delineation Report prepared by HDR, dated April 20, 2015. This original report was reviewed by Ms.Lauren Brown, Jurisdiction Coordinator at the Oregon Department of State Lands (ODSL). In an email dated July 9, 2015, Ms. Brown provided initial feedback to HDR on the draft report with following comments:
1. Soil pits were not deep enough to determine the presence or absence of hydric soil and hydrology indicators (especially for a September determination).
2. Sample plot 19 is mapped as upland, however, the data sheet is wet. 3. The Arid West Supplement and Arid plant lists are more applicable to the Rogue Valley.
Following this feedback, HDR scheduled a meeting with Ms. Brown to go over her comments and get any additional insight prior to initiating follow-up field work. Mike Witter and Matt Hutchinson from HDR met with Ms. Brown on July 30, 2015. In order to validate the delineated wetland boundary, Ms. Brown has requested that HDR reevaluate certain soil pits that were part of wetland data plots at the site where investigators were unable to dig down to the required depths to support the soil determination conclusions. At the meeting, we specifically targeted upland soil pits at SP#4, #17, #20, #24, and #26. These soil pits were determined to be in upland, largely based on observed soil conditions; but the soil profiles analyzed were not deep enough (12-inches) to support those conclusions according to ODSL.
At the July 30 meeting Ms. Brown also indicated that more data would be useful for two portions of the site, in order to support the wetland determinations in these areas. These two areas were near photo point #p23 and in the vicinity of soil pits #24 and #25.
Ms. Brown was correct in her observations concerning Sample Plot #19, but this was because the numbers for Sample Plot #18 and #19 had been transposed in the original report. Sample Plot #18 was intended as the upland plot, and #19 was to represent the wetland side of the boundary. Ms. Brown’s comment was incorporated in the revised map so that Sample Plot #19 represents a wetland plot.
Page 1 of 10

PacifiCorp | Sam’s Valley Reinforcement Project MEMO
2.0 Methods To address additional data needs, HDR conducted an additional field visit on September 1 and 2, 2015. The existing sample plot locations were loaded into a hand-held Trimble GPS receiver capable of sub-meter accuracy, and field crews used these coordinates to navigate to the suspect locations. Pits were excavated with a combination of a shovel and a 3-inch bucket auger, but a pick-axe was required in some areas to excavate these soils to the required depth. A total of eight soil pits were sampled during the September 2015 field visit. Of these, seven soil pits were dug next to the previous sample plots that had been excavated to insufficient depths (between 8 and 14 inches) during the original survey. Additionally, one new sample plot was collected in an area that had not been sampled during the original visit, but appeared to have the potential to be a wetland, based on aerial photos.
New sample plots were excavated to depths of 15-24 inches, no more than 13 feet away from the original sample plot. Previously recorded indicators for vegetation, soil, and hydrology were reviewed for accuracy at each sample plot. For ease of comparison, newly sampled soil profiles were recorded for each pit on their original data forms, which are included as an attachment to this memo.
3.0 Results Data collected at the updated sample plots confirmed all of the original findings for vegetation, soil, and hydrology indicators. There were no changes in the findings for vegetation and hydrology indicators at any of the sample plots that were revisited. Although some of the soil profiles had minor differences, such as subtle changes in matrix colors or redox percentages, these minor differences did not change the hydric soil indicator outcomes. Table 1 provides a summary of updated sample plot findings. Detailed soil profile data can be found in the attached data forms.
Using the Arid West Regional Supplement for this delineation (as suggested by ODSL during their initial review) would not affect the results of this wetland delineation. When comparing the wetland indicator status for plant species found to dominate these plots, HDR found that some of the indicators were different, but the conclusions as to whether the plant communities were hydrophytic or not did not change. Also the soil and hydrology indicators were slightly different, but none of these differences would have changed any of the wetland determination conclusions.
Page 2 of 10

PacifiCorp | Sam’s Valley Reinforcement Project MEMO
Table 1: Updated Sample Plot Soils Sample Point
Associated Wetland/Waterbody
Original Excavation
Depth (inches)
Updated Excavation
Depth (inches) Original Soil
Indicators Updated Soil
Indicators Photo
SP-4 Upland 9 20 No hydric soil indicators present
No hydric soil indicators present
SP-16 Wetland B 9 20 F6-Redox Dark
Surface F6-Redox Dark
Surface
Page 3 of 10

PacifiCorp | Sam’s Valley Reinforcement Project MEMO
Sample Point
Associated Wetland/Waterbody
Original Excavation
Depth (inches)
Updated Excavation
Depth (inches) Original Soil
Indicators Updated Soil
Indicators Photo
SP-17 Wetland B 8 16 No hydric soil indicators present
No hydric soil indicators present
SP-19 Wetland B 14 19 F6-Redox Dark
Surface F6-Redox Dark
Surface
Page 4 of 10

PacifiCorp | Sam’s Valley Reinforcement Project MEMO
Sample Point
Associated Wetland/Waterbody
Original Excavation
Depth (inches)
Updated Excavation
Depth (inches) Original Soil
Indicators Updated Soil
Indicators Photo
SP-20 Wetland B 12 16.5 No hydric soil indicators present
No hydric soil indicators present
SP-24 Upland 8 15 No hydric soil
indicators present
No hydric soil indicators present
Page 5 of 10

PacifiCorp | Sam’s Valley Reinforcement Project MEMO
Sample Point
Associated Wetland/Waterbody
Original Excavation
Depth (inches)
Updated Excavation
Depth (inches) Original Soil
Indicators Updated Soil
Indicators Photo
SP-26 Upland 12 24 No hydric soil indicators present
No hydric soil indicators present
SP-30 (new)
Upland n/a 18 n/a No hydric soil indicators present
Page 6 of 10

PacifiCorp | Sam’s Valley Reinforcement Project MEMO
Sample Point
Associated Wetland/Waterbody
Original Excavation
Depth (inches)
Updated Excavation
Depth (inches) Original Soil
Indicators Updated Soil
Indicators Photo
SP-30 (new)
Page 7 of 10
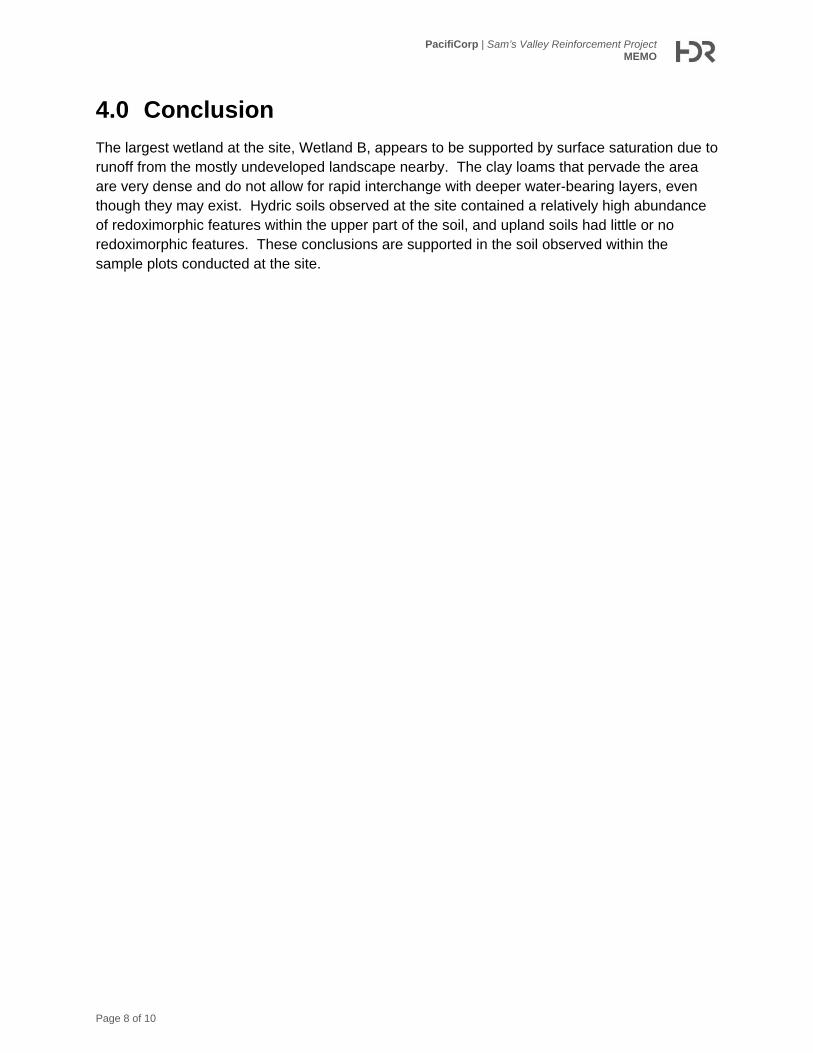
PacifiCorp | Sam’s Valley Reinforcement Project MEMO
4.0 Conclusion The largest wetland at the site, Wetland B, appears to be supported by surface saturation due to runoff from the mostly undeveloped landscape nearby. The clay loams that pervade the area are very dense and do not allow for rapid interchange with deeper water-bearing layers, even though they may exist. Hydric soils observed at the site contained a relatively high abundance of redoximorphic features within the upper part of the soil, and upland soils had little or no redoximorphic features. These conclusions are supported in the soil observed within the sample plots conducted at the site.
Page 8 of 10

PacifiCorp | Sam’s Valley Reinforcement Project MEMO
Attachment A: Wetland Delineation Amendment


")
")")
")
")
")
")")")
")
")
")")
")")
")")
")
")
")")
")")
")")
")
")
")")
")
")
")
")
")
")
")")
sp1
sp2
sp3sp4
sp5
sp6
sp7
sp8
sp9sp10
sp11
sp12
sp13
sp14
sp15
sp17
sp16
sp19
sp18sp20
sp21
sp22
sp23
sp24
sp25
sp26
sp29
sp27
sp28
sp19 sp20
sp24
sp26
sp4
sp30
sp17
sp16
WetlandExtends Offsite
Wetland C
Wetland B
Wetland A
SAMS VALLEY HWY 234TRESHAM LN
Wetland Delineation Amendment Map
Sam's Valley | PacifiCorp
Data S
ource:
ESRI, Ja
ckson C
ounty,
HDR
±0 400200
Feet
") Original Sample Plot
") Updated Sample Plot
Study Area
Delineated Wetland
Figure 1
*Data plot locations, wetland boundaries were recorded using a resource gradeTrimble GeoXH 6000 Global Positioning System (GPS). Mapping accuracy of the unit is 50 cm (1.64 feet) using post-processed differential data correction (DGNSS). GPS data was post-processed and corrected after data was downloaded.
Aerial Image Date: 6/28/2010
