b services trade in numbers - world trade organization · 2019-11-14 · b services trade in...
TRANSCRIPT

B Services trade in numbersThis section presents the importance of trade in services in the global economy by using an experimental dataset, developed by the WTO, called Trade in Services by Modes of Supply (TISMOS). This dataset captures services supplied through the four modes of supply categorized in the WTO General Agreement on Trade in Services (GATS); traditional services trade statistics cover only three of the GATS modes of supply. This section also discusses the participation of developing economies, including least-developed countries (LDCs), the importance of micro, small and medium-sized enterprises (MSMEs), and the role of women in services trade. Finally, the section explores the content of services value-added in international global value chains.

Contents1. Trends in trade in services 22
2. Global trade in services through all modes of supply is worth US$ 13.3 trillion 22
3. Who trades services? 31
4. What is the role of services in global value chains? 44
Some key facts and findings
• Trade in services expanded faster than trade in goods between 2005 and 2017, at 5.4 per cent per year on average.
• Commercial presence in another country (mode 3) is the dominant mode of supply for trading services globally, representing almost 60 per cent of trade in services in 2017.
• The contribution of developing economies to trade in services grew by more than 10 percentage points between 2005 and 2017, but remains largely concentrated in five economies.
• Services MSMEs start exporting quicker than manufacturing MSMEs. Firms owned by women are under-represented in services exports, but less so than in manufacturing.
• Services value-added accounts for close to half of the value of international goods and services trade.

WORLD TRADE REPORT 2019
22
1. Trends in trade in services
International trade in services plays an increasingly large role in the world economy and in everyday life. However, the full extent of this trade is not always understood by market participants. When a consumer purchases a smartphone or a car that was manufactured in a country other than their own, there is no doubt that international trade is involved. It is less common for consumers to realize that they are taking part in international trade when eating in a restaurant while travelling abroad, or when using a foreign car-share service in their own country. The large number of services that go into the manufacture and distribution of consumer goods may be even less obvious to the users of these products. This difficulty in grasping services trade is also illustrated in the opinion piece by Alan Beattie (see page 23).
Some misperceptions about the importance of international trade in services are due to their intrinsic characteristics of intangibility and non-storability. However, new technologies are contributing to increasing services tradability.
There are many ways that services can be traded internationally, referred to as “modes of supply”. The WTO General Agreement on Trade in Services (GATS) categorizes services trade according to four modes of supply:
• Cross-border supply (mode 1), in which services are supplied from the territory of one member (i.e. WTO member) into the territory of any other member, such as through the internet.
• Consumption abroad (mode 2), in which services are provided in the territory of one member to a consumer of any other member, such as tourism.
• Commercial presence (mode 3), in which services are delivered by a supplier of one member through commercial presence in the territory of any other member, such as establishing a controlled affiliate in a foreign country to serve the local market.
• Presence of natural persons (mode 4), in which a supplier of one member provides services through the presence of natural persons in the territory of another member, such as consultants.
The supply of services through cross-border trade is perhaps most easily recognized as international trade. Examples include consultancy services over the phone or legal services provided in one country to clients in other countries by e-mail or video. Spending by tourists in other economies and students studying
abroad are two common examples of consumption abroad. Commercial presence is when a foreign-owned retailer or bank supplies services to local consumers. Finally, an architect or engineer moving abroad temporarily in order to provide their services is an example of services supplied through the presence of natural persons.
Statisticians face various challenges in categorizing and measuring international trade in services. In some cases, the distinction between goods and services trade is unclear. For example, the streaming of a film from a digital platform based in another country is counted as trade in services, but if the film is stored on an imported DVD, it is considered to be trade in goods.
Services can also enter manufacturing production processes, either as high-value inputs such as engineering services, or as lower-value inputs such as assembly – that is, they are inputs in an international transaction of goods. Trade statistics in value-added terms reveal the importance of services inputs in the international trade of goods and services.
2. Global trade in services through all modes of supply is worth US$ 13.3 trillion
According to TISMOS (see Box B.1), global trade in commercial services was worth US$ 13.3 trillion in 2017. These estimates present a comprehensive picture of services in world trade according to international treaties such as the GATS. Trade in services has expanded by 5.4 per cent per year on average since 2005, faster than the 4.6 per cent yearly expansion of trade in goods.
Figure B.1 shows the importance of the four modes of supply in services trade. With a value of US$ 7.8 trillion, sales1 through the establishment of foreign-controlled affiliates worldwide (mode 3) are the dominant mode for trading services globally (58.9 per cent), in an unchanged pattern since 2005. Financial services and distribution services together account for around half of this value.
Cross-border services transactions (mode 1), including through electronic means, totalled US$ 3.7 trillion in 2017 with a 27.7 per cent share. Cross-border trade is widespread across different services sectors, including transport, professional and business services, distribution services and communications services, as well as computer services and related activities.
23
THE FUTURE OF SERVICES TRADE
23
The case of the missing services
Whenever a newspaper needs to illustrate a story about trade, at least seven times out of ten the result is a photograph of 20-foot containers stacked on a cargo ship or resting on a quay. It is a natural tendency, generally reflecting a bias towards the writing itself, to focus on goods rather than services – and to use cases from manufacturing or agriculture to illustrate basic concepts about cross-border commerce. When writing about a broad issue like trade, readers like examples that they can see and touch.
For the media, the bias away from services trade goes beyond ease of comprehension and illustration, for several reasons.
One, journalism thrives on conflict, and there are rarely major trade disputes over services trade. Since China’s accession to the WTO, for example, the most high-profile litigation with the European Union and United States has been over garments, solar panels, trade defence methodologies and non-market economy status. Even between the European Union and United States, two advanced economies where the proportion of bilateral trade taken by services has been trending higher, the big fights have been over aircraft subsidies and bananas rather than the alignment of accounting standards.
Two, services sector industries are often less well set up at lobbying and
communications than manufacturers, and thus less likely to get coverage. The Brexit negotiations are a case in point. Much of the debate in the United Kingdom has been focused on car production, some of which is located in formerly depressed areas and which stands as a symbol for industrial regeneration reliant on the European Single Market. The car companies have been well organized, both collectively through the Society of Motor Manufacturers and Traders, and singly through individual companies like Nissan and Honda.
Farming and fishing, too, have featured heavily in the debates, from the threat of imports of the infamous chlorine-washed American chicken to the fate of Britain’s beleaguered deep-sea fishing fleet. The tiny size of these in terms of UK GDP – Harrods almost certainly creates more value than Britain’s entire fishing industry – is outweighed by symbolism and sentiment.
By contrast, although finance and associated sectors like business and legal services constitute a larger part of the economy than car manufacture, the industry itself has been split between different lobby groups. It has struggled to attract attention to the potentially serious loss of economic activity and jobs that leaving the European Single Market would entail. Banks and finance houses are more used to lobbying domestic regulators and established
forums of international rules, such as the Basel Committee on Banking Supervision, than trade negotiations, which have traditionally had only weak coverage of financial services.
Three, as well as its relatively weak symbolism and underdeveloped skill at lobbying, the complexity of services deals also militates against media coverage. It is relatively easy, for example, to follow and describe arguments over agricultural tariffs and quotas than the traditional sector-by-sector request-offer process in services or free trade agreement annexes on regulatory cooperation over professional qualifications. The Trade in Services Agreement talks got relatively little coverage, partly because they were held in relative secrecy but also because it is hard to report on negotiations where dozens of sub-sectors with different forms of regulation are all being discussed at once.
There is no automatic solution to the under-covering of services in the media, except for companies and trade officials to get better at talking to journalists – including by generating easy-to-understand examples – and for journalists to make an effort to feature them. One way of raising their profile would be to have a huge transatlantic or transpacific trade war over a particular service industry. But that would seem a slightly excessive way of doing it.
OPINION PIECE
By Alan Beattie, European Editorial Writer, Financial Times

WORLD TRADE REPORT 2019
24
Box B.1: What is TISMOS?
Due to a lack of comprehensive official data on trade in services by mode of supply, the WTO has produced an “experimental” dataset which is called TISMOS (i.e. Trade in Services by Mode of Supply). This dataset uses both official figures and estimates to cover services exports and imports of some 200 economies from 2005 to 2017. It features a breakdown by sector and the first-ever comprehensive estimate of how much services are traded through the four modes of supply as defined in the WTO’s General Agreement on Trade in Services. TISMOS uses several assumptions and statistics are adjusted to meet the scope of trade in services in international or regional treaties such as the GATS. These are further explained at https://www.wto.org/english/res_e/statis_e/trade_datasets_e.htm#TISMOS
TISMOS is based on the 2010 edition of the Manual on Statistics of International Trade in Services (MSITS, 2010). This manual suggests two statistical frameworks to draw from for compiling international trade in services statistics: the balance of payments (BOP) and Foreign Affiliates Statistics (FATS).
An economy’s balance of payments provides information on services transactions for cross-border supply (mode 1), consumption abroad (mode 2) and the presence of natural persons (mode 4), while Foreign Affiliates Statistics (FATS) offer information on trade via commercial presence (mode 3).2
TISMOS allocates services transactions recorded in an economy’s balance of payments either to one dominant mode, or, where there is no single dominant mode, to the most significant mode of supply (known as a “simplified approach”). When possible, country studies are included to refine the default allocation (referred to as “enhanced simplified approach”).
As mentioned above, the FATS framework is used to estimate trade through commercial presence. A worldwide dataset of FATS output, classified by activity (International Standard Industry Classification of Industries (ISIC)), has been built.
TISMOS combines both datasets through a correspondence table and estimates the relative importance of the modes of supply in the international trade in services at the level of individual economies. Sectoral and regional aggregates are obtained by aggregation.
TISMOS is an analytical and not a statistical dataset, since, as mentioned above, it includes assumptions and estimates. One of its main purposes is to produce information for monitoring, research and economic modelling.
Interlinkages of modes are somewhat reflected through the use of existing balance of payments and foreign affiliates statistics. It is hoped that TISMOS will develop over time into an international benchmark to which compilers and academics will be able to contribute. Once data compilers capture modes of supply in their data collection, TISMOS will be able to become a statistical dataset.
Figure B.1: Commercial presence is the most important mode in trade in services World trade in commercial services by mode of supply, 2017
27.7%10.4%
58.9%
2.9%
2017Cross-border transactions (mode 1)
Consumption abroad (mode 2)
Commercial presence in another country (mode 3)
Presence of individuals in another country (mode 4)
Source: WTO estimates (2019).
Note: World trade is calculated as the average of world exports and world imports.

25
THE FUTURE OF SERVICES TRADE
Services consumed in other countries (mode 2) accounted for US$ 1.4 trillion and 10.4 per cent of total trade in services, with tourism accounting for more than 60 per cent of the value.
Only US$ 0.4 trillion, or 2.9 per cent, of services are traded worldwide through the presence of persons abroad (mode 4), but this share may vary for individual economies or sectors.
Figure B.2 shows developments in trade in services by sector. Computer services, research and development (R&D) services and health services recorded very rapid growth, at 10 per cent and above on average per year, since 2005, and a wide range of other services sectors followed closely.
Distribution services and financial services are the largest traded services globally, with US$ 2,634 billion and US$ 2,463 billion respectively, and they account for 19.9 per cent and 18.6 per cent of total services trade in 2017.
Wholesalers and retailers have a crucial role in international trade, connecting producers and consumers worldwide, thus ensuring consumers’
access to a variety of goods at competitive prices. The financial sector is the backbone of the economy, and one of its key functions is to enable international transactions, facilitating the smooth exchange of goods and services between countries, while managing the risks associated with their flows.
According to estimates, world trade in financial services and in distribution services takes place predominantly by means of the establishment of a commercial presence in other countries (mode 3). In 2017, around 77 per cent of financial services, or some US$ 1,941 billion, and over 70 per cent of distribution services, some US$ 1,852 billion, were traded worldwide through foreign affiliates.
However, increased digitalization, e-banking, mobile banking and online sales are reshaping the business models for the finance and distribution sectors. Although banks and other financial services institutions maintain affiliates abroad for operations, they are adapting to changes in consumers’ preferences by offering an increasing number of services online, from credit card transactions to finance management. Insurance companies are making it possible to underwrite and submit claims
Figure B.2: Distribution and financial services are the most traded services3 World trade in commercial services by sector, 2005 and 2017
Source: WTO estimates (2019).
Note: World trade is calculated as the average of world exports and world imports.
0%
2%
4%
6%
8%
10%
12%
14%
16%
18%
20%
0200400600800
1,0001,2001,4001,6001,8002,0002,2002,4002,6002,800
Distrib
ution
servi
ces
Finan
cial s
ervic
es
Telec
ommun
icatio
ns, c
ompu
ter
servi
ces,
audio
visua
ls
Tran
spor
t
Tour
ism
Other b
usine
ss se
rvice
s
Profes
siona
l ser
vices
Constr
uctio
n
Intell
ectua
l pro
perty
-relat
ed
servi
ces
Resea
rch a
nd d
evelo
pmen
t
servi
ces
Recre
ation
al, cu
ltural
and
spor
ting
activ
ities
Educa
tiona
l ser
vices
Rental
and
leasin
g se
rvice
s
Health
servi
ces
Enviro
nmen
tal se
rvice
s
2005 2017 Share in world trade in services
19.9%
18.6%
13.2%
11.8%
7.8%
3.9%3.4% 3.4% 3.0%
1.4% 0.9% 0.8%0.5% 0.4% 0.2%
B. S
ER
VIC
ES
TR
AD
E
IN N
UM
BE
RS

WORLD TRADE REPORT 2019
26
online. These are only a fraction of the online cross-border services that digitalization is expected to bring to the industry in the near future.
As a result, the share of services exports through branches and subsidiaries established in other economies is declining in leading developed traders. For example, in the European Union, this trend started in the financial sector after the 2008-09 global financial crisis, alongside the structural transformation that the banking system underwent post-crisis (see Figure B.3). In 2017, the share of financial services exported by European Union-controlled affiliates was 6 percentage points lower than in 2005, matching development in the United States. At the same time, the United States’ financial services exports through cross-border transactions almost tripled compared with 2005, reaching US$ 109.6 billion.
In distribution services, electronic payments, innovative software and evolving mobile technology are enabling consumers to order goods online from anywhere in the world. This has resulted in a boom of online cross-border sales with many wholesalers and retailers, especially in developed economies, closing physical stores and choosing to sell online, or blending physical presence with online ordering and delivery options.4 Distributors face fierce competition, especially on the web, and, in order to satisfy consumers’ expectations of fast delivery, they need to be able to rely on transport operators.
Whether products are ordered online or through traditional means, the distribution of goods, including internationally, requires an efficient transport and logistics industry. In 2017, one-third of global trade in transport, or US$ 529 billion, related directly to the
Figure B.3: EU and US cross-border financial and insurance services exports are growing faster than exports through foreign-controlled affiliatesEU and US cross-border exports of financial and insurance services and exports through controlled affiliates abroad (mode 3), 2005-17
Source: WTO estimates (2019).
Note: The European Union is calculated as the sum of the 28 EU member states and includes intra-EU trade.
0
50
100
150
200
250
300
2005 2006 2007 2008 2009 2010 2011 2012 2013 2014 2015 2016 2017
Inde
x 20
05=
100
European Union
0
50
100
150
200
250
300
2005 2006 2007 2008 2009 2010 2011 2012 2013 2014 2015 2016 2017
Inde
x 20
05=
100
Cross-border financial and insurance services exportsExports through controlled foreign affiliates in the financial sector
United States

27
THE FUTURE OF SERVICES TRADE
cost of shipping goods across economies, mainly by sea or by air. Supporting transport services such as cargo handling, storage and warehousing made up an additional 16 per cent.
Overall, around half of world trade in transport services is driven by trade in goods, including both goods that directly reach consumers and those that are used as inputs in production processes. This makes the transport sector vulnerable, as freight shipping rates are volatile and fluctuate according to global demand. Since 2005, the transport industry has faced challenges due to weak merchandise trade flows following the global financial crisis, stagnating economic conditions and overcapacity, with 2009, 2015 and 2016 as the worst years on record. Developed and developing economies5 were equally affected.
However, transport is vital not only for trading goods, it is essential to move people across the globe, for business or for leisure, enabling also other services to be traded internationally. In the last decade, the rise of low-cost airlines, coupled with the multiplication of direct routes, especially at the regional level, has not only changed the air transport industry, but has fostered impressive growth in international tourism (see Figure B.4).
As the number of international tourist arrivals worldwide rose to some 1,330 million in 2017, up
from 809 million in 2005 (UNWTO, 2018), world trade in tourism reached US$ 1,029 billion, almost doubling its 2005 value. International tourism is the most inclusive service sector with participation in trade by economies at all levels of development. In developing economies, the tourism and travel-related industry records the highest contribution in exports by micro, small and medium-sized enterprises (MSMEs) and by women (WTO estimates based on World Bank Enterprise Surveys). The new trend towards sustainable and green tourism will offer further export opportunities to areas not yet touched by tourism development.
Foreign travellers’ expenditure during stays abroad enters the tourism value chain directly via the hospitality sector, transport, retail, entertainment and cultural activities etc. Tourism indirectly contributes to the development of other sectors such as conference and events management or communications. It also drives the construction of infrastructure and accommodation.
In 2017, trade in construction reached US$ 445 billion, with an average annual growth of 7 per cent since 2005, and a share in global services trade of 3.4 per cent. The last decade has seen the emergence of China as a global construction exporter, involved in large infrastructural building projects. (see Figure B.5). China, whose exports reached US$ 188 billion and accounted for over one-third of global construction exports (37.3 per cent) in 2017, up from
Figure B.4: World trade in air passenger transport services and world trade in tourism develop in parallelWorld trade in air passenger transport services and world trade in tourism, 2005-17
Source: WTO estimates (2019).
World trade in air passenger transport services World trade in tourism
80
100
120
140
160
180
200
2005 2006 2007 2008 2009 2010 2011 2012 2013 2014 2015 2016 2017
Inde
x 20
05=
100
B. S
ER
VIC
ES
TR
AD
E
IN N
UM
BE
RS

WORLD TRADE REPORT 2019
28
8.4 per cent in 2005, ranked as the second largest exporter in the world after the European Union.
Chinese firms are active in the construction of bridges, harbours, roads and railways, in Africa and in other developing regions. China’s construction exports are expected to rise further with the “Belt and Road Initiative”, an initiative launched in 2013 by the Chinese government aiming at infrastructure development and investment in many economies.
Technology is permeating all services sectors and gradually transforming them. This is the result of the synergy between the telecommunications industry and its provision of high-speed connectivity such as 5G, the IT sector and its development of innovative industry-specific software, and robotics, thanks to a thriving R&D sector.
For example, the construction sector is increasingly making use of advanced technology in its operations, such as drones for the aerial surveillance of building projects, replacing land surveillance, and construction through automated modular 3D printing, to cut costs and compensate for skilled labour shortages. In addition, with prefabricated construction taking place indoors in factories and just assembly work onsite, the definition of construction as a service is becoming blurred. At present, over 90 per cent of construction and related engineering
services are traded worldwide through a commercial presence abroad; however, it is already possible for construction to be traded across borders too.
Trade in information and communication technology (ICT) services, including computer services and related activities (IT services) was estimated at US$ 1,756 billion in 2017, more than doubling since 2005.6 The sector has recorded remarkable growth in the last decade, with IT services expanding by 11 per cent annually on average. IT services were resilient during the financial crisis due to a regular demand for new software as well as mounting cybersecurity concerns.
World exports of IT services were estimated at US$ 438 billion in 2017 (see Figure B.6), predominantly exported through cross-border transactions, with the European Union as the largest global exporter and India ranking second. Over the years, India has become a prominent exporter of IT services, with the United States and Canada as the main importers. In 2017, India’s exports exceeded US$ 52 billion, of which some 13 per cent was exported through the deployment of IT professionals abroad (mode 4).
IT firms in India and in other economies are increasingly expanding their core services to include product development. This segment, including new technologies such as the Internet of Things, cloud
Figure B.5: China’s construction exports are escalatingConstruction exports by China, developed economies, other developing economies and LDCs, 2005-17
Source: WTO estimates (2019).
0
200
400
600
800
1,000
1,200
1,400
2005 2006 2007 2008 2009 2010 2011 2012 2013 2014 2015 2016 2017
Inde
x 20
05=
100
China Developed economies Other developing economies and LDCs

29
THE FUTURE OF SERVICES TRADE
analytics and artificial intelligence, is expected to boost not only the IT industry and global trade in computer services, but also trade in intellectual property (IP)-related services in the next few years.
IP-related services cover, for example, fees for the reproduction and distribution of copyrights on computer software, audio-visuals, books, broadcasting and recording of live performances. Fostered also by mobile technology and digital
means, trade in IP-related services is growing rapidly. In the last five years, the boom of on-demand music and video streaming, such as through online platforms, has turned audio-visuals into the most dynamic segment of the United States’ IP-related services exports (see Figure B.7).
While innovating the audio-visuals industry, digitalization has also revolutionized the advertising services sector. With a young generation of full-time
Figure B.6: IT services are exported across borders and through the presence of individualsWorld exports of IT services through cross-border transactions (mode 1) and through the presence of natural persons or individuals (mode 4), 2005-17
Source: WTO estimates (2019).
Figure B.7: Films, music and software drive US exports of IP-related servicesCross-border exports of IP-related services by selected product in the United States, 2006-17
Source: US Bureau of Economic Analysis (2018).
0
50
100
150
200
250
300
350
400
2005 2006 2007 2008 2009 2010 2011 2012 2013 2014 2015 2016 2017
US
$ b
illio
n
Cross-border transactions (mode 1) Exports through the presence of individuals abroad (mode 4)
2,973
4,799
6,104 6,2035,228 5,697
6,570 6,474 6,714 6,795
7,593
9,957
1,520 1,548
1,782 1,912 1,6612,101
2,566 2,4363,276
4,588
6,210
6,933
753 744 780 794 913 1,130 1,3822,179
2,6163,151
3,789
5,418
2006 2007 2008 2009 2010 2011 2012 2013 2014 2015 2016 2017
US
$ b
illio
n
Computer software Films and television programming Books and sound recordings
B. S
ER
VIC
ES
TR
AD
E
IN N
UM
BE
RS

WORLD TRADE REPORT 2019
30
streamers and influencers on social media, advertising is moving away from traditional media, such as television, radio and newspapers, and into digital channels. Data collected through social media platforms, search engines and websites enable the creation of automated and personalized advertisements which can reach potential customers from all over the world. As a result, firms worldwide have turned increasingly to online advertising for their goods and services. For example, since 2006, US exports of cross-border advertising services have almost quadrupled, while the share of exports through US affiliates established in other economies dropped by more than 23 percentage points (US Bureau of Economic Analysis, 2018).
IP-related services cover also fees relating to the international use of patents, outputs from R&D, industrial processes and designs, as well as franchises and trademarks. In general, cross-border trade in IP-related services, estimated overall at US$ 396 billion, is dominated by flows between developed countries (92 per cent of exports and 75 per cent of imports) (see Figure B.8).
However, innovation and creativity thrive in several developing economies, where the applications for patents, industrial designs and trademarks record outstanding growth (WTO, 2018b). Digital communications, IT and electrical machinery were the main areas of technology for patent
applications in China in 2017, while Singapore focused on IT, semiconductors, pharmaceuticals and biotechnologies. The Republic of Korea ranked third globally for applications for industrial designs, mainly in ICT and audio-visuals in the same year (WIPO, 2018). Innovation has translated into a significant rise of developing Asia’s IP-related services exports (17 per cent on average per year since 2005).
In the Middle East, Israel is an international hub for research and innovation ranging from IT to medical technologies and pharmaceuticals. In 2017, Israel ranked first in the world for R&D expenditure (4.5 per cent of GDP), and fourth for exports of R&D services, behind the European Union, the United States, and China.
Once developed, goods or services need to be marketed. However, exploring business or trade opportunities in foreign markets is a challenging task for firms, irrespective of their size. Firms need guidance on strategies and operations to ensure market viability of their goods or services, as well as their legal protection. Companies need also advice, for instance, on taxation in different jurisdictions and on data privacy, as well as bookkeeping. The last decade’s rapid growth of trade in management consulting services, legal services and accounting services mirrors to a large extent the globalization of the economy. Trade in professional and management consulting services through cross-border transactions
Figure B.8: Trade in IP-related services is dominated by developed economiesCross-border trade in IP-related services, 2017
Source: WTO estimates (2019).
Note: The European Union is calculated as the sum of the EU member states and includes intra-EU trade.
Exports Imports
39%
34%
11%
8%
2%2%
4%
50%
13%
5%7% 7% 4%
14%
European Union
United States
Japan
Other developed economies
Other developing economies
Singapore
China
Republic of Korea

31
THE FUTURE OF SERVICES TRADE
and the physical presence of professionals abroad expanded by 8 per cent on average per year since 2005, to total US$ 308 billion, with the largest share, around 70 per cent, held by developed economies.
Digitalization is also transforming professional services. The number of virtual law firms and freelance management consultants on digital platforms is growing. With no physical offices to run, they have lower operating costs and clients can benefit from reduced fees. Artificial intelligence and machine-learning can be used in accounting and bookkeeping, and several companies, thanks to such technology, may look into relocating these services back to home offices rather than importing them from other countries. Although it might still be early to see it in the numbers, a shift is under way and is likely to affect trade.
Finally, a range of services is taking baby steps in international trade, such as educational, health or environmental services. At present, these services account for a negligible share of trade, but they are rising.
Thanks to over 5 million international students worldwide in 2017, trade in educational services recorded dynamic growth (7 per cent on average annually since 2005), and a value of US$ 111 billion, or 0.9 per cent of world trade in services. English-speaking developed economies, such as the United States, the United Kingdom, and Australia are the main destinations for foreign students but developing economies are no longer only sending their students to other economies. China, Malaysia and India, among others, are emerging as exporters of educational services, attracting students mainly from other developing regions (UNESCO, 2019).
Educational services are predominantly traded through consumption abroad (mode 2). However, online distance education is growing thanks to the thousands of educational platforms flourishing on the web, addressing a variety of educational needs from primary school students to graduates. Several leading universities offer online courses in subjects from sciences to the humanities, with online tutors available to assist students. Online distance learning represents a cheaper and more flexible alternative for students worldwide who, due to financial constraints or for other reasons, are unable to travel abroad to pursue higher education. New technologies are increasingly making it possible to integrate virtual reality into education and training, thereby making e-learning an ever more thorough experience for online students.
Trade in health services, from complex surgery to rejuvenation treatments, was estimated at US$ 54 billion in 2017, with a share in world trade in services of only 0.4 per cent but recording an annual average growth of 11 per cent since 2005. Globally, over 72 per cent of health services were traded primarily by developed economies through affiliated hospitals and medical centres in other countries, and 22 per cent exported to foreign patients during their stay abroad (mode 2).
However, in the coming years, the ways in which health services will be traded may change vastly. New health services providers are emerging across all developing regions, from Asia to Latin America, offering treatment to foreign travellers such as dental work or aesthetic treatments at attractive prices, further increasing the relative importance of trade through consumption abroad. The numbers of medical travel agencies and facilitators are growing, as are those of insurance companies providing health coverage abroad to cut costs. In the meantime, 5G technology and robotics are transforming trade in health services, allowing distant diagnostics and even pioneering remote surgery and medical interventions in real time and without the physical presence of doctors.
Finally, according to preliminary estimates, some US$ 20 billion of environmental services, including waste disposal, recycling, sanitation and cleaning of pollution, were traded in 2017. Environmental services account for just 0.2 per cent of services trade; however, growing environmental concerns and ensuing regulatory initiatives, such as those which aim to reduce pollution by plastics, are boosting demand for these services worldwide, and their trade is growing (4 per cent on average annually since 2005).
From product manufacturing, assembly and design to the shipping and distribution of goods, services have traditionally been seen in a fundamental, yet supporting, role in trade, secondary to trade in goods. However, services not only facilitate trade in goods, they are themselves traded and are enablers of trade in services.
3. Who trades services?
(a) The participation of developing economies
Between 2005 and 2017, developing economies, excluding LDCs, gained over 10 percentage points in their share in global trade, reaching US$ 3.4 trillion
B. S
ER
VIC
ES
TR
AD
E
IN N
UM
BE
RS

WORLD TRADE REPORT 2019
32
in world services exports and US$ 4.5 trillion in global services imports (see Figure B.9). Such an impressive result is the outcome of a process of structural economic transformation and successful trade diversification from goods to services in several developing economies, in Asia in particular, and the emergence of new services traders and new ways to trade services.
By contrast, in the same period, LDCs increased their share in global services exports by 0.1 percentage point. In 2017, LDCs accounted for only 0.3 per cent of world services exports, or US$ 38.3 billion, and, in imports, their participation was at less than 1 per cent, with services imports totalling US$ 124.1 billion. Commercial services production in LDCs is, on average, 40 per cent of GDP, well below middle-income economies (over 50 per cent) and high-income economies (generally above 70 per cent).
In fact, income plays a role. Three out of five leading developing services traders are high-income economies, while the rest are classified as upper middle-income and lower middle-income economies.7
The participation of developing economies in services trade is not yet inclusive. A close look reveals that trade is very concentrated, with the same five
economies ranking both as leading services exporters and importers, although in a different order. In 2017, China was the leading services trader, followed by Hong Kong (China), the Republic of Korea, Singapore and India (see Figure B.10).
These five Asian economies accounted for 56.7 per cent of developing economies’ exports and 58.1 per cent of imports. They are the main drivers of developing economies’ impressive trade performance, with services exports rising by over 12 per cent on annual average since 2005, almost three times faster than in developed economies. From R&D and IP-related services to ICT services, professional services and finance, these five economies are penetrating high value-added services trade.
After 2009, the five leading developing economies substantially modified the way they export services, in a manner which increasingly resembles that of developed economies, and which matches the way the world predominantly imports services, i.e. through a commercial presence of another country.
In 2017, services exported by these five economies through branches and subsidiaries abroad made up, on average, 55.9 per cent of their services exports, a
Figure B.9: Developing economies rise in world trade in services but LDCs continue to lag behind Share in world trade in commercial services by group of economies, 2005 and 2017
Source: WTO estimates (2019).
2005 2017
ImportsExports
0.2% 0.3%02%4%6%8%
10%12%14%16%18%20%22%24%26%28%30%
32%34%36%38%
02%4%6%8%
10%12%14%16%18%20%22%24%26%28%30%
32%34%36%38%
Developing economies(excluding LDCs)
LDCs Developing economies(excluding LDCs)
0.5% 0.9%
LDCs
14.7%
25.2%23.0%
34.4%

33
THE FUTURE OF SERVICES TRADE
rise of 22 percentage points since 2005. In China and the Republic of Korea in particular, up to two-thirds of services were exported through foreign-controlled affiliates, more than half in Hong Kong, China, and around half in Singapore, too. In India, cross-border trade remains the dominant mode, with only 20 per cent of services exported through foreign-controlled affiliates in other economies. Nevertheless, this is a 12-percentage-point increase compared with 2005 (see Figure B.11).
For the five leading developing economy traders, construction, finance and distribution are the sectors
that contribute most to the remarkable growth of their
services exports through foreign-controlled affiliates
(see Figure B.12). However, in a variety of other
sectors, from professional and business services,
to ICT and transport, a shift in the way services are
exported has already occurred. In others, such as
tourism or health services, a change is well under
way. In China, the Belt and Road initiative has further
accelerated this process, with Chinese services firms
encouraged to “go global” and helped to expand
rapidly in local markets (China Ministry of Commerce,
2017).
Figure B.10: Five Asian economies account for more than half of developing economies’ exports and imports Leading developing services exporters and importers, 2005 and 2017
Source: WTO estimates (2019).
Note: Values differ from reported statistics by the above economies as they include an estimate of services exported or imported through foreign-controlled affiliates.
0.2%
7.8%
0.8%
1.4%
1.5%
1.1%
1.9%
0.3%
10.7%
1.6%
1.8%
1.9%
2.5%
6.4%
- 200 400 600 800 1,000 1,200 1,400 1,600 1,800 2,000 2,200
- 200 400 600 800 1,000 1,200 1,400 1,600 1,800 2,000 2,200
LDCs
Other 125 developing economies
India
Hong Kong, China
Republic of Korea
Singapore
China
US$ billion
Global exports (%)
0.5%
12.2%
1.1%
1.5%
1.8%
2.8%
3.0%
0.9%
16.1%
1.4%
1.9%
2.2%
3.2%
8.6%
LDCs
Other 125 developing economies
India
Singapore
Republic of Korea
Hong Kong, China
China
US$ billion
Global imports (%)
2005 2017
B. S
ER
VIC
ES
TR
AD
E
IN N
UM
BE
RS

WORLD TRADE REPORT 2019
34
Figure B.11: The top five developing economies have modified their way of exporting services over timeServices exports of selected economy groups by mode of supply, 2005-17
Source: WTO estimates (2019).
2005
2006
2007
2008
2009
2010
2011
2012
2013
2014
2015
2016
2017
2005
2006
2007
2008
2009
2010
2011
2012
2013
2014
2015
2016
2017
2005
2006
2007
2008
2009
2010
2011
2012
2013
2014
2015
2016
2017
2005
2006
2007
2008
2009
2010
2011
2012
2013
2014
2015
2016
2017
Mode 1 Mode 2 Mode 3 Mode 4
0%
10%
20%
30%
40%
50%
60%
70%
80%
0%
10%
20%
30%
40%
50%
60%
70%
80%
0%
10%
20%
30%
40%
50%
60%
70%
80%
0%
10%
20%
30%
40%
50%
60%
70%
80%
Five leading developing economies
LDCsOther 125 developing economies
Developed economies
Figure B.12: For the top five developing economies, commercial presence is the dominant mode for exporting services Five leading developing economies’ exports through foreign-controlled affiliates abroad (commercial presence) in selected services sectors, 2005 and 2017
Source: WTO estimates (2019).
91%
62%
36%
49%
27%
13%
2% 0.2%
93%
71%
62%57%
44%
34%
12%7%
0%
10%
20%
30%
40%
50%
60%
70%
80%
90%
100%
Construction Financialservices
Professionalservices and
other businessservices
Distributionservices
ICT services Transport Tourism Healthservices
2005 2017

35
THE FUTURE OF SERVICES TRADE
This is the result of substantial investment flows in services, with the five leading developing economies establishing branches and subsidiaries not only in other developing regions but also in developed economies. For example, US services imports through foreign-controlled affiliates of the five economies are rising. Between 2014 and 2016, distribution services, financial services and transport services imports through China’s affiliates established in the United States doubled, although on a small scale, while IT services imports through affiliates of Indian companies grew by 12 per cent on average annually. In the same period, the Republic of Korea held a 13 per cent share in total US imports of distribution services through a commercial presence (US Bureau of Economic Analysis, 2018 and WTO calculations).
Apart from the five leading developing economy traders, the other 125 developing economies export services differently (see Figure B.13). These other developing economies, some 125 in number, spread across all regions, have relatively fewer financial resources to set up affiliates abroad. According to estimates, in 2017 less than one-third of their services exports took place through a commercial presence. This share is 23 percentage points lower than in the five leading developing economies. For these 125 developing economies, cross-border trade is the predominant mode to export services such as in professional and other business services.
For these 125 developing economies, with relatively good levels of internet penetration, services trade digitalization can offer concrete opportunities to boost exports and gain a share of global services markets. In the meantime, exports through the consumption abroad of services, including health and educational services, can help diversify their service supply; such a trend has already started in several economies.
Turning to LDCs, since 2005, their services exports have been rising by almost 11 per cent on average per year, albeit from a very low base, with growth led by tourism. Boosted by intensified intra-regional arrivals in recent years, tourism represents an important source of revenue for LDCs and is the only services sector in which the group’s participation in global exports exceeds 1 per cent (at 1.3 per cent).
However, LDCs’ services exports are unbalanced. With tourism as the largest sector (34.4 per cent of services exports), the share of LDCs’ services exports through consumption abroad, estimated at 43.1 per cent in 2017, is at least twice as big as in most developing economies and five times bigger than in developed economies. Cross-border trade accounts almost entirely for the other half but is largely concentrated on transport and distribution services, while commercial presence, for example in construction, is in the initial stages.
B. S
ER
VIC
ES
TR
AD
E
IN N
UM
BE
RS
Figure B.13: The other 125 developing economies export services differently Professional and other business services: share of exports by mode of supply in selected groups of economies, 2017
Source: WTO estimates (2019).
64%
1%
17% 18%
31%
0%
62%
7%
31%
1%
58%
10%
0%
10%
20%
30%
40%
50%
60%
70%
80%
Cross-bordertransactions (mode 1)
Consumption abroad (mode 2)
Commercial presence(mode 3)
Presence of naturalpersons (mode 4)
Other developing economies Five leading developing economies Developed economies

WORLD TRADE REPORT 2019
36
For LDCs, diversifying services exports in order to integrate into global services exports remains challenging due to infrastructural constraints, lack of skills, low financial resources and a digital gap.
(b) MSMEs’ participation
At present no comprehensive dataset exists on international trade by enterprise size covering all economies. One of the reasons is the lack of a commonly agreed definition for MSMEs. For example, MSME definitions by sources considered in this section range from firms with less than 100 employees (World Bank Enterprise Surveys) to firms with less than 250 employees (Eurostat, 2017). Due to differences in coverage and data sources, it is also currently not possible to compare the participation of MSMEs in developing economies with that of MSMEs in the developed group.
To measure participation in international trade by firm size, enterprise surveys and administrative data are often the only sources of data. Over recent years, in developed economies, statisticians’ efforts have focused on measuring merchandise trade by enterprise characteristics (OECD Trade by Enterprise Characteristics (TEC) database), while only pilot studies have specifically targeted trade in services by firm size (Eurostat, 2017).
(i) Participation of MSMEs in developing economies
For developing economies, the World Bank Enterprise Surveys8 provide indicators on a large range of economies in all regions. What are called “direct
exports” occur whenever an enterprise sells goods or services directly to customers in another country. A major benefit of exporting directly is that it gives the exporting firm direct contact with its customers and a better understanding of their needs, thereby potentially generating new business opportunities. If direct participation in trade is challenging for developing country firms, “indirect” export participation by supplying (intermediate) services to another domestic firm that subsequently exports can be an alternative for MSMEs.
According to WTO estimates based on the World Bank Enterprise Survey, covering some 19,700 services MSMEs in 83 developing economies in the period 2013-2018, the participation of MSMEs in direct services exports is marginal, only 4.7 per cent of total sales, a share three times lower than large services firms. Indirect services exports, such as catering for hotels, courier services, or road passenger transport through intermediaries, accounted for 3.7 per cent (see Figure B.14).
In comparison, MSMEs in the manufacturing sector were able to export more than double the sales of MSMEs in services, with 10.6 per cent of MSME manufacturing sales described as direct exports and 8.6 per cent as indirect exports.
For services MSMEs located in LDCs, exports are a negligible portion of sales, only 1.8 per cent, a much lower share than in other developing economies (6.0 per cent), and almost ten times lower than exports by MSMEs in manufacturing (16.1 per cent) (see Figure B.15). Services MSMEs in LDCs mainly access international markets through indirect exports (7.9 per cent of total sales).
Figure B.14: Participation in services exports is positively correlated with firm size Shares of direct and indirect services exports by firm size in developing economies
Source: WTO estimates (2019) based on World Bank Enterprise Surveys.
Direct exports
Indirect exports
4.7%
17.2%
3.7%
1.1%
0%
2%
4%
6%
8%
10%
12%
14%
16%
18%
MSMEs Large services firms
Per
cent
age
of to
tal s
ales

37
THE FUTURE OF SERVICES TRADE
In developing economies, foreign-controlled services firms represent a very small fraction of MSMEs. MSMEs almost exclusively serve the domestic market, with national sales at 96 per cent of total sales, compared to foreign-controlled manufacturing firms, which have only 68 per cent of national sales. Services MSMEs are engaged in distribution services, hotels and restaurants, travel agencies and tour operators, transport, construction and ICT activities.
According to WTO calculations, again based on World Bank Enterprise Surveys, large firms, in both services and manufacturing, begin to export more
rapidly after the start of operations than small firms, although this gap has declined significantly since the 1980s. Services firms in developing economies that began operations in the 1980s took on average eight years to begin exporting, compared to four years for firms starting in the 2000s. Although data show that a considerable time lag remains before services MSMEs in developing economies feel confident enough to engage in exports, technological progress and the rise of the internet could offer reasons why MSMEs now access international markets more quickly (see Figure B.16 and the opinion piece by Sonja Grater, Ali Parry and Wilma Viviers on page 42).
B. S
ER
VIC
ES
TR
AD
E
IN N
UM
BE
RS
Figure B.15: Services MSMEs in LDCs export only 1.8 per cent of their salesShares of direct and indirect services exports by firm size and developing group
Source: WTO estimates (2019) based on World Bank Enterprise Surveys.
Direct exports
Indirect exports
Percentage of total sales (%)
1.3%
7.9%
6.0%
1.8%
0 2 4 6 8 10
Services MSMEs in otherdeveloping economies
Services MSMEsin LDCs
Figure B.16: MSMEs engaged in services start exporting in four years on average, compared to six years for MSMEs in manufacturing Developing economies’ time lag between firms’ start of operations and engagement in exports, 1980s and 2000s
Source: WTO estimates (2019) based on World Bank Enterprise Surveys.
0123456789
1011121314
1 to10 11 to 40 41 to 99
Yea
rs b
efor
e fir
m e
ngag
ed in
exp
orts
sinc
e it
star
ted
oper
atio
ns
Number of employees when firm started operations
Services
1 to10 11 to 40 41 to 99
Manufacturing
MSMEs in the 1980s MSMEs in the 2000s MSMEs in the 1980s MSMEs in the 2000s
11.4
5.5
7.5
4.34.9
3.4
13.1
7.2
8.3
5.56.2
4.9

WORLD TRADE REPORT 2019
38
For each class of initial firm size, the time lag to export in the 2000s was roughly half that of MSMEs which started operations in the late 1980s. In the 1980s, for services firms with one to 10 employees, it took on average 11.4 years to start exporting, for firms with 11-40 employees 7.5 years, and for firms with 41-99 employees 4.9 years. However, for MSMEs trading services which began operating in the early 2000s, it took only four years on average to begin exporting. Service MSMEs with one to 10 employees in the 2000s needed only 5.5 years, firms with 11 to 40 employees took 4.3 years, and firms with 41 to 99 employees needed only 3.4 years on average before engaging in exports.
(ii) Participation of MSMEs in developed economies9
Available evidence from survey data in developed economies shows that SMEs have a relatively low propensity to export. According to the Annual Business Survey (ABS), which covers the United Kingdom with the exception of Northern Ireland, 7.8 per cent of services businesses with less than 50 employees engaged in international trade in 2017, compared to 24.4 per cent for firms with between 50 and 249 employees, and 34 per cent for firms with over 250 employees.10 Similarly, in Canada, only 6.9 per cent of MSMEs exported services in 2017, with 6.5 per cent of firms with one to four employees exporting services compared to 11.6 per cent of firms with 100 to 499 employees.11
A pilot study of services trade by enterprise characteristics (Eurostat, 2017) for 15 European countries in 2014 revealed substantial heterogeneity
in MSME trade participation. Smaller enterprises led services exports in some economies (e.g. Estonia, Hungary and Norway), while in other economies, large enterprises accounted for most services exports (e.g. the Czech Republic, Finland and the Netherlands) (see Figure B.17).
As seen with developing economies, data indicate that the time lag to export services is inversely correlated with the age of the firm. For example, only a quarter of UK MSME services exporters in 2017 had less than two years’ experience, with the majority (64 per cent) having at least four years of experience (UK ONS, 2018).
Digital technology has been influential on MSME services trade, especially for MSMEs in developed economies. For example, UK MSMEs in ICT, manufacturing12 and professional and scientific services were not only more likely to have exported than firms in the construction, accommodation and food, and transport industries, they were also more likely to have innovated goods, services or processes. Further, UK non-exporting MSMEs in the ICT sector were the most likely to report that they were considering exporting in the future (15 per cent) (UK DBEIS, 2019).
The situation was similar in Canada, where professional and technical services had the largest share of exporting MSMEs of any service sector in 2014, a sector often considered very digitizable. Manufacturing and wholesale trade had the next largest shares.
Eurostat STEC also shows that two services sectors with the highest export intensities (defined as the
Figure B.17: In Europe, participation by MSMEs in services trade varied across countries in 2014 Selected EU countries’ trade by firm size, 2014
Source: Eurostat (2017).
Note: 2013 data for Austria, the Czech Republic and Norway; 2011 data for Poland due to lack of available data.
0%
20%
40%
60%
80%
100%
Irelan
dCze
ch R
epub
lic
Finlan
dNet
herla
nds
Sweden
Austri
a
Poland
Belgium
Icelan
dLit
huan
ia
Denmar
k
Norway
Hunga
ry
Esto
niaLu
xembo
urg
Small (0-49 employees) Medium (50-249 employees) Large (250+ employees)

39
THE FUTURE OF SERVICES TRADE
share of exports in total turnover) were ICT and professional, scientific and technical services (see Figure B.18). Again, these are two services sectors often considered highly digitizable.
(c) Women’s participation
Services play a prominent role in female employment, with participation rising steadily over time. Over the past three decades, women have gradually been moving out of employment in agriculture and industry
and have been moving into employment in services at a faster pace than men, although participation remains uneven across economies (see Figure B.19).
Female employment in services is positively correlated with economic development. In 2018, in developed economies, 87 per cent of working women were employed in services, compared to only 28 per cent in LDCs, where agriculture remains the main sector of employment. In other developing economies, where female employment in services
B. S
ER
VIC
ES
TR
AD
E
IN N
UM
BE
RS
Figure B.18: Professional, scientific and technical activities had the highest export intensity after transportation and storage in European countries in 2014 Ratio of exports to turnover by service sector in selected European countries, 2014
Source: Eurostat (2017).
Note: 2013 data for Austria, the Czech Republic and Norway; 2011 for Poland. No data available on ICT for the Netherlands or financial and insurance activities for Norway.
Figure B.19: Female employment in services is positively correlated with economic development Distribution of female employment by main sector and group of economies, 1995-2018
Source: ILOSTAT (2019).
Transportation and storage Professional, scientific and technical activitiesInformation and communication Financial and insurance activitiesWholesale and retail trade
0%10%20%
30%40%50%
60%70%
Lithu
ania
Icelan
d
Denm
ark
Hunga
ry
Belgium
Esto
nia
Norway
Aust
ria
Cze
ch
Repub
lic
Finlan
d
Nethe
rland
s
Sweden
Agriculture Industry Services
199519961997199819992000200120022003200420052006200720082009201020112012201320142015201620172018
Developed economies
0% 20% 40% 60% 80% 100% 0% 50% 100%
LDCs
0% 50% 100%
Other developing economies (excluding LDCs)

WORLD TRADE REPORT 2019
40
exceeds 50 per cent, women have moved faster out of agriculture, compared to developed economies and LDCs, with 19 per cent more females employed in service activities compared to 23 years ago.
In general, in developed and other developing economies, the share of women employed in services is respectively 20 per cent and 10 per cent higher than the share of men. However, in LDCs, employment in services is almost equally low for women (28 per cent) and for men (31 per cent).
Except for wholesale and retail trade, which have high female employment shares in LDCs and other developing economies, the employment of women is largely concentrated in the least-traded services sectors, such as education, health and social work (see Figure B.20).
Education is a key employment sector for women in economies at all levels of development, while women are especially active in health and social work activities in developed economies. This includes a high number of female healthcare workers from developing economies who have contributed to addressing shortages of nurses or caregivers in many developed economies.
Female employment is at its lowest in ICT, one of the most promising and highly traded services sectors, and only 5 per cent of women in developed economies are employed in financial and insurance activities. Among the most traded services sectors, tourism provides excellent employment possibilities for women at all skill levels.
Employment in tradeable sectors is only one of the ways women can contribute to trade. In fact, women can engage directly in international trade, whether in goods or in services, by owning and running a business. Like all exporters, exporting MSMEs owned by women tend to earn more, pay more, employ more people and be more productive than non-exporting firms (ITC, 2015).
At present, there are no comprehensive statistics which capture the contribution made by firms owned by women to services trade. However, WTO estimates based on World Bank Enterprise Surveys, suggest that in developing economies, on average only 13 per cent of services firms of all sizes were either majority-owned or wholly owned by women. In MSMEs, female ownership was at 14 per cent, and at 6 per cent in large services firms.13
Figure B.20: Female employment is concentrated in the least-traded services sectors Female employment in services sectors by group of economies and the sectors’ share in world trade in services, 2017
Source: Based on ISIC Rev. 4. WTO calculations based on ILOSTAT (2019) and WTO estimates (2019).
Developed economies Developing economies LDCs Sector’s share in world trade in services
Who
lesale
and
reta
il tra
de;
repa
ir of
mot
or ve
hicles
and
mot
orcy
cles
Fina
ncial
and
insur
ance
act
ivitie
s In
form
atio
n an
d
com
mun
icatio
nsTr
ansp
orta
tion
and
stor
age
Acco
mm
odat
ion
and
food
ser
vice
activ
ities
Prof
essio
nal, s
cient
ific
and
tech
nical
activ
ities
Con
stru
ctio
nAr
ts, e
nter
tainm
ent
and
recr
eatio
nEd
ucat
ion
Real
esta
te a
nd le
asing
Human
hea
lth a
nd
socia
l wor
k act
ivitie
s
Adm
inist
rativ
e an
d
supp
ort s
ervic
e ac
tivitie
s
Oth
er s
ervic
e ac
tivitie
s
Activ
ities
of h
ouse
hold
s
0%
5%
10%
15%
20%
25%
0%
5%
10%
15%
20%
25%
30%
35%
40%
45%S
hare
in w
orld
trad
e in
ser
vice
s
50%
Sha
re in
tota
l fem
ale
empl
oym
ent i
n se
rvic
es

41
THE FUTURE OF SERVICES TRADE
In developing economies, the participation of firms owned by women in services exports is also marginal.14 MSMEs owned by women account for only 15 per cent of services exports made by all MSMEs. This share dropped to 2.6 per cent in the case of large services firms, which account for the bulk of exports in developing economies.
However, in comparison, the contribution of manufacturing firms owned by women to exports is significantly lower, at 2.1 per cent for MSMEs owned by women and 0.6 per cent for large manufacturing firms (see Figure B.21). Female ownership of manufacturing firms was also lower, with only 10 per cent of MSMEs and 3.8 per cent of large manufacturing firms owned by women.
In services MSMEs, the highest shares of exports by firms owned by women were in tourism and travel-related services, such as travel agencies,
tour operators, hotels and restaurants, as well as in transport. Tourism is not only an important source of female employment but also offers concrete opportunities for female business-owners to trade internationally.
Mirroring female employment, female ownership in developing economies is concentrated in distribution services, especially retail trade. However, World Bank Enterprise Surveys show that businesses owned by women in this sector primarily targeted local markets.
In the case of developed economies, information on businesses owned by women and women’s participation in trade is captured by national surveys, such as on MSMEs. According to information available for some large services traders, the share of firms owned by women and their participation in trade is not much higher than in developing economies.
B. S
ER
VIC
ES
TR
AD
E
IN N
UM
BE
RS
Figure B.21: Firms owned by women are under-represented in services exports Direct and indirect services and manufacturing exports by gender of firm owners and firm size in developing economies(Percentage of total exports)
Source: WTO estimates (2019) based on World Bank Enterprise Surveys.
MSMEs with mixedownership
MSMEs owned by men
MSMEs ownedby women
MSMEs with mixedownership
MSMEs owned by men
MSMEs ownedby women
8.3
88.1
3.6
22.3
62.7
15.0
0 10 20 30 40 50 60 70 80 90 100
Services MSMEs
Direct exports Indirect exports
Direct exports Indirect exports
1.2
93.8
5.0
2.4
97.4
2.6
0 10 20 30 40 50 60 70 80 90 100
Large firms withmixed ownership
Large firms owned by men
Large firms ownedby women
Large firms with mixed ownership
Large firms owned by men
Large firms ownedby women
Large services firms
0.0
96.4
3.6
3.2
96.2
0.6
0 10 20 30 40 50 60 70 80 90 100
Large manufacturing firms
2.8
95.7
1.6
2.0
95.9
2.1
0 10 20 30 40 50 60 70 80 90 100
Manufacturing MSMEs

MSMES and services trade: A pathway to inclusive growth in developing economies?
WORLD TRADE REPORT 2019
42
There is a general consensus that micro, small and medium-sized enterprises (MSMEs) play a critical role in countries’ economies, offering employment to significant numbers of people across a diverse range of professions and trades (Aga et al., 2015).
MSMEs are also widely viewed as holding the key to inclusive growth, which is so frequently spoken about but remains an elusive goal.
Yet it is worrying that a large proportion of MSMEs, despite their recognised potential, fail to become productive and sustainable sources of economic value.
Among the factors holding MSMEs back are inadequate human and financial resources and a policy and regulatory environment that tends to be far better suited to large
enterprises (Parry and Markowitz, 2016). In fact, MSMEs generally receive little attention at the official policy level. Where they do, it rarely translates into concrete and viable forms of support. Not surprisingly, these sorts of problems are more pronounced in developing countries than developed countries.
The exponential growth in global services trade could, however, be a game-changer for MSME communities in developing countries, particularly as many services are more accessible to entrepreneurs and small firms than manufacturing, mining or agriculture, which generally require considerable investment.
Information and communications technology (ICT), financial services, transport and hospitality are among the services sectors that hold particular potential for MSMEs,
while also conveniently laying the foundation for a well-functioning society. That is not to say that services do not require investment in resources such as financial and human capital, but start-up costs are often relatively low, and trading across borders has become a more realistic option given the developments in e-commerce and the relative ease of communicating and transacting via digital platforms.
Advances in technology, which are having such a dramatic effect on how people live, work and interact, have been the key driver behind the global value chain (GVC) phenomenon. GVCs, which have blurred the lines between tangible goods and services trade, have created many opportunities for MSME service providers to act as links in the chain – even on a modest scale, operating from their home base. In this way,
OPINION PIECE
By Sonja Grater, Associate Professor, North-West University, South Africa
Ali Parry, Extra-ordinary Scientist, North-West University, South Africa
and Wilma Viviers, Research Professor and WTO Chair, North-West University, South Africa

they gain access to an extended market which, had they had to face the costs and logistical hurdles of shipping goods across borders, might not have been possible.
MSMEs have much going for them in the services arena. With the right resources, they tend to be flexible and able to adapt quickly to changes in the marketplace, whereas in larger firms, decision-making is more cumbersome. This flexibility is often the product of an entrepreneurial spirit and/or a youthful fascination for things that are new and innovative (Ata, 2019).
MSMEs are not the exclusive preserve of young people, but in a world where jobs in large, established companies are becoming increasingly scarce, they constitute an important source of employment for young people with good ideas and a desire to succeed.
The need for flexibility will, of course, intensify as automation, artificial intelligence and other technological developments continue to transform the world of work and erode the pool of more traditional jobs. Many services are powered by digital technologies, thus putting tech-savvy MSME service providers in an excellent position to leverage the continuously unfolding opportunities. The rapid spread of mobile banking services in East and Southern Africa in recent years is an example of how advances in technology have helped to fan entrepreneurial ideas and create new, high-growth industries that have international reach.
In addition, many women who, given their multiple roles in life, have
not fitted comfortably into formal corporate structures, are finding new economic purpose in service sectors such as education and accountancy, which lend themselves to flexible, online delivery.
It has been argued that the development of the services sector in developing countries that are still agriculture- or mining-dependent can clear the way for the country to “leapfrog” manufacturing, which would be the next logical stage in the economic development process. This view appears to have some merit if the unprecedented growth in mobile phone usage and the growing popularity of online business and leisure services are anything to go by.
However, a services sector cannot thrive in a vacuum, devoid of a supportive policy environment and regulatory framework and well-functioning infrastructure, notably in the telecommunications and energy spheres.
MSMEs, in turn, need special types of attention and assistance, particularly if they are to make inroads into regional or international markets. MSMEs often lack market knowledge and international business skills, but as they are not well understood or properly catered for in developing countries, they are often confronted by the same rules, regulations and challenges as those faced by larger firms. The services sector is notoriously regulated and requires informed and skilful navigation. A lack of finance, compounded by weak creditworthiness, is another perennial problem. Faced with these
challenges, many MSMEs simply retreat into the informal sector where their economic potential remains stunted (Grater et al., 2017).
MSMEs need to be given serious attention if developing countries are to make headway in their frequently expressed desire for inclusive growth and sustainable development. Although stories abound of small businesses in Africa, Asia and other developing regions that have made impressive strides in building a regional or global presence, these are more often than not “pockets of excellence” which do not realistically reflect the status quo. Left on their own, most MSMEs will be unable to grow and reach their full potential.
While opening doors to new sources of finance and building knowledge and skills are critical steps, creating a strong cohort of MSME service providers also depends on a country having an entrenched services culture, from which different services sectors and individual providers can take their nourishment. This implies that while there may be merit in “leapfrogging”, it does not include taking short cuts.
Clearly, developing countries (government, business and civil society) need to devote much more time and effort to researching, understanding and unleashing the potential of MSMEs in high-potential service sectors, failing which technology giants and other major economic players could crowd out smaller local entities and set an economy on a course that simply entrenches inequality.
43
THE FUTURE OF SERVICES TRADE

WORLD TRADE REPORT 2019
44
In Canada, female ownership and firm size are negatively correlated (Statistics Canada, 2018).15
Women owned 17.2 per cent of micro-firms (one to four employees) across all economic sectors and 14.4 per cent of small firms (five-19 employees), but only 12 per cent of medium-sized firms (less than 100 employees). Services prevail over manufacturing, with “other services” (such as personal care services and laundry services), retail trade, and hospitality as the main sectors (see Figure B.22). Only 14 per cent of MSMEs owned by women were exporters, and 4 per cent had exported services in 2017. However, only 11 per cent of female MSME-owners intended to access foreign markets in the following three years.
In the United Kingdom, in 2017, businesses led by women were inversely correlated with enterprise size: 21 per cent of businesses with no employees were led by women, compared to 19 per cent of micro- firms (one to nine employees), 20 per cent of small businesses (10-49 employees) and 15 per cent of medium-sized businesses (50-249 employees).
UK MSMEs in the health and education sectors and in other services sectors were most likely to be led
by women in 2017 (52 per cent, 50 per cent and 26 per cent, respectively), while businesses in ICT, construction and manufacturing were least likely to be controlled by women (10 per cent, 11 per cent and 12 per cent, respectively) (UK DBEIS, 2018).
In various economies, at different levels of development, women are largely concentrated in the least-traded services sectors, such as education, health and social care, thus reducing their opportunities to engage in trade. However, educational and health services are in rapid expansion thanks to digitalization and medical tourism, offering good prospects for women’s contributions to services trade.
4. What is the role of services in global value chains?
Measuring the role of services in global value chains is increasingly complex as manufacturing and services, including intellectual property, become intertwined components of any production process (Miroudot, 2019).
Figure B.22: In Canada, MSMEs owned by women are largely in services Canadian MSMEs owned by women, by sector and share of female ownership, 2017 (percentage)
Source: Statistics Canada (2018).
Female ownership at 51 to 99% Female ownership at 100%
0
5
10
15
20
25
30
Other
servi
ces
Retail t
rade
Manufa
cturin
g
Who
lesale
trade
Trans
portati
on
and w
areho
using
Agricult
ure, fo
restry
,
fishin
g and hu
nting
, mini
ng,
and oi
l and
gas ex
tracti
on
Constr
uctio
n
Accom
modati
on
and fo
od se
rvice
s
Profes
siona
l,
scien
tific a
nd
techn
ical s
ervice
s
1.0
2.91.9
3.6
0.5
6.6
1.6
7.4
3.6
8.6
1.6
13.3
2.4
17.5
3.8
20.0
3.0
21.3
5.7
19.4
Infor
mation
and
cultu
ral in
dustr
ies,
real
estat
e, ad
ministr
ative
and
supp
ort,
waste
manag
emen
t and
remed
iation
servi
ces,
healt
hcare
and
socia
l ass
istan
ce, a
rts,
enter
tainm
ent a
nd re
crea
tion
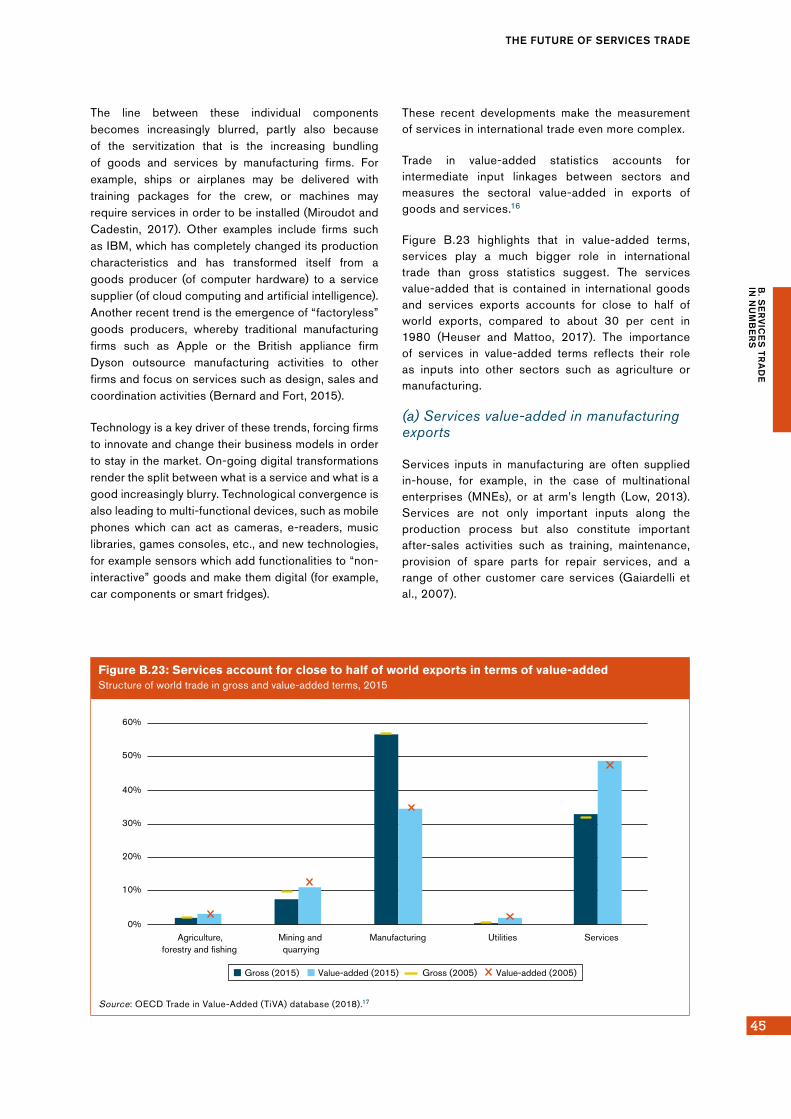
45
THE FUTURE OF SERVICES TRADE
The line between these individual components becomes increasingly blurred, partly also because of the servitization that is the increasing bundling of goods and services by manufacturing firms. For example, ships or airplanes may be delivered with training packages for the crew, or machines may require services in order to be installed (Miroudot and Cadestin, 2017). Other examples include firms such as IBM, which has completely changed its production characteristics and has transformed itself from a goods producer (of computer hardware) to a service supplier (of cloud computing and artificial intelligence). Another recent trend is the emergence of “factoryless” goods producers, whereby traditional manufacturing firms such as Apple or the British appliance firm Dyson outsource manufacturing activities to other firms and focus on services such as design, sales and coordination activities (Bernard and Fort, 2015).
Technology is a key driver of these trends, forcing firms to innovate and change their business models in order to stay in the market. On-going digital transformations render the split between what is a service and what is a good increasingly blurry. Technological convergence is also leading to multi-functional devices, such as mobile phones which can act as cameras, e-readers, music libraries, games consoles, etc., and new technologies, for example sensors which add functionalities to “non-interactive” goods and make them digital (for example, car components or smart fridges).
These recent developments make the measurement of services in international trade even more complex.
Trade in value-added statistics accounts for intermediate input linkages between sectors and measures the sectoral value-added in exports of goods and services.16
Figure B.23 highlights that in value-added terms, services play a much bigger role in international trade than gross statistics suggest. The services value-added that is contained in international goods and services exports accounts for close to half of world exports, compared to about 30 per cent in 1980 (Heuser and Mattoo, 2017). The importance of services in value-added terms reflects their role as inputs into other sectors such as agriculture or manufacturing.
(a) Services value-added in manufacturing exports
Services inputs in manufacturing are often supplied in-house, for example, in the case of multinational enterprises (MNEs), or at arm’s length (Low, 2013). Services are not only important inputs along the production process but also constitute important after-sales activities such as training, maintenance, provision of spare parts for repair services, and a range of other customer care services (Gaiardelli et al., 2007).
B. S
ER
VIC
ES
TR
AD
E
IN N
UM
BE
RS
Figure B.23: Services account for close to half of world exports in terms of value-added Structure of world trade in gross and value-added terms, 2015
Source: OECD Trade in Value-Added (TiVA) database (2018).17
0%
10%
20%
30%
40%
50%
60%
Agriculture,forestry and fishing
Mining andquarrying
Manufacturing Utilities Services
Gross (2005) Value-added (2005)Gross (2015) Value-added (2015)

WORLD TRADE REPORT 2019
46
Providing a decomposition of manufacturing exports by value-added and origin, Figure B.24 illustrates the importance of services for manufacturing. In developed economies, due to a higher degree of servicification, services value-added accounted in 2015 for 33 per cent of manufacturing exports compared to 29 per cent in developing countries. The decomposition for the three manufacturing hubs – Asia, Europe and North America – in 2015 shows that Europe had the highest services content (34 per cent), followed by North America (31 per cent) and Asia (29 per cent). While the aggregate services value in manufacturing exports remained stable for developed countries between 2005 and 2015, it increased in Asia, particularly due to the strong increase of the domestic services content in China’s manufacturing exports. More heterogeneity is observed at the level of individual economies (WTO 2014).
Providing further detail on the services content in exports, Figure B.25 illustrates the importance of wholesale and retail services, other business services,18 financial services and transport services as inputs for manufacturing sectors. In contrast,
services such as accommodation and food, real estate and construction are closer to final demand. The reliance on different types of services is similar across manufacturing sectors, implying that building the supply-side capacity of these services sectors will thus benefit the competitiveness of all manufacturing sectors.
The value-added shown in these results is considered a lower-bound estimate, as services are often produced “in-house” by exporting companies, including high-value-added services such as R&D and advertising. In contrast to arm’s-length transactions, no respective market transactions appear, so statistical frameworks do not capture these flows. As a result, services produced “in-house” might not be adequately measured (Low, 2013; Wölfl, 2019). Using a combination of labour force surveys and the OECD-WTO Trade in Value-Added (TiVA) initiative’s database, Miroudot and Cadestin (2017) estimate for a sample of 31 economies that the share of services value-added in manufacturing exports increases from 37 per cent to 53 per cent when the “in-house” services activities of manufacturing firms are added.
Figure B.24: The share of services value-added in manufacturing exports is highest in Europe and is increasing in Asia Value-added decomposition of manufacturing and services industry exports, 2005 and 2015
Source: OECD TiVA database (2018).
Note: Services value-added includes construction services. Primary value-added covers agriculture, mining and utilities.
11% 12% 13% 10% 11% 10% 13% 14%9% 9%
22% 21%15% 19% 16% 19%
22% 20%23% 22%
9% 10%13% 11% 11% 10%
11% 12%10% 10%
48% 48%43% 45% 46% 47%
45% 46%47% 47%
5% 5%
7% 6% 7% 7%6% 5%
5% 5%
4% 4%10% 9% 8% 8%
4% 3% 6% 7%
0%
10%
20%
30%
40%
50%
60%
70%
80%
90%
100%
2005 2015 2005 2015 2005 2015 2005 2015 2005 2015
Developed economies Developing economies Asia Europe North America
Services value-added: foreign Services value-added: domestic Manufacturing value-added: foreign
Manufacturing value-added: domestic Primary value-added: foreign Primary value-added: domestic

47
THE FUTURE OF SERVICES TRADE
Across economies, between 25 per cent and 60 per cent of employment in manufacturing firms is found in service support functions such as R&D, engineering, transport, logistics, distribution, marketing, sales, after-sale services, IT, management and back-office support.
(b) Services value-added in services production
Trade statistics in value-added terms also allude to services fragmentation (see Figure B.26). Services production, at least at the sectoral aggregation of the TiVA database, is less fragmented than manufacturing. Services value-added constitutes 90 per cent of services exports, while the value-added of manufacturing and primary activities account for the remaining 10 per cent. Services exports rely to a large extent on the domestic supply-side capacity, with the domestic services content being 81 per cent of exports. The foreign services content (imported services inputs) of services exports is 9
per cent, slightly below the foreign services content in manufacturing exports (see Figure B.24 above). In this context, it is important to note that, since the activities of foreign affiliates represent domestic services value-added and not foreign value-added, TiVA statistics do not readily identify trade through a commercial presence in another country (GATS mode 3).
The decomposition at the sector level shows that services exports rely to a large extent on services inputs from within the same sector as compared to inputs from other services sectors. The share of intra-sectoral value-added in exports is highest for the following sectors: real estate (78 per cent); public, health, education and social (71 per cent); finance and insurance (71 per cent); and other business services (71 per cent). In contrast, inter-sectoral services value-added is important for the exports of sectors such as construction (32 per cent), information and communication services (30 per cent), and accommodation and food (28 per cent).
B. S
ER
VIC
ES
TR
AD
E
IN N
UM
BE
RS
Figure B.25. Services have similar relative importance for exports in different manufacturing sectors Services value-added in exports of manufacturing industries, 2015
Source: OECD TiVA database (2018).
ConstructionAccommodation and foodReal estate
Information and communicationsPublic, education, health and socialTransport and storage
Finance and insuranceOther business servicesWholesale and retail
0%
5%
10%
15%
20%
25%
30%
35%
Manufa
cturin
g
Food
, bev
erag
es
and
toba
cco
Texti
les, a
ppare
l
and
leathe
r
Woo
d, pa
per
and
ing
Chemica
ls an
d
non-
metallic
mine
rals
Basic
metals
and
fabric
ated
metals
Compu
ters,
electr
ical
and
optic
al
Machin
ery a
nd eq
uipmen
t,
not e
lsewhe
re cl
assifi
ed
Tran
spor
t
equip
ment
Othe
r man
ufactu
ring;
repa
ir

WORLD TRADE REPORT 2019
48
Figure B.26: Services value-added constitutes 90 per cent in services exports Decomposition of services exports by services value-added, 2015
Source: OECD TiVA database (2018).
Note: For illustrative purposes, the decomposition does not show the primary and manufacturing value-added contained in services exports, which would correspond to the difference between 100 per cent and the services value-added represented by the bar.
0% 10% 20% 30% 40% 50% 60% 70% 80% 90% 100%
Public, education, health and social
Other business services
Real estate
Finance andinsurance
Information andcommunications
Accommodation and food
Transport and storage
Wholesale and retail
Construction
Services (total) 81% 9%
45% 0% 21% 11%
66% 2% 19% 5%
54% 4% 19% 7%
52% 22% 6%
60% 2% 19% 11%
62% 9% 18% 7%
78% 0% 14% 3%
68% 3% 17% 5%
71% 0% 16% 4%
Intra-sectoral (domestic) Intra-sectoral (foreign) Inter-sectoral (domestic) Inter-sectoral (foreign)
0%

49
THE FUTURE OF SERVICES TRADE
Endnotes1 For services, the variable sales is equivalent to output
except in wholesale and retail trade, financial intermediation and insurance, and real estate activities.
2 Affiliates are enterprises controlled by a foreign investor. While international treaties such as the GATS define control more broadly, the FATS framework recommends concentrating on control through the majority-ownership of voting power. A more detailed definition is available in UN et al. (2012).
3 The sectoral classification in this section, was adjusted, to the extent possible, to comply with the scope of GATS.
4 At present, the value of international trade in goods through cross-border e-commerce is not yet known. The international statistical community is actively engaged in the development of a measure.
5 In this report, the aggregate “developing economies” includes developing economies, LDCs, and the Commonwealth of Independent States (CIS), including associate and former member states. Except for LDCs, this statistical grouping has no implications for any matter relating to the level of development of WTO members.
6 ICT services cover telecommunications services, computer services and related activities. Estimated values also include audio-visuals and related services. International transactions are recorded as trade in intellectual property (IP) and related services when purchased from another country for commercial purposes, such as for reproduction or distribution. The purchase of digitally downloaded audio-visuals and software, such as music or games streamed for own consumption from another country, is recorded respectively as trade in audio-visual services or computer software.
7 According to the World Bank income classification based on GNI per capita. Hong Kong (China), Singapore and the Republic of Korea are classified as high-income economies; China is classified as an upper middle-income economy; and India as a lower middle-income economy.
8 The World Bank Enterprise Surveys are surveys of firms which are representative of a country’s non-agricultural economy. They cover small firms (five to 20 employees), medium-sized firms (20 to 99 employees) and large firms (more than 100 employees). Micro-firms ((less than five employees) are not surveyed. Surveys used in this report were carried out between 2013 and 2018 (and for two economies in 2012) in 83 economies from all regions. In services, the Enterprise Surveys include the following services divisions of the International Standard Industrial Classification of All Economic Activities (ISIC Rev. 3.1): construction (45); wholesale and retail trade; repair of motor vehicles, motorcycles and personal and household goods (50-52); hotels and restaurants (55); transport, storage and communications (60-64); and computer and related activities (72). In manufacturing, surveys cover firms in ISIC Rev. 3. divisions 15 to 37.
9 This section is based on national statistics and not on the World Bank Enterprise Survey.
10 The UK Annual Business Survey covers businesses in the United Kingdom with the exception of Northern Ireland. Insurance and reinsurance are excluded from the survey.
11 Defined as firms with less than 500 employees.
12 The UK Standard Industrial Classification defines manufacturing activities as “the physical and/or chemical transformation of materials, substances or components into new products” (Department for Business, 2018). Ninety-five three-digit SIC codes were cited in the UK Longitudinal Small Business Survey, with the treatment and coating of metals as well as printing being the two largest sub-sectors.
13 In the World Bank Enterprise Surveys, some 18,600 services firms and 25,760 manufacturing firms in different regions reported detailed information on female ownership and exports as percentage of total sales. Surveys used in this report were carried out between 2013 and 2018 (and for two economies in 2012).
14 Direct and indirect female participation in exports is calculated as the share of exports by firms owned by women (majority-owned or wholly-owned) in total exports of all firms (owned by women, owned by men, and with mixed gender ownership).
15 Estimates were generated from the responses obtained from 9,115 MSMEs. Financing and leasing companies, subsidiaries, non-profit organizations, government offices, schools, hospitals and other public sector organizations are not covered.
16 For a description of how these technical estimates are built, see WTO and IDE-JETRO (2011), chapter IX.
17 Services account for one-third of world exports in gross terms according to the OECD TiVA database, but for less than one-quarter according to balance-of-payments statistics. As the OECD TiVA database is benchmarked against national statistics, several methodological differences, including the allocation of trade and transport margins for goods to services trade, can explain the relatively higher importance of services trade in the OECD TiVA database.
18 A key sector that provides extra-sectoral inputs to these and other sectors is “other business services”, which encompasses professional and technical activities such as accounting, advertising, architecture, engineering, legal, management consultancy, market research and R&D.
B. S
ER
VIC
ES
TR
AD
E
IN N
UM
BE
RS