b sc agri ii sc,sf & nm, u 3 soil fertility evaluation
TRANSCRIPT

Soil fertility evaluation
Course: B.Sc. Agriculture
Subject : Soil chemistry, Soil fertility and Nutrient management
Unit: 3

SOIL FERTILITY EVALUATION
• Calibration, Correlation of crop responses, yield prediction,fertilizer recommendation
• SOIL TESTING RESEARCH IN INDIA
Farming is a business and, like all businesspersons, the farmeroperates farming business for profit. Obviously, to reach adecision before planting a crop,a farmer needs all of thereliable information from the country’s soil evaluationprogramme. In our country, system of fertility evaluation isbeing modified from time to time in various stagesincorporating crop response data.
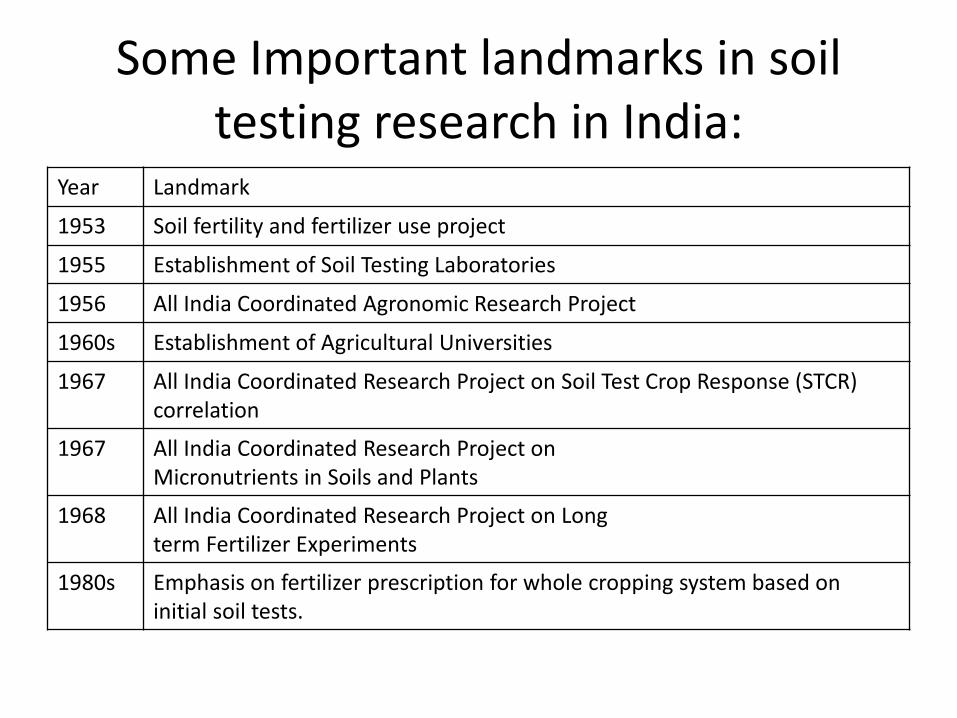
Some Important landmarks in soil testing research in India:
Year Landmark
1953 Soil fertility and fertilizer use project
1955 Establishment of Soil Testing Laboratories
1956 All India Coordinated Agronomic Research Project
1960s Establishment of Agricultural Universities
1967 All India Coordinated Research Project on Soil Test Crop Response (STCR) correlation
1967 All India Coordinated Research Project on Micronutrients in Soils and Plants
1968 All India Coordinated Research Project on Long term Fertilizer Experiments
1980s Emphasis on fertilizer prescription for whole cropping system based on initial soil tests.

• Since Liebig’s time around 1840 many methods and approacheshave been tried to get a precise or workable basis for predicting thefertilizer requirements of crops. The fertilizer use project initiated in1953 following a study by Stewart (1947) was the first systematicattempt in the whole of the country to relate the knowledge of soilsto the judicious use of fertilizers. The establishment of soil testinglaboratories was initiated in 1955-56.
• The project on Model Agronomic Experiments on ExperimentalFarms and Simple fertilizer trials on cultivators’ Fields was started in1957. The Soil Test Crop Response (STCR) correlation work carriedout at Indian Agricultural Research Institute, New Delhi had resultedin the selection of soil test methods and categorizing the tests intolow, medium, and high soil fertility classes.

Soil fertility evaluation
• Soils are very heterogeneous in respect to forms of nutrients theycontain, which greatly complicates the interpretation of Soil Test forassessing fertilizer needs. The total amount of a nutrient present ina soil offers little information relative to the amount of that nutrientwhich is available. Numerous extracting solutions and procedureshave been used to remove nutrient elements from the soil, butnone remove exactly the amount that plant roots obtain.
• This means that, in order to interpret the data, the results fromeach analytical procedure must be correlated with the plantresponse obtained in field experiments by applying that fertilizernutrient.
• By this calibration, the requirement of fertilizer is calculated forachieving specific yield target. Soil fertility evaluation preferablyemploys a particular method of calibration as per the utility of theoutcome.

Crop Response Data
• In nutrient rating experiments, soil test data iscorrelated with the response of crop. Theresponse is measured in terms of ‘percent yield’or ‘percent yield increase’. Both represent theratio of the yield obtained in unfertilized soil(nutrient limiting deficient soil) to the yield infertilizer nutrient applied soil (non-limiting ornutrient sufficient soil). The yield in non-limitingsoil is otherwise known as maximum attainableyield or yield of standard treatment with allnutrients applied.

• While comparing native fertility, in experiments that areconducted at different locations, percent yield is used.
Percent yield= Yield without fertilizer nutrient/Yield in standard treatment x100
• While conducting multi location trials, or a potexperiment in a single location with soils brought fromdifferent locations, percent yield increase Is worked outfor every level of fertilizer application. The highest yieldobtained in the experiment with all fertilizer nutrientapplied, is taken as Maximum attainable yield

• Percent yield increase =Yield at fertilizer nutrient level - Yield without fertilizer nutrient/Maximum
attainable yield x 100
• The soils analyzed by standard nutrientextraction method are grouped. The soil testsare calibrated into different fertility groups byvarious procedures.

Present approaches in formulation of fertilizer recommendations extensively
used in India:
• Soil testing programme was initially startedadopting the International soil fertility evaluationand improvement programme (Fitts,1956). In thisapproach much stress is laid on laboratorycharacterization, followed by potted-plant studiesultimately leading to field-verification trials.These two initial steps help in eliminatingarbitrariness of field trials. However, thisapproach had low adoption as it arrived onecritical value below which economic responsesare possible. Later, many improvements weresuggested.

AGRONOMIC APPROACH
• This is based on fertilizer rate experiments(recording yield at increasing nutrient levels)conducted at many locations. The level at whichyields are high are recorded and averaged. Fromthese results, the optimum dose of fertilizer isrecommended for a crop at given agro-climaticregion.
• Eg. A blanket dose of 120-50-50 kg/ha of N,P2O5,K2Orespectively is recommended for rice.
CRITICAL LIMIT APPROACH
• Waugh and Fitts (1965) developed thistechnique which is largely meant for lessmobile nutrients like P, K and micronutrients.Soils vary considerably in fixing capacities. Dueto it a part of applied P, which is fixed in soil, isnot readily available to plants.

• The method includes incubation study. For P, Soilis incubated for 72 hours with graded doses ofsoluble P in the form of monocalcium phosphate.Then, the amount of phosphates released(extracted) with an extracting reagent (Olsen orBray) will be determined. The extracted P versusthe amount of P applied is plotted. If therelationship is unique, then for high P fixing soilsa larger amount of fertilizer P application isneeded. This amount of P fixed is estimated as X-value.

• Then, in potted experiment fertilizer P is added at 0, 0.5X,X, 2X levels, and the test crop was grown to find out thesoil critical value. The percentage yield obtained is plottedagainst the soil-test value for different soils. By using aplastic overlay, these data are grouped into twopopulations as described by Cate and Nelson (1965). Thesoil-test value where the vertical line crosses
• the x-axis is designated as the soil critical limit. Critical limitfor the soil test value is the limit below which a positive oreconomic response to added fertilizer is possible and abovewhich the response diminishes at a faster rate or vanishes.The validity of critical value is verified by conductingverification trials in the field locations where from the soilsamples have been collected for pot studies.

PREDICTING YIELDS USING NUTRIENT FUNCTIONS
• Yield = f (crop, soil, climate, management)
• Nutrient functions are fitted using data obtained in experiments conducted either in deductive or inductive approach.
Deductive approach
• Deductive approach utilizes the natural variation in soilfertility for calibrating soil test values. Multilocation trialsare carried out with same set of treatments. The responsesare then fitted in the fertilizer prescription models.
• Colwell (1967) developed this approach on the basis thatsome variables, which affect the response of crop tofertilizers, if omitted from the correlation between soil testand crop response, led to poor correlations. To prevent thisdifficulty, a calibration model was suggested based on thegeneralization of coefficients of an orthogonal polynomialyield-response model, which can include all the variablesaffecting the responses to fertilizers.

Inductive approach
• This approach is by creating fertility gradient artificially in aparticular experimental location by addition of fertilizers. Theapproach of inducing fertility gradient (Ramamoorthy, 970) aims ateliminating influence of the 3 out of 4 factors in the yield function,namely: crop, climate and management in the experimentallocation.
• A large field having wide variation in fertility is chosen in a location.It is divided into 4 strips, which are treated with 4 doses of N, P andK fertilizers, viz., control (N0P0K0) ½ normal dose (N½P½K½),normal dose (N1P1K1) and double dose (N2P2K2).
• The normal doses are fixed based on nutrient fixing capacity of thesoil. Exhaustive crop like maize is grown. The calibration cropexperiment is then laid out. For the purpose of correlation, 21treatments having one untreated check plot are tested.

Quadratic Model:
• Percentage of yield maximum concept(sufficiency concept)
• This is commonly known as Mitscherlich and Brayapproach. An empirical relationship is developedbetween percent yield, soil test, and fertilizermaximum yield (Bray, 1944).
• Presently, this approach is modified and used bythe Department of Agriculture, Tamil Nadu forgiving site-specific fertilizer recommendations

FERTILITY EVALUATION BY PLANT ANALYSIS
• Plant analysis is a useful diagnostic tool to ascertain if anutrient has been or is being ssimilated. Plant analysisis also important in ascertaining the nutrientrequirements and nutrient status of plants duringvarious stages of growth.
• A reasonably simple laboratory test of plant sampleprovides a measure of nutrient availability in soil ornutrient status of lant at the time the sample wascollected. If these tests are to be useful in makingfertilizer recommendations, a coordinated laboratory-field research program must be conducted in order toobtain the desired information.

Deficiency symptoms
• Careful nspection of growing seedling orplants can help identify specific nutrientstress. If a plant is lacking in a particularnutrient, characteristic symptoms may appear.Nutrient deficiency symptoms must be relatedto some function of the nutrient in the plant.isual symptoms may be caused by more thanone nutrient. In a set of nutrient omission andaddition pot experiments, exact limitingutrients can be identified.

Tissue tests
• The concentration of the nutrients in the cell sapis usually a good indication of how well the plantis supplied at the time of testing. These semi-quantitative tests are intended mainly forverifying or predicting deficiencies of N, P, K, Sand several micronutrients.
• Method: the plant parts may be chopped up andextracted with reagents. The intensity of colordeveloped is compared with standards and usedas a measure of nutrient concentration. Tissuetests are quick, easy to conduct and interpret

• For tissue tests, the time of sampling and plantpart to be sampled have already beenstandardized for many crops. Tissue test can bedone 5-6 times in a season and concentration canbe monitored in the farm premises.
• There can be two peak periods of nutrientdemand, ne during maximum vegetative growthand second during reproductive stage.Fertilization can be done to maintain the peakconcentration at critical stages.
Total plant analysis
• As in tissue tests, a standardized method fortime and method of sampling of plant part arevailable for total analysis, which is done atlaboratory. The critical nutrient concentrationis commonly used in interpreting plantanalysis results and diagnosing nutritionalproblems.

Diagnosis and Recommendation Integrated System (DRIS)
• DRIS is a system that identifies all the utritional factorslimiting crop production. Index values measure how farparticular nutrients in the leaf or plant are fromoptimum evels. Index values are used in the calibrationto classify yield factors in the order of limitingimportance. To develop a DRIS for a given crop, thefollowing criteria are to be well considered.
• All factors having effect on yield
• Relationship among factors
• Calibration norms
• Continually refined recommendations
• DRIS was developed based on nutrient ratios.When compared to concentration thatnormally varies with season, nutrient ratiodoes ot vary much. When a nutrient ratio hasan optimal value, optimum yield occurs unlesssome other limiting factor reduces the yield.

BIOLOGICAL TESTS
• Simpler and rapid laboratory/ green house techniques utilizesmall quantity of soil to quantify nutrient supplying power ofa soil.
Tests using higher plants:Neubauer seedling method: The neubauer technique is based on the uptake ofnutrients by a large number of plants grown on a small amount soil. The rootsthoroughly penetrate the soil, exhausting available nutrient supply within a short time.Usually 100 seedlings of rye or oats made to feed 100 g soil mixed with 50 g sand.Blank without soil is also run. Total P2O5and K2O uptake is calculated and blank valueis detected to get root soluble P2O5and K2O. Values designated as Neubauer Nos.(mg/ 100 g soil) are used to determine the deficiency. These tables give the maximumvalues of available macro and micronutrients for satisfactory yields of various crops.

Standard and Demont technique:
• It is a modified neubauer technique. Roundcardboard cartons with bottom removed arenested in a container and filled with sand.Seeds are sown. After 2-3 weeks of growth, acarton containing the plants is nested in asecond carton holding 200 g soil or soil +fertilizer. When the mat of roots meets soil, itis allowed to feed for 3-4 days. Then nutrientuptake is estimated.

• Sunflower is grown in the test soil supplied with nutrientsolution with all essential nutrients excepting boron. From theday of appearance of B deficiency symptoms of leaves, thesoil is identified as deficient (<28 days), moderately deficient(28-36 days), and not deficient (>36 days).
Deficiency test of sunflower for Boron

• Microbiological methods:In the absence ofnutrients, certain microorganisms exhibitbehavior similar to that of higher plants. Forexample, growth of Azotobacteror Aspergillusnigerreflects nutrient deficiency in the soil. Thesoil is grouped from very deficient to notdeficient in the respective elements, dependingon the amount of colony growth. In comparisonwith methods that utilize growing of higherplants, microbiological methods are rapid, simpleand require little space.

• Sacket and Stewart technique. For identifyingP and K deficiency test soil is divided in to 4portions. Solution containing soluble P, K, andP+K are added in 3 portions and one portionwas allowed as check. They are inoculatedwith Azotobacter and incubated for 72 hrs.Based on colony growth deficiency isidentified.

• Melich Cunninghamella –plaque test:
• Cunninghamellais sensitive for P. Test soil ismixed with nutrient solution and a paste isprepared. The paste is spread on a clay dish.Cunninghamellais inoculated at the centre andincubated for 5-6 days. Based on the diameterof mycelial growth, the soil is diagnosed asdeficient (<10 cm), moderately deficient (11-21 cm), or not deficient (>22 cm).

• Mulder Aspergillus niger test for Cu and MgColours of mycelial and spores are used todelineate the deficiency of Cu and Mg. Thismethod is used for Mo, Co, Mn, S, Zn also.

SOIL TESTING AND CORRELATION
• The composite samples obtained from fields are used in pot-culture plant studies to assess the crop responses (in terms of dry matter) to added fertilizers. Calibration of the responses to soil - test values was obtained by using different methods. Fixation studies are conducted to ascertain the capacity of soil to fix nutrient to be applied, finally, the results are interpreted to confirm nutrient deficiencies, index soil fertility, and establish "critical level" for each nutrient. The results are verified in the next stage, in field experiments.
Fertility group/ Index
• The International soil fertility evaluation and improvement programme(Waugh and Fitts, 1965) advocated grouping of soils into low-medium-highcategories.
The method:
• Collection of representative soil samples and analysis by using differentextractants for the 'available' nutrient
• Conducting of potted-plant studies with graded doses of added nutrientsupplying all other nutrients to meet the crop requirement
• Computing of the percentage yield responses
• Plotting of the soil-test data obtained with different methods and thepercent yield response; and to find the scatter distribution for the bestcorrelating soils test methods. The scatter diagram will be generallycurvilinear. The response is less, as the soil test value increases.
• The general groups are low, medium and high

Fertility index
• Fertility index expresses the relative sufficiency as a percentage of soil nutrient amount adequate for optimum yields. The probability of a response to fertilizer application increases with decreasing soil test level.
•
• More than 85% of soils testing very low may give greater response and profit. About 60-85% of soils, having medium soil test value may give little profit. Around 15% soils with very high soil test may have little response.
•
• In general, the very low to very high classification is easily understood by the grower. However, separate group classification need to be done accounting for greater variability associated with crops and soils.

Soil Test RatingProbability of Crop Response (% Yield
increase)Fertility Index
Very low 95-100 0-10
Low 70-95 10-25
Medium 40-70 25-50
High 10-40 50-100
Very High 0-10 100+

• Soil Testing• Soil testing is defined as a 'programme for procedural
evaluation of soil fertility by Rapid chemical analysisparticularly to assess the available nutrient status andreaction of a soil'.
• A soil test is a chemical method for estimating nutrientsupplying power of a soil. Compared to plant analysis, theprimary advantage of soil testing is its ability to determinethe nutrient status of the soil before the crop is planted.
• The result of a soil test is known as soil test value. A soiltest value measures a part of the total nutrient supply inthe soil and represents only as an index of nutrient ability.

• Soil test do not measure the exact quantity of a nutrient potentially taken up by a crop. To predict nutrient needs of crops a soil test must be calibrated against the response of crops in nutrient rate experiments in greenhouse and fields. Thereafter, interpretation and evaluation of the soil test values primarily form the basis for fertilizer recommendation.
Soil test programmes have the following objectives:
• To provide an index of nutrient availability
• To predict the probability of profitable response to fertilizer
• To provide a basis for fertilizer recommendation
• To evaluate the soil fertility status and a county soil area or a statewide basis by the use of the soil test summaries.
Phases of Soil Testing programme
• Collecting the soil samples
• Extraction and determining the available nutrients
• Calibrating and interpreting the analytical results
• Making the fertilizer recommendation and management

• Soil sampling
• The most critical aspect of soil testing is obtaining asoil sample that is representative of the field. There isalways a considerable opportunity for sampling error. Ifa sample does not represent a field, it is impossible toprovide a reliable fertilizer recommendation.
• The soils are normally heterogeneous, and widevariability can occur even in a uniform fields. Intensivesoil sampling is the most efficient way to evaluatevariability. The sampling error in a field is generallygreater than the error in the laboratory analysis.

• Soil Unit: It is an area of soil tc 24 (1/4) ted by a composite sample. After the soil unit is determined, the soil samples are collected throughout the area. The number of samples for combining into each representative composite sample varies from 5-20 samples in an area of an acre. Usually a composite sample of one kg of soil is taken from a field.
• The size of the area may be sometimes even less for areas that vary in appearance, slope, drainage, soil types, past treatment These areas are to be sampled for separately. The purpose of the procedure of making a composite sample is to minimize the influence of any local non-uniformity in the soil.
• Normally for all field crops, sampling soil up to 15 cm depth is practiced. For deep-rooted crops and tree crops samples up to 1-2 m may be necessary. While sampling, first a uniform portion is taken from the surface to the depth desired. Second, the same volume is obtained from each area.
• Preparation of the composite soil sample in thelaboratory
• It involves the following steps: Drying, grinding, sieving,mixing, partitioning, weighing, and storing. Uniformmixing and sampling is done by Quartering Technique:
• The soil sample is coned in the center of the mixingsheet. Cone is flattened and divided through the centerwith a flat wooden sheet. One half is moved to the sidequantitatively. Then each half is further divided into half,the four quarters being separated into separate'quarters'. Two diagonally 'opposite quarters' arediscarded quantitatively. The two other are mixed byrolling. This process is repeated, until 250-500 gcomposite soil material is obtained.

• For micronutrient analysis - sampling and processing of samples should alone be done only with stainless steel materials, plastic, or wood to avoid contamination.
• The soil test values calibrated nutrient functions are advocated to the farmers as a package of nutrient management that aims at judicious use of fertilizers. Ultimately any soil testing and interpretation must involve'economics' because it is used to make a fertilizer recommendation to achieve an economic goal that would give maximum profit per hectare of land.

Extraction and determining the available nutrients
• Many chemical extractants have beendeveloped for use in soil testing. The ability ofan extractant to extract a plant nutrient inquantities related to plant requirementsdepends on the reactions that control nutrientsupply and availability. The extractantscommonly used in soil testing programmes aregiven below.
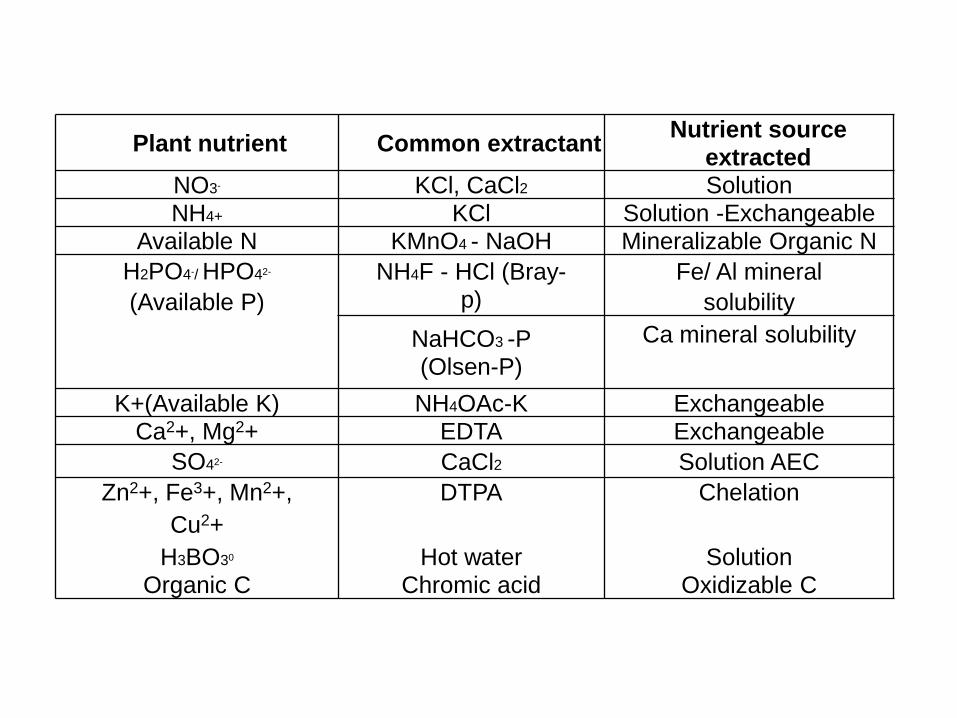
Plant nutrient Common extractantNutrient source
extractedNO3- KCl, CaCl2 SolutionNH4+ KCl Solution -Exchangeable
Available N KMnO4 - NaOH Mineralizable Organic N
H2PO4-/ HPO42- NH4F - HCl (Bray-p)
Fe/ Al mineral
(Available P) solubility
NaHCO3 -P(Olsen-P)
Ca mineral solubility
K+(Available K) NH4OAc-K ExchangeableCa2+, Mg2+ EDTA Exchangeable
SO42- CaCl2 Solution AEC
Zn2+, Fe3+, Mn2+, DTPA Chelation
Cu2+
H3BO30 Hot water SolutionOrganic C Chromic acid Oxidizable C

SOIL TESTING LABORATORY
• Soil Testing Laboratories of the Department ofAgriculture funded by State Government arefunctioning at identified centres in eachdistrict. Soil testing services are also extendedto the farming community in the SoilLaboratories operated by Central governmentand Agricultural Universities.

The major functions of State Soil Testing Laboratory are:
• Analysis of soil samples which are collected from thefarmers by the Assistant Agricultural Officers fortexture (by feel method), lime status, Electricalconductivity, pH and available N, P and K status atlower charges/ sample; and advocating fertilizerrecommendation for different crops. Availablemicronutrients will be analyzed on request.
• Analyzing irrigation water samples for EC, pH, cations,and anions; Assessing their quality based on differentparameters; and suggesting suitable ameliorativemeasures for different soil condition and crops.

• Adopting two villages for a particular period by eachsoil testing laboratory; collecting and anal ng (h/8) andirrigation water samples at free of cost and advocatingthe recommendations.
• Collection of benchmark water samples from the wellsmarked in a particular block/ water shed/ taluk. Afteranalyzing the water samples for different properties,water quality map will be prepared.
• Based on the soil test value for the soil samplescollected during the particular year they are rated aslow, medium, and high; and village fertility indices willbe prepared.
• Conducting trials related to soil fertility to solve thesite-specific problems.

Functions of mobile soil testing laboratory
• The staff of the Mobile STL will visit the villages,collecting and analyzing the soil and irrigation watersamples in the village itself and givingrecommendations immediately.
• Showing the audio-visual programmes throughprojectors in the villages educating the importance ofsoil testing, plant protection measures and otherpractices related to crop production.
• In addition, Mobile STL is carrying out other regularfunctions of stationary soil-testing laboratory.

Text book and web sources
- www. agriinfo.in
- ecourses.iasri.res.in
- Soil science and management by Edward J. Plaster
- Anand Agricultural university theory notes