b-cell regeneration profile and minimal residual disease
TRANSCRIPT
cancers
Article
B-Cell Regeneration Profile and Minimal Residual DiseaseStatus in Bone Marrow of Treated Multiple Myeloma Patients
Robéria Mendonça de Pontes 1,2,† , Juan Flores-Montero 3,4,† , Luzalba Sanoja-Flores 4,5,† , Noemi Puig 4,6,Roberto J. Pessoa de Magalhães 7, Alba Corral-Mateos 3,4, Anna Beatriz Salgado 1, Omar García-Sánchez 4,6,José Pérez-Morán 4,6, Maria-Victoria Mateos 4,6 , Leire Burgos 4,8, Bruno Paiva 4,8, Jeroen te Marvelde 9,Vincent H. J. van der Velden 9, Carlos Aguilar 10 , Abelardo Bárez 11 , Aranzazú García-Mateo 12,Jorge Labrador 13 , Pilar Leoz 4,6, Carmen Aguilera-Sanz 14, Brian Durie 15, Jacques J. M. van Dongen 16,*,Angelo Maiolino 1,7,17, Elaine Sobral da Costa 1,2 and Alberto Orfao 3,4,* on behalf of the EuroFlow Consortium
�����������������
Citation: Mendonça de Pontes, R.;
Flores-Montero, J.; Sanoja-Flores, L.;
Puig, N.; Pessoa de Magalhães, R.J.;
Corral-Mateos, A.; Salgado, A.B.;
García-Sánchez, O.; Pérez-Morán, J.;
Mateos, M.-V.; et al. B-Cell
Regeneration Profile and Minimal
Residual Disease Status in Bone
Marrow of Treated Multiple Myeloma
Patients. Cancers 2021, 13, 1704.
https://doi.org/10.3390/
cancers13071704
Academic Editor: Aldo M. Roccaro
Received: 8 February 2021
Accepted: 29 March 2021
Published: 3 April 2021
Publisher’s Note: MDPI stays neutral
with regard to jurisdictional claims in
published maps and institutional affil-
iations.
Copyright: © 2021 by the authors.
Licensee MDPI, Basel, Switzerland.
This article is an open access article
distributed under the terms and
conditions of the Creative Commons
Attribution (CC BY) license (https://
creativecommons.org/licenses/by/
4.0/).
1 Internal Medicine Postgraduate Program, Faculty of Medicine, Federal University of Rio de Janeiro (UFRJ),Rio de Janeiro 21941-617, Brazil; [email protected] (R.M.d.P.); [email protected] (A.B.S.);[email protected] (A.M.); [email protected] (E.S.d.C.)
2 Cytometry Service, Institute of Paediatrics and Puericultura Martagão Gesteira (IPPMG), Faculty of Medicine,Federal University of Rio de Janeiro (UFRJ), Rio de Janeiro 21941-912, Brazil
3 Translational and Clinical Research Program, Cancer Research Center (IBMCC, USAL-CSIC),Cytometry Service (NUCLEUS) and Department of Medicine, University of Salamanca, and Institute ofBiomedical Research of Salamanca (IBSAL), 37007 Salamanca, Spain; [email protected] (J.F.-M.);[email protected] (A.C.-M.)
4 Centro de Investigación Biomédica en Red de Cáncer (CIBERONC) (CB16/12/00400, CB16/12/00233,CB16/12/00369, CB16/12/00489 and CB16/12/00480), Instituto Carlos III, 28029 Madrid, Spain;[email protected] (L.S.-F.); [email protected] (N.P.); [email protected] (O.G.-S.);[email protected] (J.P.-M.); [email protected] (M.-V.M.); [email protected] (L.B.);[email protected] (B.P.); [email protected] (P.L.)
5 Institute of Biomedicine of Seville, Department of Hematology, University Hospital Virgen del Rocío of theConsejo Superior de Investigaciones Científicas (CSIC), University of Seville, 41013 Seville, Spain
6 Service of Hematology, University Hospital of Salamanca (USAL) and IBSAL, 37007 Salamanca, Spain7 Department of Internal Medicine, University Hospital Clementino Fraga Filho, Faculty of Medicine,
Federal University of Rio de Janeiro (UFRJ), Rio de Janeiro 21941-617, Brazil; [email protected] Centro de Investigación Médica Aplicada (CIMA), Instituto de Investigación Sanitaria de Navarra (IDISNA),
Clínica Universidad de Navarra, 31008 Pamplona, Spain9 Department of Immunology, Erasmus MC, (EMC) University Medical Center Rotterdam,
3015 GA Rotterdam, The Netherlands; [email protected] (J.t.M.);[email protected] (V.H.J.v.d.V.)
10 Department of Hematology, Hospital General de Santa Bárbara, 42005 Soria, Spain;[email protected]
11 Department of Hematology, Complejo Asistencial de Ávila, 05071 Ávila, Spain; [email protected] Department of Hematology, Complejo Asistencial de Segovia, 40002 Segovia, Spain;
[email protected] Department of Hematology and Research Unit, Hospital Universitario de Burgos, 09006 Burgos, Spain;
[email protected] Department of Hematology, Hospital El Bierzo, 24404 Ponferrada, Spain; [email protected] Cedars-Sinai Samuel Oschin Cancer Center, Los Angeles, CA 90048, USA; [email protected] Department of Immunology, Leiden University Medical Center, 2333 ZA Leiden, The Netherlands17 Americas Centro de Oncologia Integrado, Rio de Janeiro 22290-030, Brazil* Correspondence: [email protected] (J.J.M.v.D.); [email protected] (A.O.);
Tel.: +31-71-526-5128 (J.J.M.v.D.); +34-923-294811 (A.O.)† These authors contributed equally to this work.
Simple Summary: B-cell regeneration during therapy has been associated with the outcome ofmultiple myeloma (MM) patients. However, the effects of therapy and hemodilution in bone marrow(BM) B-cell recovery have not been systematically evaluated. Here, we show that hemodilution ispresent in a significant fraction of MM BM samples, leading to lower total B-cell, B-cell precursor(BCP), and normal plasma cell (nPC) counts. Among MM BM samples, decreased percentages (vs.healthy donors) of BCP, transitional/naïve B-cell (TBC/NBC) and nPC populations were observed at
Cancers 2021, 13, 1704. https://doi.org/10.3390/cancers13071704 https://www.mdpi.com/journal/cancers

Cancers 2021, 13, 1704 2 of 18
diagnosis. BM BCP, but not TBC/NBC, increased after induction therapy. At day+100 post-autolo-gous stem cell transplantation, a greater increase in BCP with recovered TBC/NBC numbers butpersistently low memory B-cell and nPC counts were found. At the end of therapy, complete response(CR) BM samples showed higher CD19− nPC counts vs. non-CR specimens with no clear associationbetween BM B-cell regeneration profiles and patient outcomes.
Abstract: B-cell regeneration during therapy has been considered as a strong prognostic factor inmultiple myeloma (MM). However, the effects of therapy and hemodilution in bone marrow (BM)B-cell recovery have not been systematically evaluated during follow-up. MM (n = 177) and adult(≥50y) healthy donor (HD; n = 14) BM samples were studied by next-generation flow (NGF) tosimultaneously assess measurable residual disease (MRD) and residual normal B-cell populations.BM hemodilution was detected in 41 out of 177 (23%) patient samples, leading to lower total B-cell, B-cell precursor (BCP) and normal plasma cell (nPC) counts. Among MM BM, decreased percentages (vs.HD) of BCP, transitional/naïve B-cell (TBC/NBC) and nPC populations were observed at diagnosis.BM BCP increased after induction therapy, whereas TBC/NBC counts remained abnormally low.At day+100 postautologous stem cell transplantation, a greater increase in BCP with recoveredTBC/NBC cell numbers but persistently low memory B-cell and nPC counts were found. At theend of therapy, complete response (CR) BM samples showed higher CD19− nPC counts vs. non-CRspecimens. MRD positivity was associated with higher BCP and nPC percentages. Hemodilutionshowed a negative impact on BM B-cell distribution. Different BM B-cell regeneration profiles arepresent in MM at diagnosis and after therapy with no significant association with patient outcome.
Keywords: multiple myeloma; B-cell regeneration; hemodilution; measurable residual disease;immunophenotyping
1. Introduction
Multiple myeloma (MM) is a hematopoietic malignancy characterized by an expansionand accumulation of (malignant) clonal plasma cells (cPC) in bone marrow (BM) andother tissues [1,2]. In most MM patients, cPC produce a clonal immunoglobulin—Ig (i.e.,M-component)—which becomes detectable in blood and/or urine, in association withdecreased normal residual serum Igs levels (i.e., immunoparesis) and end-organ damage(e.g., cytopenia, anemia, lytic bone lesions, renal failure) [3,4]. Introduction of novel drugsand new therapeutic options that target tumor cells with diverse effects on the patient’simmune system [5–9]—e.g., autologous hematopoietic stem cell transplantation (ASCT),immune modulatory drugs (e.g., lenalidomide, thalidomide and pomalidomide) togetherwith antibody-based (daratumumab and elotuzumab) and CART-cell targeted therapies—has led to significantly higher complete response (CR) rates with prolonged progression-free survival (PFS) and overall survival (OS) [10,11]. However, the effects of such immune-modulatory therapies on the residual immune system have been less investigated.
Suppression of B-cell production and differentiation, in association with reducedlevels of (normal) non-involved Igs (i.e., immunoparesis), is a hallmark of MM, whichinversely correlates with disease stage and patient outcome [12,13], but this might revertback with therapy [14–17]. Conventional and novel treatment protocols for MM typicallycomprise sequential pulses of multiple drugs aimed at achieving and maintaining thehighest quality of response [18]. However, such strategies might result in a cumulativeimmunosuppressive effect with an increased risk for (more pronounced) immunodeficiencyand its related clinical complications [19–21]. Altogether, this indicates that recovery ofimmunoparesis after therapy for MM mostly depends on the ability of the (individual)patient hematopoietic system to regenerate the immune system, particularly the B-cellcompartment [14,16,17,22–25].
Optimal B-cell and immune recovery might potentially contribute to both mitigatethe clinical complications of immunoparesis and help eradicate residual tumor cells via

Cancers 2021, 13, 1704 3 of 18
antibody mediated mechanisms and parallel T cell responses [26–28]. In this regard,previous studies have shown that persistence of normal residual (n)PC in BM of MMat diagnosis [12] and after therapy is a strong favorable prognostic factor for patientoutcome [17,22,29]. Similarly, patients who show long-term disease control, [17,22,25] aswell as elderly (transplant-ineligible) MM patients with favorable outcomes, have beenshown to display significantly higher mature B-cell counts in blood [22].
Previous studies on B-cell regeneration profiles in treated MM patients have shown theexistence of highly variable profiles [12,14,15,17,22–25,29]. However, these studies mostlyfocused on total B-cells and nPC, frequently analyzed at a single time point prior to or aftercompletion of therapy. To the best of our knowledge, there is no systematic description ofthe distribution of normal maturation-associated residual BM B-cell populations in MMduring therapy that could be used as a frame of reference for better understanding theeffects of therapy on B-cell regeneration and to investigate its potential association withboth measurable residual disease (MRD) levels and patient outcome.
Here, we investigated the B-cell regeneration profile in 177 BM samples from 162 MMpatients treated with high-dose therapy followed by ASCT at different time points duringfollow-up and explored its potential association with response to therapy, the BM MRDstatus and patient outcome.
2. Results2.1. Distribution of Maturation-Associated B-Cell and PC Populations in Hemodiluted vs.Nonhemodiluted BM
All healthy donor (HD) BM samples showed no significant levels of hemodilutionwith median (range) frequencies of total B-cells of 2.6% (1%–4.6%) and nPC of 0.3% (0.08%–0.9%). Within normal BM B-cells, progressively higher median percentages of cells wereobserved along the B-cell maturation pathway from more immature (stage I) B-cell pre-cursors (BCP)—0.02% (0.006%–0.2%)—and stage II BCP—0.3% (0.09%–1.5%); p = 0.001 vs.stage I BCP—to transitional B-cells (TBC)/naïve B-cells (NBC)—1.1% (0.3%–2%); p = 0.005vs. stage II BCP—. In contrast, more mature post-germinal center (GC) memory B-cells,and both CD19+ and CD19− nPC were less represented than TBC/NBC, and they had pro-gressively lower median (range) numbers in BM—from the less mature B-cells to the morePC compartments: 0.4% memory B-cells (range: 0.06%–1.3%; p = 0.002 vs. immature/naiveB-cells), 0.2% CD19+ nPC (0.03%–0.6%; p = 0.001 vs. memory B-cells), and 0.1% CD19−
nPC (0.02%–0.3%; p = 0.002 vs. CD19+ nPC)—(Table 1 and Figure 1A).In contrast to normal BM, 41 of 177 (23%) BM samples from MM patients were found
to be hemodiluted based on an abnormally low percentage (i.e., ≤0.002%) of CD117hi
mast cells (median of 0.001% in hemodiluted vs. 0.007% in non-hemodiluted BM samples;p ≤ 0.001), depending on the specific time point at which they had been obtained: medianpercentages of hemodiluted samples at diagnosis, postinduction and at day+100 afterASCT of 40% (10/25), 29% (11/38) and 18% (20/114), respectively (p = 0.04). As expected,hemodilution was associated with significantly lower total B-cell counts (median: 1.5%vs. 2.5% for non-hemodiluted BM; p = 0.006), immature stage I BCP (median: 0.04% vs.0.1%, p = 0.006) and stage II BCP (median: 0.4% vs. 1.1%; p = 0.002), total nPC (median:0.05% vs. 0.07%; p = 0.003), CD19+ nPC (median: 0.04% vs. 0.06%; p = 0.009) and CD19−
nPC (median: 0.003% vs. 0.007%; p = 0.001). In contrast, TBC/NBC were represented atsimilar percentages in hemodiluted vs. non-hemodiluted MM BM—median: 0.7% vs. 1.1%(p > 0.05) (Table 1 and Figure 1B,C)—independently of the time point at which sampleshad been studied (data not shown).
Overall, MRD was positive in 61% (74/121) of non-hemodiluted follow-up BMsamples—median (range) MRD levels of 0.001% (≤0.0002% to 2.9%)—compared to 58%(18/31) of hemodiluted MM BM samples—median (range) MRD levels of 0.0003% (≤0.0002%to 4.8%) (p > 0.05)—. Similar numbers of BM cells were evaluated in both groups of samples(data not shown). Due to the effect of hemodilution on total BM B-cells and nPC, as well ason more immature BM-associated B-cell (i.e., BPC) and nPC populations, hereafter onlynon-hemodiluted BM samples were included in the analyses (Figure 1).

Cancers 2021, 13, 1704 4 of 18
Table 1. Distribution of maturation-associated B-cell and normal plasma cell (nPC) populations in non-hemodiluted vs. hemodilutedbone marrow (BM) from treated multiple myeloma (MM) patients (vs. healthy donor (HD) and diagnostic patient samples).
Cell Population (%) Treated MM (n = 152)
HD(n = 14)
MM at Diagnosis(n = 25)
Non-hemodilutedBM (n = 121)
HemodilutedBM (n = 31)
Total B-cells 2.6(1–4.6)
1.2 a
(0.4–3.3)2.5 b
(0.05 -11.4)1.5 c
(0.04–7.9)
Pre-germinal center B-cells 1.7(0.4–3.3)
0.5 a
(0.07–2.2)2.4 a,b
(0.003–11.2)1.3 b,c
(0.03–7.8)
BCP 0.3(0.09–1.7)
0.01 a
(<0.0002–0.8)1.3 a,b
(<0.0002–10.3)0.5 b,c
(<0.0002–6.1)
Stage I BCP 0.02(0.006–0.2)
0.0005 a
(<0.0002–0.1)0.1a,b
(<0.0002–0.9)0.04 b,c
(<0.0002–0.6)
Stage II BCP 0.3(0.09–1.5)
0.01 a
(<0.0002–0.7)1.1 a,b
(<0.0002–9.4)0.4 b,c
(<0.0002–5.5)
Stage I/stage II BCP ratio 0.1(0.04–0.2)
0.02 a
(0–0.2)0.09 b
(<0.0002 -1.6)0.1 b
(<0.0002–1.2)
Transitional/naive B-cells 1.1(0.3–2)
0.4 a
(0.05–1.9)1.1 b
(0.0008–5.7)0.7
(0.01–4,4)
Post-germinal center B-cells 0.80.4–1.4)
0.4 a
(0.1–1.6)0.1 a,b
(0.0008–0.9)0.1 a,b
(0.01–1)
Memory B-cells 0.4(0.06–1.3)
0.3(0.05–1.5)
0.04 a,b
(0.0005–0.5)0.05 a
(0.003–1)
nPC 0.3(0.08–0.9)
0.04 a
(0.005–0.5)0.08 a,b
(0.002–0.8)0.05 a,c
(0.003–0.4)
CD19+ nPC 0.2(0.03–0.6)
0.03 a
(0.002–0.4)0.06 a,b
(<0.0002–0.8)0.04 a,c
(0.002–0.4)
CD19− nPC 0.1(0.02–0.3)
0.006 a
(<0.0002–0.08)0.007 a
(<0.0002–0.2)0.003 a,b,c
(<0.0002–0.08)
CD19+/CD19− nPC ratio 2(0.7–8.6)
2.2(0–18.6)
7.5 a,b
(0–146)9.4 a,b
(0–45)
Mature B-cells ¥ 1.5(0.4–3)
0.8 a
(0.1–2.8)1.2
(0.004–5.9)0.9 a
(0.01–4.5)
BCP/mature B-cell ratio 0.2(0.08–1.6)
0.005 a
(0–2.5)1 a,b
(0–30.2)0.4 b,c
(0–5.9)
Abbreviations: BM, bone marrow; HD, healthy donor; BCP, B-cell precursor; nPC, normal plasma cells; MM, multiple myeloma; ¥, matureB-cells (transitional/naïve B-cells plus memory B-cells); a p < 0.05 vs. HD. b p < 0.05 vs. at diagnosis; c p < 0.05 for hemodiluted vs.non-hemodiluted BM (Mann–Whitney-U test).
2.2. Distribution of Maturation-Associated B-Cell and nPC Populations in MM BM at Diagnosisand During Follow-Up
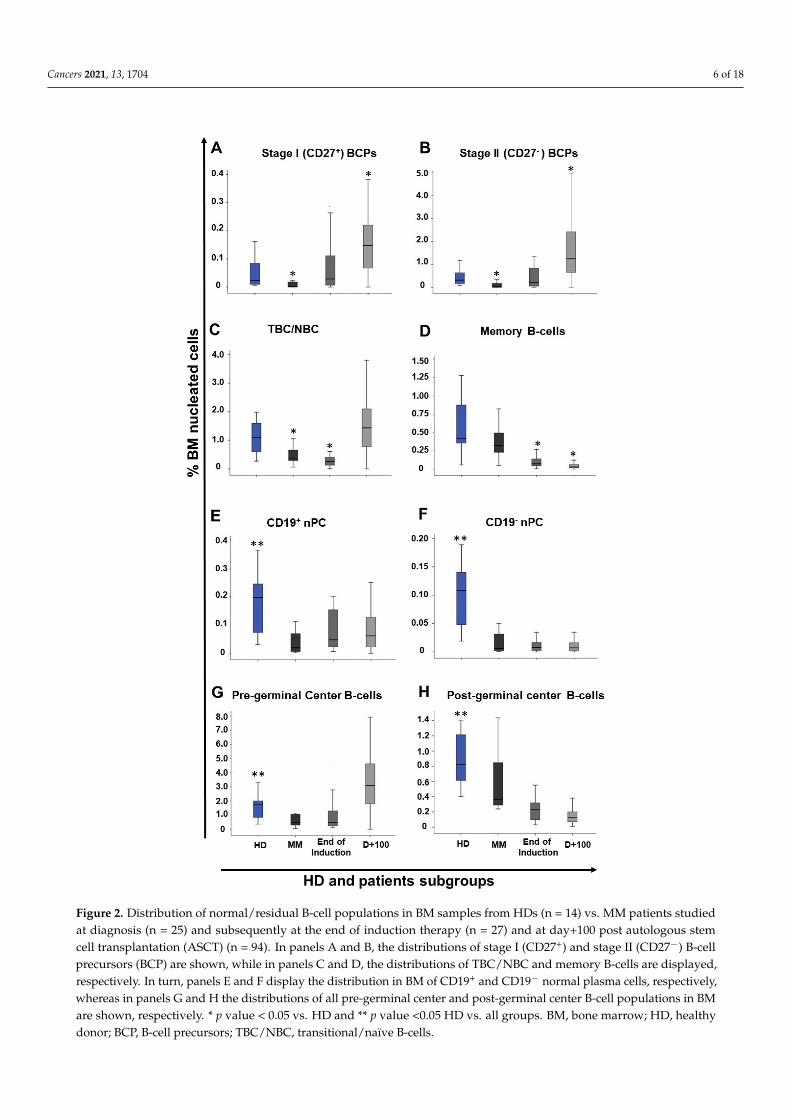
At diagnosis, MM patients showed significantly decreased median percentages ofboth stage I and stage II BCP in BM vs. age-matched HD: 0.0005% vs. 0.02% (p ≤ 0.001) and0.01% vs. 0.3% (p ≤ 0.001), respectively (Figure 2). Regarding mature B-cells, significantlyreduced percentages of TBC/NBC and nPC were also found in BM of MM patients studiedat diagnosis vs. age-matched HD with median percentages of TBC/NBC at 0.4% vs. 1.1%(p = 0.01), of CD19+ nPC at 0.03% vs. 0.2% (p ≤ 0.001) and of CD19− nPC at 0.006% vs.0.1% (p ≤ 0.001), respectively (Figure 2).

Cancers 2021, 13, 1704 5 of 18Cancers 2021, 13, x FOR PEER REVIEW 5 of 19
Figure 1. Distribution of normal/residual B-cell populations in BM of healthy adults (≥50y) (A) and both non-hemodiluted (B) and hemodiluted (C) BM samples from (treated) MM patients. Panel A: ● p < 0.05 vs. all B-cell and nPC populations; Δ p < 0.05 vs. all B-cell and nPC populations except memory B-cells; *p < 0.05 vs. all immature and mature B-cell populations; ** p < 0.05 for CD19+ nPC vs. CD19- nPC. Panel B: ● p < 0.05 vs. all B-cell and nPC populations; Δ p < 0.05 vs. all B-cell and nPC populations except transitional/naïve B-cells (TBC/NBC); ** p < 0.05 CD19+ nPC vs. CD19- nPC. Panel C: ¥ p < 0.05 vs. all B-cell and nPC populations except memory B-cells and CD19 + nPC; Δ p < 0.05 vs. all B-cell and nPC populations except TBC/NBC; ** p < 0.05 CD19+ nPC vs. CD19- nPC. BM, bone
Figure 1. Distribution of normal/residual B-cell populations in BM of healthy adults (≥50y) (A) and both non-hemodiluted(B) and hemodiluted (C) BM samples from (treated) MM patients. Panel A: • p < 0.05 vs. all B-cell and nPC populations;∆ p < 0.05 vs. all B-cell and nPC populations except memory B-cells; *p < 0.05 vs. all immature and mature B-cell populations;** p < 0.05 for CD19+ nPC vs. CD19− nPC. Panel B: • p < 0.05 vs. all B-cell and nPC populations; ∆ p < 0.05 vs. all B-cell andnPC populations except transitional/naïve B-cells (TBC/NBC); ** p < 0.05 CD19+ nPC vs. CD19− nPC. Panel C: ¥ p < 0.05vs. all B-cell and nPC populations except memory B-cells and CD19 + nPC; ∆ p < 0.05 vs. all B-cell and nPC populationsexcept TBC/NBC; ** p < 0.05 CD19+ nPC vs. CD19− nPC. BM, bone marrow; HD, healthy donor; MM, multiple myeloma;BCP, B-cell precursors; TBC/NBC, transitional/naïve B-cells; nPC, normal plasma cell.
Cancers 2021, 13, 1704 6 of 18Cancers 2021, 13, x FOR PEER REVIEW 7 of 19
Figure 2. Distribution of normal/residual B-cell populations in BM samples from HDs (n = 14) vs. MM patients studied at diagnosis (n = 25) and subsequently at the end of induction therapy (n = 27) and at day+100 post autologous stem cell transplantation (ASCT) (n = 94). In panels A and B, the distributions of stage I (CD27+) and stage II (CD27-) B-cell precursors (BCP) are shown, while in panels C and D, the distributions of TBC/NBC and memory B-cells are displayed, respectively. In turn, panels E and F display the distribution in BM of CD19+ and CD19- normal plasma cells, respec-tively, whereas in panels G and H the distributions of all pre-germinal center and post-germinal center B-cell populations in BM are shown, respectively. * p value < 0.05 vs. HD and ** p value <0.05
Figure 2. Distribution of normal/residual B-cell populations in BM samples from HDs (n = 14) vs. MM patients studiedat diagnosis (n = 25) and subsequently at the end of induction therapy (n = 27) and at day+100 post autologous stemcell transplantation (ASCT) (n = 94). In panels A and B, the distributions of stage I (CD27+) and stage II (CD27−) B-cellprecursors (BCP) are shown, while in panels C and D, the distributions of TBC/NBC and memory B-cells are displayed,respectively. In turn, panels E and F display the distribution in BM of CD19+ and CD19− normal plasma cells, respectively,whereas in panels G and H the distributions of all pre-germinal center and post-germinal center B-cell populations in BMare shown, respectively. * p value < 0.05 vs. HD and ** p value <0.05 HD vs. all groups. BM, bone marrow; HD, healthydonor; BCP, B-cell precursors; TBC/NBC, transitional/naïve B-cells.

Cancers 2021, 13, 1704 7 of 18
In contrast, non-hemodiluted BM samples from treated MM patients (i.e., end ofinduction and day+100 after ASCT) showed an overall increased frequency of stage I andstage II BCP (p ≤ 0.001) vs. age-matched normal BM and vs. MM BM obtained at diagnosis(0.1% vs. 0.02% and 0.0005%, and 1.1% vs. 0.3% and 0.01%, respectively), while memoryB-cell (0.04% vs. 0.4%) and nPC (0.06% vs. 0.2% and 0.007% vs. 0.1% for CD19+ and CD19−
nPC, respectively) subsets were both significantly (p ≤ 0.001) decreased vs. normal BM(Table 1 and Figure 1).
In more detail, significant recoveries of both stage I and stage II BCP were observedin MM BM samples obtained at the end of induction therapy vs. diagnosis, with medianpercentages of stage I BCP of 0.02% vs. 0.0005% (p ≤ 0.001) and of stage II BCP of 0.2% vs.0.01% (p = 0.002), respectively (Figure 2). In contrast, (all) more mature B-cell populationsremained significantly reduced at the end of induction (vs. normal BM), with a tendencytoward lower median numbers than those observed at diagnosis for all B-cell and nPCpopulations, except for nPC populations: (i) TBC/NBC, 0.2% vs. 1.1% (p ≤ 0.01) and 0.4%(p = 0.006); (ii) memory B-cells, 0.07% vs. 0.4% (p ≤ 0.001) and 0.3% (p ≤ 0.001); (iii) CD19+
nPC levels, 0.05% vs. 0.2% (p = 0.004) and 0.03% (p = 0.06); and (iv) CD19− nPC, 0.009% vs.0.1% (p ≤ 0.001) and 0.006% (p = 0.85), respectively (Figure 2).
In turn, at day+100 post-ASCT, MM patients displayed a pattern consistent with BMregeneration and increased production of B-cells (Figure 2). Thus, significant (p ≤ 0.001)increased numbers of both stage I and stage II BCP (vs. both HD and MM BM studied atdiagnosis) were observed: median of 0.2% (vs. 0.02% and 0.0005%) and of 1.3% (vs. 0.3%and 0.01%) for stage I and stage II BCP, respectively (Figure 2). In parallel, the percentageof TBC/NBC returned to levels similar to those observed in normal BM—a median of 1.5%vs. 1.1% (p = 0.2)—. By contrast, the number of memory B-cells remained significantlydecreased vs. both normal BM and MM diagnostic samples—median of 0.03% vs. 0.4%and 0.3%, respectively (p ≤ 0.001)—(Figure 2). Similarly, to memory B-cell counts, thenumber of both CD19+ and CD19− nPC at day+100 post-ASCT also remained below normallevels: a median of 0.07% vs. 0.2% for CD19+ nPC and of 0.007% vs. 0.1% for CD19− nPC(p ≤ 0.001), respectively (Figure 2 and Supplementary Table S2).
2.3. Impact of Response to Therapy and Type of Induction Therapy on the Distribution of NormalResidual BM B-Cell and nPC Populations in MM
Similar distributions of the distinct subsets of BCP, mature B-cells (TBC/NBC andmemory B-cells) and total nPC were observed in BM of MM patients grouped according toresponse to therapy (i.e., non-CR vs. sCR/CR) for the two different time points evaluatedduring follow-up (Table 2). In contrast, the median percentage of CD19− nPC was higher inBM of patients who were in CR/sCR vs. non-CR cases, both at the end of induction—0.01%vs. 0.003% (p = 0.036)—and at day+100 post-ASCT—0.009% vs. 0.006% (p = 0.049)—.Among CR/sCR cases, the presence vs. absence of MRD did not affect the distribution ofthe distinct maturation-associated B-cell and nPC populations in BM studied at the end ofinduction (Table 2). In contrast, at day+100 post-ASCT, MRD positivity among CR/sCRpatients was associated with higher median percentages (vs. MRD negativity CR/sCRpatients) of: (i) total BCP (1.9% vs. 1.3%; p = 0.026), particularly due to increased stageII BCP counts (median of 1.7% vs. 1.1%; p = 0.023); (ii) post-GC B-cells (0.2% vs. 0.1%;p = 0.025); (iii) total nPC (0.1% vs. 0.07%; p = 0.048); and (iv) CD19+ nPC (0.09% vs. 0.06%;p = 0.018), but not CD19− nPC (0.009% vs. 0.01%; p > 0.05).

Cancers 2021, 13, 1704 8 of 18
Table 2. Distribution of normal/residual B-cell populations in BM of treated MM patients according to their response status studied atdifferent time points after/during therapy.
Cell population (%) End of Induction (n = 27) Post ASCT (day+100) (n = 94)
Non-CR(n = 7)
sCR/CRMRD+(n = 13)
sCR/CRMRD-(n = 7)
Non-CR(n = 38)
sCR/CRMRD+(n = 27)
sCR/CRMRD-
(n = 29)
Total B-cells 1.3(0.3–2.9)
0.7(0.3–2.1)
0.9(0.5–5)
3.7(0.06–11.4)
4.1(1.1–10.7)
2.6(0.05–9.3)
Pre-germinal center B-cells 0.8 a
(0.2–2.9)0.3
(0.1–1.9)0.7
(0.4–4.5)3.6
(0.05–11.2)3.9
(0.5–10.5)2.6
(0.003–9.1)
BCP 0.5(0.05–2.3)
0.1(<0.0002–1.4)
0.3(0.01–2)
1.7(0.04–10.3)
1.9 b
(0.06–9.5)1.3
(0.002–4.1)
Stage I BCP 0.1(0.005–0.3)
0.008(<0.0002–0.2)
0.02(0.001–0.7)
0.2(0.01–0.9)
0.2(0.002–0.8)
0.1(<0.0002–0.4)
Stage II BCP 0.2(0.05–2.1)
0.1(<0.0002–1.2)
0.3(0.01–1.4)
1.5(0.03–9.4)
1.7 b
(0.06–8.6)1.1
(0.002–3.8)
Stage I/stage II BCP ratio 0.1(0.07–1.6)
0.1(<0.0002–0.8)
0.09(0.03–0.5)
0.09(0.02–0.6)
0.09(0.01–0.5)
0.08(<0.0002–1.2)
Transitional/naive B-cells 0.3 a
(0.2–0.6)0.1
(0.004–0.4)0.3
(0.1–2.5)1.5
(0.09–5.7)1.3
(0.3–4.9)1.5
(0.0008–5.7)
Post-germinal center B-cells 0.2(0.08–0.5)
0.2(0.03–0.6)
0.2(0.08–0.6)
0.1(0.03–0.9)
0.2 a, b
(0.02–0.6)0.1
(0.009–0.5)
Memory B-cells 0.08(0.05–0.5)
0.07(0.005–0.5)
0.08(0.05–0.3)
0.03(0.005–0.2)
0.03(0.006–0.5)
0.03(0.0005–0.2)
nPC 0.03(0.01–0.2)
0.06(0.008–0.4)
0.1(0.04–0.4)
0.07(0.004–0.8)
0.1 a, b
(0.002–0.6)0.07
(0.008–0.3)
CD19+ nPC 0.03(0.01–0.2)
0.05(0.007–0.4)
0.09(0.03–0.4)
0.05(<0.0002–0.8)
0.09 a, b
(0.002–0.4)0.06
(0.0008–0.3)
CD19− nPC 0.003(≤0.0002–0.02)
0.01(0.006–0.04)
0.01(0.003–0.07)
0.006(<0.0002–0.1)
0.009(<0.0002–0.2)
0.01(0.001–0.06)
CD19+/CD19− nPC ratio 8.4(0–72.2)
5.4(2.7–19.3)
4.8(1.3–147)
11.3(0–42)
9.5(0–39)
5(0–21.5)
Mature B-cells ¥ 0.5 a
(0.3–0.8)0.2
(0.009–0.7)0.4
(0.3–2.6)1.5
(0.01–5.8)1.4
(0.3–5)1.5
(0.004–5.9)
BCP/Mature B-cell ratio 0.6(0.1–5.9)
0.6(0–30.2)
0.8(0.03–3.4)
1(0–13.3)
1.7(0–8.5)
0.9(0.08–3.5)
Abbreviations: MM, multiple myeloma; BM, bone marrow; MRD, measurable residual disease; BCP, B-cell precursors; nPC, normalplasma cells; CR, complete response; sCR, stringent CR; ¥ Mature B-cells (transitional/naïve B-cells plus memory B-cells); a p < 0.05 forcomparison between non-CR vs. CR/sCR plus MRD+; b p < 0.05 for comparison between CR/sCR plus MRD+ vs. CR/sCR plus MRD-(Mann–Whitney-U test).
From the prognostic point of view, MM patients who were MRD-positive at day+100post-ASCT displayed significantly (p = 0.013) shorter PFS vs. MRD-negative cases—medianPFS of 28 months vs. not reached (NR) (Figure 3A). In contrast, the distribution of thedifferent subsets of BM BCP, mature (pre-GC and pos-GC) B-cells and nPC at day+100post-ASCT, did not show a significant impact on PFS of MM patients, regardless of theirBM MRD status (Figure 3B–D).
Regarding the type of induction therapy used prior to ASCT, MM patients that re-ceived a combination of proteasome inhibitors (PIs) plus immunomodulatory drugs (IMIDs)plus steroids presented significantly lower median percentages of (i) total B-cells (2.5% vs.4.2%, p = 0.009), (ii) total BCP (1.2% vs. 1.9%, p = 0.013), particularly stage II BCP (1% vs.1.8%, p = 0.008), and (iii) total nPC (0.05% vs. 0.1%, p = 0.001), especially CD19+ nPC (0.04%vs. 0.1%, p = 0.001) at day+100 post-ASCT, compared to those patients who received PIsplus steroids or IMIDs plus steroids and cyclophosphamide. Of note, MRD and PFS weresimilar between these two patient groups (Supplementary Table S4).

Cancers 2021, 13, 1704 9 of 18Cancers 2021, 13, x FOR PEER REVIEW 10 of 19
Figure 3. Impact of measurable residual disease (MRD) and the distribution of normal residual post-germinal center B-cells in BM of MM at day+100 after autologous stem cell transplantation (ASCT) on patient progression-free survival (PFS). In panel (A), the impact of BM MRD on PFS is shown. PFS of treated MM patients grouped according to the number of residual post-germinal center B-cells (memory B-cells plus nPC) in BM at day+100 post-ASCT (B) and in MM patients stratified according to the presence (C) vs. absence of MRD (D) at day+100 post-ASCT, is shown. BM, bone marrow; MM, multiple myeloma.
Regarding the type of induction therapy used prior to ASCT, MM patients that re-ceived a combination of proteasome inhibitors (PIs) plus immunomodulatory drugs (IMIDs) plus steroids presented significantly lower median percentages of (i) total B-cells (2.5% vs. 4.2%, p = 0.009), (ii) total BCP (1.2% vs. 1.9%, p = 0.013), particularly stage II BCP (1% vs. 1.8%, p = 0.008), and (iii) total nPC (0.05% vs. 0.1%, p = 0.001), especially CD19+ nPC (0.04% vs. 0.1%, p = 0.001) at day+100 post-ASCT, compared to those patients who received PIs plus steroids or IMIDs plus steroids and cyclophosphamide. Of note, MRD and PFS were similar between these two patient groups (Supplementary Table S4).
2.4. Distribution of Maturation-Associated B-Cell and PC Populations in Follow-Up BM from MM Patients According to the Cytogenetic Risk at Diagnosis
Cytogenetic risk was present in 103 patients, from whom 73 had standard risk cyto-genetics and 30 showed high-risk cytogenetics. Overall, similar distributions of the dis-tinct subsets of BCP, mature B-cells (TBC/NBC and memory B-cells) and total normal PC were observed in BM samples from MM patients according to cytogenetic risk for the two different time points evaluated during follow-up post-induction and at day+100 post-ASCT (Supplementary Table S3).
Figure 3. Impact of measurable residual disease (MRD) and the distribution of normal residualpost-germinal center B-cells in BM of MM at day+100 after autologous stem cell transplantation(ASCT) on patient progression-free survival (PFS). In panel (A), the impact of BM MRD on PFS isshown. PFS of treated MM patients grouped according to the number of residual post-germinalcenter B-cells (memory B-cells plus nPC) in BM at day+100 post-ASCT (B) and in MM patientsstratified according to the presence (C) vs. absence of MRD (D) at day+100 post-ASCT, is shown. BM,bone marrow; MM, multiple myeloma.
2.4. Distribution of Maturation-Associated B-Cell and PC Populations in Follow-Up BM fromMM Patients According to the Cytogenetic Risk at Diagnosis
Cytogenetic risk was present in 103 patients, from whom 73 had standard risk cy-togenetics and 30 showed high-risk cytogenetics. Overall, similar distributions of thedistinct subsets of BCP, mature B-cells (TBC/NBC and memory B-cells) and total normalPC were observed in BM samples from MM patients according to cytogenetic risk forthe two different time points evaluated during follow-up post-induction and at day+100post-ASCT (Supplementary Table S3).
3. Discussion
B-cell recovery during therapy has been previously reported as a strong prognosticfactor in MM [14–16,23,24,29–31] and a unique feature of MM patients who attain long-term disease control [22,25]. Despite this, the kinetics of B-cell depletion and regenerationin BM during the course of therapy have not been investigated in detail in MM. Here, weused a high-sensitive NGF approach [32] for simultaneous assessment of MRD and normalresidual B-cell and PC regeneration in BM of MM patients studied at diagnosis and atdifferent time points after starting therapy compared to age-matched healthy donors. Forthis purpose, the impact of hemodilution on the distribution of the distinct maturation-associated B-cell populations in BM was first evaluated used the percent BM mast cellcut-off of ≤0.002%, as previously proposed [32].

Cancers 2021, 13, 1704 10 of 18
Overall, hemodilution showed a significant impact on the distribution of normalresidual BCP, B-cells and nPC, as well as their subsets. Thus, significantly lower total B-celland nPC numbers were detected in hemodiluted vs. non-hemodiluted BM samples, at theexpense of decreased percentages of both stages I and II BCP and both CD19+ and CD19−
nPC, but with similar numbers of TBC/NBC. Altogether, these results indicate that BMhemodilution is associated with significantly decreased numbers of BM-derived B-cells(e.g., BCP) and nPC due to the very low numbers of both cell populations in (steady-state)adult blood [33,34], independently of the time point at which the sample was obtainedduring the course of disease therapy. To the best of our knowledge, this is the first studyin which the impact of hemodilution on the distribution of BM B-cell and PC subsets wasinvestigated in MM and shows that accurate analysis of the distribution of normal/residualB-cells requires the assessment of sample quality.
Several studies have previously reported on hemodilution of BM samples after MMtreatment, with potential implications for MRD detection [32,35–37]. More recently, de-creased mast cell counts in BM below the 0.002% threshold have been reported as a bettermarker than nucleated red cells, myeloid precursors, and B-cell precursors for identificationof hemodilution of MM BM samples after therapy [32]. This is probably due to the fact thatMM on one side and treatment of MM on the other side might significantly affect erythro-poiesis and/or myelopoiesis [1,2]. Due to this, EuroFlow selected the mast cell-associatedthreshold to implement in the EuroFlow version of Infinicyt software (version 2.0, Cy-tognos) to indicate potential hemodilution of BM samples in MM [32]. However, normalmast cell counts in BM vary substantially among different individuals, and limited dataexist on the frequency of mast cells in core BM biopsies from treated MM patients [38–40].Altogether, this points out the need for new cellular markers and approaches for moreaccurate estimation of BM hemodilution. In this regard, some authors have used pairedPB and BM samples and defined specific formulas to estimate BM hemodilution based onboth absolute and/or relative cell counts as well as hemoglobin levels [34,41,42]. However,such approaches are not easy to implement in routine laboratory diagnostics, pointing outthe need for more simple and user-friendly approaches to estimate BM hemodilution inindividual patients.
Based on the impact of hemodilution on the B-cell and nPC distribution in BM,all subsequent analyses performed in this study were restricted to non-hemodiluted BMsamples evaluable after therapy as defined by a mast cell threshold of >0.002% [32]. Overall,our results showed a distribution of the distinct B-cell subsets in normal adult (≥50y) BM,consistent with a progressive expansion of BCP along their different maturation stages,until TBC/NBC migrate to blood. In contrast, progressively lower numbers of post-GCB-cell and nPC subsets were observed in normal BM from the less mature to the moredifferentiated cells (i.e., memory B-cells to CD19+ nPC and CD19− nPC). These results arefully consistent with those previously reported in the literature [32,33,43].
Compared to age-matched normal BM, MM patients presented at diagnosis withsignificantly decreased numbers of BCP (both stage I and stage II), TBC/NBC and (bothCD19+ and CD19−) nPC in their BM. Previous studies, indicate that decreased BCP andnPC numbers in BM of MM patients at diagnosis might result from their progressivereplacement by cPCs, as normal BPC, nPC and cPC share similar adhesion moleculephenotypic profiles with potentially overlapping BM (stromal cell) niches [13,44,45], whosenumbers are limited [44] and functionally impaired in the elderly [46,47]. At the sametime, interaction of cPC with BM stromal cells might actively induce apoptosis of B-cellprogenitors, leading to decreased B-cell production and lower immature/naïve B-cellcounts in blood [48].
Following induction therapy, the percentage of BCP notably increased in the BMof MM patients in parallel to the decrease in cPC percentages, suggesting the later maycontribute to a greater availability of stromal cell BM niches [13], and thereby, the recov-ery of B-cell production. In contrast, mature pre-GC B-cells (e.g., TBC/NBC) remainedsignificantly decreased at the end induction therapy and only recovered latter at day+100

Cancers 2021, 13, 1704 11 of 18
post-ASCT, with highly variable numbers among different patients. These findings supportfull (but variable) recovery of B-cell production after ASCT. In contrast, at day+100 postASCT, post-GC BM B-cells (e.g., memory B-cells) and nPC counts remained significantlydecreased compared to age-matched HDs. These results together with those previouslyreported for MM patients who achieve long-term disease control [22,25] suggest that fullrecovery of memory B-cells and end-stage nPC in BM of MM might require longer periodsof time (e.g., ≥1year) during which the levels of antigen-experienced B-cells (e.g., memoryB-cells and end-stage nPC) in BM return to normal [44,49] and serum immunoglobulin(Ig) levels recover in the absence of disease progression [17,50]. Altogether, these resultssupport the notion that full B-cell reconstitution is a late and progressive process thatstarts early after the onset of therapy, which would lead to a full recovery of normal B-cellcounts at between 6 to 12 months, when maximum B-lymphocyte levels are detected inBM [30,49]. In line with these findings, the percentage of nPC in BM as assessed by flowcytometry has also been associated with parallel recovery of Ig levels from day+100 afterASCT onward [17]. Despite this, global B-cell regeneration profile, we observed importantdifferences depending on the specific type of induction therapy administered. Thus, theuse of PIs in combination with IMIDs as induction therapy appeared to more deeply affectB-cell regeneration in our patient cohort compared to the use of these same type of drugsseparately. These results are in line with previous observations indicating that an increasedrisk of infection together with a decreased response to vaccination would occur amongMM patients treated with combined (vs. single) PIs plus IMIDs therapy [19,51]. Despite thedifferent B-cell regeneration profiles observed according to induction therapy, no significantdifferences in the patients’ MRD status and PFS rates were observed according to the typeof induction therapy.
In contrast to the negative impact of BM infiltration by cPC on normal B-cell andnPC production at diagnosis, no major differences were observed between patients whoreached sCR/CR at day+100 post-ASCT and non-CR cases, except for higher percentagesof CD19− nPC in the former group. In addition, no significant differences were observedbetween MM patients with standard vs. high cytogenetic risk. Conversely, a significantlymore pronounced B-cell and nPC recovery was observed at day+100 post-ASCT amongMRD-positive vs. MRD-negative sCR/CR patients.
From the prognostic point of view, previous studies on transplant-ineligible elderlyMM patients suggested an association between high BCP counts in BM and a poor out-come [24]. In contrast, for the same patient population [24] and both transplant-eligiblecases [14,16,29–31], as well as in MM patients with long-term disease control [17,22,25],multiple studies point out better recoveries of BM B-cells and nPC have been associatedwith better outcomes. In line with these later studies, here we found higher numbersof CD19− nPC in BM of patients who reached sCR/CR vs. non-CR cases, both at theend induction therapy and at day+100 post-ASCT. In contrast, among sCR/CR patientsgreater B-cell and nPC counts were observed in BM of MRD-positive vs. MRD-negativecases. Careful analysis for the potential reasons for such a discrepancy show that themajority of previous studies focused on the percentage of nPC within the whole BM PCcompartment [29], the B-cell counts in blood [22,25,30,31] and Ig serum levels [14,17]. Incontrast, here we focused on the relative distribution of the distinct B-cell populationsin whole BM, where B-cell numbers might also be influenced by the recovery of othercell populations, including the erythroid and myeloid precursors; in addition, it is alsoimportant in this study that very limited numbers of paired BM samples from the samepatients were analysed at diagnosis and follow-up, while in others potentially hemodilutedsamples have been excluded from analysis. Therefore, further investigations in larger seriesof paired diagnostic and follow-up (non-hemodiluted) BM samples from MM patents arerequired to determine the underlying cause(s) for such apparent discrepancies.
Altogether, our findings reinforce the notion that following therapy, depletion of cPCsfrom the BM (stromal cell) niches would increase their availability for nPC that have reachedthe BM and potentially also for normal BCP, leading to a recovery of both B-cell production
Cancers 2021, 13, 1704 12 of 18
and nPC homing in BM after therapy. However, despite previous studies suggesting thatthere is an association between a better recovery of more mature B-cells and an improvedpatient outcome, here we could not show an impact of the B-cell recovery profile on PFS ofMM, even when the BM MRD status at day+100 post-ASCT did. Importantly, our data alsoindicate that the BM B-cell regeneration profiles in MM might also be affected by the typeof induction therapy and the time point of BM collection, as well as hemodilution.
4. Materials and Methods4.1. Patients, Samples, and Controls
A total of 177 BM samples from 162 MM patients—57% males and 43% females witha median age (range) of 62 years (y; 36–87y)—were obtained and studied at differenttime points during the course of disease, including: diagnosis (n = 25), end of inductiontherapy (n = 38) and day+100 post-ASCT (n = 114). Only 15/162 MM patients were studiedsequentially at diagnosis and/or during follow-up. After therapy started, patients werecategorized at every time point of evaluation by the 2016 International Myeloma WorkingGroup (IMWG) response criteria [52] into: stringent (s)CR/CR (n = 93) and non-CR (n = 59),including cases with very good partial responses (VGPRs; n = 44), partial responses (PRs;n = 6), stable disease (SD; n = 4) and progressive disease (PD; n = 5). In addition, 14 BMsamples from an identical number of healthy donors—HDs; median age (range) of 58y(50–78y)—were studied in parallel. BM samples were obtained and processed within 24hafter collection at 4 different centers (USAL, UFRJ, CIMA and EMC). All BM samples fromMM and HD patients were collected after each individual had given his/her informedconsent to participate in the study and/or in compliance to regulations of local ethics andresearch committees, according to the Declaration of Helsinki; the study was approved bythe local ethics committees of the four participating centers. A more detailed descriptionof the patients’ clinical and laboratory features at diagnosis, as well as the treatmenttime points and therapeutic regimens used, is provided in Supplementary Materials andSupplementary Table S1.
4.2. Treatment Regimens
At the end of induction therapy, patients had received between 4 and 6 cycles oftherapy prior to ASCT. Post-ASCT (day+100), BM samples were obtained 104 ± 15 daysafter transplantation. Induction regimens were based on IMIDs or PIs, while high-dosemelphalan was used in the conditioning regimen for ASCT with the following patientdistribution per time point: (i) end of induction therapy (n = 38), included patients treatedwith PIs + IMIDs + steroids (n = 28), PIs + chemotherapy + steroids (n = 2), PIs + IMIDs +chemotherapy+ steroids (n = 2), PIs + IMIDs + steroids + anti-CD38 (n = 1), PIs + steroids(n = 3), chemotherapy + IMIDs + steroids (n = 1), and chemotherapy alone (n = 1); and(ii) day+100 post-ASCT (n = 114) cases consisted of MM patients previously treated withPIs + IMIDs + steroids (n = 53), PIs + cyclophosphamide + steroids (n = 23), PIs + steroids(n = 3), PIs + IMIDs + steroids + anti-CD38 (n = 2), PIs + chemotherapy + IMIDs + steroids(n = 5), cyclophosphamide + IMIDs + steroids (n = 22), IMIDs + steroids (n = 2) andchemotherapy alone (n = 1), followed in all cases by ASCT. For to the purpose to compareB-cell distribution according to the type of induction therapy, MM patients were groupedin two categories: (i) PIs + IMIDs + steroids or (ii) PIs + steroids or IMIDs + steroids andcyclophosphamide.
4.3. Immunophenotypic Studies
All BM samples were stained following the EuroFlow next-generation flow (NGF)MM MRD antibody panel and standard operating procedures (SOPs), as previously de-scribed [32,53]. Briefly, bulk lysed BM samples were stained with the two 8-color EuroFlowtubes—(i) CD138-BV421, CD27-BV510, CD38-FITC, CD56-PE, CD45-PerCPCy5.5, CD19-PECy7, CD117-APC, CD81-APCC750 and (ii) CD138-BV421, CD27-BV510, CD38-FITC,CD56-PE, CD45-PerCPCy5.5, CD19-PECy7, cytoplasmic (cy)Ig—Kappa-APC and cyIg-
Cancers 2021, 13, 1704 13 of 18
Lambda-APCC750. Stained cells were measured on FACSCanto II flow cytometers—BectonDickinson Biosciences (BD), San Jose, CA—using the FACS DiVA software (BD) and theEuroFlow SOPs for instrument set up and calibration [53]. A median of 5 × 10⁶ (range:10 × 105–12 × 106) and 107 (range: 2 × 10⁶–15 × 106) cells were measured in case of di-agnostic and follow-up samples, respectively. For data analysis, events measured in thetwo tubes stained per sample were merged into a single data file and analyzed using theautomatic gating and report tool (AGI) of the Infinicyt software (version 2.0, Cytognos SL,Salamanca, Spain). Identification of the distinct maturation-associated B-cell compartmentswas based on the following phenotypic criteria: (i) B-cell precursors (BCP) were definedas CD19+ CD38hi CD45lo CD81hi cyIg− cells; (ii) TBC/NBC as CD19+ CD45+ CD38-/+lo
CD27− CD81+ and cyIg+ cells; (iii) memory B-cells were CD19+ CD45+ CD38−/lo CD27+
CD81+ cyIg+, and (iv) nPC were identified as CD38hi CD138lo/het CD45−/+ CD81het CD27+
CD56−/+ CD117− cyIg+ cells. In addition, BCP were further subdivided into stage I(CD27+) and stage II (CD27−) BCP as previously reported [54,55] and nPC were split ac-cording to CD19 expression into CD19+ plasmablasts/PC and CD19− mature PC (Figure 4).For each cell population, relative distribution (i.e., percentage from all BM nucleated cellsafter excluding cell debris/doublets and cPC) was recorded. MRD negativity was definedas absence of cPC in BM by NGF at a limit of detection ≤2 × 10⁻⁶ cPC, while MRD positiv-ity indicates presence of cPC in BM by NGF above this cut-off. Then, ≤0.002% CD117hi
mast cells were used to classify a BM sample as hemodiluted, following previously definedcriteria [32].
4.4. Molecular Cytogenetic Studies
Interphase fluorescence in situ hybridization (i-FISH) studies were performed at diag-nosis in 103/162 for detection of Ig heavy chain (IGH) gene rearrangements/translocations—t(4;14), t(14;16), t(14,20)—and for del(17/17p). iFISH studies were systematically performedon fluorescence-activated cell sorting (FACS)—purified cPC (FACS Aria, BD Biosciences).Based on the cytogenetic findings, patients were classified as having standard risk (n = 73)or high-risk cytogenetics (n = 30).
4.5. Statistical Methods
The nonparametric Kruskal–Wallis or Mann–Whitney U tests (for unpaired contin-uous variables) and the Wilcoxon or Friedman tests (for paired continuous variables), aswell as the chi-square test (for categorical variables) were used to establish the statisticalsignificance of differences observed among groups. PFS curves were plotted by the Kaplanand Meier method and the (two-sided) log-rank test was used to compare PFS curves.PFS was defined as the time from BM analysis by NGF to disease progression/relapse ordeath. To determine the impact of the BM B-cell regeneration profiles on PFS, patientswere stratified based on median (percent) values observed at day+100 after ASCT foreach normal residual maturation-associated B-cell population investigated. Two-sidedp-values <0.05 were considered to be statistically significant. All statistical analyses wereperformed with the Statistical Package for Social Sciences Software (SPSS, version20; IBMCorp Inc, Chicago, IL, USA).
Cancers 2021, 13, 1704 14 of 18Cancers 2021, 13, x FOR PEER REVIEW 15 of 19
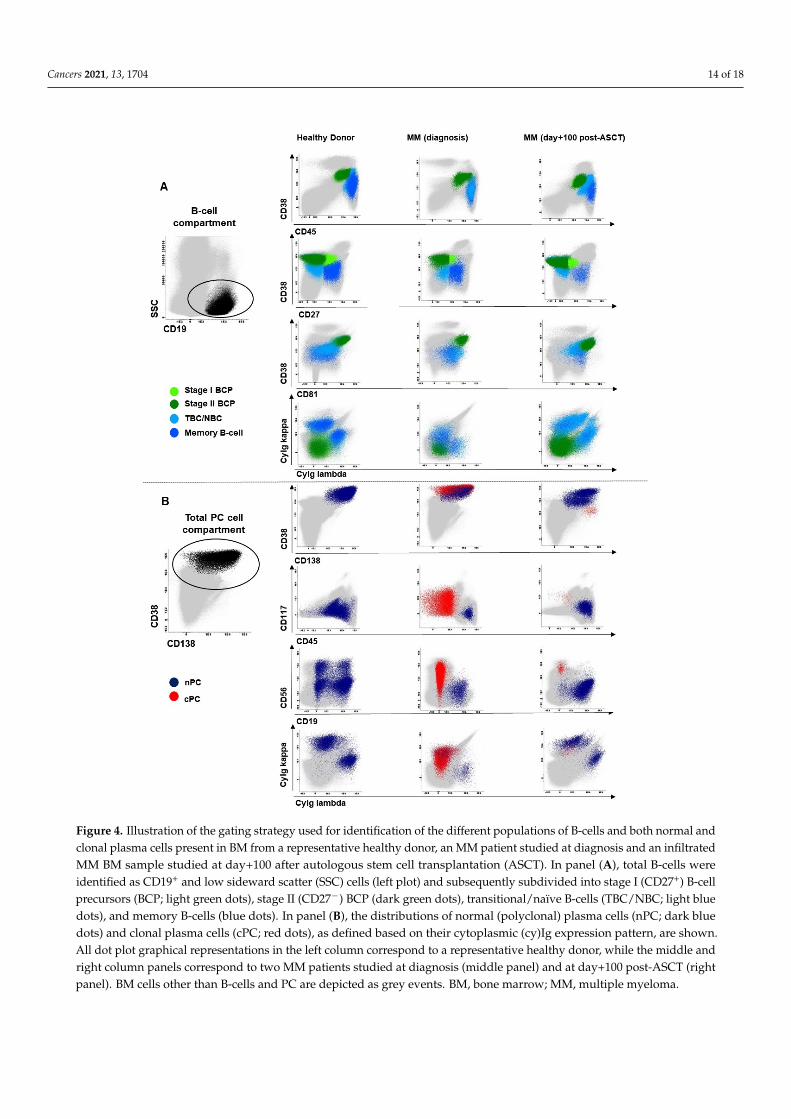
Figure 4. Illustration of the gating strategy used for identification of the different populations of B-cells and both normal and clonal plasma cells present in BM from a representative healthy donor, an MM patient studied at diagnosis and an infiltrated MM BM sample studied at day+100 after autologous stem cell transplantation (ASCT). In panel (A), total B-cells were identified as CD19+ and low sideward scatter (SSC) cells (left plot) and subsequently subdivided into stage I (CD27+) B-cell precursors (BCP; light green dots), stage II (CD27-) BCP (dark green dots), transitional/naïve B-cells (TBC/NBC; light blue dots), and memory B-cells (blue dots). In panel (B), the distributions of normal (polyclonal) plasma cells (nPC; dark blue dots) and clonal plasma cells (cPC; red dots), as defined based on their cytoplasmic (cy)Ig expression pattern, are shown. All dot plot graphical representations in the left column correspond to a representative healthy donor, while the middle and right column panels correspond to two MM patients studied at diagnosis (middle panel) and at day+100 post-ASCT (right panel). BM cells other than B-cells and PC are depicted as grey events. BM, bone marrow; MM, multiple myeloma;
Figure 4. Illustration of the gating strategy used for identification of the different populations of B-cells and both normal andclonal plasma cells present in BM from a representative healthy donor, an MM patient studied at diagnosis and an infiltratedMM BM sample studied at day+100 after autologous stem cell transplantation (ASCT). In panel (A), total B-cells wereidentified as CD19+ and low sideward scatter (SSC) cells (left plot) and subsequently subdivided into stage I (CD27+) B-cellprecursors (BCP; light green dots), stage II (CD27−) BCP (dark green dots), transitional/naïve B-cells (TBC/NBC; light bluedots), and memory B-cells (blue dots). In panel (B), the distributions of normal (polyclonal) plasma cells (nPC; dark bluedots) and clonal plasma cells (cPC; red dots), as defined based on their cytoplasmic (cy)Ig expression pattern, are shown.All dot plot graphical representations in the left column correspond to a representative healthy donor, while the middle andright column panels correspond to two MM patients studied at diagnosis (middle panel) and at day+100 post-ASCT (rightpanel). BM cells other than B-cells and PC are depicted as grey events. BM, bone marrow; MM, multiple myeloma.
Cancers 2021, 13, 1704 15 of 18
5. Conclusions
Hemodilution had a significant impact on the distribution of normal residual B-cells(BCP and nPC). These results reinforce the need for high-quality BM aspirate for both MRDand immune monitoring in MM after therapy. Different (altered) B-cell distribution profilesare present in MM BM at diagnosis and after therapy with no significant association withpatient outcome.
Supplementary Materials: The following are available online at https://www.mdpi.com/article/10.3390/cancers13071704/s1, Table S1: Clinical and laboratory features observed at diagnosis for theMM patients included in this study (n = 162), Table S2: Distribution of maturation-associated nor-mal/residual B-cell and nPC cell population in BM of HD vs. MM patients studied at diagnosis andat different time points after therapy, Table S3: Distribution of maturation-associated normal/residualB-cell and nPC cell populations in BM of MM patients studied at diagnosis and at different timepoints after therapy according to the patients’ cytogenetic risk (standard vs. high risk), Table S4:Distribution of maturation-associated normal/residual B-cell and nPC cell populations in BM ofMM patients studied at day+100 post-autologous stem cell transplantation, according to the type ofinduction therapy received.
Author Contributions: Performed the research, R.M.d.P., J.F.-M., and L.S.-F. Co-first authors, J.F.-M.,and L.S.-F. Conceptualization, R.M.d.P., J.F.-M., L.S.-F., B.D., J.J.M.v.D., E.S.d.C. and A.O. Data cu-ration, R.M.d.P., J.F.-M. and L.S.-F. Formal analysis, R.M.d.P., J.F.-M., L.S.-F. and E.S.d.C. Fundingacquisition, J.J.M.v.D., A.M. and A.O. Investigation, R.M.d.P., J.F.-M. and L.S.-F. Methodology, J.F.-M.,B.D., J.J.M.v.D. and A.O. Project administration, J.F.-M, J.J.M.v.D., E.S.d.C. and A.O. Collected in-formed consents, samples, and patient data; R.M.d.P., J.F.-M., L.S.-F., N.P., R.J.P.M., A.C.M., A.B.S.,O.G.-S., J.P.-M., M.-V.M., L.B., B.P., J.t.M., V.H.J.v.d.V., C.A., A.B., A.G.-M., J.L., P.L., C.A.-S. and A.M.Supervision, J.J.M.v.D. and A.O. Visualization, R.M.d.P., J.F.-M., L.S.-F. and E.S.d.C. Writing andreview the manuscript R.M.d.P., J.F.-M., L.S.-F., E.S.d.C. and A.O. All authors have read and agreedto the final version of the manuscript.
Funding: This work has been supported by the International Myeloma Foundation-Black SwanResearch Initiative, the EuroFlow Consortium (grant LSHB-CT-2006-018708); Centro de InvestigaciónBiomédica en Red de Cáncer (CIBER-ONC; Instituto de Salud Carlos III, Ministerio de Economía yCompetitividad, Madrid, Spain and FONDOS FEDER), numbers: CB16/12/00400, CB16/12/00233,CB16/12/00369, CB16/12/00489 and CB16/12/00480; grant from Bilateral Cooperation Programbetween Coordenação de Aperfeiçoamento de Pessoal de Nível Superior-CAPES (Brasília/Brazil) andDirección General de Políticas Universitárias (DGPU)-Ministério de Educación, Cultura y Deportes(Madrid/Spain) number DGPU 311/15; Fundação de Amparo à Pesquisa do Estado do Rio deJaneiro of Brazil (FAPERJ) numbers: E26/110.105/2014 and E26/102.191/2013; grant from ConselhoNacional de Desenvolvimento Científico e Tecnológico of Brazil (CNPQ), number: 400194/2014-7.R.M.d.P. was supported by a grant from Coordenação de Aperfeiçoamento de Pessoal de NívelSuperior (CAPES/DGPU), number: 000281/2016-06 and CAPES/PROEX 641/2018, Brazil; Fundaçãode Amparo à Pesquisa do Estado do Rio de Janeiro of Brazil (FAPERJ) number: E01/200/537/2018.
Institutional Review Board Statement: The study was conducted according to the guidelines of theDeclaration of Helsinki and approved (on the 26th of February 2007) by the Ethics Committee of theUniversity Hospital of Salamanca/IBSAL (Health Area of Salamanca, Salamanca, Spain) and (on the27th of May 2017) by Ethics Committee of the University Hospital Clementino Fraga Filho, FederalUniversity of Rio de Janeiro (UFRJ) Brazil, (protocol code CAAE number 63221816.2.0000.5257).
Informed Consent Statement: Informed consent was obtained from all subjects involved in the study.
Data Availability Statement: The data presented in this study are available on request from thecorresponding author.
Conflicts of Interest: J.F.-M., V.H.J.v.d.V., J.J.M.v.D. and A.O. report inventorship of the patent“Methods reagents, and kit for detecting minimal residual disease” (PCT/NL2013/050420, filing date14 June 2013), owned by the EuroFlow Consortium. In addition, J.J.M.v.D. and A.O. are chairmen ofthe EuroFlow scientific foundation, which receives royalties from licensed patents that are collectivelyowned by the participants of the EuroFlow Foundation. These royalties are exclusively used forcontinuation of EuroFlow collaboration and sustainability of the EuroFlow consortium. In addition,
Cancers 2021, 13, 1704 16 of 18
J.J.M.v.D. and A.O. report an Educational Services Agreement from BD Biosciences (San José, CA)and a Scientific Advisor Agreement with Cytognos; all related fees and honoraria go to LUMC andUSAL, respectively. All other authors declare no conflict of interest related to the present work.
References1. Kyle, R.A.; Rajkumar, S.V. Multiple myeloma. N. Engl. J. Med. 2004, 351, 1860–1873. [CrossRef]2. Kumar, S.K.; Rajkumar, V.; Kyle, R.A.; Van Duin, M.; Sonneveld, P.; Mateos, M.V.; Gay, F.; Anderson, K.C. Multiple myeloma. Nat.
Rev. Dis. Prim. 2017, 3, 1–20. [CrossRef] [PubMed]3. Kyle, R.A.; Rajkumar, S.V. Criteria for diagnosis, staging, risk stratification and response assessment of multiple myeloma.
Leukemia 2009, 23, 3–9. [CrossRef] [PubMed]4. Rajkumar, S.V.; Dimopoulos, M.A.; Palumbo, A.; Blade, J.; Merlini, G.; Mateos, M.V.; Kumar, S.; Hillengass, J.; Kastritis, E.;
Richardson, P.; et al. International Myeloma Working Group updated criteria for the diagnosis of multiple myeloma. Lancet Oncol.2014, 15, e538–e548. [CrossRef]
5. Borrello, I. Can we change the disease biology of multiple myeloma? Leuk. Res. 2012, 36, S3–S12. [CrossRef]6. Kumar, S.K.; Anderson, K.C. Immune therapies in multiple myeloma. Clin. Cancer Res. 2016, 22, 5453–5460. [CrossRef]7. Lonial, S.; Durie, B.; Palumbo, A.; San-Miguel, J. Monoclonal antibodies in the treatment of multiple myeloma: Current status
and future perspectives. Leukemia 2016, 30, 526–535. [CrossRef] [PubMed]8. Cohen, A.D. CAR T cells and other cellular therapies for multiple myeloma: 2018 update. Am. Soc. Clin. Oncol. Educ. B 2018,
e6–e15. [CrossRef]9. Bonello, F.; Mina, R.; Boccadoro, M.; Gay, F. Therapeutic monoclonal antibodies and antibody products: Current practices and
development in multiple myeloma. Cancers 2020, 12, 15. [CrossRef]10. Mateos, M.-V.; Ocio, E.M.; Paiva, B.; Rosiñol, L.; Martínez-López, J.; Bladé, J.; Lahuerta, J.-J.; García-Sanz, R.; San Miguel, J.F.
Treatment for patients with newly diagnosed multiple myeloma in 2015. Blood Rev. 2015, 29, 387–403. [CrossRef]11. Lahuerta, J.J.; Paiva, B.; Vidriales, M.B.; Cordón, L.; Cedena, M.T.; Puig, N.; Martinez-Lopez, J.; Rosiñol, L.; Gutierrez, N.C.;
Martín-Ramos, M.L.; et al. Depth of response in multiple myeloma: A pooled analysis of three PETHEMA/GEM clinical trials. J.Clin. Oncol. 2017, 35, 2900–2910. [CrossRef] [PubMed]
12. Paiva, B.; Vidriales, M.; Cervero, J.; Mateo, G.; Perez, J.; Montalban, M.A.; Sureda, A.; Montejano, L.; Gutierrez, N.;de Coca, A.G.; et al. The presence of residual normal plasma cells by multiparameter flow cytometry in the bone marrow ofsymptomatic multiple myeloma patients at diagnosis identifies a good prognostic subgroup. Haematol. Hematol. J. 2009, 94,154–155. [CrossRef]
13. Paiva, B.; Pérez-Andrés, M.; Vídriales, M.B.; Almeida, J.; De Las Heras, N.; Mateos, M.V.; López-Corral, L.; Gutiérrez, N.C.; Blanco,J.; Oriol, A.; et al. Competition between clonal plasma cells and normal cells for potentially overlapping bone marrow nichesis associated with a progressively altered cellular distribution in MGUS vs myeloma. Leukemia 2011, 25, 697–706. [CrossRef][PubMed]
14. Zent, C.S.; Wilson, C.S.; Tricot, G.; Jagannath, S.; Siegel, D.; Desikan, K.R.; Munshi, N.; Bracy, D.; Barlogie, B.; Butch, A.W.Oligoclonal protein bands and Ig isotype switching in multiple myeloma treated with high-dose therapy and hematopoietic celltransplantation. Blood 1998, 91, 3518–3523. [CrossRef]
15. Rawstron, A.C.; Davies, F.E.; Owkn, R.G.; English, A.; Pratt, G.; Child, J.A.; Jack, A.S.; Morgan, G.J. B-lymphocyte suppression inmultiple myeloma is a reversible phenomenon specific to normal B-cell progenitors and plasma cell precursors. Br. J. Haematol.1998, 100, 176–183. [CrossRef] [PubMed]
16. Byrne, E.; Naresh, K.N.; Giles, C.; Rahemtulla, A. Excess bone marrow B-cells in patients with multiple myeloma achievingcomplete remission following autologous stem cell transplantation is a biomarker for improved survival. Br. J. Haematol. 2011,155, 509–511. [CrossRef]
17. González-Calle, V.; Cerdá, S.; Labrador, J.; Sobejano, E.; González-Mena, B.; Aguilera, C.; Ocio, E.M.; Vidriales, M.B.; Puig, N.;Gutiérrez, N.C.; et al. Recovery of polyclonal immunoglobulins one year after autologous stem cell transplantation as a long-termpredictor marker of progression and survival in multiple myeloma. Haematologica 2017, 102, 922–931. [CrossRef]
18. Rajkumar, S.V.; Kumar, S. Multiple myeloma: Diagnosis and treatment. Mayo Clin. Proc. 2016, 91, 101–119. [CrossRef]19. Nucci, M.; Anaissie, E. Infections in patients with multiple myeloma in the era of high-dose therapy and novel agents. Clin. Infect.
Dis. 2009, 49, 1211–1225. [CrossRef]20. Teh, B.W.; Harrison, S.J.; Worth, L.J.; Thursky, K.A.; Slavin, M.A. Infection risk with immunomodulatory and proteasome
inhibitor–based therapies across treatment phases for multiple myeloma: A systematic review and meta-analysis. Eur. J. Cancer2016, 67, 21–37. [CrossRef]
21. Teh, B.W.; Harrison, S.J.; Pellegrini, M.; Thursky, K.A.; Worth, L.J.; Slavin, M.A. Changing treatment paradigms for patients withplasma cell myeloma: Impact upon immune determinants of infection. Blood Rev. 2014, 28, 75–86. [CrossRef]
22. De Magalhães, R.J.P.; Vidriales, M.B.; Paiva, B.; Fernandez-Gimenez, C.; García-Sanz, R.; Mateos, M.V.; Gutierrez, N.C.; Lecrevisse,Q.; Blanco, J.F.; Hernández, J.; et al. Analysis of the immune system of multiple myeloma patients achieving long-term diseasecontrol by multidimensional flow cytometry. Haematologica 2013, 98, 79–86. [CrossRef]

Cancers 2021, 13, 1704 17 of 18
23. Tovar, N.; de Larrea, C.F.; Aróstegui, J.I.; Cibeira, M.T.; Rosiñol, L.; Rovira, M.; Elena, M.; Filella, X.; Yagüe, J.; Bladé, J. Naturalhistory and prognostic impact of oligoclonal humoral response in patients with multiple myeloma after autologous stem celltransplantation: Long-term results from a single institution. Haematologica 2013, 98, 1142–1146. [CrossRef] [PubMed]
24. Paiva, B.; Cedena, M.-T.; Puig, N.; Arana, P.; Vidriales, M.-B.; Cordon, L.; Flores-Montero, J.; Gutierrez, N.C.; Martín-Ramos, M.-L.;Martinez-Lopez, J.; et al. Minimal residual disease monitoring and immune profiling using second generation flow cytometry inelderly multiple myeloma. Blood 2016, 127. [CrossRef] [PubMed]
25. Arteche-López, A.; Kreutzman, A.; Alegre, A.; Sanz Martín, P.; Aguado, B.; González-Pardo, M.; Espiño, M.; Villar, L.M.; GarcíaBelmonte, D.; De La Cámara, R.; et al. Multiple myeloma patients in long-term complete response after autologous stem celltransplantation express a particular immune signature with potential prognostic implication. Bone Marrow Transpl. 2017, 52,832–838. [CrossRef] [PubMed]
26. Tsou, P.; Katayama, H.; Ostrin, E.J.; Hanash, S.M. The emerging role of b cells in tumor immunity. Cancer Res. 2016, 76, 5591–5601.[CrossRef] [PubMed]
27. Kroeger, D.R.; Milne, K.; Nelson, B.H. Tumor-infiltrating plasma cells are associated with tertiary lymphoid structures, cytolyticT-cell responses, and superior prognosis in ovarian cancer. Clin. Cancer Res. 2016, 22, 3005–3015. [CrossRef]
28. Sharonov, G.V.; Serebrovskaya, E.O.; Yuzhakova, D.V.; Britanova, O.V.; Chudakov, D.M. B cells, plasma cells and antibodyrepertoires in the tumour microenvironment. Nat. Rev. Immunol. 2020, 20, 294–307. [CrossRef]
29. San Miguel, J.F.; Almeida, J.; Mateo, G.; Blade, J.; Lopez-Berges, C.; Caballero, D.; Hernandez, J.; Moro, M.J.; Fernandez-Calvo,J.; Diaz-Mediavilla, J.; et al. Immunophenotypic evaluation of the plasma cell compartment in multiple myeloma: A tool forcomparing the efficacy of different treatment strategies and predicting outcome. Blood 2002, 99, 1853–1856. [CrossRef]
30. Rueff, J.; Medinger, M.; Heim, D.; Passweg, J.; Stern, M. Lymphocyte subset recovery and outcome after autologous hematopoieticstem cell transplantation for plasma cell myeloma. Biol. Blood Marrow Transpl. 2014, 20, 896–899. [CrossRef]
31. Ho, C.M.; Mccarthy, P.L.; Wallace, P.K.; Zhang, Y.; Fora, A.; Mellors, P.; Tario, J.D.; Mccarthy, B.L.S.; Chen, G.L.; Holstein, S.A.;et al. Immune signatures associated with improved progression-free and overall survival for myeloma patients treated withAHSCT. Blood Adv. 2017, 1, 1056–1066. [CrossRef] [PubMed]
32. Flores-Montero, J.; Sanoja-Flores, L.; Paiva, B.; Puig, N.; García-Sánchez, O.; Böttcher, S.; Van Der Velden, V.H.J.; Pérez-Morán, J.J.;Vidriales, M.B.; García-Sanz, R.; et al. Next generation flow for highly sensitive and standardized detection of minimal residualdisease in multiple myeloma. Leukemia 2017, 31, 2094–2103. [CrossRef] [PubMed]
33. Ciudad, J.; Orfao, A.; Vidriales, B.; Macedo, A.; Martínez, A.; González, M.; López-Berges, M.C.; Valverde, B.; San Miguel, J.F.Immunophenotypic analysis of CD19+ precursors in normal human adult bone marrow: Implications for minimal residualdisease detection. Haematologica 1998, 83, 1069–1075.
34. Delgado, J.A.; Guillén-Grima, F.; Moreno, C.; Panizo, C.; Pérez-Robles, C.; Mata, J.J.; Moreno, L.; Arana, P.; Chocarro, S.; Merino, J.A simple flow-cytometry method to evaluate peripheral blood contamination of bone marrow aspirates. J. Immunol. Methods2017, 442, 54–58. [CrossRef] [PubMed]
35. Rawstron, A.C.; Orfao, A.; Beksac, M.; Bezdickova, L.; Brooimans, R.A.; Bumbea, H.; Dalva, K.; Fuhler, G.; Gratama, J.; Hose, D.;et al. Report of the European Myeloma Network on multiparametric flow cytometry in multiple myeloma and related disorders.Haematologica 2008, 93, 431–438. [CrossRef] [PubMed]
36. Gupta, R.; Bhaskar, A.; Kumar, L.; Sharma, A.; Jain, P. Flow cytometric immunophenotyping and minimal residual diseaseanalysis in multiple myeloma. Am. J. Clin. Pathol. 2009, 132, 728–732. [CrossRef]
37. Arroz, M.; Came, N.; Lin, P.; Chen, W.; Yuan, C.; Lagoo, A.; Monreal, M.; de Tute, R.; Vergilio, J.A.; Rawstron, A.C.; et al.Consensus guidelines on plasma cell myeloma minimal residual disease analysis and reporting. Cytom. Part B Clin. Cytom. 2016,90, 31–39. [CrossRef]
38. Orfao, A.; Escribano, L.; Villarrubia, J.; Velasco, J.L.; Cerveró, C.; Ciudad, J.; Navarro, J.L.; San Miguel, J.F. Flow cytometricanalysis of mast cells from normal and pathological human bone marrow samples: Identification and enumeration. Am. J. Pathol.1996, 149, 1493–1499. [PubMed]
39. Escribano, L.; Orfao, A.; Díaz-Agustin, B.; Villarrubia, J.; Cerveró, C.; López, A.; Marcos, M.A.; Bellas, C.; Fernández-Cañadas, S.;Cuevas, M.; et al. Indolent systemic mast cell disease in adults: Immunophenotypic characterization of bone marrow mast cellsand its diagnostic implications. Blood 1998, 91, 2731–2736. [CrossRef]
40. Escribano, L.; Díaz-Agustín, B.; Bellas, C.; Navalón, R.; Nuñez, R.; Sperr, W.R.; Schernthaner, G.H.; Valent, P.; Orfao, A. Utilityof flow cytometric analysis of mast cells in the diagnosis and classification of adult mastocytosis. Leuk. Res. 2001, 25, 563–570.[CrossRef]
41. Brooimans, R.A.; Kraan, J.; van Putten, W.; Cornelissen, J.J.; Löwenberg, B.; Gratama, J.W. Flow cytometric differential of leukocytepopulations in normal bone marrow: Influence of peripheral blood contamination. Cytom. Part B Clin. Cytom. 2009, 76, 18–26.[CrossRef] [PubMed]
42. Gener, G.; Espasa, A.; Raya, M.; Vergara, S.; Juncà, J.; Sorigue, M. Brief communication: Distribution of bone marrow cell subsetsand hemodilution in patients with acute leukemia. Int. J. Lab. Hematol. 2020, 42, e192–e195. [CrossRef] [PubMed]
43. Linton, P.J.; Dorshkind, K. Age-related changes in lymphocyte development and function. Nat. Immunol. 2004, 5, 133–139.[CrossRef] [PubMed]
44. Radbruch, A.; Muehlinghaus, G.; Luger, E.O.; Inamine, A.; Smith, K.G.; Dorner, T.; Hiepe, F. Competence and competition: Thechallenge of becoming a long-lived plasma cell. Nat. Rev. Immunol. 2006, 6, 741–750. [CrossRef] [PubMed]
Cancers 2021, 13, 1704 18 of 18
45. Tokoyoda, K.; Egawa, T.; Sugiyama, T.; Choi, B.; Nagasawa, T. Cellular niches controlling B lymphocyte behavior within bonemarrow during development. Immunity 2004, 20, 707–718. [CrossRef] [PubMed]
46. Mayack, S.R.; Shadrach, J.L.; Kim, F.S.; Wagers, A.J. Systemic signals regulate ageing and rejuvenation of blood stem cell niches.Nature 2010, 463, 495–500. [CrossRef]
47. Perez-Andres, M.; Paiva, B.; Nieto, W.G.; Caraux, A.; Schmitz, A.; Almeida, J.; Vogt, R.F.; Marti, G.E.; Rawstron, A.C.; Van Zelm,M.C.; et al. Human peripheral blood B-Cell compartments: A crossroad in B-cell traffic. Cytom. Part B Clin. Cytom. 2010, 78, 47–60.[CrossRef]
48. Tsujimoto, T.; Lisukov, A.; Huang, N.; Mahmoud, M.S.; Kawano, M.M. Plasma cells induce apoptosis. Blood 1996, 87, 3375–3383.[CrossRef]
49. Theunissen, P.M.J.; van den Branden, A.; Van Der Sluijs-Gelling, A.; De Haas, V.; Beishuizen, A.; van Dongen, J.J.M.; Van DerVelden, V.H.J. Understanding the reconstitution of the B-cell compartment in bone marrow and blood after treatment for B-cellprecursor acute lymphoblastic leukaemia. Br. J. Haematol. 2017, 178, 267–278. [CrossRef] [PubMed]
50. Jimenez-Zepeda, V.; Duggan, P.; Neri, P.; Chaudhry, A.; Tay, J.; Bahlis, N.J. Immunoglobulin recovery after ASCT for patients withmultiple myeloma: Impact on overall survival and progression-free survival. Blood 2016, 128, 2263. [CrossRef]
51. Tete, S.M.; Bijl, M.; Sahota, S.S.; Bos, N.A. Immune defects in the risk of infection and response to vaccination in monoclonalgammopathy of undetermined significance and multiple myeloma. Front. Immunol. 2014, 5, 1–14. [CrossRef] [PubMed]
52. Kumar, S.; Paiva, B.; Anderson, K.C.; Durie, B.; Landgren, O.; Moreau, P.; Munshi, N.; Lonial, S.; Bladé, J.; Kyle, R.A.; et al.International Myeloma Working Group consensus criteria for response and minimal residual disease assessment in multiplemyeloma. Lancet Oncol. 2016, 17, e328–e346. [CrossRef]
53. Kalina, T.; Flores-Montero, J.; Van Der Velden, V.H.J.; Martin-Ayuso, M.; Böttcher, S.; Ritgen, M.; Almeida, J.; Lhermitte, L.;Asnafi, V.; Mendonça, A.; et al. EuroFlow standardization of flow cytometer instrument settings and immunophenotypingprotocols. Leukemia 2012, 26, 1986–2010. [CrossRef]
54. Nilsson, A.; De Milito, A.; Mowafi, F.; Winberg, G.; Björk, O.; Wolpert, E.Z.; Chiodi, F. Expression of CD27-CD70 on early B cellprogenitors in the bone marrow: Implication for diagnosis and therapy of childhood ALL. Exp. Hematol. 2005, 33, 1500–1507.[CrossRef] [PubMed]
55. Vaskova, M.; Fronkova, E.; Starkova, J.; Kalina, T.; Mejstrikova, E.; Hrusak, O. CD44 and CD27 delineate B-precursor stages withdifferent recombination status and with an uneven distribution in nonmalignant and malignant hematopoiesis. Tissue Antigens2008, 71, 57–66. [CrossRef]