awake rat pharmacological mri as a translational...
TRANSCRIPT

JPET #173880
1
TITLE PAGE
Awake Rat Pharmacological MRI as a Translational Pharmacodynamic Biomarker: mGluR2/3 Agonist Modulation of Ketamine-induced BOLD Signals
Chih-Liang Chin, Jaymin Upadhyay, Gerard J. Marek , Scott J. Baker, Min Zhang , Mario Mezler, Gerard B. Fox, Mark Day
Translational Imaging, Advanced Technology (C.-L.C., J.U., G.B.F., M.D.), Neuroscience Discovery (S.J.B., M.Z.),
Neuroscience Development (G.J.M.), Global Pharmaceutical Research and Development, Abbott laboratories, USA,
Neuroscience Discovery (M.M.), Abbott GmbH & Co KG, Knollstrasse 50, 67061 Ludwigshafen, Germany
JPET Fast Forward. Published on December 20, 2010 as DOI:10.1124/jpet.110.173880
Copyright 2010 by the American Society for Pharmacology and Experimental Therapeutics.
This article has not been copyedited and formatted. The final version may differ from this version.JPET Fast Forward. Published on December 20, 2010 as DOI: 10.1124/jpet.110.173880
at ASPE
T Journals on June 22, 2018
jpet.aspetjournals.orgD
ownloaded from

JPET #173880
2
RUNNING TITLE PAGE Running Title: Ketamine phMRI in Awake Rat as a Pharmacodynamic Biomarker Corresponding Author:
Mark Day, Ph.D. Translational Imaging & Biochemical Biomarkers Global Pharmaceutical Research and Development Abbott Laboratories, Dept R4DF 100 Abbott Park Road, Bldg AP4-2 Abbott Park, IL 60064 Tel (847) 938-4266 Fax (847) 938-5286 Email: [email protected]
Text pages: 10 Tables: 1 Figures: 3 References: 40 Words in Abstract: 197 Words in Introduction: 660 Words in Discussion: 1373 Non-standard Abbreviations: MRI, magnetic resonance imaging, phMRI, pharmacological MRI, fMRI, functional MRI, BOLD, blood oxygenation level dependence, PD, pharmacodynamic, mGluR2/3, metabotropic glutamate2/3, NMDA, N-methyl-D-aspartate, rCBV, relative cerebral blood volume, rCBF, relative cerebral blood flow, PAG, periaqueductal gray, VTA, ventral tegmental area, PET, positron emission tomography, SPECT, single photon emission computed tomography, TE, target engagement, EPI, echo-planar imaging, FLASH, fast low angle shot magnetic resonance imaging, PK, pharmacokinetic, PCP, phencyclidine
This article has not been copyedited and formatted. The final version may differ from this version.JPET Fast Forward. Published on December 20, 2010 as DOI: 10.1124/jpet.110.173880
at ASPE
T Journals on June 22, 2018
jpet.aspetjournals.orgD
ownloaded from

JPET #173880
3
ABSTRACT Neuroimaging techniques have been exploited to characterize the effect NMDA receptor antagonists on brain activation
in humans and animals. However, most preclinical imaging studies were conducted in anesthetized animals and could be
confounded by potential drug-anesthetic interactions as well as anesthetic agents’ effect on brain activation. Such confounds
may affect the translation of these basic research findings to the clinical setting. The main aim of the current study was to
examine the brain activation elicited by the infusion of a sub-anesthetic dose of ketamine using blood oxygenation level
dependence (BOLD) pharmacological MRI (phMRI) in awake rats. However, a sub-aim was to determine if a behaviorally
active metabotropic glutamate2/3 receptor agonist, LY379268, could modulate the effects of ketamine-induced brain activation.
Our data indicate that ketamine produces positive BOLD signals in several cortical and hippocampal regions whilst negative
BOLD signals were observed in regions, such as periaqueductal gray (PAG) (p<0.05). Furthermore, pretreatment of LY379268
significantly attenuated ketamine-induced brain activation in a region-specific manner (posterior cingulate, entorhinal, and
retrosplenial cortices, hippocampus CA1, and PAG). Thus, the region-specific brain activations observed in this awake rat,
ketamine phMRI study may have utility as a translational biomarker for investigating symptom domains of schizophrenia.
This article has not been copyedited and formatted. The final version may differ from this version.JPET Fast Forward. Published on December 20, 2010 as DOI: 10.1124/jpet.110.173880
at ASPE
T Journals on June 22, 2018
jpet.aspetjournals.orgD
ownloaded from

JPET #173880
4
INTRODUCTION
In light of high attrition rates in drug development, there is an urgent need to improve the predictability of preclinical
behavioral models to clinical outcome. Meeting this demand requires the discovery, validation and implementation of
biomarkers that improve the congruency of preclinical models to clinical reality, and the establishment of proof-of-concept
(POC) for efficacy and safety based on targeted mechanisms of action (Feuerstein et al., 2008; Day et al., 2009). Thus, it is
essential to establish translational endpoints that allow the determination of whether the experimental therapeutic has the same
pharmacological and physiological effects in a preclinical species as it does in healthy humans and ultimately in a clinical
population (Day et al., 2008). In vivo translational imaging, such as positron emission tomography (PET), single photon
emission computed tomography (SPECT), or pharmacological MRI (phMRI), is one novel pathway to improve the
translatability from animal models to clinical outcome (Borsook et al., 2006; Fox et al., 2009; Wong et al., 2009). In particular,
phMRI allows investigating the effects of an experimental or approved therapeutic on functional endpoints (e.g. changes in
blood oxygenation level dependence (BOLD) signals, regional cerebral blood volume / flow (rCBV / rCBF)) and may allow a
better understanding of the neurobiological mechanisms (i.e. physiology and pharmacology) underlying the drug effect (Borsook
et al., 2006). For example, the glutamatergic hypothesis of schizophrenia is supported from several lines of clinical evidence,
including genetic, postmortem and human psychosis modeling (Krystal et al., 1994; Malhotra et al., 1997). In fact, N-methyl-D-
aspartate (NMDA) antagonists, such as phencyclidine (PCP) or ketamine, can induce symptoms that mimic psychosis in healthy
volunteers and exacerbate symptoms in schizophrenic patients (Krystal et al., 1994; Lahti et al., 1995). Using in vivo imaging,
Littlewood and colleagues demonstrated that ketamine increased BOLD signals in the frontal, hippocampal, cortical and limbic
areas with the largest activations observed in the retrosplenial cortex and hippocampus (Littlewood et al., 2006). Additionally, it
was found that pretreatment of glutamatergic agents appeared to globally modulate rCBV changes in rats challenged with
phencyclidine (PCP) (Gozzi et al., 2008). It is intriguing that ketamine, which can induce psychomimetic symptoms or
behavioral aberrations (Moghaddam et al., 1997; Nishizawa et al., 2000; Becker and Grecksch, 2004), produced significant
changes of brain activity in the across several cortical, hippocampal and midbrain regions in animals and humans (Langsjo et al.,
2003; Holcomb et al., 2005; Honey et al., 2005; Littlewood et al., 2006). A central translational perspective is to conduct the
preclinical studies in a way that we would conduct the study in humans. However, a translational gap is the use of anesthesia in
animal imaging studies. Several lines of evidence have shown that anesthesia can reduce functional responses and lead to
discrepancy in observed activation patterns (Lahti et al., 1999; Austin et al., 2005; Chin et al., 2008a). Therefore, awake animal
imaging is particularly attractive for investigating drug-induced brain activity, given that anesthetic-drug interactions likely
confound the data interpretations as well as translatability of basic research to clinical investigations.
The main aim of the current study was to examine the brain activation elicited by the infusion of a sub-anesthetic dose
of ketamine using blood oxygenation level dependence (BOLD) pharmacological MRI (phMRI) in awake rats. Study 1
examined the brain activation elicited by the infusion of a sub-anesthetic dose of ketamine using BOLD phMRI in awake rats.
This article has not been copyedited and formatted. The final version may differ from this version.JPET Fast Forward. Published on December 20, 2010 as DOI: 10.1124/jpet.110.173880
at ASPE
T Journals on June 22, 2018
jpet.aspetjournals.orgD
ownloaded from
JPET #173880
5
Considering that positive results were recently reported in a Phase II schizophrenia trial with the mGluR2/3 agonist pro-drug,
LY2140023 (Patil et al., 2007), we added a sub-aim, to determine if a behaviorally active metabotropic glutamate2/3 receptor
agonist, LY379268, could modulate the effects of ketamine-induced brain activation (Schoepp and Marek, 2002; Imre, 2007).
Study 2 aimed to test whether the ketamine-induced changes in the BOLD signal could be affected by the administration of a
commercially available mGluR2/3 agonist. To this end, we characterized the effect of LY379268 on the ketamine-induced brain
activation and hypothesized that LY379268 would modulate BOLD signal changes in specific regions of interest.
METHODS
Animals
All studies were conducted in accordance with Institutional Animal Care and Use Committee (IACUC) guidelines at
Abbott Laboratories as well as the National Institutes of Health Guide for Care and Use of Laboratory Animals guidelines.
Adult male Sprague-Dawley rats (Charles River, Portage, MI) were used for imaging experiments (n = 20; weight: 300~350 g).
Rats were group-housed in temperature-controlled (22o-24oC) rooms and maintained on a 12:12 light:dark cycle with lights on at
6:00 am. Rat chow and water were provided ad libitum. Facilities at Abbott Laboratories are further accredited by the
Association for the Assessment and Accreditation of Laboratory Animal Care (AAALAC).
Drug Preparation and Administration
LY379268 was purchased from Tocris Bioscience (Ellisville, MO) and dissolved in 5% hydroxypropyl methyl
cellulose (Acros Organics, Morris Plains, NJ) in saline. Ketamine hydrochloride solution was purchased from Sigma-Aldrich
(St. Louis, MO, USA). Rats were divided into four different treatment groups (n = 5 per group): (i) interperitoneal (ip)
pretreatment of vehicle (5% hydroxypropyl methyl cellulose in saline) followed a ketamine challenge (30 mg/kg ip); (ii)
pretreatment of LY379268 (10 mg/kg ip) followed by a ketamine challenge (30 mg/kg ip); (iii) pretreatment of LY379268 (10
mg/kg ip) followed by a saline challenge, and (iv) challenge with LY379268 (10 mg/kg ip) without any pretreatment. The
injection volume of LY379268 or vehicle was 2 mL/kg, while ketamine was given at 1 mL/kg. Of note, the choice of a sub-
anesthetic dose of ketamine in the current study was based on previously published work (Ellison, 1995; Becker and Grecksch,
2004) as well as in-house exploratory findings. In a pilot study, we examined brain activation induced by different doses/routes
This article has not been copyedited and formatted. The final version may differ from this version.JPET Fast Forward. Published on December 20, 2010 as DOI: 10.1124/jpet.110.173880
at ASPE
T Journals on June 22, 2018
jpet.aspetjournals.orgD
ownloaded from
JPET #173880
6
of administration of ketamine, in which we clearly observed global negative BOLD signals in rats treated with a higher, or
presumably anesthetic, dose of ketamine (not shown), whilst a dose of 30 mg/kg ip resulted in robust positive BOLD signals.
Pharmacological MRI
A method of reducing and controlling head motion artifacts, when imaging awake rats has been previously
characterized (King et al., 2005) using a dedicated animal holder (Ekam Imaging Inc., Shrewsbury MA), which includes a head
restrainer and a cylindrical body tube. This method of imaging awake animals has been used for fMRI across several
publications (Lahti et al., 1999; Chin et al., 2008a; Chin et al., 2008b; Ferris et al., 2008). Briefly, the head restrainer contains a
half-circular headpiece and a blunted ear bar positioned over the ears and fitted into the ear canals. The animal’s head was
positioned into the headpiece as the rat’s incisors were secured over a bite bar and ears situated inside the head restrainer. Then,
the body of the animal was placed inside the cylindrical body tube to minimize movement without restricting respiration. To
alleviate the stress, each animal was acclimated to this dedicated animal holder for four training sessions of varying lengths (10,
30, and 60 min on 4 separate days) prior to imaging (Chin et al., 2008a). Further, to mimic the environment inside the magnet
bore during imaging, habituation was conducted inside a ventilated acoustic chamber where a tape-recording of the noise
generated by imaging gradients was played. During training, rats were anesthetized with ~3% isoflurane (Abbott Laboratories,
Abbott Park, IL, USA) for positioning inside the holder and then allowed to recover from anesthesia during the habituation
period. On the day of imaging, rats were again briefly anesthetized with isoflurane (5% induction, 3% maintenance in air),
placed into the imaging holder and an ip catheter (PE-160 tubing) was placed for the drug challenge. Rats were allowed to
recover from the effects of isoflurane within the imaging holder in the magnet for approximately 20~25 min before collecting
functional data. Notably, Lockharet et al reported that the half-life of isoflurane in rabbit brain was around 8 min and the value
could depend on the duration of anesthesia (Lockhart et al., 1991). For example, a half-life of 16 min was found in rabbits that
have been exposed to isoflurane for 90 min (Strum et al., 1986), in contrast to 30-min time period experienced in Lockhart and
colleagues’ experiments (Lockhart et al., 1991). In our study, rats were under isoflurane during the preparation work (e.g. ip
line placement; positioning into the animal holder), which typically takes 15 min or less. Thus, based on the published
isoflurane half-life data (Strum et al., 1986; Lockhart et al., 1991) and the current imaging protocol (Fig 1), it suffices to assume
that the effect of isoflurane during imaging is negligible.
This article has not been copyedited and formatted. The final version may differ from this version.JPET Fast Forward. Published on December 20, 2010 as DOI: 10.1124/jpet.110.173880
at ASPE
T Journals on June 22, 2018
jpet.aspetjournals.orgD
ownloaded from

JPET #173880
7
All imaging experiments were carried out on a 7T Bruker Biospec MRI scanner (Karlsruhe, Germany). The phMRI
data were collected with eight-shot spin-echo EPI sequence with imaging parameters: TR/TE = 3200/50 ms, in-plane resolution
= 250 × 250 μm2, slice thickness = 1.0 mm, and inter-slice spacing = 0.25. There were 10 slices prescribed in the coronal plane,
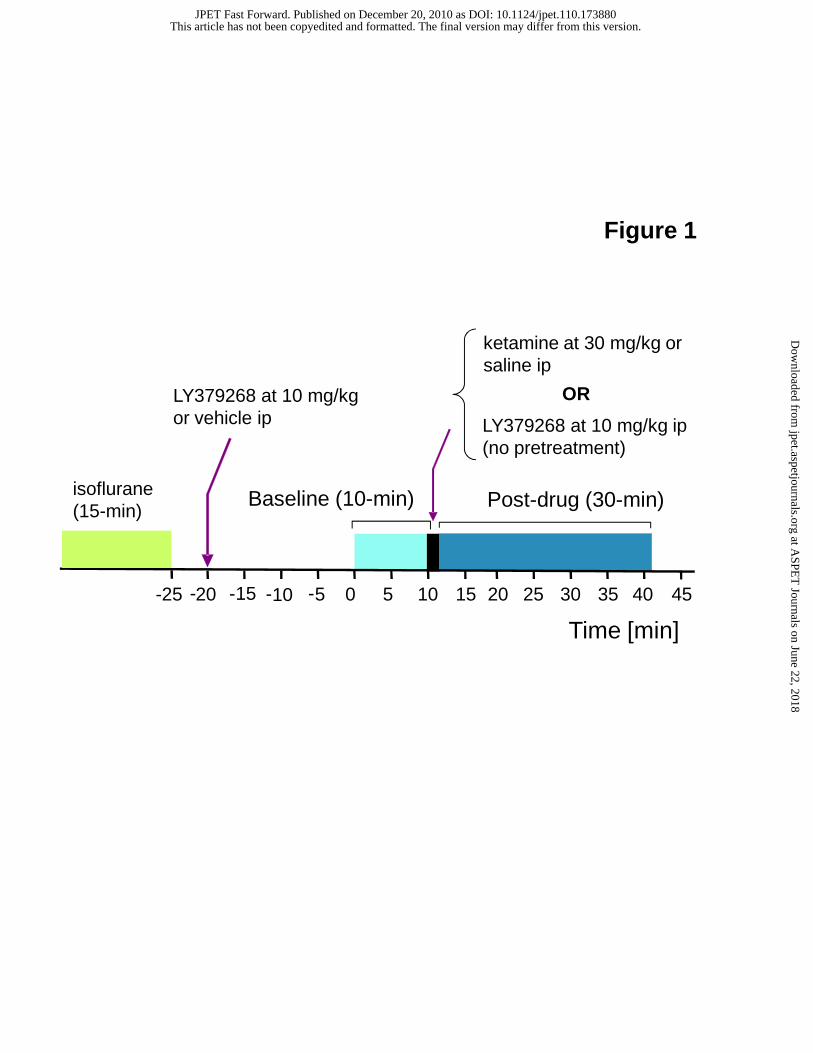
centered to cover the whole brain. The imaging protocol included (i) 10 min baseline acquisition, (ii) ip infusion of either
vehicle or drug over 2 min (infusion rate = 0.4 mL/min), and (iii) 30 min period of post-drug imaging acquisition (see Fig. 1).
Of note, the pretreatment was typically given approximately 30 min prior to ketamine or saline challenge.
Pharmacokinetic Study of LY379268
To evaluate the exposure levels at the time when the maximum drug-induced BOLD signal changes were observed, a
pharmacokinetic study was performed using a satellite group of animals (n = 5). Experiments were carried out to mimic the
phMRI study by following the imaging protocol, in which rats were treated with LY379268 at 10 mg/kg ip. Then,
approximately 30 min after drug infusion, blood samples were obtained via cardiac puncture and brains were then immediately
collected and snap-frozen for pharmacokinetic analysis.
Data Analysis
Data analysis was performed using AFNI software package (Cox, 1996) and in-house IDL (Research Systems, Inc.,
Boulder, CO, USA) programs. We performed motion correction by co-registering time-course data to the first baseline imaging
dataset. To determine activated pixels, cross-correlation coefficients between the time-course raw data and a step function
(OFF/ON ≡ pre-drug baseline/post-drug period) were calculated on a pixel-by-pixel basis within the brain parenchyma for
individual animals. Later, z-scores were derived from the calculated cross-correlation coefficients, while percentage BOLD
signal changes were derived from mean signal intensity calculated from the baseline and post-drug periods. Specifically, the
percentage BOLD signal changes were derived by the change in average signal intensity between the pre-drug infusion period
(10 minute time interval) and average signal intensity during the post-drug infusion period (30 minute time period). In addition,
baseline levels were not normalized across or within treatment groups. In order to perform group analysis, anatomical images
obtained from individual animals were co-registered into a template image set by rigid body translations and rotations; these
calculated transformation matrix parameters were then applied to the functional dataset and derived statistical maps. Regions-
of-interest (ROI) analyses were performed to obtain regional BOLD signal changes, in which specific regions were outlined
This article has not been copyedited and formatted. The final version may differ from this version.JPET Fast Forward. Published on December 20, 2010 as DOI: 10.1124/jpet.110.173880
at ASPE
T Journals on June 22, 2018
jpet.aspetjournals.orgD
ownloaded from
JPET #173880
8
manually based on a rat brain atlas (Paxinos and Watson, 1998). Subsequently, regional mean BOLD signal changes (mean ±
SEM) were retrieved from various cortical and sub-cortical structures for each treatment group. Statistical significance between
groups was determined using t-test (JMP 7.0.1, SAS Institute, Cary NC), with differences considered statistically significant at
p<0.05. In addition, group comparisons (un-paired t-test) were conducted using AFNI with a threshold p<0.05, in order to
determine brain regions affected by the ketamine challenge or pretreatment of LY379268. Finally, to illustrate the temporal
dynamics of BOLD signal, representative time-course data for each treatment group were also extracted
RESULTS
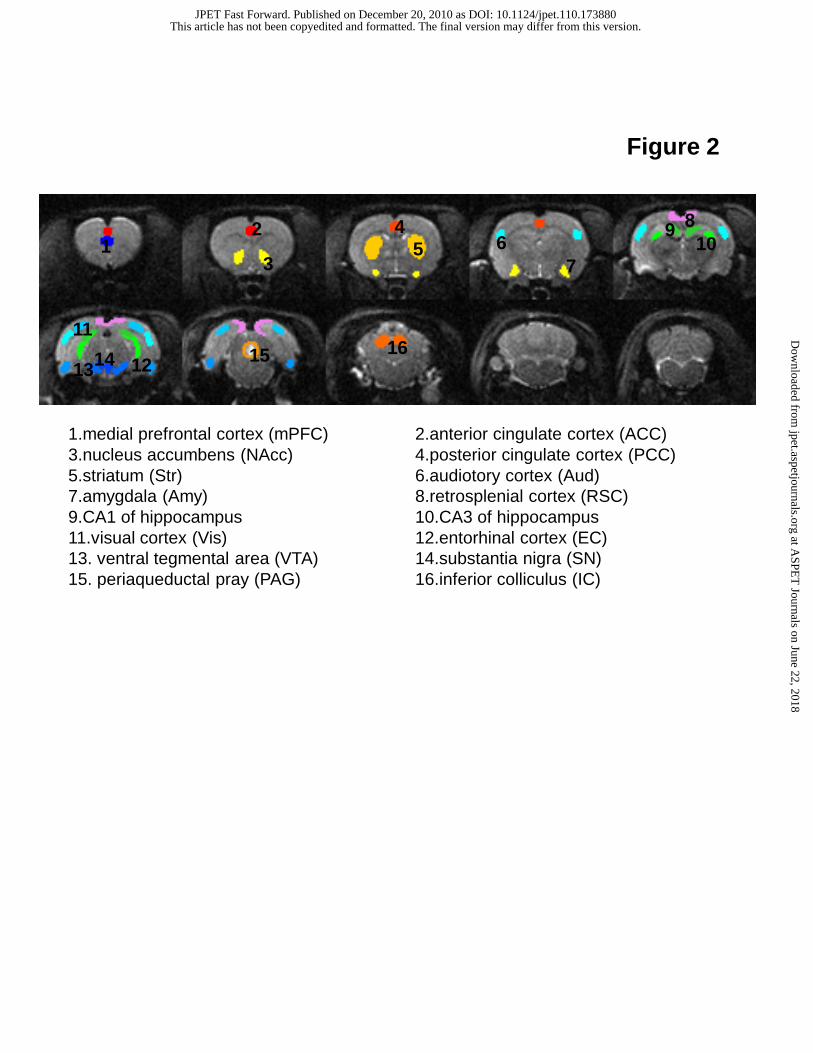
Figure 2 shows the anatomical images as well as sixteen brain regions used for ROI analyses. The selection of these
brain regions was based on possible involvement of schizophrenia-like symptoms induced by ketamine or PCP, as reported in
previous animal studies (Duncan et al., 1998; Gozzi et al., 2008). Table 1 lists regional BOLD signal changes (mean ± SEM)
calculated from each treatment group. The results indicated that, compared to saline-challenged rats, ketamine produced a
significant increase in BOLD signals (p<0.05) in brain region, such as the medial prefrontal, cingulate, retrosplenial, entorhinal,
auditory, and visual cortices as well as CA1 region of the hippocampus, whilst negative BOLD signals were observed in the
PAG (p<0.05). A significant increase in BOLD signal was also found in the striatum, but not in nucleus accumbens, ventral
tegmental area, nor substantia nigra. Of note, these ROI-based data are consistent with group comparisons results in which brain
regions showed a significant effect to the ketamine challenge (Fig 3A). No significant or robust activation was observed in rats
pretreated with LY379268 at 10 mg/kg ip then later challenged with saline (not shown). This observation is consistent with our
previous saline data (Chin et al., 2008a) and indicate that pretreatment of LY379269 does not modulate the saline response. In
addition, we found that pretreatment of LY379268 significantly attenuated the ketamine-induced BOLD signals in a region-
specific manner, including posterior cingulate, entorhinal, retrosplenial cortices, hippocampus CA1, and PAG (Fig 3B and Table
1). Again, good agreement between data generated from ROI analyses (Table 1) and group comparisons were obtained. Finally,
time-course data obtained from the retrosplenial cortex are shown in Figure 3C. The results indicate that an increase in the
BOLD signal occurring immediately after ketamine infusion can be abolished by the pretreatment of LY379268.
Our pharmacokinetic data obtained from the satellite animals indicate that the corresponding LY379268 plasma and
brain exposure levels (mean ± SEM) are 2.57 ± 0.25 μg/mL and 0.44 ± 0.09 μg/g, respectively. Considering the affinity of
This article has not been copyedited and formatted. The final version may differ from this version.JPET Fast Forward. Published on December 20, 2010 as DOI: 10.1124/jpet.110.173880
at ASPE
T Journals on June 22, 2018
jpet.aspetjournals.orgD
ownloaded from
JPET #173880
9
LY379268 for mGluR2/3 receptors (EC50 = 3~6 μM; ((Imre, 2007)), the drug exposure reached in the current study should be
comparable with efficacious doses used in behavioral measures (i.e. ketamine-induced hyperactivity, (Lorrain et al., 2003)).
DISCUSSION
The main aim of the current study was to examine the brain activation elicited by the infusion of a sub-anesthetic dose
of ketamine using BOLD phMRI in awake rats and our data are the first to characterize the modulatory effects of ketamine
across several brain regions in awake rodents. Strong activations were observed in the medial prefrontal, hippocampal and
cortico-limbic regions. No significant brain activations were observed from saline-challenged rats, which are consistent with
our previous findings (Chin et al., 2008a). A secondary aim was to determine if the metabotropic glutamate2/3 receptor agonist,
LY379268, could modulate the effects of ketamine-induced brain activation at doses that are active in behavioral models. To
this end, it was demonstrated that the pretreatment of LY379268, selectively modulated changes in the ketamine-induced
BOLD signal, including the posterior cingulate, entorhinal, and retrosplenial cortices, CA1, as well as PAG. Such region-
specific activity may indicate the utility of the ketamine model to be used as a translatable pharmacodynamic (PD) biomarker.
Previously, Duncan et al observed significant changes in uptake of [14C]2-deoxyglucose (2-DG) in specific brain regions in rats,
including medial prefrontal cortex, retrosplenial cortex, hippocampus, nucleus accumbens, amygdala, and thalamic nuclei after
ketamine challenge (Duncan et al., 1998). Further, in the same study they found 2-DG uptake can be normalized by the
pretreatment of clozapine, but not haloperidol (Duncan et al., 1998). The ketamine-induced BOLD signal changes we report in
awake animals are, for several ROIs, in agreement with the previous reports using similar imaging methods in anesthetized
animals. Littlewood et al have shown that ketamine produced positive BOLD signals in the frontal, hippocampal, cortical and
limbic areas with the largest activations observed in the retrosplenial cortex and hippocampus; more importantly, changes in
BOLD signal appeared to correlate with the PD profile of the drug (Littlewood et al., 2006). However, in our study, we also
found deactivations in the PAG that have not been reported in any previous ketamine phMRI studies in humans and animals.
Moreover, the activations of several midbrain ROIs reported by Littlewood et al were not seen in our study (e.g. activations in
nucleus accumbens, amygdala; deactivations were seen in the inferior colliculus) (Littlewood et al., 2006). Several other phMRI
studies also report a larger number of activated ROIs, albeit using PCP to modulate rCBV (Gozzi et al., 2008) or BOLD signal
(Hackler et al., 2010). In those studies, activations of the thalamus, motor cortex, striatum, nucleus accumbens, were reported.
This article has not been copyedited and formatted. The final version may differ from this version.JPET Fast Forward. Published on December 20, 2010 as DOI: 10.1124/jpet.110.173880
at ASPE
T Journals on June 22, 2018
jpet.aspetjournals.orgD
ownloaded from

JPET #173880
10
To reconcile this discrepancy, in addition to awake imaging, the differences in imaging methods/parameters, doses/routes of
administration, or imaging hardware used might collectively contribute to the limited midbrain activation in our results. For
example, in contrast to using rCBV measurements (Gozzi et al., 2008) or a FLASH imaging method (Hackler et al., 2010), we
employed an EPI protocol to collect BOLD data, which is the standard imaging method used in human fMRI studies.
One of the key findings in the current study is the region-specific effect of the mGluR2/3 agonist, LY379268, on
ketamine-induced brain activations. Interestingly, Krystal et al have shown that healthy subjects, pretreated with an mGluR2/3
agonist show little evidence of memory impairment during ketamine infusion (Krystal et al., 2005), whilst we observed that
pretreatment of LY379268 attenuated ketamine-induced positive BOLD signals in brain regions associated with episodic
memory function. Significant modulation of ketamine was seen in specific brain regions (see Table 1), which might afford
testing translatability to healthy volunteers, assuming that the same ROIs would be affected. Recently, it has been demonstrated
that biphenyl indanone-A (BINA), an mGluR2 positive allosteric potentiator, modulated PCP-induced BOLD signals across
several ROIs, where hyperglutamergic activities were blocked with the pretreatment of BINA in the prefrontal cortex, caudate
and putamen, nucleus accumbens, retrosplenial and motor cortices as well as the mediodorsal thalamus (Hackler et al.). Further,
it is known that PCP produces a noncompetitive blockade of NMDA Ca++ channel, whereas ketamine is a less potent blocker of
the same channel. Thus, a comparable effect of PCP and ketamine on brain activation is expected. In fact, it has been shown
these drugs induced similar effects on behavioral outcome and neurotransmission (Ellison, 1995; Imre, 2007). Taken together,
the use of such mGluR2 selective agents offers the potential to dissect the relative contributions of mGluR subtypes to neuronal
modulation as assessed by NMDA antagonist challenge. However, the reconciliation of the studies between the positive
allosteric modulator BINA and mGluR2/3 agonists are confounded by the use of anesthesia in their study. Nonetheless, such
data coupled with the positive clinical data (Patil et al., 2007), add to the growing body of evidence indicating the importance
and potential utility of glutamatergic agents for treating schizophrenia (Marek, 2004) and the need for translatable biomarkers to
accelerate discovery and development of these experimental therapeutics. Therefore, phMRI, using ketamine as a challenge,
offers the potential utility to establish a faster clinical path by optimizing dose selection for mGluR2/3 agonism. However, such
conclusions are beyond the scope of the current manuscript; to establish such translatability would require the establishment of
dose response relationships in animals and humans, in order to investigate the minimal effective dose, dose range and the
specific regions-of-interest where the BOLD signal is modulated across species.
This article has not been copyedited and formatted. The final version may differ from this version.JPET Fast Forward. Published on December 20, 2010 as DOI: 10.1124/jpet.110.173880
at ASPE
T Journals on June 22, 2018
jpet.aspetjournals.orgD
ownloaded from

JPET #173880
11
The current study essentially back translates the ketamine-induced brain activation that has previously been done in
human. In the human PET study, ketamine elevated rCBF, with the largest effects in the anterior cingulate cortex (Langsjo et
al., 2003; Holcomb et al., 2005). Likewise, positive BOLD signals in the frontal, mid-posterior cingulate, temporal, motor
cortex, and hippocampus were observed in healthy subjects infused with ketamine (Deakin et al., 2008). In a human BOLD
fMRI study using an episodic memory task, it was found that ketamine infusion potentiated frontal activation during the
encoding phase, but attenuated hippocampal activation during the retrieval phase (Honey et al., 2005); therefore the effect of
ketamine on BOLD signal changes appears to be region-specific, albeit these observations could be task-dependent (Abel et al.,
2003). In our study, we also found cortical and hippocampal activation in awake rats, which agrees with regional specificity
reported in the human study (Deakin et al., 2008). In addition, ketamine appeared to increase glutamate metabolism in the
anterior cingulate cortex, as revealed via 1H-MRS study in healthy subjects (Rowland et al., 2005), and these findings are
consistent with the proposition that NMDA receptor hypofunction may increase glutamate release and result in
hypermetabolism in cortico-limbic regions. Thus, in view of both the anterior cingulate cortex and retrosplenial cortex are
involved in various aspects of information processing; the results observed from these studies imply that brain activation in such
regions may be reconciled with the underlying psychosis or memory deficits (Sharp et al., 1991). In fact, it has also been
consistently demonstrated that systemic administration of sub-anesthetic doses of ketamine can induce psychotomimetic
symptoms or behavioral aberrations in animals (Moghaddam et al., 1997; Nishizawa et al., 2000; Becker and Grecksch, 2004),
which supports the validity and translatability of the ketamine model for schizophrenia. Nevertheless, the molecular insights on
this hypoglutamatergic hypothesis remain elusive. For example, it was found that in the medial prefrontal cortex, local infusion
of ketamine does not elevate the extracellular glutamate concentration, whilst systemic administration results in increased
extracellular glutamate, implying that the interplay between excitatory and inhibitory neurons is critical to understand the
response to systemically applied NMDA antagonists in vivo (Lorrain et al., 2003). Thus, the observation of increased
extracellular glutamate levels following ketamine administration has been ascribed to its actions on GABAergic interneurons as
well as glial cells (Olney et al., 1999).
In summary, we have demonstrated ketamine infusion can produce significant changes in BOLD signal in awake rats,
and that the observed brain activation pattern is consistent with previous work (Littlewood et al., 2006; Deakin et al., 2008).
Further, we also found that pretreatment of LY379268 attenuated ketamine-induced BOLD signals in brain regions that are
This article has not been copyedited and formatted. The final version may differ from this version.JPET Fast Forward. Published on December 20, 2010 as DOI: 10.1124/jpet.110.173880
at ASPE
T Journals on June 22, 2018
jpet.aspetjournals.orgD
ownloaded from

JPET #173880
12
associated with episodic memory function. The regional specificity observed in the current study suggests that this ketamine
awake rat model could be used as a translational biomarker for investigating symptom domains of schizophrenia, although the
utility and translatability remain to be seen across species. This translational imaging approach may ultimately be translatable to
human phMRI in early clinical studies of novel therapeutic compounds.
This article has not been copyedited and formatted. The final version may differ from this version.JPET Fast Forward. Published on December 20, 2010 as DOI: 10.1124/jpet.110.173880
at ASPE
T Journals on June 22, 2018
jpet.aspetjournals.orgD
ownloaded from

JPET #173880
13
ACKNOWLEDGEMENTS:
The authors wish to extend their gratitude to Dr. Nathan R. Rusty for his help with animal studies and. and Dr. Vince Hradil for
his technical assistance for data analysis. We are also grateful to Dr. Laura Gault for insightful discussion.
This article has not been copyedited and formatted. The final version may differ from this version.JPET Fast Forward. Published on December 20, 2010 as DOI: 10.1124/jpet.110.173880
at ASPE
T Journals on June 22, 2018
jpet.aspetjournals.orgD
ownloaded from

JPET #173880
14
AUTHORSHIP CONTRIBUTIONS:
Participated in research design: Chin, Marek, Zhang, Fox, Day
Conducted experiments: Chin, Baker
Perform data analysis: Chin, Upadhyay, Baker
Wrote or contributed to the writing of the manuscript: Chin, Upadhyay, Marek, Mezler, Fox, Day
This article has not been copyedited and formatted. The final version may differ from this version.JPET Fast Forward. Published on December 20, 2010 as DOI: 10.1124/jpet.110.173880
at ASPE
T Journals on June 22, 2018
jpet.aspetjournals.orgD
ownloaded from

JPET #173880
15
REFERENCES
Abel KM, Allin MP, Kucharska-Pietura K, David A, Andrew C, Williams S, Brammer MJ and Phillips ML (2003) Ketamine alters neural processing of facial emotion recognition in healthy men: an fMRI study. Neuroreport 14:387-391.
Austin VC, Blamire AM, Allers KA, Sharp T, Styles P, Matthews PM and Sibson NR (2005) Confounding effects of anesthesia on functional activation in rodent brain: a study of halothane and alpha-chloralose anesthesia. Neuroimage 24:92-100.
Becker A and Grecksch G (2004) Ketamine-induced changes in rat behaviour: a possible animal model of schizophrenia. Test of predictive validity. Prog Neuropsychopharmacol Biol Psychiatry 28:1267-1277.
Borsook D, Becerra L and Hargreaves R (2006) A role for fMRI in optimizing CNS drug development. Nat Rev Drug Discov 5:411-424.
Chin CL, Pauly JR, Surber BW, Skoubis PD, McGaraughty S, Hradil VP, Luo Y, Cox BF and Fox GB (2008a) Pharmacological MRI in awake rats predicts selective binding of alpha4beta2 nicotinic receptors. Synapse 62:159-168.
Chin CL, Tovcimak AE, Hradil VP, Seifert TR, Hollingsworth PR, Chandran P, Zhu CZ, Gauvin D, Pai M, Wetter J, Hsieh GC, Honore P, Frost JM, Dart MJ, Meyer MD, Yao BB, Cox BF and Fox GB (2008b) Differential effects of cannabinoid receptor agonists on regional brain activity using pharmacological MRI. Br J Pharmacol 153:367-379.
Cox RW (1996) AFNI: software for analysis and visualization of functional magnetic resonance neuroimages. Comput Biomed Res 29:162-173.
Day M, Balci F, Wan HI, Fox GB, Rutkowski JL and Feuerstein G (2008) Cognitive endpoints as disease biomarkers: optimizing the congruency of preclinical models to the clinic. Curr Opin Investig Drugs 9:696-706.
Day M, Rutkowski JL and Feuerstein GZ (2009) Translational medicine-a paradigm shift in modern drug discovery and development: the role of biomarkers. Adv Exp Med Biol 655:1-12.
Deakin JF, Lees J, McKie S, Hallak JE, Williams SR and Dursun SM (2008) Glutamate and the neural basis of the subjective effects of ketamine: a pharmaco-magnetic resonance imaging study. Arch Gen Psychiatry 65:154-164.
Duncan GE, Leipzig JN, Mailman RB and Lieberman JA (1998) Differential effects of clozapine and haloperidol on ketamine-induced brain metabolic activation. Brain Res 812:65-75.
Ellison G (1995) The N-methyl-D-aspartate antagonists phencyclidine, ketamine and dizocilpine as both behavioral and anatomical models of the dementias. Brain Res Brain Res Rev 20:250-267.
Ferris CF, Stolberg T, Kulkarni P, Murugavel M, Blanchard R, Blanchard DC, Febo M, Brevard M and Simon NG (2008) Imaging the neural circuitry and chemical control of aggressive motivation. BMC Neurosci 9:111.
Feuerstein GZ, Gill D, Dormer C, Ruffolo RR, Rutkowski JL, Walsh FS and Hurko O (2008) The Vastly Neglected Biomarkers Contributing to Early Clinical Development Failure American Pharmaceutical Review 11:64-68.
Fox GB, Chin CL, Luo F, Day M and Cox BF (2009) Translational neuroimaging of the CNS: novel pathways to drug development. Mol Interv 9:302-313.
Gozzi A, Large CH, Schwarz A, Bertani S, Crestan V and Bifone A (2008) Differential effects of antipsychotic and glutamatergic agents on the phMRI response to phencyclidine. Neuropsychopharmacology 33:1690-1703.
Hackler EA, Byun NE, Jones CK, Williams JM, Baheza R, Sengupta S, Grier MD, Avison M, Conn PJ and Gore JC (2010) Selective potentiation of the metabotropic glutamate receptor subtype 2 blocks phencyclidine-induced hyperlocomotion and brain activation. Neuroscience 168:209-218.
Holcomb HH, Lahti AC, Medoff DR, Cullen T and Tamminga CA (2005) Effects of noncompetitive NMDA receptor blockade on anterior cingulate cerebral blood flow in volunteers with schizophrenia. Neuropsychopharmacology 30:2275-2282.
Honey GD, Honey RA, O'Loughlin C, Sharar SR, Kumaran D, Suckling J, Menon DK, Sleator C, Bullmore ET and Fletcher PC (2005) Ketamine disrupts frontal and hippocampal contribution to encoding and retrieval of episodic memory: an fMRI study. Cereb Cortex 15:749-759.
Imre G (2007) The preclinical properties of a novel group II metabotropic glutamate receptor agonist LY379268. CNS Drug Rev 13:444-464.
Krystal JH, Abi-Saab W, Perry E, D'Souza DC, Liu N, Gueorguieva R, McDougall L, Hunsberger T, Belger A, Levine L and Breier A (2005) Preliminary evidence of attenuation of the disruptive effects of the NMDA glutamate receptor antagonist, ketamine, on working memory by pretreatment with the group II metabotropic glutamate receptor agonist, LY354740, in healthy human subjects. Psychopharmacology (Berl) 179:303-309.
This article has not been copyedited and formatted. The final version may differ from this version.JPET Fast Forward. Published on December 20, 2010 as DOI: 10.1124/jpet.110.173880
at ASPE
T Journals on June 22, 2018
jpet.aspetjournals.orgD
ownloaded from

JPET #173880
16
Krystal JH, Karper LP, Seibyl JP, Freeman GK, Delaney R, Bremner JD, Heninger GR, Bowers MB, Jr. and Charney DS (1994) Subanesthetic effects of the noncompetitive NMDA antagonist, ketamine, in humans. Psychotomimetic, perceptual, cognitive, and neuroendocrine responses. Arch Gen Psychiatry 51:199-214.
Lahti AC, Koffel B, LaPorte D and Tamminga CA (1995) Subanesthetic doses of ketamine stimulate psychosis in schizophrenia. Neuropsychopharmacology 13:9-19.
Lahti KM, Ferris CF, Li F, Sotak CH and King JA (1999) Comparison of evoked cortical activity in conscious and propofol-anesthetized rats using functional MRI. Magn Reson Med 41:412-416.
Langsjo JW, Kaisti KK, Aalto S, Hinkka S, Aantaa R, Oikonen V, Sipila H, Kurki T, Silvanto M and Scheinin H (2003) Effects of subanesthetic doses of ketamine on regional cerebral blood flow, oxygen consumption, and blood volume in humans. Anesthesiology 99:614-623.
Littlewood CL, Jones N, O'Neill MJ, Mitchell SN, Tricklebank M and Williams SC (2006) Mapping the central effects of ketamine in the rat using pharmacological MRI. Psychopharmacology (Berl) 186:64-81.
Lockhart SH, Cohen Y, Yasuda N, Freire B, Taheri S, Litt L and Eger EI, 2nd (1991) Cerebral uptake and elimination of desflurane, isoflurane, and halothane from rabbit brain: an in vivo NMR study. Anesthesiology 74:575-580.
Lorrain DS, Baccei CS, Bristow LJ, Anderson JJ and Varney MA (2003) Effects of ketamine and N-methyl-D-aspartate on glutamate and dopamine release in the rat prefrontal cortex: modulation by a group II selective metabotropic glutamate receptor agonist LY379268. Neuroscience 117:697-706.
Malhotra AK, Pinals DA, Adler CM, Elman I, Clifton A, Pickar D and Breier A (1997) Ketamine-induced exacerbation of psychotic symptoms and cognitive impairment in neuroleptic-free schizophrenics. Neuropsychopharmacology 17:141-150.
Marek GJ (2004) Metabotropic glutamate 2/3 receptors as drug targets. Curr Opin Pharmacol 4:18-22. Moghaddam B, Adams B, Verma A and Daly D (1997) Activation of glutamatergic neurotransmission by ketamine: a novel step
in the pathway from NMDA receptor blockade to dopaminergic and cognitive disruptions associated with the prefrontal cortex. J Neurosci 17:2921-2927.
Nishizawa N, Nakao S, Nagata A, Hirose T, Masuzawa M and Shingu K (2000) The effect of ketamine isomers on both mice behavioral responses and c-Fos expression in the posterior cingulate and retrosplenial cortices. Brain Res 857:188-192.
Olney JW, Newcomer JW and Farber NB (1999) NMDA receptor hypofunction model of schizophrenia. J Psychiatr Res 33:523-533.
Patil ST, Zhang L, Martenyi F, Lowe SL, Jackson KA, Andreev BV, Avedisova AS, Bardenstein LM, Gurovich IY, Morozova MA, Mosolov SN, Neznanov NG, Reznik AM, Smulevich AB, Tochilov VA, Johnson BG, Monn JA and Schoepp DD (2007) Activation of mGlu2/3 receptors as a new approach to treat schizophrenia: a randomized Phase 2 clinical trial. Nat Med 13:1102-1107.
Paxinos G and Watson C (1998) The rat brain in stereotaxic coordinateds. Academic Press. Rowland LM, Bustillo JR, Mullins PG, Jung RE, Lenroot R, Landgraf E, Barrow R, Yeo R, Lauriello J and Brooks WM (2005)
Effects of ketamine on anterior cingulate glutamate metabolism in healthy humans: a 4-T proton MRS study. Am J Psychiatry 162:394-396.
Schoepp D and Marek GJ (2002) Preclinical pharmacology of mGlu2/3 receptor agonists: novel agents for schizophrenia? Curr Drug Targets CNS Neurol Disord 1:215-225.
Sharp FR, Jasper P, Hall J, Noble L and Sagar SM (1991) MK-801 and ketamine induce heat shock protein HSP72 in injured neurons in posterior cingulate and retrosplenial cortex. Ann Neurol 30:801-809.
Strum DP, Johnson BH and Eger EI, 2nd (1986) Elimination of anesthetics from rabbit brain. Science 234:1586-1588. Wong DF, Tauscher J and Grunder G (2009) The role of imaging in proof of concept for CNS drug discovery and development.
Neuropsychopharmacology 34:187-203.
This article has not been copyedited and formatted. The final version may differ from this version.JPET Fast Forward. Published on December 20, 2010 as DOI: 10.1124/jpet.110.173880
at ASPE
T Journals on June 22, 2018
jpet.aspetjournals.orgD
ownloaded from

JPET #173880
17
FOOTNOTES
All authors are employees of Abbott Laboratories, the source of funding this research.
This article has not been copyedited and formatted. The final version may differ from this version.JPET Fast Forward. Published on December 20, 2010 as DOI: 10.1124/jpet.110.173880
at ASPE
T Journals on June 22, 2018
jpet.aspetjournals.orgD
ownloaded from

JPET #173880
18
LEGENDS FOR FIGURES
Figure 1. Pharmacological MR imaging protocol employed in the current awake rat study. Rats were pretreated with
LY379268 (10 mg/kg ip) or vehicle approximately 20-min prior to collecting the baseline functional data. The imaging
experiment started at time = 0 min and total acquisition time was 42 min; baseline: 10 min, drug (ketamine or saline) infusion:
2min, and post-drug: 30min.
Figure 2. Imaging slices obtained in phMRI data acquisition (8-shot, spin-echo EPI; in-plane resolution: 250x250 μm2, slice
thickness: 1.25 mm) and brain regions used for ROI analyses. These ROIs were manually drawn based on a rat brain atlas
(Paxinos and Watson, 1998) and they are implicated in the neuropathology of schizophrenia.
Figure 3 Group comparisons (between groups, un-paired t-test) with a threshold of p< 0.05 and cluster size = 16 voxel: (A)
regions showing significant effects of ketamine vs saline on BOLD signal and (B) regions showing significant pretreatment
effects of LY379269 vs vehicle on ketamine-induced BOLD signals. (C) Representative time-course data extracted from the
brain region located in the retrosplenial cortex for each treatment group. (VEH: vehicle; Ket: ketamine; LY: LY379268; Sal:
saline).
This article has not been copyedited and formatted. The final version may differ from this version.JPET Fast Forward. Published on December 20, 2010 as DOI: 10.1124/jpet.110.173880
at ASPE
T Journals on June 22, 2018
jpet.aspetjournals.orgD
ownloaded from

JPET #173880
19
TABLES
Table 1: ROI analysis of BOLD signal changes (mean ± SEM) obtained from all treatment groups (t-test, LY/Sal vs VEH/Ket,
*p<0.05, **p<0.01; VEH/Ket vs LY/Ket, #p<0.05, ##p<0.01). (VEH: vehicle; Ket: ketamine; LY: LY379268; Sal: saline; Ctx:
Cortex)
Brain Region LY/Sal VEH/Ket LY/Ket −/LY
Medial prefrontal (mPFC) -0.34 ± 0.7 4.42 ± 0.7* 3.06 ± 0.5 -1.76 ± 0.9
Anterior Cingulate Ctx (ACC) 0.46 ± 1.0 7.63 ± 0.7** 5.34± 0.8 -2.43 ± 1.0
Nucleus Accumbens (NAcc) -1.55 ± 0.6 0.08 ± 0.7 1.13 ± 0.1 -1.15 ± 0.3
Posterior Cingulate Ctx (PCC) -0.52 ± 0.5 7.32 ± 0.4** 2.28 ± 0.5## -2.10 ± 0.5
Striatum (Str) -0.17 ± 0.2 3.06 ± 0.5* 1.85± 0.4 -1.19 ± 0.6
Auditory Ctx (Aud) -0.67 ± 0.3 3.44 ± 1.0* 2.38 ± 0.3 -2.03 ± 0.4
Amygdala (Amy) -1.68 ± 0.3 -1.73 ± 1.7 -0.48 ± 0.3 -0.82 ± 0.7
Retrosplenial Ctx (RSC) -0.08 ± 0.5 5.44 ± 0.8** 0.53 ± 0.4## -3.3 ± 0.9
Hippocampus, CA1 -0.59 ± 0.5 4.1 ± 0.6** 0.13 ± 0.3## -0.95 ± 0.3
Hippocampus, CA3 -0.58 ± 0.3 0.92 ± 0.1 -1.49 ± 0.4 -0..8 ± 0.3
Visual Ctx (Vis) -0.67 ± 0.6 4.17 ± 0.8** 2.47 ± 0.3 -1.66 ± 0.8
Entorhinal Ctx (Ent) -0.9 ± 0.3 1.38 ± 0.6* -0.96 ± 0.7# -1.43 ± 0.7
Ventral Tegmental Area (VTA) -0.83 ± 1.4 -1.64 ± 0.5 -0.82 ± 0.6 -0.35 ± 1.2
Substantia Nigra (SN) -1.34 ± 1.1 -1.51 ± 0.8 -1.47 ± 1.1 -0.9 ± 1.1
Periaqueductal Gray (PAG) -0.24 ± 1.1 -4.27 ± 1.0* -1.15 ± 0.4# -0.65 ± 0.6
Inferior Colliculus (IC) -1.57 ± 0.3 -3.39 ± 1.3 -2.29 ± 0.5 -0.28 ± 0.6
This article has not been copyedited and formatted. The final version may differ from this version.JPET Fast Forward. Published on December 20, 2010 as DOI: 10.1124/jpet.110.173880
at ASPE
T Journals on June 22, 2018
jpet.aspetjournals.orgD
ownloaded from
Time [min]
Baseline (10-min)
-20 -10-15 -5 0 5 10 15 20 25 30 35 40 45
LY379268 at 10 mg/kg or vehicle ip
Post-drug (30-min)
ketamine at 30 mg/kg or saline ip
LY379268 at 10 mg/kg ip (no pretreatment)
OR
-25
isoflurane (15-min)
Figure 1
This article has not been copyedited and formatted. The final version may differ from this version.JPET Fast Forward. Published on December 20, 2010 as DOI: 10.1124/jpet.110.173880
at ASPE
T Journals on June 22, 2018
jpet.aspetjournals.orgD
ownloaded from
12
3
45 6
7
8910
11
121314 15 16
1.medial prefrontal cortex (mPFC) 2.anterior cingulate cortex (ACC)3.nucleus accumbens (NAcc) 4.posterior cingulate cortex (PCC)5.striatum (Str) 6.audiotory cortex (Aud)7.amygdala (Amy) 8.retrosplenial cortex (RSC)9.CA1 of hippocampus 10.CA3 of hippocampus11.visual cortex (Vis) 12.entorhinal cortex (EC)13. ventral tegmental area (VTA) 14.substantia nigra (SN)15. periaqueductal pray (PAG) 16.inferior colliculus (IC)
Figure 2
This article has not been copyedited and formatted. The final version may differ from this version.JPET Fast Forward. Published on December 20, 2010 as DOI: 10.1124/jpet.110.173880
at ASPE
T Journals on June 22, 2018
jpet.aspetjournals.orgD
ownloaded from

t = -10
t = 10
A
B
C
Sig
nal I
nten
sity
[a.u
.]
Time [min]
0 20 40
VEH / Ket
LY379268 / Ket
LY379268 / Sal⎯ / LY379268
30
25
20
15
10
5
0
-5
-10
-15
Baseline
Figure 3
This article has not been copyedited and formatted. The final version may differ from this version.JPET Fast Forward. Published on December 20, 2010 as DOI: 10.1124/jpet.110.173880
at ASPE
T Journals on June 22, 2018
jpet.aspetjournals.orgD
ownloaded from