aviation - regional economics · foreword iii foreword this report provides an overview of domestic...
TRANSCRIPT
S T A T I S T I C A L R E P O R T
Domestic aviation activityOctober 2017
Aviation

BITRE – AVIATION STATISTICS DOMESTIC MONTHLY
ii
© Commonwealth of Australia 2017
ISSN: 1832 - 1968
Ownership of intellectual property rights in this publication Unless otherwise noted, copyright (and any other intellectual property rights, if any) in this publication is owned by the Commonwealth of Australia (referred to below as the Commonwealth).
Disclaimer The material contained in this publication is made available on the understanding that the Commonwealth is not providing professional advice, and that users exercise their own skill and care with respect to its use, and seek independent advice if necessary.
The Commonwealth makes no representations or warranties as to the contents or accuracy of the information contained in this publication. To the extent permitted by law, the Commonwealth disclaims liability to any person or organisation in respect of anything done, or omitted to be done, in reliance upon information contained in this publication.
Creative Commons licence With the exception of (a) the Coat of Arms; and (b) the Department of Infrastructure and Regional Development’s photos and graphics, copyright in this publication is licensed under a Creative Commons Attribution 3.0 Australia Licence.
Creative Commons Attribution 3.0 Australia Licence is a standard form licence agreement that allows you to copy, communicate and adapt this publication provided that you attribute the work to the Commonwealth and abide by the other licence terms. A summary of the licence terms is available from http://creativecommons.org/licenses/by/3.0/au/deed.en. The full licence terms are available from http://creativecommons.org/licenses/by/3.0/au/legalcode.
Use of the Coat of Arms The Department of the Prime Minister and Cabinet sets the terms under which the Coat of Arms is used. Please refer to the Department’s Commonwealth Coat of Arms and Government branding web page http://www.dpmc.gov.au/guidelines/index.cfm#brand and, in particular, the Guidelines on the use of the Commonwealth Coat of Arms publication.
An appropriate citation for this report is:
Bureau of Infrastructure, Transport and Regional Economics (BITRE), 2017, Domestic aviation activity, Statistical Report, BITRE, Canberra ACT.
Contact us This publication is available in PDF format. All other rights are reserved, including in relation to any Departmental logos or trade marks which may exist. For enquiries regarding the licence and any use of this publication, please contact:
Bureau of Infrastructure, Transport and Regional Economics (BITRE) Department of Infrastructure and Regional Development GPO Box 501, Canberra ACT 2601, Australia Telephone: (international) +61 2 6274 7210 Fax: (international) +61 2 6274 6855 Email: [email protected] Website: www.bitre.gov.au
Inquiries Should you require additional information about the statistics contained in this publication:
Nebojsa Pavlovic
Telephone (02) 6274 6817 or Facsimile (02) 6274 7727
Electronic mail: [email protected]
Web site: http://www.bitre.gov.au/statistics/aviation/domestic.aspx

Foreword
iii
FOREWORD
This report provides an overview of domestic (including charter) commercial aviation activity in Australia for the month of October 2017.
The data cover revenue passengers carried by Australian-registered operators of scheduled regular public transport services over Australian flight stages and fixed-wing charter operators. These estimates include passengers carried between domestic airports on international flights operated by these carriers. The passengers carried refer to traffic on board by stages.
Estimates of passengers and aircraft movements for charter aviation are included in this publication, where BITRE confidentiality standards are met.
Individual routes shown are restricted to those with an average exceeding 8 000 passengers per month over the previous six months where two or more airlines operate in competition. For the month of October 2017 there were 66 such routes.
Information on the total network for the month of October 2017 and on the Regular Public Transport (RPT) network for the month of October 2017 is presented on page 2, with estimates for the year ended October 2017 presented on page 3.
Detailed information on the 66 individual routes can be found in the RPT summary pages 4-13 of this publication.
The top ten airports in terms of RPT passenger movements are shown on page 14.
Data on domestic RPT cargo movements at the top five cargo airports are provided on page 15. The table includes cargo carried on passenger flights operated by the Qantas group (including Jetstar), Virgin Australia, Air North and Skippers as well as the cargo carried by dedicated freighter aircraft operated by Qantas Freight, Toll Priority and Virgin Australia Cargo.
The long-term trends for the top ten competitive RPT routes are presented graphically on pages 16-25.
Domestic RPT passenger movements at the top 50 regional airports are presented on pages 26-27.
Tables providing estimates of domestic charter aviation activity are shown on page 28. BITRE confidentiality standards restrict publication of detailed estimates for individual Australian airports, with the exception of Perth Airport.
A list of definitions can be found on page 29.
This report was prepared by the Aviation Statistics Section of the Bureau of Infrastructure, Transport and Regional Economics with data provided by airlines.

BITRE – AVIATION STATISTICS DOMESTIC MONTHLY
iv
Estimates are included where data were not available and data presented in this publication may contain revisions to previously published data.
Where figures have been rounded, discrepancies may occur between sums of component items and totals, and in percentage changes which are derived from figures prior to rounding.

Contents
v
CONTENTS
Highlights ................................................................................................................... 1
Total network .............................................................................................................. 2
RPT network ............................................................................................................... 2
Top competitive routes ..................................................................................... 4
Top ten airports – passenger movements ..................................................... 14
Top five airports – cargo movements ............................................................ 15
Top ten routes ................................................................................................. 16
1. Melbourne – Sydney ...................................................................... 16 2. Brisbane – Sydney ......................................................................... 17 3. Brisbane – Melbourne ..................................................................... 18 4. Gold Coast – Sydney ...................................................................... 19 5. Adelaide – Melbourne ..................................................................... 20 6. Gold Coast – Melbourne ................................................................. 21 7. Melbourne – Perth .......................................................................... 22 8. Adelaide – Sydney .......................................................................... 23 9. Perth – Sydney ............................................................................... 24 10. Hobart – Melbourne ........................................................................ 25
Top fifty regional airports ........................................................................................ 26
Domestic charter activity ......................................................................................... 28
Definitions ................................................................................................................ 29

BITRE – AVIATION STATISTICS DOMESTIC MONTHLY
vi
This page is intentionally left blank.

Highlights
1
HIGHLIGHTS There were 5.63 million passengers carried on Australian domestic commercial aviation (including charter operations) in October 2017, an increase of 3.6 per cent on October 2016. For the month of October 2017 there were 59 385 aircraft trips, an increase of 1.0 per cent compared to October 2016.
5.42 million passengers were carried on RPT flights in October 2017, an increase of 3.4 per cent on October 2016.
For the year ending October 2017 there were 59.69 million RPT passengers, an increase of 1.6 per cent on the year ending October 2016.
RPT revenue passenger kilometres (RPKs) performed were 6.35 billion for the month, up 2.3 per cent compared with October 2016. Capacity, measured by available seat kilometres (ASKs), decreased by 0.5 per cent compared with October 2016 to a total of 7.72 billion.
With RPT passenger traffic increasing and capacity decreasing, the industry wide load factor (RPKs/ASKs) increased from 80.0 per cent in October 2016 to 82.3 per cent in October 2017, the highest industry wide load factor recorded since October 2011 (83.0 per cent). Load factors on individual routes increased on 45 of the 64 RPT routes for which data is available for publishing in both years.
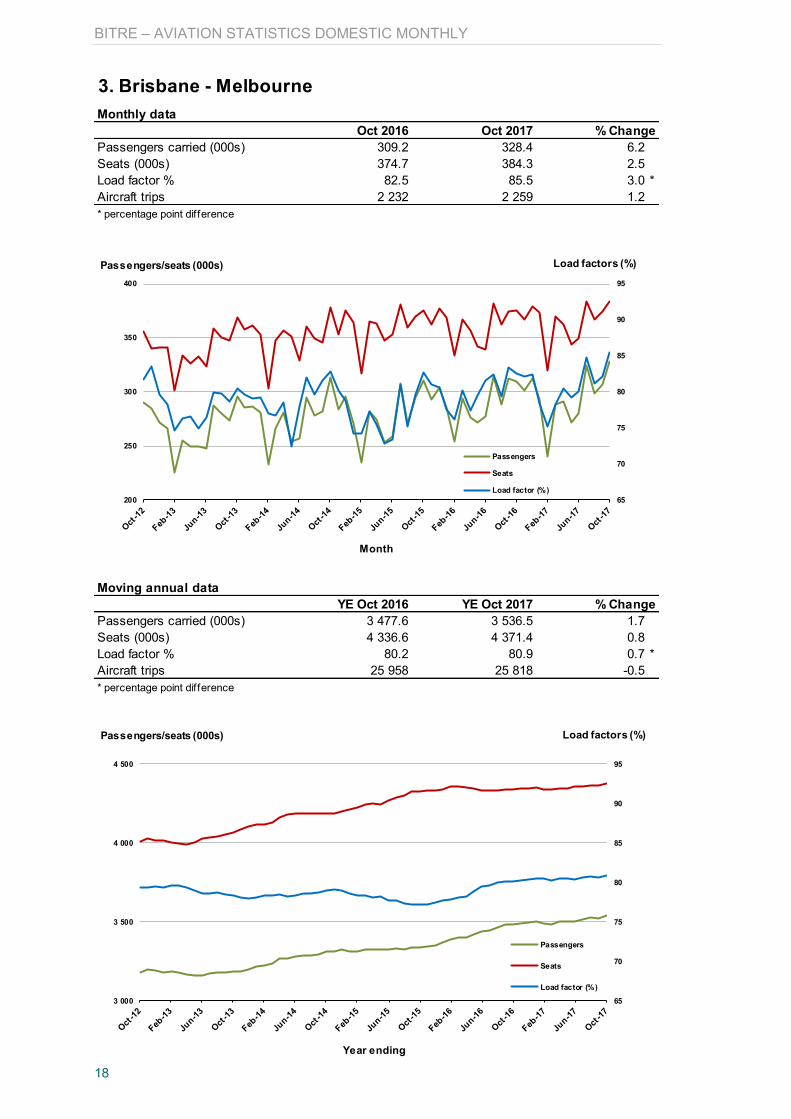
For the month of October 2017, Melbourne – Sydney remained Australia’s busiest RPT route with 810 641 passengers, an increase of 4.5 per cent compared with October 2016. It was followed by Brisbane – Sydney with 419 015 passengers (up 3.7 per cent) and Brisbane – Melbourne with 328 434 passengers (up 6.2 per cent).
The greatest percentage increase in RPT passenger numbers, compared to October 2016, was on the Brisbane – Proserpine route (up 27.5 per cent). There were large increases on a number of other routes, including Broome – Perth (up 20.5 per cent), Melbourne – Sunshine Coast (up 19.3 per cent) and Adelaide – Canberra (up 12.6 per cent).
Routes with traffic decreases in October 2017 compared with October 2016 included Hamilton Island – Sydney (down 29.4 per cent), Brisbane – Hamilton Island (down 19.6 per cent), Adelaide – Gold Coast (down 11.9 per cent) and Brisbane – Gladstone (down 11.3 per cent).
In October 2017, Sydney remained Australia’s busiest domestic airport with 2.45 million passenger movements, followed by Melbourne with 2.30 million passenger movements and Brisbane with 1.56 million passenger movements.
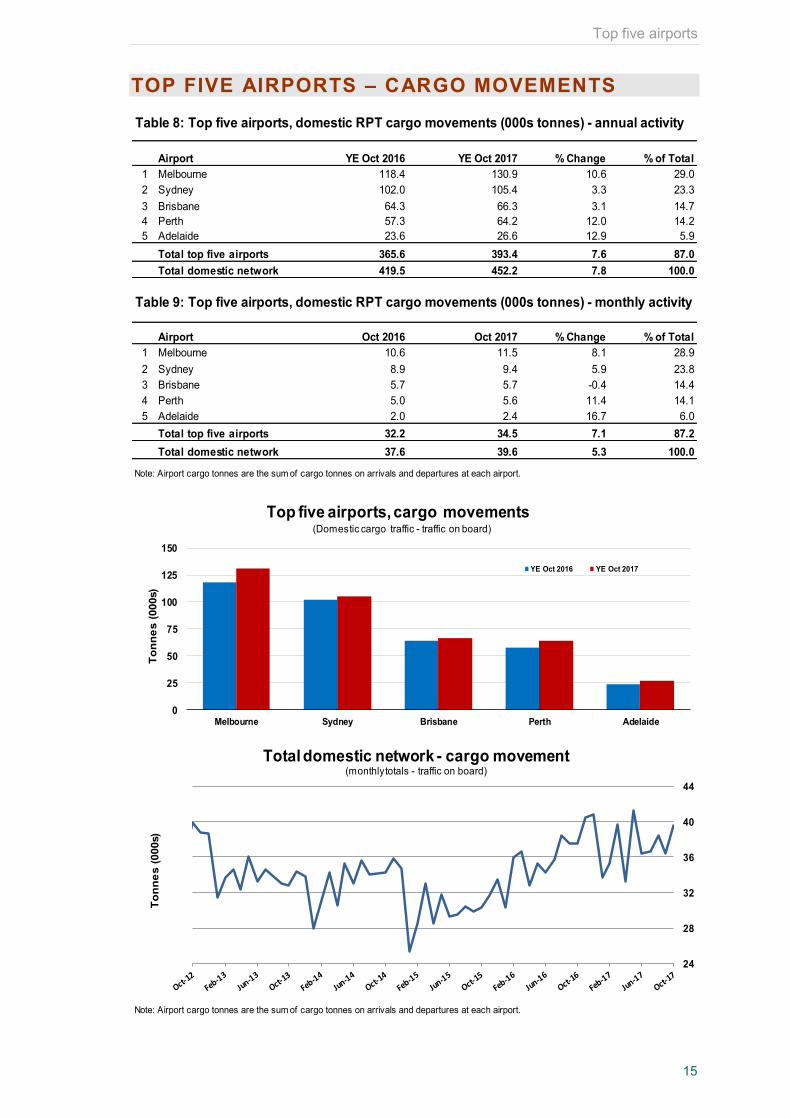
Total cargo movements at Australian airports on domestic RPT flights were 39.6 thousand tonnes in October 2017, an increase of 5.3 per cent compared with October 2016.
In October 2017 there were 2.22 million domestic passenger movements through regional airports, 3.2 per cent higher than in October 2016. Out of the top 50 regional airports, the strongest growth was at Olympic Dam airport (up 86.4 per cent on October 2016), while the largest decrease was at Hamilton Island airport (down 24.3 per cent on October 2016).
Fixed-wing charter operators carried 209.79 thousand passengers in October 2017, an increase of 9.9 per cent on October 2016. Perth airport accounted for 37.3 per cent of all charter passengers in Australia.

BITRE – AVIATION STATISTICS DOMESTIC MONTHLY
2
TOTAL NETWORK
Summary of monthly commercial aviation activityOct 2016 Oct 2017
Total passengers carried (millions) 5.43 5.63 3.6Aircraft trips (000s) 58.8 59.4 1.0Note: Regular Public Transport and charter aviation activityHelicopter, joyflights and sightseeing charter f lights not included.
% Change
RPT NETWORK Summary of monthly RPT activity
Oct 2016 Oct 2017Total passengers carried (millions) 5.24 5.42 3.4Revenue passenger kilometres (billions) 6.21 6.35 2.3Available seats (millions) 6.68 6.71 0.6Available seat kilometres (billions) 7.76 7.72 -0.5Load factor % 80.0 82.3 2.3 *Aircraft trips (000s) 55.3 55.4 0.2* percentage point difference
% Change
4.0
4.5
5.0
5.5
Oct-12
Feb-13
Jun-13
Oct-13
Feb-14
Jun-14
Oct-14
Feb-15
Jun-15
Oct-15
Feb-16
Jun-16
Oct-16
Feb-17
Jun-17
Oct-17
Tota
l pas
seng
ers
carr
ied
(mill
ions
)
Month
Domestic RPT passenger traffic(monthly)
65
70
75
80
85
90
95
4.0
5.0
6.0
7.0
8.0
Oct-12
Feb-13
Jun-13
Oct-13
Feb-14
Jun-14
Oct-14
Feb-15
Jun-15
Oct-15
Feb-16
Jun-16
Oct-16
Feb-17
Jun-17
Oct-17
Load
fac
tor (
%)
ASK
s/RP
Ks (b
illio
ns)
Month
RPT Network utilisation
Available seat kilometres (ASKs) Revenue passenger kilometres (RPKs) Load factor ( % )

Total network
3
TOTAL NETWORK
Summary of annual commercial aviation activityYE Oct 2016 YE Oct 2017
Total passengers carried (millions) 61.20 62.13 1.5Aircraft trips (000s) 687.1 685.2 -0.3Note: Regular Public Transport and charter aviation activityHelicopter, joyflights and sightseeing charter f lights not included.
% Change
RPT NETWORK
Summary of annual RPT activityYE Oct 2016 YE Oct 2017
Total passengers carried (millions) 58.78 59.69 1.6Revenue passenger kilometres (billions) 69.15 69.77 0.9Available seats (millions) 77.29 77.11 -0.2Available seat kilometres (billions) 88.97 88.30 -0.8Load factor % 77.7 79.0 1.3 *Aircraft trips (000s) 642.1 639.4 -0.4* percentage point difference
% Change
55
56
57
58
59
60
Oct-12
Feb-13
Jun-13
Oct-13
Feb-14
Jun-14
Oct-14
Feb-15
Jun-15
Oct-15
Feb-16
Jun-16
Oct-16
Feb-17
Jun-17
Oct-17
Tota
l pas
seng
ers c
arrie
d (m
illio
ns)
Year ending
Domestic RPT passenger traffic(moving annual totals)
65
70
75
80
85
90
95
60
70
80
90
Oct-12
Feb-13
Jun-13
Oct-13
Feb-14
Jun-14
Oct-14
Feb-15
Jun-15
Oct-15
Feb-16
Jun-16
Oct-16
Feb-17
Jun-17
Oct-17
Load
fac
tor (
%)
ASKs
/RPK
s (b
illio
ns)
Year ending
RPT Network utilisation
Available seat kilometres (ASKs)
Revenue passenger kilometres (RPKs)
Load factor ( % )
(moving annual totals)

BITRE – AVIATION STATISTICS DOMESTIC MONTHLY
4
TOP COMPETITIVE ROUTES Table 1: Passengers carried (000s) — annual activity
City-Pair YE Oct 2016 YE Oct 2017 % Change1 Melbourne - Sydney 8 874.6 9 034.4 1.82 Brisbane - Sydney 4 647.8 4 723.2 1.63 Brisbane - Melbourne 3 477.6 3 536.5 1.74 Gold Coast - Sydney 2 708.0 2 717.6 0.45 Adelaide - Melbourne 2 382.1 2 436.1 2.36 Melbourne - Perth 2 075.8 2 035.3 -2.07 Gold Coast - Melbourne 1 944.5 2 006.6 3.28 Adelaide - Sydney 1 867.9 1 892.3 1.39 Perth - Sydney 1 757.5 1 720.2 -2.110 Hobart - Melbourne 1 544.0 1 620.0 4.911 Brisbane - Cairns 1 347.5 1 375.2 2.112 Cairns - Sydney 1 102.0 1 127.1 2.313 Canberra - Melbourne 1 012.2 1 119.4 10.614 Brisbane - Perth 989.8 967.3 -2.315 Brisbane - Townsville 983.1 955.9 -2.816 Canberra - Sydney 951.9 954.0 0.217 Launceston - Melbourne 920.4 916.3 -0.418 Cairns - Melbourne 815.6 842.3 3.319 Adelaide - Brisbane 830.4 838.9 1.020 Brisbane - Mackay 687.3 689.7 0.321 Hobart - Sydney 608.8 650.6 6.922 Adelaide - Perth 617.3 613.9 -0.623 Brisbane - Canberra 570.2 589.6 3.424 Brisbane - Newcastle 568.4 587.6 3.425 Sunshine Coast - Sydney 530.4 572.5 7.926 Brisbane - Rockhampton 564.9 533.6 -5.527 Melbourne - Sunshine Coast 434.2 474.5 9.328 Melbourne - Newcastle 445.6 470.8 5.729 Karratha - Perth 508.2 443.7 -12.730 Brisbane - Darwin 406.3 406.9 0.231 Ballina - Sydney 378.5 399.0 5.432 Coffs Harbour - Sydney 338.3 345.1 2.033 Perth - Port Hedland 341.7 343.9 0.634 Darwin - Sydney 318.4 320.9 0.835 Darwin - Melbourne 299.3 307.2 2.636 Broome - Perth 297.9 303.0 1.737 Brisbane - Gladstone 345.6 289.5 -16.238 Launceston - Sydney 287.5 288.0 0.239 Newman - Perth 311.3 285.9 -8.240 Brisbane - Proserpine 229.9 250.0 8.841 Kalgoorlie - Perth 229.5 240.3 4.742 Albury - Sydney 224.7 224.7 0.043 Adelaide - Gold Coast 223.4 211.6 -5.344 Melbourne - Mildura 205.3 210.5 2.545 Brisbane - Hobart 203.4 210.4 3.446 Hamilton Island - Sydney 260.2 206.9 -20.547 Brisbane - Emerald 200.4 199.0 -0.748 Darwin - Perth 183.4 195.3 6.549 Port Macquarie - Sydney 193.3 192.9 -0.250 Dubbo - Sydney 186.9 191.4 2.4
continued

Top competitive routes
5
Table 1: (continued) Passengers carried (000s) — annual activity
City-Pair YE Oct 2016 YE Oct 2017 % Change51 Ayers Rock - Sydney 179.0 190.4 6.452 Sydney - Wagga Wagga 189.1 184.8 -2.353 Sydney - Tamworth 173.4 181.6 4.754 Adelaide - Canberra 171.4 180.1 5.155 Brisbane - Bundaberg 171.4 175.4 2.456 Adelaide - Port Lincoln 181.0 172.4 -4.857 Sydney - Townsville 157.5 159.5 1.358 Cairns - Townsville 139.3 141.1 1.359 Brisbane - Hamilton Island 147.6 132.1 -10.560 Armidale - Sydney 127.5 126.9 -0.461 Brisbane - Mount Isa 120.7 124.5 3.162 Adelaide - Alice Springs 120.5 123.7 2.663 Alice Springs - Darwin 116.1 117.7 1.464 Geraldton - Perth 117.8 111.9 -5.065 Melbourne - Townsville .. 28.2 NA (a)66 Proserpine - Sydney .. 22.8 NA (b)
Total domestic network 58 775.3 59 694.3 1.6(a) Melbourne - Townsville route included from September 2017, prior data not shown.(b) Proserpine - Sydney route included from September 2017, prior data not shown.

BITRE – AVIATION STATISTICS DOMESTIC MONTHLY
6
Table 2: Passengers carried (000s) — monthly activity
City-Pair Oct 2016 Oct 2017 % Change1 Melbourne - Sydney 775.7 810.6 4.52 Brisbane - Sydney 404.0 419.0 3.73 Brisbane - Melbourne 309.2 328.4 6.24 Gold Coast - Sydney 240.5 243.7 1.35 Adelaide - Melbourne 211.9 222.0 4.86 Gold Coast - Melbourne 186.8 193.1 3.37 Melbourne - Perth 182.8 180.0 -1.58 Adelaide - Sydney 165.5 170.6 3.09 Perth - Sydney 152.0 150.1 -1.210 Hobart - Melbourne 132.0 137.1 3.911 Brisbane - Cairns 118.1 124.0 5.012 Cairns - Sydney 104.5 104.2 -0.313 Canberra - Melbourne 91.1 101.5 11.514 Brisbane - Perth 87.8 88.2 0.515 Canberra - Sydney 84.2 84.6 0.516 Brisbane - Townsville 83.1 83.5 0.617 Adelaide - Brisbane 78.0 82.3 5.518 Cairns - Melbourne 77.4 81.8 5.719 Launceston - Melbourne 76.3 78.3 2.620 Brisbane - Mackay 59.2 63.9 8.021 Hobart - Sydney 55.1 61.0 10.722 Sunshine Coast - Sydney 52.1 57.5 10.423 Adelaide - Perth 56.3 56.4 0.224 Brisbane - Canberra 52.0 54.4 4.525 Brisbane - Newcastle 53.4 52.0 -2.726 Melbourne - Sunshine Coast 40.9 48.8 19.327 Brisbane - Rockhampton 49.5 47.7 -3.728 Melbourne - Newcastle 43.4 45.9 5.729 Ballina - Sydney 36.7 39.1 6.630 Karratha - Perth 40.9 37.9 -7.231 Brisbane - Darwin 35.6 35.1 -1.632 Broome - Perth 27.8 33.5 20.533 Coffs Harbour - Sydney 31.0 32.2 4.234 Perth - Port Hedland 28.3 30.2 6.935 Darwin - Sydney 28.8 28.5 -1.036 Darwin - Melbourne 26.5 26.5 0.237 Brisbane - Proserpine 20.5 26.1 27.538 Newman - Perth 24.6 25.7 4.539 Brisbane - Gladstone 26.8 23.8 -11.340 Kalgoorlie - Perth 19.6 21.3 8.741 Launceston - Sydney 21.2 21.3 0.342 Albury - Sydney 19.7 19.7 0.143 Melbourne - Mildura 18.4 19.7 6.844 Adelaide - Gold Coast 22.0 19.4 -11.945 Brisbane - Hobart 18.3 18.9 3.246 Hamilton Island - Sydney 26.1 18.4 -29.447 Darwin - Perth 16.6 18.3 10.148 Brisbane - Emerald 17.5 18.0 2.649 Ayers Rock - Sydney 17.5 17.5 0.050 Adelaide - Canberra 15.4 17.4 12.6
continued

Top competitive routes
7
Table 2: (continued) Passengers carried (000s) — monthly activity
City-Pair Oct 2016 Oct 2017 % Change51 Dubbo - Sydney 16.6 17.3 4.052 Sydney - Wagga Wagga 16.8 16.7 -0.453 Port Macquarie - Sydney 17.0 16.7 -2.154 Sydney - Townsville 15.4 15.6 1.355 Sydney - Tamworth 16.3 15.5 -5.256 Brisbane - Bundaberg 15.4 14.9 -3.557 Melbourne - Townsville .. 14.3 NA (a)58 Adelaide - Port Lincoln 15.5 14.2 -8.159 Cairns - Townsville 11.9 13.0 9.060 Adelaide - Alice Springs 11.6 12.1 4.461 Proserpine - Sydney .. 11.8 NA (b)62 Armidale - Sydney 11.5 11.7 2.463 Brisbane - Hamilton Island 13.8 11.1 -19.664 Brisbane - Mount Isa 10.6 11.0 4.565 Alice Springs - Darwin 11.0 10.9 -1.166 Geraldton - Perth 10.1 9.5 -5.9
Total domestic network 5 242.5 5 420.3 3.4(a) Melbourne - Townsville route included from September 2017, prior data not shown.(b) Proserpine - Sydney route included from September 2017, prior data not shown.

BITRE – AVIATION STATISTICS DOMESTIC MONTHLY
8
Table 3: Available seats (000s) — monthly activity
City-Pair Oct 2016 Oct 2017 % Change1 Melbourne - Sydney 913.4 936.0 2.52 Brisbane - Sydney 486.1 496.7 2.23 Brisbane - Melbourne 374.7 384.3 2.54 Gold Coast - Sydney 275.6 277.8 0.85 Adelaide - Melbourne 256.5 263.5 2.76 Gold Coast - Melbourne 215.9 216.1 0.17 Melbourne - Perth 227.3 207.2 -8.98 Adelaide - Sydney 196.9 198.1 0.69 Perth - Sydney 183.4 182.0 -0.710 Hobart - Melbourne 164.2 157.7 -3.911 Brisbane - Cairns 140.5 142.8 1.612 Cairns - Sydney 123.7 120.0 -3.013 Canberra - Melbourne 130.1 151.0 16.014 Brisbane - Perth 106.0 104.7 -1.315 Canberra - Sydney 116.0 110.0 -5.216 Brisbane - Townsville 113.0 106.1 -6.117 Adelaide - Brisbane 98.3 99.7 1.418 Cairns - Melbourne 89.3 90.4 1.219 Launceston - Melbourne 90.1 92.3 2.420 Brisbane - Mackay 77.4 77.8 0.521 Hobart - Sydney 67.0 71.0 6.122 Sunshine Coast - Sydney 61.7 68.6 11.223 Adelaide - Perth 78.3 74.1 -5.424 Brisbane - Canberra 66.8 73.4 9.825 Brisbane - Newcastle 66.5 67.5 1.526 Melbourne - Sunshine Coast 46.4 54.3 17.127 Brisbane - Rockhampton 65.4 54.4 -16.928 Melbourne - Newcastle 51.8 53.9 3.929 Ballina - Sydney 43.1 46.7 8.330 Karratha - Perth 68.1 57.7 -15.231 Brisbane - Darwin 43.7 42.9 -1.832 Broome - Perth 37.0 42.3 14.233 Coffs Harbour - Sydney 37.0 42.8 15.634 Perth - Port Hedland 49.8 45.1 -9.435 Darwin - Sydney 39.5 37.9 -4.136 Darwin - Melbourne 32.7 32.7 0.137 Brisbane - Proserpine 22.6 29.9 32.138 Newman - Perth 49.6 45.4 -8.539 Brisbane - Gladstone 45.1 31.4 -30.540 Kalgoorlie - Perth 33.3 36.5 9.741 Launceston - Sydney 24.4 24.5 0.342 Albury - Sydney 29.8 26.5 -10.943 Melbourne - Mildura 26.6 28.8 8.344 Adelaide - Gold Coast 26.4 21.9 -17.245 Brisbane - Hobart 20.9 21.2 1.446 Hamilton Island - Sydney 30.8 26.8 -13.047 Darwin - Perth 22.8 22.1 -3.048 Brisbane - Emerald 30.5 24.5 -19.649 Ayers Rock - Sydney 20.9 21.5 2.750 Adelaide - Canberra 22.6 26.4 16.8
continued

Top competitive routes
9
Table 3: (continued) Available seats (000s) — monthly activity
City-Pair Oct 2016 Oct 2017 % Change51 Dubbo - Sydney 24.3 22.7 -6.652 Sydney - Wagga Wagga 25.0 25.0 -0.253 Port Macquarie - Sydney 22.2 21.1 -5.154 Sydney - Townsville 21.6 20.4 -5.355 Sydney - Tamworth 24.6 23.6 -4.156 Brisbane - Bundaberg 19.2 19.4 0.957 Melbourne - Townsville .. 17.2 NA (a)58 Adelaide - Port Lincoln 24.9 24.9 0.159 Cairns - Townsville 24.1 23.1 -4.360 Adelaide - Alice Springs 15.2 15.8 3.561 Proserpine - Sydney .. 14.4 NA (b)62 Armidale - Sydney 16.9 16.3 -3.663 Brisbane - Hamilton Island 15.8 15.7 -0.964 Brisbane - Mount Isa 18.4 15.4 -16.265 Alice Springs - Darwin 19.5 19.2 -1.566 Geraldton - Perth 20.8 19.0 -8.7
Total domestic network 6 677.0 6 714.8 0.6(a) Melbourne - Townsville route included from September 2017, prior data not shown.(b) Proserpine - Sydney route included from September 2017, prior data not shown.

BITRE – AVIATION STATISTICS DOMESTIC MONTHLY
10
Table 4: Load factors (%) — monthly activity
City-Pair Oct 2016 Oct 2017 % Point diff1 Melbourne - Sydney 84.9 86.6 1.72 Brisbane - Sydney 83.1 84.4 1.33 Brisbane - Melbourne 82.5 85.5 3.04 Gold Coast - Sydney 87.2 87.7 0.55 Adelaide - Melbourne 82.6 84.3 1.76 Gold Coast - Melbourne 86.6 89.3 2.77 Melbourne - Perth 80.4 86.9 6.58 Adelaide - Sydney 84.1 86.1 2.09 Perth - Sydney 82.9 82.5 -0.410 Hobart - Melbourne 80.4 86.9 6.511 Brisbane - Cairns 84.1 86.8 2.712 Cairns - Sydney 84.5 86.8 2.313 Canberra - Melbourne 70.0 67.2 -2.814 Brisbane - Perth 82.8 84.3 1.515 Canberra - Sydney 72.6 77.0 4.416 Brisbane - Townsville 73.5 78.7 5.217 Adelaide - Brisbane 79.4 82.6 3.218 Cairns - Melbourne 86.7 90.5 3.819 Launceston - Melbourne 84.7 84.9 0.220 Brisbane - Mackay 76.4 82.1 5.721 Hobart - Sydney 82.3 85.9 3.622 Sunshine Coast - Sydney 84.4 83.7 -0.723 Adelaide - Perth 71.9 76.1 4.224 Brisbane - Canberra 77.8 74.1 -3.725 Brisbane - Newcastle 80.3 77.0 -3.326 Melbourne - Sunshine Coast 88.1 89.8 1.727 Brisbane - Rockhampton 75.6 87.7 12.128 Melbourne - Newcastle 83.7 85.1 1.429 Ballina - Sydney 85.2 83.8 -1.430 Karratha - Perth 60.0 65.7 5.731 Brisbane - Darwin 81.6 81.8 0.232 Broome - Perth 75.1 79.2 4.133 Coffs Harbour - Sydney 83.7 75.4 -8.334 Perth - Port Hedland 56.8 67.0 10.235 Darwin - Sydney 72.9 75.3 2.436 Darwin - Melbourne 81.0 81.1 0.137 Brisbane - Proserpine 90.3 87.1 -3.238 Newman - Perth 49.5 56.6 7.139 Brisbane - Gladstone 59.5 75.8 16.340 Kalgoorlie - Perth 58.8 58.2 -0.641 Launceston - Sydney 86.7 86.7 0.042 Albury - Sydney 66.3 74.5 8.243 Melbourne - Mildura 69.2 68.2 -1.044 Adelaide - Gold Coast 83.2 88.5 5.345 Brisbane - Hobart 87.9 89.4 1.546 Hamilton Island - Sydney 84.6 68.6 -16.047 Darwin - Perth 72.8 82.7 9.948 Brisbane - Emerald 57.5 73.4 15.949 Ayers Rock - Sydney 84.0 81.8 -2.250 Adelaide - Canberra 68.2 65.8 -2.4
continued

Top competitive routes
11
Table 4: (continued) Load factors (%) — monthly activity
City-Pair Oct 2016 Oct 2017 % Point diff51 Dubbo - Sydney 68.3 76.0 7.752 Sydney - Wagga Wagga 67.1 66.9 -0.253 Port Macquarie - Sydney 76.8 79.3 2.554 Sydney - Townsville 71.4 76.4 5.055 Sydney - Tamworth 66.1 65.4 -0.756 Brisbane - Bundaberg 80.4 76.9 -3.557 Melbourne - Townsville .. 83.0 NA (a)58 Adelaide - Port Lincoln 62.3 57.1 -5.259 Cairns - Townsville 49.5 56.4 6.960 Adelaide - Alice Springs 76.0 76.7 0.761 Proserpine - Sydney .. 82.1 NA (b)62 Armidale - Sydney 67.8 72.0 4.263 Brisbane - Hamilton Island 87.2 70.7 -16.564 Brisbane - Mount Isa 57.5 71.6 14.165 Alice Springs - Darwin 56.7 56.9 0.266 Geraldton - Perth 48.5 50.0 1.5
Total domestic network 80.0 82.3 2.3(a) Melbourne - Townsville route included from September 2017, prior data not shown.(b) Proserpine - Sydney route included from September 2017, prior data not shown.

BITRE – AVIATION STATISTICS DOMESTIC MONTHLY
12
Table 5: Aircraft trips (a) — monthly activity
City-Pair Oct 2016 Oct 2017 % Change1 Melbourne - Sydney 5 081 5 156 1.52 Brisbane - Sydney 2 986 3 042 1.93 Brisbane - Melbourne 2 232 2 259 1.24 Gold Coast - Sydney 1 611 1 565 -2.95 Adelaide - Melbourne 1 669 1 651 -1.16 Gold Coast - Melbourne 1 144 1 140 -0.37 Melbourne - Perth 1 028 957 -6.98 Adelaide - Sydney 1 190 1 179 -0.99 Perth - Sydney 787 774 -1.710 Hobart - Melbourne 1 028 976 -5.111 Brisbane - Cairns 890 893 0.312 Cairns - Sydney 703 654 -7.013 Canberra - Melbourne 918 1 009 9.914 Brisbane - Perth 490 527 7.615 Canberra - Sydney 1 441 1 406 -2.416 Brisbane - Townsville 778 740 -4.917 Adelaide - Brisbane 588 595 1.218 Cairns - Melbourne 471 475 0.819 Launceston - Melbourne 712 734 3.120 Brisbane - Mackay 663 629 -5.121 Hobart - Sydney 423 439 3.822 Sunshine Coast - Sydney 374 409 9.423 Adelaide - Perth 492 497 1.024 Brisbane - Canberra 510 527 3.325 Brisbane - Newcastle 546 510 -6.626 Melbourne - Sunshine Coast 261 306 17.227 Brisbane - Rockhampton 778 687 -11.728 Melbourne - Newcastle 294 302 2.729 Ballina - Sydney 284 304 7.030 Karratha - Perth 573 507 -11.531 Brisbane - Darwin 265 260 -1.932 Broome - Perth 305 371 21.633 Coffs Harbour - Sydney 438 437 -0.234 Perth - Port Hedland 392 368 -6.135 Darwin - Sydney 234 224 -4.336 Darwin - Melbourne 187 186 -0.537 Brisbane - Proserpine 128 168 31.338 Newman - Perth 363 334 -8.039 Brisbane - Gladstone 586 412 -29.740 Kalgoorlie - Perth 288 303 5.241 Launceston - Sydney 142 142 0.042 Albury - Sydney 547 495 -9.543 Melbourne - Mildura 418 417 -0.244 Adelaide - Gold Coast 149 124 -16.845 Brisbane - Hobart 120 120 0.046 Hamilton Island - Sydney 186 162 -12.947 Darwin - Perth 140 132 -5.748 Brisbane - Emerald 404 326 -19.349 Ayers Rock - Sydney 121 122 0.850 Adelaide - Canberra 150 156 4.0
continued

Top competitive routes
13
Table 5: (continued) Aircraft trips — monthly activity
City-Pair Oct 2016 Oct 2017 % Change51 Dubbo - Sydney 537 527 -1.952 Sydney - Wagga Wagga 484 489 1.053 Port Macquarie - Sydney 387 369 -4.754 Sydney - Townsville 133 116 -12.855 Sydney - Tamworth 393 378 -3.856 Brisbane - Bundaberg 328 296 -9.857 Melbourne - Townsville .. 96 NA (b)58 Adelaide - Port Lincoln 641 644 0.559 Cairns - Townsville 410 368 -10.260 Adelaide - Alice Springs 96 113 17.761 Proserpine - Sydney .. 80 NA (c)62 Armidale - Sydney 392 388 -1.063 Brisbane - Hamilton Island 126 125 -0.864 Brisbane - Mount Isa 153 151 -1.365 Alice Springs - Darwin 158 167 5.766 Geraldton - Perth 208 190 -8.7
Total domestic network 55 294 55 402 0.2(a) Includes RPT Cargo flights.(b) Melbourne - Townsville route included from September 2017, prior data not shown.(c) Proserpine - Sydney route included from September 2017, prior data not shown.

BITRE – AVIATION STATISTICS DOMESTIC MONTHLY
14
TOP TEN AIRPORTS – PASSENGER MOVEMENTS
Table 6: Top ten airports, RPT passenger movements (000s) - annual activity
Airport YE Oct 2016 YE Oct 2017 % Change % of Total1 Sydney 26 841.5 27 199.7 1.3 22.82 Melbourne 24 652.9 25 217.8 2.3 21.13 Brisbane 17 071.6 17 231.2 0.9 14.44 Perth 8 163.9 7 998.9 -2.0 6.75 Adelaide 6 970.7 7 097.0 1.8 5.96 Gold Coast 5 307.0 5 376.8 1.3 4.57 Cairns 4 218.2 4 307.4 2.1 3.68 Canberra 2 856.5 3 004.5 5.2 2.59 Hobart 2 356.8 2 481.6 5.3 2.1
10 Darwin 1 794.0 1 805.8 0.7 1.5Total top ten airports 100 233.1 101 720.8 1.5 85.2Total domestic network 117 550.5 119 388.6 1.6 100.0
Table 7: Top ten airports, RPT passenger movements (000s) - monthly activity
Airport Oct 2016 Oct 2017 % Change % of Total1 Sydney 2 380.1 2 446.8 2.8 22.62 Melbourne 2 198.0 2 301.1 4.7 21.23 Brisbane 1 503.6 1 559.4 3.7 14.44 Perth 712.4 715.8 0.5 6.65 Adelaide 636.3 653.6 2.7 6.06 Gold Coast 489.6 496.3 1.4 4.67 Cairns 391.6 401.6 2.5 3.78 Canberra 256.7 272.0 6.0 2.59 Hobart 205.4 217.1 5.7 2.0
10 Darwin 163.9 158.9 -3.1 1.5Total top ten airports 8 937.5 9 222.6 3.2 85.1Total domestic network 10 485.0 10 840.6 3.4 100.0
Note: Airport passenger movement numbers are the sum of passenger arrivals and departures at each airport.
0
5
10
15
20
25
30
(mill
ions
) YE Oct 2016 YE Oct 2017
Top ten airports, RPT passenger movements(traff ic on board)
Top five airports
15
TOP FIVE AIRPORTS – CARGO MOVEMENTS Table 8: Top five airports, domestic RPT cargo movements (000s tonnes) - annual activity
Airport YE Oct 2016 YE Oct 2017 % Change % of Total1 Melbourne 118.4 130.9 10.6 29.02 Sydney 102.0 105.4 3.3 23.33 Brisbane 64.3 66.3 3.1 14.74 Perth 57.3 64.2 12.0 14.25 Adelaide 23.6 26.6 12.9 5.9
Total top five airports 365.6 393.4 7.6 87.0Total domestic network 419.5 452.2 7.8 100.0
Table 9: Top five airports, domestic RPT cargo movements (000s tonnes) - monthly activity
Airport Oct 2016 Oct 2017 % Change % of Total1 Melbourne 10.6 11.5 8.1 28.92 Sydney 8.9 9.4 5.9 23.83 Brisbane 5.7 5.7 -0.4 14.44 Perth 5.0 5.6 11.4 14.15 Adelaide 2.0 2.4 16.7 6.0
Total top five airports 32.2 34.5 7.1 87.2Total domestic network 37.6 39.6 5.3 100.0
Note: Airport cargo tonnes are the sum of cargo tonnes on arrivals and departures at each airport.
Note: Airport cargo tonnes are the sum of cargo tonnes on arrivals and departures at each airport.
0
25
50
75
100
125
150
Melbourne Sydney Brisbane Perth Adelaide
Tonn
es (
000s
)
Top five airports, cargo movements
YE Oct 2016 YE Oct 2017
(Domestic cargo traffic - traffic on board)
24
28
32
36
40
44
Tonn
es (
000s
)
Total domestic network - cargo movement(monthly totals - traffic on board)

BITRE – AVIATION STATISTICS DOMESTIC MONTHLY
16
TOP TEN ROUTES
1. Melbourne - SydneyMonthly data
Oct 2016 Oct 2017Passengers carried (000s) 775.7 810.6 4.5Seats (000s) 913.4 936.0 2.5Load factor % 84.9 86.6 1.7 *Aircraft trips 5 081 5 156 1.5* percentage point difference
graph needed here
Moving annual dataYE Oct 2016 YE Oct 2017
Passengers carried (000s) 8 874.6 9 034.4 1.8Seats (000s) 10 644.3 10 723.0 0.7Load factor % 83.4 84.3 0.9 *Aircraft trips 59 413 59 699 0.5* percentage point difference
% Change
% Change
65
70
75
80
85
90
95
600
700
800
900
1 000
Load factors (%)
Month
Passengers/seats (000s)
Passengers Seats Load factor (%)
65
70
75
80
85
90
95
7 000
8 000
9 000
10 000
11 000
Load factors (%)
Year ending
Passengers/seats (000s)
Passengers
Seats
Load factor (%)

Top ten routes
17
2. Brisbane - SydneyMonthly data
Oct 2016 Oct 2017Passengers carried (000s) 404.0 419.0 3.7Seats (000s) 486.1 496.7 2.2Load factor % 83.1 84.4 1.3 *Aircraft trips 2 986 3 042 1.9* percentage point difference
graph needed here
Moving annual dataYE Oct 2016 YE Oct 2017
Passengers carried (000s) 4 647.8 4 723.2 1.6Seats (000s) 5 710.1 5 751.2 0.7Load factor % 81.4 82.1 0.7 *Aircraft trips 35 462 35 459 0.0* percentage point difference
% Change
% Change
65
70
75
80
85
90
95
300
350
400
450
500
550
Load factors (%)
Month
Passengers/seats (000s)
Passengers Seats Load factor (%)
65
70
75
80
85
90
95
4 000
4 500
5 000
5 500
6 000
Load factors (%)
Year ending
Passengers/seats (000s)
Passengers
Seats
Load factor (%)
BITRE – AVIATION STATISTICS DOMESTIC MONTHLY
18
3. Brisbane - MelbourneMonthly data
Oct 2016 Oct 2017Passengers carried (000s) 309.2 328.4 6.2Seats (000s) 374.7 384.3 2.5Load factor % 82.5 85.5 3.0 *Aircraft trips 2 232 2 259 1.2* percentage point difference
graph needed here
Moving annual dataYE Oct 2016 YE Oct 2017
Passengers carried (000s) 3 477.6 3 536.5 1.7Seats (000s) 4 336.6 4 371.4 0.8Load factor % 80.2 80.9 0.7 *Aircraft trips 25 958 25 818 -0.5* percentage point difference
BNEBNEBNEBNEBNEBNEBNEBNEBNEBNEBNEBNE
% Change
% Change
65
70
75
80
85
90
95
200
250
300
350
400
Load factors (%)
Month
Passengers/seats (000s)
Passengers
Seats
Load factor (%)
65
70
75
80
85
90
95
3 000
3 500
4 000
4 500
Load factors (%)
Year ending
Passengers/seats (000s)
Passengers
Seats
Load factor (%)

Top ten routes
19
4. Gold Coast - SydneyMonthly data
Oct 2016 Oct 2017Passengers carried (000s) 240.5 243.7 1.3Seats (000s) 275.6 277.8 0.8Load factor % 87.2 87.7 0.5 *Aircraft trips 1 611 1 565 -2.9* percentage point difference
graph needed here
Moving annual dataYE Oct 2016 YE Oct 2017
Passengers carried (000s) 2 708.0 2 717.6 0.4Seats (000s) 3 147.9 3 159.6 0.4Load factor % 86.0 86.0 0.0 *Aircraft trips 18 432 18 047 -2.1* percentage point difference
OOLOOLOOLOOLOOLOOLOOLOOLOOLOOLOOLOOL
% Change
% Change
65
70
75
80
85
90
95
150
180
210
240
270
300
330
Load factors (%)
Month
Passengers/seats (000s)
Passengers
Seats
Load factor (%)
65
70
75
80
85
90
95
2 100
2 400
2 700
3 000
3 300
Load factors (%)
Year ending
Passengers/seats (000s)
Passengers
Seats
Load factor (%)

BITRE – AVIATION STATISTICS DOMESTIC MONTHLY
20
5. Adelaide - MelbourneMonthly data
Oct 2016 Oct 2017Passengers carried (000s) 211.9 222.0 4.8Seats (000s) 256.5 263.5 2.7Load factor % 82.6 84.3 1.7 *Aircraft trips 1 669 1 651 -1.1* percentage point difference
graph needed here
Moving annual dataYE Oct 2016 YE Oct 2017
Passengers carried (000s) 2 382.1 2 436.1 2.3Seats (000s) 3 017.2 3 029.4 0.4Load factor % 79.0 80.4 1.5 *Aircraft trips 19 312 19 061 -1.3* percentage point difference
ADLADLADLADLADLADLADLADLADLADLADLADL
% Change
% Change
65
70
75
80
85
90
95
150
180
210
240
270
Load factors (%)
Month
Passengers/seats (000s)
Passengers
Seats
Load factor (%)
65
70
75
80
85
90
95
2 000
2 300
2 600
2 900
3 200
Load factors (%)
Year ending
Passengers/seats (000s)
Passengers
Seats
Load factor (%)

Top ten routes
21
6. Gold Coast - MelbourneMonthly data
Oct 2016 Oct 2017Passengers carried (000s) 186.8 193.1 3.3Seats (000s) 215.9 216.1 0.1Load factor % 86.6 89.3 2.7 *Aircraft trips 1 144 1 140 -0.3* percentage point difference
graph needed here
Moving annual dataYE Oct 2016 YE Oct 2017
Passengers carried (000s) 1 944.5 2 006.6 3.2Seats (000s) 2 357.1 2 331.6 -1.1Load factor % 82.5 86.1 3.6 *Aircraft trips 12 632 12 433 -1.6* percentage point difference
MELMELMELMELMELMELMELMELMELMELMELMEL
% Change
% Change
65
70
75
80
85
90
95
100
120
140
160
180
200
220
240
Load factors (%)
Month
Passengers/seats (000s)
Passengers
Seats
Load factor (%)
65
70
75
80
85
90
95
1 600
1 800
2 000
2 200
2 400
Load factors (%)
Year ending
Passengers/seats (000s)
Passengers
Seats
Load factor (%)

BITRE – AVIATION STATISTICS DOMESTIC MONTHLY
22
7. Melbourne - PerthMonthly data
Oct 2016 Oct 2017Passengers carried (000s) 182.8 180.0 -1.5Seats (000s) 227.3 207.2 -8.9Load factor % 80.4 86.9 6.5 *Aircraft trips 1 028 957 -6.9* percentage point difference
graph needed here
Moving annual dataYE Oct 2016 YE Oct 2017
Passengers carried (000s) 2 075.8 2 035.3 -2.0Seats (000s) 2 559.6 2 453.8 -4.1Load factor % 81.1 82.9 1.8 *Aircraft trips 11 597 11 164 -3.7* percentage point difference
MELMELMELMELMELMELMELMELMELMELMELMEL
% Change
% Change
65
70
75
80
85
90
95
140
160
180
200
220
240
260
280
Load factors (%)
Month
Passengers/seats (000s)
Passengers Seats Load factor (%)
65
70
75
80
85
90
95
2 000
2 200
2 400
2 600
2 800
3 000
Load factors (%)
Year ending
Passengers/seats (000s)
Passengers Seats Load factor (%)
Top ten routes
23
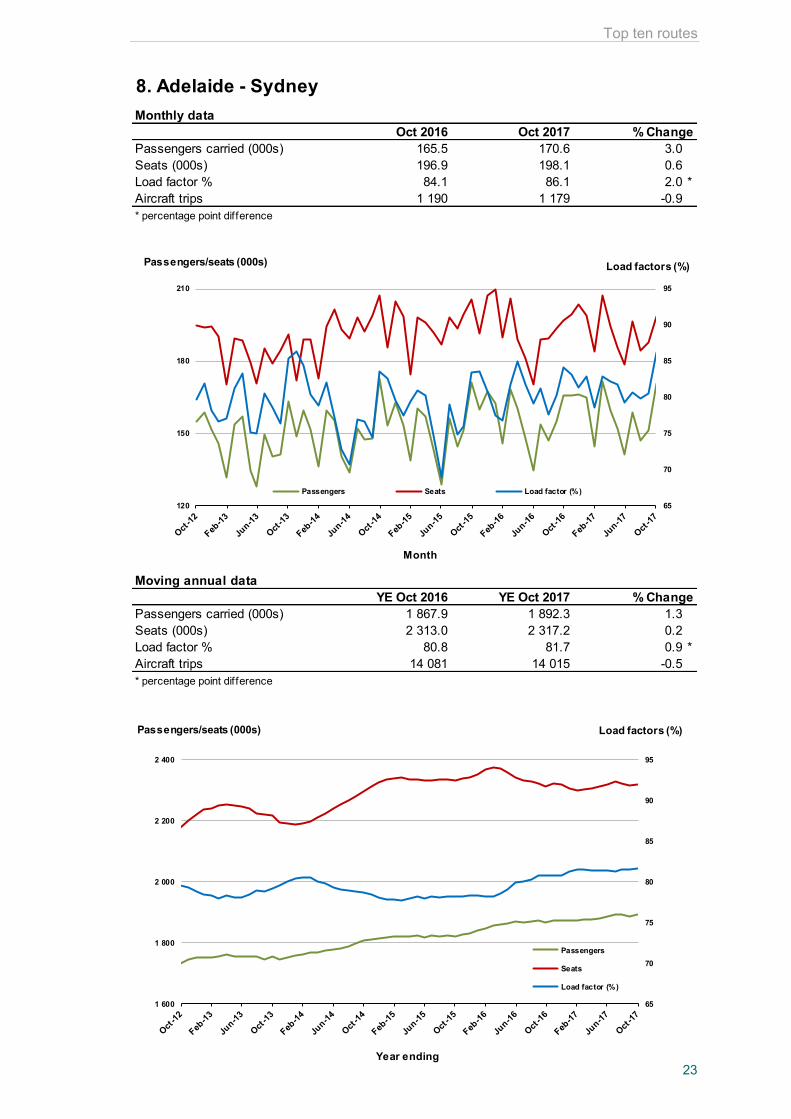
8. Adelaide - SydneyMonthly data
Oct 2016 Oct 2017Passengers carried (000s) 165.5 170.6 3.0Seats (000s) 196.9 198.1 0.6Load factor % 84.1 86.1 2.0 *Aircraft trips 1 190 1 179 -0.9* percentage point difference
graph needed here
Moving annual dataYE Oct 2016 YE Oct 2017
Passengers carried (000s) 1 867.9 1 892.3 1.3Seats (000s) 2 313.0 2 317.2 0.2Load factor % 80.8 81.7 0.9 *Aircraft trips 14 081 14 015 -0.5* percentage point difference
ADLADLADLADLADLADLADLADLADLADLADLADLADL
% Change
% Change
65
70
75
80
85
90
95
1 600
1 800
2 000
2 200
2 400
Load factors (%)
Year ending
Passengers/seats (000s)
Passengers
Seats
Load factor (%)
65
70
75
80
85
90
95
120
150
180
210
Load factors (%)
Month
Passengers/seats (000s)
Passengers Seats Load factor (%)

BITRE – AVIATION STATISTICS DOMESTIC MONTHLY
24
9. Perth - SydneyMonthly data
Oct 2016 Oct 2017Passengers carried (000s) 152.0 150.1 -1.2Seats (000s) 183.4 182.0 -0.7Load factor % 82.9 82.5 -0.4 *Aircraft trips 787 774 -1.7* percentage point difference
graph needed here
Moving annual dataYE Oct 2016 YE Oct 2017
Passengers carried (000s) 1 757.5 1 720.2 -2.1Seats (000s) 2 163.2 2 108.7 -2.5Load factor % 81.2 81.6 0.3 *Aircraft trips 9 163 9 057 -1.2* percentage point difference
PERPERPERPERPERPERPERPERPERPERPERPERPER
% Change
% Change
65
70
75
80
85
90
95
120
140
160
180
200
220
Load factors (%)
Month
Passengers/seats (000s)
Passengers Seats Load factor (%)
65
70
75
80
85
90
95
1 600
1 800
2 000
2 200
2 400
Load factors (%)
Year ending
Passengers/seats (000s)
Passengers Seats Load factor (%)

Top ten routes
25
10. Hobart - MelbourneMonthly data
Oct 2016 Oct 2017Passengers carried (000s) 132.0 137.1 3.9Seats (000s) 164.2 157.7 -3.9Load factor % 80.4 86.9 6.5 *Aircraft trips 1 028 976 -5.1* percentage point difference
graph needed here
Moving annual dataYE Oct 2016 YE Oct 2017
Passengers carried (000s) 1 544.0 1 620.0 4.9Seats (000s) 1 944.4 1 982.8 2.0Load factor % 79.4 81.7 2.3 *Aircraft trips 12 217 12 183 -0.3* percentage point difference
HBAHBAHBAHBAHBAHBAHBAHBAHBAHBAHBAHBAHBA
% Change
% Change
65
70
75
80
85
90
95
80
100
120
140
160
180
200
220
Load factors (%)
Month
Passengers/seats (000s)
Passengers Seats Load factor (%)
65
70
75
80
85
90
95
1 100
1 300
1 500
1 700
1 900
2 100
Load factors (%)
Year ending
Passengers/seats (000s)
Passengers
Seats
Load factor (%)

BITRE – AVIATION STATISTICS DOMESTIC MONTHLY
26
TOP FIFTY REGIONAL AIRPORTS
Table 10: Top fifty regional airports (000s) — passenger movements, monthly
Airport Oct 2016 Oct 2017 % Change1 Cairns 391.6 401.6 2.52 Hobart 205.4 217.1 5.73 Darwin 163.9 158.9 -3.14 Townsville 133.3 144.2 8.25 Newcastle 116.3 118.4 1.76 Launceston 108.2 110.8 2.47 Mackay 68.2 71.9 5.48 Alice Springs 58.0 57.3 -1.19 Rockhampton 50.9 50.2 -1.410 Ballina 47.4 49.6 4.611 Proserpine 31.7 43.6 37.712 Hamilton Island 53.0 40.2 -24.313 Broome 33.8 39.3 16.114 Karratha 41.2 38.1 -7.315 Coffs Harbour 35.9 37.9 5.416 Ayers Rock 33.6 34.7 3.317 Port Hedland 29.7 31.4 5.618 Newman 24.9 25.8 3.719 Gladstone 26.8 23.8 -11.320 Mildura 22.1 23.5 6.321 Albury 22.1 23.1 4.622 Kalgoorlie 20.4 22.2 9.023 Dubbo 18.3 21.3 16.024 Wagga Wagga 19.5 20.6 5.825 Port Macquarie 19.6 20.1 2.426 Mount Isa 16.3 18.0 10.927 Emerald 17.6 18.0 1.928 Tamworth 16.5 17.1 3.929 Hervey Bay 15.1 15.9 5.630 Bundaberg 15.4 14.9 -3.531 Paraburdoo 14.5 14.6 1.232 Wellcamp 11.9 14.4 20.833 Port Lincoln 15.5 14.3 -8.034 Devonport 13.5 14.2 5.535 Armidale 11.5 12.5 8.536 Geraldton 10.1 9.5 -5.937 Kununurra 8.3 9.1 9.238 Moranbah 9.9 8.9 -10.039 Thursday Island 9.4 8.9 -4.840 Gove 8.0 7.9 -1.841 Olympic Dam 4.2 7.8 86.442 Roma 7.6 7.5 -1.343 Weipa 6.9 7.3 5.344 Learmonth 6.8 7.1 3.745 Mount Gambier 6.6 6.9 4.146 Orange 4.8 6.5 35.747 Griffith 6.5 6.4 -1.548 Whyalla 5.1 6.1 19.949 Burnie 5.6 6.1 8.050 Norfolk Island 5.8 5.9 2.3
Total top 50 regional airports 2 029.4 2 091.4 3.1
Total regional airports 2 148.8 2 216.6 3.2
Total domestic network 10 485.0 10 840.6 3.4Note: Airport passenger movement numbers are the sum of passenger arrivals and departures at each airport.

Top fifty regional airports
27
Table 11: Top fifty regional airports (000s) — passenger movements, annual
Airport YE Oct 2016 YE Oct 2017 % Change1 Cairns 4 218.2 4 307.4 2.12 Hobart 2 356.8 2 481.6 5.33 Darwin 1 794.0 1 805.8 0.74 Townsville 1 537.7 1 569.0 2.05 Launceston 1 330.8 1 335.6 0.46 Newcastle 1 220.5 1 280.0 4.97 Mackay 802.7 779.8 -2.98 Alice Springs 610.5 614.1 0.69 Rockhampton 584.6 563.3 -3.610 Ballina 477.5 506.0 6.011 Hamilton Island 539.2 447.4 -17.012 Karratha 513.5 445.6 -13.213 Coffs Harbour 389.6 413.2 6.114 Proserpine 344.3 399.6 16.115 Broome 377.5 377.5 0.016 Ayers Rock 353.8 362.8 2.617 Port Hedland 361.4 351.1 -2.818 Gladstone 346.1 289.8 -16.319 Newman 313.1 286.9 -8.420 Albury 250.4 265.4 6.021 Mildura 246.2 253.4 2.922 Kalgoorlie 238.1 250.1 5.023 Dubbo 202.6 237.0 17.024 Port Macquarie 225.2 231.3 2.725 Wagga Wagga 215.5 219.6 1.926 Emerald 200.8 199.2 -0.827 Mount Isa 189.3 198.9 5.128 Tamworth 175.3 198.5 13.229 Bundaberg 171.7 176.2 2.630 Hervey Bay 169.9 174.8 2.931 Port Lincoln 181.1 172.6 -4.732 Paraburdoo 164.4 166.7 1.433 Wellcamp 109.9 150.9 37.334 Devonport 147.5 147.2 -0.235 Armidale 129.3 132.6 2.536 Moranbah 118.6 120.0 1.237 Geraldton 118.4 113.7 -3.938 Kununurra 108.4 104.7 -3.539 Thursday Island 99.4 100.1 0.740 Gove 79.2 83.9 5.941 Roma 91.7 83.3 -9.142 Learmonth 85.7 82.3 -4.143 Mount Gambier 76.1 79.7 4.844 Weipa 78.2 77.8 -0.545 Griffith 69.4 72.9 5.146 Merimbula 62.3 65.8 5.547 Olympic Dam 50.8 64.5 26.948 Whyalla 63.6 64.0 0.649 Orange 51.3 61.6 20.250 Burnie 60.3 60.9 1.0
Total top 50 regional airports 22 702.3 23 026.1 1.4
Total regional airports 24 019.7 24 410.4 1.6
Total domestic network 117 550.5 119 388.6 1.6Note: Airport passenger movement numbers are the sum of passenger arrivals and departures at each airport.

BITRE – AVIATION STATISTICS DOMESTIC MONTHLY
28
DOMESTIC CHARTER ACTIVITY
Table 12: Charter passengers carried and aircraft trips - annual activityYE Oct 2016 YE Oct 2017 % Change
Total domestic charter passengers 2 428 625 2 431 585 0.1Total domestic charter aircraft trips 45 006 45 758 1.7Note: Helicopter, joyflights and sightseeing charter flights not included.
Table 13: Charter passengers carried and aircraft trips - monthly activityOct 2016 Oct 2017 % Change
Total domestic charter passengers 190 849 209 787 9.9Total domestic charter aircraft trips 3 517 3 983 13.2Note: Helicopter, joyflights and sightseeing charter flights not included.
Table 14: Domestic airports - charter activity - annual YE Oct 2016 YE Oct 2017 % Change
Total domestic charter passenger movements 4 857 250 4 863 170 0.1Total domestic charter aircraft movements 90 012 91 516 1.7
Perth airport charter passenger movements 1 872 769 1 860 470 -0.7Perth airport charter aircraft movements 31 331 31 557 0.7Note: Helicopter, joyflights and sightseeing charter flights not included.Charter passenger and aircraft movement numbers are the sum of arrivals and departures at each airport.
Table 15: Domestic airports - charter activity - monthlyOct 2016 Oct 2017 % Change
Total domestic charter passenger movements 381 698 419 574 9.9Total domestic charter aircraft movements 7 034 7 966 13.2
Perth airport charter passenger movements 149 186 156 394 4.8Perth airport charter aircraft movements 2 520 2 609 3.5Note: Helicopter, joyflights and sightseeing charter flights not included.Charter passenger and aircraft movement numbers are the sum of arrivals and departures at each airport.
0
1
2
3
4
5
6
7
8
9
10
11
12
0
100
200
300
400
500
600
Airc
raft
mov
emen
ts (0
00s)
Pass
enge
rs (0
00s)
Month
Domestic airports - charter passenger and aircraft movements
Total domestic charter passengers movements
Perth airport charter passenger movements
Total domestic charter aircraft movements

Definitions
29
DEFINITIONS
Aircraft Trips The number of flight stages. A return flight counts as two aircraft trips.
Airport Movements Airport movements (passenger and cargo) are measured once on arrival and once on departure. Each domestic trip generates two movements at airports. For example, a trip from Melbourne to Sydney will be counted twice, as a passenger departure at Melbourne and as a passenger arrival at Sydney. At the national level, the sum of all domestic airport traffic will therefore be equal to twice the number of trips undertaken.
Available Seat Kilometres (ASKs)
Calculated by multiplying the number of seats available on each flight stage, by the distance in kilometres between the ports. The distances used are Great Circle Distances.
City-Pair The ports shown make up the city-pair route. Passenger movements shown for a city pair reflect total traffic in both directions.
Flight Stage The operation of an aircraft from take-off to landing.
Load Factor The total revenue passenger kilometres performed as a percentage of the total available seat kilometres.
Passengers Carried Revenue passengers carried.
Regular Public Transport Services (RPT)
All air service operations in which aircraft are available for the transport of members of the public and are conducted in accordance with fixed schedules. It does not include charter or other non-scheduled operations.
Revenue Passengers All passengers paying any fare. Frequent flyer redemption travellers are regarded as revenue passengers.
Revenue Passenger Kilometres (RPKs)
Calculated by multiplying the number of revenue passengers travelling on each flight stage, by the distance in kilometres between the ports. The distances used are Great Circle Distances.
Traffic on board by stages The total of all traffic (revenue passengers) on each flight stage between two directly connected airports.
.. Data not included
NA Not applicable