averages
DESCRIPTION
Measures of dispersionTRANSCRIPT

1
KATHIRAVAN GopalanKATHIRAVAN Gopalan
STATISTICSMeasures of Averages

2
a value at the
center or middle of a data set
Measures of Center

3
Mean
(Arithmetic Mean)
AVERAGE
the number obtained by adding the values and dividing the total by the number of values
Definitions

4
Notation
denotes the addition of a set of values
x is the variable usually used to represent the individual data values
n represents the number of data values in a sample
N represents the number of data values in a population

5
Notationis pronounced ‘x-bar’ and denotes the mean of a set of sample values
x =n
xx

6
Notation
µ is pronounced ‘mu’ and denotes the mean of all values in a population
is pronounced ‘x-bar’ and denotes the mean of a set of sample values
Calculators can calculate the mean of data
x =n
xx
Nµ =
x

7
Definitions Median
the middle value when the original data values are arranged in order of increasing (or decreasing) magnitude

8
Definitions Median
the middle value when the original data values are arranged in order of increasing (or decreasing) magnitude
often denoted by x (pronounced ‘x-tilde’)~
9
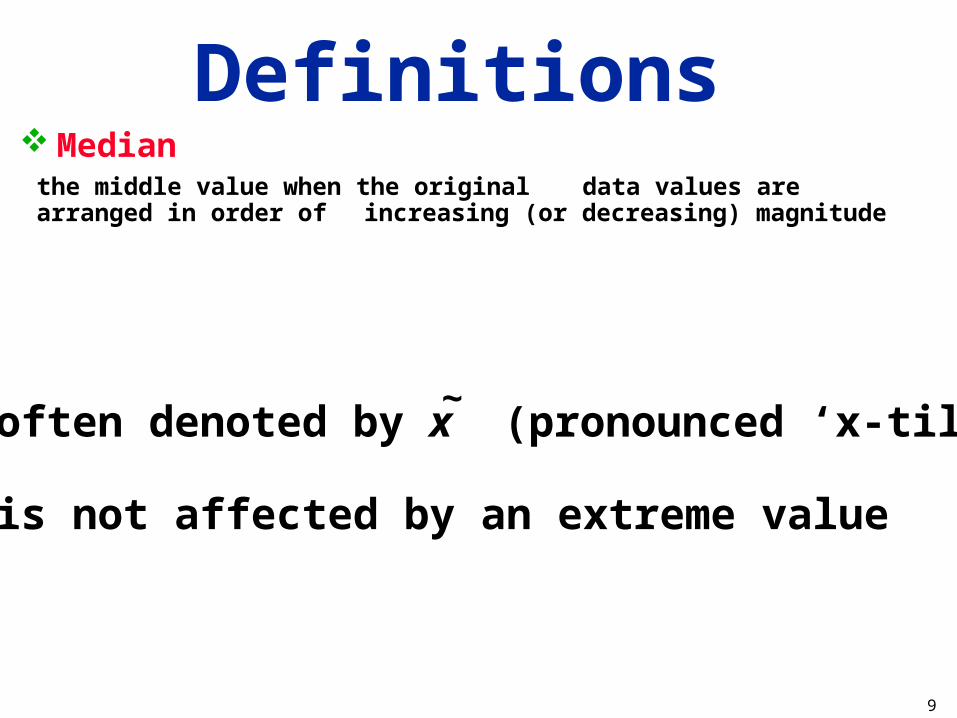
Definitions Median
the middle value when the original data values are arranged in order of increasing (or decreasing) magnitude
often denoted by x (pronounced ‘x-tilde’)
is not affected by an extreme value
~

10
6.72 3.46 3.60 6.44
3.46 3.60 6.44 6.72 no exact middle -- shared by two numbers
3.60 + 6.44
2
(even number of values)
MEDIAN is 5.02

11
6.72 3.46 3.60 6.44 26.70
3.46 3.60 6.44 6.72 26.70
(in order - odd number of values)
exact middle MEDIAN is 6.44
6.72 3.46 3.60 6.44
3.46 3.60 6.44 6.72 no exact middle -- shared by two numbers
3.60 + 6.44
2
(even number of values)
MEDIAN is 5.02

12
Definitions Mode
the score that occurs most frequently
Bimodal
Multimodal
No Mode
denoted by M
the only measure of central tendency that can be used with nominal data

13
a. 5 5 5 3 1 5 1 4 3 5
b. 1 2 2 2 3 4 5 6 6 6 7 9
c. 1 2 3 6 7 8 9 10
Examples
Mode is 5
Bimodal - 2 and 6
No Mode

14
Midrange
the value midway between the highest and lowest values in the original data set
Definitions

15
Midrange
the value midway between the highest and lowest values in the original data set
Definitions
Midrange =highest score + lowest score
2

16
Carry one more decimal place than is present in the original set of values
Round-off Rule for Measures of Center

17
use class midpoint of classes for variable x
Mean from a Frequency Table

18
use class midpoint of classes for variable x
Mean from a Frequency Table
x = f
(f • x)

19
use class midpoint of classes for variable x
Mean from a Frequency Table
x = class midpoint
f = frequency
f = n
x = f
(f • x)

20
Weighted Mean
x =w
(w • x)

21
Advantages - Disadvantages
Best Measure of Center

22
SymmetricData is symmetric if the left half of its histogram is roughly a mirror of its right half.
SkewedData is skewed if it is not symmetric and if it extends more to one side
than the other.
Definitions

23
Skewness
Mode = Mean = Median
SYMMETRIC

24
Skewness
Mode = Mean = Median
SKEWED LEFT(negatively)
SYMMETRIC
Mean Mode Median

25
Skewness
Mode = Mean = Median
SKEWED LEFT(negatively)
SYMMETRIC
Mean Mode Median
SKEWED RIGHT(positively)
Mean Mode Median