a summary of climate averages for · pdf filea summary of climate averages for ireland ......
TRANSCRIPT
CLIMATOLOGICAL NOTE NO.14
A SUMMARY
OF
CLIMATE AVERAGES
FOR IRELAND
1981-2010
BY
SÉAMUS WALSH
MET ÉIREANN, GLASNEVIN HILL, DUBLIN 9MAY 2012
U.D.C.551.582 (417)
1981-2010 AVERAGES
MET ÉIREANN INTRODUCES NEW
LONG-TERM AVERAGES FOR DAY TO
DAY WEATHER AND CLIMATE
COMPARISONS
Long-term averages decribe the climate ofIreland.It is usual to place current weatherevents in context by comparing them to long-term averages or ‘Normals’. These aredefined as 30 year averages of a weather ele-ment e.g. rainfall, sunshine etc. The period of30 years is considered long enough to smoothout year-to-year variations.
Standard Climatological Normals or averagesare compiled in 30 year cycles e.g. 1931-1960,1961-1990 etc., and allow for comparisons ofcurrent weather elements with long-term averages. Every country which is a member ofthe World Meteorological Organisation(WMO) is obliged to calculate these StandardClimatological Normals. However ClimateNormals may also be calculated for any 30year period of complete decades e.g. 1971-2000or 1981-2010.
Met Éireann has compiled a set of long-termaverages for the period 1981 to 2010, covering arange of weather elements. From May 2012onwards, weather and climate statistics quotedwill reference the new long-term average period 1981-2010, unless otherwise stated.These will replace the 1961-1990 long-termaverages currently in use. (The 1961-1990 averages will still be referenced occasionally,particularly in climate change studies).
HOW ARE THE AVERAGES CALCULATED?
Averages are calculated from readings taken atweather stations operated by Met Éireann andits voluntary observers. Values are averaged foreach month over a 30 year period to obtain thelong-term average. Where there are gaps indata, estimates are made using data fromneighbouring stations.
WHAT PRODUCTS ARE AVAILABLE?
Rainfall: Long-term averages of monthly, sea-sonal and annual rainfall totals and days ofrainfall greater than 0.2mm, 1mm and 10mmhave been calculated at stations with sufficientrecords. Gridded maps with values at 1 km resolution have also been produced.
Temperature: Long-term averages of monthly,seasonal and annual maxima, minima andmean temperatures have been calculated atstations with sufficient records. Gridded mapswith values at 1 km resolution have also beenproduced.
Sunshine: Long-term averages of monthly,seasonal and annual sunshine duration havebeen calculated at stations with sufficientrecords. Gridded maps with values at 1 kmresolution have also been produced.
Wind: Monthly mean values have beencalculated and 30-year wind roses have alsobeen produced.
WHAT IS THE SIGNIFICANCE OF DIFFERENCES
IN THE 1961-1990 AND 1981-2010 LONG-TERM AVERAGES?
Because we are comparing two 30 year periodswith an overlap of 10 years, the differencesrelate to the non-overlap periods i.e. 1961-1980and 1991-2010.
WHAT DOES THIS MEAN IN TERMS OF
CLIMATE CHANGE?
Changes in climate are reflected in the long-term averages, however their main use is as abaseline to put current weather in context, it isnot possible to detect changes in extremevalues from long-term averages.
WHERE CAN I FIND MORE DETAILS OF THE
ANALYSIS TECHNIQUES?
Details of the methods used to infill formissing data, and information on how thegridded data was produced are in preparationand will be published in due course.

1981-2010 AVERAGES
WHERE CAN I GET SOME OF THE DATA?
Maps and underlying data for the long-termaverages will be made freely available onwww.met.ie as will a selection of stationaverages. For other data requests please e-mailClimate Enquires at [email protected]
ACKNOWLEDGEMENTS
We are grateful to our voluntary observers atclimatological and rainfall stations withoutwhom this work would not be possible.Thanks also to the United KingdomMeteorological Office for Northern Irelandstation data for gridding purposes.
RAINFALL
RAINFALL AND TEMPERATURE
RAINFALL, TEMPERATURE
AND SUNSHINE
LOCATION OF STATIONS
USED IN
CALCULATING
1981-2010 AVERAGES
1981-2010 AVERAGES
ANNUALMEAN
TEMPERATURE
WINTER MEAN TEMPERATURE (°C)
SPRING MEAN TEMPERATURE (°C)
AUTUMN MEAN TEMPERATURE (°C)
SUMMER MEAN TEMPERATURE (°C)
(°C)
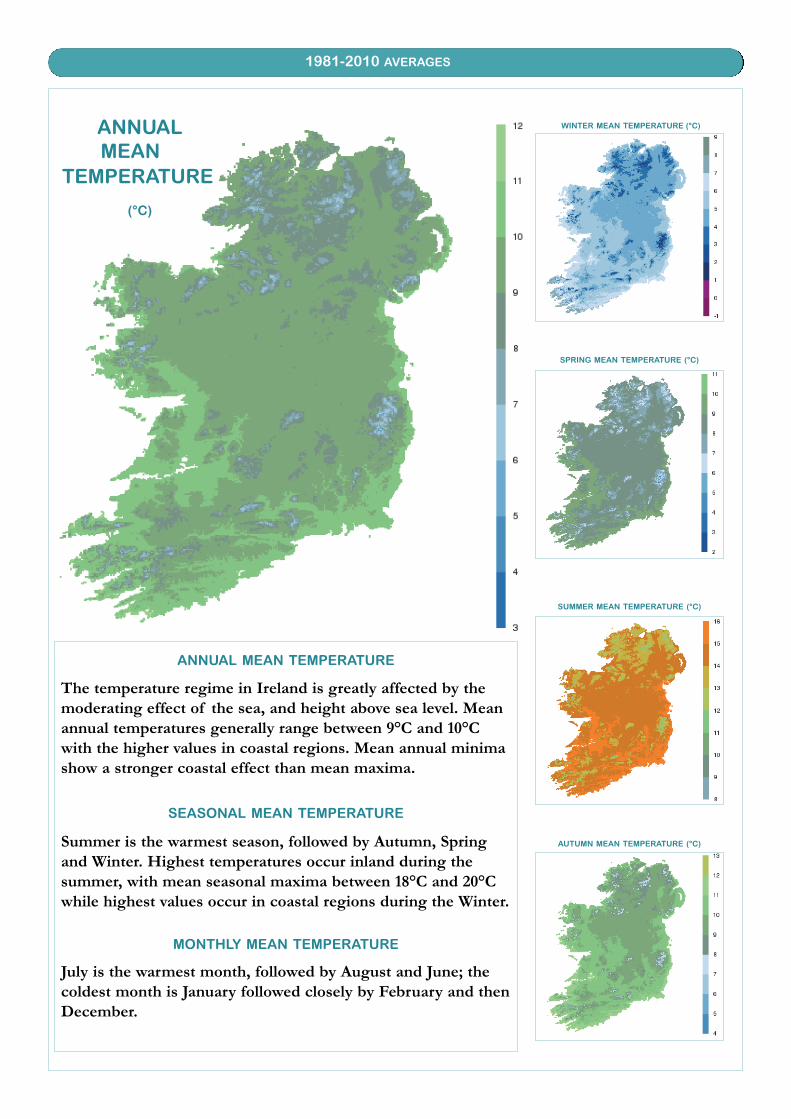
ANNUAL MEAN TEMPERATURE
The temperature regime in Ireland is greatly affected by themoderating effect of the sea, and height above sea level. Meanannual temperatures generally range between 9°C and 10°Cwith the higher values in coastal regions. Mean annual minimashow a stronger coastal effect than mean maxima.
SEASONAL MEAN TEMPERATURE
Summer is the warmest season, followed by Autumn, Springand Winter. Highest temperatures occur inland during thesummer, with mean seasonal maxima between 18°C and 20°Cwhile highest values occur in coastal regions during the Winter.
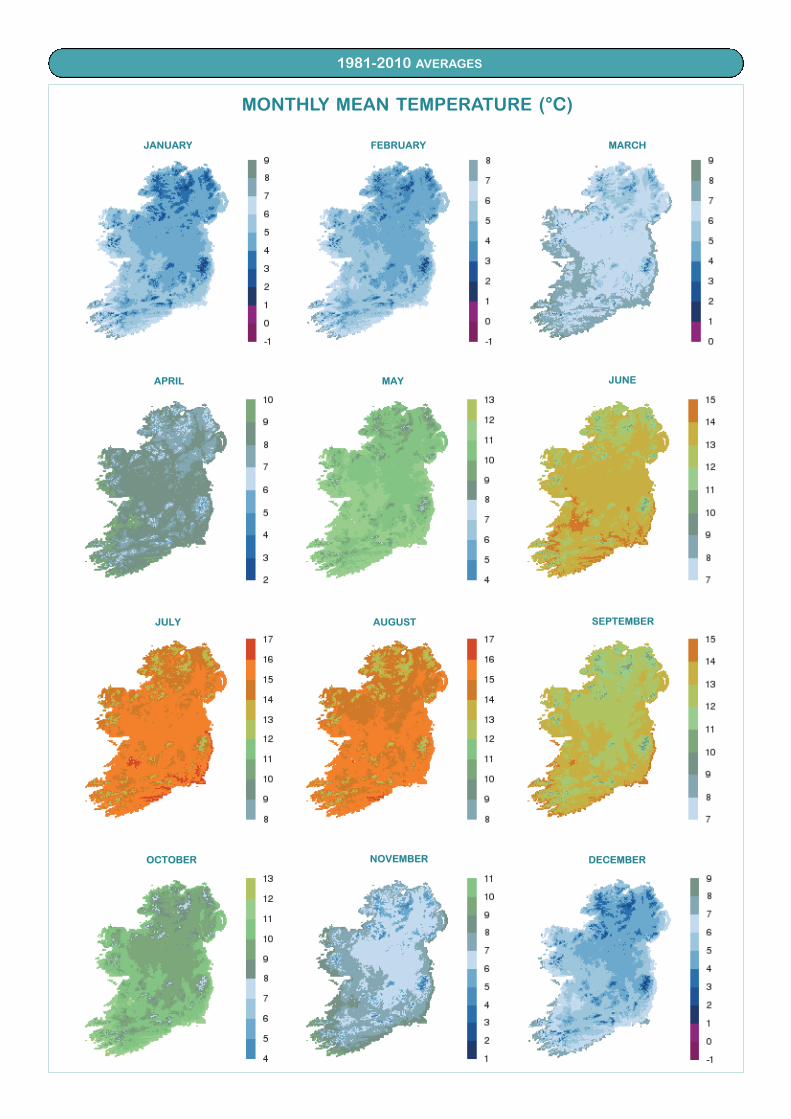
MONTHLY MEAN TEMPERATURE
July is the warmest month, followed by August and June; thecoldest month is January followed closely by February and thenDecember.
1981-2010 AVERAGES
MONTHLY MEAN TEMPERATURE (°C)
JANUARY
DECEMBER
SEPTEMBER
NOVEMBEROCTOBER
AUGUSTJULY
JUNEAPRIL MAY
MARCHFEBRUARY
1981-2010 AVERAGES
WINTER RAINFALL (mm)
ANNUAL
RAINFALL(mm)
SPRING RAINFALL (mm)
AUTUMN RAINFALL (mm)
SUMMER RAINFALL (mm)
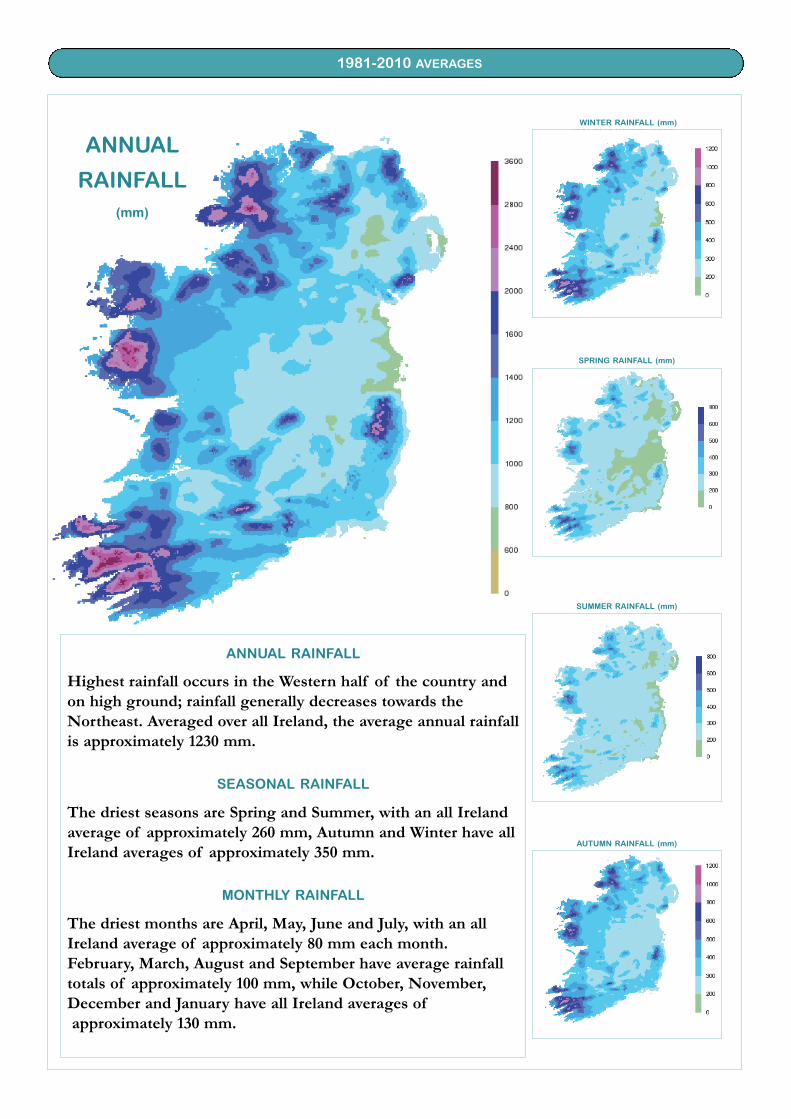
ANNUAL RAINFALL
Highest rainfall occurs in the Western half of the country andon high ground; rainfall generally decreases towards theNortheast. Averaged over all Ireland, the average annual rainfallis approximately 1230 mm.
SEASONAL RAINFALL
The driest seasons are Spring and Summer, with an all Irelandaverage of approximately 260 mm, Autumn and Winter have allIreland averages of approximately 350 mm.
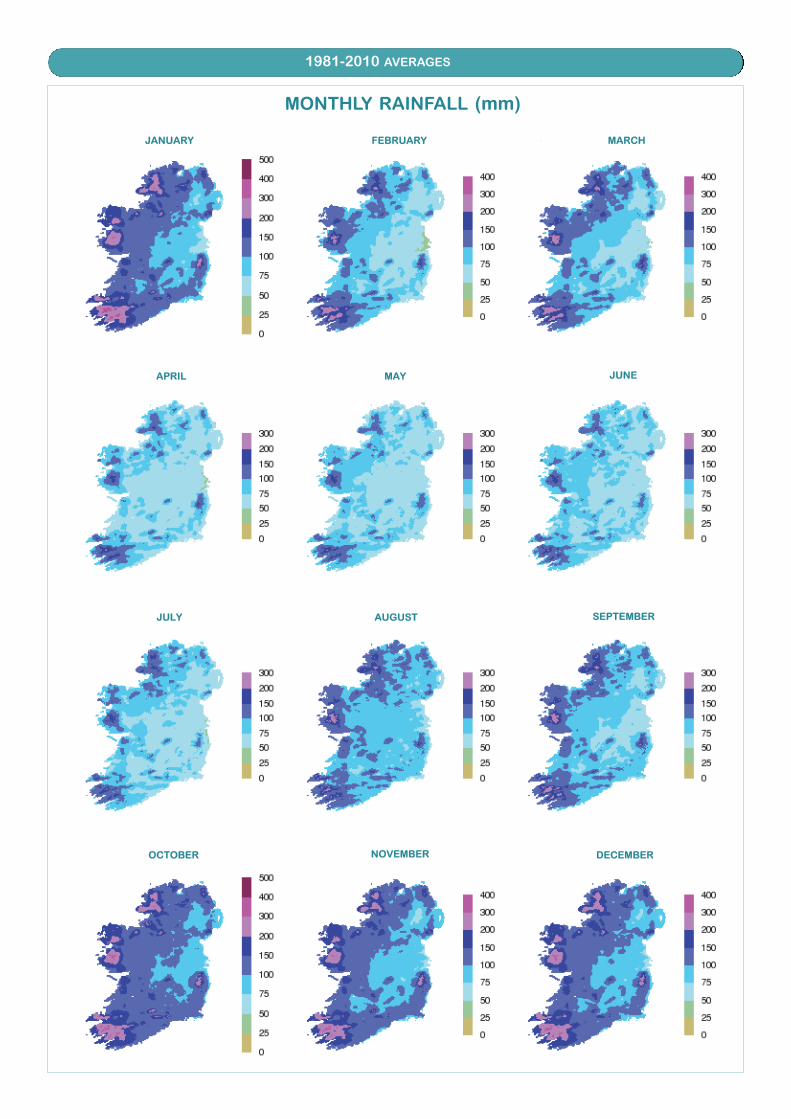
MONTHLY RAINFALL
The driest months are April, May, June and July, with an allIreland average of approximately 80 mm each month.February, March, August and September have average rainfalltotals of approximately 100 mm, while October, November,December and January have all Ireland averages ofapproximately 130 mm.
1981-2010 AVERAGES
JANUARY
DECEMBER
SEPTEMBER
NOVEMBEROCTOBER
AUGUSTJULY
JUNEAPRIL MAY
MARCHFEBRUARY
MONTHLY RAINFALL (mm)
1981-2010 AVERAGES
TOTAL WINTER SUNSHINE (hours)
TOTAL ANNUAL
SUNSHINE(hours)
TOTAL SPRING SUNSHINE (hours)
TOTAL AUTUMN SUNSHINE (hours)
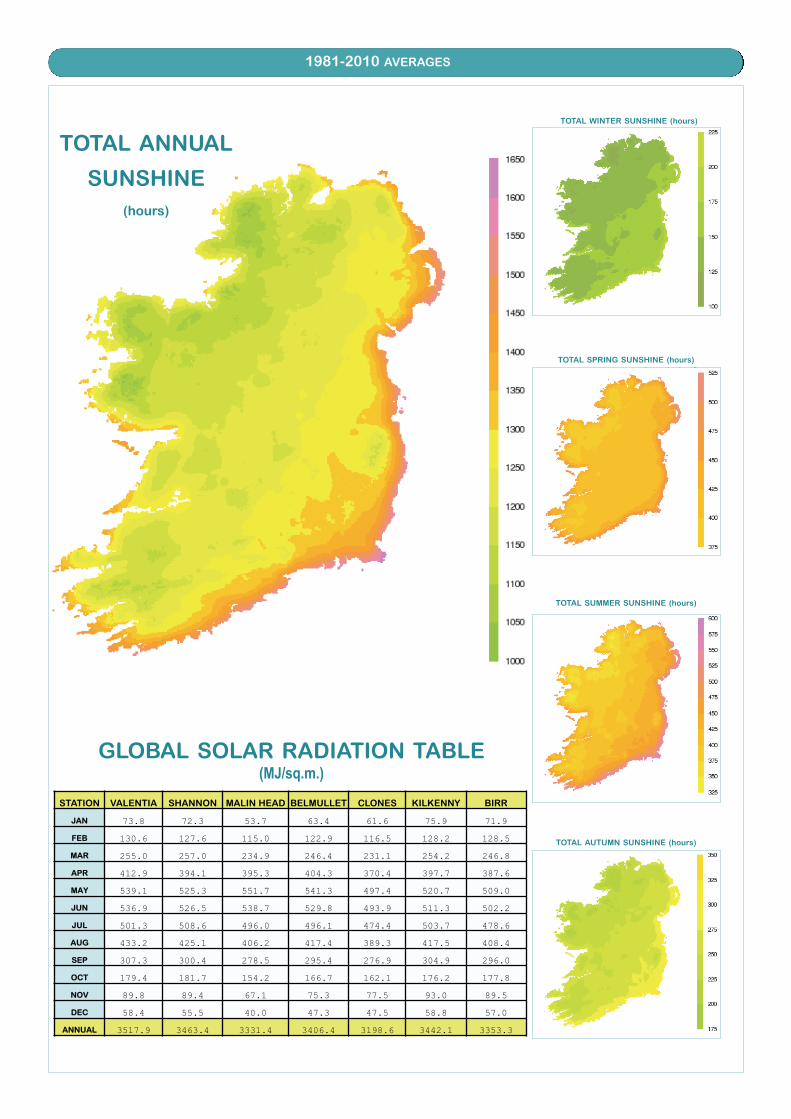
GLOBAL SOLAR RADIATION TABLE(MJ/sq.m.)
TOTAL SUMMER SUNSHINE (hours)
STATION VALENTIA SHANNON MALIN HEAD BELMULLET CLONES KILKENNY BIRR
JAN 73.8 72.3 53.7 63.4 61.6 75.9 71.9FEB 130.6 127.6 115.0 122.9 116.5 128.2 128.5MAR 255.0 257.0 234.9 246.4 231.1 254.2 246.8APR 412.9 394.1 395.3 404.3 370.4 397.7 387.6MAY 539.1 525.3 551.7 541.3 497.4 520.7 509.0JUN 536.9 526.5 538.7 529.8 493.9 511.3 502.2JUL 501.3 508.6 496.0 496.1 474.4 503.7 478.6AUG 433.2 425.1 406.2 417.4 389.3 417.5 408.4SEP 307.3 300.4 278.5 295.4 276.9 304.9 296.0OCT 179.4 181.7 154.2 166.7 162.1 176.2 177.8NOV 89.8 89.4 67.1 75.3 77.5 93.0 89.5DEC 58.4 55.5 40.0 47.3 47.5 58.8 57.0
ANNUAL 3517.9 3463.4 3331.4 3406.4 3198.6 3442.1 3353.3
1981-2010 AVERAGES
JANUARY
DECEMBER
SEPTEMBER
NOVEMBEROCTOBER
AUGUSTJULY
JUNEAPRIL MAY
MARCHFEBRUARY
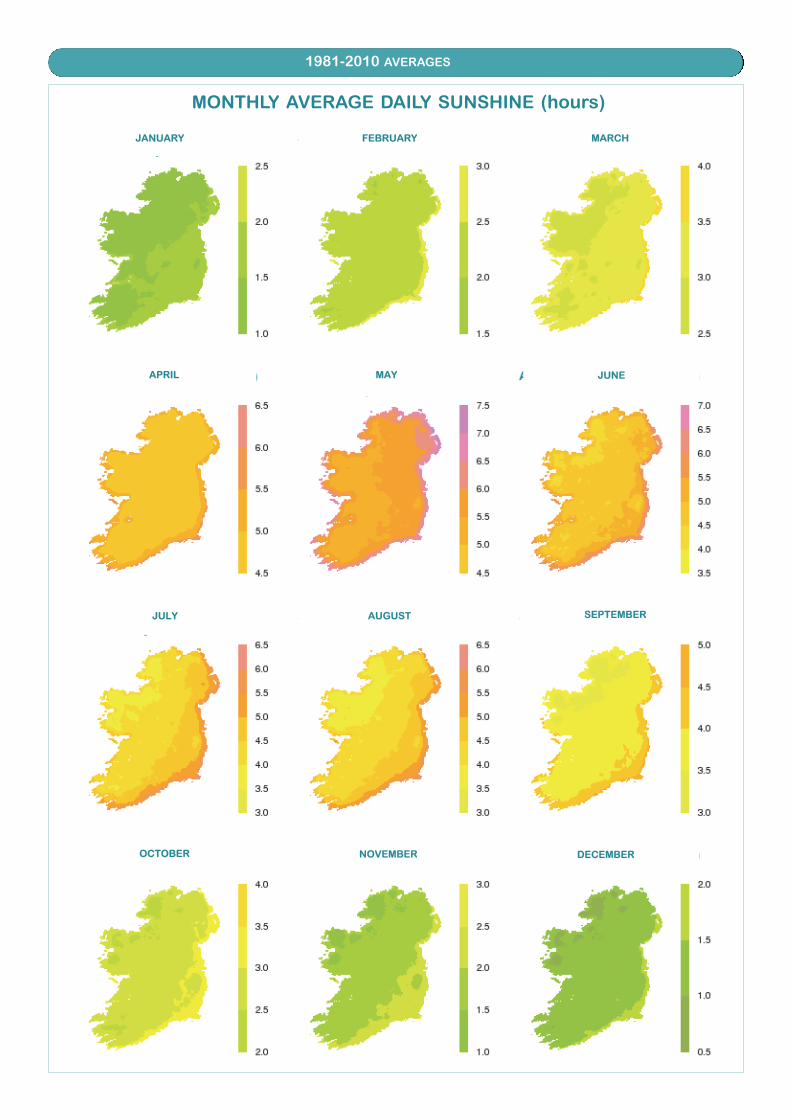
MONTHLY AVERAGE DAILY SUNSHINE (hours)
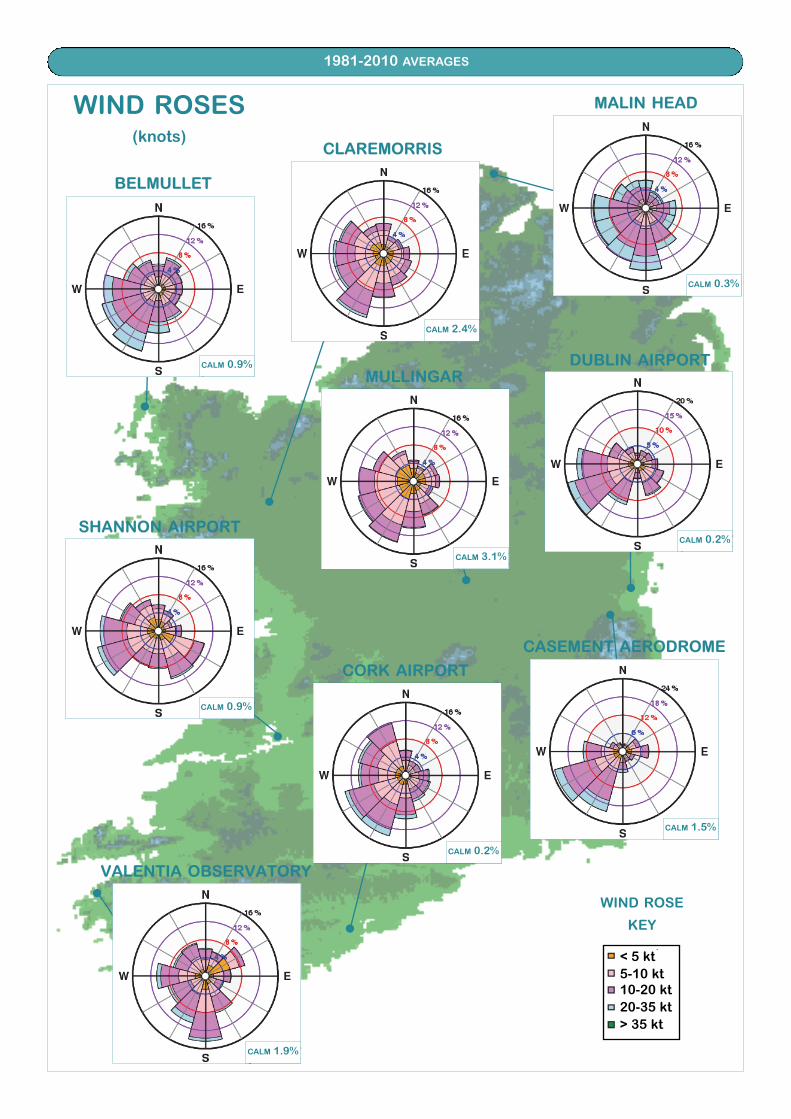
1981-2010 AVERAGES
WIND ROSES(knots)
MALIN HEAD
DUBLIN AIRPORT
CASEMENT AERODROME
CORK AIRPORT
SHANNON AIRPORT
VALENTIA OBSERVATORY
BELMULLET
WIND ROSE
KEY
n
n
n
n
nn
n
n
MULLINGAR
CLAREMORRIS
n
CALM 0.9%
CALM 0.2%
CALM 1.5%
CALM 3.1%
CALM 0.2%
CALM 0.3%
CALM 2.4%
CALM 0.9%
CALM 1.9%
< 5 kt5-10 kt10-20 kt20-35 kt> 35 kt
1981-2010 AVERAGES
MALIN HEAD
MULLINGARCASEMENT
AERODROME
SHANNON AIRPORT
VALENTIA OBSERVATORY
BELMULLET
n
n
n
n
n
n
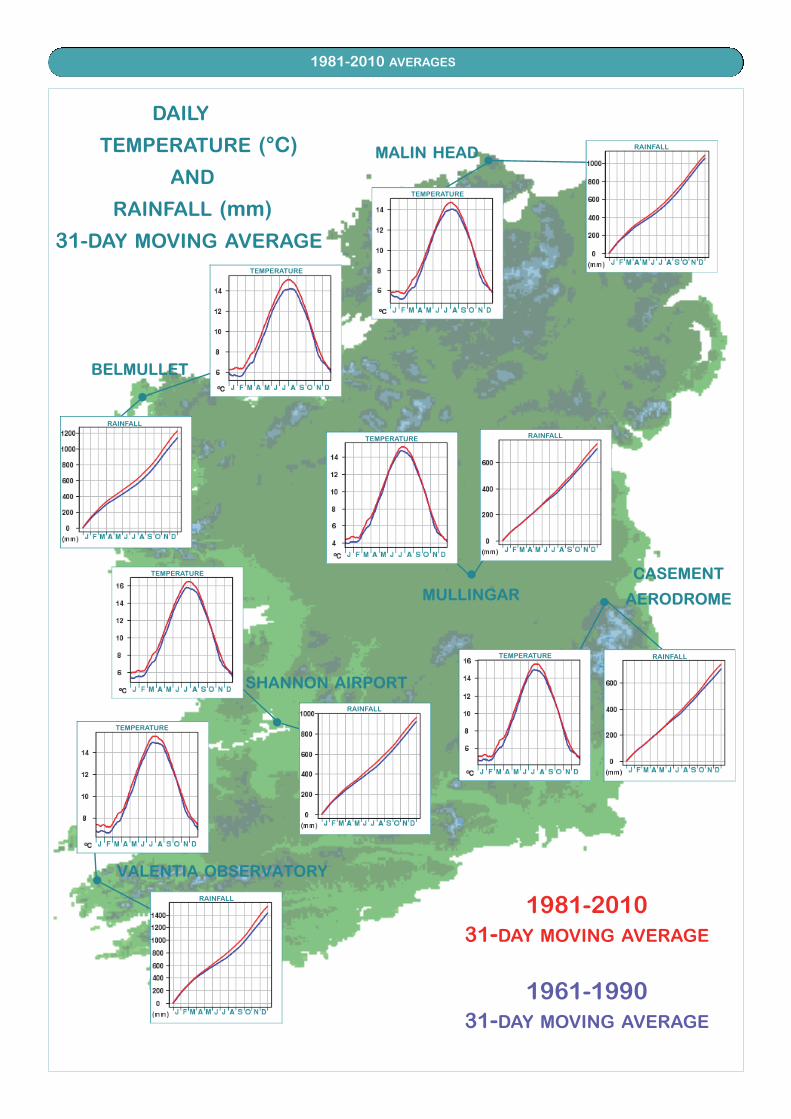
1981-2010 31-DAY MOVING AVERAGE
1961-1990 31-DAY MOVING AVERAGE
DAILY
TEMPERATURE (°C)
AND
RAINFALL (mm)
31-DAY MOVING AVERAGE
TEMPERATURE
TEMPERATURE
TEMPERATURE
TEMPERATURE
TEMPERATURE
TEMPERATURE
RAINFALL
RAINFALL
RAINFALL
RAINFALL
RAINFALL
RAINFALL
1981-2010 AVERAGES
WINTER COMPARISON (%)
SPRING COMPARISON (%)
AUTUMN COMPARISON (%)
SUMMER COMPARISON (%)
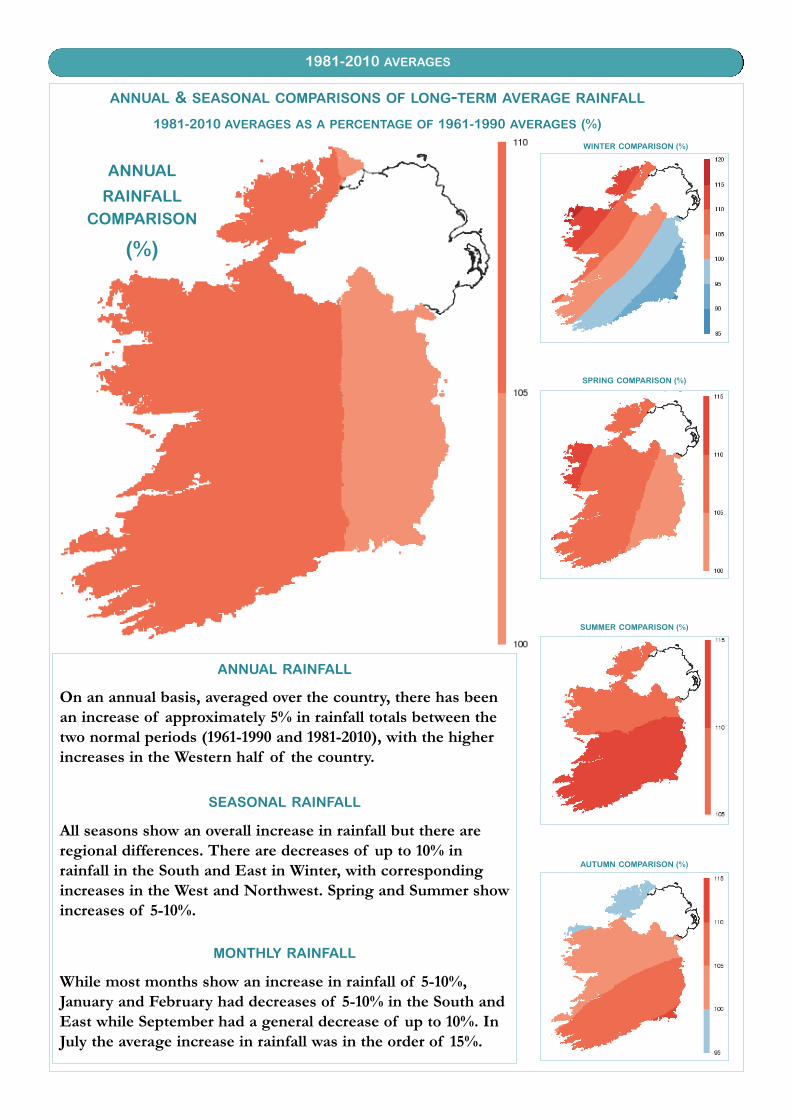
ANNUAL RAINFALL
On an annual basis, averaged over the country, there has beenan increase of approximately 5% in rainfall totals between thetwo normal periods (1961-1990 and 1981-2010), with the higherincreases in the Western half of the country.
SEASONAL RAINFALL
All seasons show an overall increase in rainfall but there areregional differences. There are decreases of up to 10% in rainfall in the South and East in Winter, with correspondingincreases in the West and Northwest. Spring and Summer showincreases of 5-10%.
MONTHLY RAINFALL
While most months show an increase in rainfall of 5-10%,January and February had decreases of 5-10% in the South andEast while September had a general decrease of up to 10%. InJuly the average increase in rainfall was in the order of 15%.
ANNUAL & SEASONAL COMPARISONS OF LONG-TERM AVERAGE RAINFALL
1981-2010 AVERAGES AS A PERCENTAGE OF 1961-1990 AVERAGES (%)
ANNUAL
RAINFALLCOMPARISON
(%)
1981-2010 AVERAGES
WINTER COMPARISON (°C)
SPRING COMPARISON (°C)
AUTUMN COMPARISON (°C)
SUMMER COMPARISON (°C)
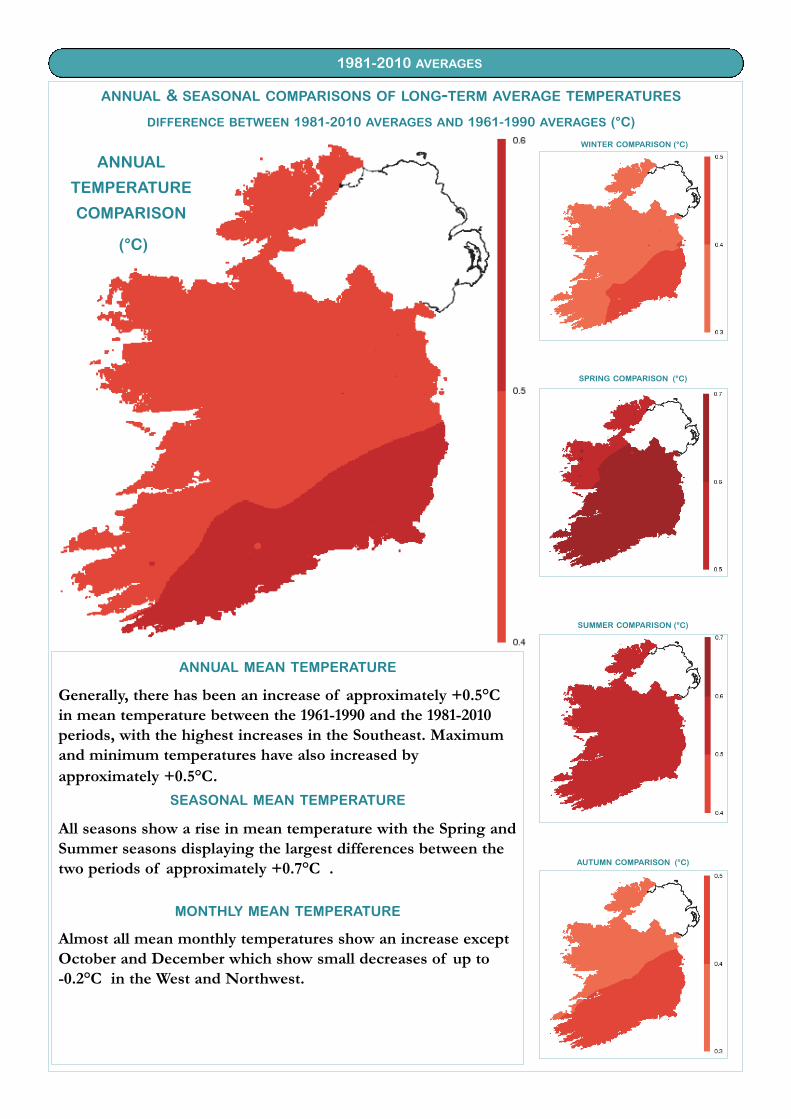
ANNUAL MEAN TEMPERATURE
Generally, there has been an increase of approximately +0.5°Cin mean temperature between the 1961-1990 and the 1981-2010 periods, with the highest increases in the Southeast. Maximumand minimum temperatures have also increased by approximately +0.5°C.
SEASONAL MEAN TEMPERATURE
All seasons show a rise in mean temperature with the Spring andSummer seasons displaying the largest differences between thetwo periods of approximately +0.7°C .
MONTHLY MEAN TEMPERATURE
Almost all mean monthly temperatures show an increase exceptOctober and December which show small decreases of up to -0.2°C in the West and Northwest.
ANNUAL & SEASONAL COMPARISONS OF LONG-TERM AVERAGE TEMPERATURES
DIFFERENCE BETWEEN 1981-2010 AVERAGES AND 1961-1990 AVERAGES (°C)
ANNUAL
TEMPERATURE
COMPARISON
(°C)
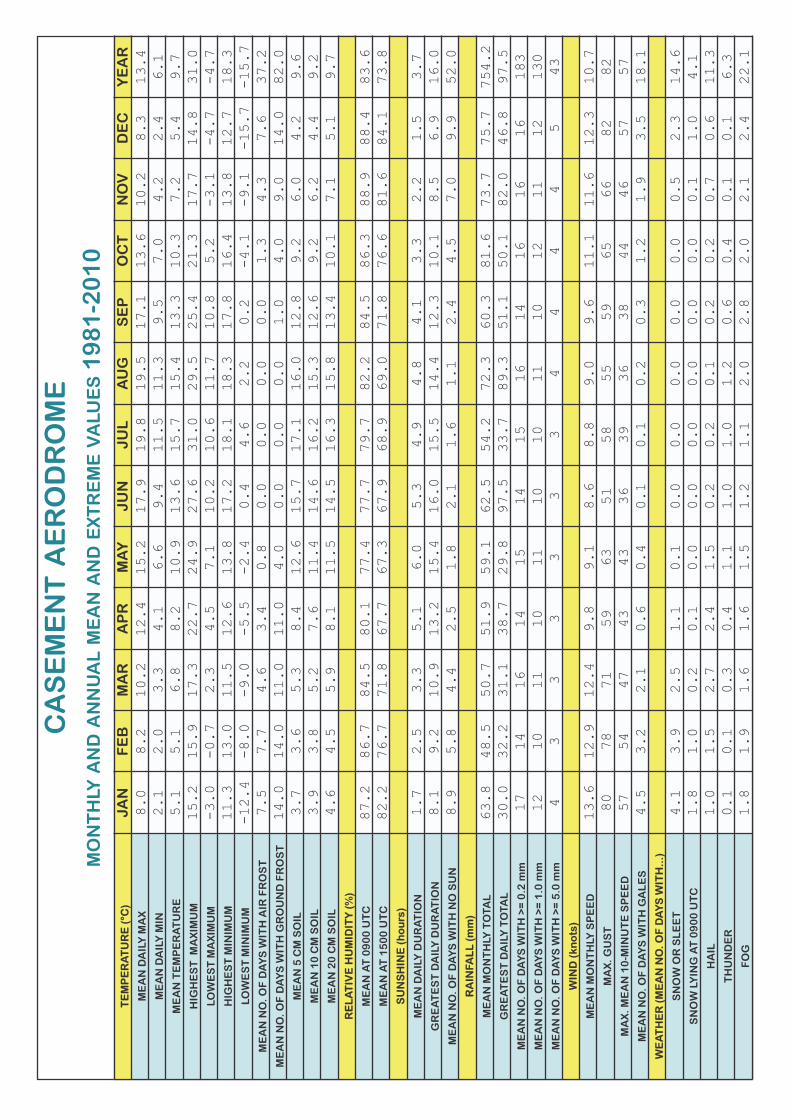
CA
SE
ME
NT
AE
RO
DR
OM
EM
ON
TH
LYA
ND
AN
NU
AL
ME
AN
AN
DE
XT
RE
ME
VA
LUE
S1
98
1-2
01
0T
EM
PE
RA
TU
RE
(°C
)JA
NF
EB
MA
RA
PR
MA
YJU
NJU
LA
UG
SE
PO
CT
NO
VD
EC
YE
AR
ME
AN
DA
ILY
MA
X8.0
8.2
10.2
12.4
15.2
17.9
19.8
19.5
17.1
13.6
10.2
8.3
13.4
ME
AN
DA
ILY
MIN
2.1
2.0
3.3
4.1
6.6
9.4
11.5
11.3
9.5
7.0
4.2
2.4
6.1
ME
AN
TE
MP
ER
AT
UR
E5.1
5.1
6.8
8.2
10.9
13.6
15.7
15.4
13.3
10.3
7.2
5.4
9.7
HIG
HE
ST
MA
XIM
UM
15.2
15.9
17.3
22.7
24.9
27.6
31.0
29.5
25.4
21.3
17.7
14.8
31.0
LOW
ES
T M
AX
IMU
M-3.0
-0.7
2.3
4.5
7.1
10.2
10.6
11.7
10.8
5.2
-3.1
-4.7
-4.7
HIG
HE
ST
MIN
IMU
M11.3
13.0
11.5
12.6
13.8
17.2
18.1
18.3
17.8
16.4
13.8
12.7
18.3
LOW
ES
T M
INIM
UM
-12.4
-8.0
-9.0
-5.5
-2.4
0.4
4.6
2.2
0.2
-4.1
-9.1
-15.7
-15.7
ME
AN
NO
. OF
DA
YS
WIT
H A
IR F
RO
ST
7.5
7.7
4.6
3.4
0.8
0.0
0.0
0.0
0.0
1.3
4.3
7.6
37.2
ME
AN
NO
. OF
DA
YS
WIT
H G
RO
UN
D F
RO
ST
14.0
14.0
11.0
11.0
4.0
0.0
0.0
0.0
1.0
4.0
9.0
14.0
82.0
ME
AN
5 C
M S
OIL
3.7
3.6
5.3
8.4
12.6
15.7
17.1
16.0
12.8
9.2
6.0
4.2
9.6
ME
AN
10
CM
SO
IL3.9
3.8
5.2
7.6
11.4
14.6
16.2
15.3
12.6
9.2
6.2
4.4
9.2
ME
AN
20
CM
SO
IL4.6
4.5
5.9
8.1
11.5
14.5
16.3
15.8
13.4
10.1
7.1
5.1
9.7
RE
LA
TIV
E H
UM
IDIT
Y (
%)
ME
AN
AT
09
00
UT
C87.2
86.7
84.5
80.1
77.4
77.7
79.7
82.2
84.5
86.3
88.9
88.4
83.6
ME
AN
AT
15
00
UT
C
82.2
76.7
71.8
67.7
67.3
67.9
68.9
69.0
71.8
76.6
81.6
84.1
73.8
SU
NS
HIN
E (
ho
urs
)
ME
AN
DA
ILY
DU
RA
TIO
N
1.7
2.5
3.3
5.1
6.0
5.3
4.9
4.8
4.1
3.3
2.2
1.5
3.7
GR
EA
TE
ST
DA
ILY
DU
RA
TIO
N
8.1
9.2
10.9
13.2
15.4
16.0
15.5
14.4
12.3
10.1
8.5
6.9
16.0
ME
AN
NO
. OF
DA
YS
WIT
H N
O S
UN
8.9
5.8
4.4
2.5
1.8
2.1
1.6
1.1
2.4
4.5
7.0
9.9
52.0
RA
INFA
LL
(m
m)
ME
AN
MO
NT
HLY
TO
TAL
63.8
48.5
50.7
51.9
59.1
62.5
54.2
72.3
60.3
81.6
73.7
75.7
754.2
GR
EA
TE
ST
DA
ILY
TO
TAL
30.0
32.2
31.1
38.7
29.8
97.5
33.7
89.3
51.1
50.1
82.0
46.8
97.5
ME
AN
NO
. OF
DA
YS
WIT
H >
= 0
.2 m
m
1714
1614
1514
1516
1416
1616
183
ME
AN
NO
. OF
DA
YS
WIT
H >
= 1
.0 m
m
1210
1110
1110
1011
1012
1112
130
ME
AN
NO
. OF
DA
YS
WIT
H >
= 5
.0 m
m
43
33
33
34
44
45
43W
IND
(kn
ots
)
ME
AN
MO
NT
HLY
SP
EE
D
13.6
12.9
12.4
9.8
9.1
8.6
8.8
9.0
9.6
11.1
11.6
12.3
10.7
MA
X. G
US
T
8078
7159
6351
5855
5965
6682
82M
AX
. ME
AN
10
-MIN
UT
E S
PE
ED
57
5447
4343
3639
3638
4446
5757
ME
AN
NO
. OF
DA
YS
WIT
H G
AL
ES
4.5
3.2
2.1
0.6
0.4
0.1
0.1
0.2
0.3
1.2
1.9
3.5
18.1
WE
AT
HE
R (
ME
AN
NO
. OF
DA
YS
WIT
H..
.)
SN
OW
OR
SL
EE
T
4.1
3.9
2.5
1.1
0.1
0.0
0.0
0.0
0.0
0.0
0.5
2.3
14.6
SN
OW
LY
ING
AT
09
00
UT
C1.8
1.0
0.2
0.1
0.0
0.0
0.0
0.0
0.0
0.0
0.1
1.0
4.1
HA
IL
1.0
1.5
2.7
2.4
1.5
0.2
0.2
0.1
0.2
0.2
0.7
0.6
11.3
TH
UN
DE
R
0.1
0.1
0.3
0.4
1.1
1.0
1.0
1.2
0.6
0.4
0.1
0.1
6.3
FO
G1.8
1.9
1.6
1.6
1.5
1.2
1.1
2.0
2.8
2.0
2.1
2.4
22.1
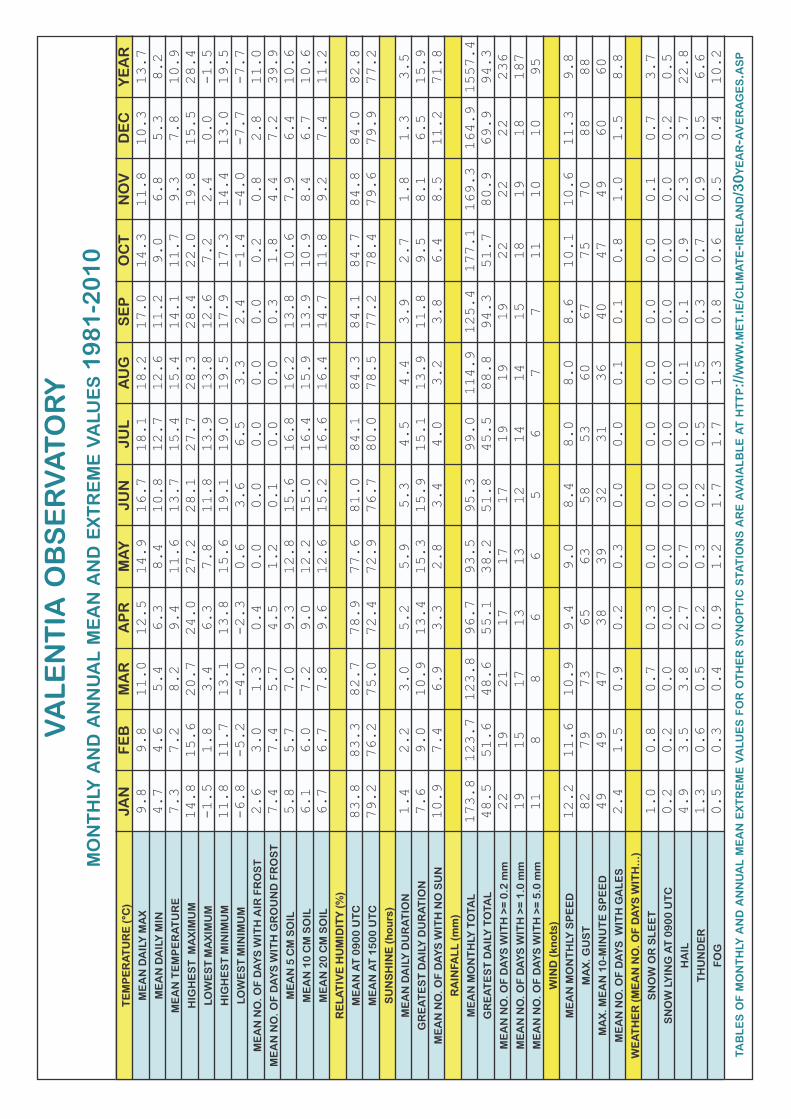
VA
LE
NT
IAO
BS
ER
VA
TO
RY
MO
NT
HLY
AN
DA
NN
UA
LM
EA
NA
ND
EX
TR
EM
EV
ALU
ES
19
81
-20
10
TE
MP
ER
AT
UR
E (
°C)
JAN
FE
BM
AR
AP
RM
AY
JUN
JUL
AU
GS
EP
OC
TN
OV
DE
CY
EA
RM
EA
N D
AIL
Y M
AX
9.8
9.8
11.0
12.5
14.9
16.7
18.1
18.2
17.0
14.3
11.8
10.3
13.7
ME
AN
DA
ILY
MIN
4.7
4.6
5.4
6.3
8.4
10.8
12.7
12.6
11.2
9.0
6.8
5.3
8.2
ME
AN
TE
MP
ER
AT
UR
E7.3
7.2
8.2
9.4
11.6
13.7
15.4
15.4
14.1
11.7
9.3
7.8
10.9
HIG
HE
ST
MA
XIM
UM
14.8
15.6
20.7
24.0
27.2
28.1
27.7
28.3
28.4
22.0
19.8
15.5
28.4
LOW
ES
T M
AX
IMU
M-1.5
1.8
3.4
6.3
7.8
11.8
13.9
13.8
12.6
7.2
2.4
0.0
-1.5
HIG
HE
ST
MIN
IMU
M11.8
11.7
13.1
13.8
15.6
19.1
19.0
19.5
17.9
17.3
14.4
13.0
19.5
LOW
ES
T M
INIM
UM
-6.8
-5.2
-4.0
-2.3
0.6
3.6
6.5
3.3
2.4
-1.4
-4.0
-7.7
-7.7
ME
AN
NO
. OF
DA
YS
WIT
H A
IR F
RO
ST
2.6
3.0
1.3
0.4
0.0
0.0
0.0
0.0
0.0
0.2
0.8
2.8
11.0
ME
AN
NO
. OF
DA
YS
WIT
H G
RO
UN
D F
RO
ST
7.4
7.4
5.7
4.5
1.2
0.1
0.0
0.0
0.3
1.8
4.4
7.2
39.9
ME
AN
5 C
M S
OIL
5.8
5.7
7.0
9.3
12.8
15.6
16.8
16.2
13.8
10.6
7.9
6.4
10.6
ME
AN
10
CM
SO
IL6.1
6.0
7.2
9.0
12.2
15.0
16.4
15.9
13.9
10.9
8.4
6.7
10.6
ME
AN
20
CM
SO
IL6.7
6.7
7.8
9.6
12.6
15.2
16.6
16.4
14.7
11.8
9.2
7.4
11.2
RE
LA
TIV
E H
UM
IDIT
Y (
%)
ME
AN
AT
09
00
UT
C83.8
83.3
82.7
78.9
77.6
81.0
84.1
84.3
84.1
84.7
84.8
84.0
82.8
ME
AN
AT
15
00
UT
C
79.2
76.2
75.0
72.4
72.9
76.7
80.0
78.5
77.2
78.4
79.6
79.9
77.2
SU
NS
HIN
E (
ho
urs
)
ME
AN
DA
ILY
DU
RA
TIO
N
1.4
2.2
3.0
5.2
5.9
5.3
4.5
4.4
3.9
2.7
1.8
1.3
3.5
GR
EA
TE
ST
DA
ILY
DU
RA
TIO
N
7.6
9.0
10.9
13.4
15.3
15.9
15.1
13.9
11.8
9.5
8.1
6.5
15.9
ME
AN
NO
. OF
DA
YS
WIT
H N
O S
UN
10.9
7.4
6.9
3.3
2.8
3.4
4.0
3.2
3.8
6.4
8.5
11.2
71.8
RA
INFA
LL
(m
m)
ME
AN
MO
NT
HLY
TO
TAL
173.8
123.7
123.8
96.7
93.5
95.3
99.0
114.9
125.4
177.1
169.3
164.9
1557.4
GR
EA
TE
ST
DA
ILY
TO
TAL
48.5
51.6
48.6
55.1
38.2
51.8
45.5
88.8
94.3
51.7
80.9
69.9
94.3
ME
AN
NO
. OF
DA
YS
WIT
H >
= 0
.2 m
m
2219
2117
1717
1919
1922
2222
236
ME
AN
NO
. OF
DA
YS
WIT
H >
= 1
.0 m
m
1915
1713
1312
1414
1518
1918
187
ME
AN
NO
. OF
DA
YS
WIT
H >
= 5
.0 m
m
118
86
65
67
711
1010
95W
IND
(kn
ots
)
ME
AN
MO
NT
HLY
SP
EE
D
12.2
11.6
10.9
9.4
9.0
8.4
8.0
8.0
8.6
10.1
10.6
11.3
9.8
MA
X. G
US
T
8279
7365
6358
5360
6775
7088
88M
AX
. ME
AN
10
-MIN
UT
E S
PE
ED
49
4947
3839
3231
3640
4749
6060
ME
AN
NO
. OF
DA
YS
WIT
H G
AL
ES
2.4
1.5
0.9
0.2
0.3
0.0
0.0
0.1
0.1
0.8
1.0
1.5
8.8
WE
AT
HE
R (
ME
AN
NO
. OF
DA
YS
WIT
H..
.)
SN
OW
OR
SL
EE
T
1.0
0.8
0.7
0.3
0.0
0.0
0.0
0.0
0.0
0.0
0.1
0.7
3.7
SN
OW
LY
ING
AT
09
00
UT
C0.2
0.2
0.0
0.0
0.0
0.0
0.0
0.0
0.0
0.0
0.0
0.2
0.5
HA
IL
4.9
3.5
3.8
2.7
0.7
0.0
0.0
0.1
0.1
0.9
2.3
3.7
22.8
TH
UN
DE
R
1.3
0.6
0.5
0.2
0.3
0.2
0.5
0.5
0.3
0.7
0.9
0.5
6.6
FO
G0.5
0.3
0.4
0.9
1.2
1.7
1.7
1.3
0.8
0.6
0.5
0.4
10.2
TAB
LE
SO
FM
ON
TH
LYA
ND
AN
NU
AL
ME
AN
EX
TR
EM
EV
ALU
ES
FO
RO
TH
ER
SY
NO
PT
ICS
TAT
ION
SA
RE
AV
AIA
LB
LE
AT
HT
TP
://W
WW
.ME
T.IE
/CL
IMA
TE
-IRE
LA
ND
/30
YE
AR
-AV
ER
AG
ES.A
SP
