averaged dynamic topographies of the gulf of mexico
TRANSCRIPT
Averaged Dynamic Topographies of the Gulf of MexicoAuthor(s): Alyn C. DuxburySource: Limnology and Oceanography, Vol. 7, No. 3 (Jul., 1962), pp. 428-431Published by: American Society of Limnology and OceanographyStable URL: http://www.jstor.org/stable/2832957 .
Accessed: 14/06/2014 00:19
Your use of the JSTOR archive indicates your acceptance of the Terms & Conditions of Use, available at .http://www.jstor.org/page/info/about/policies/terms.jsp
.JSTOR is a not-for-profit service that helps scholars, researchers, and students discover, use, and build upon a wide range ofcontent in a trusted digital archive. We use information technology and tools to increase productivity and facilitate new formsof scholarship. For more information about JSTOR, please contact [email protected].
.
American Society of Limnology and Oceanography is collaborating with JSTOR to digitize, preserve andextend access to Limnology and Oceanography.
http://www.jstor.org
This content downloaded from 185.2.32.106 on Sat, 14 Jun 2014 00:19:21 AMAll use subject to JSTOR Terms and Conditions

428 NOTES AND COMMENT
AVERAGED DYNAMIC TOPOGRAPHIES OF THE GULF OF MEXICO
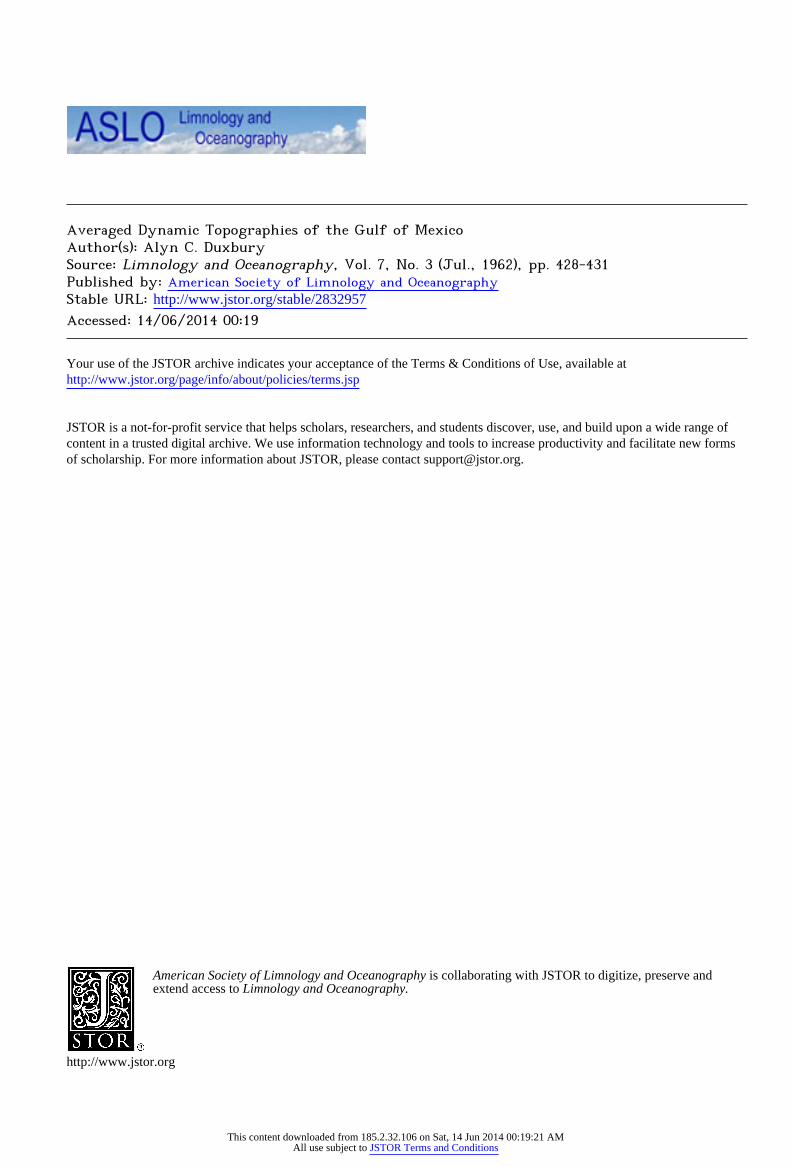
The general circulation pattern of the Gulf of Mexico still remains essentially un- known, especially in its westem region. In reviewing hydrographic data from the Gulf, it was found that a synoptic survey cover- ing the entire Gulf had never been made, but synoptic data were available for small discrete sections of the Gulf in various un- published reports prepared by the Depart- ment of Oceanography and Meteorology, A & M College of Texas. To, use these data, the assumption was made that the circula- tion of the Gulf is nearly constant and is changed only slightly by seasonal modifica- tions; therefore, all cruise data lending themselves to dynamic calculations were treated with equal weight regardless of their date of origin. Figure 1 shows the
spatial and temporal distributions of stations used in this analysis and Appendix A lists the references for the data. These data were then averaged by one degree squares to ob- tain a distribution of the averaged anoma- lies of dynamic height. It is hoped that treating the data in this manner will mask any seasonal fluctuations and produce a set of dynamic topographies which are indica- tive of the mean circulation pattern of the Gulf.
It is not the contention of the author that the dynamic topographies as presented in Figures 2, 3, and 4 are accurate to any high degree; however, these results are consistent with the partial topographies and current structures given in the various Texas A & M reports.
N ~~ ~ ~~~~~~~~~~~~~~~~~~~~~A.
_ .0~ ~~~~~~~~~~~~~~~~~~~~~~~~~~~~~~ U0 D
I .1. A A 0~~~~A. . C, I
*0 0.0 1. G
0 .~~~~~~~~~~~~~~~~~~~.r IF AE A J
F, ~~~~~~ ~~~~~'IF A0 M0* FO M~~~, J.A 'J A~~~~~~~~~~~~~~~ 0 .0 *0 _D BE. F ~~~~~~~~~~~~~~~~~~~~~FA I.G* M~~~~~~~~~~~~ p~~~~~~~~~~
01 A
.14 A J~~~~~~~~~~~~~~~~~~
S A 0~~~~~~~~~~~~~~SA,E N 0 .0~~~~~~~~~~~~~~~~~~~~~~D -.
M*A -J J -A.-
EL C.~~~~~~~~~~~~~~~~~~~~~~~~~~~~K CE.D
F *A .
IC~~~~~~~~~~MI J
I .
.0 - CRUISE GYMS MOE CRUISE GYAMO. MOICAD.TDS LM *ARA A APR C A501 A
UGS
At A A~~~~~~ - 1562-AC A MAO-~~~~~~~ AJOS AS-A5 FBUR ,FA D0LA ~ lASM GA-A J 55- PI
EL N~~~~~~~~~~~ MRA GMMA I lAT-CC S-AS
ABA AMA 54A 55~~~~~~~~~~ SG~~~ 55. SB AS~~~~~~~~ AM~~~ 5G~~~ Ak F~~~~~p M LIG 1. Staiotch rt
This content downloaded from 185.2.32.106 on Sat, 14 Jun 2014 00:19:21 AMAll use subject to JSTOR Terms and Conditions
NOTES AND COMMIENT 429
tCs Ct~~~~~~~~~~~~~OII
/ \ - / 8 HE>T LY /\/0\/-,4 / // o.0 1 t tX000 D R K E t < / g~~~~~~~~~~~~-.0-.
/ / / / A / / J y XNTERVAL 05 D~~~ ~~ ~~~~YNA AtJC H E T E /
4L<~~~~~~~~~~~~~~~~~~~~~~~~~O TH ,0 _EBA SUFC * ~ ~~~~~~~~~~~~~~~~~~~~~~~~~~~~~~~~~ O O OF9 4
9AC TS AE
T
BM7 E e 42 ?
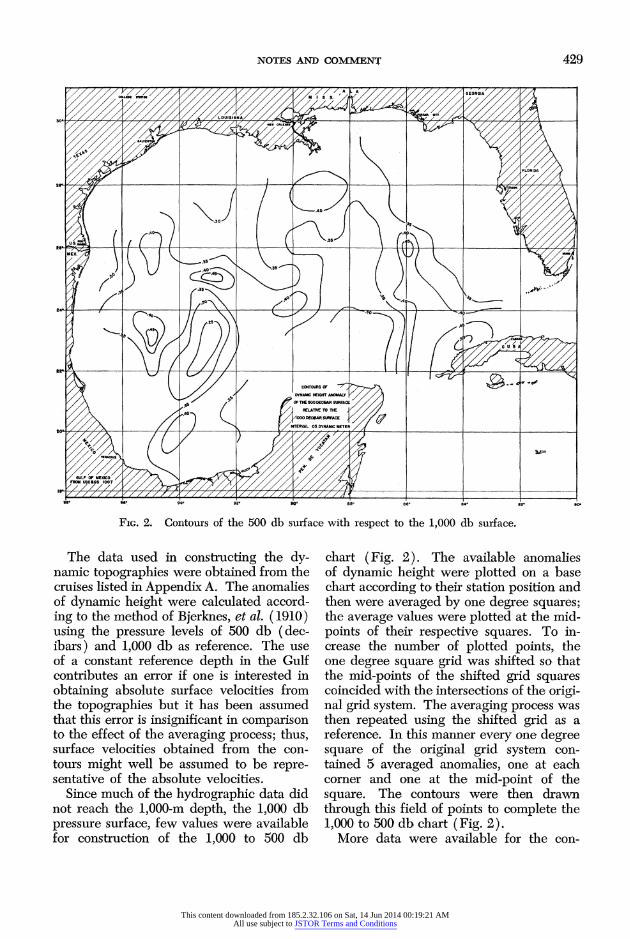
FIG. 2. Contours of the 500 db surface with respect to the 1,000 db surface.
The data used in constructing the dy- namic topographies were obtained from the cruises listed in Appendix A. The anomalies of dynamic height were calculated accord- ing to the method of Bjerknes, et al. (1910) using the pressure levels of 500 db (dec- ibars) and 1,000 db as reference. The use of a constant reference depth in the Gulf contributes an error if one is interested in obtaining absolute surface velocities from the topographies but it has been assumed that this error is insignificant in comparison to the effect of the averaging process; thus, surface velocities obtained from the con- tours might well be assumed to be repre- sentative of the absolute velocities.
Since much of the hydrographic data did not reach the 1,000-m depth, the 1,000 db pressure surface, few values were available for construction of the 1,000 to 500 db
chart (Fig. 2). The available anomalies of dynamic height were plotted on a base chart according to, their station position and then were averaged by one degree squares; the average values were plotted at the mid- points of their respective squares. To in- crease the number of plotted points, the one degree square grid was shifted so that the mid-points of the shifted grid squares coincided with the intersections of the origi- nal grid system. The averaging process was then repeated using the shifted grid as a reference. In this manner every one degree square of the original grid system con- tained 5 averaged anomalies, one at each corner and one at the mid-point of the square. The contours were then drawn through this field of points to complete the 1,000 to 500 db chart (Fig. 2).
More data were available for the con-
This content downloaded from 185.2.32.106 on Sat, 14 Jun 2014 00:19:21 AMAll use subject to JSTOR Terms and Conditions
430 NOTES AND COMMENT
'0~~~~~~~~~~~~~~~~~~~~~~~~~~~~~~~~~~~~~~~~10
/ / / / A > 0 / / IH~~~~~~~~~~~~~~TERVAL .05 DYNAUtC METER/
i EXI1 AA ! X
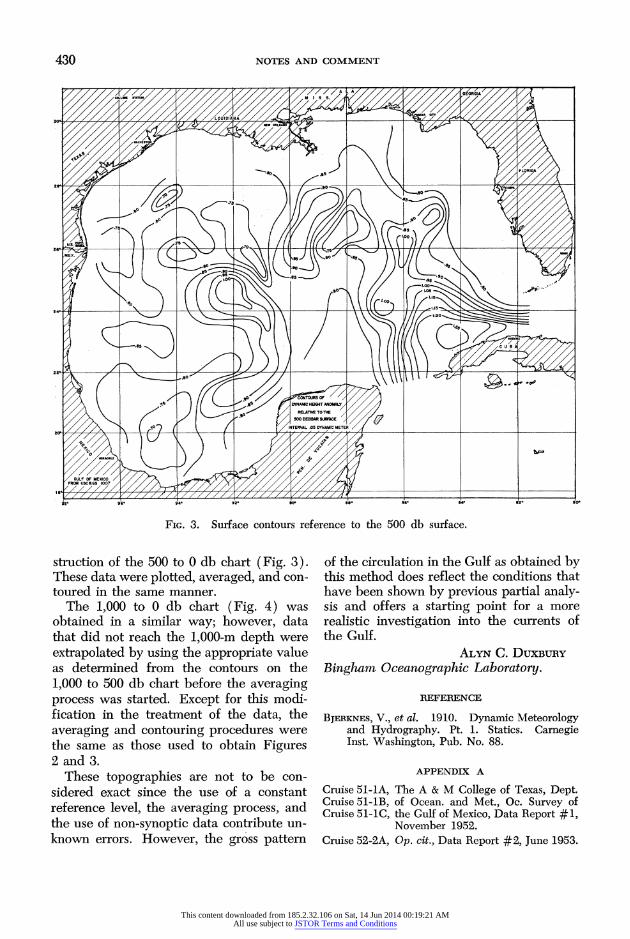
FIG. 3. Surface contours reference to the 500 db surface.
struction of the 500 to 0 db chart (Fig. 3). These data were plotted, averaged, and con- toured in the same manner.
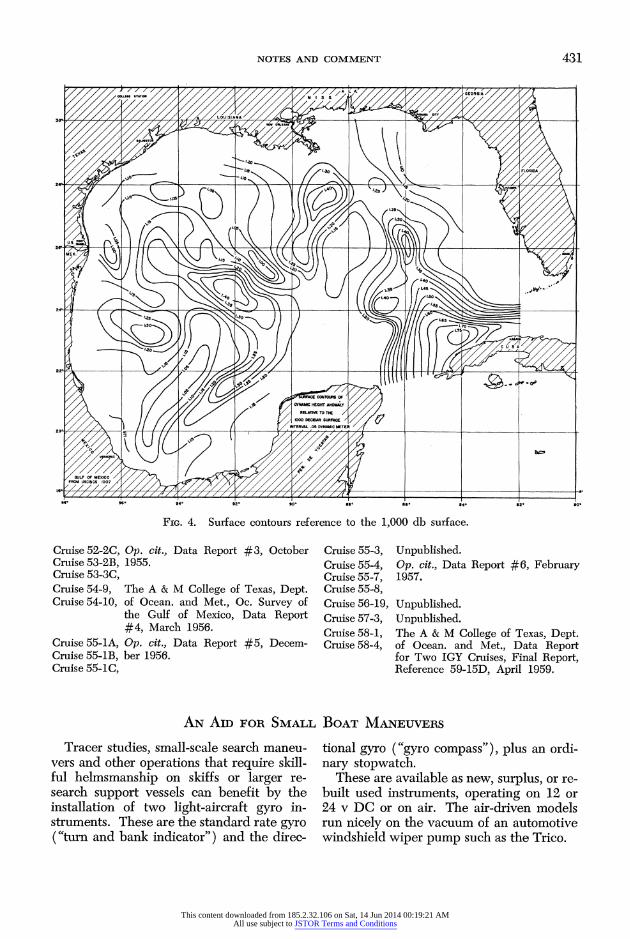
The 1,000 to 0 db chart (Fig. 4) was obtained in a similar way; however, data that did not reach the 1,000-m depth were extrapolated by using the appropriate value as determined from the contours on the 1,000 to 500 db chart before the averaging process was started. Except for this modi- fication in the treatment of the data, the averaging and contouring procedures were the same as those used to obtain Figures 2 and 3.
These topographies are not to be con- sidered exact since the use of a constant reference level, the averaging process, and the use of non-synoptic data contribute un- known errors. However, the gross pattern
of the circulation in the Gulf as obtained by this method does reflect the conditions that have been shown by previous partial analy- sis and offers a starting point for a more realistic investigation into the currents of the Gulf.
ALYN C. DUXBURY Bingham Oceanographic Laboratory.
REFERENCE
BJERKNES, V., et al. 1910. Dynamic Meteorology and Hydrography. Pt. 1. Statics. Carnegie Inst. Washington, Pub. No. 88.
APPENDIX A
Cruise 51-lA, The A & M College of Texas, Dept. Cruise 51-IB, of Ocean. and Met., Oc. Survey of Cruise 51-IC, the Gulf of Mexico, Data Report #1,
November 1952. Cruise 52-2A, Op. cit., Data Report #2, June 1953.
This content downloaded from 185.2.32.106 on Sat, 14 Jun 2014 00:19:21 AMAll use subject to JSTOR Terms and Conditions
NOTES AND COMMENT 431
OUIS . / A
a/{~~~~~~~~~~~~~~~~~~~~~~~~~~~~~~~~~~~~~~~~~~~I S E
sr 55 54' 52' 30' *~~ ~ ~~~ ~ ~~~ ~ ~ ~ ~ ~ ~~~~30 F6 4 2 e
FIG. 4. Surface contours reference to the 1,000 db surface.
Cruise 52-2C, Op. cit., Data Report #3, October Cruise 53-2B, 1955. Cruise 53-3C, Cruise 54-9, The A & M College of Texas, Dept. Cruise 54-10, of Ocean. and Met., Oc. Survey of
the Gulf of Mexico, Data Report #4, March 1956.
Cruise 55-lA, Op. cit., Data Report #5, Decem- Cruise 55-1B, ber 1956. Cruise 55-IC,
Cruise 55-3, Unpublished. Cruise 55-4, Op. cit., Data Report #6, February Cruise 55-7, 1957. Cruise 55-8, Cruise 56-19, Unpublished. Cruise 57-3, Unpublished. Cruise 58-1, The A & M College of Texas, Dept. Cruise 58-4, of Ocean. and Met., Data Report
for Two IGY Cruises, Final Report, Reference 59-15D, April 1959.
AN AID FOR SMALL BOAT MANEUVERS
Tracer studies, small-scale search maneu- vers and other operations that require skill- ful helmsmanship on skiffs or larger re- search support vessels can benefit by the installation of two light-aircraft gyro in- struments. These are the standard rate gyro ("turn and bank indicator") and the direc-
tional gyro ("gyro compass"), plus an ordi- nary stopwatch.
These are available as new, surplus, or re- built used instruments, operating on 12 or 24 v DC or on air. The air-driven models run nicely on the vacuum of an automotive windshield wiper pump such as the Trico.
This content downloaded from 185.2.32.106 on Sat, 14 Jun 2014 00:19:21 AMAll use subject to JSTOR Terms and Conditions