average annual precipitation and runoff in · average annual precipitation and runoff in north...
TRANSCRIPT
DEPARTMENT OF THE INTERIOR UNITED STATES GEOLOGICAL SURVEY
TO ACCOMPANY MAP HA- 298
AVERAGE ANNUAL PRECIPITATION AND RUNOFF IN NORTH COASTAL CALIFORNIA
by
S. E. Rantz
INTRODUCTION
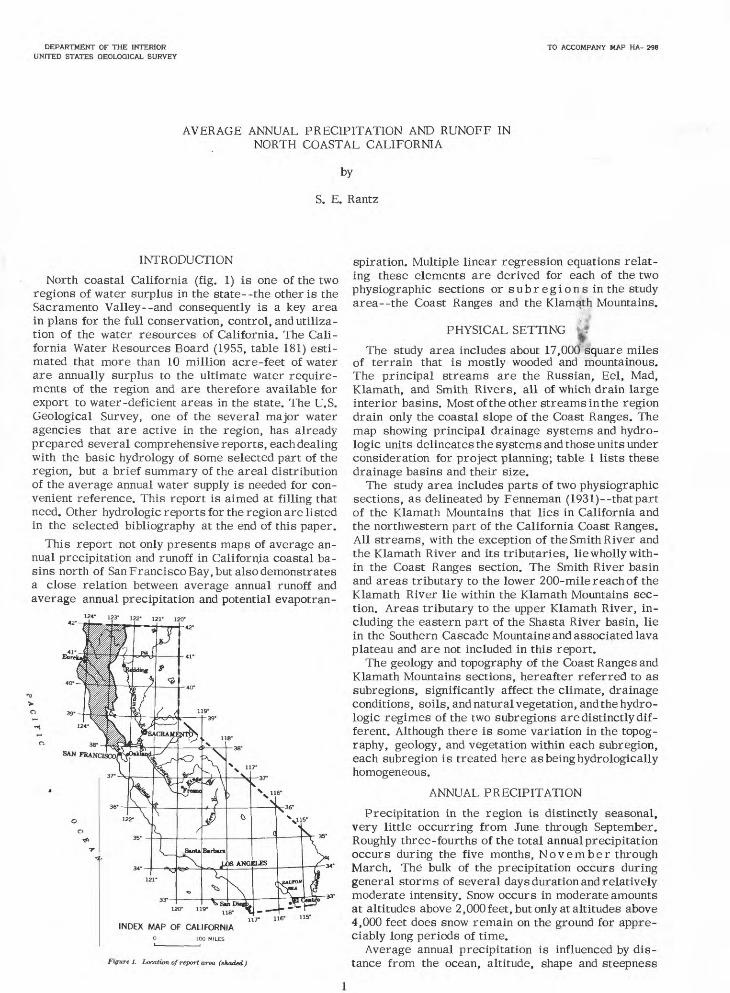
North coastal California (fig. 1) is one of the two regions of water surplus in the state--the other is the Sacramento Valley--and consequently is a key area in plans for the full conservation, control, and utiliza tion of the water resources of California. The Cali fornia Water Resources Board (1955, table 181) esti mated that more than 10 million acre-feet of water are annually surplus to the ultimate water require ments of the region and are therefore available for export to water-deficient areas in the state. The U.S. Geological Survey, one of the several major water agencies that are active in the region, has already prepared several comprehensive reports, each dealing with the basic hydrology of some selected part of the region, but a brief summary of the areal distribution of the average annual water supply is needed for con venient reference. This report is aimed at filling that need. Other hydrologic reports for the region are listed in the selected bibliography at the end of this paper.
This report not only presents maps of average an nual precipitation and runoff in California coastal ba sins north of San Francisco Bay, but also demonstrates a close relation between average annual runoff and average annual precipitation and potential evapotran-
122- 121' 120-
spiration. Multiple linear regression equations relat ing these elements are derived for each of the two physiographic sections or subregions in the study area --the Coast Ranges and the Klama,th Mountains.
PHYSICAL SETTING
INDEX MAP OF CALIFORNIA0 100 MILES
Figure 1. Location of report area (skaded)
The study area includes about 17,000 square miles of terrain that is mostly wooded and mountainous. The principal streams are the Russian, Eel, Mad, Klamath, and Smith Rivers, all of which drain large interior basins. Most of the other streams in the region drain only the coastal slope of the Coast Ranges. The map showing principal drainage systems and hydro- logic units delineates the systems and those units under consideration for project planning; table 1 lists these drainage basins and their size.
The study area includes parts of two physiographic sections, as delineated by Fenneman (1931)- -that part of the Klamath Mountains that lies in California and the northwestern part of the California Coast Ranges. All streams, with the exception of the Smith River and the Klamath River and its tributaries, lie wholly with in the Coast Ranges section. The Smith River basin and areas tributary to the lower 2 00- mile reach of the Klamath River lie within the Klamath Mountains sec tion. Areas tributary to the upper Klamath River, in cluding the eastern part of the Shasta River basin, lie in the Southern Cascade Mountains and associated lava plateau and are not included in this report.
The geology and topography of the Coast Ranges and Klamath Mountains sections, hereafter referred to as subregions, significantly affect the climate, drainage conditions, soils, and natural vegetation, and the hydro- logic regimes of the two subregions are distinctly dif ferent. Although there is some variation in the topog raphy, geology, and vegetation within each subregion, each subregion is treated here as being hydrologically homogeneous.
ANNUAL PRECIPITATION
Precipitation in the region is distinctly seasonal, very little occurring from June through September. Roughly three-fourths of the total annual precipitation occurs during the five months, November through March. The bulk of the precipitation occurs during general storms of several days duration and relatively moderate intensity. Snow occurs in moderate amounts at altitudes above 2, OOOfeet, but only at altitudes above 4,000 feet does snow remain on the ground for appre ciably long periods of time.
Average annual precipitation is influenced by dis tance from the ocean, altitude, shape and steepness
1
of mountain slopes, and direction of slopes in relation to the moisture-bearing winds. As a rule, precipitation increases from south to north and is much heavier on southern and western mountain slopes than on north ern and eastern slopes. This is seen on the map which presents a generalized picture of the areal distri bution of average annual precipitation. The map of average annual precipitation combines maps presented in two earlier reports (Rantz, 1964; Rantz and Thomp son, 1967). The 1964 report, which covered the north ern part of the study area, used the period 1900-59. as a base for its average annual precipitation map; the average annual precipitation map in the 1967 report, covering the southern part of the study area, used the period 1931-63 as a base. However, examination of long-term (80-year) precipitation records in the study area shows that records for either of the two base periods are representative of those for the long-term, and the map of average annual precipitation in this report, therefore, is properly a map of long-term av er age annual precipitation. The wide range of values is striking; precipitation decreases from a high of 120 inches in the northwest to a low of 20 inches in the southeast.
Average annual precipitation for the basins listed in table 1 was estimated in the two cited reports by planimetering the average annual precipitation maps. It is recognized that estimates of basinwide precipi tation, obtained for this rough mountainous country from the existing network of precipitation stations, are not precise; these estimates are satisfactory in dexes of precipitation, however. The basinwide av erages are given in table 1.
ANNUAL RUNOFF
The runoff pattern in the study area is influenced not only by the distribution of precipitation, but also by the geology and topography. In the Coast Ranges subregion the mountains are relatively low and there is therefore little snowmelt runoff. Because of the shallowness of the soil and low permeability of the soil and surficial rock, the bulk of the runoff in the subregion occurs during and shortly after the rains of late fall and winter and base flow is poorly sustained. In the Klamath Mountains subregion a large part of the area is above 5,000 feet in altitude. Much of the winter precipitation is therefore stored as snow, and in ad dition to the storm runoff in winter, a large amount of snowmelt runoff occurs in late spring. The soil and surficial rock are more permeable in the Klamath Mountains than in the Coast Ranges subregion, and base flow is therefore better sustained.
Average annual runoff in the study area totals about 31 million acre-feet, which is the equivalent of about 34 inches of water over the entire area. Average an nual runoff for each of the basins listed in table 1 had been obtained for the two previously cited hydrology reports, either from long-term streamflow records or from short-term records whose time base was ex tended by correlation with long-term records. The long-term basinwide averages are given in table 1; they range from 7 to 90 inches.
Subtraction of basin runoff from basin precipitation gives the basin water loss. Average annual loss in the study area ranges from 18 to 36 inches and averages about 25 inches, as shown in table 1.
DERIVATION OF AVERAGE ANNUAL PRECIPITA TION-RUNOFF RELATIONS
As a preliminary step in preparing a map of average annual runoff, it was necessary to derive a precipita tion-runoff relation for the region. The derivation is described in detail here because the technique may prove to be useful in hydrologic studies for other humid regions. The reasoning used in the derivation was as follows. By definition,
R = P - L, (1)
R= average annual runoff, in inches
where
P = average annual precipitation, in inches, and
L = average annual water loss, in inches.
It was hypothesized that in a humid region, such as north coastal California, where the annual precipitation is generally equal to or greater than the annual po tential evapotranspiration, the annual water loss will be virtually independent of the annual precipation, and will depend almost entirely on the climatic conditions that effect evapotranspiration. The annual water loss will therefore be related almost entirely to the annual potential evapotranspiration. This would be partic ularly true of the Coast Ranges subregion, whereabout 75 percent of the precipitation and about 80 percent of the runoff occur during the period of November through March, when the evapotranspiration demand is light. In the Klamath Mountains subregion where snow- melt maintains the runoff at a significant level until midsummer, it was expected that annual precipitation would be a small, but significant factor, in the water loss. In other words, we would expect the equation for average annual water loss to be,
= K+aP+b (PET), (2)
where
PET is average annual potential evapotran spiration, in inches,
and
K, a, and b are constants.
In addition, we would expect the value of a, the pre cipitation coefficient, to be small for the Klamath Mountains subregion., and probably zero for the Coast Ranges subregion.
When we substitute equation 2 in equation 1, we ob tain
R = P - [K+aP+b (PET)], or
R = (1 - a) P - b (PET) - K (3)
To apply equation 3 it is necessary to have an index of average annual potential evapotranspiration. A com monly used index of that type is the average annual evaporation from the surface of water bodies, such as lakes and reservoirs. A generalized map of average annual lake evaporation in the United States is available (Kohler and others, 1959, pi. 2), and a part of that map has been reproduced in this report. The map of average annual evaporation was used to determine the average annual potential evapotranspiration for the basins
listed in table 1. The values of R, P, and PET listed in table 1 were then used in a least-squares deter mination of the constants in equation 3. Separate deter minations were made for the Coast Ranges subregion (75 basins) and for the Klamath Mountains subregion (24 basins), because of the differing hydrologic char acteristics of the two subregions. Because equation 3 is linear, basinwide average values of the variables from table 1 could be used in the determination of the runoff equations, regardless of the fact that these variables often had a wide range of values within the larger individual basins.
The regression equations obtained for computing runoff were as follows:
Coast Ranges:R - 1.00 P - 0.40 (PET) - 9.1
Klamath Mountains:R - 0.93 P - 0.32 (PET) - 8.1
(4)
(5)
These equations confirm our hypothesis; a in equation 3 is zero for the Coast Ranges subregion and small (0.07) for the Klamath Mountains subregion. For the Coast Ranges regression equation, the correlation coefficient is 0.964 and the standard error of estimate of R is 3.9 inches; for the Klamath Mountains regres sion equation, the correlation coefficient is 0.994 and the standard error is 2.6 inches. Table 1 lists the computed values of average annual runoff for each basin, and the percentages by which these computed values differed from the actual runoff values. For some of the basins that have relatively light, runoff, the percentage differences were quite large. This was due primarily to inherent inaccuracies in the gener alized maps of average annual precipitation and po tential evapotranspiration that were used to obtain basinwide values of those two parameters. Another probable reason for discordant results was the as sumption of hydrologic homogeneity within the sub- regions. The variability of other factors that areper- tinent in the hydrologic equation, such as degree of forestation and surficial rock type, could have been considered, but most of these factors are difficult to measure and evaluate. In view of these difficulties and the uncertainties connected with the basic data, refinement of equations 4 and 5 by the inclusion of additional variables was not warranted.
CONSTRUCTION OF" MAP OF AVERAGE ANNUAL RUNOFF
The runoff map was constructed by applying the following procedure:
1. A network of points, consisting of intersections of a grid system, was established on the map. Each point represented an area of approxi mately 70 square miles.
2. The maps of mean annual precipitation and evaporation were used to determine the pre cipitation and potential evapotranspiration for each point.
3. The appropriate equation--either equation 4 or 5--was used to compute the average annual runoff for each point.
4. Lines of equal runoff were then drawn in proper position relative to the points, using the av erage annual precipitation map as a guide to shape the lines.
The average annual runoff for each of the basins listed in table 1 was determined from the lines of equal run off and compared with the actual basinwide value. Be cause runoff computed from equations 4 and 5 did not always closely match the actual runoff, there were discrepancies in some basins between actual runoff and that indicated by the derived runoff map. Where such discrepancies occurred, the lines of equal run off were adjusted for consistency with actual basinwide figures.
The runoff map provides a convenient visual ref erence to the magnitude and distribution of average annual runoff in north coastal California.
SELECTED BIBLIOGRAPHY
Back, William, 1957, Geology and ground-water fea tures of Smith River plain, Del Norte County, Cali fornia: U.S. Geol. Survey Water-Supply Paper 1254, 76 p.
California Department of Water Resources, 1964, Klamath River basin investigation: Bull. 83, 198p.
___1964, Shasta Valley investigation: Bull. 87,170p.___1964, North coastal area investigation: Bull. 136,
160 p.1965, Water resources and future water require
ments, north coastal hydrographic area, southern portion: Bull. 142-1, 450 p.
California Water Resources Board, 1955, Water utili zation and requirements of California: Bull. 2, 227 p.
Cardwell, G. T., 1958, Geology and ground water in the Santa Rosa and Petaluma Valley areas, Sonoma County, California: U.S. Geol. Survey Water-Supply Paper 1427, 273 p.
___1965, Geology and ground water in Russian River Valley areas and in Round, Laytonville, and Little Lake Valleys, Sonoma and Mendocino Counties, California: U.S. Geol. Survey Water-Supply Paper 1548, 154 p.
Evenson, R. E., 1959, Geology and ground-water fea tures of the Eureka area, Humboldt County, Cali fornia: U.S. Geol. Survey Water-Supply Paper 1470, 80 p.
Fenneman, R M., 1931, Physiography of Western United States: New York, McGraw-Hill Book Co., 534 p.
Kohler, M. A., Nordenson, T. J., and Baker, D. R., 1959, Evaporation maps for the United States: U.S. Weather Bureau Tech. Paper 37, 13 p.
Kunkel, Fred, and Upson, J. E., 1960, Geology and ground water in Napa and Sonoma Valleys, Napa and Sonoma Counties, California: U.S. Geol. Survey Water-Supply Paper 1495, 252 p.
Mack, Seymour, 1958, Geology and ground-water fea tures of Scott Valley, Siskiyou County, California: U.S. Geol. Survey Water-Supply Paper 1462, 98 p.
___1960, Geology and ground-water features of Shasta Valley, Siskiyou County, California: U.S. Geol. Survey Water-Supply Paper 1484, 115 p.
Poole, J. L., 1961, Water-resources reconnaissance of Hoopa Valley, Humboldt County, California: U.S. Geol. Survey Water-Supply Paper 1576-C, 18 p.
Rantz, S. E., 1964, Surface-water hydrology of coastal basins of northern California: U.S. Geol. Survey Water-Supply Paper 1758, 77 p.
Rantz, S. E., and Thompson, T. H., 1967, Surface- in California except Central Valley: U.S,water hydrology of California coastal basins be- Geol. Survey Water-Supply Paper 1315-B, 413 p. tween San Francisco Bay and Eel River: U.S. Geol. U.S. Geological Survey, 1964, Compilation of recordsSurvey Water-Supply Paper 1851, 60 p. of surface waters of the United States, October
U.S. Geological Survey, I960, Compilation of records 1950 to September I960, Part 11, Pacific slopeof surface waters of the United States through basins in California: U.S. Geol. Survey Water-September 1950, Part 11-A, Pacific slope basins Supply Paper 1735, 715 p.