automatic control for oxygen intake via nasal · pdf fileautomatic control for oxygen intake...
TRANSCRIPT

Abstract— In the present, oxygen supplying using nasal
cannula is the first aide for a patient who has the problems in
respiratory system by example in a newborn baby in which the
incompetence of respiratory system on early days of birth is
concerned. An indicator of this kind of symptom is physiological
Jaundice, yellowish discoloration of the skin. Direct oxygen
intake is a usual caretaking for this group of patients. Basically
manual valve control of feeding oxygen by caretaker is a
treatment by using pulse oximetry value as monitoring of
effectiveness. This treatment is either time or labor consuming
in a corona care unit. The purpose of this research is to develop
an automatic control for oxygen intake. By studying the
mechanism of arterial oxygen saturation in blood (SaO2) under
the partial pressure of feeding oxygen (PiO2), the effective model
can be applied as control value of oxygen for this group of
patient.
Index Terms— Pulse Oximeter, SpO2, Oxyhemoglobin
dissociation curve, SaO2, PaO2, Alveolar air equation, PiO2,
Oxygen, Nasal Cannula.
I. INTRODUCTION
At present, the primary aiding device for a patient who has
a problem concerning in respiratory system is respirator
called “Nasal Cannula” [1]. The device helps to deliver
oxygen in rate of fraction of inspired oxygen (FiO2) of
0.24-0.44 which depends on arterial oxygen saturation in
blood of the patient.
Nasal Cannula is a simple, not expensive medical device.
The oxygen intake via this device depends on a difference
between the controlled pressure of a gas source and nasal
pressure. In fact the effectiveness of treatment by this device
depends on lung pathology, the potential of physician to
select the proper quantity of intake and also tending while
using the device [2]-[4].
We propose in this paper a new computer based system
combining to the nasal cannula for automatically controlling
quantity of oxygen intake. By using a pulse oximeter as
indicator for arterial oxygen saturation in blood (SaO2) in the
feedback loop control, oxygen intake needed, calculated from
the model is fed via controlled valves. The process operates
on a microcomputer programmed on the LabVIEW™.
The performances of the proposed system were evaluated
at the Biomedical Instrument Calibration Unit, Siriraj
Hospital, Bangkok, Thailand. The BIO-TEK model index2
series SpO2 simulators to generate functional pulsatile
Manuscript received January 13, 2010.
Deacha Chumlert, Anan Wongjan, and Kitiphol Chitsakul are with
Faculty of Engineering, King Mongkut’s Institute of Technology
Ladkrabang, Bangkok, 10520 Thailand (phone: 662-326-4222; fax:
662-739-2398; e-mail: [email protected], [email protected],
oxygen saturation levels (%SpO2) and pulse rate levels,
MASIMO pulse oximeter model Rad-9 and HUMONICS
model 730 digital flow-meter were employed, respectively.
Test results demonstrating close agreement with reference
signals are also presented.
II. PROCEDURE MEASUREMENT DESCRIPTION
A. Proposed Measurement and Control Concept
Fig. 1. Proposed measurement and control concept.
Block diagram of operation and main components of the
designed system applied to BIO-TEK model index2 series
SpO2 simulators is shown in Fig. 1 consisting of;
1) Pulse oximeter,
2) Computer control with LabVIEW™,
3) USB to DAQ (Data Acquisition) interface,
4) Flow control device,
5) Oxygen container,
6) Nasal Cannula.
The pulse oximetry probe was placed on the simulator of
neonate. There were two parameters monitored on the
assessments, SpO2 rate which shown the hemoglobin
saturation of the object and heart rate pulse which normally is
60-80 beats/minute [5]. Normally initial pulse oximetry
values are obtained in one to three minutes after cord
clamping. Oxygen intake are needed when the hemoglobin
saturation is indicated below 89 – 94 % such as found in
newborn baby who had physiological jaundice or yellowish
discoloration of the skin marked arterial desaturation during
the early neonatal period [6].
The MASIMO pulse oximeter model Rad-9 was connected
to the PC via the serial port (RS232) in order to transfer SpO2
data used in the process. The rate of partial pressure of
oxygen in arterial blood (PaO2) was then calculated from the
model to obtain FiO2 rate form the Alveolar air equation.
Automatic Control for Oxygen Intake via Nasal
Cannula
Deacha Chumlert, Anan Wongjan, and Kitiphol Chitsakul, Members, IAENG

Finally, Oxygen supplied rate needed
cannula was estimated by using FiO2 rate
section D). The suitable oxygen supplied
adjusted by a controlling valve installed between supplying
source (oxygen tank) and nasal cannula.
B. Pulse Oximeter
Pulse oximeter is currently used in a variety of clinical
settings for noninvasive and continuous monitoring of
arterial oxygenation in adults, children and infants.
provides reliable measurement, display and alerts for,
functional pulsatile oxygen saturation (Sp
[7].
Functional Saturation ������������
where HbO2 is Fractional Hemoglobin, COHb is
hemogiobin, and METHb is Methemoglobin
Equation (1) is a functional saturation
amount of oxyhemoglobin as a percentage of the
that can be oxygenated. Dysfunctional hemoglobins (COHb
and METHb) are not included in the measurement of
functional saturation. Pulse Rate is calculated by measuring
the time interval between the peaks of the
waveform. The inverse of this measurement is
pulse rate.
Pulse oximeter can communicate with other devices using
the built-in RS232 compatible serial port. Several serial
communications modes are available. They include
format mode. Default mode is usually
purpose data collection.
C. Oxyhemoglobin dissociation curve
The oxygen dissociation curve (ODC)
(Hb) has been widely studied and mathematically described
for nearly a century. Numerous mathematical models have
been designed to predict with ever-increasing accuracy the
behavior of oxygen transport by Hb in differing conditions of
pH, carbon dioxide, temperature,
Hb levels, and 2,
3-diphosphoglycerate concentrations that enable
applications in various clinical situations. The modeling
techniques employed in many existing models are notably
borrowed
from advanced and highly sophisticated
mathematics that are likely to surpass the comprehensibility
of many medical and bioscience.
A close observation of its sigmoidal shape
reveals a couple of unique properties, namely, that oxygen
saturation (SaO2) approaches a horizontal asymptote as
exceeds 70 mmHg, while it declines precipitously down the
steep slope toward a point of inflexion when
"shoulder" of the ODC below 60 mmHg.
One of the earliest mathematical descriptions of the ODC
of Hb is the well-known Hill's equation a simple equation
proposed in 1910 by Archibald Vivian Hill (1886
British physiologist and Nobel laureate in Physiology or
Medicine [10]. S���� , saturation of Hbassociation constant of HbO�; n, Hill coefficient, as in
S���� ����������
needed as input to nasal
rate (as shown in the
supplied rate could be
ed by a controlling valve installed between supplying
a variety of clinical
settings for noninvasive and continuous monitoring of
arterial oxygenation in adults, children and infants. It
provides reliable measurement, display and alerts for,
functional pulsatile oxygen saturation (SpO2) and pulse rate
����������� ��! (1)
, COHb is Carboxy-
Methemoglobin [8].
s a functional saturation represents the
amount of oxyhemoglobin as a percentage of the hemoglobin
xygenated. Dysfunctional hemoglobins (COHb
are not included in the measurement of
Pulse Rate is calculated by measuring
the time interval between the peaks of the infrared light
measurement is displayed as
can communicate with other devices using
serial port. Several serial
communications modes are available. They include full
is usually used for general
The oxygen dissociation curve (ODC) [9] of hemoglobin
widely studied and mathematically described
Numerous mathematical models have
reasing accuracy the
Hb in differing conditions of
Hb levels, and 2,
diphosphoglycerate concentrations that enable
their
applications in various clinical situations. The modeling
employed in many existing models are notably
from advanced and highly sophisticated
likely to surpass the comprehensibility
A close observation of its sigmoidal shape in Fig. 2 quickly
a couple of unique properties, namely, that oxygen
) approaches a horizontal asymptote as PaO2
exceeds 70 mmHg, while it declines precipitously down the
slope toward a point of inflexion when PaO2 falls off the
One of the earliest mathematical descriptions of the ODC
known Hill's equation a simple equation
in 1910 by Archibald Vivian Hill (1886-1977), a
physiologist and Nobel laureate in Physiology or
HbO� ; K�#�� , net
, Hill coefficient, as in
(2)
Fig. 2. Oxygen dissociation curves (ODCs) for human
hemoglobin (Hb) at 3 different p
the curves is due to the fact that Hb begins to absorb
rapidly when PaO2 levels are between 20 and 40 mmHg.
Bohr effect is illustrated here by the shift of the curve to the
right as pH decreases. [Reproduced, with kind
from Prof. Dave McShaffrey (
mcshaffd).]
S�#�� $
� �
These models are unquestionably more complex.
it is helpful to introduce students of physiology and
biomedicine to the ODC by using only the simplest
mathematical principles to achieve better understanding,
from which the more discerning and interested with greater
mathematical aptitude may subseq
more complex models if they so desire.
Consider the oxygenation of a Hb molecule as four
sequential steps, given that each of the four heme groups
within the two α-globin and two
molecule of oxygen.
This expression is readily identifiable
having a form similar to the Hill's equation.
SaO2, can be stated as [11]
SaO��%! &'&() '*+,-.'/)'�01&'&()
SaO� $���� � $��
Let x = PaO2, where PaO2 is the partial pressure of oxygen,
and let y = SaO2, such that we can then represent
algebraically with y as a functio
2 34� � 3
The configuration of this mathematical relation
solved by determining the presence of any turning points,
points of inflexion, and horizontal or vertical asymptotes.
Hence, differentiating y with respect to
second derivative of x to determine the
points of inflexion along the curve.
dy/dx with respect to x yields.
value of y = SaO2 from (6) is 37.5
PaO2 is 22.4 mmHg.
Oxygen dissociation curves (ODCs) for human
hemoglobin (Hb) at 3 different pH levels. The "S" shape of
the curves is due to the fact that Hb begins to absorb oxygen
levels are between 20 and 40 mmHg. The
Bohr effect is illustrated here by the shift of the curve to the
right as pH decreases. [Reproduced, with kind permission,
from Prof. Dave McShaffrey (http://www.marietta.Edu/
$567�����8� $567�����8
(3)
These models are unquestionably more complex. As such,
it is helpful to introduce students of physiology and
biomedicine to the ODC by using only the simplest
principles to achieve better understanding,
discerning and interested with greater
aptitude may subsequently delve further to
if they so desire.
Consider the oxygenation of a Hb molecule as four
each of the four heme groups
globin and two β-globin chains binds to a
This expression is readily identifiable as
having a form similar to the Hill's equation. Refer to (3).
'*+,-.'/)'�01&'&() �� 9 100 (4)
� ��<����<
(5)
is the partial pressure of oxygen,
, such that we can then represent (5)
as a function of x as follows:
4<34< (6)
The configuration of this mathematical relation can be
solved by determining the presence of any turning points,
points of inflexion, and horizontal or vertical asymptotes.
with respect to x and examine the
to determine the existence of any
points of inflexion along the curve. Hence, differentiating
yields. This point of inflexion, the
is 37.5 % and = >3/�5K!<, x =

D. Alveolar air equation
The partial pressure of oxygen in alveoli (PAO2) is a partial
pressure which the crucial step before the gas exchange
happened and also specified the variation of oxygenation
which helps to monitor the cure result and for understanding
clearly the pathology. The oxygen is transferred to cell by
simply principle because normally the oxygen is absorbed
from high to low intense that called “Diffusion” effected to
oxygen deficit [12].
At the atmospheric pressure 760 mmHg, consisted of FiO2
0.21 and PiO2 (partial pressure of inspired oxygen) 159.6
mmHg therefore we search for PiO2 from the equation as
below
BCD� ECD� 9 BF (7)
The alveolar gas equation [13] for calculating PAO2 is
essential to understanding any PaO2 value and in assessing if
the lungs are properly transferring oxygen into the blood. To
clinically interpret PaO2 [14] one has to also know the
patient's partial pressure of carbon dioxide in arterial blood
(PaCO2), FiO2 and the PB (barometric pressure), all
components of the equation for PAO2 :
BGD� �713 9 ECD�! I JKLM��.OP (8)
Find VE (Minute Ventilation) from VT (Tidal volume) and f
(Respiratory rate) , then we get [15]
QR QS 9 T (9)
UVW BXYD� 9 QR Z[\ BXYD� 9 QR (10)
T]^_ JKLM�`� 9 Tabc (11)
Solve oxygen (O2) from nasal cannula
D��UXdX[ eXUUf[X! gh� 9 ij] k
g�`� 9 ialm (12)
D��UXdX[ eXUUf[X! P��gn (13)
D��V=iVoUX[! D��[fUp! I D��UXdX[ eXUUf[X! (14)
D��V=iVoUX[! 10q I P��gn (15)
were O2 (litres), f (beats/minute) and, m (kg.)
D��iZiX[! D��UXdX[ eXUUf[X! k D��V=iVoUX[! (16)
Therefore, in total we can say:
ECD� r �PO,��� gt9abc JKLM�9nuvw
k 21y (17)
ECD� r1,580 9 gJKLM�9n9t
k 0.21y (18)
BXD� { BGD� (19)
UVW JKM�J|M� Z[\ JKM�J|M�
(20)
We get the oxygen from nasal cannula:
} ~���.�hJKM�I 0.15� 9 �JKLM�9n9t�PO� �~ LPM (21)
E. Software Design
To continuously display SpO2 and Pulse rate data, the
graphical user interface on computer screen has been
developed on the LabVIEW™. Fig. 3 shows the block
diagram of measured data from pulse oximeter. The
adjustable alarm limits for detecting low pulse rate and low
SpO2 events are provided. The pulse oximeter probe-off
alarm is also included. And data present as the percentage of
SpO2 into procedure shown in Fig. 4 for drawing graph.
The percentage of SpO2 data is mapped onto ODC, when
ODC already received S-curve file from memory, it will
integrate the case history in order to process data for getting
PaO2 rate then calculate for oxygen supplying rate.
Fig. 3. Block diagram of system data processing.
The rate of Fig. 4 PaO2 which is calculated by using (21).
This equation will program which search for oxygen rate.
The input rate is consisted of PaCo2, respiratory rate and mass
and this project already have a default for the normal
newborn baby which not be a incurrent disease.
Fig. 4. Block diagram of software data processing.
For PaCo2 rate, We should do the blood gas for getting the
accurate oxygen rate. Oxygen rate that received from nasal
cannula shows the result as number which measured by litres
per minute (LPM) and also presents in waveform then,

searching for revolutions per minute (RPM) of stepping
motor by using oxygen rate and compare with the standard
rate by calibration.
F. Flow control of Oxygen
Fig. 5 shows a mechanical part of the system used for
oxygen flow control. The commands are transferred from
computer into DAQ interface by USB port and DAQ then
sends digital data, 8 bits to driver of stepping motor for speed
control. The flow is controlled by using rubber tube
connecting with oxygen tank pass through a roller tile
established on the motoring axle. The rotating speed of this
part controls delivering of supplemental oxygen to the nasal
cannula. This device consists of a plastic tube which fits
behind the ears, and a set of two prongs which are placed in
the nostrils. Oxygen flows from these prongs.
Fig. 5. Block diagram of Flow control Oxygen.
Normally a using nasal cannula is connected to an oxygen
tank, a portable oxygen generator, or a wall connection in a
hospital via a flow-meter. The nasal cannula delivers 1–6
litres of oxygen per minute. There are also infant or neonatal
nasal cannula which carry less than one litre per minute with
smaller prongs. The oxygen fraction provided to the patient
ranges roughly from 24% to 44%.
We also, in the experiments, tested the proportion of
oxygen flow rate and rotating rate of driving stepping motor
by using digital flow-meter with flow control oxygen to
control the quantity of fleeting oxygen as calculated rate.
III. EXPERIMENTAL RESULTS
To preliminarily verify the performances of the automatic
control oxygen intake from blood oxygen saturation, we used
the BIO-TEK model index2 series SpO2 simulators to
generate variable SpO2 and employed MASIMO pulse
oximeter model Rad-9 for measuring the SpO2.
Fig. 6. Block diagram of system data processing.
The generated SpO2 of 50% to 100% corresponding pulse
rate of 50 to 100 bpm were used as calibrating values for
adjustment of the flow rate. A precision flow-mete
(HUMONICS model 730 digital) was used to measure
oxygen flow rate at nasal cannula tip as shown in Fig. 6.
Fig. 7. Overall hardware of the proposed system.
Fig. 7 shows the overall hardware connection of the
proposed system for experiment setup. Measured results for
eleven different values of %SpO2 level, i.e. 100%, 95%,
90%,85%,80%, 75%, 70%, 65%,60%, 55%, and 50% are
summarized in Table 1. To test the repeatability, the
measurement was similarly carried on five times for each
%SpO2 value. Setting parameters such as PaCo2 of 40 mmHg,
respiratory rate of 50 beats/minute and body weight of 3 kg.
was used for simulated normal newborn baby [16].
TABLE I
MEASURED RESULTS FOR SPO2 AND OXYGEN FLOW RATE
%
SpO2
Measured Value of Oxygen (L/M) Average Caculated
1st 2nd 3th 4th 5th
100 0 0 0 0 0 0 0
95 0.06 0.06 0.06 0.06 0.06 0.06 0.063
90 0.22 0.23 0.23 0.22 0.24 0.228 0.23
85 0.35 0.34 0.37 0.35 0.38 0.358 0.37
80 0.5 0.49 0.53 0.5 0.5 0.504 0.51
75 0.61 0.65 0.62 0.63 0.62 0.626 0.63
70 0.74 0.75 0.75 0.73 0.74 0.742 0.74
65 0.85 0.84 0.84 0.85 0.86 0.848 0.85
60 0.95 0.93 0.94 0.95 0.95 0.944 0.95
55 1.0 1.1 1.0 1.0 1.1 1.040 1.05
50 1.3 1.1 1.1 1.2 1.2 1.18 1.2
Fig. 8. The results of the system from Table 1.
The very close correlation of measured oxygen flow rate
needed to compensate for changed SpO2 with one from
calculation are shown in Fig. 8.
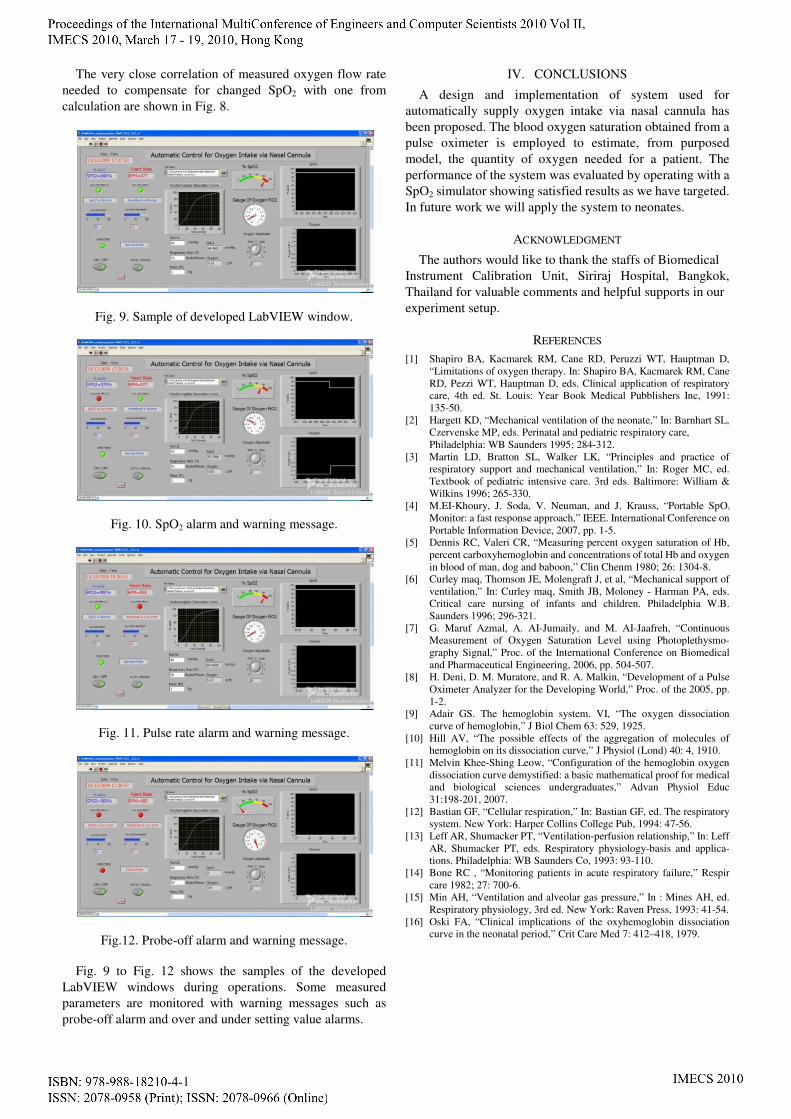
Fig. 9. Sample of developed LabVIEW window.
Fig. 10. SpO2 alarm and warning message.
Fig. 11. Pulse rate alarm and warning message.
Fig.12. Probe-off alarm and warning message.
Fig. 9 to Fig. 12 shows the samples of the developed
LabVIEW windows during operations. Some measured
parameters are monitored with warning messages such as
probe-off alarm and over and under setting value alarms.
IV. CONCLUSIONS
A design and implementation of system used for
automatically supply oxygen intake via nasal cannula has
been proposed. The blood oxygen saturation obtained from a
pulse oximeter is employed to estimate, from purposed
model, the quantity of oxygen needed for a patient. The
performance of the system was evaluated by operating with a
SpO2 simulator showing satisfied results as we have targeted.
In future work we will apply the system to neonates.
ACKNOWLEDGMENT
The authors would like to thank the staffs of Biomedical
Instrument Calibration Unit, Siriraj Hospital, Bangkok,
Thailand for valuable comments and helpful supports in our
experiment setup.
REFERENCES
[1] Shapiro BA, Kacmarek RM, Cane RD, Peruzzi WT, Hauptman D,
“Limitations of oxygen therapy. In: Shapiro BA, Kacmarek RM, Cane
RD, Pezzi WT, Hauptman D, eds. Clinical application of respiratory
care, 4th ed. St. Louis: Year Book Medical Pubblishers Inc, 1991:
135-50.
[2] Hargett KD, “Mechanical ventilation of the neonate,” In: Barnhart SL,
Czervenske MP, eds. Perinatal and pediatric respiratory care,
Philadelphia: WB Saunders 1995; 284-312.
[3] Martin LD, Bratton SL, Walker LK, “Principles and practice of
respiratory support and mechanical ventilation,” In: Roger MC, ed.
Textbook of pediatric intensive care. 3rd eds. Baltimore: William &
Wilkins 1996; 265-330.
[4] M.EI-Khoury, J. Soda, V. Neuman, and J. Krauss, “Portable SpO2
Monitor: a fast response approach,” IEEE. International Conference on
Portable Information Device, 2007, pp. 1-5.
[5] Dennis RC, Valeri CR, “Measuring percent oxygen saturation of Hb,
percent carboxyhemoglobin and concentrations of total Hb and oxygen
in blood of man, dog and baboon,” Clin Chenm 1980; 26: 1304-8.
[6] Curley maq, Thomson JE, Molengraft J, et al, “Mechanical support of
ventilation,” In: Curley maq, Smith JB, Moloney - Harman PA, eds.
Critical care nursing of infants and children. Philadelphia W.B.
Saunders 1996; 296-321.
[7] G. Maruf Azmal, A. AI-Jumaily, and M. AI-Jaafreh, “Continuous
Measurement of Oxygen Saturation Level using Photoplethysmo-
graphy Signal,” Proc. of the International Conference on Biomedical
and Pharmaceutical Engineering, 2006, pp. 504-507.
[8] H. Deni, D. M. Muratore, and R. A. Malkin, “Development of a Pulse
Oximeter Analyzer for the Developing World,” Proc. of the 2005, pp.
1-2.
[9] Adair GS. The hemoglobin system. VI, “The oxygen dissociation
curve of hemoglobin,” J Biol Chem 63: 529, 1925.
[10] Hill AV, “The possible effects of the aggregation of molecules of
hemoglobin on its dissociation curve,” J Physiol (Lond) 40: 4, 1910.
[11] Melvin Khee-Shing Leow, “Configuration of the hemoglobin oxygen
dissociation curve demystified: a basic mathematical proof for medical
and biological sciences undergraduates,” Advan Physiol Educ
31:198-201, 2007.
[12] Bastian GF, “Cellular respiration,” In: Bastian GF, ed. The respiratory
system. New York: Harper Collins College Pub, 1994: 47-56.
[13] Leff AR, Shumacker PT, “Ventilation-perfusion relationship,” In: Leff
AR, Shumacker PT, eds. Respiratory physiology-basis and applica-
tions. Philadelphia: WB Saunders Co, 1993: 93-110.
[14] Bone RC , “Monitoring patients in acute respiratory failure,” Respir
care 1982; 27: 700-6.
[15] Min AH, “Ventilation and alveolar gas pressure,” In : Mines AH, ed.
Respiratory physiology, 3rd ed. New York: Raven Press, 1993: 41-54.
[16] Oski FA, “Clinical implications of the oxyhemoglobin dissociation
curve in the neonatal period,” Crit Care Med 7: 412–418, 1979.