automated iss leak location system development status · automated iss leak location system ......
TRANSCRIPT
1
Automated ISS Leak Location System
Development Status
Dr. Eric Madaras
Todd Hong
Dr. Jialin Tian
Dr. Kornel Nagy
Dr. Cara Leckey
In Space Inspection Workshop
July 15-16, 2014

2
Outline
• Project background: “Pressurized Module Leak Detection and
Repair”
• Leak signals
• Ultrasonic Background Noise Test “UBNT” project status
• Leak location algorithm
• Steps Forward
2

3
09/12/07 3
0.0%
2.0%
4.0%
6.0%
8.0%
10.0%
12.0%
14.0%
16.0%
18.0%
Soyuz
Pro
gre
ss
SM
DC
1
SP
M
FG
B
RM
CM
Gs
MLM
CA
M
AP
M
MP
LM
JE
M L
M-P
S
Node 1
Node 3
HT
V
TC
S-s
Node 2
JE
M
Airlo
ck H
PG
C
TC
S-p
Lab M
odule
PM
A 2
PM
A 3
AT
V
PM
A 1
Cupola
PC
U
10
-ye
ar
MM
OD
Ris
k Baseline Risk (w/SM conformal SMDPs
only, no deployables)
Likelihood of Penetrating
Impact from MMOD
SM FGB N1 Lab
S
o
y
u
z
Soyuz N2
A
P
M
J
E
M
MP
LM
Loss of Crew – Emergency Depress
Consequences of Fast Leak
Loss of Vehicle – repair location unknown
or at least operations capability
Make-up Gas Depletion
PMA
A/L
3% with new shields
DC
Pro
gre
ss
10 Year (2007-2016) Cumulative Risk and
Informal Assessment of Consequences
Not all locations on
Module have equal
risk of damage.
Source: Studor, G., ISS Module Leak Detection and Location (MLDL) Operations Concept, Sep, 12, 2007.
4
Immediate Evacuation Function of station volume, crew O2 masks, etc.
T ime t o C rit ical Pressure Fo llowing Penet rat ion
ISS A ssembly C omplet e
0
1000
2000
3000
4000
5000
6000
7000
0 0.5 1 1.5 2 2.5 3 3.5 4 4.5 5
Hole Diameter (in)
Tim
e t
o C
riti
cal P
ressu
re (
sec)
Tim
e t
o 9
PS
I (n
o r
ep
ress g
ase
s)
seconds
Class 1 Alarm (0.44”)
(15min)
(30min)
(1hr 56min)
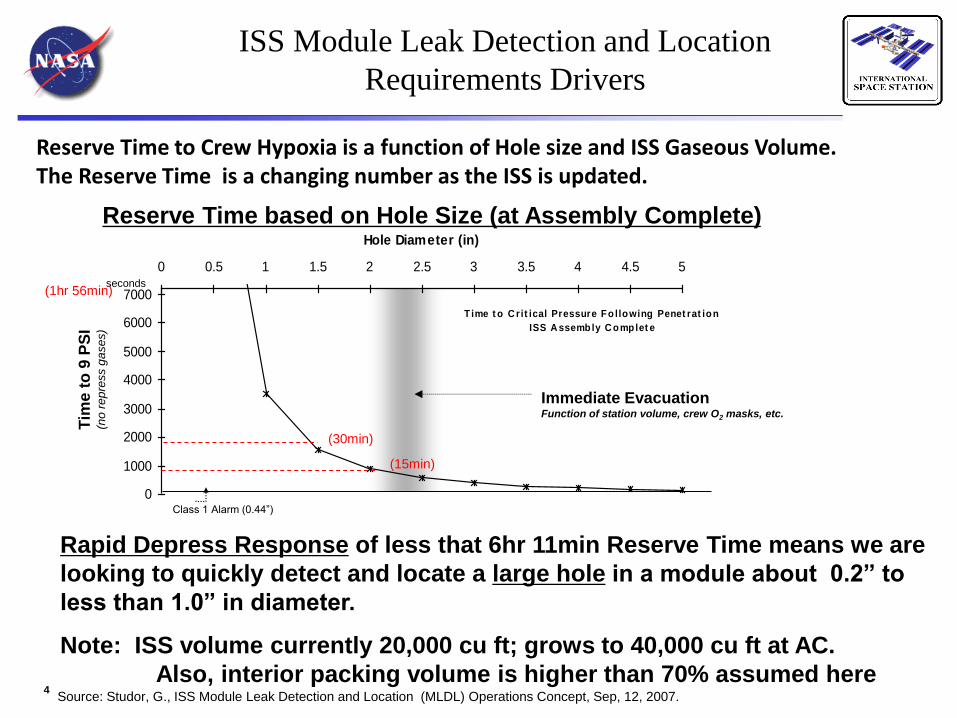
Rapid Depress Response of less that 6hr 11min Reserve Time means we are
looking to quickly detect and locate a large hole in a module about 0.2” to
less than 1.0” in diameter.
Note: ISS volume currently 20,000 cu ft; grows to 40,000 cu ft at AC.
Also, interior packing volume is higher than 70% assumed here
Reserve Time based on Hole Size (at Assembly Complete)
Reserve Time to Crew Hypoxia is a function of Hole size and ISS Gaseous Volume. The Reserve Time is a changing number as the ISS is updated.
ISS Module Leak Detection and Location
Requirements Drivers
Source: Studor, G., ISS Module Leak Detection and Location (MLDL) Operations Concept, Sep, 12, 2007.
5
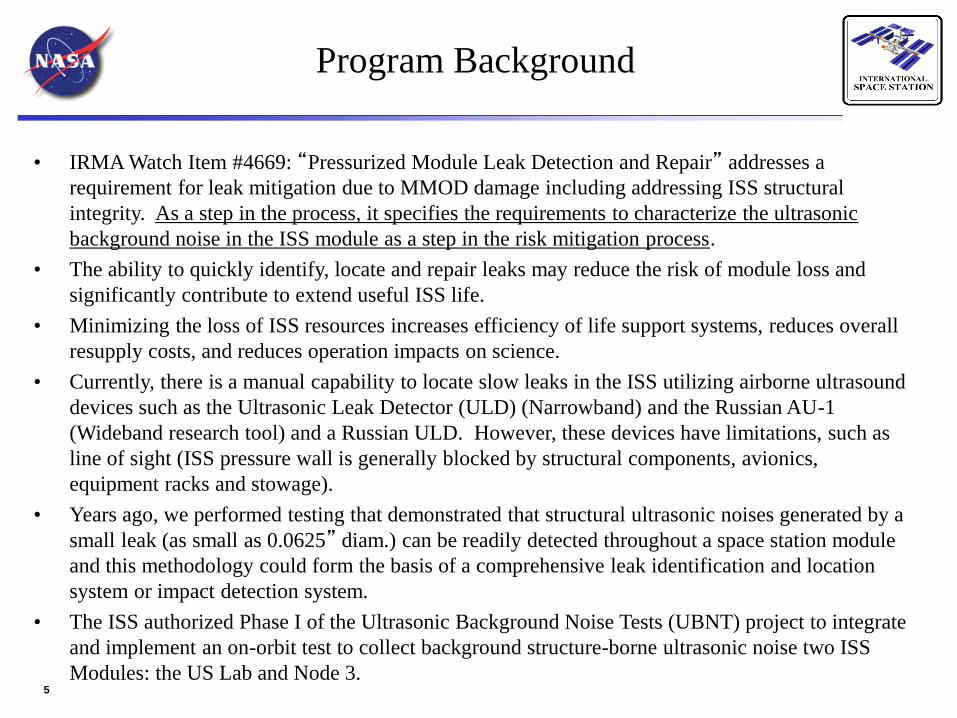
• IRMA Watch Item #4669: “Pressurized Module Leak Detection and Repair” addresses a
requirement for leak mitigation due to MMOD damage including addressing ISS structural
integrity. As a step in the process, it specifies the requirements to characterize the ultrasonic
background noise in the ISS module as a step in the risk mitigation process.
• The ability to quickly identify, locate and repair leaks may reduce the risk of module loss and
significantly contribute to extend useful ISS life.
• Minimizing the loss of ISS resources increases efficiency of life support systems, reduces overall
resupply costs, and reduces operation impacts on science.
• Currently, there is a manual capability to locate slow leaks in the ISS utilizing airborne ultrasound
devices such as the Ultrasonic Leak Detector (ULD) (Narrowband) and the Russian AU-1
(Wideband research tool) and a Russian ULD. However, these devices have limitations, such as
line of sight (ISS pressure wall is generally blocked by structural components, avionics,
equipment racks and stowage).
• Years ago, we performed testing that demonstrated that structural ultrasonic noises generated by a
small leak (as small as 0.0625” diam.) can be readily detected throughout a space station module
and this methodology could form the basis of a comprehensive leak identification and location
system or impact detection system.
• The ISS authorized Phase I of the Ultrasonic Background Noise Tests (UBNT) project to integrate
and implement an on-orbit test to collect background structure-borne ultrasonic noise two ISS
Modules: the US Lab and Node 3.
Program Background
6
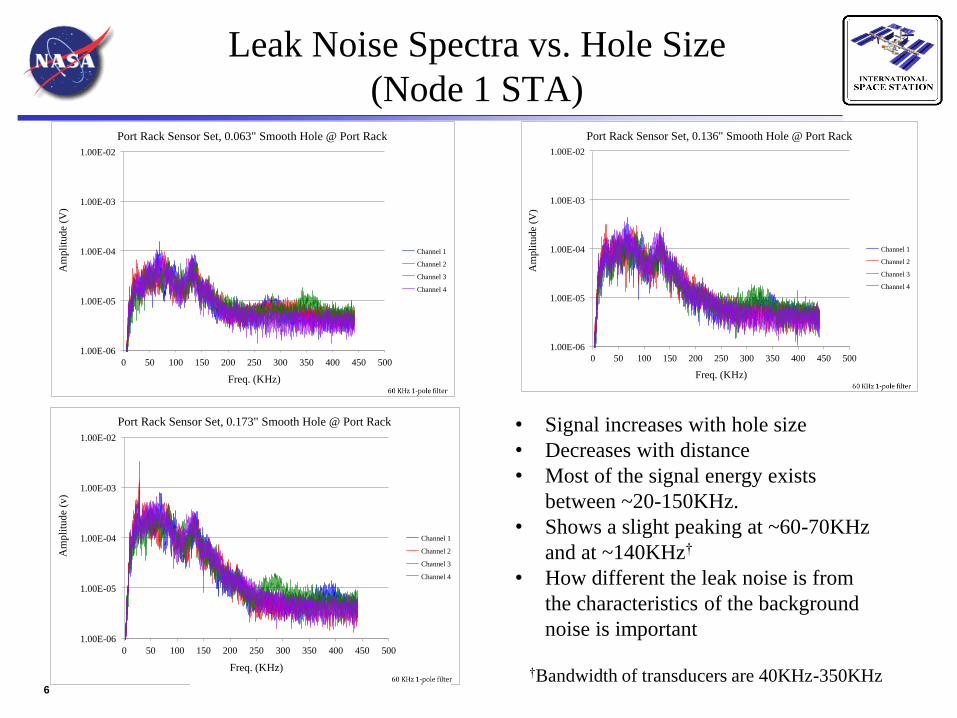
Leak Noise Spectra vs. Hole Size
(Node 1 STA)
1.00E-06
1.00E-05
1.00E-04
1.00E-03
1.00E-02
0 50 100 150 200 250 300 350 400 450 500
Am
pli
tude
(V)
Freq. (KHz)
Port Rack Sensor Set, 0.063" Smooth Hole @ Port Rack
Channel 1
Channel 2
Channel 3
Channel 4
1.00E-06
1.00E-05
1.00E-04
1.00E-03
1.00E-02
0 50 100 150 200 250 300 350 400 450 500
Am
pli
tude
(V)
Freq. (KHz)
Port Rack Sensor Set, 0.136" Smooth Hole @ Port Rack
Channel 1
Channel 2
Channel 3
Channel 4
1.00E-06
1.00E-05
1.00E-04
1.00E-03
1.00E-02
0 50 100 150 200 250 300 350 400 450 500
Am
pli
tude
(v)
Freq. (KHz)
Port Rack Sensor Set, 0.173" Smooth Hole @ Port Rack
Channel 1
Channel 2
Channel 3
Channel 4
• Signal increases with hole size
• Decreases with distance
• Most of the signal energy exists
between ~20-150KHz.
• Shows a slight peaking at ~60-70KHz
and at ~140KHz†
• How different the leak noise is from
the characteristics of the background
noise is important
†Bandwidth of transducers are 40KHz-350KHz
7
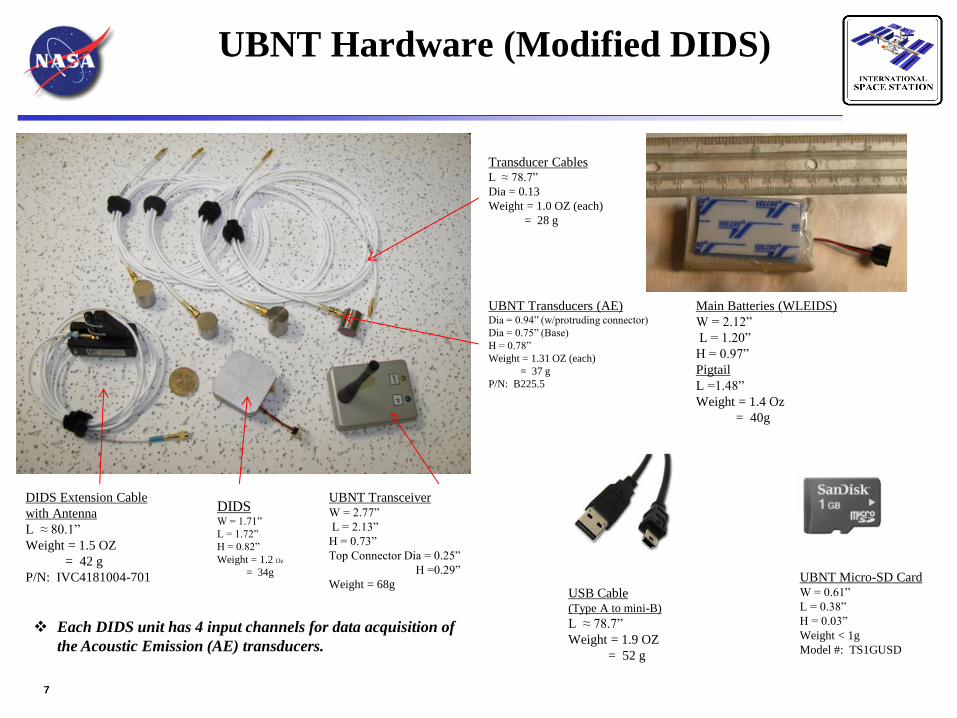
UBNT Hardware (Modified DIDS)
DIDS W = 1.71”
L = 1.72”
H = 0.82”
Weight = 1.2 Oz
= 34g
UBNT Transceiver W = 2.77”
L = 2.13”
H = 0.73”
Top Connector Dia = 0.25”
H =0.29”
Weight = 68g
Main Batteries (WLEIDS)
W = 2.12”
L = 1.20”
H = 0.97”
Pigtail
L =1.48”
Weight = 1.4 Oz
= 40g
UBNT Transducers (AE) Dia = 0.94” (w/protruding connector)
Dia = 0.75” (Base)
H = 0.78”
Weight = 1.31 OZ (each)
= 37 g
P/N: B225.5
Transducer Cables L ≈ 78.7”
Dia = 0.13
Weight = 1.0 OZ (each)
= 28 g
DIDS Extension Cable
with Antenna
L ≈ 80.1”
Weight = 1.5 OZ
= 42 g
P/N: IVC4181004-701
USB Cable (Type A to mini-B)
L ≈ 78.7”
Weight = 1.9 OZ
= 52 g
1GB
UBNT Micro-SD Card W = 0.61”
L = 0.38”
H = 0.03”
Weight < 1g
Model #: TS1GUSD
Each DIDS unit has 4 input channels for data acquisition of
the Acoustic Emission (AE) transducers.

8
Status of UBNT Phase 1A
1. UBNT hardware was manifested to ISS in Feb. 2011.
2. First UBNT sensor set was installed in Nov. 2012
3. First data take occurred on Dec. 12, 2012 (5700 measurements on one UBNT
set.)
4. Remaining UBNT sensors were installed by Feb. 1, 2013
5. First integrated data take using all seven sensor units occurred on May 14,
2013. (7700 measurements)
a. Summary data was downloaded on May 15, 2013.
b. Sets of full data were downloaded in June, 2013
6. Analyzed data and isolated ultrasonic and EMI type of noises.
7. Demonstrated the ability to locate noise sources in the US Lab from the
processed data using the Leak Location Algorithm.

9
UBNT Configuration in US Lab
2 1
3 4
2 1
3 4
2 1
3 4
1 4
=
2 3
1 4
2 3
UBNT S/N 1004
UBNT S/N 1005
UBNT S/N 1006
UBNT S/N 1035
UBNT S/N 1031
UBNT S/N 1003
UBNT S/N 1002
LAB1O01
LAB1OS0
UBNT Sensor Module
UBNT Transducer
UBNT Transducer Cable
AFT FWD
2 1
3 4
2 1
3 4
UBNT Antenna

10
2 1
3 4
1 4
2 3
1 4
2 3
UBNT Sensor Module
UBNT Transducer
AFT FWD
2 1
3 4
2 1
3 4
1.0E-06
1.0E-05
1.0E-04
1.0E-03
0 4 8 12 16 20 24
Sig
nal
Ener
gy (
V2-µ
s)
Time (hrs)
DIDS 1002, Signal Energy vs. Time
SE ch1
SE ch2
SE ch3
SE ch4
LAB1D2 AV-3
1.0E-06
1.0E-05
1.0E-04
1.0E-03
0 4 8 12 16 20 24
Sig
nal
Ener
gy (
V2-µ
s)
Time (hrs)
DIDS 1003, Signal Energy vs. Time
SE ch1
SE ch2
SE ch3
SE ch4
LAB1D4 CHeCS
1.0E-06
1.0E-05
1.0E-04
1.0E-03
0 4 8 12 16 20 24
Sig
nal
Ener
gy (
V2-µ
s)
Time (hrs)
DIDS 1004, Signal Energy vs. Time
SE ch1
SE ch2
SE ch3
SE ch4
LAB1O5 AVCO
1.0E-06
1.0E-05
1.0E-04
1.0E-03
0 4 8 12 16 20 24
Sig
nal
Ener
gy (
V2-µ
s)
Time (hrs)
DIDS 1005, Signal Energy vs. Time
SE ch1
SE ch2
SE ch3
SE ch4
SE ch1
SE ch2
SE ch3
SE ch4
LAB1O2 ExPRESS-1
1.0E-06
1.0E-05
1.0E-04
1.0E-03
0 4 8 12 16 20 24
Sig
nal
Ener
gy (
V2-µ
s)
Time (hrs)
DIDS 1006, Signal Energy vs. Time
SE ch1
SE ch2
SE ch3
SE ch4
AFT HATCHWAY
1.0E-06
1.0E-05
1.0E-04
1.0E-03
0 4 8 12 16 20 24
Sig
nal
Ener
gy (
V2-µ
s)
Time (hrs)
DIDS 1031, Signal Energy vs. Time
SE ch1
SE ch2
SE ch3
SE ch4
LAB1D6 ARS
1.0E-06
1.0E-05
1.0E-04
1.0E-03
0 4 8 12 16 20 24
Sig
nal
Ener
gy (
V2-µ
s)
Time (hrs)
DIDS 1035, Signal Energy vs. Time
SE ch1
SE ch2
SE ch3
SE ch4
FWD HATCHWAY
US LAB Test 2: Sensor Locations and Background Noise Responses (Summary Data)
STARBOARD
SIDE
DECK
SIDE
OVERHEAD
SIDE
PORT
SIDE
11
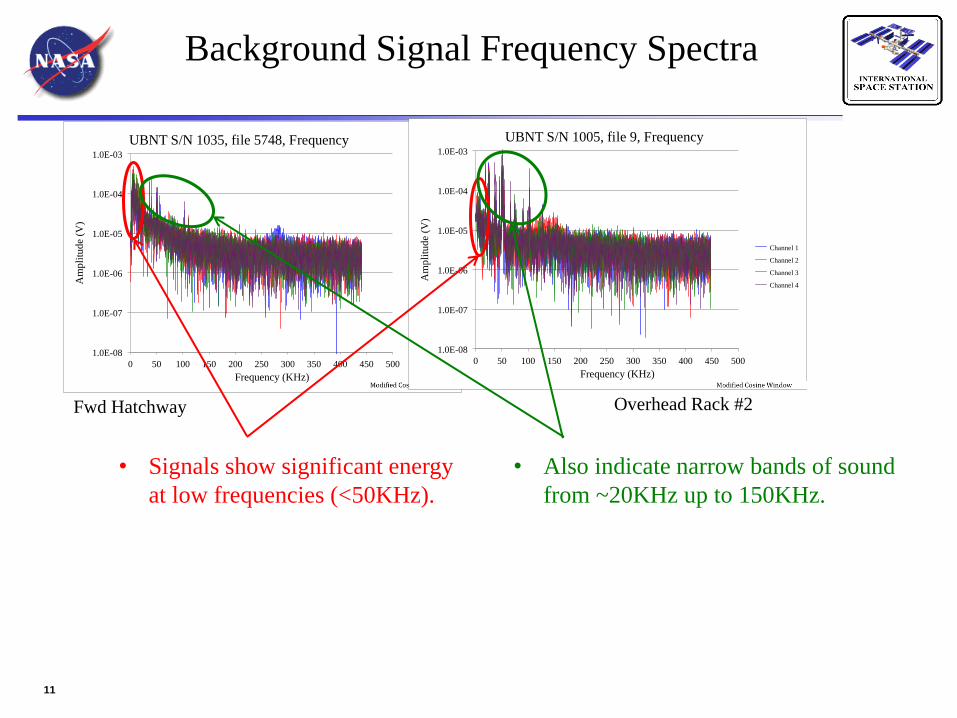
Background Signal Frequency Spectra
1.0E-08
1.0E-07
1.0E-06
1.0E-05
1.0E-04
1.0E-03
0 50 100 150 200 250 300 350 400 450 500
Am
pli
tude
(V)
Frequency (KHz)
UBNT S/N 1035, file 5748, Frequency
Channel 1
Channel 2
Channel 3
Channel 4
1.0E-08
1.0E-07
1.0E-06
1.0E-05
1.0E-04
1.0E-03
0 50 100 150 200 250 300 350 400 450 500
Am
pli
tude
(V)
Frequency (KHz)
UBNT S/N 1005, file 9, Frequency
Channel 1
Channel 2
Channel 3
Channel 4
Fwd Hatchway Overhead Rack #2
• Signals show significant energy
at low frequencies (<50KHz).
• Also indicate narrow bands of sound
from ~20KHz up to 150KHz.

12
Measured Signal Energy After Application of
50KHz 2-pole High Pass Filter
1.0E-08
1.0E-07
1.0E-06
1.0E-05
1.0E-04
1.0E-03
0 4 8 12 16 20 24
Sig
nal
Ener
gy (
V2µ
s)
Time (hrs)
Signal Energy After 50KHz 2-Pole Hi-Pass Filter
1002 SE ch1=
1002 SE ch2=
1002 SE ch3=
1002 SE ch4=
1005 SE ch1=
1005 SE ch2=
1005 SE ch3=
1005 SE ch4=
1006 SE ch1=
1006 SE ch2=
1006 SE ch3=
1006 SE ch4=
1035 SE ch1=
1035 SE ch2=
1035 SE ch3=
1035 SE ch4=
Transducer
key

13
Signal Frequency Spectra-
Before and After Filtering
1.0E-08
1.0E-07
1.0E-06
1.0E-05
1.0E-04
1.0E-03
0 50 100 150 200 250 300 350 400 450 500
Am
pli
tude
(V)
Frequency (KHz)
UBNT S/N 1005, file 9, Filtered Frequency
Channel 1
Channel 2
Channel 3
Channel 4
1.0E-08
1.0E-07
1.0E-06
1.0E-05
1.0E-04
1.0E-03
0 50 100 150 200 250 300 350 400 450 500
Am
pli
tude
(V)
Frequency (KHz)
UBNT S/N 1005, file 9, Frequency
Channel 1
Channel 2
Channel 3
Channel 4
Original Data from Overhead Rack #2 Filtered Data from Overhead Rack #2

14
Measured Signal Energy
After Removing Noise Sources
1.0E-08
1.0E-07
1.0E-06
1.0E-05
1.0E-04
1.0E-03
0 4 8 12 16 20 24
Sig
nal
Ener
gy
(V
2-µ
s)
Time (hrs.)
Signal Energy Measured in US Lab 1002 SE ch1
1002 SE ch2
1002 SE ch3
1002 SE ch4
1005 SE ch1
1005 SE ch2
1005 SE ch3
1005 SE ch4
1006 SE ch1
1006 SE ch2
1006 SE ch3
1006 SE ch4
1035 SE ch1
1035 SE ch2
1035 SE ch3
1035 SE ch4
Ultrasound peaks and EMI removed
15
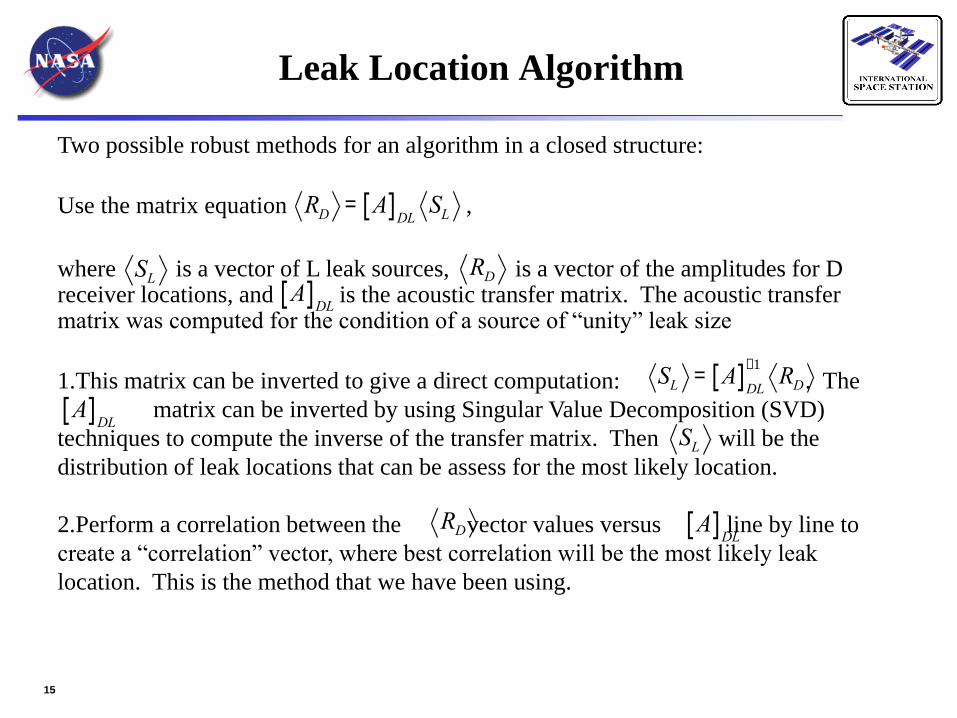
Leak Location Algorithm
Two possible robust methods for an algorithm in a closed structure:
Use the matrix equation ,
where is a vector of L leak sources, is a vector of the amplitudes for D receiver locations, and is the acoustic transfer matrix. The acoustic transfer matrix was computed for the condition of a source of “unity” leak size
1.This matrix can be inverted to give a direct computation: . The
matrix can be inverted by using Singular Value Decomposition (SVD)
techniques to compute the inverse of the transfer matrix. Then will be the
distribution of leak locations that can be assess for the most likely location.
2.Perform a correlation between the vector values versus line by line to
create a “correlation” vector, where best correlation will be the most likely leak
location. This is the method that we have been using.
RD = A[ ]DLSL
RDA[ ]
DL
SL
SL = A[ ]DL
-1RD
SL
A[ ]DL
RD A[ ]DL

16
Computing the Acoustic Transfer Matrix
• Computational methods to compute the acoustic transfer matrix must be able to
compute the acoustic
1. direct field effects,
2. reverberant field effects, and
3. beam bending effects.
• Software that can compute the reverberant and beam bending effects in a complex
structure exists. Statistical Energy Analysis (SEA) and Energy FEM (E-FEM) are two
such commercially available methods. With modifications, both methods can also
handle the direct field.
• We have been using the E-FEM software with good results. It works directly with the
structural FEM model and once the correlation vector is computed, that vector can be
displayed on the FEM model to show where the most likely location of the leak is.
• In principle, this method can give us 100% coverage of an ISS module, without blind
spots. Since this is a noise locating algorithm, we used this method to help find the
location of the background signals, to display them on the FEM mesh, and to help
identify the hardware generating the noise.
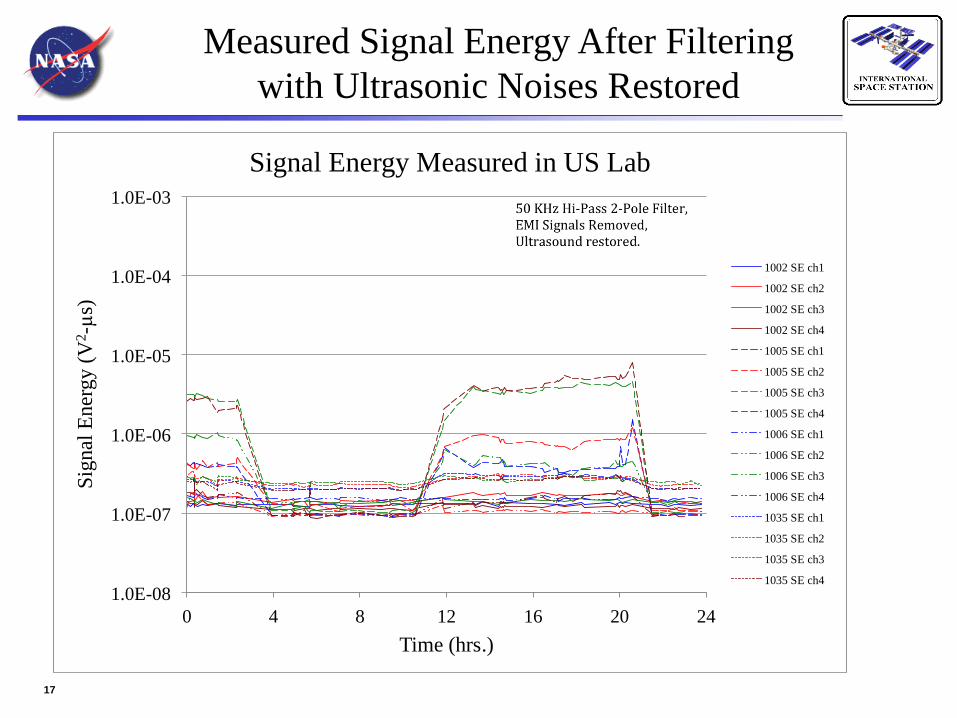
17
Measured Signal Energy After Filtering
with Ultrasonic Noises Restored
1.0E-08
1.0E-07
1.0E-06
1.0E-05
1.0E-04
1.0E-03
0 4 8 12 16 20 24
Sig
nal
Ener
gy (
V2-µ
s)
Time (hrs.)
Signal Energy Measured in US Lab
1002 SE ch1
1002 SE ch2
1002 SE ch3
1002 SE ch4
1005 SE ch1
1005 SE ch2
1005 SE ch3
1005 SE ch4
1006 SE ch1
1006 SE ch2
1006 SE ch3
1006 SE ch4
1035 SE ch1
1035 SE ch2
1035 SE ch3
1035 SE ch4

18
Forward Aft
Overhead
Port
Starboard
Location of GLA
on LAB1OS1
panel in hallway
Location of GLA
on LAB1OP3
panel in hallway
US Lab FEM Model
Note: Location Estimates for Sounds Recorded
between 12 AM and 3 AM GMT on May 15, 2013
Crew was active during this period.
Noise Location Estimate for Sounds between 12 AM and 3 AM
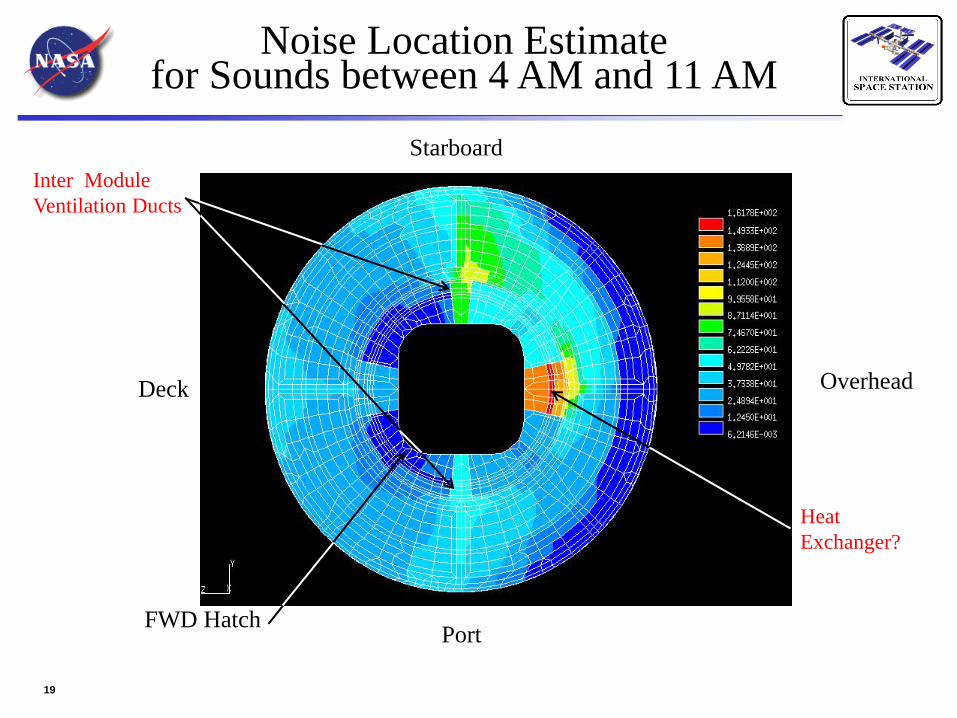
19
FWD Hatch
Overhead
Port
Deck
Starboard
Noise Location Estimate for Sounds between 4 AM and 11 AM
Inter Module
Ventilation Ducts
Heat
Exchanger?

20
Next Steps
1. Finish UBNT Phase 1
a. Update software and hardware (from lessons learned on-orbit):
b. Acquire hardware for Node 3 and replace hardware for US Lab.
2. Assess leak location algorithm using ground resources (Hab Module at
MSFC and Node 1 STA at KSC) and the on-orbit background noise results
(requires extra hardware).
3. Acquire hardware for Russian SM and FGB.
a. This requires an agreement between Roscosmos and NASA plus
coordination between RSC Energia, Khurnichev, TsNIIMash, and
NASA.
b. Perform ground testing (MLM and SM mockups in Moscow).
c. Perform on-orbit testing in SM and FGB.
4. Develop the flight version of the leak location algorithm for each module.
5. Develop an integrated version of the software for the ISS as a whole.

21
Back-up Slides
22
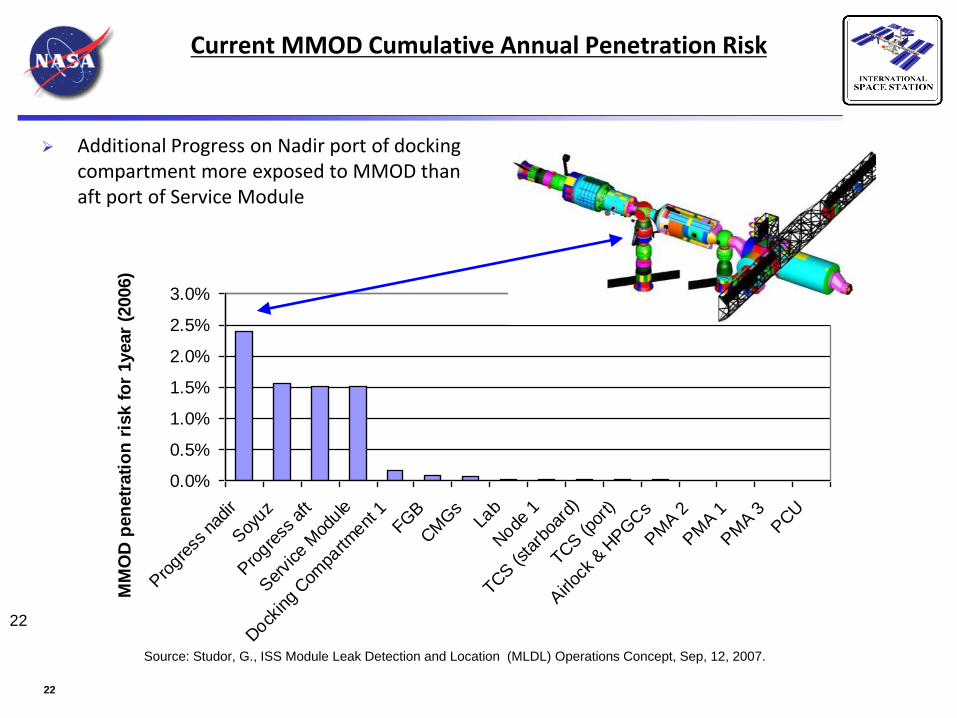
Current MMOD Cumulative Annual Penetration Risk
Additional Progress on Nadir port of docking compartment more exposed to MMOD than aft port of Service Module
22
Source: Studor, G., ISS Module Leak Detection and Location (MLDL) Operations Concept, Sep, 12, 2007.
0.0%
0.5%
1.0%
1.5%
2.0%
2.5%
3.0%
Pro
gress
nad
ir
Soy
uz
Pro
gress
aft
Ser
vice
Mod
ule
Dock
ing
Com
partm
ent 1
FGB
CM
Gs
Lab
Node
1
TCS (s
tarb
oard
)
TCS (p
ort)
Airloc
k & H
PGCs
PM
A 2
PM
A 1
PM
A 3PCU
MM
OD
pen
etr
ati
on
ris
k f
or
1year
(2006)
23
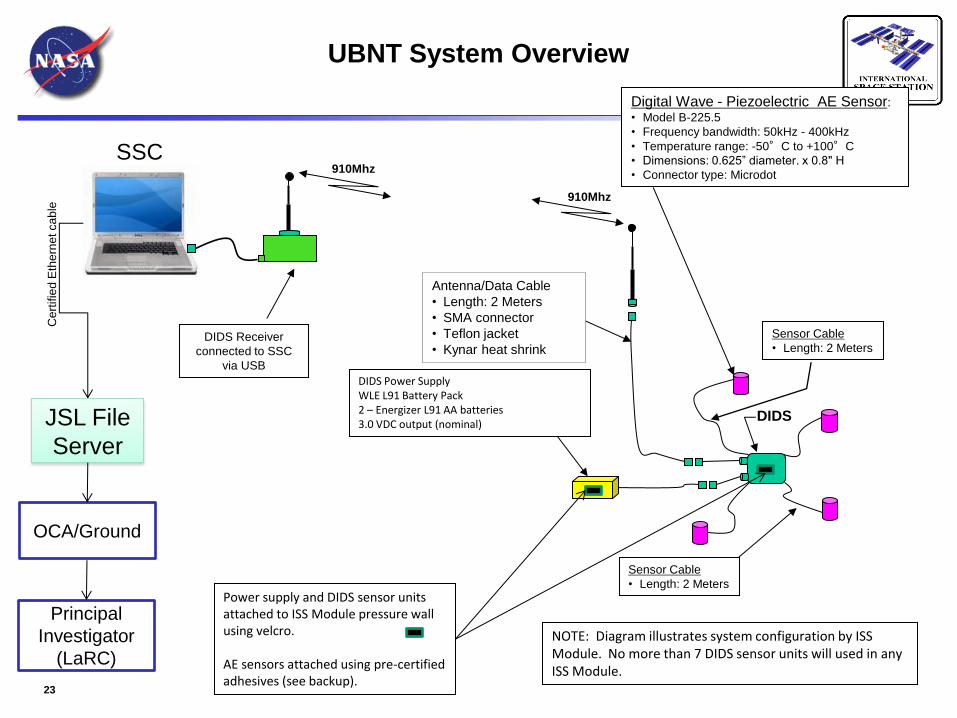
UBNT System Overview
910Mhz
DIDS
Digital Wave - Piezoelectric AE Sensor: • Model B-225.5
• Frequency bandwidth: 50kHz - 400kHz
• Temperature range: -50°C to +100°C
• Dimensions: 0.625” diameter. x 0.8" H
• Connector type: Microdot
Sensor Cable
• Length: 2 Meters
Sensor Cable
• Length: 2 Meters
DIDS Power Supply WLE L91 Battery Pack 2 – Energizer L91 AA batteries 3.0 VDC output (nominal)
Antenna/Data Cable
• Length: 2 Meters
• SMA connector
• Teflon jacket
• Kynar heat shrink
910Mhz SSC
DIDS Receiver
connected to SSC
via USB
Power supply and DIDS sensor units attached to ISS Module pressure wall using velcro. AE sensors attached using pre-certified adhesives (see backup).
JSL File
Server
OCA/Ground
Cert
ifie
d E
the
rne
t ca
ble
NOTE: Diagram illustrates system configuration by ISS Module. No more than 7 DIDS sensor units will used in any ISS Module.
Principal
Investigator
(LaRC)
24 09/12/07
24
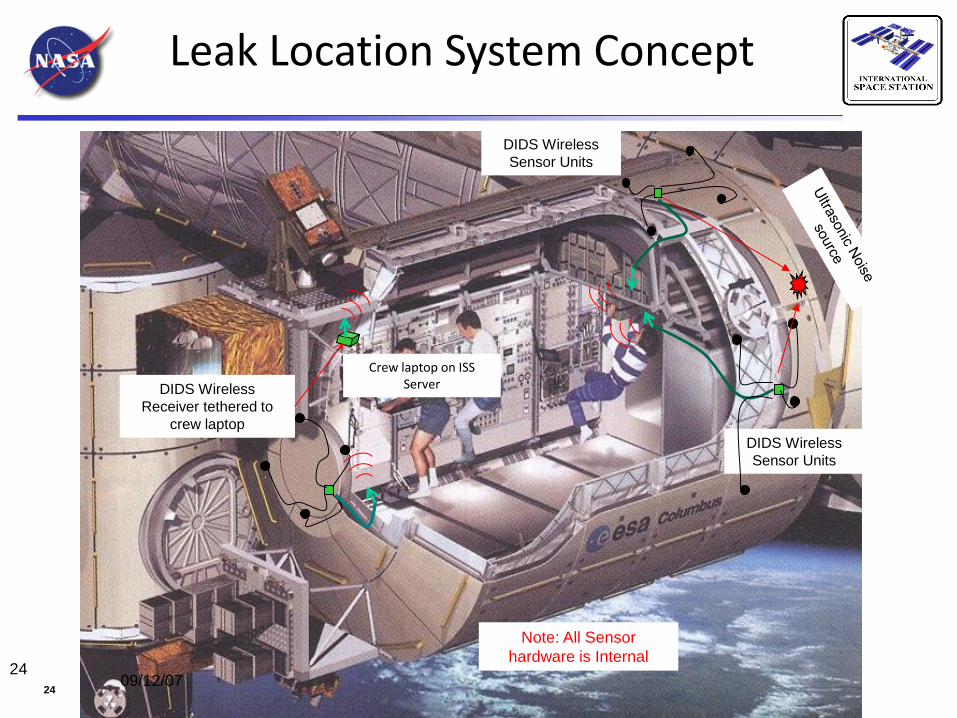
Crew laptop on ISS Server
DIDS Wireless
Sensor Units
DIDS Wireless
Receiver tethered to
crew laptop
Note: All Sensor
hardware is Internal
DIDS Wireless
Sensor Units
Leak Location System Concept