automated data analysis - pennsylvania state...
TRANSCRIPT

Automated Data Analysis
Richard E. Higgs, Jr.
Molecular InformaticsLilly Research Laboratories

ObjectiveConvey candid observations from someone
on a road from data to decisions...

Agenda• Session 1
– Accessing Data (first things first)
– Analyzing Data (statistics, statistics, statistics)
• Session 2– Implementation (Linux changing rules of game)
– Case Studies• HPLC-MS of complex mixtures• FTMS• Proteomics
Accessing Data• Raw files
– Contains maximum amount of information– Proprietary issues– Vulnerable to format changes by vendors– Multiple vendors
Accessing Data• netCDF converted files
– Self describing binary format– Some loss of information (vendor issue)– Limited to MS and LC-MS– Standard data format– Libraries available for many analysis tools
• ANDI library for C/C++• R/Splus, MATLAB, etc. compatible

Accessing Data• ASCII text files
– Report files• Lots of information lost• Easy to read (e.g. Perl)
– New technologies (standards) may help• XML• File size may still be an issue for your application
Data Storage Options• Storing raw MS data in relational databases
– Overhead problems– Terabyte databases still a challenge ?
• Storing raw MS data on disk– Less overhead– File organization issues
• Compromise solution– Some of both

Instructing Instrument• Automatic sample list generation
– Sample identification (file naming)– Instrument method– Integrated with relational experiment database

Accessing Data
InstrumentControl PC
Autosampler
Relational Database- experiment conditions- filenames
File Server- spectra
Compute Server- analyses
network
Analyzing Data• Noise and variability in all measurements
• Statisticians– Uniquely trained to analyze data with noise– Statistics = Science of decision making
• Seek the help of data analysis specialists– Data analysis is a complex, rapidly changing field– Much of what you may need has been invented
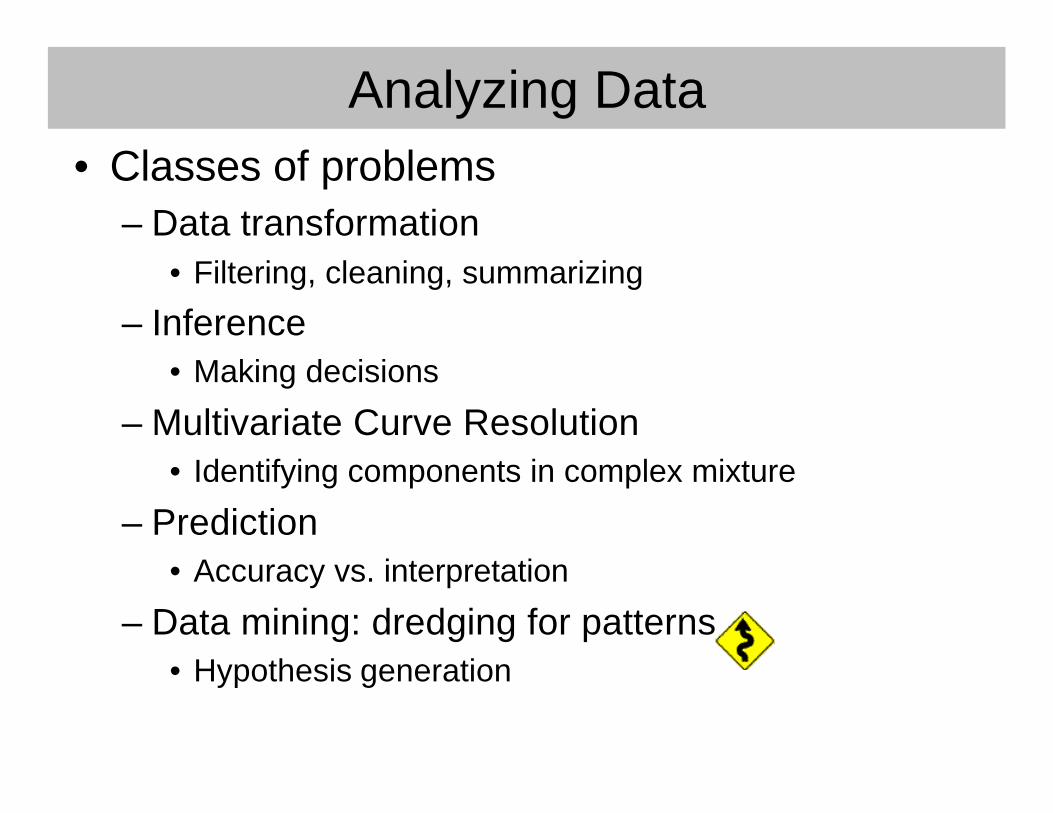
Analyzing Data• Classes of problems
– Data transformation• Filtering, cleaning, summarizing
– Inference• Making decisions
– Multivariate Curve Resolution• Identifying components in complex mixture
– Prediction• Accuracy vs. interpretation
– Data mining: dredging for patterns• Hypothesis generation
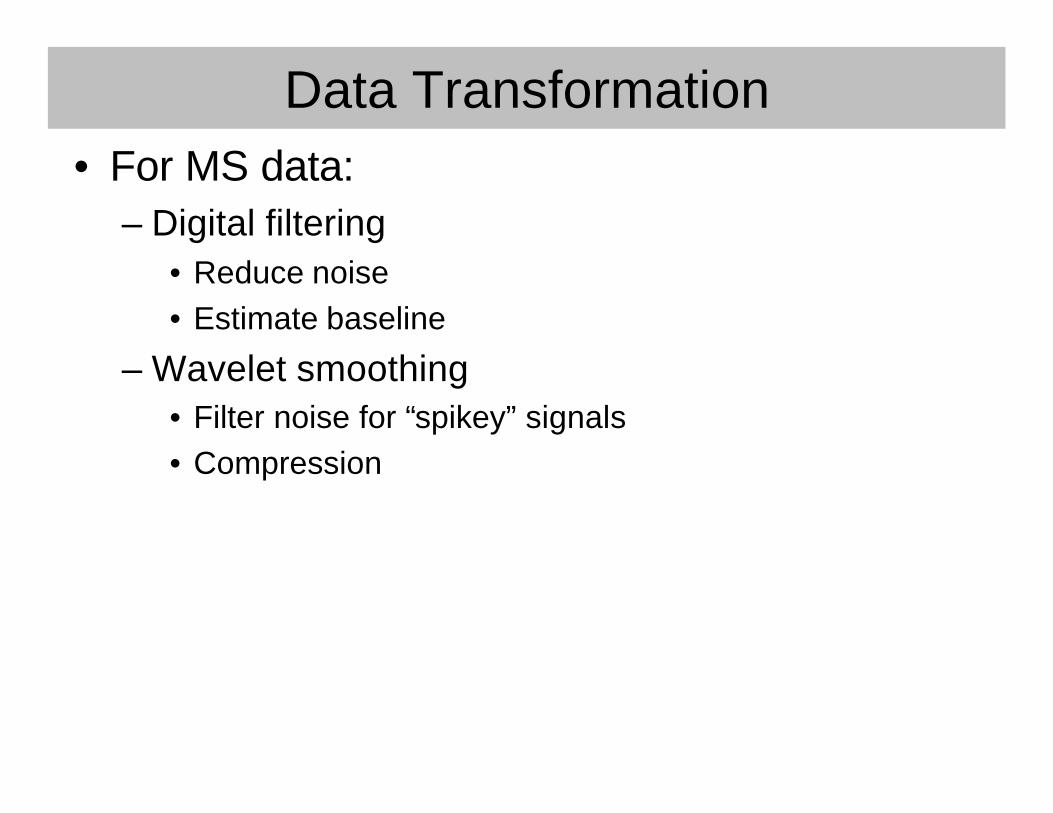
Data Transformation• For MS data:
– Digital filtering• Reduce noise• Estimate baseline
– Wavelet smoothing• Filter noise for “spikey” signals• Compression

Wavelet Smoothing
0 200 400 600 800 1000
020
4060
NMR Spectrum
Index
Inte
nsity
0 200 400 600 800 1000
-10
1030
50
Waveshrink Estimate of NMR Spectrum
Index
Inte
nsity
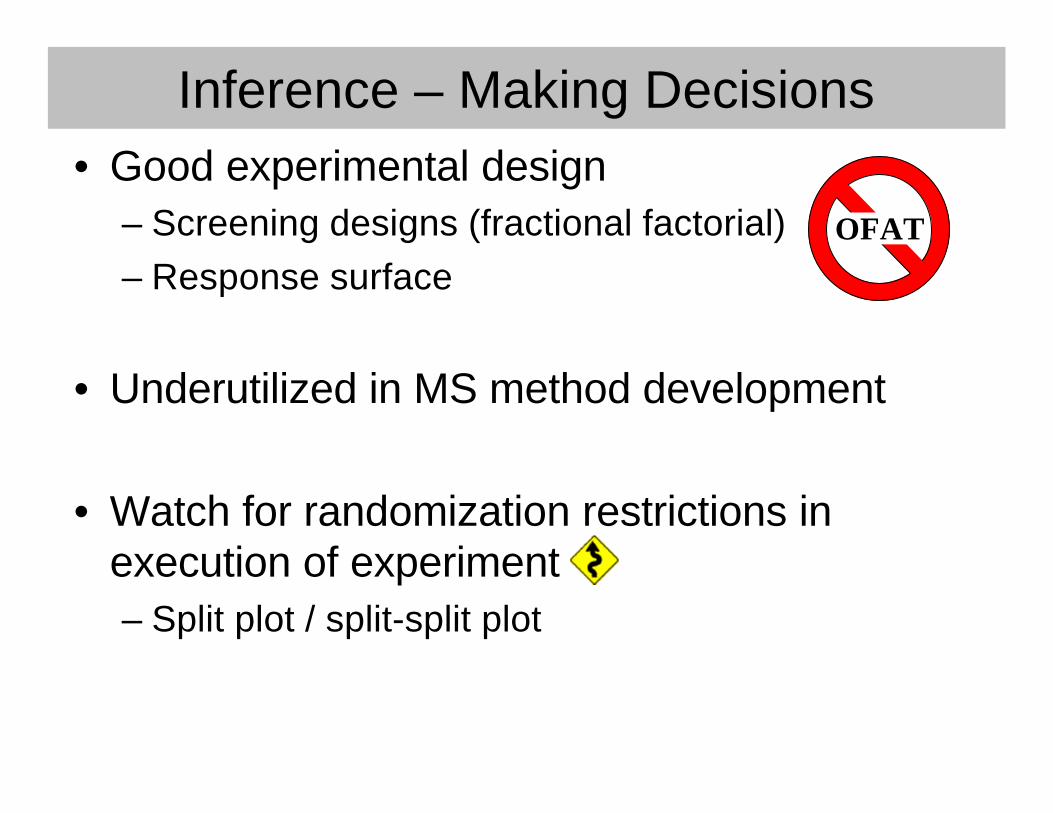
Inference – Making Decisions• Good experimental design
– Screening designs (fractional factorial)– Response surface
• Underutilized in MS method development
• Watch for randomization restrictions inexecution of experiment– Split plot / split-split plot
OFAT
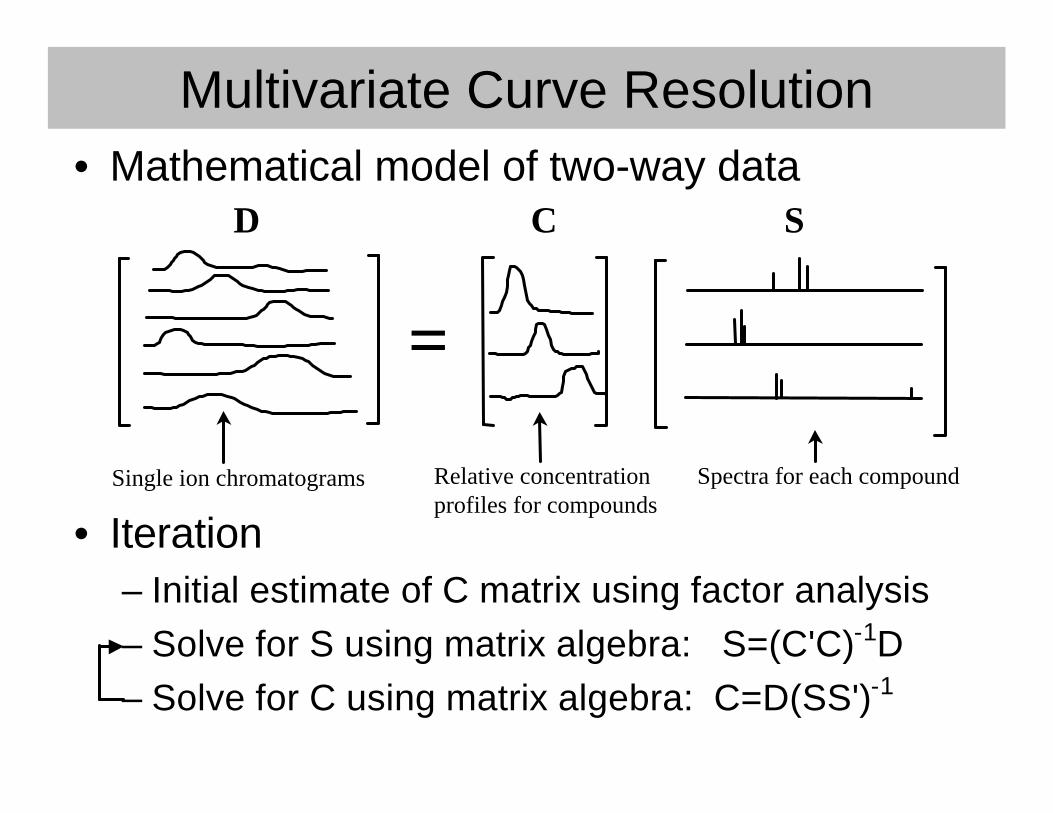
Multivariate Curve Resolution• Mathematical model of two-way data
• Iteration– Initial estimate of C matrix using factor analysis– Solve for S using matrix algebra: S=(C'C)-1D– Solve for C using matrix algebra: C=D(SS')-1
=
Single ion chromatograms Relative concentrationprofiles for compounds
Spectra for each compound
D C S

Multivariate Curve Resolution• Many proposed methods
– Evolving factor analysis– Windowed factor analysis– Alternating least squares
• MATLAB examples (Roma Tauler)– http://www.ub.es/gesq/mcr/mcr.htm
14.0 14.2 14.4 14.6 14.8
0 e
+00
2 e
+06
m/z = 383 .3
Ret Time (min)
Cou
nts
14.0 14.2 14.4 14.6 14.8
010
0000
2500
00
m/z = 275 .2
Ret Time (min)
Cou
nts
14.0 14.2 14.4 14.6 14.8
010
000
2000
0
m/z = 591 .2
Ret Time (min)
Cou
nts
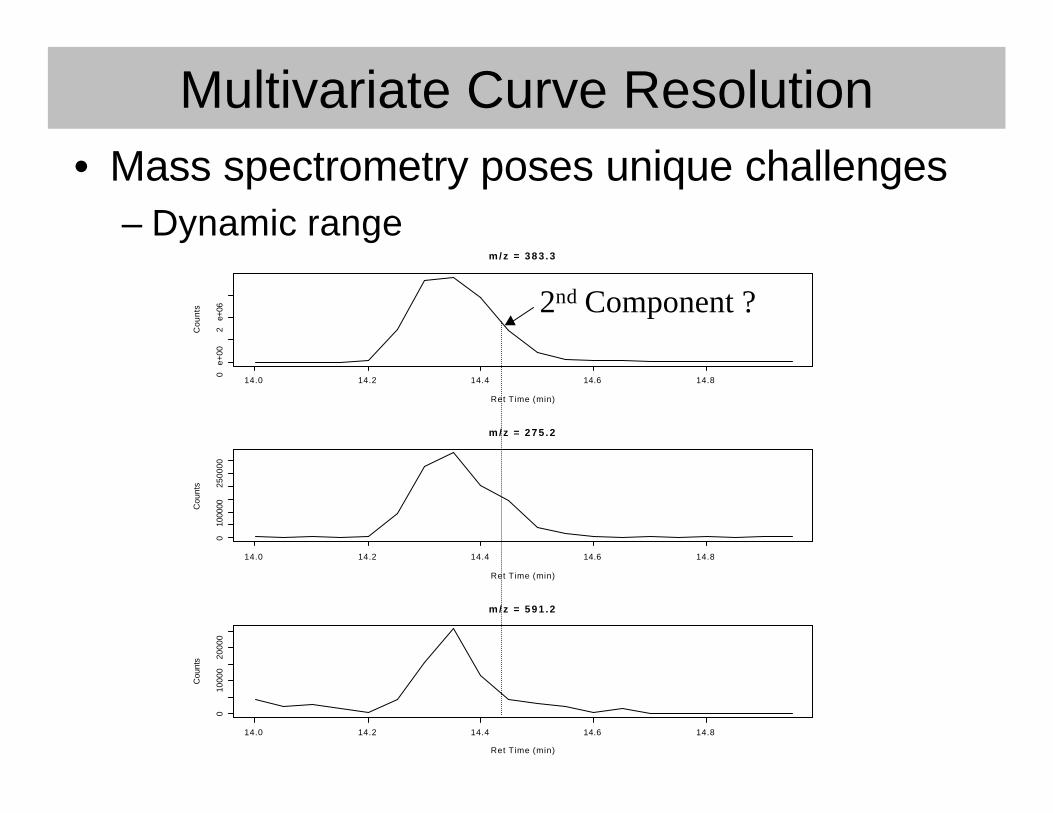
Multivariate Curve Resolution• Mass spectrometry poses unique challenges
– Dynamic range
2nd Component ?

Prediction• “All models are wrong but some are useful.”
– G.E.P. Box
• Goal: make accurate predictions using model
• Interpretation of model not of interest
• Accuracy*Interpretability < Breiman’s Constant– Leo Breiman
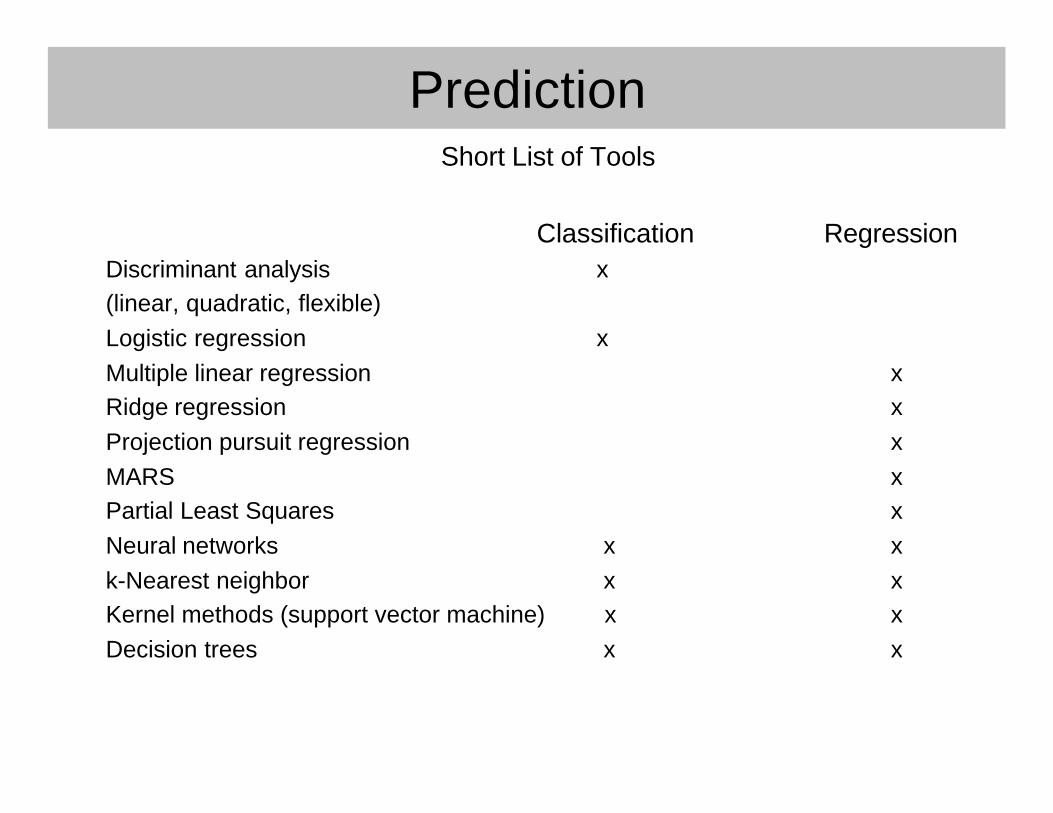
PredictionShort List of Tools
Classification RegressionDiscriminant analysis x(linear, quadratic, flexible)Logistic regression xMultiple linear regression xRidge regression xProjection pursuit regression xMARS xPartial Least Squares xNeural networks x xk-Nearest neighbor x xKernel methods (support vector machine) x xDecision trees x x

Prediction• Decision Trees
– Fast, capable of handling large data sets– Recursively partition data into homogeneous sets– Can capture nonlinear behavior– Can capture interactions
If clogP<4
If MW<400 If# rings > 1
activeIf clogP<5.5
active
inactive inactive
inactive
T F
F
F
FT T
T
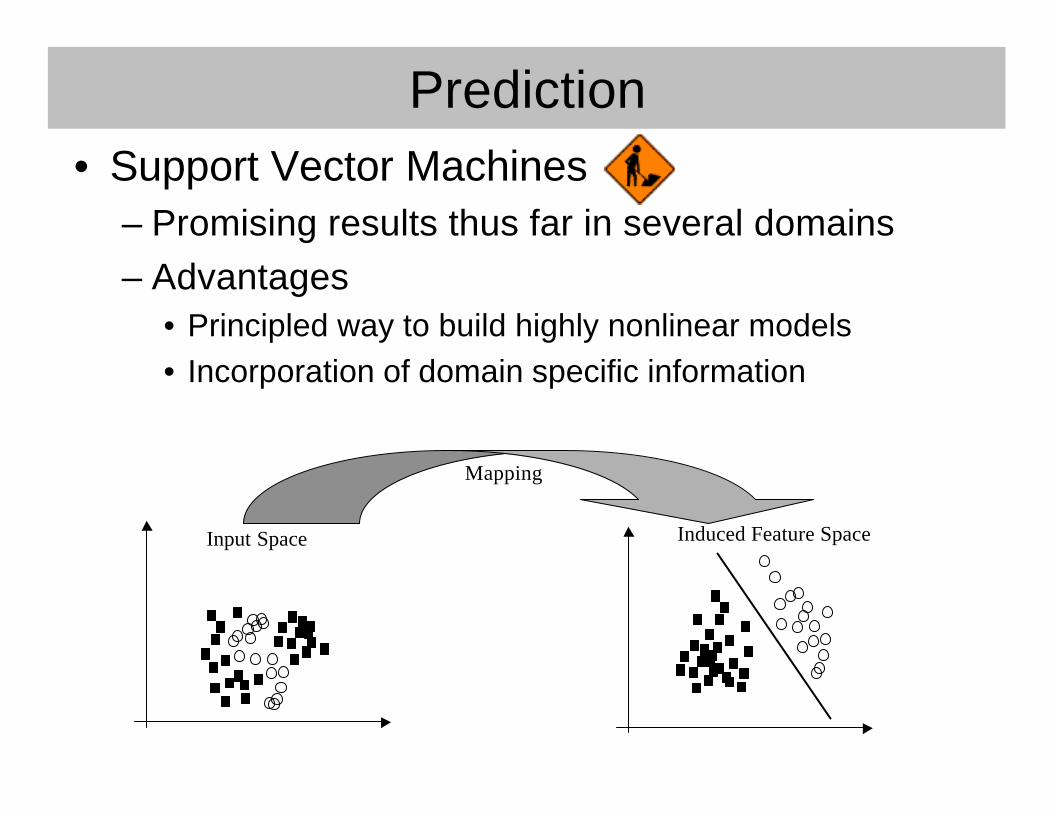
Prediction• Support Vector Machines
– Promising results thus far in several domains– Advantages
• Principled way to build highly nonlinear models• Incorporation of domain specific information
Input Space Induced Feature Space
Mapping
Prediction• Ensemble Methods
– Average predictions from several models toimprove overall prediction accuracy
– Bagging– Boosting– Revolutionized prediction accuracy

Prediction
Analogous to fitting high degreepolynomials to a calibration curve
Overfitting

Prediction• Overfitting is a huge problem
– Must be vigilant about using independent testdata to assess model performance
– Leave-one-out cross-validation is too optimistic!– Leave ½ out cross-validation preferred
• If test data used to modify model, predictionperformance will be biased

PredictionPr
edic
tion
Err
or
Model ComplexityLow High
Training Sample
Test Sample
High BiasLow Variance
Low BiasHigh Variance

Data Mining• Finding "useful" patterns or relationships in
observational databases
• Spurious correlations abound
• Hypothesis generation– Confirmed by designed experiments
Data Mining• "Unsupervised Methods"
– Clustering– Association rules– No clear measure of success– Proliferation of methods since effectiveness is a
matter of opinion

Analyzing Data - Take Home• Beware of “fuzzy neural genetic …”
• Have multiple tools at your disposal– “To a little boy with a hammer, all the world’s a nail.”– Seek collaborators with big tool boxes
• Stay focused and principled– What’s the essence of the problem– What method best solves the problem– Not "...how can I apply tool X here…"

Q&A
Implementing• Hardware
– Symmetric Multiprocessor (SMP)• Multiple processors all sharing same memory space• Tens of processors, tens of Gbytes of memory,
Terabytes of disk• Good for big memory jobs, file serving• Operating system handles load balancing• Expensive,infrequent upgrades

Sun SMP Server
Example System (Lilly Natural Products):Sun E6000Ten 333 MHz UltraSparc processors4 GBytes RAM1.5 TeraBytes disk

Implementing• Hardware
– Linux clusters• Unbeatable single CPU price/performance• Scalable and less expensive than SMPs• Requires queuing software• Small memory jobs• Unbeatable overall performance for many applications

Linux Cluster (version 1.0)
40 Desktop PCs on HPLCcarts (733 MHz PIII)
Simple and inexpensive
No centralized admin.
"Total Cost of Ownership"lower than some will claim
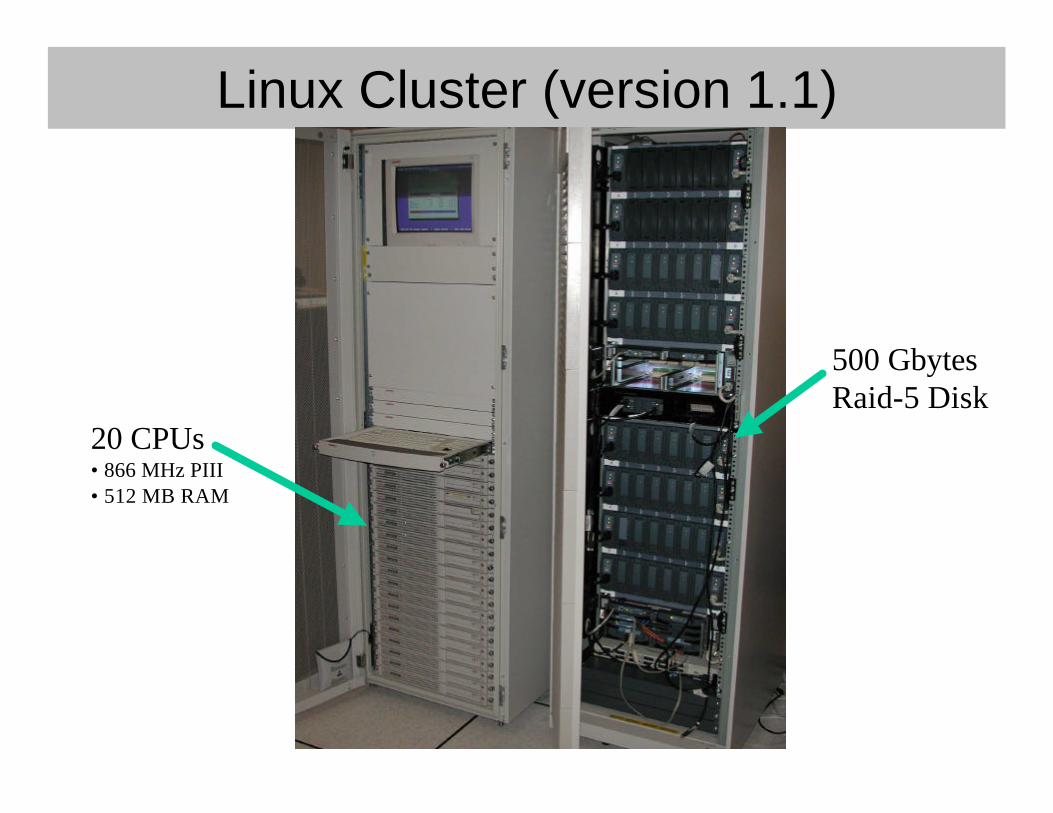
Linux Cluster (version 1.1)
20 CPUs• 866 MHz PIII• 512 MB RAM
500 GbytesRaid-5 Disk
Implementing• Software
– General tools (we do GNU, www.gnu.org)• gcc, ghostscript, bash, gzip, emacs• Consistent development environment
– Queuing software for clusters• LSF – full featured, $$ (www.platform.com)• Grid Engine - less features, no $$ (www.sun.com)

Implementing• Software
– Experimental design & interactive analysis• JMP (www.sas.com)
– Rapid prototyping• MATLAB (www.mathworks.com)• R / Splus (www.r-project.org, www.insightful.com)• Perl

Implementing• Software
– Decision trees• R / Splus• SAS Enterprise Miner• Salford Systems (www.salford-systems.com)
– Production deployment• SAS (www.sas.com)• Perl• C/C++
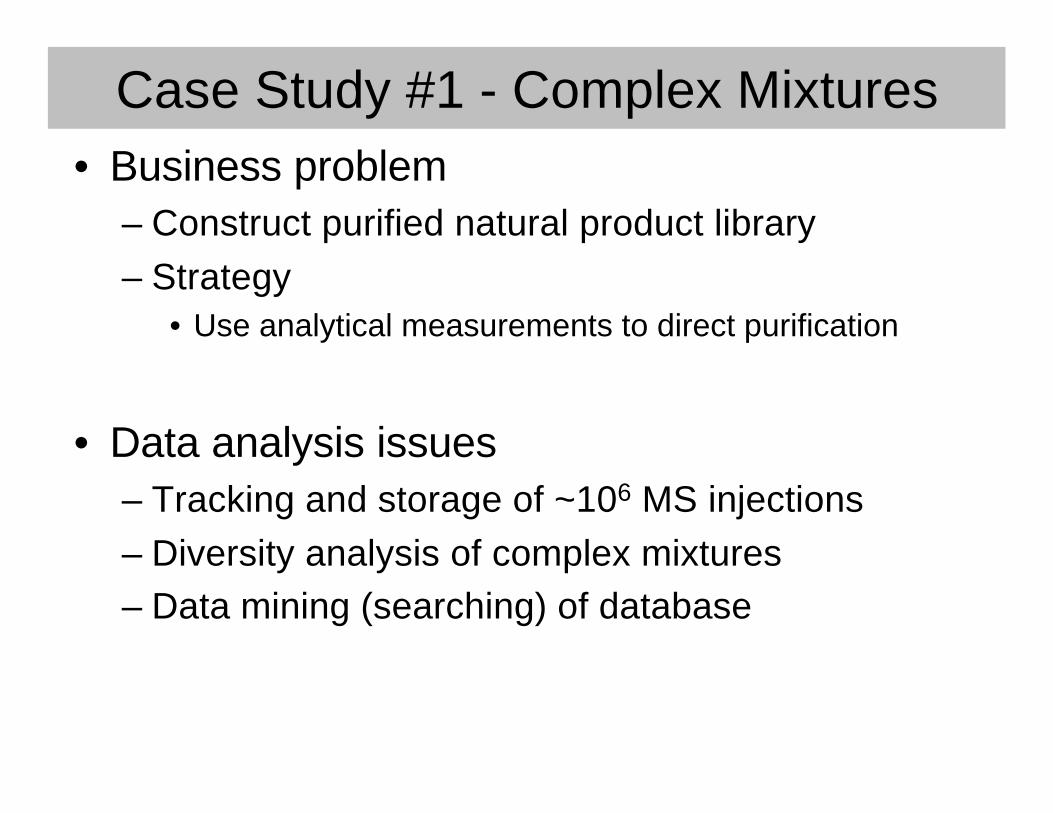
Case Study #1 - Complex Mixtures• Business problem
– Construct purified natural product library– Strategy
• Use analytical measurements to direct purification
• Data analysis issues– Tracking and storage of ~106 MS injections– Diversity analysis of complex mixtures– Data mining (searching) of database

Case Study #1 - Complex Mixtures• Path we took
– SMP Sun Server– 1.5 Terabytes of netCDF files– Database associating experiments with filenames– Strategy
• Automated analysis required• Visualization needed to validate algorithms
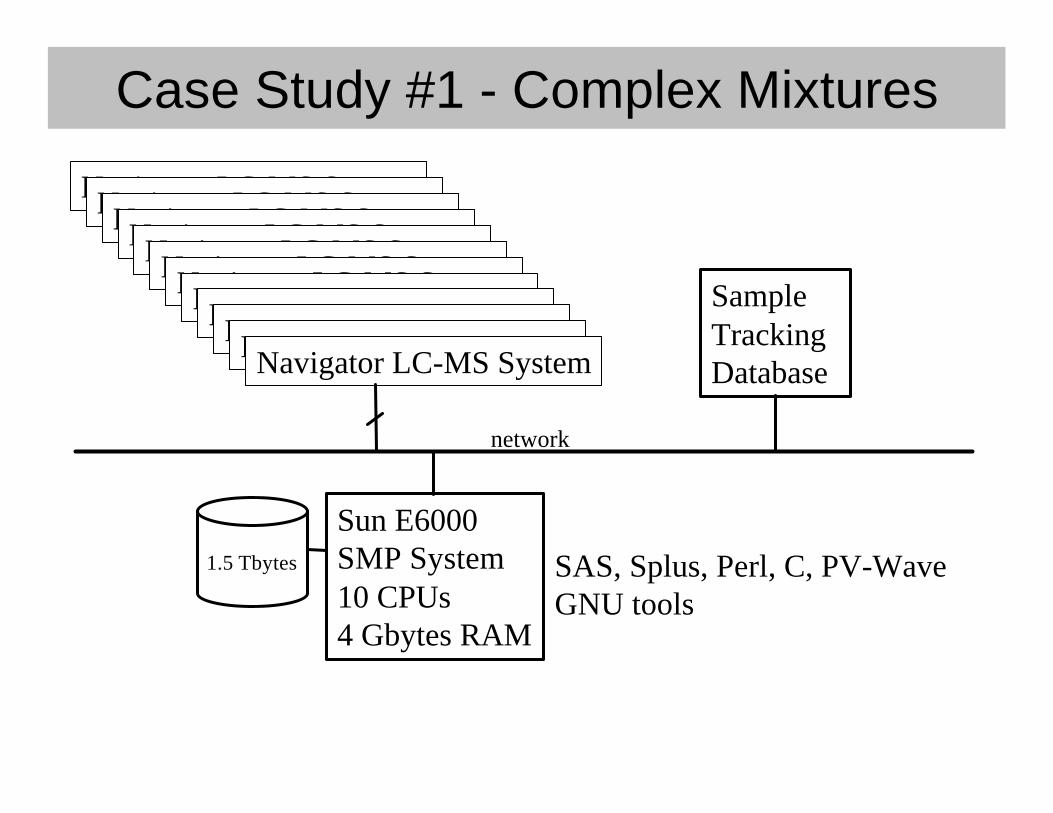
Case Study #1 - Complex Mixtures
SampleTrackingDatabase
Navigator LC-MS SystemNavigator LC-MS SystemNavigator LC-MS SystemNavigator LC-MS SystemNavigator LC-MS SystemNavigator LC-MS SystemNavigator LC-MS SystemNavigator LC-MS SystemNavigator LC-MS SystemNavigator LC-MS SystemNavigator LC-MS SystemNavigator LC-MS System
network
Sun E6000SMP System10 CPUs4 Gbytes RAM
1.5 Tbytes SAS, Splus, Perl, C, PV-WaveGNU tools

Case Study #1 - Complex MixturesTwo Similar Red Algae (by +MS)
Unknown Red Alga(San Simeon, CAJun '95)
Unknown Red Alga(Montano De Oro,CA Jun '95)

Case Study #1 - Complex MixturesTwo Dissimilar Sponges (by +MS)
Verongula rigida
UnknownEncrusting Sponge

Case Study #2 - FTMS• Business problem
– Screen traditionally difficult targets– Strategy
• Use FTMS to directly detect bound complexes
• Data analysis issues– Discrete wavelet transform to compress spectra– Detecting target:ligand complexes
• Matched filtering

Case Study #2 - FTMS• Path we took
– Bruker binary files• Cooperative vendor
– Linux cluster• Saved > $400K relative to SMP solution
– C++• Custom code• FFTW library• Wave++ library
– No user interface required• Populate existing HTS databases

Case Study #2 - FTMS
500 GbyteDisk
File Server(Sun Workstation)
Local networkSwitch
FTMSControl
PC
= 100 Mbit/sec ethernet= 100 Mbyte/sec Fibre channel
Master Compute Node20 Node Compute Cluster
21
Lilly Network
866 MHz Pentium III's512 MB RAM
FTMS HTSResults
Database
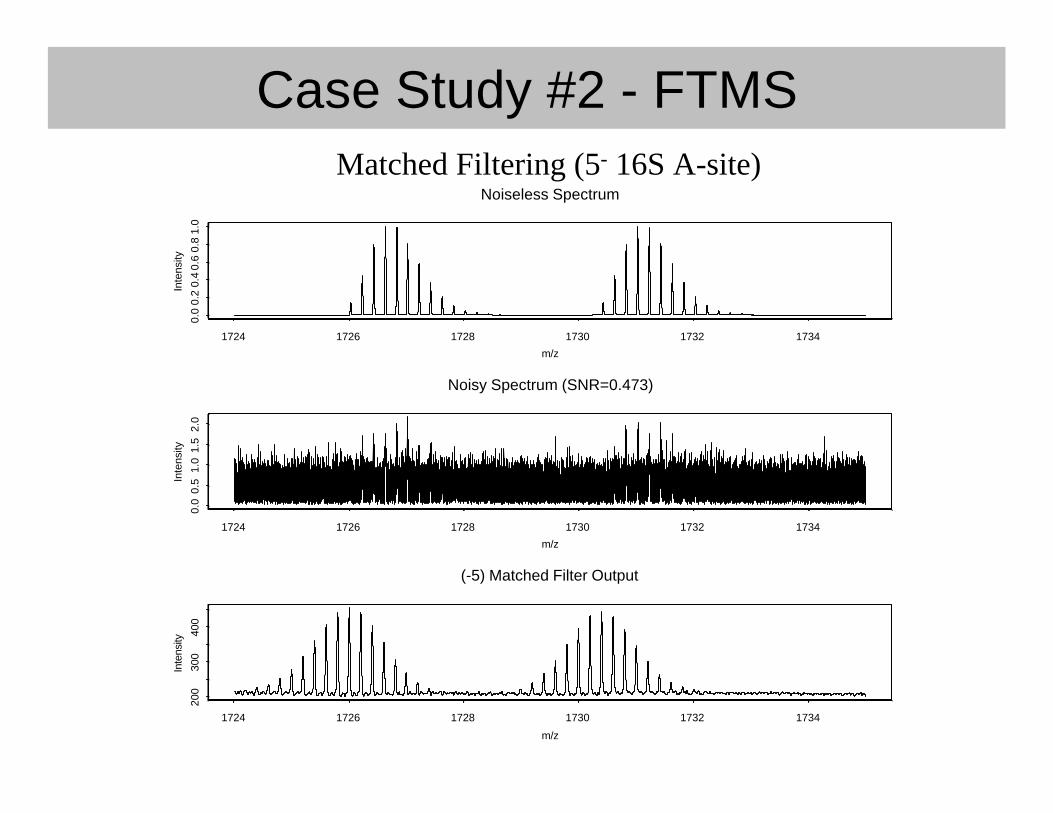
Case Study #2 - FTMS
1724 1726 1728 1730 1732 1734
m/z
0.0
0.2
0.4
0.6
0.8
1.0
Inte
nsity
Noiseless Spectrum
1724 1726 1728 1730 1732 1734
m/z
0.0
0.5
1.0
1.5
2.0
Inte
nsity
Noisy Spectrum (SNR=0.473)
1724 1726 1728 1730 1732 1734
m/z
200
300
400
Inte
nsity
(-5) Matched Filter Output
Matched Filtering (5- 16S A-site)
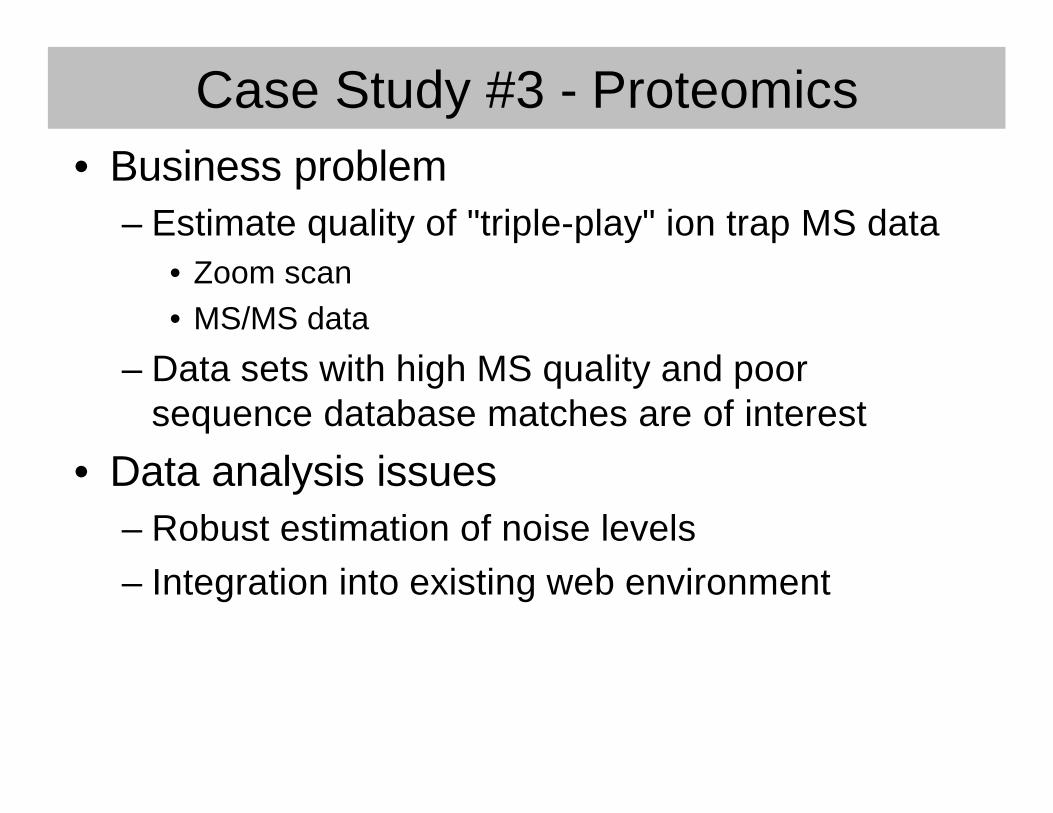
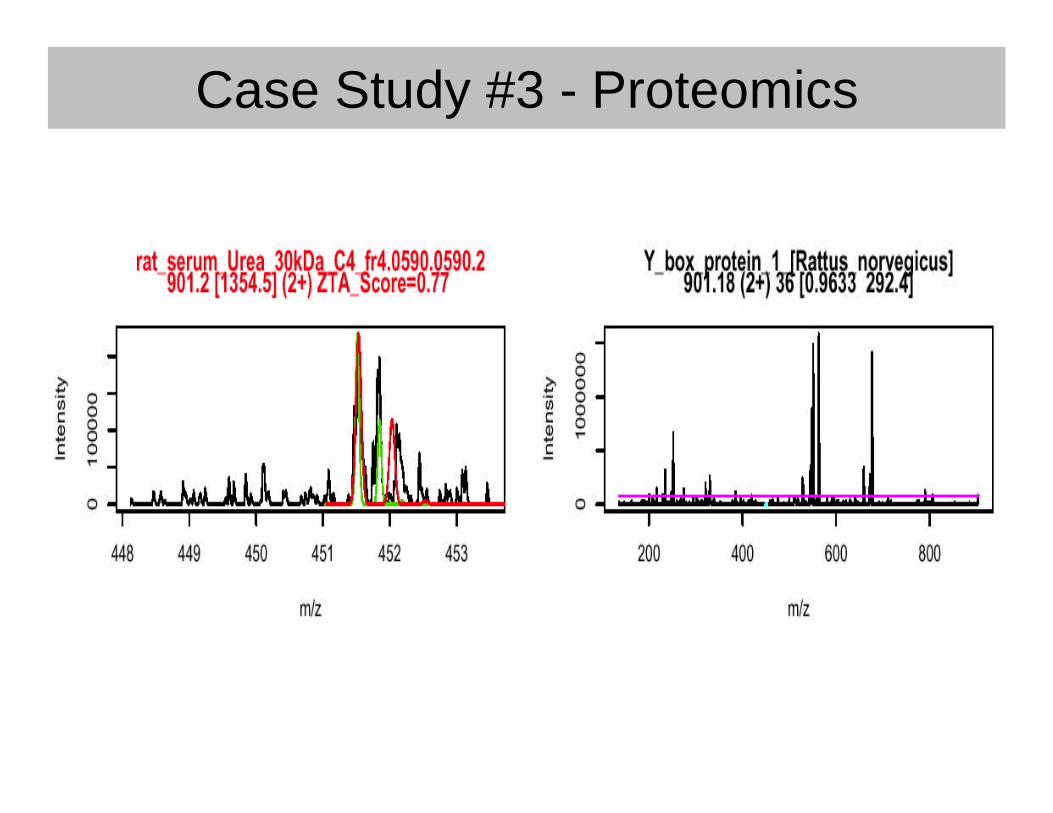
Case Study #3 - Proteomics• Business problem
– Estimate quality of "triple-play" ion trap MS data• Zoom scan• MS/MS data
– Data sets with high MS quality and poorsequence database matches are of interest
• Data analysis issues– Robust estimation of noise levels– Integration into existing web environment

Case Study #3 - Proteomics• Path we took
– Report files (*.zta, *.dta) files– Windows NT required– Tight integration required
• Use Perl as the glue
– R statistical computing environment• Rapid development
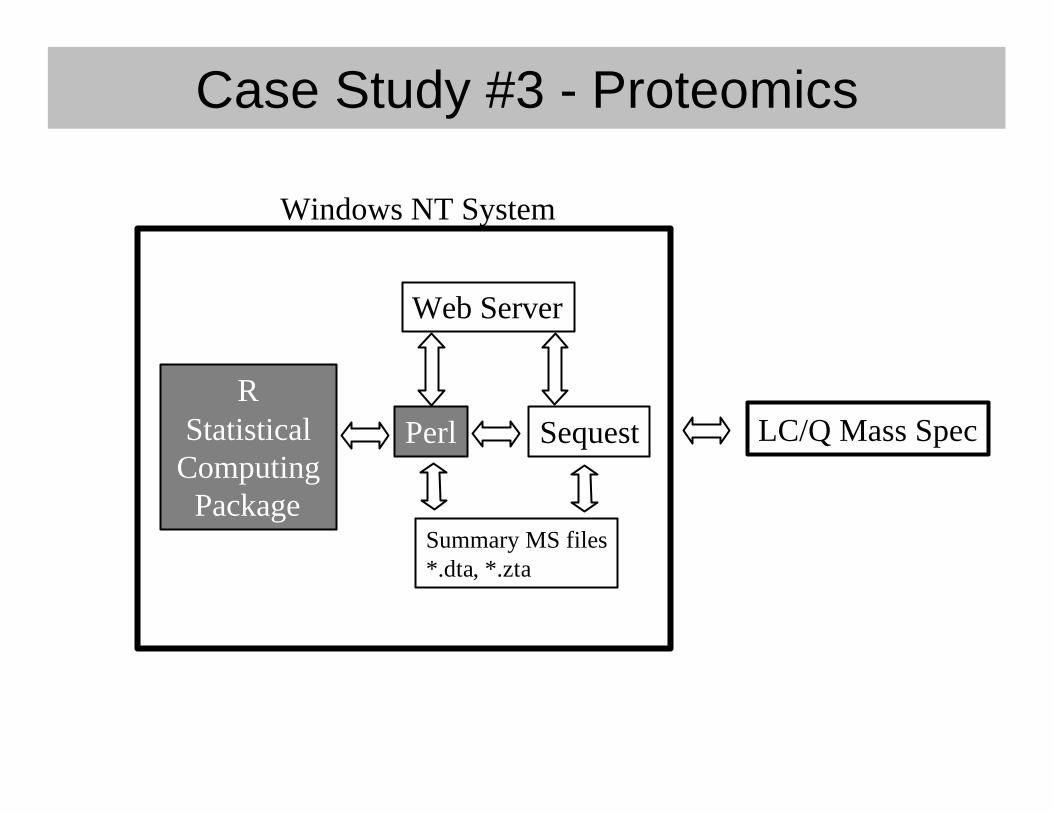
Case Study #3 - Proteomics
RStatistical
ComputingPackage
Perl
Windows NT System
Sequest
Summary MS files*.dta, *.zta
Web Server
LC/Q Mass Spec
Case Study #3 - Proteomics

Q&A
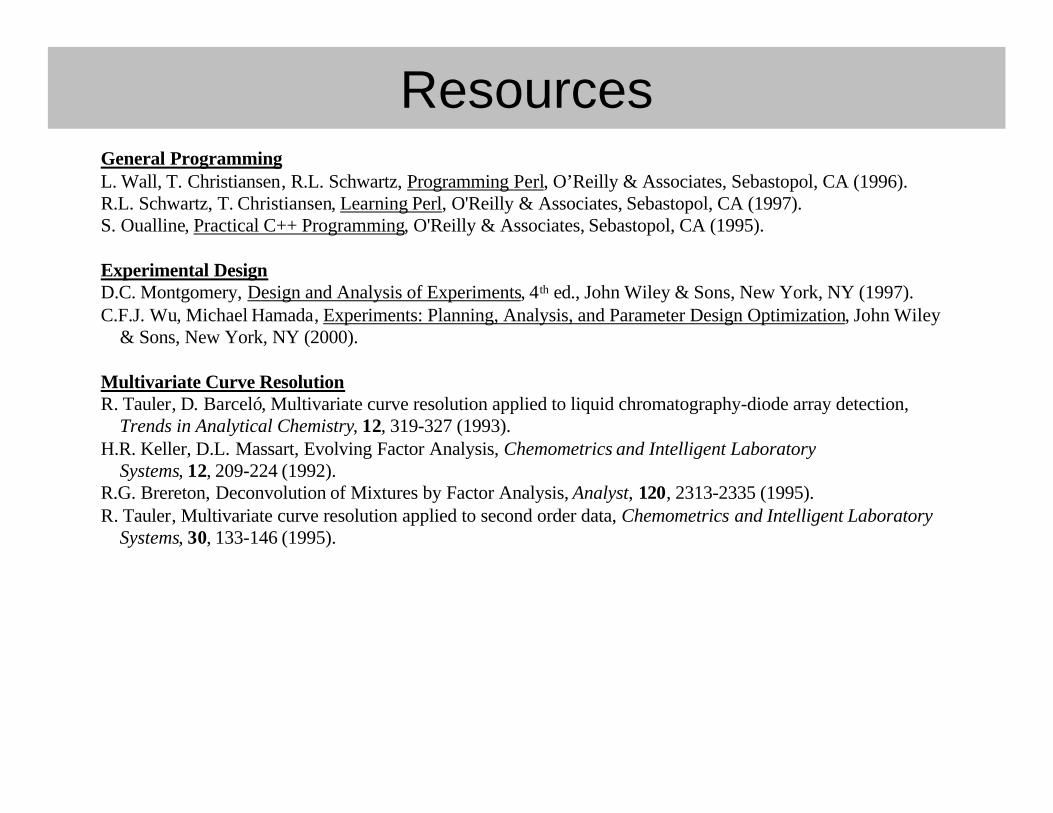
ResourcesGeneral ProgrammingL. Wall, T. Christiansen, R.L. Schwartz, Programming Perl, O’Reilly & Associates, Sebastopol, CA (1996).R.L. Schwartz, T. Christiansen, Learning Perl, O'Reilly & Associates, Sebastopol, CA (1997).S. Oualline, Practical C++ Programming, O'Reilly & Associates, Sebastopol, CA (1995).
Experimental DesignD.C. Montgomery, Design and Analysis of Experiments, 4th ed., John Wiley & Sons, New York, NY (1997).C.F.J. Wu, Michael Hamada, Experiments: Planning, Analysis, and Parameter Design Optimization, John Wiley & Sons, New York, NY (2000).
Multivariate Curve ResolutionR. Tauler, D. Barceló, Multivariate curve resolution applied to liquid chromatography-diode array detection, Trends in Analytical Chemistry, 12, 319-327 (1993).H.R. Keller, D.L. Massart, Evolving Factor Analysis, Chemometrics and Intelligent Laboratory Systems, 12, 209-224 (1992).R.G. Brereton, Deconvolution of Mixtures by Factor Analysis, Analyst, 120, 2313-2335 (1995).R. Tauler, Multivariate curve resolution applied to second order data, Chemometrics and Intelligent Laboratory Systems, 30, 133-146 (1995).

ResourcesStatistics / Machine LearningR. Duda, P. Hart, D. Stork, Pattern Classification, 2nd ed., John Wiley & Sons, New York, NY (2000).T. Hastie, R. Tibshirani, J. Friedman, The Elements of Statistical Learning-Data Mining, Inference, and Prediction, Springer-Verlag, New York, NY (2001).L. Breiman, J. Friedman, R. Olshen, C. Stone, Classification and Regression Trees, Wadsworth (1984).C. Bishop, Neural Networks for Pattern Recognition, Clarendon Press, Oxford (1995).B. Efron, R. Tibshirani, An Introduction to the Bootstrap, Chapman and Hall, London (1993).B.D. Ripley, Pattern Recognition and Neural Networks, Cambridge University Press (1996).
J.F. Elder, D. Pregibon, A Statistical Perspective On Knowledge Discovery In Databases, in Advances in Knowledge Discovery and Data Mining (Ch. 4), U.M. Fayyad, G. Piatetsky-Shapiro, P. Smyth, and R. Uthurusamy editors, AAAI/MIT Press (1995).Y. Freund, R. Shapire, A decision-theoretic generalization of online learning and an application to boosting, Journal of Computer and System Sciences, 55, 119-139 (1997).L. Breiman, Bagging predictors, Machine Learning, 26, 123-140 (1996).L. Breiman, Stacked regressions, Machine Learning, 24, 51-64 (1996).L. Breiman, Arcing classifiers (with discussion), Annals of Statistics, 26, 801-849 (1998).I. Frank, J. Friedman, A statistical view of some chemometrics regression tools (with discussion), Technometrics, 35(2), 109-148 (1993).
www.jmlr.org

ResourcesSupport Vector MachinesK.P. Bennett, C. Campbell, Support Vector Machines: Hype or Hallelujah?, ACM SIGKDD Explorations, 2(2), 1-13 (December 2000).C.J. Burges, A Tutorial on Support Vector Machines for Pattern Recognition, Data Mining & Knowledge Discovery, 2, 121-167 (1998).C. Campbell, An Introduction to Kernel Methods, In Radial Basis Function Networks: Design and Applications, R.J. Howlett & L.C. Jain editors, Physica Verlag, Berlin, Ch. 7, 155-192 (2000).www.kernel-machines.orgwww.support-vector.net
WaveletsA. Bruce, H. Gao, Applied Wavelet Analysis with S-PLUS, Springer-Verlag, New York, NY (1996).D.L. Donoho, I.M. Johnstone, Adapting to unknown smoothness via wavelet shrinkage, Journal of the American Statistical Association, 90(432), 1200-1224 1995.D.L. Donoho, De-noising by soft thresholding, IEEE Transactions on Information Theory, 41(3), 613-627 1995.D.L. Donoho, I. Johnstone, G. Kerkyacharian, D. Picard, Wavelet shrinkage: Asymptopia?, Journal of the Royal Statistical Society, Series B, 57, 301-369 1995 (with discussion).