automated bug assignment: ensemble-based machine learning...
TRANSCRIPT
Empir Software Eng manuscript No.(will be inserted by the editor)
Automated Bug Assignment: Ensemble-based
Machine Learning in Large Scale Industrial Contexts
Leif Jonsson · Markus Borg · DavidBroman · Kristian Sandahl · SigridEldh · Per Runeson
Received: date / Accepted: date
Abstract Context: Bug report assignment is an important part of softwaremaintenance. In particular, incorrect assignments of bug reports to develop-ment teams can be very expensive in large software development projects.Several studies propose automating bug assignment techniques using machinelearning in open source software contexts, but no study exists for large-scaleproprietary projects in industry. Objective: The goal of this study is to eval-uate automated bug assignment techniques that are based on machine learn-ing classi�cation. In particular, we study the state-of-the-art ensemble learnerStacked Generalization (SG) that combines several classi�ers. Method: Wecollect more than 50,000 bug reports from �ve development projects from twocompanies in di�erent domains. We implement automated bug assignment
L. JonssonEricsson and Department of Computer and Information Science Linköping UniversityTorshamnsgatan 42SE-16480, Stockholm, SwedenTel.: +46-107147215E-mail: [email protected]
M. BorgDepartment of Computer Science, Lund UniversityE-mail: [email protected]
D. BromanUniversity of California, BerkeleyE-mail: [email protected]
K. SandahlDepartment of Computer and Information Science Linköping UniversityE-mail: [email protected]
S. EldhEricsson ABE-mail: [email protected]
P. RunesonDepartment of Computer Science, Lund UniversityE-mail: [email protected]
2 Leif Jonsson et al.
and evaluate the performance in a set of controlled experiments. Results:Weshow that SG scales to large scale industrial application and that it outper-forms the use of individual classi�ers for bug assignment, reaching predictionaccuracies from 50% to 90% when large training sets are used. In addition, weshow how old training data can decrease the prediction accuracy of bug as-signment. Conclusions: We advice industry to use SG for bug assignment inproprietary contexts, using at least 2,000 bug reports for training. Finally, wehighlight the importance of not solely relying on results from cross-validationwhen evaluating automated bug assignment.
1 Introduction
In large projects, the continuous in�ow of bug reports1 challenges the develop-ers' abilities to overview the content of the Bug Tracking System (BTS) (Bet-tenburg et al, 2008; Just et al, 2008). As a �rst step toward correcting a bug,the corresponding bug report must be assigned to a development team or anindividual developer. This task, referred to as bug assignment, is normally donemanually. However, several studies report that manual bug assignment is labor-intensive and error-prone (Baysal et al, 2009; Jeong et al, 2009; Bhattacharyaet al, 2012), resulting in �bug tossing� (i.e., reassigning bug reports to anotherdeveloper) and delayed bug corrections. Previous work report that bug tossingis frequent in large projects; 25% of bug reports are reassigned in the EclipsePlatform project (Anvik and Murphy, 2011) and over 90% of the �xed bugs inboth the Eclipse Platform project and in projects in the Mozilla foundationhave been reassigned at least once (Bhattacharya et al, 2012). Moreover, wehave previously highlighted the same phenomenon in large-scale maintenanceat Ericsson (Jonsson et al, 2012).
Several researchers have proposed improving the situation by automatingbug assignment. The most common automation approach is based on classi-
�cation using supervised Machine Learning (ML) (Anvik et al, 2006; Jeonget al, 2009; Alenezi et al, 2013) (see Section 2 for a discussion about machinelearning and classi�cation). By training a classi�er, incoming bug reports canautomatically be assigned to developers. A wide variety of classi�ers have beensuggested, and previous studies report promising prediction accuracies rang-ing from 40% to 60% (Anvik et al, 2006; Ahsan et al, 2009; Jeong et al, 2009;Lin et al, 2009). Previous work has focused on Open Source Software (OSS)development projects, especially the Eclipse and Mozilla projects. Only a fewstudies on bug assignment in proprietary development projects are available,and they target small organizations (Lin et al, 2009; Helming et al, 2011). Al-though OSS development is a relevant context to study, it di�ers from propri-etary development in aspects such as development processes, team structure,and developer incentives. Consequently, whether previous research on auto-
1 Other common names for bug report include issues, tickets, fault reports, trouble reports,defect reports, anomaly reports, maintenance requests, and incidents.

Title Suppressed Due to Excessive Length 3
mated bug assignment applies to large proprietary development organizationsremains an open question.
Researchers have evaluated several di�erent ML techniques for classifyingbug reports. The two most popular classi�ers in bug assignment are NaiveBayes (NB) and Support Vector Machines (SVM), applied in pioneering workby Cubranic and Murphy (2004) and Anvik et al (2006), respectively. Previ-ous work on bug assignment has also evaluated several other classi�ers, andcompared the prediction accuracy (i.e., the proportion of bug reports assignedto the correct developer) with varying results (Anvik et al, 2006; Ahsan et al,2009; Helming et al, 2011; Anvik and Murphy, 2011; Bhattacharya et al, 2012).To improve the accuracy, some authors have presented customized solutionsfor bug assignment, tailored for their speci�c project contexts (e.g., Xie et al(2012) and Xia et al (2013)). While such approaches have the potential tooutperform general purpose classi�ers, we instead focus on a solution that canbe deployed as a plug-in to an industrial BTS with limited customization. Onthe other hand, our solution still provides a novel technical contribution in re-lation to previous work on ML-based bug assignment by combining individualclassi�ers.
Studies in other domains report that ensemble learners, an approach tocombine classi�ers, can outperform individual techniques when there is di-versity among the individual classi�ers (Kuncheva and Whitaker, 2003). Inrecent years, combining classi�ers has been used also for applications in soft-ware engineering. Examples include e�ort estimation (Li et al, 2008), faultlocalization (Thomas et al, 2013), and fault classi�cation (Xia et al, 2013).In this article, we propose using Stacked Generalization (SG) (Wolpert, 1992)as the ensemble learner for improving prediction accuracy in automated bugassignment. SG is a state-of-the-art method to combine output from multipleclassi�ers, used in a wide variety of applications. One prominent example wasdeveloped by the winning team of the Net�ix Prize, where a solution involvingSG outperformed the competition in predicting movie ratings, and won the $1million prize (Sill et al, 2009). In the �eld of software engineering, applicationsof SG include predicting the numbers of remaining defects in black-box test-ing (Li et al, 2011), and malware detection in smartphones (Amamra et al,2012). In a previous pilot study, we initially evaluated using SG for bug assign-ment with promising results (Jonsson et al, 2012). Building on our previouswork, this paper constitutes a deeper study using bug reports from di�erentproprietary contexts. We analyze how the prediction accuracy depends on thechoice of individual classi�ers used in SG. Furthermore, we study learning
curves for di�erent systems, that is, how the amount of training data impactsthe overall prediction accuracy.
We evaluate our approach of automated bug assignment on bug reportsfrom �ve large proprietary development projects. Four of the datasets origi-nate from product development projects at a telecom company, totaling morethan 35,000 bug reports. To strengthen the external validity of our results, wealso study a dataset of 15,000 bug reports, collected from a company devel-oping industrial automation systems. Both development contexts constitute

4 Leif Jonsson et al.
large-scale proprietary software development, involving hundreds of engineers,working with complex embedded systems. As such, we focus on software engi-neering much di�erent from the OSS application development that has beenthe target of most previous work. Moreover, while previous work address bugassignment to individual developers, we instead evaluate bug assignment to
di�erent development teams, as our industrial partners report this task tobe more important. In large scale industrial development it makes sense toassign bugs to a team and let the developers involved distribute the work in-ternally. Individual developers might be unavailable for a number of reasons,e.g., temporary peaks of workload, sickness, or employee turnover, thus teamassignment is regarded as more important by our industry partners.
The overall goal of our research is to support bug assignment in large pro-
prietary development projects using state-of-the-art ML. We further re�ne thisgoal into four Research Questions (RQ):
RQ1 Does stacked generalization outperform individual classi�ers?RQ2 How does the ensemble selection in SG a�ect the prediction accuracy?RQ3 How consistent learning curves does SG display across projects?RQ4 How does the time locality of training data a�ect the prediction accuracy?
To be more speci�c, our contributions are as follows:
� We synthesize results from previous studies on automated bug assignmentand present a comprehensive overview (Section 3).
� We present the �rst empirical studies of automated bug assignment withdata originating from large proprietary development contexts, where bugassignments are made at team level (Section 4).
� We conduct a series of experiments to answer the above speci�ed researchquestions (Section 5) and report the experimental results and analysis froma practical bug assignment perspective (Section 6), including analyzingthreats to validity (Section 7).
� We discuss the big picture, that is, the potential to deploy automated sup-port for bug assignment in the two case companies under study (Section 8).
2 Machine Learning
Machine learning is a �eld of study where computer programs can learn andget better at performing speci�c tasks by training on historical data. In thissection, we discuss more speci�cally what machine learning means in our con-text, focusing on supervised machine learning�the type of machine learningtechnique used in this paper.
2.1 Supervised Machine Learning Techniques and their Evaluation
In supervised learning, a machine learning algorithm is trained on a training
set (Bishop, 2006). A training set is a subset of some historical data that is
Title Suppressed Due to Excessive Length 5
collected over time. Another subset of the historical data is the test set, usedfor evaluation. The evaluation determines how well the system performs withrespect to some metric. In our context, an example metric is the number of bugreports that are assigned to correct development teams, that is, the teams thatended up solving the bugs. The training set can, in turn, be split into disjointsets for parameter optimization. These sets are called hold-out or validationsets. After the system has been trained on the training data, the system is thenevaluated on each of the instances in the test set. From the point of view ofthe system, the test instances are completely new since none of the instancesin the training set are part of the test set.
To evaluate the predictions, we apply cross-validation with strati�cation(Kohavi, 1995). Strati�cation means that the instances in the training setsand the test sets are selected to be proportional to their distribution in thewhole dataset. In our experiments, we use strati�ed 10-fold cross-validation,where the dataset is split into ten strati�ed sets. Training and evaluation arethen performed ten times, each time shifting the set used for testing. The �nalestimate of accuracy of the system is the average of these ten evaluations.
In addition to 10-fold cross-validation, we use two versions of timed evalu-ation to closely replicate a real world scenario: sliding window and cumulativetime window. In the sliding window evaluation, both the training set and thetest set have �xed sizes, but the time di�erence between the sets varies byselecting the training set farther back in time. Sliding window is described inmore details in Section 5.5.4. The sliding window approach makes it possibleto study how time locality of bug reports a�ects the prediction accuracy of asystem.
The cumulative time window evaluation also has a �xed sized test set, butincreases the size of the training set by adding more data farther back in time.This scheme is described in more details in Section 5.5.5. By adding more bugreports incrementally, we can study if adding older bug reports is detrimentalto prediction accuracy.
2.2 Classi�cation
We are mainly concerned with the type of machine learning techniques calledclassi�cation techniques. In classi�cation, a software component, called a clas-si�er, is invoked with inputs that are named features. Features are extractedfrom the training data instances. Features can, for instance, be in the form offree text, numbers, or nominal values. As an example, an instance of a bugreport can be represented in terms of features where the subject and descrip-tion are free texts, the customer is a nominal value from a list of possiblecustomers, and the severity of the bug is represented on an ordinal scale. Inthe evaluation phase, the classi�er will�based on the values of the features ofa particular instance�return the class that the features correspond to. In ourcase, the di�erent classes correspond to the development teams in the organi-zation that we want to assign bugs to. The features can vary from organization

6 Leif Jonsson et al.
to organization, depending on which data that is collected in the bug trackingsystem.
2.3 Ensemble Techniques and Stacked Generalization
It is often bene�cial to combine the results of several individual classi�ers. Thegeneral idea to combine classi�ers is called ensemble techniques. Classi�ers canbe combined in several di�eret ways. In one ensemble technique, called bag-
ging (Breiman, 1996), many instances of the same type of classi�er are trainedon di�erent versions of the training set. Each classi�er is trained on a newdataset, created by sampling with replacement from the original dataset. The�nal result is then obtained by averaging the results from all of the classi�ersin the ensemble. Another ensemble technique, called boosting, also involvestraining several instances of the same type of classi�er on a modi�ed trainingset, which places di�erent weights on the di�erent training instances. The clas-si�ers are trained and evaluated in sequence with subsequent classi�ers trainedwith higher weights on instances that previous classi�ers have misclassi�ed. Apopular version of boosting is called Adaboost (Freund and Schapire, 1995).Both bagging and boosting use the same type of classi�ers in the ensembleand vary the data the classi�ers are trained on.
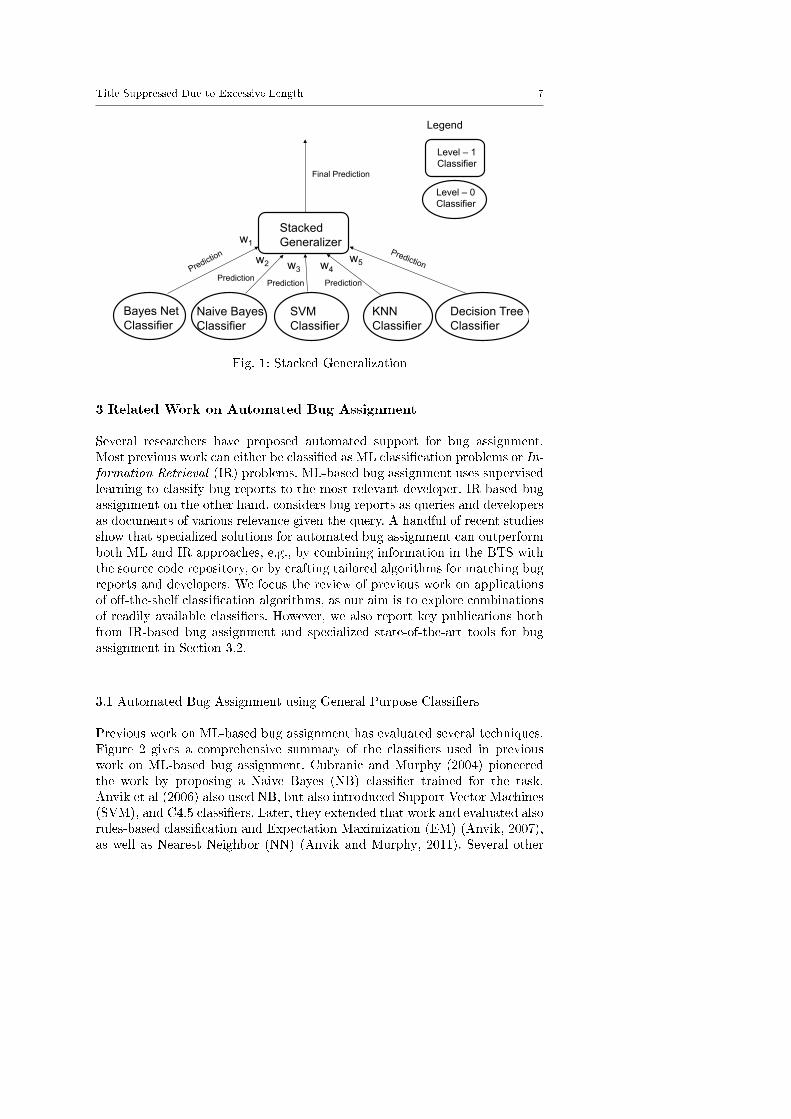
Stacked Generalization (SG) (Wolpert, 1992) (also called stacking or blend-ing) is an ensemble technique that combines several level-0 classi�ers of di�er-ent types with one level-1 classi�er (see Figure 1) into an ensemble. The level-1classi�er trains and evaluates all of the level-0 classi�ers on the same data andlearns (using a separate learning algorithm) which of the underlying classi�ers(the level-0 classi�ers) that perform well on di�erent classes and data. Thelevel-1 training algorithm is typically a relatively simple smooth linear model(Witten et al, 2011), such as logistic regression. Note that in stacking, it iscompletely permissible to put other ensemble techniques as level-0 classi�ers.
In this study (see Sections 5 and 6), we are using stacked generalizationbecause this ensemble technique meets our goal of combining and evaluatingdi�erent classi�ers.
Title Suppressed Due to Excessive Length 7
Stacked Generalizer
Decision Tree Classifier
SVM Classifier
KNN Classifier
Naive Bayes Classifier
Bayes Net Classifier
w1
w2 w3 w4 w5
Final Prediction
Level – 1 Classifier
Level – 0 Classifier
Prediction Prediction Prediction
Legend
Fig. 1: Stacked Generalization
3 Related Work on Automated Bug Assignment
Several researchers have proposed automated support for bug assignment.Most previous work can either be classi�ed as ML classi�cation problems or In-formation Retrieval (IR) problems. ML-based bug assignment uses supervisedlearning to classify bug reports to the most relevant developer. IR-based bugassignment on the other hand, considers bug reports as queries and developersas documents of various relevance given the query. A handful of recent studiesshow that specialized solutions for automated bug assignment can outperformboth ML and IR approaches, e.g., by combining information in the BTS withthe source code repository, or by crafting tailored algorithms for matching bugreports and developers. We focus the review of previous work on applicationsof o�-the-shelf classi�cation algorithms, as our aim is to explore combinationsof readily available classi�ers. However, we also report key publications bothfrom IR-based bug assignment and specialized state-of-the-art tools for bugassignment in Section 3.2.
3.1 Automated Bug Assignment using General Purpose Classi�ers
Previous work on ML-based bug assignment has evaluated several techniques.Figure 2 gives a comprehensive summary of the classi�ers used in previouswork on ML-based bug assignment. Cubranic and Murphy (2004) pioneeredthe work by proposing a Naive Bayes (NB) classi�er trained for the task.Anvik et al (2006) also used NB, but also introduced Support Vector Machines(SVM), and C4.5 classi�ers. Later, they extended that work and evaluated alsorules-based classi�cation and Expectation Maximization (EM) (Anvik, 2007),as well as Nearest Neighbor (NN) (Anvik and Murphy, 2011). Several other

8 Leif Jonsson et al.
researchers continued the work by Anvik et al by evaluating classi�cation-based bug assignment on bug reports from di�erent projects, using a varietyof classi�ers. Ahsan et al (2009) were the �rst to introduce Decision Trees(DT), RBF Network (RBF), REPTree (RT), and Random Forest (RF) forbug assignment. The same year, Jeong et al (2009) proposed to use BayesianNetworks (BNet). Helming et al (2011) used Neural Networks (NNet) andConstant Classi�er (CC). In our work, we evaluate 28 di�erent classi�ers, aspresented in Section 5.
Two general purpose classi�cation techniques have been used more thanthe others, namely NB and SVM (cf. Figure 2). The numerous studies on NBand SVM are in line with ML work in general; NB and SVM are two standardclassi�ers with often good results that can be considered default choices whenexploring a new task. Other classi�ers used in at least three previous studieson bug assignment are Bayesian Networks (BNET), and C4.5. We include bothNB and SVM in our study, as presented in Section 5.
Eight of the studies using ML-based bug assignment compare di�erentclassi�ers. The previously largest comparative studies of general purpose clas-si�ers for bug assignment used seven and six classi�ers, respectively, (Ahsanet al, 2009; Helming et al, 2011). We go beyond previous work by compar-ing more classi�ers. Moreover, we propose applying ensemble learning for bugassignment, i.e., combining several di�erent classi�ers.
Figure 2 also displays the features used to represent bug reports in previouswork on ML-based bug assignment. Most previous approaches rely solely ontextual information, most often the title and description of bug reports. Onlytwo of the previous studies combine textual and nominal features in theirsolutions. Ahsan et al (2009) include information about product, component,and platform, and Lin et al (2009) complement textual information withcomponent, type, phase, priority, and submitter. In our study, we complementtextual information by submitter site, submitter type, software revision, andbug priority.
Figure 3 shows an overview of the previous evaluations of automated bugassignment (including studies presented in Section 3.2. It is evident that pre-vious work has focused on the context of Open Source Software (OSS) de-velopment, as 23 out of 25 studies have studied OSS bug reports. This is inline with general research in empirical software engineering, explained by theappealing availability of large amounts of data and the possibility of replica-tions (Robinson and Francis, 2010). While there is large variety within the OSSdomain, there are some general di�erences from proprietary bug managementthat impact our work. First, the bug databases used in OSS development aretypically publicly available; anyone can submit bug reports. Second, Paulsonet al (2004) report that defects are found and �xed faster in OSS projects.Third, while proprietary development often is organized in teams, an OSSdevelopment community rather consists of individual developers. Also, themanagement in a company typically makes an e�ort to maintain stable teamsover time despite employee turnover, while the churn behavior of individualdevelopers in OSS projects is well-known (Asklund and Bendix, 2002; Robles

Title Suppressed Due to Excessive Length 9
Fig. 2: Techniques used in previous studies on ML-based bug assignment.Bold author names indicate comparative studies, capital X shows the classi�ergiving the best results. IR indicates Information Retrieval techniques. The lastrow shows the study presented in this paper.
and Gonzalez-Barahona, 2006). Consequently, due to the di�erent nature ofOSS development, it is not clear to what extent previous �ndings based onOSS data can be generalized to proprietary contexts. Moreover, we are notaware of any major OSS bug dataset that contains team assignments withwhich we can directly compare our work. This is unfortunate since it wouldbe interesting to use the same set of tools in the two di�erent contexts.
As the organization of developers in proprietary projects tend to be dif-ferent from OSS communities, the bug assignment task we study di�ers ac-cordingly. While all previous work (including the two studies on proprietarydevelopment contexts by Lin et al (2009) and Helming et al (2011)) aim atsupporting assignment of bug reports to individual developers, we instead ad-dress the task of bug assignment to development teams. Thus, as the numberof development teams is much lower than the number of developers in nor-mal projects, direct comparisons of our results to previous work can not be

10 Leif Jonsson et al.
made. As an example, according to Open HUB2 (Dec 2014), the number ofcontributors to some of the studied OSS projects in Figure 3 are: Linux kernel(13,343), GNOME (5,888), KDE (4,060), Firefox (3,187), NetBeans (893), gcc(534), Eclipse platform (474), Bugzilla (143), OpenO�ce (124), Mylyn (92),ArgoUML (87), Maemo (83), UNICASE (83), jEdit (55), and muCommander(9). Moreover, while the number of bugs resolved in our proprietary datasetsis somewhat balanced, contributions in OSS communities tend to follow the�onion model� (Aberdour, 2007), i.e., the commit distribution is skewed, a fewcore developers contribute much source code, but most developers contributeonly occasionally.
Bug reports from the development of Eclipse are used in 14 out of the21 studies (cf. Figure 3). Still, no set of Eclipse bugs has become the de factobenchmark. Instead, di�erent subsets of bug reports have been used in previouswork, containing between 6,500 and 300,000 bug reports. Bug reports origi-nating from OSS development in the Mozilla foundation is the second moststudied system, containing up to 550,000 bug reports (Bhattacharya et al,2012). While we do not study bug repositories containing 100,000s of bug re-ports, our work involves much larger datasets than the previously largest studyin a proprietary context by (Lin et al, 2009) (2,576 bug reports). Furthermore,we study bug reports from �ve di�erent development projects in two di�erentcompanies.
The most common measure to report the success in previous work is ac-curacy3, reported in 10 out of 21 studies. As listed in Figure 3, predictionaccuracies ranging from 0.14 to 0.78 have been reported, with an average of0.42 and standard deviation of 0.17. This suggests that a rule of thumb couldbe that automated bug assignment has the potential to correctly assign almostevery second bug to an individual developer.
3.2 Other Approaches to Automated Bug Assignment
Some previous studies consider bug assignment as an IR problem, meaningthat the incoming bug is treated as a search query and the assignment op-tions are the possible documents to retrieve. There are two main families ofIR models used in software engineering: algebraic models and probabilisticmodels (Borg et al, 2014). For automated bug assignment, four studies usedalgebraic models (Chen et al, 2011; Kagdi et al, 2012; Nagwani and Verma,2012; Shokripour et al, 2012). A probabilistic IR model on the other hand, hasonly been applied by Canfora and Cerulo (2006). Moreover, only (Linares-Vasquez et al, 2012) evaluated bug assignment using both classi�cation and IRin the same study, and reported that IR displayed the most promising results.
2 Formerly Ohloh.net, an open public library presenting analyses of OSS projects(www.openhub.net).3 Equivalent to recall when recommending only the most probable developer, aka. the
Top-1 recommendation or Rc@1

Title Suppressed Due to Excessive Length 11
Fig. 3: Evaluations performed in previous studies with BTS focus. Bold authornames indicate studies evaluating general purpose ML-based bug assignment.Results are listed in the same order as the systems appear in the fourth column.The last row shows the study presented in this paper, even though it is notdirectly comparable.
Most studies on IR-based bug assignment report F-scores instead of accu-racy. In Figure 3 we present F-scores for the �rst candidate developer suggestedin previous work (F@1). The F-scores display large variation; about 0.60 for astudy on muCommander and one of the studies of Eclipse, and very low valueson work on Firefox, gcc, and jEdit. The variation shows that the potential ofautomated bug assignment is highly data dependent, as the same approachevaluated on di�erent data can display large di�erences (Anvik and Murphy,2011; Linares-Vasquez et al, 2012). A subset of IR-based studies reports nei-ther accuracy nor F-score. Chen et al (2011) conclude that their automatedbug assignment signi�cantly reduces bug tossing as compared to manual work.Finally, Kagdi et al (2012) and Nagwani and Verma (2012) perform qualitative
12 Leif Jonsson et al.
evaluations of their approaches. Especially the former study reports positiveresults.
Three studies on automated bug assignment identi�ed in the literaturepresent tools based on content-based and collaborative �ltering, i.e., techniquesfrom research on Recommendation Systems (Robillard et al, 2014). Park et al(2011) developed an RS where bug reports are represented by their textualdescription extended by the nominal features: platform, version, and devel-opment phase. Baysal et al (2009) presented a framework for recommendingdevelopers for a given bug report, using a vector space analysis of the historyof previous bug resolutions. Matter et al (2009) matched bug reports to devel-opers by modelling the natural language in historical commits and comparingthem to the textual content of bug reports.
More recently, some researchers have showed that the accuracy of auto-mated bug assignment can be improved by implementing more advanced al-gorithms, tailored for both the task and the context. Tamrawi et al (2011)proposed Bugzie, an automated bug assignment approach they refer to asfuzzy set and cache-based. Two assumptions guide their work: 1) the textualcontent of bug reports is assumed to relate to a speci�c technical aspect of thesoftware system, and 2) if a developer frequently resolves bugs related to such atechnical aspect, (s)he is capable of resolving related bugs in the future. Bugziemodels both technical aspects and developers' expertise as bags-of-words andmatches them accordingly. Furthermore, to improve the scalability, Bugzierecommends only developers that recently committed bug resolutions, i.e., de-velopers in the cache. Bugzie was evaluated on more than 500,000 bug reportsfrom seven OSS projects, and achieved an prediction accuracies between 30%and 53%.
Wu et al (2011) proposed DREX, an approach to bug assignment usingk-nearest neighbour search and social network analysis. DREX recommendsperforms assignment by: 1) �nding textually similar bug reports, 2) extractingdevelopers involved in their resolution, and 3) ranking the developers expertiseby analyzing their participation in resolving the similar bugs. The participa-tion is based on developers' comments on historical bug reports, both man-ually written comments and comments automatically generated when sourcecode changes are committed. DREX uses the comments to construct a socialnetwork, and approximated participation using a series of network measures.An evaluation on bug reports from the Firefox OSS project shows the so-cial network analysis of DREX outperforms a purely textual approach, witha prediction accuracy of about 15% and recall when considering the Top-10recommendations (Rc@10, i.e., the bug is included in the 10 �rst recommen-dations) of 0.66.
Servant and Jones (2012) developed WhoseFault, a tool that both assignsa bug to a developer and presents a possible location of the fault in the sourcecode. WhoseFault is also di�erent from other approaches reported in this sec-tion, as it performs its analysis originating from failures from automated test-ing instead of textual bug reports. To assign appropriate developers to a failure,WhoseFault combines a framework for automated testing, a fault localization

Title Suppressed Due to Excessive Length 13
technique, and the commit history of individual developers. By �nding thelikely position of a fault, and identifying the most active developers of thatpiece of source code, WhoseFault reaches a prediction accuracy of 35% for the889 test cases studied in the AspectJ OSS project. Moreover, the tool reportsthe correct developer among the top-3 recommendations for 81.44% of the testcases.
A trending technique to process and analyze natural language text in soft-ware engineering is topic modeling. Xie et al (2012) use topic models for auto-mated bug assignment in their approach DRETOM. First, the textual contentof bug reports is represented using topic models (Latent Dirichlet Allocation(LDA) Blei et al (2003)). Then, based on the bug-topic distribution, DRETOMmaps each bug report to a single topic. Finally, developers and bug reports areassociated using a probabilistic model, considering the interest and expertise
of a developer given the speci�c bug report. DRETOM was evaluated on morethan 5,000 bug reports from the Eclipse and Firefox OSS projects, and achievedan accuracy of about 15%. However, considering the Top-5 recommendationsthe recall reaches 80% and 50% for Eclipse and Firefox, respectively.
Xia et al (2013) developed DevRec, a highly specialized tool for automatedbug assignment, that also successfully implemented topic models. Similar tothe bug assignment implemented in DREX, DevRec �rst performs a k-nearestneighbours search. DevRec however calculates similarity between bug reportsusing an advanced combination of the terms in the bug reports, its topic asextracted by LDA, and the product and component the bug report is relatedto (referred to as BR-based analysis). Developers are then connected to bugreports based on multi-label learning using ML-KNN. Furthermore, DevRecthen also models the a�nity between developers and bug reports by calculat-ing their distances (referred to as D-based analysis). Finally, the BR-analysisand the D-based analyses are combined to recommend developers for new bugreports. Xia et al (2013) evaluated DevRec on more than 100,000 bug reportsfrom �ve OSS projects, and they also implemented the approaches proposedin both DREX and Bugzie to enable a comparison The authors report aver-age Rc@5 and Rc@10 of 62% and 74%, respectively, constituting considerableimprovements compared to both DREX and Bugzie.
In contrast to previous work on specialised tools for bug assignment, wepresent an approach based on general purpose classi�ers. Furthermore, ourwork uses standard features of bug reports, readily available in a typical BTS.As such, we do not rely on advanced operations such as mining developers'social networks, or data integration with the commit history from a separatesource code repository. The reasons for our more conservative approach are�vefold:
1. Our study constitutes initial work on applying ML for automated bug as-signment in proprietary contexts. We consider it an appropriate strategyto �rst evaluate general purpose techniques, and then, if the results arepromising, move on to further re�ne our solutions. However, while we ad-
14 Leif Jonsson et al.
vocate general purpose classi�ers in this study, the way we combine theminto an ensemble is novel in automated bug assignment.
2. The two proprietary contexts under study are di�erent in terms of workprocesses and tool chains, thus it would not be possible to develop onespecialized bug assignment solution that �ts both the organizations.
3. As user studies on automated bug assignment are missing, it is unclear towhat extent slight tool improvements are of practical signi�cance for an enduser. Thus, before studies evaluate the interplay between users and tools,it is unclear if specialized solutions are worth the additional developmente�ort required. This is in line with discussions on improved tool supportfor trace recovery (Borg and Pfahl, 2011), and the di�erence of correctnessand utility of recommendation systems in software engineering (Avazpouret al, 2014).
4. Relying on general purpose classi�ers supports transfer of research resultsto industry. Our industrial partners are experts on developing high qualityembedded software systems, but they do not have extensive knowledge ofML. Thus, delivering a highly specialized solution would complicate boththe hand-over and the future maintenance of the tool. We expect that thisobservation generalizes to most software intensive organizations.
5. Using general purpose techniques supports future replications in other com-panies. As such replications could be used to initiate case studies involvingend users, a type of studies currently missing, we believe this to be animportant advantage of using general purpose classi�ers.
4 Case Descriptions
This section describes the two case companies under study, both of which arebigger than the vast majority of OSS projects. In OSS projects a typical power-law behavior is seen with a few projects, such as the Linux kernel, Mozilla etc,having large number of contributors. We present the companies guided by thesix context facets proposed by Petersen and Wohlin (2009), namely product,processes, practices and techniques, people, organization, and market. Also, wepresent a simpli�ed model of the bug handling processes used in the companies.Finally, we illustrate where in the process our machine learning system couldbe deployed to increase the level of automation, as de�ned by Parasuramanet al (2000)4.
4.1 Description of Company Automation
Company Automation is a large international company active in the power andautomation sector. The case we study consists of a development organizationmanaging hundreds of engineers, with development sites in Sweden, India,
4 Ten levels of automation, ranging from 0, for fully manual work, to 10, when the com-puter acts autonomously ignoring the human.

Title Suppressed Due to Excessive Length 15
Germany, and the US. The development context is safety-critical embeddeddevelopment in the domain of industrial control systems, governed by IEC615115. A typical project has a length of 12-18 months and follows an iterativestage-gate project management model. The software is certi�ed to a SafetyIntegrity Level (SIL) of 2 as de�ned by IEC 615086 mandating strict processeson the development and maintenance activities. As speci�ed by IEC 61511,all changes to safety classi�ed source code requires a formal impact analysisbefore any changes are made. Furthermore, the safety standards mandate thatboth forward and backward traceability should be maintained during softwareevolution.
The software product under development is a mature system consisting oflarge amounts of legacy code; parts of the code base are more than 20 years old.As the company has a low sta� turnover, many of the developers of the legacycode are still available within the organization. Most of the software is writtenin C/C++. Considerable testing takes place to ensure a very high code quality.The typical customers of the software product require safe process automationin very large industrial sites.
The bug-tracking system (BTS) in Company Automation has a centralrole in the change management and the impact analyses. All software changes,both source code changes and changes to documentation, must be connectedto an issue report. Issue reports are categorized as one of the following: errorcorrections (i.e., bug reports), enhancements, document modi�cation, and in-
ternal (e.g., changes to test code, internal tools, and administrative changes).Moreover, the formal change impact analyses are documented as attachmentsto individual issue reports in the BTS.
4.2 Description of Company Telecom
Company Telecom is a major telecommunications vendor based in Sweden.We are studying data from four di�erent development organizations withinCompany Telecom, consisting of several hundreds of engineers distributed overseveral countries. Sta� turnover is very low and many of the developers aresenior developers that have been working on the same products for many years.
The development context is embedded systems in the Information andCommunications Technology (ICT) domain. Development in the ICT domainis heavily standardized, and adheres to standards such as 3GPP, 3GPP2, ETSI,IEEE, IETF, ITU, and OMA. Company Telecom is ISO 9001 and TL 9000certi�ed. At the time the study was conducted, the project model was basedon an internal waterfall-like model, but has since then changed to an Agiledevelopment process.
5 Functional safety - Safety instrumented systems for the process industry sector6 Functional safety of Electrical/Electronic/Programmable Electronic safety-related sys-
tems

16 Leif Jonsson et al.
Various programming languages are used in the four di�erent products.The majority of the code is written in C++ and Java, but other languages,such as hardware description languages, are also used.
Two of the four products are large systems in the ICT domain, one is amiddleware platform, and one is a component system. Two of the products aremature with a code base older than 15 years, whereas the other two productsare younger, but still older than 8 years. All four products are deployed atcustomer sites world-wide in the ICT market.
Issue management in the design organization is handled in two separaterepositories; one for change requests (planned new features or updates) andone for bug reports. In this study we only use data from the latter, the BTS.
Customer support requests to Company Telecom are handled in a twolayered approach with an initial customer service organization dealing withinitial requests, called Customer Service Requests (CSR). The task of thisorganization is to screen incoming requests so that only hardware or softwareerrors and no other issue, such as con�guration problems, are sent down to thesecond layer. If the customer support organization believes a CSR to be a faultin the product, they �le a bug report based on the CSR in the second layerBTS. In this way, the second layer organization can focus on issues that arelikely to be faults in the software. In spite of this approach, some bug reportscan be con�guration issues or other problems not directly related to faults inthe code. In this study, we have only used data from the second layer BTS,but there is nothing in principle that prevents the same approach to be usedon the �rst layer CSR's. The BTS is the central point in the bug handlingprocess and there are several process descriptions for the various employeeroles. Tracking of analysis, implementation proposals, testing, and veri�cationare all coordinated through the BTS.
4.3 State-of-Practice Bug Assignment: A Manual Process
The bug handling process of both Company Automation and Telecom aresubstantially more complex than the standard process described by Bugzilla(Mozilla, 2013). The two processes are characterized by the development con-texts of the organizations. Company Automation develops safety-critical sys-tems, and the bug handling process must therefore adhere to safety standardsas described in Section 4.1. The standards put strict requirements on how soft-ware is allowed to be modi�ed, including rigorous change impact analyses withfocus on traceability. In Company Telecom on the other hand, the sheer sizeof both the system under development and the organization itself are re�ectedon the bug handling process. The resource allocation in Company Telecomis complex and involves advanced routing in a hierarchical organization to anumber of development teams.
We generalize the bug handling processes in the two case companies andpresent an overview model of the currently manual process in Figure 4. Ingeneral, three actors can �le bug reports: i) the developers of the systems,

Title Suppressed Due to Excessive Length 17
ii) the internal testing organization, and iii) customers that �le bug reportsvia helpdesk functions. A submitted bug report starts in a bug triaging stage.As the next step, the Change Control Board (CCB) assigns the bug reportto a development team for investigation. The leader of the receiving teamthen assigns the bug report to an individual developer. Unfortunately, the bugreports often end up with the wrong developer, thus bug tossing (i.e., bugreport re-assignment) is common, especially between teams. The BTS storesinformation about the bug tossing that takes place. As a consequence, we canestimate the classi�cation accuracy of the manual bug assignment process.
Development
Test
Customer Support
Bug
Tracking System (BTS)
Team 1
Team N
Developer 1
Developer N
Team Leader CCB
New Bug Report
New Bug Report
New Bug Report
Automatic Assignment
Bug Tossing
Fig. 4: A simpli�ed model of bug assignment in a proprietary context.
4.4 State-of-the-Art: Automated Bug Assignment
We propose, in line with previous work, to automate the bug assignment. Ourapproach is to use the historical information in the BTS as a labeled trainingset for a classi�er. When a new bug is submitted to the BTS, we encode theavailable information as features and feed them to a prediction system. Theprediction system then classi�es the new bug to a speci�c development team.While this resembles proposals in previous work, our approach di�ers by: i)aiming at supporting large proprietary organizations, and ii) assigning bugreports to teams rather than individual developers.
Figure 4 shows our automated step as a dashed line. The prediction systemo�ers decision support to the CCB, by suggesting which development teamthat is the most likely to have the skills required to investigate the issue.This automated support corresponds to a medium level of automation (�thecomputer suggests one alternative and executes that suggestion if the humanapproves�), as de�ned in the established automation model by Parasuramanet al (2000).
18 Leif Jonsson et al.
5 Method
The overall goal of our work is to support bug assignment in large propri-etary development projects using state-of-the-art ML. As a step toward thisgoal, we study �ve sets of bug reports from two companies (described in Sec-tion 4), including information of team assignment for each bug report. Weconduct controlled experiments using Weka (Hall et al, 2009), a mature ma-chine learning environment that is successfully used across several domains, forinstance, bioinformatics (Frank et al, 2004), telecommunication (Alshammariand Zincir-Heywood, 2009), and astronomy (Zhao and Zhang, 2008). This sec-tion describes the de�nition, design and setting of the experiments, followingthe general guidelines by Basili et al (1986) and Wohlin et al (2012).
5.1 Experiment De�nition and Context
The goal of the experiments is to study automatic bug assignment usingstacked generalization in large proprietary development contexts, for the pur-pose of evaluating its industrial feasibility, from the perspective of an appliedresearcher, planning deployment of the approach in an industrial setting.
Table 1 reminds the reader of our RQs. Also, the table presents the ra-tionale of each RQ, and a high-level description of the research approach wehave selected to address them. Moreover, the table maps the RQs to the �vesub-experiments we conduct, and the experimental variables involved.
5.2 Data Collection
We collect data from one development project at Company Automation andfour major development projects at Company Telecom. While the bug trackingsystems in the two companies show many similarities, some slight variationsforce us to perform actions to consolidate the input format of the bug reports.For instance, in Company Automation a bug report has a �eld called �Title�,whereas the corresponding �eld in Company Telecom is called �Heading�. Wealign these variations to make the semantics of the resulting �elds the same forall datasets. The total number of bug reports in our study is 15,113 + 35,266= 50,379. Table 2 shows an overview of the �ve datasets.
We made an e�ort to extract similar sets of bug reports from the two com-panies. However, as the companies use di�erent BTSs, and interact with themaccording to di�erent processes, slight variations in the extraction steps are in-evitable. Company Automation uses a BTS from an external software vendor,while Company Telecom uses an internally developed BTS. Moreover, whilethe life-cycles of bug reports are similar in the two companies (as describedin Section 4.3), they are not equivalent. Another di�erence is that CompanyAutomation uses the BTS for issue management in a broader sense (incl. newfeature development, document updates, and release management), Company

Title Suppressed Due to Excessive Length 19
RQ1 RQ2 RQ3 RQ4
Description Does stacked general-ization outperform in-dividual classi�ers?
How does the ensem-ble selection in SG af-fect the prediction ac-curacy?
How consistent learn-ing curves does SG dis-play across projects?
How does the time lo-cality of training dataa�ect the predictionaccuracy?
Rationale Con�rm the re-sult of our previouswork (Jonsson et al,2012).
Explore which ensem-ble selection performsthe best.
Study how SG per-forms on di�erent data,and understand howmuch training data isrequired.
Understand how SGshould be retrained asnew bug reports aresubmitted.
Approach Test the hypothesis:�SG does not performbetter than individualclassi�ers wrt. predic-tion accuracy�.
Based on RQ1: evalu-ate three di�erent en-semble selections.
Using the best en-semble selection fromRQ2: evaluate learningcurves.
Using the best ensem-ble selection from RQ2with amount of train-ing data from RQ3:evaluate SG sensitivityto freshness of trainingdata.
Related experi-ments
Exp A, Exp B Exp B Exp C Exp D, Exp E
Dependentvariable
Prediction accuracy
Independentvariables
Individual classi�er Ensemble selection Size of training set Time locality of train-ing data (Exp D), sizeof training set (Exp E)
Fixed variables Preprocessing, feature selection, training size Preprocessing, featureselection, ensemble se-lection
Preprocessing, featureselection, ensemble se-lection
Table 1: Overview of the research questions, all related to the task of auto-mated team allocation. Each question is listed along with the main purpose ofthe question, a high-level description of our study approach, and the experi-mental variables involved.
Dataset #Bug reports Timespan #Teams
Automation 15,113 July 2000 � Jan 2012 67Telecom 1 > 9,000 > 5 years 28Telecom 2 > 8,000 > 5 years 36Telecom 3 > 3,000 > 5 years 17Telecom 4 > 10,000 > 5 years 64
Total > 50,000
Table 2: Datasets used in the experiments. Note: At the request of our industrypartners the table only lists lower bounds for Telecom systems, but the totalnumber of sums up to an excess of 50,000 bug reports.
Telecom uses the BTS for bug reports exclusively. To harmonize the datasets,we present two separate �ltering sequences in Sections 5.2.1 and 5.2.2.
5.2.1 Company Automation Data Filtering
The dataset from Company Automation contains in total 26,121 bug reportssubmitted between July 2000 and January 2012, all related to di�erent ver-

20 Leif Jonsson et al.
sions of the same software system. The bug reports originate from severaldevelopment projects, and describe issues reported concerning a handful ofdi�erent related products. During the 12 years of development represented inthe dataset, both the organization and processes have changed towards a moreiterative development methodology. We �lter the dataset in the following way:
1. We included only CLOSED bug reports to ensure that all bugs have validteam assignments, that is, we �lter out bug reports in states such as OPEN,NO ACTION, and CHANGE DEFERRED. This step results in 24,690remaining bug reports.
2. We exclude bug reports concerning requests for new features, documentupdates, changes to internal test code, and issues of administrative nature.Thus, we only keep bug reports related to source code of the softwaresystem. The rationale for this step is to make the data consistent withCompany Telecom, where the BTS solely contains bug reports. The �nalnumber of bug reports in the �ltered dataset is 15,113.
5.2.2 Company Telecom Data Filtering
Our �rst step of the data �ltering for Company Telecom is to identify a time-span characterized by a stable development process. We select a timespan fromthe start of the development of the product family to the point in time whenan agile development process is introduced (Wiklund et al, 2013). The motiva-tion for this step is to make sure that the study is conducted on a conformeddata set. We �lter the bug reports in the timespan according to the followingsteps:
1. We include only bug reports in the state FINISHED.2. We exclude bug reports marked as duplicates.3. We exclude bug reports that do not result in an source code update in a
product.
After performing these three steps, the data set for the four products containsin total 35,2667 bug reports.
5.3 ML Framework Selection
To select a platform for our experiments, we study features available in variousmachine learning toolkits. The focus of the comparison is to �nd a robust, welltested, and comparatively complete framework. The framework should also in-clude an implementation of stacked generalizer and it should be scalable. As aconsequence, we focus on platforms that are suitable for distributed computa-tion. Another criterion is to �nd a framework that has implemented a large setof state-of-the-art machine learning techniques. With the increased attention of
7 Due to con�dentiality reasons these numbers are not broken down in exact detail perproject.
Title Suppressed Due to Excessive Length 21
machine learning and data mining, quite a few frameworks have emerged dur-ing the last couple of years such as Weka (Hall et al, 2009), RapidMiner (Hof-mann and Klinkenberg, 2014), Mahout (Owen et al, 2011), MOA (Bifet et al,2010), Mallet (McCallum, 2002), Julia (Bezanson et al, 2012), and Spark (Za-haria et al, 2010) as well as increased visibility of established systems such asSAS, SPSS, MATLAB, and R.
For this study, we select to use a framework called Weka (Hall et al, 2009).Weka is a comparatively well documented framework with a public Java APIand accompanying book, website, forum, and active community. Weka hasmany ML algorithms implemented and it is readily extensible. It has severalsupport functionalities, such as cross-validation, strati�cation, and visualiza-tion. Weka has a built-in Java GUI for data exploration and it is also readilyavailable as a stand alone library in JAR format. It has some support for par-allelization. Weka supports both batch and online interfaces for some of itsalgorithms. The meta facilities of the Java language also allows for mechanicalextraction of available classi�ers. Weka is a well established framework in theresearch community and its implementation is open source.
5.4 Bug Report Feature Selection
This section describes the feature selection steps that are common to all ourdata sets. We represent bug reports using a combination of textual and nominalfeatures. Feature selections that are speci�c to each individual sub-experimentare described together with each experiment.
For the textual features, we limit the number of words because of memoryand execution time constraints. To determine a suitable number of words tokeep, we run a series of pilot experiments, varying the method and numberof words to keep, by varying the built in settings of Weka. We decide to rep-resent the text in the bug reports as the 100 words with highest TF-IDF8 ascalculated by the Weka framework. Furthermore, the textual content of thetitles and descriptions are not separated. There are two reasons for our rathersimple treatment of the natural language text. First, Weka does not supportmultiple bags-of-words; such a solution would require signi�cant implementa-tion e�ort. Second, our focus is not on �nding ML con�gurations that providethe optimal prediction accuracies for our datasets, but rather to explore SGfor bug assignment in general. We consider optimization to be an engineeringtask during deployment.
The non-textual �elds available in the two bug tracking systems vary be-tween the companies, leading to some considerations regarding the selectionof non-textual features. Bug reports in the BTS of Company Automation con-tain 79 di�erent �elds; about 50% of these �elds are either mostly empty orhave turned obsolete during the 12 year timespan. Bug reports in the BTS of
8 Term Frequency-Inverse Document Frequency (TF-IDF) is a standard weighting schemefor information retrieval and text mining. This scheme is common in software engineeringapplications (Borg et al, 2014).

22 Leif Jonsson et al.
Company Automation Company Telecom Description
Textual features
Text Title+Description Heading+Observation One line summary andfull description of thebug report
Nominal features
SubmitterType SubmitterClass Customer A�liation of the issuesubmitter
#Possible values 17 >170,>50,>120,>150Site SubmitterSite SiteId Site from where the
bug was submitted#Possible values 14 >250,>60,>80,>200Revision Revision Faulty revision Revision of the prod-
uct that the bug wasreported on
#Possible values 103 547,1325,999,982Priority Priority Priority Priority of the bug#Possible values 5 3,3,3,3
Table 3: Features used to represent bug reports. For company Telecom the�elds are reported for Telecom 1,2,3,4 respectively.
Company Telecom contain information in more than 100 �elds. However, mostof these �elds are empty when the bug report is submitted. Thus, we restrictedthe feature selection to contain only features available at the time of submis-
sion of the bug report, i.e., features that do not require a deeper analysis e�ort(e.g., faulty component, function involved). We also want to select a small setof general features, likely to be found in most bug tracking systems. Achievingfeasible results using a simple feature selection might simplify industrial adap-tation, and also it limits the ML training times. Based on discussions withinvolved developers, we selected the features presented in Table 3. In the restof the paper, we follow the nomenclature in the leftmost column.
A recurring discussion when applying ML concerns which features are thebest for prediction. In our BTS'es we have both textual and non-textual fea-tures, thus we consider it valuable to compare the relative predictive power ofthe two types of features. While out previous research has indicated that in-cluding non-textual features improves the prediction accuracy (Jonsson et al,2012), many other studies rely solely on the text (see Figure 2). To motivatethe feature selection used in this study, we performed a small study comparingtextual vs. non-textual features for our �ve datasets.
Figure 5 shows the results from our small feature selection experiment.The �gure displays results from three experimental runs, all using SG with thebest individual classi�ers (further described in Section 6.1). The three curvesrepresent three di�erent sets of features: 1) textual and non-textual features,2) non-textual features only, and 3) textual features only. The results showthat for some systems (Telecom 1, 2 and 4) the non-textual features performsbetter than the textual features alone, while for some systems (Telecom 3 andAutomation) the results are the opposite. Thus, our �ndings strongly suggestthat we should combine both non-textual features and textual features for bug

Title Suppressed Due to Excessive Length 23
assignment. Note that with more sophisticated text modeling techniques, suchas LDA (Blei et al, 2003), we suspect that the textual features may have ahigher impact on the �nal result.
●
●●●
●●
●
●●
0
25
50
75
100
0 5000 10000 15000Dataset size
Pre
dict
ion
Acc
urac
y
Type● BESTBEST−notext−onlyBEST−text−only
Automation
(a)
●
●
●
●●
●
●
●
0
25
50
75
100
0 2500 5000 7500 10000Dataset size
Pre
dict
ion
Acc
urac
y
Type● BESTBEST−notext−onlyBEST−text−only
Telecom 1
(b)
●
●●
●●
●
●
●
0
25
50
75
100
0 2000 4000 6000 8000Dataset size
Pre
dict
ion
Acc
urac
y
Type● BESTBEST−notext−onlyBEST−text−only
Telecom 2
(c)
●
●
●
●
●
● ●
0
25
50
75
100
0 1000 2000 3000Dataset size
Pre
dict
ion
Acc
urac
y
Type● BESTBEST−notext−onlyBEST−text−only
Telecom 3
(d)
●
●
●
●
●
●
●
●
0
25
50
75
100
0 5000 10000Dataset size
Pre
dict
ion
Acc
urac
y
Type● BESTBEST−notext−onlyBEST−text−only
Telecom 4
(e)
Fig. 5: The prediction accuracy when using text only features (�text-only�) vs.using non-text features only (�notext-only�)

24 Leif Jonsson et al.
5.5 Experiment Design and Procedure
Figure 6 shows an overview of our experimental setup. The �ve datasets orig-inate from two di�erent industrial contexts, as depicted by the two clouds tothe left. We implement �ve sub-experiments (c.f. A�E in Figure 6), using theWeka machine learning framework. Each sub-experiment is conducted onceper dataset, that is, we performed 25 experimental runs. A number of stepsimplemented in Weka are common for all experimental runs:
1. The complete dataset set of bug reports is imported.2. Bug reports are divided into training and test sets. In sub-experiments
A�C, the bug reports are sampled using strati�cation. The process in sub-experiments D�E is described in Sections 5.5.4 and 5.5.5.
3. Feature extraction is conducted as speci�ed in Section 5.4.
We executed the experiments on two di�erent computers. We conductexperiments on the Company Automation dataset on a Mac Pro, runningMac OS X 10.7.5, equipped with 24 GB RAM and two Intel(R) Xeon(R)X5670 2.93 GHz CPUs with six cores each. The computer used for the ex-periments on the Company Telecom datasets had the following speci�cation:Linux 2.6.32.45-0.3-xen, running SUSE LINUX, equipped with eight 2.80 GHzIntel(R) Xeon(R) CPU and 80 GB RAM.
Fig. 6: Overview of the controlled experiment. Vertical arrows depict indepen-dent variables, whereas the horizontal arrow shows the dependent variable.Arrows within the experiment box depict dependencies between experimentalruns A�E: Experiment A determines the composition of individual classi�ersin the ensembles studied evaluated in Experiment B-E. The appearance of thelearning curves from Experiment C is used to set the size of the time-basedevaluations in Experiment D and Experiment E.
As depicted in Figure 6, there are dependencies among the sub-experiments.Several sub-experiments rely on results from previous experimental runs to

Title Suppressed Due to Excessive Length 25
select values for both �xed and independent variables. Further details are pre-sented in the descriptions of the individual sub-experiments A�E.
We evaluate the classi�cation using a top-1 approach. That is, we onlyconsider a correct/incorrect classi�cation, i.e., we do not evaluate whetherour approach correctly assigns bug reports to a set of candidate teams. In IRevaluations, considering ranked output of search results, it is common to assessthe output at di�erent cut-o� points, e.g., the top-5 or top-10 search hits. Alsosome previous studies on bug assignment present top-X evaluations inspired byIR research. However, our reasons for a top-1 approach are three-fold: First,for fully automatic bug assignment a top-1 approach is the only reasonablechoice, since an automatic system would not send a bug report to more thanone team. Second, a top-1 approach is a conservative choice in the sense thatthe classi�cation results would only improve with a top-k approach. The thirdmotivation is technical; to ensure high quality evaluations we have chosen touse the built-in mechanisms in the well established Weka. Unfortunately, Wekadoes not support a top-k approach in its evaluation framework for classi�ers.
5.5.1 Experiment A: Individual Classi�ers
Independent variable: Choice of individual classi�er
Experiment A investigates RQ1 and the null hypothesis �SG does not performbetter than individual classi�ers wrt. prediction accuracy�. We evaluate the28 available classi�ers in Weka Development version 3.7.9, listed in Table 4.The list of possible classi�ers is extracted by �rst listing all classes in thecorresponding .jar �le in the �classi�er� package and then trying to assignthem one by one to a classi�er. The independent variable is the individual
classi�er. For all �ve datasets, we execute 10-fold cross-validation once perclassi�er. We use all available bug reports in each dataset and evaluated all28 classi�ers on all datasets. The results of this experiment is presented inSection 6.1.
Table 4: Individual classi�ers available in Weka Development version 3.7.9.Column headings show package names in Weka. Classi�ers in bold are excludedfrom the study because of long training times or exceeding memory constraints.
bayes. functions. lazy. rules. trees. misc.BayesNet Logistic IBk DecisionTable DecisionStump InputMappedClassi�erNaiveBayes MultilayerPerceptron KStar JRip J48NaiveBayesMultinomial SimpleLogistic LWL OneR LMTNaiveBayesMultinomialText SMO ZeroR PART RandomForestNaiveBayesMultinomialUpdateable RandomTreeNaiveBayesUpdateable REPTreenet.BayesNetGeneratornet.BIFReadernet.EditableBayesNet

26 Leif Jonsson et al.
5.5.2 Experiment B: Ensemble Selection
Independent variable: Ensemble selection
Experiment B explores both RQ1 and RQ2, i.e., both if SG is better thanindividual classi�ers and which ensemble of classi�ers to choose for bug as-signment. As evaluating all combinations of the 28 individual classi�ers inWeka is not feasible, we restrict our study to investigate three ensemble selec-tions, each combining �ve individual classi�ers. We chose �ve as the number ofindividual classi�ers to use in SG at a consensus meeting, based on experiencesof prediction accuracy and run-time performance from pilot runs. Moreover,we exclude individual classi�ers with run-times longer than 24 hours in Ex-periment A, e.g., MultiLayerPerceptron and SimpleLogistic.
Based on the results from Experiment A, we select three ensembles for eachdataset (cf. Table 4). We refer to these as BEST, WORST, and SELECTED.We chose the �rst two ensembles to test the hypothesis �combining the best in-dividual classi�ers should produce a better result than if you choose the worst�.The BEST ensemble consists of the �ve individual classi�ers with the highestprediction accuracy from Experiment A. The WORST ensemble contains the�ve individual classi�ers with the lowest prediction accuracy from ExperimentB, while still performing better than the basic classi�er ZeroR that we see as alower level baseline. The ZeroR classi�er simply always predicts the class withthe largest number of bugs. No classi�er with a lower classi�cation accuracythan ZeroR is included in any ensemble, thus the ZeroR acts as a lower levelcut-o� threshold for being included in an ensemble.
The SELECTED ensemble is motivated by a discussion in Wolpert (1992),who posits that diversity in the ensemble of classi�ers improves predictionresults. The general idea is that if you add similar classi�ers to a stackedgeneralizer, less new information is added compared to adding a classi�er basedon a di�erent classi�cation approach. By having level-0 generalizers of di�erenttypes, they together will better �span the learning space�. This is due to thefundamental theory behind stacked generalization, claiming that the errors ofthe individual classi�ers should average out. Thus, if we use several similarclassi�ers we do not get the averaging out e�ect since then, in theory, theclassi�ers will have the same type of errors and not cancel out. We explore thisapproach by using the ensemble selection call SELECTED, where we combinethe best individual classi�ers from �ve di�erent classi�cation approaches (thepackages in Table 4). The results of this experiment is presented in Section 6.1.
Some individual classi�ers are never part of a SG. This depends on eitherthat the classi�er did not pass the cut-o� threshold of being better than theZeroR classi�er, this case occurs for instance for the InputMappedClassi�er
(see Table 4). Alternatively the classi�er was neither bad enough to be in theWORST ensemble nor good enough to be in the BEST or SELECTED, thisis the case with for instance JRip.

Title Suppressed Due to Excessive Length 27
In all of the ensembles we use SimpleLogistic regression as the level-1 clas-si�er following the general advice of Wolpert (1992) and Witten et al (2011)of using a relatively simple smooth linear model.
We choose to evaluate the individual classi�ers on the whole dataset infavor of evaluating them on a hold-out set, i.e., a set of bug reports that wouldlater not be used in the evaluation of the SG. This is done to maximize theamount of data in the evaluation of the SG. It is important to note that thisreuse of data only applies to the selection of which individual classi�ers toinclude in the ensemble. In the evaluation of the SG, all of the individualclassi�ers are completely retrained on only the training set, and none of thedata points in the test set is part of the training set of the individual classi�ers.This is also the approach we would suggest for industry adoption, i.e., �rstevaluate the individual classi�ers on the current bug database, and then usethem in a SG.
5.5.3 Experiment C: Learning Curves
Independent variable: Amount of training data
The goal of Experiment C is to study RQ3: How consistent learning curves
does SG display across projects? For each dataset, we evaluate the three en-sembles from Experiment B using �xed size subsets of the �ve datasets: 100,200, 400, 800, 1600, 3200, 6400, 12800, and ALL bug reports. All subsets are se-lected using random strati�ed sampling from the full dataset. As the datasetsTelecom 1-3 contain fewer bug reports than 12800, the learning curves arelimited accordingly. The results of this experiment is presented in Section 6.2.
5.5.4 Experiment D: Sliding Time Window
Independent variable: Time locality of training data
Experiment D examines RQ4, which addresses how the time locality of thetraining set a�ects the prediction accuracy on a given test set. Figure 7 showsan overview of the setup of Experiment D. The idea is to use training setsof the same size increasingly further back in time to predict a given test set.By splitting the chronologically ordered full data set into �xed size trainingand test sets according to Figure 7, we can generate a new dataset consistingof pairs (x,y). In this dataset, x represents the time di�erence measured innumber of days (delta time) between the start of the training set and the startof the test set. The y variable represents the prediction accuracy of using thetraining set x days back in time to predict the bug assignments in the selectedtest set. We can then run a linear regression on the data set of delta timeand prediction accuracy samples and examine if there is a negative correlationbetween delta time and prediction accuracy.
We break down RQ4 further into the following research hypothesis formu-lation: �Is training data further back in time worse at predicting bug report

28 Leif Jonsson et al.
assignment than training data closer in time�? We test this research hypoth-esis with the statistical method of simple linear regression. Translated into astatistical hypothesis RQ4 is formulated as:
�Let the di�erence in time between the submission date of the �rst bugreport in a test set and the submission date of the �rst bug report in thetraining set be the independent variable x. Further, let the prediction accuracyon the test set be the dependent variable y. Is the coe�cient of the slope ofa linear regression �t on x and y statistically di�erent from 0 and negative atthe 5 % α level? �
To create the training set and test sets, we sort the complete dataset inchronological order on the bug report submission date. To select suitable sizesto split the training set and test sets, we employ the following procedure.For the simple linear regression, we want to create enough sample points tobe able to run a linear regression with enough power to detect a signi�cantdi�erence and still have as large training and test sets as possible to reducethe variance in the generated samples. Green (1991) suggests the followingformula : N ≥ 50 + 8m as a rule of thumb for calculating the needed numberof samples at α level of 5 % and β level of 20 %, where m is the numberof independent variables. In our case we have one independent variable (deltatime) so the minimum number of samples in our case is 58 = 50 + 8 * 1. We usea combination of theoretical calculations for the lower and upper bounds onthe number of training samples given that we want an 80/20 ratio of training totest data. We combine the theoretical approach with a program that calculatesthe number of sample points generated by a given training and test set size,by simulating runs. This combination together with Green's formula let usexplore the most suitable training and test sets for the di�erent systems.
We also know from Experiment C that the �elbow� where the predictionaccuracy tends to level out is roughly around 1,000-2,000 samples, this togetherwith the calculations for the linear regression guided our decision for the �nalselection of sample size.
We arrived at the following dataset sizes by exploring various combinationswith the simulation program, the theoretical calculations and the experiencefrom Experiment C. For the smallest of the systems, the maximum sizes oftraining and test sets that gives more than 58 samples amounts to 619 and 154bug reports respectively. For the larger systems, we can a�ord to have largerdata sets. For comparison we prioritize to have the same sized sets for all theother systems. When we calculate the set sizes for the smallest of the largersystems, we arrived at 1,400 and 350 bug reports for the training and test setsizes, respectively. These values are then chosen for all the other four systems.The results of this analysis is presented in Section 6.3.
5.5.5 Experiment E: Cumulative Time Window
Independent variable: Amount of training data

Title Suppressed Due to Excessive Length 29
Time
Fixed size Test set
Fixed size Training set
Te1 Tr11 Tr12 Tr13 Tr14 Tr15 Tr16
Te2 Tr21 Tr22 Tr23 Tr24 Tr25
Te3 Tr31 Tr32 Tr33 Tr34
Te4 Tr41 Tr42 Tr43
Te5 Tr51 Tr52
Te6 Tr61
Tr 16 = Training set 6 for test set 1
Te 1 = Test set 1
Run Test set Training set
1 Te2 Tr21
2 Te2 Tr22
… … …
Run Test set Training set
1 Te1 Tr11
2 Te1 Tr12
… … ...
….
Older Bugs Newer Bugs
Fig. 7: Overview of the time-sorted evaluation. Vertical bars show how we splitthe chronologically ordered data set into training and test sets. This approachgives us many measurement points in time per test set size. Observe that thetime between the di�erent sets can vary due to non-uniform bug report in�owbut the number of bug reports between each vertical bar is �xed.
Experiment E is also designed to investigate RQ4, i.e., how the time local-ity of the training set a�ects the prediction accuracy. Instead of varying thetraining data using a �xed size sliding window as in Experiment D, we �x thestarting point and vary the amount of the training data. The independent vari-able is the cumulatively increasing amount of training data. This experimentalsetup mimics realistic use of SG for automated bug assignment.
Figure 8 depicts an overview of Experiment E. We sort the dataset inchronological order on the issue submission date. Based on the outcome fromExperiment C, we split the dataset into a corresponding number of equallysized chunks. We used each chunk as a test set, and for each test set we vary thenumber of previous chunks used as training set. Thus, the amount of trainingdata was the independent variable. We refer to this evaluation approach ascumulative time window. Our setup is similar to the �incremental learning�that Bhattacharya et al (2012) present in their work on bug assignment, butwe conduct a more thorough evaluation. We split the data into training andtest sets in a more comprehensive manner, and thus conduct several moreexperimental runs. The results of this experiment is presented in Section 6.4.

30 Leif Jonsson et al.
Time
Fixed size Test set
Cumula0vely Increasing Training set
Te1
Tr 16 = Training set 6 for test set 1
Te 1 = Test set 1
Run Test set Training set
1 Te2 Tr21
2 Te2 Tr22
… … …
Run Test set Training set
1 Te1 Tr11
2 Te1 Tr12
… … ...
Tr11 Tr12
Tr13 …
Tr16
Te2
Tr21 Tr22
Tr23 … Tr25
Older Bugs Newer Bugs
…….
Fig. 8: Overview of the cumulative time-sorted evaluation. We use a �xed testset, but cumulatively increase the training set for each run.
6 Results and Analysis
6.1 Experiment A: Individual Classi�ers and Experiment B: EnsembleSelection
Experiment A investigates whether SG outperforms individual classi�ers. Ta-ble 5 shows the individual classi�er performance for the �ve evaluated systems.It also summarizes the results of running SG with the three di�erent con�gura-tions BEST, WORST, and SELECTED, related to Experiment B. In Table 5we can view the classi�er �rules.ZeroR� as a sort of lower baseline reference.The ZeroR classi�er simply always predicts the class with the highest numberof bug reports.
The answer to RQ1 is that while the improvements in some projects are
marginal, using reasonable ensemble selection leads to a better prediction ac-
curacy than using any of the individual classi�ers. On our systems, the im-provement is 3% better than the best of the individual classi�ers on two ofthe systems. The best improvement is 8% on the Automation system and thesmallest improvement is 1% on system Telecom 1 and 4, which can be consid-ered negligible. This conclusion must be followed by a slight warning; mindless

Title Suppressed Due to Excessive Length 31
Table 5: Individual classi�er results (rounded to two digits) on the �ve systemsuse the full data set and 10-fold cross validation. Out of memory is markedO-MEM and an execution that exceeds a time threshold is marked O-TIME.
Classi�erAccuracy
AutomationAccuracyTelecom 1
AccuracyTelecom 2
AccuracyTelecom 3
AccuracyTelecom 4
bayes.BayesNet 35 % (B,S) O-MEM O-MEM O-MEM O-MEMbayes.NaiveBayes 15 % (W) 25 % (W) 18 % (W) 35 % 17 %bayes.NaiveBayesMultinomial 22 % 34 % (W) 32 % 53 % (W) 26 % (W)bayes.NaiveBayesMultinomialText 6 % 13 % 16 % 43 % 19 %bayes.NaiveBayesMultinomialUpdateable 26 % 34 % 32 % (S) 61 % (W) 28 % (W)bayes.NaiveBayesUpdateable 15 % 25 % 18 % 35 % 17 %bayes.net.BIFReader 35 % O-MEM O-MEM O-MEM O-MEMbayes.net.BayesNetGenerator 35 % 41 % (S) 31 % (W) 66 % (S,W) 37 % (S)bayes.net.EditableBayesNet 35 % O-MEM O-MEM O-MEM O-MEMfunctions.SMO 42 % (B,S) 70 % (B,S) 54 % (B,S) 86 % (B,S) 78 % (B,S)lazy.IBk 38 % (B) 58 % (S) 44 % (B) 77 % (B) 63 %lazy.KStar 42 % (B,S) 50 % 46 % (B,S) 77 % (S) 60 % (S)lazy.LWL 9 % (W) 21 % (W) O-MEM O-MEM O-MEMmisc.InputMappedClassi�er 6 % 13 % 16 % 43 % 19 %rules.DecisionTable 26 % 52 % 31 % (W) 65 % (W) 55 %rules.JRip 23 % 51 % 36 % 73 % 55 %rules.OneR 13 % (W) 43 % (W) 30 % (W) 71 % 50 % (W)rules.PART 29 % (S) 61 % (B,S) 38 % (S) 76 % (S) 64 % (B,S)rules.ZeroR 6 % 13 % 16 % 43 % 19 %trees.DecisionStump 7 % (W) 21 % (W) 22 % (W) 44 % (W) 20 % (W)trees.J48 30 % 62 % (B) 40 % (B) 78 % (B) 66 % (B)trees.LMT O-MEM O-MEM O-MEM O-MEM O-MEMtrees.REPTree 29 % 62 % (B) 34 % 79 % (B) 67 % (B)trees.RandomForest 39 % (B,S) 63 % (B,S) 49 % (B,S) 84 (B,S)% 67 % (S)trees.RandomTree 27 % 52 % 32 % 69 % 49 % (W)functions.Logistic O-MEM O-MEM O-MEM O-MEM O-MEMfunctions.SimpleLogistic 40 % O-TIME 52 % O-TIME O-TIMEfunctions.MultilayerPerceptron 20 % (W) O-TIME O-TIME O-TIME O-TIME
SG BEST (B) 50 % 71 % 57 % 89 % 77 %SG SELECTED (S) 50 % 71 % 57 % 89 % 79 %SG WORST (W) 28 % 57 % 45 % 83 % 62 %
ensemble selection together with bad luck can lead to worse result than someof the individual classi�ers. In none of our runs (including with the WORSTensemble) is the stacked generalizer worse than all of the individual classi�ers.
Experiment B addresses di�erent ensemble selections in SG. From Table 5we see that in the cases of the BEST and SELECTED con�gurations thestacked generalizer in general performs as well, or better, than the individualclassi�ers. In the case of Telecom 1 and 4, there is a negligible di�erencebetween the best individual classi�er SMO and the SELECTED and BESTSG. We also see that when we use the WORST con�guration the result ofthe stacked generalizer is worse than the best of the individual classi�ers, butit still performs better than some of the individual classi�ers. When it comesto the individual classi�ers we note that the SMO classi�er performs best on
32 Leif Jonsson et al.
all systems. The conclusion is that the SG does not do worse than any of theindividual classi�ers but can sometimes perform better.
Figure 9 shows the learning curves (further presented in relation to Exper-iment C) for the �ve datasets using the three con�gurations BEST, WORST,and SELECTED. The �gures illustrate that the two ensembles BEST andSELECTED have very similar performance across the �ve systems. Also, itis evident that the WORST ensemble levels out at a lower prediction accu-racy than the BEST and SELECTED ensembles as the number of trainingexamples grows and the rate of increase has stabilized.
Experiment B shows no signi�cant di�erence in the prediction accuracy
between BEST and SELECTED. Thus, our results do not con�rm that pre-diction accuracy is improved by applying ensemble selections with a diverseset of individual classi�ers. One possible explanation for this result is thatthe variation among the individual classi�ers in the BEST ensemble alreadyis enough to obtain a high prediction accuracy. There is clear evidence thatthe WORST ensemble performs worse than BEST and SELECTED. As aconsequence, simply using SG does not guarantee good results�the ensemble
selection plays an important role.
6.2 Experiment C: Learning Curves
In Experiment C, we study how consistent the learning curves for SG areacross di�erent industrial projects. Figure 10 depicts the learning curves forthe �ve systems. As presented in Section 5.5.3, the BEST and SELECTEDensembles yield similar prediction accuracy, i.e., the learning curves in Fig-ure 10 (a) and (c) are hard to distinguish by the naked eye. Also, while thereare performance di�erences across the systems, the learning curves for all �vesystems follow the same general pattern: the learning curves appear to followa roughly logarithmic form proportional to the size of the training set, butwith di�erent minimum and maximum values.

Title Suppressed Due to Excessive Length 33
●
●●
●
●●
●
●●
0
25
50
75
100
0 5000 10000 15000Dataset size
Pre
dict
ion
Acc
urac
y Type● BESTSELECTEDWORST
Automation
(a)
●
●
●
●●
●
●●
0
25
50
75
100
0 2500 5000 7500 10000Dataset size
Pre
dict
ion
Acc
urac
y Type● BESTSELECTEDWORST
Telecom 1
(b)
●
●●
●●
●●
●
0
25
50
75
100
0 2000 4000 6000 8000Dataset size
Pre
dict
ion
Acc
urac
y Type● BESTSELECTEDWORST
Telecom 2
(c)
●
●
●
●
●
● ●
0
25
50
75
100
0 1000 2000 3000Dataset size
Pre
dict
ion
Acc
urac
y Type● BESTSELECTEDWORST
Telecom 3
(d)
●
●
●
●
●
●
●
●
0
25
50
75
100
0 5000 10000Dataset size
Pre
dict
ion
Acc
urac
y Type● BESTSELECTEDWORST
Telecom 4
(e)
Fig. 9: Comparison of BEST (black, circle), SELECTED (red, triangle) andWORST (green, square) classi�er ensemble.
An observation of practical value is that the learning curves tend to �attenout within the range of 1,600 to 3,200 training examples for all �ve systems.We refer to this breakpoint as where the graph has the maximum curvature,i.e., the point on the graph where the tangent curve is the most sensitive tomoving the point to nearby points. For our study, it is su�cient to simplydetermine the breakpoint by looking at Figure 10, comparable to applying the�elbow method� to �nd a suitable number of clusters in unsupervised learn-

34 Leif Jonsson et al.
ing (Tibshirani et al, 2001). Our results suggest that at least 2,000 trainingexamples should be used when training a classi�er for bug assignment.
We answer RQ3 as follows: the learning curves for the �ve systems have
di�erent minimum and maximum values, but display similar shape and all �at-
ten out at roughly 2,000 training examples. There is a clear di�erence between
projects.
●
●●
●
●●
●
●●
0
25
50
75
100
0 5000 10000 15000Dataset size
Pre
dict
ion
Acc
urac
y
System
●
Telecom 3Telecom 4Telecom 1Telecom 2Automation
BEST
(a)
●●
●
●
●● ●
● ●
0
25
50
75
100
0 5000 10000 15000Dataset size
Pre
dict
ion
Acc
urac
y System
●
Telecom 3Telecom 4Telecom 1Telecom 2Automation
WORST
(b)
●
●
●
●
●
●
●
●●
0
25
50
75
100
0 5000 10000 15000Dataset size
Pre
dict
ion
Acc
urac
y
System
●
Telecom 3Telecom 4Telecom 1Telecom 2Automation
SELECTED
(c)
Fig. 10: Prediction accuracy for the di�erent systems using the BEST (a)WORST (b) and SELECTED (c) individual classi�ers under Stacking
6.3 Experiment D: Sliding Time Window
Experiment D targets how the time locality of the training data a�ects theprediction accuracy (RQ4). Better understanding of this aspect helps decidingthe required frequency of retraining the classi�cation model. Figure 11 showthe prediction accuracy of using SG with the BEST ensemble, following theexperimental design described in Section 5.5.4. The X axes denote the di�er-ence in time, measured in days, between the start of the training set and thestart of the test set. The �gures also depict an exponential best �t.
For all datasets, the prediction accuracy decreases as older training setsare used. The e�ect is statistically signi�cant for all datasets at a 5% level.

Title Suppressed Due to Excessive Length 35
We observe the highest e�ects on Telecom 1 and Telecom 4, where the predic-tion accuracy is halved after roughly 500 days. For Telecom 1 the predictionaccuracy is 50% using the most recent training data, and it drops to about25% when the training data is 500 days old. The results for Telecom 4 areanalogous, with the precision accuracy dropping from about 40% to 15% in500 days.
For three of the datasets the decrease in prediction accuracy is less clear.For Automation, the prediction accuracy decreases from about 14% to 7% in1,000 days, and Telecom 3, the smallest dataset, from 55% to 30% in 1,000days. For Telecom 2 the decrease in prediction accuracy is even smaller, andthus unlikely to be of practical signi�cance when deploying a solution in in-dustry.
A partial answer to RQ4 is: more recent training data yields higher predic-
tion accuracy when using SG for bug assignment.

36 Leif Jonsson et al.
0
20
40
60
0 500 1000 1500 2000 2500Delta Time
Pre
dict
ion
Acc
urac
y
Automation
(a)
0
20
40
60
400 800 1200 1600Delta Time
Pre
dict
ion
Acc
urac
y
Telecom 1
(b)
0
20
40
60
250 500 750 1000 1250Delta Time
Pre
dict
ion
Acc
urac
yTelecom 2
(c)
0
20
40
60
400 800 1200 1600Delta Time
Pre
dict
ion
Acc
urac
y
Telecom 3
(d)
0
20
40
60
0 500 1000 1500Delta Time
Pre
dict
ion
Acc
urac
y
Telecom 4
(e)
Fig. 11: Prediction accuracy for the datasets Automation (a) and Telecom 1-4(b-e) using the BEST ensemble when the time locality of the training set isvaried. Delta time is the di�erence in time, measured in days, between thestart of the training set and the start of the test set. For Automation andTelecom 1,2, and 4 the training sets contain 1,400 examples, and the test set350 examples. For Telecom 3, the training set contains 619 examples and thetest set 154 examples.

Title Suppressed Due to Excessive Length 37
6.4 Experiment E: Cumulative Time Window
Experiment E addresses the same RQ as Experiment D, namely how the timelocality of the training data a�ects the prediction accuracy (RQ4). However,instead of evaluating the e�ect using a �xed size sliding window of trainingexamples, we use a cumulatively increasing training set. As such, ExperimentE also evaluates how many training examples SG requires to perform accurateclassi�cations. Experiment E shows the prediction accuracy that SG wouldhave achieved at di�erent points in time if deployed in the �ve projects understudy.
Figures 12 plot the results from the cumulated time locality evaluationusing SG with BEST ensembles. The blue curve represents the predictionaccuracy (as �tted by a local regression spline) with the standard error for themean of the prediction accuracy in the shaded region. The maximum predictionaccuracy (as �tted by the regression spline) is indicated with a vertical line.The vertical line represents the cumulated ideal number of training points forthe respective datasets. Adding more bug reports further back in time worsensthe prediction accuracy. The number of samples (1589) and the predictionaccuracy (16.41 %) for the maximum prediction accuracy is indicated with atext label (x = 1589 Y = 16.41 for the Automation system). The number ofevaluations run with the calculated training set and test set sizes in each runis indicated in the upper right corner of the �gure with the text �Total no.Evals�.
For all datasets in Figures 12, except Telecom 3, the prediction accuracyincreases when more training data is cumulatively added until a point wherethey reach a �hump� where the prediction accuracy reaches a maximum. Thisis followed by declining prediction accuracy as more (older) training data iscumulatively added. For Automation, Telecom 1, and Telecom 4, we achievethe maximum prediction accuracy when using about 1,600 training examples.For Telecom 2 the maximum appears already at 1,332 training examples. ForTelecom 3 on the other hand, the curve is monotonically increasing, i.e., theprediction accuracy is consistently increasing as we add more training data.This is likely a special case for this dataset where we have not yet reachedthe point in the project where old data starts to introduce noise rather thanhelping the prediction.
Also related to RQ4 is our observation: there is a balancing e�ect between
adding more training examples and using older training examples. As a con-
sequence, prediction accuracy does not necessary improve when training sets
gets larger.
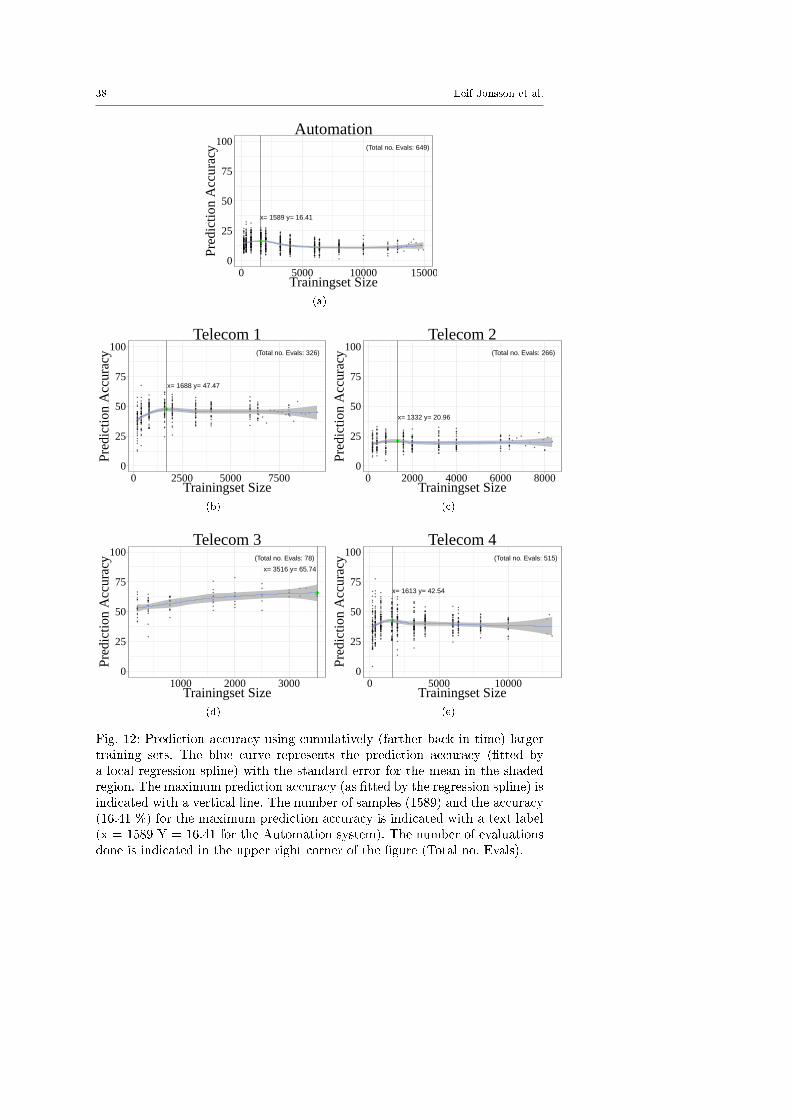
38 Leif Jonsson et al.
●
x= 1589 y= 16.41
(Total no. Evals: 649)
0
25
50
75
100
0 5000 10000 15000Trainingset Size
Pre
dict
ion
Acc
urac
y
Automation
(a)
●
x= 1688 y= 47.47
(Total no. Evals: 326)
0
25
50
75
100
0 2500 5000 7500Trainingset Size
Pre
dict
ion
Acc
urac
y
Telecom 1
(b)
●
x= 1332 y= 20.96
(Total no. Evals: 266)
0
25
50
75
100
0 2000 4000 6000 8000Trainingset Size
Pre
dict
ion
Acc
urac
yTelecom 2
(c)
●
x= 3516 y= 65.74
(Total no. Evals: 78)
0
25
50
75
100
1000 2000 3000Trainingset Size
Pre
dict
ion
Acc
urac
y
Telecom 3
(d)
●
x= 1613 y= 42.54
(Total no. Evals: 515)
0
25
50
75
100
0 5000 10000Trainingset Size
Pre
dict
ion
Acc
urac
y
Telecom 4
(e)
Fig. 12: Prediction accuracy using cumulatively (farther back in time) largertraining sets. The blue curve represents the prediction accuracy (�tted bya local regression spline) with the standard error for the mean in the shadedregion. The maximum prediction accuracy (as �tted by the regression spline) isindicated with a vertical line. The number of samples (1589) and the accuracy(16.41 %) for the maximum prediction accuracy is indicated with a text label(x = 1589 Y = 16.41 for the Automation system). The number of evaluationsdone is indicated in the upper right corner of the �gure (Total no. Evals).

Title Suppressed Due to Excessive Length 39
7 Threats to Validity
We designed our experiment to minimize the threats to validity, but still anumber of decisions that might in�uence our results had to be made. Wediscuss the main validity threats to our study with respect to construct validity,internal validity, external validity, and conclusion validity (Wohlin et al, 2012).
7.1 Construct Validity
Construct validity involves whether our experiment measures the construct westudy. Our aim is to measure how well automated bug assignment performs.We measure this using prediction accuracy, the basic measure for performanceevaluations of classi�cation experiments. As an alternative measure of the clas-si�cation performance, we could have complemented the results with averageF-measures to also illustrate type I and type II errors. However, to keep thepresentation and interpretation of results simple, we decided to consistentlyrestrict our results to contain only prediction accuracy.
TheWeka framework does not allow evaluations with classes encountered inthe test set that do not exist in the training set. For Experiments A-C (all basedon cross-validation) Weka automatically harmonizes the two sets by ensuringthe availability of all classes in both sets. However, for the time-sorted evalu-ations performed in Experiment D and E, we do not use the cross-validationinfrastructure provided by Weka. Instead, we have to perform the harmoniza-tion manually. To simplify the experimental design and be conservative in ourperformance estimates in Experiment D and E, we always consider all teamspresent in the full dataset as possible classi�cation results, i.e., regardless ofwhether the teams are present in the training and test sets of a speci�c run.This is a conservative design choice since it causes many more possible alterna-tive classes available for classi�cation, making it a harder problem. In practice,the team structure in an organization is dynamic. In the projects under study,teams are added, renamed, merged, and removed over the years as illustratedin Figure 13. While the current team structure would be known at any giventime in a real project, we do not use any such information in our experimentalruns. Thus, there is a potential that the prediction accuracy of a deployed toolusing SG could be higher.
In the projects we study, the teams are not entirely disjunct. Individualdevelopers might be members of several teams, teams might be sub-teams ofother teams, and certain teams are created for speci�c tasks during limitedperiods of time. Thus, as some teams overlap, more than one team assignmentcould be correct for a bug report. Furthermore, the correctness of a team as-signment is not a binary decision in real life. Teams might be hierarchicallystructured and there are dependencies between teams. An incorrect bug as-signment might thus be anything from totally wrong (e.g., assigning a bugreport describing embedded memory management to a GUI team) to just asgood as the team assignment stored in the BTS. Again, our evaluation is con-
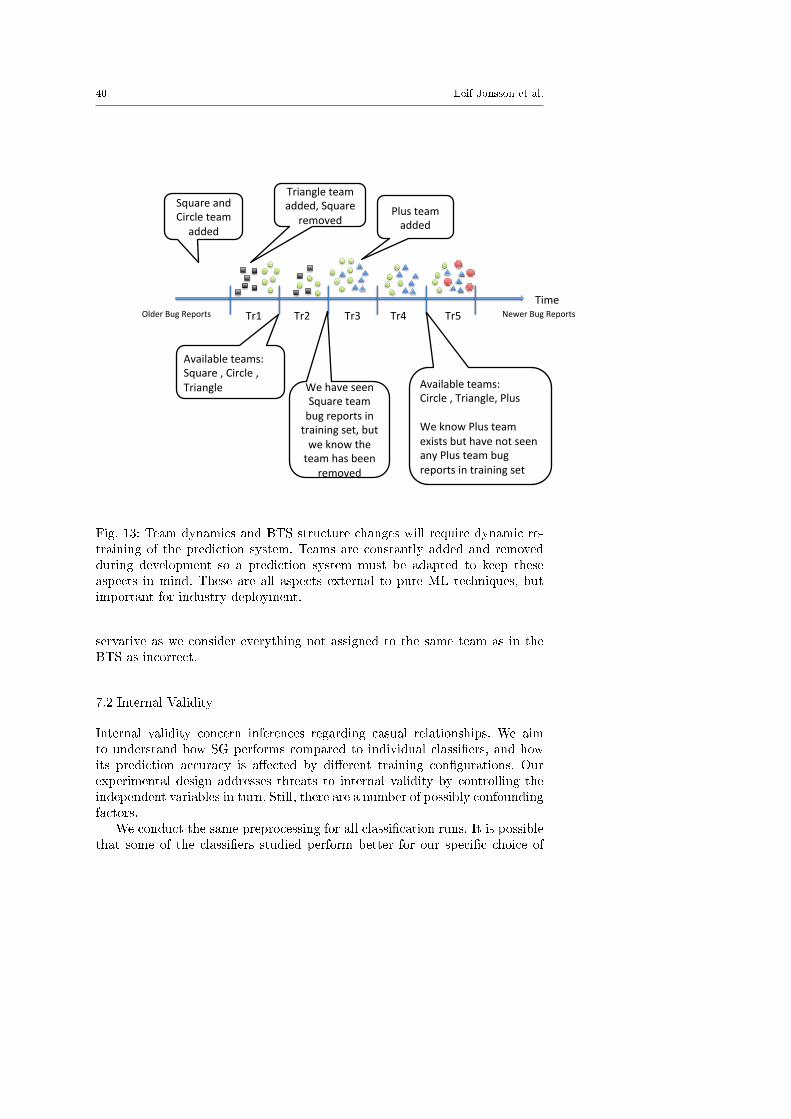
40 Leif Jonsson et al.
Time
Triangle team added, Square
removed Square and Circle team
added
Older Bug Reports Newer Bug Reports
Plus team added
Available teams: Square , Circle , Triangle Available teams:
Circle , Triangle, Plus We know Plus team exists but have not seen any Plus team bug reports in training set
We have seen Square team bug reports in training set, but we know the team has been
removed
Tr1 Tr2 Tr3 Tr4 Tr5
Fig. 13: Team dynamics and BTS structure changes will require dynamic re-training of the prediction system. Teams are constantly added and removedduring development so a prediction system must be adapted to keep theseaspects in mind. These are all aspects external to pure ML techniques, butimportant for industry deployment.
servative as we consider everything not assigned to the same team as in theBTS as incorrect.
7.2 Internal Validity
Internal validity concern inferences regarding casual relationships. We aimto understand how SG performs compared to individual classi�ers, and howits prediction accuracy is a�ected by di�erent training con�gurations. Ourexperimental design addresses threats to internal validity by controlling theindependent variables in turn. Still, there are a number of possibly confoundingfactors.
We conduct the same preprocessing for all classi�cation runs. It is possiblethat some of the classi�ers studied perform better for our speci�c choice of

Title Suppressed Due to Excessive Length 41
preprocessing actions than others. On the other hand, we conduct nothing butstandard preprocessing (i.e., lower casing and standard stop word removal),likely to be conducted in most settings.
We use default con�gurations of all individual classi�ers studied. Whilemost classi�ers are highly con�gurable, we do not perform any tuning. Instead,we consistently use the default con�gurations provided by Weka. The defaultcon�gurations for some classi�ers might be favorable for team assignment andothers might underperform. Furthermore, we evaluated only one single level-1classi�er in SG, also using the default con�guration. However, Wolpert (1992)argues that a simple level-1 classi�er should be su�cient.
7.3 External Validity
External validity re�ect the generalizability of our results. We study �ve largedatasets containing thousands of bug reports from proprietary developmentprojects. All datasets originate from development of di�erent systems, includ-ing middle-ware, client-server solutions, a compiler, and communication pro-tocols. However, while the datasets all are large, they originate from only twodi�erent companies. Furthermore, while the two companies work in di�erentdomains, i.e., automation and telecommunication, both are mainly concernedwith development of embedded systems. To generalize to other domains suchas application development, replications using other datasets are required.
The fraction of bug reports originating from customers is relatively low inall �ve datasets under study. In development contexts where end users submitmore of the bug reports, di�erent natural language descriptions and informa-tion content might be used. This might have an impact on the performanceof SG for team assignment. However, as opposed to most previous work, wefocus on proprietary development projects using closed BTSs.
We �ltered the �ve datasets to contain only bug reports actually describ-ing defects in the production software. It is possible that a BTS is used forother types of issues, as is the case in Company Automation, e.g., documentchanges, change requests, and changes to internal test code. We have not stud-ied how well SG generalizes for these more generic types of issues. On the otherhand, we assume that the most challenging team assignment involves defectsin the production software where the location in source code and the relateddocumentation are unknown.
7.4 Conclusion Validity
Conclusion validity is the degree to which conclusions we reach about relation-ships in our data are reasonable. For experiment A, B, and C we use 10-foldcross validation as conventional in machine learning evaluations. However, asargued by Rao et al (2008), evaluations should also be performed using a se-
questered test set. We accomplish this by performing experiment D and E

42 Leif Jonsson et al.
on separate training and test sets. Moreover, we evaluate the performance inseveral runs as described in Section 5.5.4 and 5.5.5.
The results from 10-fold cross-validation (using strati�ed sampling) andthe evaluations conducted using defect reports submitted by submission dateare di�erent. Cross validation yields higher prediction accuracy, in line withwarnings from previous research (Rao et al, 2008; Kodovsky, 2011). To con-�rm the better results when using cross validation, we validated the resultsusing RapidMiner (Hofmann and Klinkenberg, 2014) for the two datasets Au-tomation and Telecom 4. We trained a Naive Bayes classi�er for Automationand an SVM classi�er for Telecom 4 and observed similar di�erences betweenevaluations using 10-fold cross validation and a sorted dataset.
8 Discussion
This section contains a discussion of the results from our experiments in thecontext of our overall goal: to support bug assignment in large proprietarydevelopment projects using state-of-the-art ML. Section 8.1 synthesizes theresults related to our RQs and discusses the outcome in relation to previouswork. Finally, Section 8.2 reports important experiences from running ourexperiments and advice on industrial adaptation.
8.1 Stacked Generalization in the Light of Previous Work
We conduct a large evaluation of using SG for bug assignment, extending ourprevious work (Jonsson et al, 2012). Our results show that SG (i.e., combiningseveral classi�ers in an ensemble learner) can yield a higher prediction accuracy
than using individual general purpose classi�ers (RQ1, ExpA). The results arein line with �ndings in general ML research (Kuncheva and Whitaker, 2003).However, we show that simply relying on SG is not enough to ensure good re-sults; some care must be taken when doing the ensemble selection (RQ2, ExpB).On the other hand, our results con�rm the thesis by Wolpert (1992) that SGshould on average perform better than the individual classi�ers included inthe ensemble.
We present the �rst study on bug assignment containing 10,000s of bugreports collected from di�erent proprietary development projects. Previouswork has instead focused on bug reports from OSS development projects, e.g.,Eclipse and Firefox, as presented in Section 3. A fundamental di�erence is thatwhile bug assignment in OSS projects typically deal with individual developers,we instead assign bug reports to development teams. As this results in a morecoarse assignment granularity, i.e., our output is a set of developers, one couldargue that we target a less challenging problem.
We achieve prediction accuracy between 50% and 85% for our �ve systemsusing cross-validations, and between 15% and 65% for time-sorted evaluations.Thus, our work on bug team assignment does not display higher prediction

Title Suppressed Due to Excessive Length 43
accuracy than previous work on automated bug assignment to individuals, butis similar to what has been summarized in Figure 3. Consequently, we showthat automated proprietary bug assignment, on a team level, can correctly
classify the same fraction of bug reports as what has been reported for bug
assignment to individual developers in OSS projects. Bug assignment to teamsdoes not appear to be easier than individual assignment, at least not whenconsidering only the top candidate team presented by the ML system.
Cross-validation consistently yielded higher prediction accuracy than con-ducting more realistic evaluations on bug reports sorted by the submissiondate. The dangers of cross-validation have been highlighted in ML evalua-tion before (Rao et al, 2008), and it is a good practice to complement cross-validation with a sequestered test set. Our experiments show that evaluationson bug assignment can not rely on cross-validation alone. Several factors cancause the lower prediction accuracy for the time sorted evaluations. First,cross-validation assumes that the bug reports are independent with no dis-tributional di�erences between the training and test sets (Arlot and Celisse,2010). Bug reports have a natural temporal ordering, and our results sug-gest that the dependence among individual bug reports can not be neglected.Second, we used strati�ed sampling in the cross-validation, but not in thetime sorted evaluations. Strati�cation means that the team distributions inthe training sets and test sets are the same, which could improve the resultsin cross-validation. Third, as we perform manual harmonization of the classesin the time sorted evaluation (see Section 7), all teams are always possibleclassi�cations. In cross-validation, Weka performs the harmonization just forthe teams involved in the speci�c run, resulting in fewer available teams andpossibly a higher prediction accuracy.
8.2 Lessons Learned and Industrial Adoption
Two �ndings from our study will have practical impact on the deployment ofour approach in industrial practice. First, we studied how large the trainingset needs to be for SG to reach its potential. The learning curves from 10-fold cross-validation show that larger training set are consistently better, butthe improvement rate decreases after about 2,000 training examples. The pointwith the maximum curvature, similar to an elbow point (Tibshirani et al, 2001)as used in cluster analysis, appears in the same region for all �ve systems. Asa result, we suggest, as a rule of thumb, that at least 2,000 training examples
should be used when using SG for automated bug assignment (RQ3, ExpC).The second important �nding of practical signi�cance relates to how of-
ten an ML system for bug assignment needs to be retrained. For all but onedataset, our results show a clear decay of prediction accuracy as we use oldertraining data. For two datasets the decay appears exponential, and for twodatasets the decay is linear. Our conclusion is that the time locality of thetraining data is important to get a high prediction accuracy, i.e., SG for bug
assignment is likely to achieve a higher prediction accuracy if trained on re-
44 Leif Jonsson et al.
cent bug reports (RQ4, ExpD). Bhattacharya et al (2012) recently made thesame observation for automated bug assignment using large datasets from thedevelopment of Eclipse and Mozilla projects.
Finding the right time to retrain SG appears to be a challenge, as we wantto �nd the best balance between using many training examples and restrictingthe training set to consist of recent data. In Experiment E, our last experiment,we try several di�erent cumulatively increasing training sets at multiple pointsin time. This experimental setup mimics realistic use of SG for bug assignment,trained on di�erent amounts of previous bug reports. We show that for four ofour datasets, the positive e�ect of using larger training sets is nulli�ed by the
negative e�ect of adding old training examples. Only for one dataset it appearsmeaningful to keep as much old data as possible.
When deployed in industrial practice, we recommend that the prediction
accuracy of automated bug assignment should be continuously monitored to
identify when it starts to deteriorate. For four of our datasets, cumulativelyincreasing the amount of training data is bene�cial at �rst (see Figure 12), butthen SG reaches a maximum prediction accuracy. For all but one dataset, theprediction accuracy starts to decay even before reaching the 2,000 training ex-amples recommended based on the results from Experiment C. Furthermore,we stress that attention should be paid to alterations of the prediction accu-racy when signi�cant changes to either the development process or the actualsoftware product are made. Changes to the team structure and the BTS clearlyindicate that SG should be retrained, but also process changes, new tools inthe organization, and changes to the product can have an impact on the at-tributes used for automated bug assignment. In practice, the monitoring ofthe prediction accuracy could be accomplished by measuring the amount ofbug tossing taking place after the automated bug assignment has taken place.
While we can measure the prediction accuracy of SG for bug assignment, itis not clear what this means for practical purposes. How accurate do the classi-�cations have to be before developers start recognizing its value? Regnell et al(2008) describe quality, in our case the prediction accuracy of automated bugassignment, as continuous and non-linear. Figure 14 shows what this meansfor bug assignment. The perceived usefulness of SG is on a sliding scale with
speci�c breakpoints. The utility breakpoint represents when developers startconsidering automated bug assignment useful, any prediction accuracy belowthis level is useless. The saturation breakpoint indicates where increased pre-diction accuracy has no practical signi�cance to developers. Figure 14 alsodisplays the prediction accuracy of human analysts between the breakpoints.We argue that automated bug assignment does not have to reach the humanaccuracy to be perceived useful, as the automated process is much faster thanthe manual process. Our early evaluations indicate that the prediction accu-racy of SG in Company Telecom is in line with the manual process (Jonssonet al, 2012). Even though this study also used 10-fold cross-validation, whichwe have seen can give overly optimistic estimates in this context; we believethat our prototype has passed the utility breakpoint before we have startedany context speci�c tuning of SG.

Title Suppressed Due to Excessive Length 45
Excessive
Compe--ve
Useful
Useless
U-lity breakpoint
Quality Level
Benefit
Differen-a-on breakpoint
Satura-on breakpoint
Fig. 14: Perceived bene�t vs. prediction accuracy. The �gure shows twobreakpoints and the current prediction accuracy of human analysts. Adaptedfrom Regnell et al (2008).
When we implement automated bug assignment in an industrial tool, weplan to present a handful of candidate teams to the user for each bug reportunder investigation. While we could automatically assign the bug to the �rstcandidate, our �rst step is to provide decision support to the CCB. Consideringthe automation levels de�ned by Parasuraman et al (2000), this re�ects anincrease in automation from level 0 to level 3: �narrowing the selection downto a few�. By presenting a limited selection of teams, possibly together with ameasure of the con�dence level from SG, an experienced developer can quicklychoose the best target for the bug assignment. Note that the experimentaldesign we used in the evaluations in this study are stricter as we only consideredone single team assignment per bug report. Another recommendation is to planfrom the start to run the new ML-based system in parallel with the old way ofworking, to evaluate if the prediction accuracy is good enough for a completeroll over to a process supported by ML.
Furthermore, we must develop the tool to present the candidate teamsto the user in a suitable manner. Murphy-Hill and Murphy (2014) presentsseveral factors that a�ects how users perceive recommendations provided bysoftware engineering tools. The two most important factors for our tool aretransparency and the related aspect assessability. A developer must be able tosee why our tool suggests assigning a bug report to a speci�c team, i.e., therationale leading to the SG classi�cation must be transparent. Also, our toolshould support developers in assessing the correctness of a suggested assign-
ment. We aim to achieve this by enabling interaction with the output, e.g.,

46 Leif Jonsson et al.
browsing previous bug assignments, opening detailed bug information, andcomparing bug reports.
9 Conclusions and Future Work
We conduct the �rst evaluation of automated bug assignment using largeamounts of bug reports, collected from proprietary software development pro-jects. Using an ensemble learner, Stacked Generalization (SG), we train anML system on historical bug reports from �ve di�erent projects in two dif-ferent, large companies. We show that SG consistently outperforms individual
classi�ers with regard to prediction accuracy even though the improvementsare sometimes marginal (RQ1). Moreover, our results suggest that it is worth-while to strive for a diverse set of individual classi�ers in the ensemble (RQ2),consistent with recommendations in the general ML research �eld. Our resultsshow that SG, with feasible ensemble selection, can reach prediction accuraciesof 50% to 90% for the di�erent systems, in line with the prediction accuracyof the current manual process. We also brie�y study the relative value of tex-tual vs. non-textual features, and conclude that the most promising results areobtained when combining both in SG. In future work we plan to improve thetextual features with more advanced text modeling techniques such as TopicModeling (LDA).
We study the SG learning curves for the �ve systems (RQ3), using 10-fold cross-validation. The learning curves for all �ve datasets studied displaysimilar behaviour, thus we present an empirically based rule of thumb: whentraining SG for automated bug assignment, aim for at least 2,000 bug reports
in the training set. Using time-sorted bug reports in the training and test setswe show that the prediction accuracy decays as older training data is used
(RQ4). Consequently, we show that the bene�t of adding more bug reports in
the training set is nulli�ed by the disadvantage of training the system on less
recent data. Our conclusion is that any ML system used for automated bug
assignment should be continuously monitored to detect decreases in prediction
accuracy.Our results con�rm previous claims that relying only on K-fold cross-
validation is not enough to evaluate automated bug assignment. We achievehigher prediction accuracy when performing 10-fold cross-validation with strat-i�cation than when analyzing bug reports sorted by the submission date. Thedi�erences we observe are likely to be of practical signi�cance, thus it is im-portant to report evaluations also using sorted data, i.e., mimicking a real-istic in�ow of bug reports. Several authors have proposed modi�cations tocross-validation to allow evaluations on dependent data, e.g., h-block cross-validation (Burman et al, 1994). Future work could try this for bug assignmentevaluation, which means reducing the training set by removing h observationspreceding and following the observations in the test set.
When deploying automated bug assignment in industry, we plan to presentmore than one candidate development team to the user of the ML system. By
Title Suppressed Due to Excessive Length 47
presenting a ranked list of teams, along with rationales of our suggestions, anexperienced member of the CCB should be able to use the tool as decisionsupport to select the most appropriate team assignment. Our current evalu-ation does not take this into account, as we only measure the correctness ofthe very �rst candidate. Future work could extend this evaluation by evaluat-ing lists of candidates, opening up for measures from the information retrieval�eld, e.g., mean average precision and normalized discounted cumulative gain.Finally, to properly evaluate how ML can support bug assignment in industry,the research community needs to conduct industrial case studies in organiza-tions using the approach. In particular, it is not clear how high the predictionaccuracy needs to be before organizations perceive the system to be �goodenough�.
Future work could be directed toward improving our approach to auto-mated bug assignment. A number of studies in the past show that tools spe-cialized for bug assignment in a particular project can outperform generalpurpose classi�ers (Tamrawi et al, 2011; Xie et al, 2012; Xia et al, 2013). Itwould be possible for us to explore if any enhancements proposed in previ-ous work could improve the accuracy of SG, e.g., topic models, social networkanalysis, or mining the commit history of source code repositories. Also, wecould further investigate if any particular characteristics of team assignmentin proprietary projects could be used to improve automated bug assignment,i.e., characteristics that do not apply to OSS projects.
Another direction for future enhancements of our approach could explorehow to adapt bug assignment based on the developers' current work load inthe organization. The current solution simply aims to assign a bug report todevelopment teams that worked on similar bug reports in the past. Anotheroption would to optimize the resolution times of bug reports by assigning bugsto the team most likely to close them fast. For many bug reports, more thanone team is able to resolve the issue involved, especially in organizations witha dedicated strategy for shared code ownership. Future work could explore thefeature engineering required for SG to cover this aspect. Yet another possiblepath for future work, made possible by the large amount of industrial data wehave collected, would be to conduct comparative studies of bug reports fromOSS and proprietary projects, similar to what Robinson and Francis (2010)reported for source code.
Acknowledgements This work was supported in part by the Industrial Excellence CenterEASE � Embedded Applications Software Engineering9.
References
Aberdour M (2007) Achieving Quality in Open-Source Software. IEEE Soft-ware 24(1):58�64
9 http://ease.cs.lth.se

48 Leif Jonsson et al.
Ahsan S, Ferzund J, Wotawa F (2009) Automatic Software Bug Triage System(BTS) Based on Latent Semantic Indexing and Support Vector Machine. In:Proc. of the 4h International Conference on Software Engineering Advances,pp 216�221
Alenezi M, Magel K, Banitaan S (2013) E�cient Bug Triaging Using TextMining. Journal of Software 8(9)
Alshammari R, Zincir-Heywood A (2009) Machine learning based encryptedtra�c classi�cation: Identifying SSH and Skype. In: Proc. of the Symposiumon Computational Intelligence for Security and Defense Applications, pp 1�8
Amamra A, Talhi C, Robert JM, Hamiche M (2012) Enhancing SmartphoneMalware Detection Performance by Applying Machine Learning HybridClassi�ers. In: Kim Th, Ramos C, Kim Hk, Kiumi A, Mohammed S, SlezakD (eds) Computer Applications for Software Engineering, Disaster Recov-ery, and Business Continuity, no. 340 in Communications in Computer andInformation Science, Springer Berlin Heidelberg, pp 131�137
Anvik J (2007) Assisting Bug Report Triage through Recommendation. The-sis, University of British Columbia
Anvik J, Murphy GC (2011) Reducing the e�ort of bug report triage: Rec-ommenders for development-oriented decisions. Trans Softw Eng Methodol20(3):10:1�10:35
Anvik J, Hiew L, Murphy GC (2006) Who should �x this bug? In: Proc. ofthe 28th International Conference on Software Engineering, New York, NY,USA, '06, pp 361�370
Arlot S, Celisse A (2010) A survey of cross-validation procedures for modelselection. Statistics Surveys 4:40�79
Asklund U, Bendix L (2002) A study of con�guration management in opensource software projects. IEE Proceedings - Software 149(1):40�46
Avazpour I, Pitakrat T, Grunske L, Grundy J (2014) Dimensions and Met-rics for Evaluating Recommendation Systems. In: Robillard M, Maalej W,Walker R, Zimmermann T (eds) Recommendation Systems in Software En-gineering, Springer, pp 245�273
Basili V, Selby R, Hutchens D (1986) Experimentation in software engineer-ing. IEEE Transactions on Software Engineering SE-12(7):733�743, DOI10.1109/TSE.1986.6312975
Baysal O, Godfrey M, Cohen R (2009) A bug you like: A framework for au-tomated assignment of bugs. In: Proc. of the 17th International Conferenceon Program Comprehension, pp 297�298
Bettenburg N, Premraj R, Zimmermann T, Sunghun K (2008) Duplicate bugreports considered harmful... really? In: Proceedings of the InternationalConference on Software Maintenance, pp 337�345
Bezanson J, Karpinski S, Shah VB, Edelman A (2012) Julia: A Fast DynamicLanguage for Technical Computing ArXiv: 1209.5145
Bhattacharya P, Neamtiu I, Shelton CR (2012) Automated, highly-accurate,bug assignment using machine learning and tossing graphs. Journal of Sys-tems and Software 85(10):2275�2292

Title Suppressed Due to Excessive Length 49
Bifet A, Holmes G, Kirkby R, Pfahringer B (2010) : Massive Online Analysis.J Mach Learn Res 11:1601�1604
Bishop CM (2006) Pattern Recognition and Machine Learning. Springer, NewYork
Blei D, Ng A, Jordan M (2003) Latent Dirichlet Allocation.The Journal of Machine Learning Research 3:993�1022, URLhttp://dl.acm.org/citation.cfm?id=944919.944937
Borg M, Pfahl D (2011) Do better IR tools improve the accuracy of engineers'traceability recovery? In: Proc. of the International Workshop on MachineLearning Technologies in Software Engineering, pp 27�34
Borg M, Runeson P, Ardo A (2014) Recovering from a decade: A systematicmapping of information retrieval approaches to software traceability. Empir-ical Software Engineering 19(6):1565�1616, DOI 10.1007/s10664-013-9255-y
Breiman L (1996) Bagging Predictors. Machine Learning 24(2):123�140Burman P, Chow E, Nolan D (1994) A cross-validatory method for dependentdata. Biometrika 81(2):351�358
Canfora G, Cerulo L (2006) Supporting change request assignment in opensource development. In: Proc. of the Symposium on Applied Computing, pp1767�1772
Chen L, Wang X, Liu C (2011) An Approach to Improving Bug Assignmentwith Bug Tossing Graphs and Bug Similarities. Journal of Software 6(3)
Cubranic D, Murphy GC (2004) Automatic bug triage using text categoriza-tion. In: Proc. of the 16th International Conference on Software Engineering& Knowledge Engineering, pp 92�97
Frank E, Hall M, Trigg L, Holmes G, Witten I (2004) Data mining in bioin-formatics using Weka. Bioinformatics 20(15):2479�2481
Freund Y, Schapire RE (1995) A desicion-theoretic generalization of on-linelearning and an application to boosting. In: Vitanyi P (ed) ComputationalLearning Theory, no. 904 in Lecture Notes in Computer Science, SpringerBerlin Heidelberg, pp 23�37
Green SB (1991) How Many Subjects Does It Take To Do A Regression Anal-ysis. Multivariate Behavioral Research 26(3):499�510
Hall M, Frank E, Holmes G, Pfahringer B, Reutemann P, Witten IH (2009)The WEKA data mining software: an update. SIGKDD Explor Newsl11(1):10�18
Helming J, Arndt H, Hodaie Z, Koegel M, Narayan N (2011) Automatic As-signment of Work Items. In: Maciaszek LA, Loucopoulos P (eds) Proc. ofthe International Conference on Evaluation of Novel Approaches to SoftwareEngineering, Springer Berlin Heidelberg, pp 236�250
Hofmann M, Klinkenberg R (eds) (2014) : Data Mining Use Cases and BusinessAnalytics Applications. Chapman and Hall/CRC
Jeong G, Kim S, Zimmermann T (2009) Improving bug triage with bug toss-ing graphs. In: Proc. of the 7th joint meeting of the European SoftwareEngineering Conference and the ACM SIGSOFT Symposium on The Foun-dations of Software Engineering, New York, NY, USA, pp 111�120

50 Leif Jonsson et al.
Jonsson L, Broman D, Sandahl K, Eldh S (2012) Towards Automated AnomalyReport Assignment in Large Complex Systems Using Stacked Generaliza-tion. Proc of the International Conference on Software Testing, Veri�cation,and Validation pp 437�446
Just S, Premraj R, Zimmermann T (2008) Towards the next generation ofbug tracking systems. In: Proc. of the Symposium on Visual Languages andHuman-Centric Computing, IEEE Computer Society, pp 82�85
Kagdi H, Gethers M, Poshyvanyk D, Hammad M (2012) Assigning changerequests to software developers. Journal of Software: Evolution and Process24(1):3�33
Kodovsky J (2011) On dangers of cross-validation in steganalysis. Tech. rep.,Birmingham University
Kohavi R (1995) A Study of Cross-validation and Bootstrap for AccuracyEstimation and Model Selection. In: Proc. of the 14th International JointConference on Arti�cial Intelligence - Volume 2, pp 1137�1143
Kuncheva LI, Whitaker CJ (2003) Measures of Diversity in Classi�er Ensem-bles and Their Relationship with the Ensemble Accuracy. Machine Learning51(2):181�207
Li N, Li Z, Nie Y, Sun X, Li X (2011) Predicting software black-box defectsusing stacked generalization. In: Proc. of the International Conference onDigital Information Management, pp 294�299
Li Q, Wang Q, Yang Y, Li M (2008) Reducing Biases in Individual SoftwareE�ort Estimations: A Combining Approach. In: Proc. of the 2nd Interna-tional Symposium on Empirical Software Engineering and Measurement, pp223�232, URL http://doi.acm.org/10.1145/1414004.1414041
Lin Z, Shu F, Yang Y, Hu C, Wang Q (2009) An empirical study on bugassignment automation using Chinese bug data. In: Proc. of the 3rd Inter-national Symposium on Empirical Software Engineering and Measurement,pp 451�455
Linares-Vasquez M, Hossen K, Dang H, Kagdi H, Gethers M, PoshyvanykD (2012) Triaging incoming change requests: Bug or commit history, orcode authorship? In: Proc. of the 28th International Conference on SoftwareMaintenance, pp 451�460
Matter D, Kuhn A, Nierstrasz O (2009) Assigning bug reports using avocabulary-based expertise model of developers. In: 6th IEEE InternationalWorking Conference on Mining Software Repositories, 2009. MSR '09, pp131�140, DOI 10.1109/MSR.2009.5069491
McCallum A (2002) : A Machine Learning for Language Toolkit. Tech. rep.,URL http://mallet.cs.umass.edu
Mozilla (2013) Life Cycle of a Bug. URLhttp://www.bugzilla.org/docs/tip/en/html/lifecycle.html, [Online; ac-cessed 28-October-2013]
Murphy-Hill E, Murphy G (2014) Recommendation Delivery: Getting the UserInterface Just Right. In: Robillard M, Maalej W, Walker R, ZimmermannT (eds) Recommendation Systems in Software Engineering, Springer
Title Suppressed Due to Excessive Length 51
Nagwani N, Verma S (2012) Predicting expert developers for newly reportedbugs using frequent terms similarities of bug attributes. In: Proc. of the 9thInternational Conference on ICT and Knowledge Engineering, pp 113�117
Owen S, Anil R, Dunning T, Friedman E (2011) Mahout in Action. ManningPublications, Shelter Island, New York
Parasuraman R, Sheridan T, Wickens C (2000) A model for types and levelsof human interaction with automation. Transactions on Systems, Man andCybernetics 30(3):286�297
Park J, Lee M, Kim J, Hwang S, Kim S (2011) : A Cost-Aware Triage Algo-rithm for Bug Reporting Systems. In: Proc. of the 25th AAAI Conferenceon Arti�cial Intelligence
Paulson J, Succi G, Eberlein A (2004) An empirical study of open-sourceand closed-source software products. Transactions on Software Engineering30(4):246�256
Petersen K, Wohlin C (2009) Context in Industrial Software Engineering Re-search. In: Proc. of the 3rd International Symposium on Empirical SoftwareEngineering and Measurement, pp 401�404
Rao R, Fung G, Rosales R (2008) On the Dangers of Cross-Validation. AnExperimental Evaluation. In: Proc. of the SIAM International Conferenceon Data Mining, pp 588�596
Regnell B, Berntsson Svensson R, Olsson T (2008) Supporting Roadmap-ping of Quality Requirements. IEEE Software 25(2):42�47, DOI10.1109/MS.2008.48
Robillard M, Maalej W, Walker R, Zimmermann T (eds) (2014) Recommen-dation Systems in Software Engineering. Springer
Robinson B, Francis P (2010) Improving Industrial Adoption of Software En-gineering Research: A Comparison of Open and Closed Source Software. In:Proc. of the International Symposium on Empirical Software Engineeringand Measurement, pp 21:1�21:10
Robles G, Gonzalez-Barahona J (2006) Contributor Turnover in Libre SoftwareProjects. In: Damiani E, Fitzgerald B, Scacchi W, Scotto M, Succi G (eds)Open Source Systems, no. 203 in International Federation for InformationProcessing, Springer, pp 273�286
Servant F, Jones J (2012) : Automatic developer-to-fault assignment throughfault localization. In: Proc. of the 34th International Conference on SoftwareEngineering (ICSE), pp 36�46
Shokripour R, Kasirun Z, Zamani S, Anvik J (2012) Automatic Bug Assign-ment Using Information Extraction Methods. In: Proc. of the InternationalConference on Advanced Computer Science Applications and Technologies,pp 144�149
Sill J, Takacs G, L M, D L (2009) Feature-Weighted Linear Stacking. CoRRTamrawi A, Nguyen T, Al-Kofahi J, Nguyen T (2011) Fuzzy Set and Cache-based Approach for Bug Triaging. In: Proc. of the 19th ACM SIG-SOFT Symposium and the 13th European Conference on Foundations ofSoftware Engineering, pp 365�375, DOI 10.1145/2025113.2025163, URLhttp://doi.acm.org/10.1145/2025113.2025163

52 Leif Jonsson et al.
Thomas S, Nagappan M, Blostein D, Hassan A (2013) The Impact of Classi�erCon�guration and Classi�er Combination on Bug Localization. Transactionson Software Engineering 39(10):1427�1443
Tibshirani R, Walther G, Hastie T (2001) Estimating the number of clustersin a data set via the gap statistic. Journal of the Royal Statistical Society:Series B (Statistical Methodology) 63(2):411�423
Wiklund K, Eldh S, Sundmark D, Lundqvist K (2013) Can we do useful in-dustrial software engineering research in the shadow of lean and agile? In:Proc. of the 1st International Workshop on Conducting Empirical Studiesin Industry, pp 67�68
Witten IH, Frank E, Hall MA (2011) Data Mining. pub, Burlington, MAWohlin C, Runeson P, Host M, Ohlsson M, Regnell B, Wesslen A (2012)Experimentation in Software Engineering: A Practical Guide. Springer
Wolpert D (1992) Stacked Generalization. jour 5(2):241�259Wu W, Zhang W, Yang Y, Wang Q (2011) : Developer Recommendation withK-Nearest-Neighbor Search and Expertise Ranking. In: Proc. of the 18thAsia Paci�c Software Engineering Conference, pp 389�396
Xia X, Lo D, Wang X, Zhou B (2013) Accurate developer recommendationfor bug resolution. In: Proc. of the 20th Working Conference on ReverseEngineering, pp 72�81
Xie X, Zhang W, Yang Y, Wang Q (2012) : Developer Recommendation Basedon Topic Models for Bug Resolution. In: Proc. of the 8th International Con-ference on Predictive Models in Software Engineering, pp 19�28
Zaharia M, Chowdhury NMM, Franklin M, Shenker S, Stoica I (2010) Spark:Cluster Computing with Working Sets. Tech. rep., EECS Department, Uni-versity of California, University of California at Berkeley, Berkeley, Califor-nia
Zhao Y, Zhang Y (2008) Comparison of decision tree methods for �ndingactive objects. Advances in Space Research 41(12):1955�1959