autoliv earnings presentation - seeking alpha
TRANSCRIPT

AutolivEarnings Call Presentation1st Quarter 2021
1 ALV – Q1-2021 Earnings Call and WebcastApril 23, 2021
Safe Harbor Statement*
This presentation contains statements that are not historical facts but rather forward-looking statements within the meaning of the Private Securities Litigation Reform Act of 1995. Such forward-looking statements include those that address activities, events or developments that Autoliv, Inc. or its management believes or anticipates may occur in the future. All forward-looking statements are based upon our current expectations, various assumptions and/or data available from third parties. Our expectations and assumptions are expressed in good faith and we believe there is a reasonable basis for them. However, there can be no assurance that such forward-looking statements will materialize or prove to be correct as forward-looking statements are inherently subject to known and unknown risks, uncertainties and other factors which may cause actual future results, performance or achievements to differ materially from the future results, performance or achievements expressed in or implied by such forward-looking statements. In some cases, you can identify these statements by forward-looking words such as “estimates”, “expects”, “anticipates”, “projects”, “plans”, “intends”, “believes”, “may”, “likely”, “might”, “would”, “should”, “could”, or the negative of these terms and other comparable terminology, although not all forward-looking statements contain such words. Because these forward-looking statements involve risks and uncertainties, the outcome could differ materially from those set out in the forward-looking statements for a variety of reasons, including without limitation, changes in light vehicle production; the impacts of the coronavirus (COVID-19) pandemic on the Company’s financial condition, business operations and liquidity and the global economy; fluctuation in vehicle production schedules for which the Company is a supplier; supply chain disruptions and component shortages impacting the Company or the automotive industry; supply chain disruption and shortages impacting the Company or the automotive industry; changes in general industry and market conditions or regional growth or decline; changes in and the successful execution of our capacity alignment, restructuring and cost reduction initiatives and the market reaction thereto; loss of business from increased competition; higher raw material, fuel and energy costs; changes in consumer and customer preferences for end products; customer losses; changes in regulatory conditions; customer bankruptcies, consolidations, or restructuring or divestiture of customer brands; unfavorable fluctuations in currencies or interest rates among the various jurisdictions in which we operate; market acceptance of our new products; costs or difficulties related to the integration of any new or acquired businesses and technologies; continued uncertainty in pricing negotiations with customers; successful integration of acquisitions and operations of joint ventures; successful implementation of strategic partnerships and collaborations; our ability to be awarded new business; product liability, warranty and recall claims and investigations and other litigation and customer reactions thereto; higher expenses for our pension and other postretirement benefits, including higher funding needs for our pension plans; work stoppages or other labor issues; possible adverse results of pending or future litigation or infringement claims; our ability to protect our intellectual property rights; negative impacts of antitrust investigations or other governmental investigations and associated litigation relating to the conduct of our business; tax assessments by governmental authorities and changes in our effective tax rate; dependence on key personnel; legislative or regulatory changes impacting or limiting our business; political conditions; dependence on and relationships with customers and suppliers; and other risks and uncertainties identified under the headings “Risk Factors” and “Management’s Discussion and Analysis of Financial Condition and Results of Operations” in our Annual Reports and Quarterly Reports on Forms 10-K and 10-Q and any amendments thereto. For any forward-looking statements contained in this or any other document, we claim the protection of the safe harbor for forward-looking statements contained in the Private Securities Litigation Reform Act of 1995, and we assume no obligation to update publicly or revise any forward-looking statements in light of new information or future events, except as required by law.
ALV – Q1-2021 Earnings Call and Webcast2
(*) Non-US GAAP reconciliations are disclosed in our regulatory filings available at www.sec.gov or www.autoliv.com
April 23, 2021
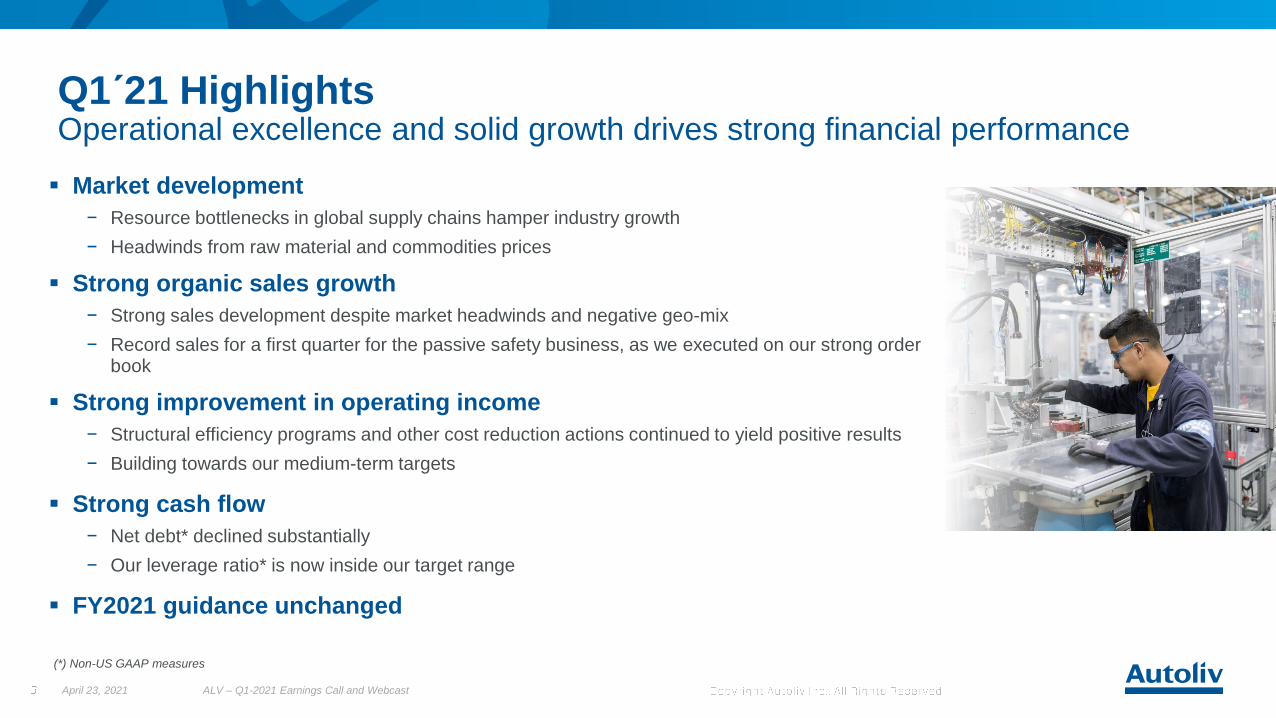
Q1´21 HighlightsOperational excellence and solid growth drives strong financial performance
April 23, 2021 ALV – Q1-2021 Earnings Call and Webcast
▪ Market development
− Resource bottlenecks in global supply chains hamper industry growth
− Headwinds from raw material and commodities prices
▪ Strong organic sales growth
− Strong sales development despite market headwinds and negative geo-mix
− Record sales for a first quarter for the passive safety business, as we executed on our strong order book
▪ Strong improvement in operating income
− Structural efficiency programs and other cost reduction actions continued to yield positive results
− Building towards our medium-term targets
▪ Strong cash flow
− Net debt* declined substantially
− Our leverage ratio* is now inside our target range
▪ FY2021 guidance unchanged
(*) Non-US GAAP measures

Strong sales and margin recovery from last year
ALV – Q1-2021 Earnings Call and Webcast4
Q1´21 Financial Highlights
$1,846
$2,242
Q1´20 Q1´21
Consolidated SalesUS$ (Millions)
$136
$237
Q1´20 Q1´21
Adjusted Operating Income* US$ (Millions)
21% $101
(*) Non-US GAAP measures exclude costs for capacity alignments
$156
$186
Q1´20 Q1´21
Operating Cash FlowUS$ (Millions)
$30
7.4% Adj. Op. Margin*
10.6% Adj.Op. Margin*
April 23, 2021
AMERICAS
ALV – Q1-2021 Earnings Call and Webcast5
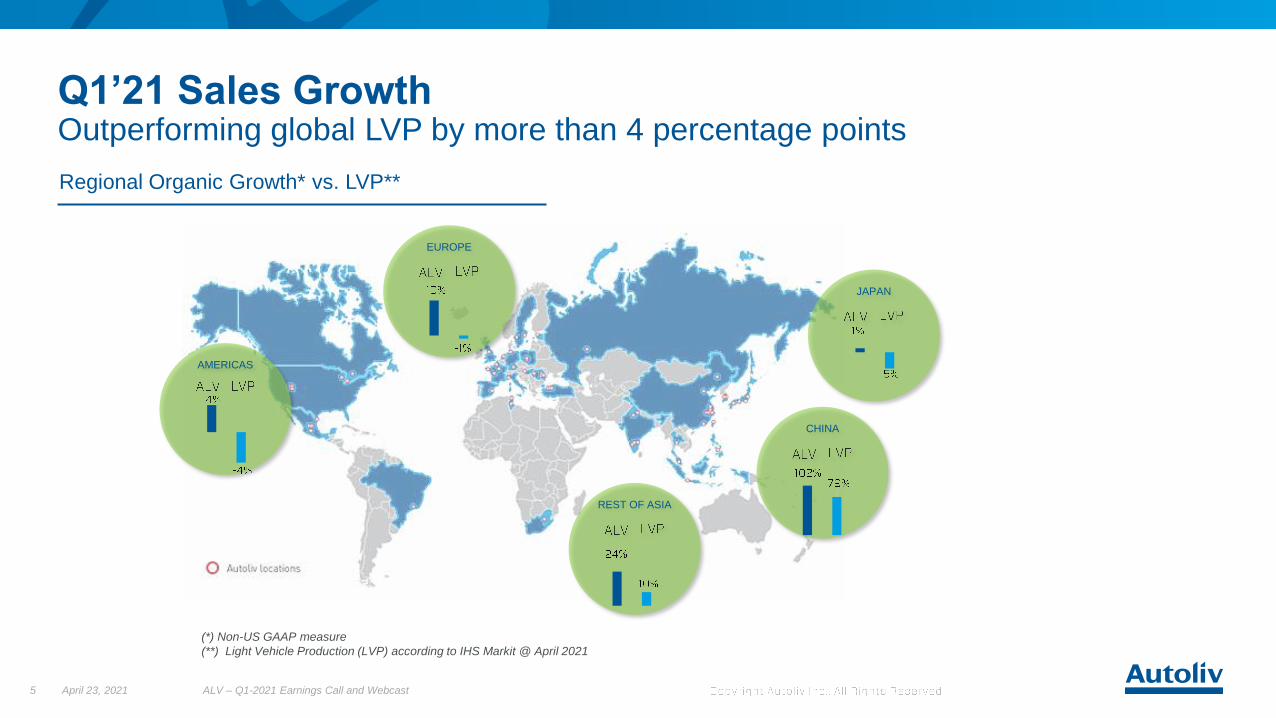
Q1’21 Sales GrowthOutperforming global LVP by more than 4 percentage points
Regional Organic Growth* vs. LVP**
(*) Non-US GAAP measure
(**) Light Vehicle Production (LVP) according to IHS Markit @ April 2021
April 23, 2021
EUROPE
JAPAN
CHINA
REST OF ASIA
ALV – Q1-2021 Earnings Call and Webcast6
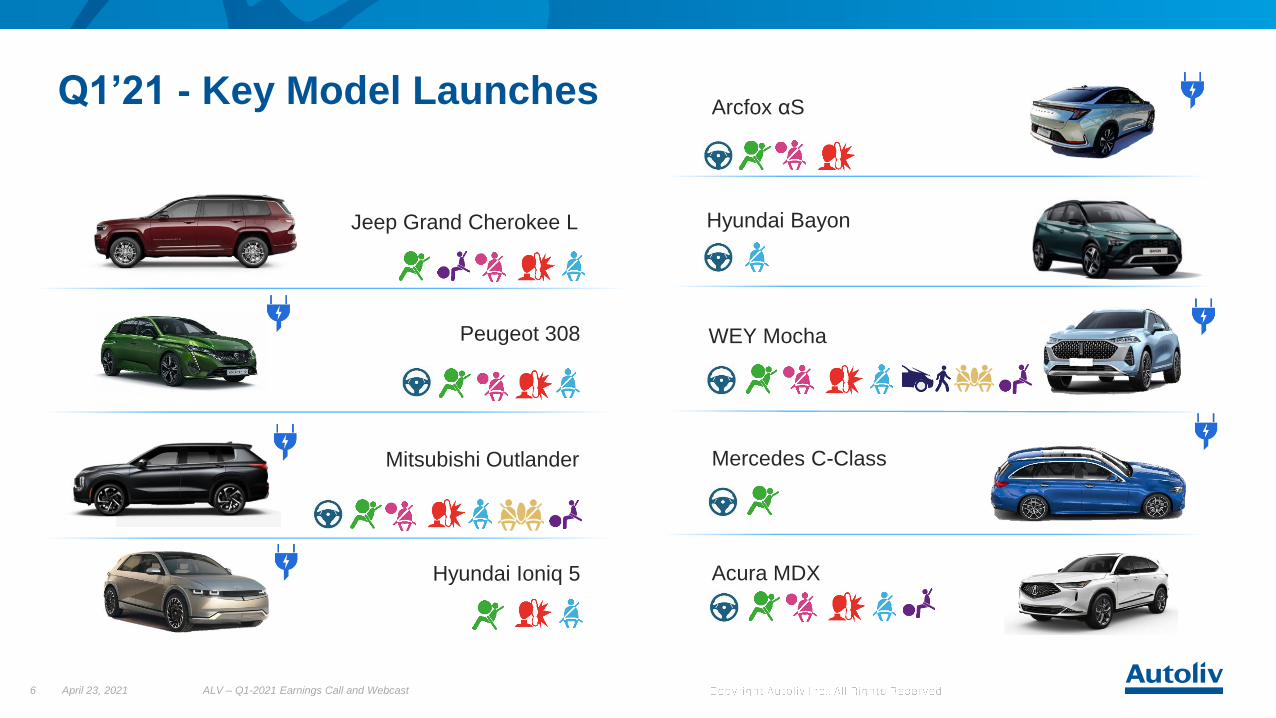
Q1’21 - Key Model Launches
Jeep Grand Cherokee L
Peugeot 308
Mitsubishi Outlander
WEY Mocha
Mercedes C-Class
Acura MDX
Hyundai Bayon
Arcfox αS
April 23, 2021
Hyundai Ioniq 5

ALV – Q1-2021 Earnings Call and Webcast7
(1) Non-US GAAP measures exclude costs for capacity alignments
(2) Return on Capital Employed (RoCE) and Return on Equity (RoE)
(3) Light Vehicle Production (LVP) according to IHS Markit @ April 2021
Q1´21 Financial Overview
(US $ Millions unless specified) Q1’21 Q1’20
Sales $2,242 $1,846
Gross Profit $458 20.4% $331 17.9%
Adj. Operating Income1 $237 10.6% $136 7.4%
EPS (assuming dilution) $1.79 $0.86
Adj. RoCE1,2 26% 15%
Adj. RoE1,2 25% 15%
Operating cash flow $186 $156
Dividend paid per share - $0.62
Global LVP3 (annual rate) ~78M ~69M
April 23, 2021
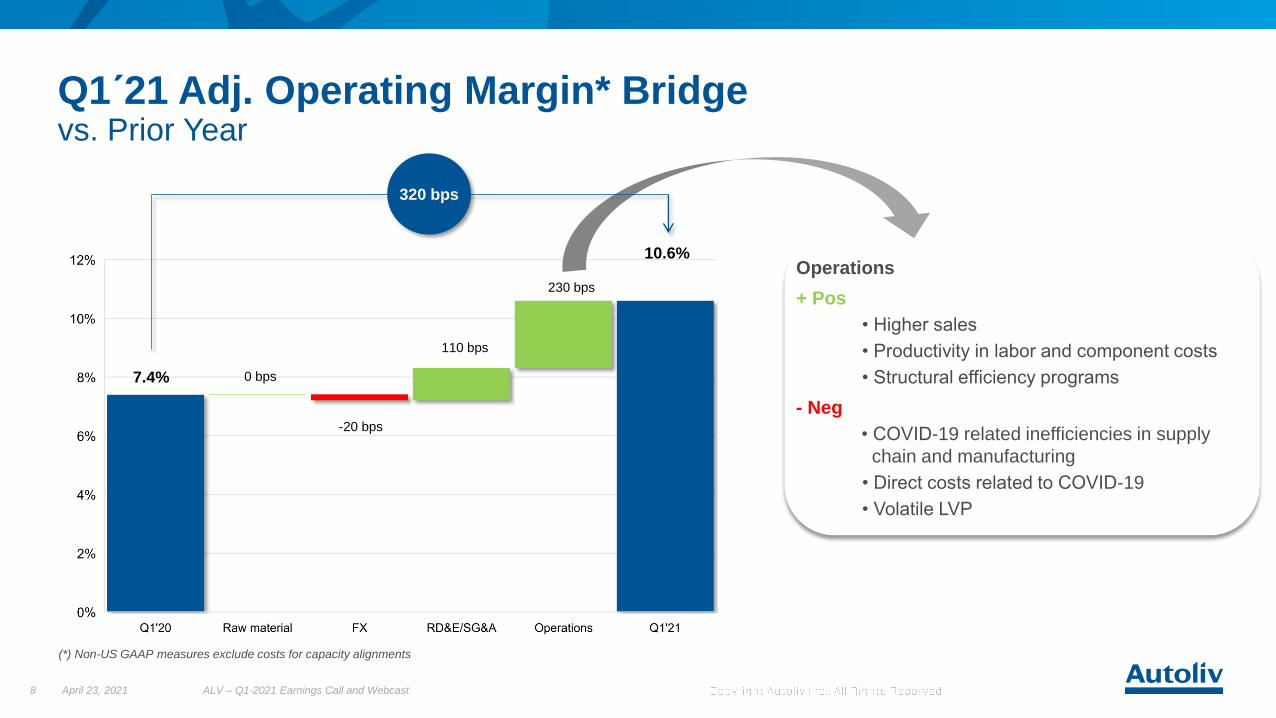
vs. Prior Year
ALV – Q1-2021 Earnings Call and Webcast8
Q1´21 Adj. Operating Margin* Bridge
Operations
+ Pos
• Higher sales
• Productivity in labor and component costs
• Structural efficiency programs
- Neg
• COVID-19 related inefficiencies in supply
chain and manufacturing
• Direct costs related to COVID-19
• Volatile LVP
April 23, 2021
0 bps
-20 bps
110 bps
7.4%
10.6%
(*) Non-US GAAP measures exclude costs for capacity alignments
230 bps
320 bps
ALV – Q1-2021 Earnings Call and Webcast9
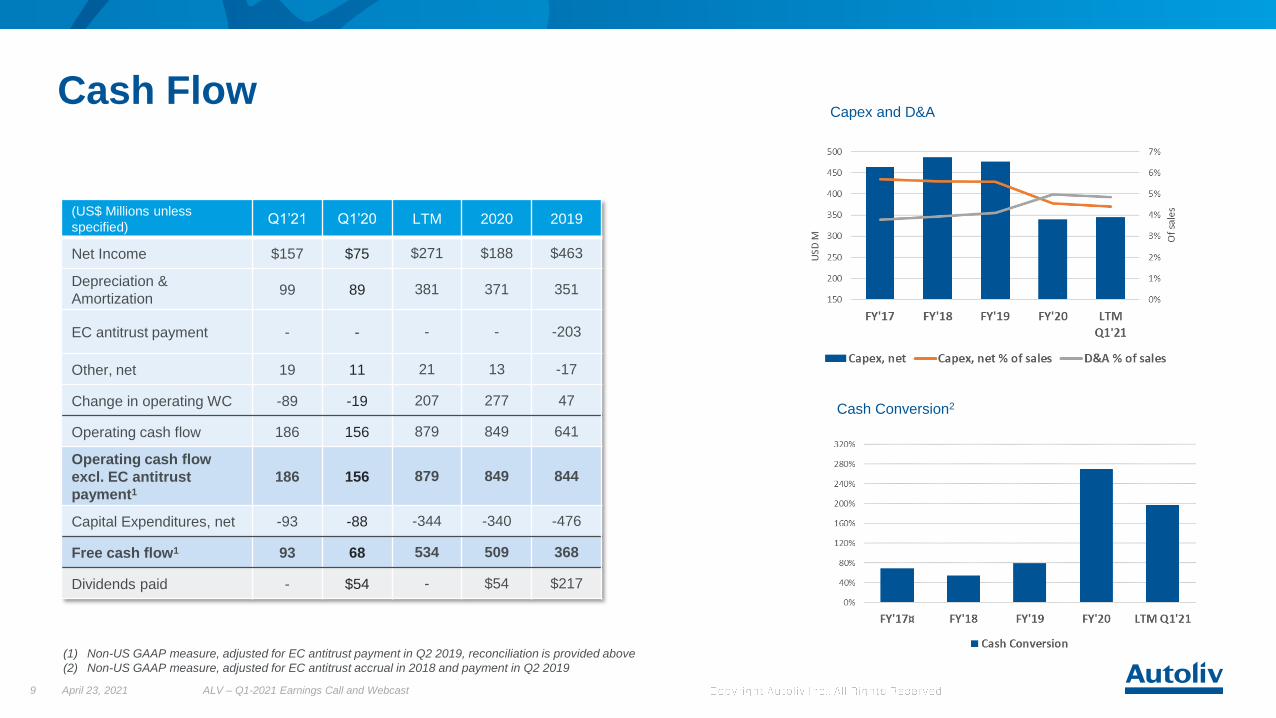
Cash Flow
(1) Non-US GAAP measure, adjusted for EC antitrust payment in Q2 2019, reconciliation is provided above
(2) Non-US GAAP measure, adjusted for EC antitrust accrual in 2018 and payment in Q2 2019
Capex and D&A
April 23, 2021
(US$ Millions unless
specified)Q1’21 Q1’20 LTM 2020 2019
Net Income $157 $75 $271 $188 $463
Depreciation &
Amortization99 89 381 371 351
EC antitrust payment - - - - -203
Other, net 19 11 21 13 -17
Change in operating WC -89 -19 207 277 47
Operating cash flow 186 156 879 849 641
Operating cash flow
excl. EC antitrust
payment1
186 156 879 849 844
Capital Expenditures, net -93 -88 -344 -340 -476
Free cash flow1 93 68 534 509 368
Dividends paid - $54 - $54 $217
Cash Conversion2
0.0
0.5
1.0
1.5
2.0
2.5
3.0
Q1'18 Q1'19 Q1´20 Q1´21
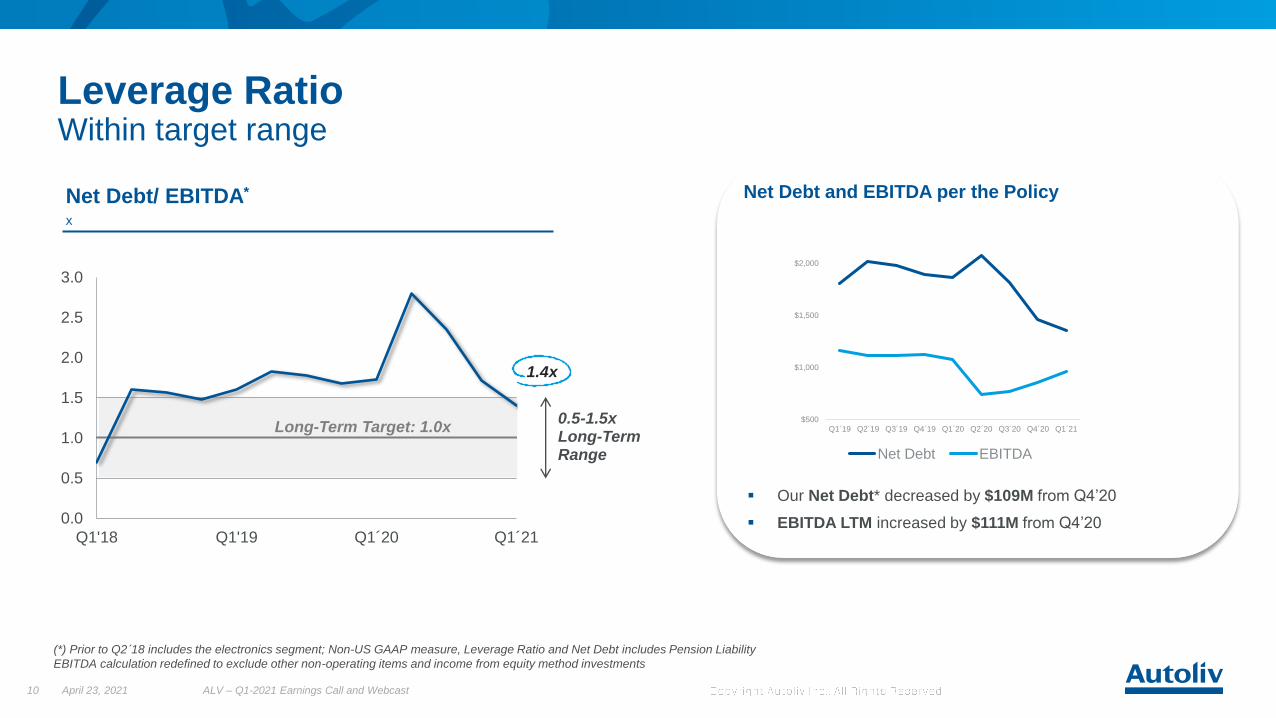
(*) Prior to Q2´18 includes the electronics segment; Non-US GAAP measure, Leverage Ratio and Net Debt includes Pension Liability
EBITDA calculation redefined to exclude other non-operating items and income from equity method investments
▪ Our Net Debt* decreased by $109M from Q4’20
▪ EBITDA LTM increased by $111M from Q4’20
Leverage Ratio
ALV – Q1-2021 Earnings Call and Webcast10
Within target range
Net Debt/ EBITDA*
x
Long-Term Target: 1.0x0.5-1.5xLong-Term Range
1.4x
April 23, 2021
$500
$1,000
$1,500
$2,000
Q1´19 Q2´19 Q3´19 Q4´19 Q1´20 Q2´20 Q3´20 Q4´20 Q1´21
Net Debt EBITDA
Net Debt and EBITDA per the Policy
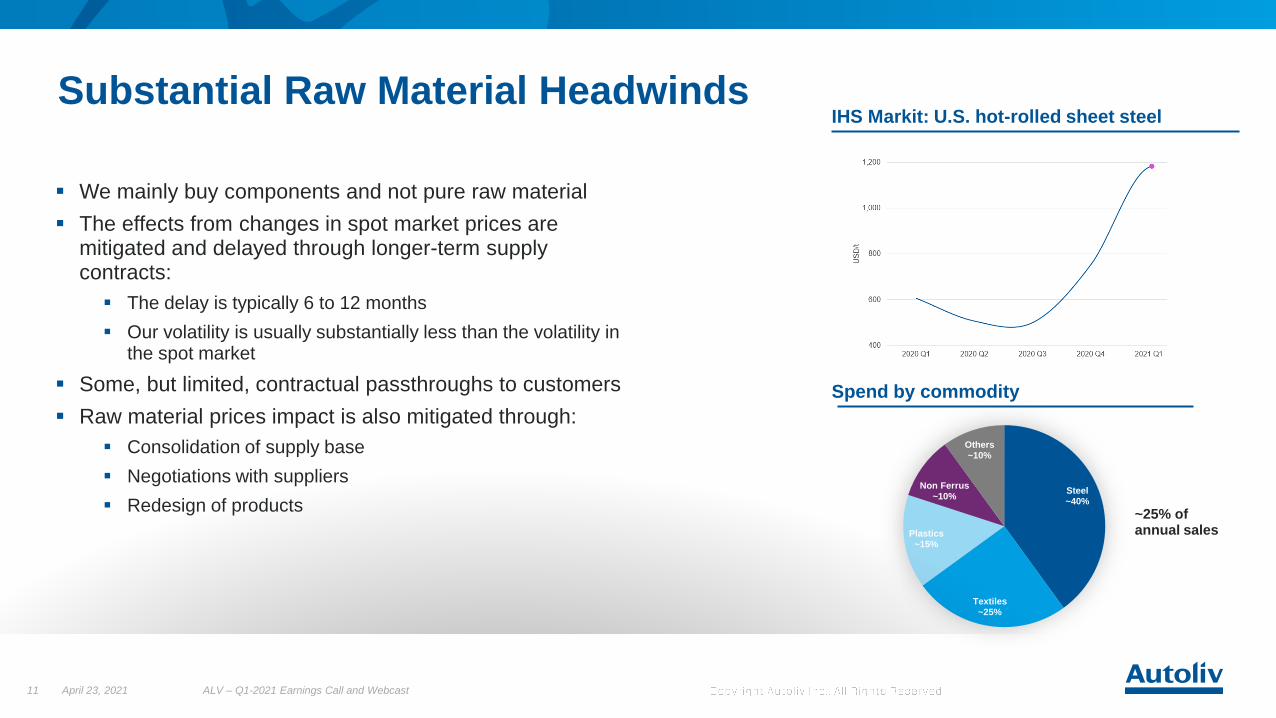
Substantial Raw Material Headwinds
ALV – Q1-2021 Earnings Call and Webcast11 April 23, 2021
IHS Markit: U.S. hot-rolled sheet steel
▪ We mainly buy components and not pure raw material
▪ The effects from changes in spot market prices are mitigated and delayed through longer-term supply contracts:
▪ The delay is typically 6 to 12 months
▪ Our volatility is usually substantially less than the volatility in the spot market
▪ Some, but limited, contractual passthroughs to customers
▪ Raw material prices impact is also mitigated through:
▪ Consolidation of supply base
▪ Negotiations with suppliers
▪ Redesign of productsSteel~40%
Textiles~25%
Plastics~15%
Non Ferrus~10%
Others~10%
~25% ofannual sales
Spend by commodity
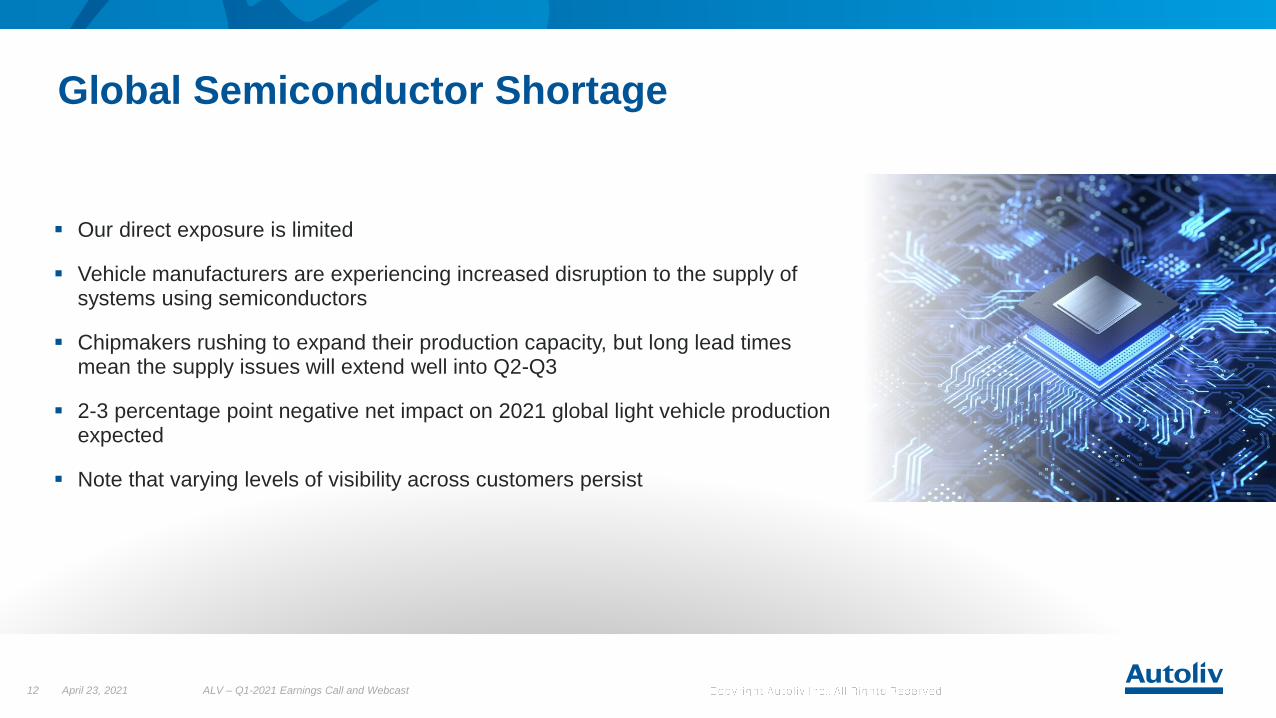
Global Semiconductor Shortage
ALV – Q1-2021 Earnings Call and Webcast12
▪ Our direct exposure is limited
▪ Vehicle manufacturers are experiencing increased disruption to the supply of systems using semiconductors
▪ Chipmakers rushing to expand their production capacity, but long lead times mean the supply issues will extend well into Q2-Q3
▪ 2-3 percentage point negative net impact on 2021 global light vehicle production expected
▪ Note that varying levels of visibility across customers persist
April 23, 2021
Uncertainty prevails
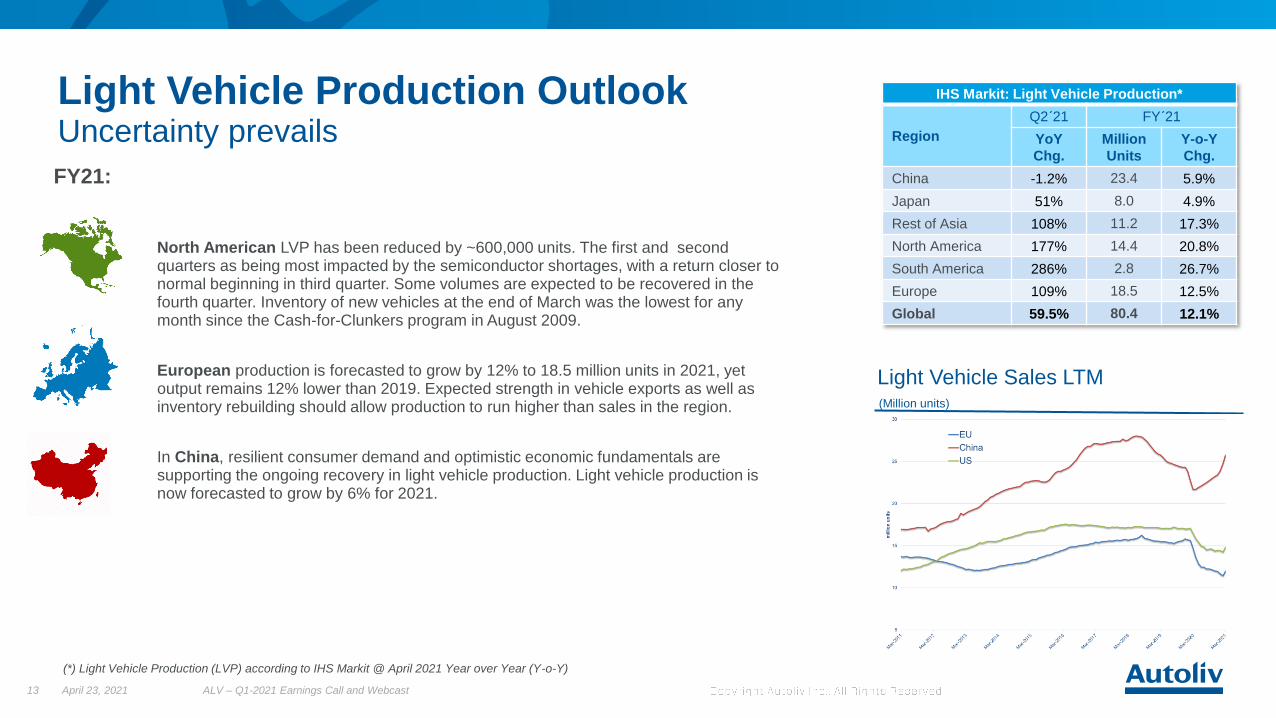
Light Vehicle Production Outlook
ALV – Q1-2021 Earnings Call and Webcast13
FY21:
North American LVP has been reduced by ~600,000 units. The first and second quarters as being most impacted by the semiconductor shortages, with a return closer to normal beginning in third quarter. Some volumes are expected to be recovered in the fourth quarter. Inventory of new vehicles at the end of March was the lowest for any month since the Cash-for-Clunkers program in August 2009.
European production is forecasted to grow by 12% to 18.5 million units in 2021, yet output remains 12% lower than 2019. Expected strength in vehicle exports as well as inventory rebuilding should allow production to run higher than sales in the region.
In China, resilient consumer demand and optimistic economic fundamentals are supporting the ongoing recovery in light vehicle production. Light vehicle production is now forecasted to grow by 6% for 2021.
(*) Light Vehicle Production (LVP) according to IHS Markit @ April 2021 Year over Year (Y-o-Y)
IHS Markit: Light Vehicle Production*
Region
Q2´21 FY´21
YoY
Chg.
Million
Units
Y-o-Y
Chg.
China -1.2% 23.4 5.9%
Japan 51% 8.0 4.9%
Rest of Asia 108% 11.2 17.3%
North America 177% 14.4 20.8%
South America 286% 2.8 26.7%
Europe 109% 18.5 12.5%
Global 59.5% 80.4 12.1%
April 23, 2021
Light Vehicle Sales LTM(Million units)
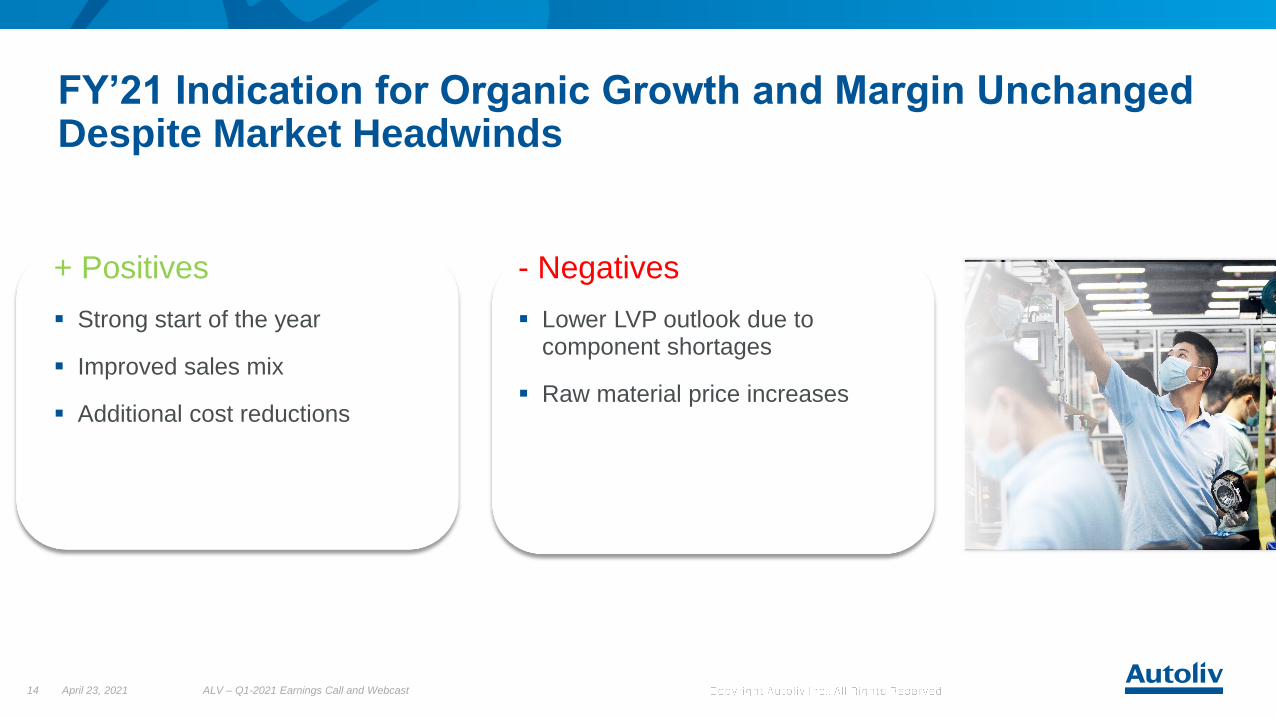
FY’21 Indication for Organic Growth and Margin Unchanged Despite Market Headwinds
14 ALV – Q1-2021 Earnings Call and WebcastApril 23, 2021
+ Positives
▪ Strong start of the year
▪ Improved sales mix
▪ Additional cost reductions
- Negatives
▪ Lower LVP outlook due to component shortages
▪ Raw material price increases

Full year 2021 indications
ALV – Q1-2021 Earnings Call and Webcast15
(1) Non-US GAAP measures. Adjusted Operating margin excludes costs for capacity alignments and antitrust related matters, (2) Excluding unusual items, (3) Mid-April 2021 exchange rates
Full year indication
Sales, net Around 23%
Organic sales increase1
Org. sales outperformance vs. LVP
Around 20%
Mid-single digits
FX Around 3%
Adjusted Operating margin1 Around 10%
Tax rate2 Around 30%
Operating Cash flow2 Similar level as 2020
Capex, net % of sales Below 6%
R,D&E, net % of sales Around 4.5%
Exchange rates3 FY’21
EUR / US$ 1.20
US$ / JPY 108.16
US$ / KRW 1115
US$ / MXN 20.12
US$ / CNY 6.52
April 23, 2021
Our full year guidance is based on our customer call-offs and light vehicle production outlook according to IHS Markit


Strong airbag sales
April 23, 2021 ALV – Q1-2021 Earnings Call and Webcast17
Autoliv Quantities Delivered(Millions unless specified)
Q1´21 vs. PY** (%)
Seatbelts 34.9 11%
▪ Pretensioners (of which) 20.8 16%
▪ Active Seatbelts (of which) 1.6 21%
Frontal Airbags 14.4 19%
▪ Knee Airbags (of which) 1.7 31%
Side Airbags 25.3 19%
▪ Chest (Thorax) 13.8 18%
▪ Head (Curtain) 11.3 18%
Steering Wheels 5.1 19%
LVP* (Global) 19.6 13.6%
Q1´21 Product Volumes
(*) Light Vehicle Production (LVP) according to IHS @ April, 2021, (**) Prior Year (PY).
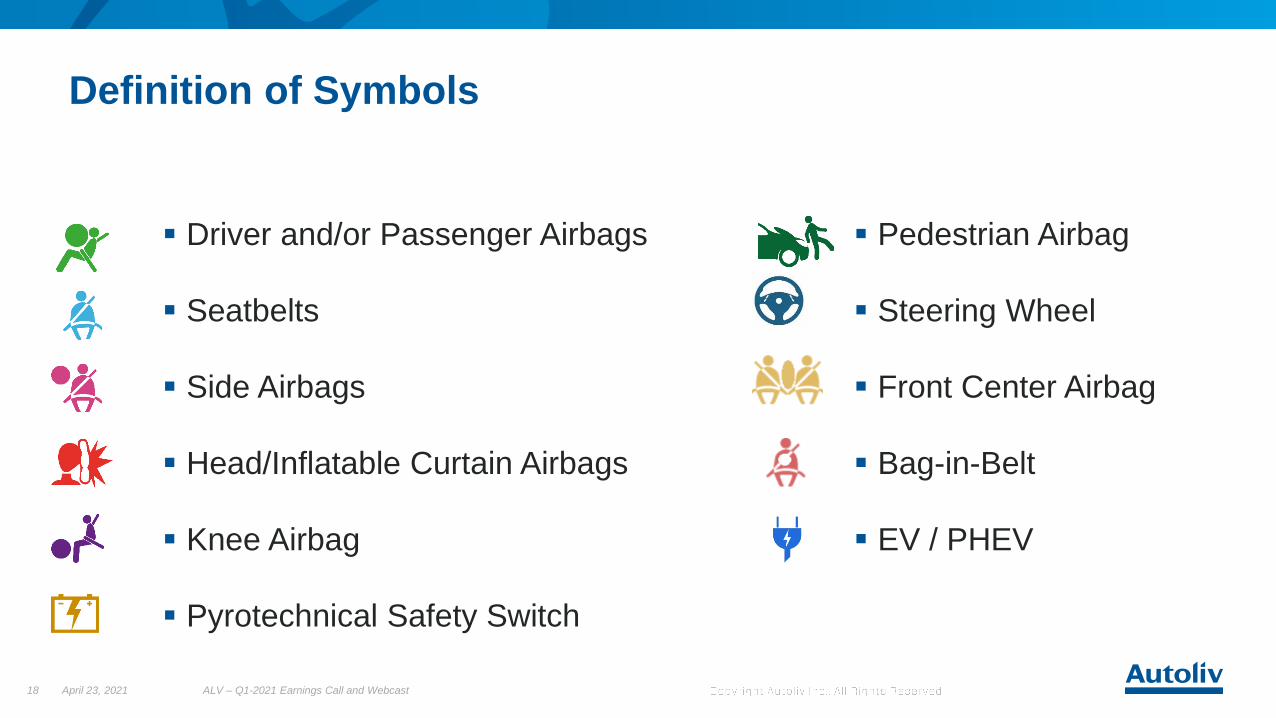
Definition of Symbols
▪ Driver and/or Passenger Airbags
▪ Seatbelts
▪ Side Airbags
▪ Head/Inflatable Curtain Airbags
▪ Knee Airbag
▪ Pyrotechnical Safety Switch
ALV – Q1-2021 Earnings Call and Webcast18
▪ Pedestrian Airbag
▪ Steering Wheel
▪ Front Center Airbag
▪ Bag-in-Belt
▪ EV / PHEV
April 23, 2021