autogenous diabetic retinopathy censor for ophthalmologists - akshi
TRANSCRIPT

Autogenous Diabetic Retinopathy Censor for Ophthalmologists - AKSHI
Asiri Wijesinghe University of Colombo School of Computing – Sri Lanka

Internal Supervisors
Prof. N. D.Kodikara - Senior Lecturer, University of Colombo School of Computing
Dr. K. D. Sandaruwan – University of Colombo School of Computing
External Supervisor (Medical)
Dr. Kapila Banduthilaka (MD, FRCOphth) - Consultant Vitreo Retinal Surgeon – National Eye Hospital (Sri-Lanka)
External Advisor (Medical)
Mr. Dasantha Fonseka – CEO at Vision Care (Pvt) Ltd (Sri-Lanka)

Outline
Introduction
Objectives
Design & Implementation
Evaluation
Uniqueness/ Innovativeness
Tools and Technologies
Future Works
Recognition
Q & A

Introduction

Human Vision System

Diabetic Retinopathy
Non proliferative DR (NPDR) Proliferative DR (PDR)

Diagnosing Diabetic Retinopathy (Manual Process)

Why Consultants Need an Automated System?
Evaluation is manually performed by expensive equipment such as HRT or expert ophthalmologists.
Ophthalmologists have to investigate the large portion of retina at once (complex and time consuming process).
In many cases ophthalmologists can't identify majority of anomalies at the initial observation.
Lack of expert consultants/ ophthalmologists to detect such diseases in rural areas.
Patient must have to wait in a long queue (time consuming).

Objectives
Develop a full fledged autogenous censor for classifying severity level of Diabetic Retinopathy (based on retinal lesions) and detecting retinal vascular network to assessment of vessel tortuousness to identify abnormal vessels in human retina.

Design & Implementation
(Methodology, Features and Functionalities)
NPDR Approach PDR Approach

Classification of Severity Level of Diabetic Retinopathy
(NPDR Approach)


Preprocessing

Blood Vessels Localizing & Eliminating
Blood vessels are also detected when analyzing dark lesions.
As a result dark lesions (microaneurisms) can’t be identified directly.

Optic Disc Localizing & Eliminating
Exudate regions are quite similar to the contrast levels of OD.
As a result brightest lesions (exudates) can’t be identified directly.

GLCM Statistical Feature Extraction Approach
Spatial relationship of pixels can be extracted from GLCM approach.
Regional texture feature extraction approach.
This matrix consists of frequencies of gray levels occurring between pixel pairs.
Represent the given image in 8 levels of gray scales.

Classification Using ANN
Our goal is to generate a model that predicts the class label of test dataset.
Statistical features are fed as input to the ANN (MLP).

Design & Implementation
(Methodology, Features and Functionalities)
NPDR Approach PDR Approach

Measurement of Vessel Tortuosity to Detect Abnormal
Vessels (PDR Approach)

System Architecture for Abnormal Vessel Detection

Preprocessing

Vascular Network Detection
Reconstruct the weak vessels (fill the missing pixels and noise reduction).
As a result we can obtain conspicuously segmented vasculature network.

Detection of Untwisted Vessels
Detect untwisted vessels from the retinal vascular network to assessment lengthy vessels before arising tortuous regions.
Tortuosity or twistedness of vessels is one of the initial stages of DR.
Length of the vessels is abnormally growth due to high blood pressure.

Vessel Tortuosity Measurement
Ref: H.C. Han, “Twisted blood vessels: symptoms, etiology and biomechanical mechanisms.,” Journal of vascular research, vol. 49, no. 3, pp. 185–97, Jan. 2012.

Evaluation (Methodology, Features and Functionalities)
NPDR Approach PDR Approach

Reference Dataset
The labeled dataset is retrieved from domain experts (human judges) at National Eye Hospital and Vision Care (Pvt) Ltd.
Dataset contains current state of DR and related symptoms.
140 images are used for NPDR approach to train the ANN. 108 for DR related patients
32 for healthy patients
rest of the dataset for testing purposes (only 100 images are considered)
In PDR approach 40 retinal images are utilized for testing purposes.

Neural Network Approach for DR Classification
Measure the performance of MLP classifier for DR detection.
Cross validation technique is utilized.
140 data items are utilized to form the NN. 70% (98 samples) of them were utilized to train the network
15% (21 samples) for validation
The rest of 15% (21 samples) are utilized for testing
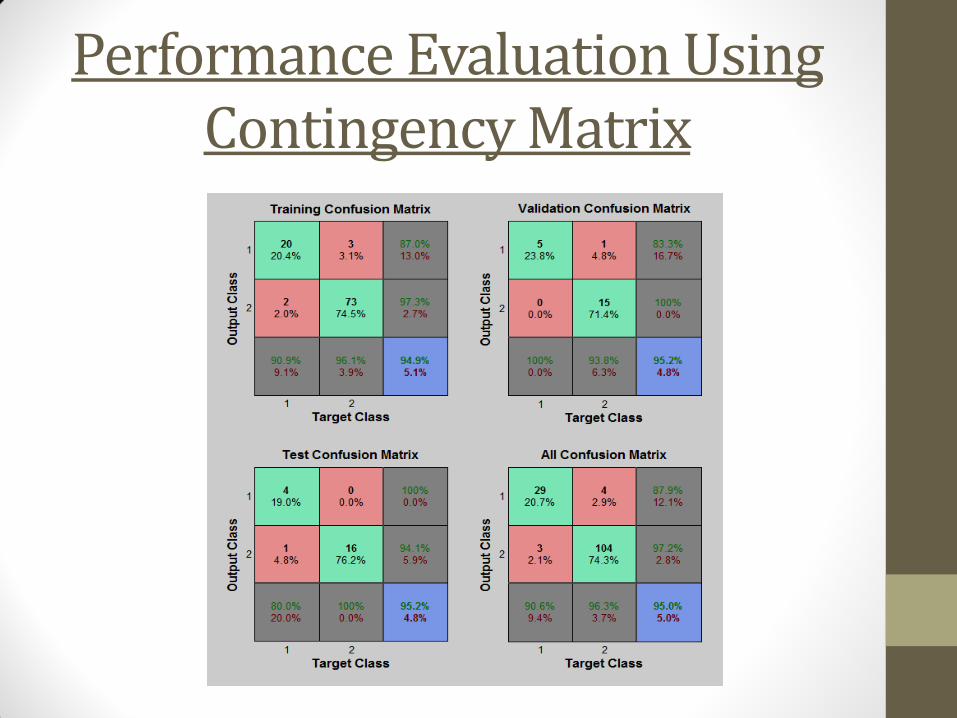
Performance Evaluation Using Contingency Matrix

Performance Evaluation Using Contingency Matrix
Measurement Training Validation Testing All
Precision 0.9733 1 0.9411 0.9719
Recall 0.9605 0.9375 1 0.9629
F-measure 0.9668 0.9677 0.9696 0.9673
Accuracy 0.9489 0.9523 0.9523 0.95

Performance Evaluation Using ROC Curves

AUC Analysis
The dataset which we assigned to each class is imbalanced.
AUC is more robust measurement than accuracy when classes in imbalance situation.
In this evaluation all ROC curves fitted in the upper left corner.
Class Training Validation Testing All
Class1 (Non DR) 0.9667 0.9685 0.9672 0.9658
Class2 (DR) 0.9662 0.9670 0.9551 0.9651

Analysis of Error Histogram of ANN

Evaluating Generalization Capability of ANN

User Level Evaluation for Severity of DR
The results of the system were re-evaluated with the dataset which obtained from the Vision Care (Pvt) Ltd.
Benchmarked 42 images with respect to the symptoms and diagnostic stage of patients.
The vertical fragments suggest to the out comes of actual human expert results (true class).
Horizontal fragments suggest to outcomes of our system (predicted class).
85% average accuracy can be obtained in this model.

User Level Evaluation for Severity of DR
DAG MOD NORM
DAG 13 1 0
MOD 2 11 1
NORM 0 2 12
True Class
Predicted Class
Evaluation Measurements
DAG MOD NORM
Precision 0.92 0.88 0.85
Recall 0.86 0.88 0.92
F-measure 0.88 0.88 0.88

Evaluation (Methodology, Features and Functionalities)
NPDR Approach PDR Approach

User Level Evaluation of Vessel Tortuosity Measurement
Correct Vessels Incorrect Vessels
Correct Vessels TP FP
Incorrect Vessels FN TN
True Class
Predicted Class

User Level Evaluation of Vessel Tortuosity Measurement
Sensitivity Specificity Accuracy
Average 0.85 0.89 0.87

Uniqueness/ Innovativeness

Feature D. J. Cornforth
et al. (2014)
A. K. Ikhar et al.
(2013)
A. Salazar et al.
(2013)
N. Patton et al.
(2014)
M. García et
al. (2012)
Our Method
Vascular network detection
Yes Yes Yes Yes No Yes
Optic Disc detection No No Yes No No Yes
Reconstruct the weak vessels (algorithm)
No No No No No Yes
Untwisted vessels detection (algorithm)
No No No No No Yes
Measuring Vessel tortuosity (algorithm)
No No No No No Yes
Microaneurysms detection
Yes Yes No No No Yes
Hard & soft exudates detection
Yes No No No Yes Yes
Uniqueness/ Innovativeness

Feature D. J. Cornforth
et al. (2014)
A. K. Ikhar et al.
(2013)
A. Salazar et al.
(2013)
N. Patton et al.
(2014)
M. García et
al. (2012)
Our Method
Vascular network elimination/ OD removing process
No/ No No/ No No/ No No/ No No/ No Yes/ Yes
Modify threshold value to detect abnormal regions
No No No No No Yes
Inform medical notification to patients
No No No No No Yes
ANN (MLP model) with GLCM statistical texture features
No No No No No Yes
Classification of severity & predict the treatment
No No No No No Yes
Uniqueness/ Innovativeness

Security
• Only authorized persons can be accessed the internal functionalities of s/w.
• Medical information cannot be accessed to external party.
• All segmented images are encrypted and stored in database.
• Sending the mail in secure connection.

Tools and Technologies
• Matlab 2013b
• Visual C++
• JAVA
• MySQL
• NVIDIA toolkit (GPGPU programming)
• Weka tool
• Machine Learning
• Image Processing
• Cryptography
• Parallel Computing
• Statistics

Future Works
Future Works
This research can be further extended to detect the glaucoma level of patients.
This research will be extended to differentiate blood vessels such as healthy and diseased. Blood vessels get swallow and narrow in DR and glaucoma patients
respectively.
System will be further upgrading with GNU license to modify the software or use pieces of it in new free programs.

Recognition

Awards
• Won the Award of Best Industrial Oriented Research (MIT Best Research Paper Award) at UCSC RESEARCH SYMPOSIUM 2015.
Considered Factors for the Award:
• Commercial Value of Research
• Importance to the Community
• Most Innovative Research

Awards
• Won the Bronze Award of Tertiary Technology Category at 17th National Best Quality ICT Awards (NBQSA) 2015.

Awards
• Won the Merit Award of Tertiary Category at Asia Pacific Alliance ICT Awards (APICTA) 2015.

Awards
• Won the Best Research Paper Award at ICCRE2016 - Singapore (IEEE International Conference on Control and Robotics Engineering).

Business Value
Ophthalmologists can easily identify the abnormal vessels via utilizing the vessel tortuosity measurements without any complex process.
All medical records are encrypted; hence any external party can’t
access that information.
Determine the next step for the patients, because of early detection of DR help to advise proper treatment to save the vision of the patient.
System results can be cross-checked with manual process to get more accurate results.
This system automatically sends the email to patient to inform medical data via secure connection (save the time and cost).

Standards/ Quality in Product Development
We obtained the ethical clearance from the medical faculty.
Data-set were getting from the National Eye Hospital/ Vision Care/ Publicly available online DBs with its standards.
Performance of image processing concepts make efficient via using GPGPU programming with parallel processing.
Handled the security features, product maintainability, higher interoperability, reliability and accuracy of the software.
Software quality evaluation via system and acceptance testing (utilized standardized evaluation process).
Research paper has been accepted by the two reputed conferences.

Q & A
