author's personal copygeo.orst.edu/files/geo/ersek-2009-epsl.pdfauthor's personal copy...
TRANSCRIPT
Author's personal copy
Environmental influences on speleothem growth in southwestern Oregon during thelast 380000 years
Vasile Ersek a,⁎, Steven W. Hostetler b, Hai Cheng c, Peter U. Clark a, Faron S. Anslow a,1,Alan C. Mix d, R. Lawrence Edwards c
a Department of Geosciences, Oregon State University, Corvallis, OR 97331, USAb U.S. Geological Survey, Department of Geosciences, Oregon State University, Corvallis, OR 97331, USAc Department of Geology and Geophysics, University of Minnesota, Minneapolis, MN 55455, USAd College of Oceanic and Atmospheric Sciences, Oregon State University, Corvallis, OR 97331, USA
a b s t r a c ta r t i c l e i n f o
Article history:Received 18 October 2008Received in revised form 6 January 2009Accepted 6 January 2009Available online 12 February 2009
Editor: P. DeMenocal
Keywords:speleothemOregonU-th datingclimate modelingpaleoclimate
The growthof carbonate formations in caves (speleothems) is sensitive to changes in environmental conditions atthe surface (temperature, precipitation and vegetation) and can provide useful paleoclimatic and paleoenviron-mental information.Weuse73 230Thdates fromspeleothems collected froma cave in southwesternOregon(USA)to constrain speleothemgrowth for the past 380000 years.Most speleothemgrowth occurred during interglacialperiods, whereas little growth occurred during glacial intervals. To evaluate potential environmental controls onspeleothem growth we use two new modeling approaches: i) a one-dimensional thermal advection–diffusionmodel to estimate cave temperatures during the last glacial cycle, and ii) a regional climate model simulation forthe Last GlacialMaximum (21000 years before present) that assesses a range of potential controls on speleothemgrowth under peak glacial conditions. The two models are mutually consistent in indicating that permafrostformation did not influence speleothem growth during glacial periods. Instead, the regional climate modelsimulation combined with proxy data suggest that the influence of the Laurentide and Cordilleran ice sheets onatmospheric circulation induced substantial changes in water balance in the Pacific Northwest and affectedspeleothem growth at our location. The overall drier conditions during glacial intervals and associated periods offrozen topsoil at times of maximum surface runoff likely induced drastic changes in cave recharge and limitedspeleothemgrowth. Thismechanism couldhave affected speleothemgrowth in othermid-latitude caveswithoutrequiring the presence of permafrost.
© 2009 Elsevier B.V. All rights reserved.
1. Introduction
Speleothems are important archives of terrestrial paleoclimatebecause they can preserve high temporal resolution environmentalrecords derived from chemical and isotopic proxies, and can beprecisely dated using uranium-series disequilibrium (Richards andDorale, 2003; McDermott, 2004). Changes in speleothem growth canalso provide an important constraint on paleoenvironmental condi-tions because their formation requires water availability and elevatedCO2 levels in the soil zone above the cave, which in turn are dependenton local water balance, biomass, and temperature (Dreybrodt, 1980;Dorr and Munnich, 1989; Dreybrodt, 1999; Fairchild et al., 2006).Accordingly, the growth of many speleothems at nonglaciated mid-
and high-latitudes slowed or ceased altogether at various times duringthe Quaternary because of some combination of increase in the arealextent of permafrost or glaciers, a decrease in partial pressure of soil(pCO2), or changes in water availability (Thompson et al., 1974;Harmon et al., 1977; Gordon et al., 1989; Lauritzen et al., 1990; Baker etal., 1995; Spötl et al., 2002; Genty et al., 2003; Brook et al., 2006).Distinguishing among these potential controls from information ongrowth changes alone, however, is generally unconstrained, requiringadditional proxy information or modeling.
Turgeon and Lundberg (2001, 2004) studied two flowstones andone 5-cm long stalagmite from Oregon Caves National Monument(OCNM). A chronology established by 14 thermal ionization massspectrometry (TIMS) 230Th ages indicated that growth of these threesamples occurred primarily during early to mid-interglacial periods,with one interval of deposition during marine isotope stage (MIS) 10.They proposed that growth ceased during glacial intervals becausethe glaciation limit was lower, favoring permafrost conditions atthe cave site. Vacco et al. (2005) studied the δ18O record from a26.5 cm long stalagmite from OCNM and identified a cold interval
Earth and Planetary Science Letters 279 (2009) 316–325
⁎ Corresponding author. Tel.: +1 541 737 2627; fax: +1 541 737 1200.E-mail address: [email protected] (V. Ersek).
1 Present address: Department of Earth and Ocean Sciences, University of BritishColumbia, Vancouver, Canada BC V6T 1Z4.
0012-821X/$ – see front matter © 2009 Elsevier B.V. All rights reserved.doi:10.1016/j.epsl.2009.01.008
Contents lists available at ScienceDirect
Earth and Planetary Science Letters
j ourna l homepage: www.e lsev ie r.com/ locate /eps l
Author's personal copy
that is synchronous with the Younger Dryas (12.5–11.7 ka) periodrecognized elsewhere in the Northern Hemisphere.
The climate of the Pacific Northwest (PNW) is strongly influencedby atmosphere-ocean interactions that originate in the Pacific Ocean(Taylor and Hannan, 1999), implying that understanding of paleocli-mate mechanisms at our study site has broad significance tounderstanding past variations of Pacific storm tracks where theyenter North America. We present 46 new 230Th ages from five OCNMstalagmites to further constrain the growth history of speleothems atthis location. These ages support previous work (Turgeon andLundberg, 2001, 2004) in indicating that times of speleothem growthlargely correspond to warm (interglacial) conditions. We also find,however, that several growth episodes occurred during cold (glacial)intervals and we investigate possible factors affecting speleothemgrowth during glacial conditions.
Many studies of speleothemgrowth have relied on regional or globalclimate records to infer possible environmental controls on speleothemformation (Thompson et al., 1974; Harmon et al., 1977; Gordon et al.,1989; Baker et al., 1995; Spötl et al., 2002; Genty et al., 2003), but thisapproach can be complicated by uncertainties in the chronologies ofthe paleoproxies used (e.g. Baker et al., 1993), particularly for periodsbeyond the limit of radiocarbon dating. In this study, we developtwo new approaches to evaluate controls on speleothem growth bycombining paleoproxy data with a regional climate model to simulatethe climate of the PNW at the peak of the last global glaciation,21000 years ago (21 ka), andwith a thermal advection–diffusionmodelto calculate the sub-surface temperature evolution at the OCNM sitethrough the last glacial cycle.
2. Regional setting
OCNM is situated in the Klamath Mountains of SW Oregon (42°05′N, 123°25′W), approximately 75 km east of the Pacific coast (Fig. 1).The Klamath Mountains were formed by tectonic accretion along anactive continental margin and are divided into four arcuate lithic beltsbounded by east-dipping thrust faults (Snoke and Barnes, 2006). TheOCNM system is developed in a small Triassic marble lens and hasseveral subhorizontal levels developed along fractures and faults atan elevation of 1150 to 1270 meters. The mean annual air surfacetemperature (MAT) at OCNM for the period 1981-2006 was 8.8 °C±0.7 °C (OCNM internal document). The active cave level is ∼60 mbelow the surface and the cave temperature is approximately constantover the whole year at ∼7 °C. The modern vegetation in the area is
dominated by Pseudotsuga menziesii (Douglas-fir) and Abies concolor(white fir).
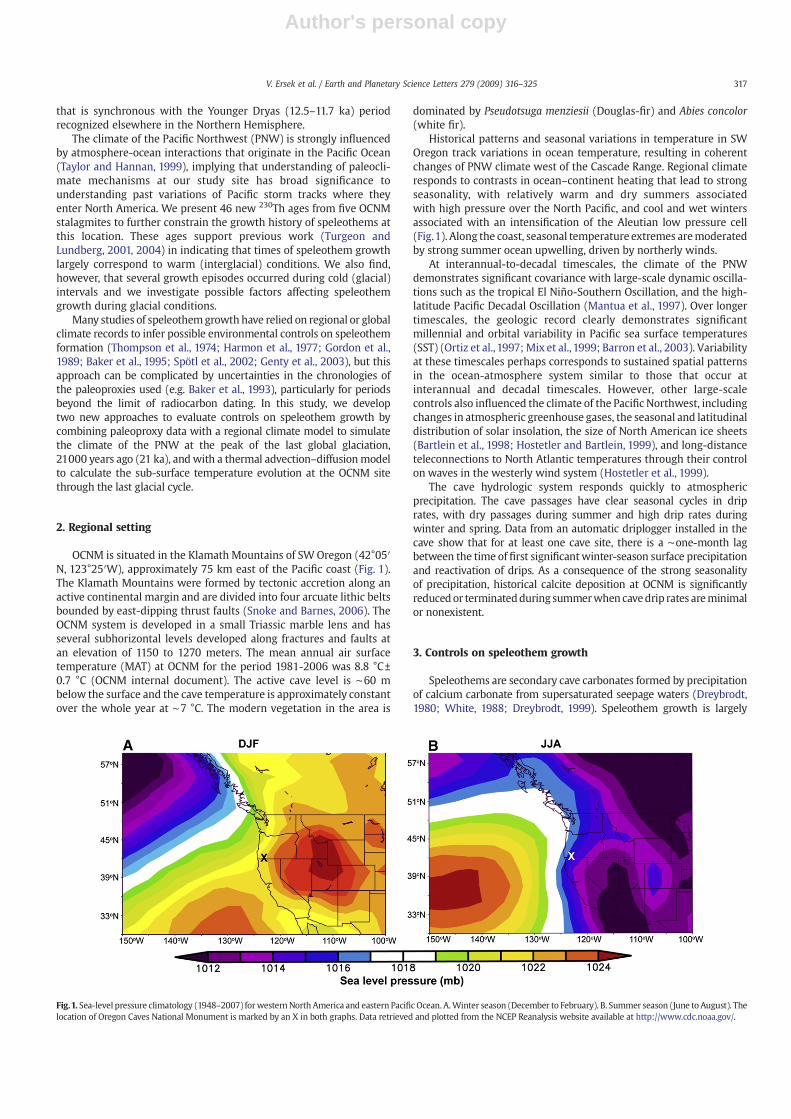
Historical patterns and seasonal variations in temperature in SWOregon track variations in ocean temperature, resulting in coherentchanges of PNW climate west of the Cascade Range. Regional climateresponds to contrasts in ocean–continent heating that lead to strongseasonality, with relatively warm and dry summers associatedwith high pressure over the North Pacific, and cool and wet wintersassociated with an intensification of the Aleutian low pressure cell(Fig.1). Along the coast, seasonal temperature extremes aremoderatedby strong summer ocean upwelling, driven by northerly winds.
At interannual-to-decadal timescales, the climate of the PNWdemonstrates significant covariance with large-scale dynamic oscilla-tions such as the tropical El Niño-Southern Oscillation, and the high-latitude Pacific Decadal Oscillation (Mantua et al., 1997). Over longertimescales, the geologic record clearly demonstrates significantmillennial and orbital variability in Pacific sea surface temperatures(SST) (Ortiz et al., 1997; Mix et al., 1999; Barron et al., 2003). Variabilityat these timescales perhaps corresponds to sustained spatial patternsin the ocean-atmosphere system similar to those that occur atinterannual and decadal timescales. However, other large-scalecontrols also influenced the climate of the Pacific Northwest, includingchanges in atmospheric greenhouse gases, the seasonal and latitudinaldistribution of solar insolation, the size of North American ice sheets(Bartlein et al., 1998; Hostetler and Bartlein, 1999), and long-distanceteleconnections to North Atlantic temperatures through their controlon waves in the westerly wind system (Hostetler et al., 1999).
The cave hydrologic system responds quickly to atmosphericprecipitation. The cave passages have clear seasonal cycles in driprates, with dry passages during summer and high drip rates duringwinter and spring. Data from an automatic driplogger installed in thecave show that for at least one cave site, there is a ∼one-month lagbetween the time of first significantwinter-season surface precipitationand reactivation of drips. As a consequence of the strong seasonalityof precipitation, historical calcite deposition at OCNM is significantlyreducedor terminatedduring summerwhen cavedrip rates areminimalor nonexistent.
3. Controls on speleothem growth
Speleothems are secondary cave carbonates formed by precipitationof calcium carbonate from supersaturated seepage waters (Dreybrodt,1980; White, 1988; Dreybrodt, 1999). Speleothem growth is largely
Fig.1. Sea-level pressure climatology (1948–2007) forwesternNorth America and eastern Pacific Ocean. A.Winter season (December to February). B. Summer season (June to August). Thelocation of Oregon Caves National Monument is marked by an X in both graphs. Data retrieved and plotted from the NCEP Reanalysis website available at http://www.cdc.noaa.gov/.
317V. Ersek et al. / Earth and Planetary Science Letters 279 (2009) 316–325
Author's personal copy
determined by the climate régime above the cave because the chemicalkinetics of the carbonate system are a function of water availability,soil pCO2 and temperature (Kaufmann, 2003). On orbital timescalesat mid- and high-latitudes temperature is commonly the principalcontrolling factor of speleothem growth because it determines thephysical state of water (liquid vs. ice) and controls biologic productivity(thus influencing soil pCO2 and carbonate dissolution rate). Plantrespiration and decay of organic matter in organic-rich soils supplyCO2 to percolating waters, leading to elevated pCO2 in the infiltratingsolutions. When this slightly acidic water comes in contact withthe carbonate bedrock, dissolution occurs until the water approachessaturationwith respect to CO2, and its dissociation products HCO3
− andCO3
− (White, 1988).The driving force of speleothem precipitation is the difference
between pCO2 in the cave atmosphere and pCO2 in the soil micro-environment and in percolating waters. Because cave pCO2 is usuallylower than that of the infiltrating water, dripwaters are generally out ofequilibriumwith respect to cave pCO2, and the dissolved CO2 is releasedto the cave atmosphere. Through this process, the dripwater becomessupersaturated with respect to calcium carbonate and carbonateminerals (typically calcite) precipitate to form stalactites, stalagmites,and flowstones, commonly known as speleothems (Moore, 1952). Thus,speleothemgrowthdepends on a steady supplyofwater that is enrichedin CO2, HCO3
− and CO3−. In certain cases, calcite supra-saturation can
also occur due to evaporation or due to common ion effects (Atkinson,1983; Harmon et al., 1983).
4. Materials and methods
4.1. Chronology
Changes in the growth rate of any individual stalagmitemay reflectsome combination of variability in localized factors along the waterpath as well as climate (Baker et al., 1996). Accordingly, we collectedfive stalagmites from different locations in OCNM, as well as include
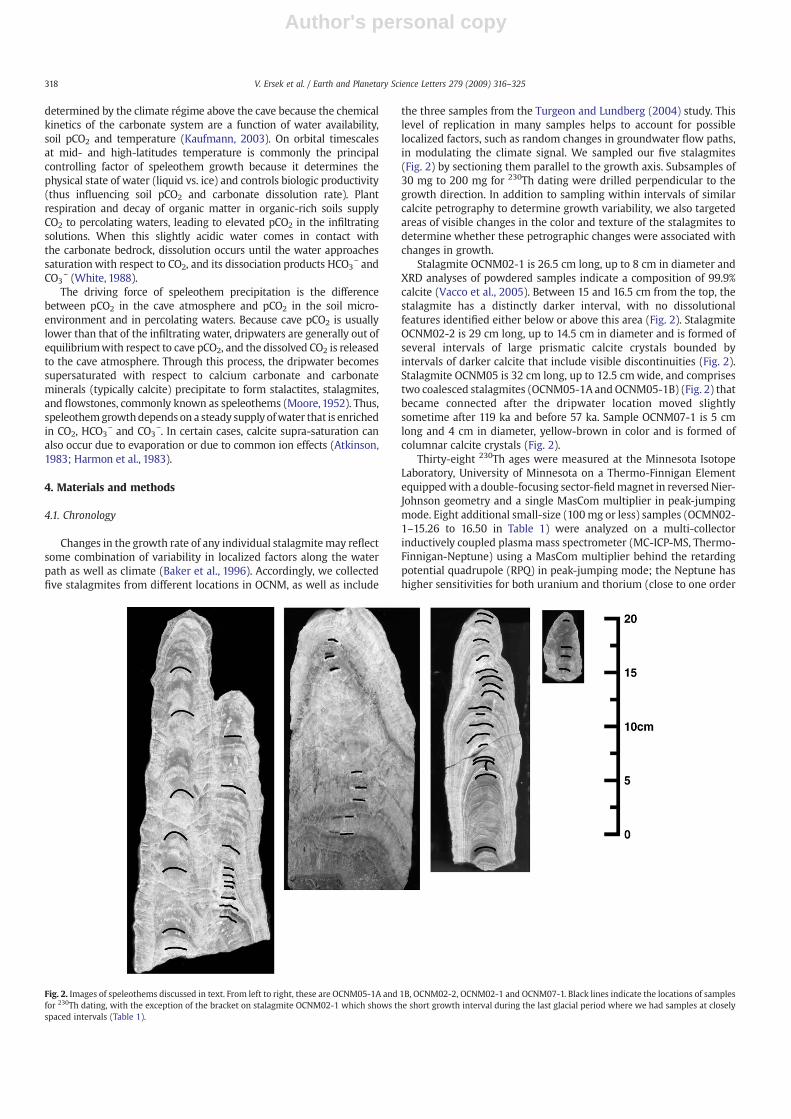
the three samples from the Turgeon and Lundberg (2004) study. Thislevel of replication in many samples helps to account for possiblelocalized factors, such as random changes in groundwater flow paths,in modulating the climate signal. We sampled our five stalagmites(Fig. 2) by sectioning them parallel to the growth axis. Subsamples of30 mg to 200 mg for 230Th dating were drilled perpendicular to thegrowth direction. In addition to sampling within intervals of similarcalcite petrography to determine growth variability, we also targetedareas of visible changes in the color and texture of the stalagmites todetermine whether these petrographic changes were associated withchanges in growth.
Stalagmite OCNM02-1 is 26.5 cm long, up to 8 cm in diameter andXRD analyses of powdered samples indicate a composition of 99.9%calcite (Vacco et al., 2005). Between 15 and 16.5 cm from the top, thestalagmite has a distinctly darker interval, with no dissolutionalfeatures identified either below or above this area (Fig. 2). StalagmiteOCNM02-2 is 29 cm long, up to 14.5 cm in diameter and is formed ofseveral intervals of large prismatic calcite crystals bounded byintervals of darker calcite that include visible discontinuities (Fig. 2).Stalagmite OCNM05 is 32 cm long, up to 12.5 cmwide, and comprisestwo coalesced stalagmites (OCNM05-1A and OCNM05-1B) (Fig. 2) thatbecame connected after the dripwater location moved slightlysometime after 119 ka and before 57 ka. Sample OCNM07-1 is 5 cmlong and 4 cm in diameter, yellow-brown in color and is formed ofcolumnar calcite crystals (Fig. 2).
Thirty-eight 230Th ages were measured at the Minnesota IsotopeLaboratory, University of Minnesota on a Thermo-Finnigan Elementequippedwith a double-focusing sector-fieldmagnet in reversed Nier-Johnson geometry and a single MasCom multiplier in peak-jumpingmode. Eight additional small-size (100mg or less) samples (OCMN02-1–15.26 to 16.50 in Table 1) were analyzed on a multi-collectorinductively coupled plasma mass spectrometer (MC-ICP-MS, Thermo-Finnigan-Neptune) using a MasCom multiplier behind the retardingpotential quadrupole (RPQ) in peak-jumping mode; the Neptune hashigher sensitivities for both uranium and thorium (close to one order
Fig. 2. Images of speleothems discussed in text. From left to right, these are OCNM05-1A and 1B, OCNM02-2, OCNM02-1 and OCNM07-1. Black lines indicate the locations of samplesfor 230Th dating, with the exception of the bracket on stalagmite OCNM02-1 which shows the short growth interval during the last glacial period where we had samples at closelyspaced intervals (Table 1).
318 V. Ersek et al. / Earth and Planetary Science Letters 279 (2009) 316–325
Author's personal copy
of magnitude higher than the Element), with 1 to 2% combinedionization and transmission efficiency for uranium and thorium. Thechemical procedures used to separate uranium and thorium for 230Thdating are similar to those described in Edwards et al. (1987). Theprocedures of characterizing multiplier and instrumental approacheswere analogous to those described in Cheng et al. (2000) and Shenet al. (2002). The Neptune measurements are similar to thosedescribed by Shen et al. (2002) for the Element, with the following
two differences: (a) the higher ionization/transmission efficiency, and(b) we do not peak jump through background positions because theretarding potential quadrupole removes any significant tailing.
4.2. Climate model simulations
We used a regional climate model to simulate the climate of theregion during the Last Glacial Maximum (LGM, 21 ka) and the present.
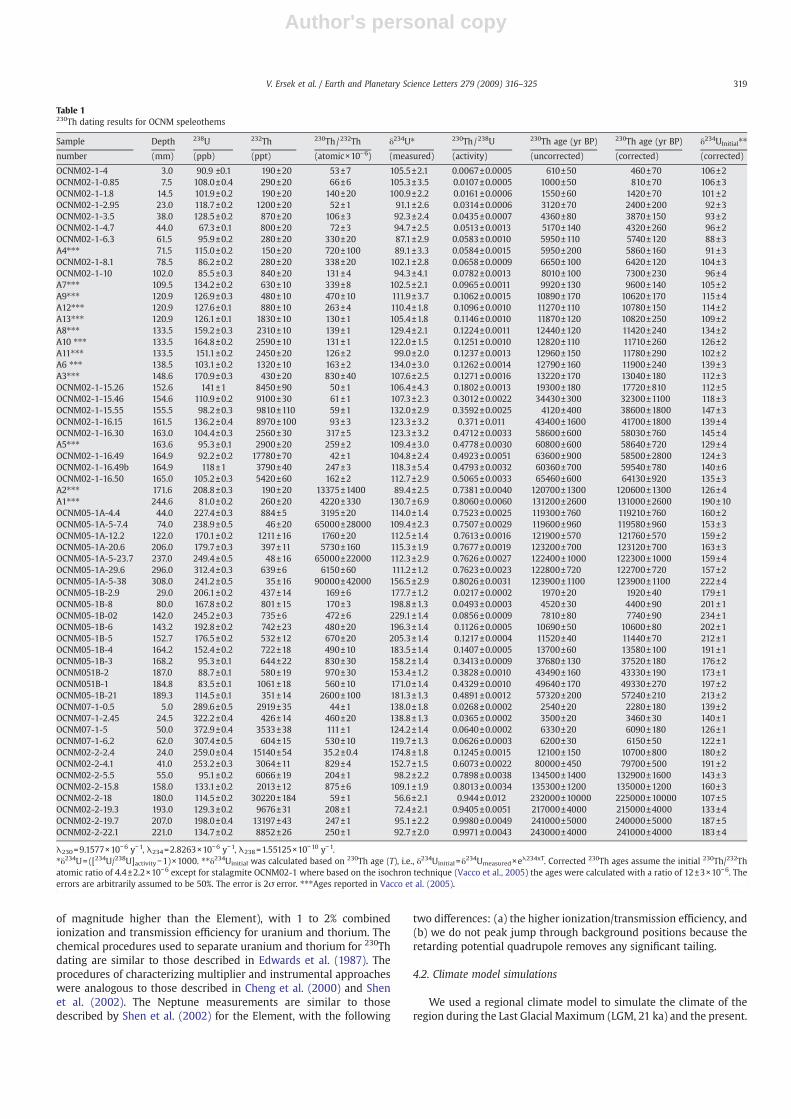
Table 1230Th dating results for OCNM speleothems
Sample Depth 238U 232Th 230Th/232Th δ234U⁎ 230Th/238U 230Th age (yr BP) 230Th age (yr BP) δ234UInitial⁎⁎
number (mm) (ppb) (ppt) (atomic×10−6) (measured) (activity) (uncorrected) (corrected) (corrected)
OCNM02-1-4 3.0 90.9 ±0.1 190±20 53±7 105.5±2.1 0.0067±0.0005 610±50 460±70 106±2OCNM02-1-0.85 7.5 108.0±0.4 290±20 66±6 105.3±3.5 0.0107±0.0005 1000±50 810±70 106±3OCNM02-1-1.8 14.5 101.9±0.2 190±20 140±20 100.9±2.2 0.0161±0.0006 1550±60 1420±70 101±2OCNM02-1-2.95 23.0 118.7±0.2 1200±20 52±1 91.1±2.6 0.0314±0.0006 3120±70 2400±200 92±3OCNM02-1-3.5 38.0 128.5±0.2 870±20 106±3 92.3±2.4 0.0435±0.0007 4360±80 3870±150 93±2OCNM02-1-4.7 44.0 67.3±0.1 800±20 72±3 94.7±2.5 0.0513±0.0013 5170±140 4320±260 96±2OCNM02-1-6.3 61.5 95.9±0.2 280±20 330±20 87.1±2.9 0.0583±0.0010 5950±110 5740±120 88±3A4⁎⁎⁎ 71.5 115.0±0.2 150±20 720±100 89.1±3.3 0.0584±0.0015 5950±200 5860±160 91±3OCNM02-1-8.1 78.5 86.2±0.2 280±20 338±20 102.1±2.8 0.0658±0.0009 6650±100 6420±120 104±3OCNM02-1-10 102.0 85.5±0.3 840±20 131±4 94.3±4.1 0.0782±0.0013 8010±100 7300±230 96±4A7⁎⁎⁎ 109.5 134.2±0.2 630±10 339±8 102.5±2.1 0.0965±0.0011 9920±130 9600±140 105±2A9⁎⁎⁎ 120.9 126.9±0.3 480±10 470±10 111.9±3.7 0.1062±0.0015 10890±170 10620±170 115±4A12⁎⁎⁎ 120.9 127.6±0.1 880±10 263±4 110.4±1.8 0.1096±0.0010 11270±110 10780±150 114±2A13⁎⁎⁎ 120.9 126.1±0.1 1830±10 130±1 105.4±1.8 0.1146±0.0010 11870±120 10820±250 109±2A8⁎⁎⁎ 133.5 159.2±0.3 2310±10 139±1 129.4±2.1 0.1224±0.0011 12440±120 11420±240 134±2A10 ⁎⁎⁎ 133.5 164.8±0.2 2590±10 131±1 122.0±1.5 0.1251±0.0010 12820±110 11710±260 126±2A11⁎⁎⁎ 133.5 151.1±0.2 2450±20 126±2 99.0±2.0 0.1237±0.0013 12960±150 11780±290 102±2A6 ⁎⁎⁎ 138.5 103.1±0.2 1320±10 163±2 134.0±3.0 0.1262±0.0014 12790±160 11900±240 139±3A3⁎⁎⁎ 148.6 170.9±0.3 430±20 830±40 107.6±2.5 0.1271±0.0016 13220±170 13040±180 112±3OCNM02-1-15.26 152.6 141±1 8450±90 50±1 106.4±4.3 0.1802±0.0013 19300±180 17720±810 112±5OCNM02-1-15.46 154.6 110.9±0.2 9100±30 61±1 107.3±2.3 0.3012±0.0022 34430±300 32300±1100 118±3OCNM02-1-15.55 155.5 98.2±0.3 9810±110 59±1 132.0±2.9 0.3592±0.0025 4120±400 38600±1800 147±3OCNM02-1-16.15 161.5 136.2±0.4 8970±100 93±3 123.3±3.2 0.371±0.011 43400±1600 41700±1800 139±4OCNM02-1-16.30 163.0 104.4±0.3 2560±30 317±5 123.3±3.2 0.4712±0.0033 58600±600 58030±760 145±4A5⁎⁎⁎ 163.6 95.3±0.1 2900±20 259±2 109.4±3.0 0.4778±0.0030 60800±600 58640±720 129±4OCNM02-1-16.49 164.9 92.2±0.2 17780±70 42±1 104.8±2.4 0.4923±0.0051 63600±900 58500±2800 124±3OCNM02-1-16.49b 164.9 118±1 3790±40 247±3 118.3±5.4 0.4793±0.0032 60360±700 59540±780 140±6OCNM02-1-16.50 165.0 105.2±0.3 5420±60 162±2 112.7±2.9 0.5065±0.0033 65460±600 64130±920 135±3A2⁎⁎⁎ 171.6 208.8±0.3 190±20 13375±1400 89.4±2.5 0.7381±0.0040 120700±1300 120600±1300 126±4A1⁎⁎⁎ 244.6 81.0±0.2 260±20 4220±330 130.7±6.9 0.8060±0.0060 131200±2600 131000±2600 190±10OCNM05-1A-4.4 44.0 227.4±0.3 884±5 3195±20 114.0±1.4 0.7523±0.0025 119300±760 119210±760 160±2OCNM05-1A-5-7.4 74.0 238.9±0.5 46±20 65000±28000 109.4±2.3 0.7507±0.0029 119600±960 119580±960 153±3OCNM05-1A-12.2 122.0 170.1±0.2 1211±16 1760±20 112.5±1.4 0.7613±0.0016 121900±570 121760±570 159±2OCNM05-1A-20.6 206.0 179.7±0.3 397±11 5730±160 115.3±1.9 0.7677±0.0019 123200±700 123120±700 163±3OCNM05-1A-5-23.7 237.0 249.4±0.5 48±16 65000±22000 112.3±2.9 0.7626±0.0027 122400±1000 122300±1000 159±4OCNM05-1A-29.6 296.0 312.4±0.3 639±6 6150±60 111.2±1.2 0.7623±0.0023 122800±720 122700±720 157±2OCNM05-1A-5-38 308.0 241.2±0.5 35±16 90000±42000 156.5±2.9 0.8026±0.0031 123900±1100 123900±1100 222±4OCNM05-1B-2.9 29.0 206.1±0.2 437±14 169±6 177.7±1.2 0.0217±0.0002 1970±20 1920±40 179±1OCNM05-1B-8 80.0 167.8±0.2 801±15 170±3 198.8±1.3 0.0493±0.0003 4520±30 4400±90 201±1OCNM05-1B-02 142.0 245.2±0.3 735±6 472±6 229.1±1.4 0.0856±0.0009 7810±80 7740±90 234±1OCNM05-1B-6 143.2 192.8±0.2 742±23 480±20 196.3±1.4 0.1126±0.0005 10690±50 10600±80 202±1OCNM05-1B-5 152.7 176.5±0.2 532±12 670±20 205.3±1.4 0.1217±0.0004 11520±40 11440±70 212±1OCNM05-1B-4 164.2 152.4±0.2 722±18 490±10 183.5±1.4 0.1407±0.0005 13700±60 13580±100 191±1OCNM05-1B-3 168.2 95.3±0.1 644±22 830±30 158.2±1.4 0.3413±0.0009 37680±130 37520±180 176±2OCNM051B-2 187.0 88.7±0.1 580±19 970±30 153.4±1.2 0.3828±0.0010 43490±160 43330±190 173±1OCNM051B-1 184.8 83.5±0.1 1061±18 560±10 171.0±1.4 0.4329±0.0010 49640±170 49330±270 197±2OCNM05-1B-21 189.3 114.5±0.1 351±14 2600±100 181.3±1.3 0.4891±0.0012 57320±200 57240±210 213±2OCNM07-1-0.5 5.0 289.6±0.5 2919±35 44±1 138.0±1.8 0.0268±0.0002 2540±20 2280±180 139±2OCNM07-1-2.45 24.5 322.2±0.4 426±14 460±20 138.8±1.3 0.0365±0.0002 3500±20 3460±30 140±1OCNM07-1-5 50.0 372.9±0.4 3533±38 111±1 124.2±1.4 0.0640±0.0002 6330±20 6090±180 126±1OCNM07-1-6.2 62.0 307.4±0.5 604±15 530±10 119.7±1.3 0.0626±0.0003 6200±30 6150±50 122±1OCNM02-2-2.4 24.0 259.0±0.4 15140±54 35.2±0.4 174.8±1.8 0.1245±0.0015 12100±150 10700±800 180±2OCNM02-2-4.1 41.0 253.2±0.3 3064±11 829±4 152.7±1.5 0.6073±0.0022 80000±450 79700±500 191±2OCNM02-2-5.5 55.0 95.1±0.2 6066±19 204±1 98.2±2.2 0.7898±0.0038 134500±1400 132900±1600 143±3OCNM02-2-15.8 158.0 133.1±0.2 2013±12 875±6 109.1±1.9 0.8013±0.0034 135300±1200 135000±1200 160±3OCNM02-2-18 180.0 114.5±0.2 30220±184 59±1 56.6±2.1 0.944±0.012 232000±10000 225000±10000 107±5OCNM02-2-19.3 193.0 129.3±0.2 9676±31 208±1 72.4±2.1 0.9405±0.0051 217000±4000 215000±4000 133±4OCNM02-2-19.7 207.0 198.0±0.4 13197±43 247±1 95.1±2.2 0.9980±0.0049 241000±5000 240000±5000 187±5OCNM02-2-22.1 221.0 134.7±0.2 8852±26 250±1 92.7±2.0 0.9971±0.0043 243000±4000 241000±4000 183±4
λ230=9.1577×10⁻⁶ y−1, λ234=2.8263×10⁻⁶ y−1, λ238=1.55125×10⁻¹⁰ y−1.⁎δ234U=([234U/238U]activity−1)×1000. ⁎⁎δ234Uinitial was calculated based on 230Th age (T), i.e., δ234Uinitial =δ234Umeasured×eλ234xT. Corrected 230Th ages assume the initial 230Th/232Thatomic ratio of 4.4±2.2×10⁻⁶ except for stalagmite OCNM02-1 where based on the isochron technique (Vacco et al., 2005) the ages were calculated with a ratio of 12±3×10⁻⁶. Theerrors are arbitrarily assumed to be 50%. The error is 2σ error. ⁎⁎⁎Ages reported in Vacco et al. (2005).
319V. Ersek et al. / Earth and Planetary Science Letters 279 (2009) 316–325
Author's personal copy
The regional climate model comprises the RegCM2 atmosphere(Giorgi et al., 1993) and LSX, a full physics land-surface model(Thompson and Pollard, 1995) with six soil layers. The model domaincovers most of North America at a 50-km horizontal grid space andincludes the North American ice sheets. Boundary conditions for theregional model simulations were obtained from global simulations ofthe 21 and 0 ka climates that were runwith the GENESIS v. 2.3 generalcirculation model with appropriate large-scale boundary conditionswhich include continental ice sheets, atmospheric composition(180 ppmV CO2 for LGM and 365 ppmV CO2 for control), and specifiedmonthly SSTs (LGM from Hostetler et al. (2006) and present fromLevitus (1982)). The boundary conditions for the RegCM (verticalprofiles of temperature, humidity, winds and SSTs) are updated every6 h of simulation. Further details about the models and the modelingmethodology are given elsewhere (Hostetler and Bartlein, 1999;Hostetler et al., 2000, 2006).
4.3. Cave temperature modeling
As an additional method to evaluate the role of temperature over alonger time scale we applied a one-dimensional thermal advection–diffusion model to calculate the sub-surface temperature evolutionat OCNM through the last glacial cycle. Inputs to the model are thegeothermal heat flux from below, and air temperature and perturba-tions in solar radiation at the surface.
Movement of heat in the subsurface is governed by the supply ofenergy from the earth's interior and the supply of energy from thesurface, which depends on the surface energy budget as the advectionof heat due towater percolating into the cave. The advection–diffusionequation representing heat transport can be written as:
ρmcmATAt
+wθρwcwATAz
= kA2TAz2
+Φ ð1Þ
where T is temperature, t is time, ρm is the density of marble (2700 kgm−3), cm is the specific heat capacity of marble (2639 J K−1 kg−1), z is thevertical spatial coordinate, w is advection velocity of percolating waterassuming a 30-day surface-to-cave transit time (1.897×10⁻⁵ m s−1), θ isthe effective porosity of the marble (0.001), ρw is density of water(1000 kgm−3), cw is the specific heat capacity of water (4181 J K−1 kg−1),k is thermal conductivity (3.0Wm−1 K−1), andΦ represents heat sources(orbital insolation anomalies and geothermal heat fluxes). At thetopmost grid cell, we allow for a mixture of 80% soil (ρ=1300 kg m−3,c=2254 J K−1 kg−1, k=0.6 W m−1 K−1) and 20% water.
We use finite differences to implement Eq. (1) over a 1000 mdomain with a 1-m vertical grid spacing and a 10-year time step. Asmall geothermal heat source at the bottom is specified as 90mWm−2.The recordof variations in SSTs of the California Current fromODP1020in the northeast Pacific (Lat: 41°0.051'N, Long: 126°26.024'W) (Herbertet al., 2001) is a surrogate for regional temperature variability atmillennial scales and longer. This site lies 200 km to thewest of OCNM,and present-day SSTs at the site are within ∼2 °C of the MAT at OCNM,reflecting the strong influence of Pacific SSTs on the climate at OCNM.We adjust this SST record uniformly by this 2 °C such that the meantemperature for the last 1000 years equals the current air temperaturein the cave. The topmost cell is set to this time-varying temperature asa boundary condition.
We also test the possibility that changes in direct solar inputs dueto changes in orbital parameters could have led to warmer or colderperiods that are reflected in higher or lower cave temperatures. To dothis, the time-varying anomaly in June solar energy flux at 40°N(Berger and Loutre,1991) is applied as an additional heat source to thetopmost grid cell. The radiation anomaly in reality is modulated bycloud-cover, surface albedo, and possible shading by vegetation. Wecannot quantify these factors, so we allow for a varying strength of thesolar radiation signal by sensitivity tests inwhich we vary the range of
the base radiation anomaly from 10% to 70% of the total anomaly. Wethen use the radiation range in combinationwith the present-day cavetemperature to select those modeled time histories of cave tempera-ture that simulated modern temperatures of 7 to 8.8 °C.
5. Results
5.1. Speleothem growth history
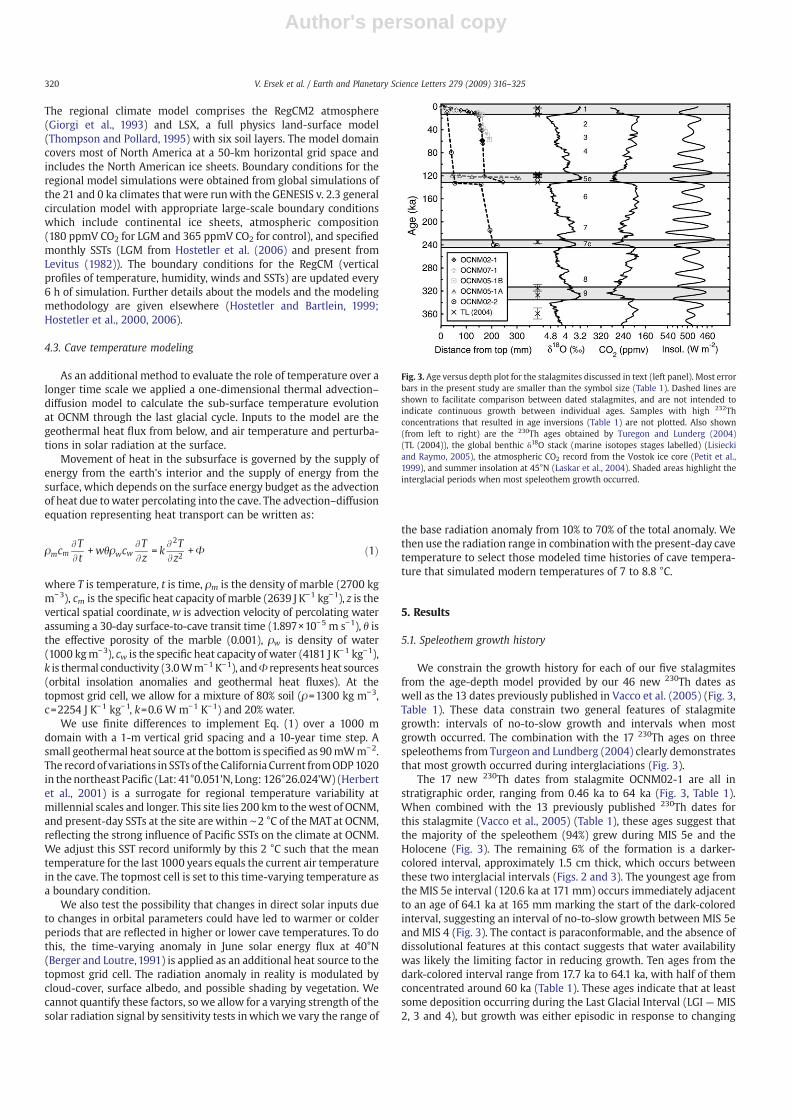
We constrain the growth history for each of our five stalagmitesfrom the age-depth model provided by our 46 new 230Th dates aswell as the 13 dates previously published in Vacco et al. (2005) (Fig. 3,Table 1). These data constrain two general features of stalagmitegrowth: intervals of no-to-slow growth and intervals when mostgrowth occurred. The combination with the 17 230Th ages on threespeleothems from Turgeon and Lundberg (2004) clearly demonstratesthat most growth occurred during interglaciations (Fig. 3).
The 17 new 230Th dates from stalagmite OCNM02-1 are all instratigraphic order, ranging from 0.46 ka to 64 ka (Fig. 3, Table 1).When combined with the 13 previously published 230Th dates forthis stalagmite (Vacco et al., 2005) (Table 1), these ages suggest thatthe majority of the speleothem (94%) grew during MIS 5e and theHolocene (Fig. 3). The remaining 6% of the formation is a darker-colored interval, approximately 1.5 cm thick, which occurs betweenthese two interglacial intervals (Figs. 2 and 3). The youngest age fromthe MIS 5e interval (120.6 ka at 171 mm) occurs immediately adjacentto an age of 64.1 ka at 165 mm marking the start of the dark-coloredinterval, suggesting an interval of no-to-slow growth between MIS 5eand MIS 4 (Fig. 3). The contact is paraconformable, and the absence ofdissolutional features at this contact suggests that water availabilitywas likely the limiting factor in reducing growth. Ten ages from thedark-colored interval range from 17.7 ka to 64.1 ka, with half of themconcentrated around 60 ka (Table 1). These ages indicate that at leastsome deposition occurring during the Last Glacial Interval (LGI — MIS2, 3 and 4), but growth was either episodic in response to changing
Fig. 3. Age versus depth plot for the stalagmites discussed in text (left panel). Most errorbars in the present study are smaller than the symbol size (Table 1). Dashed lines areshown to facilitate comparison between dated stalagmites, and are not intended toindicate continuous growth between individual ages. Samples with high 232Thconcentrations that resulted in age inversions (Table 1) are not plotted. Also shown(from left to right) are the 230Th ages obtained by Turegon and Lunderg (2004)(TL (2004)), the global benthic δ18O stack (marine isotopes stages labelled) (Lisieckiand Raymo, 2005), the atmospheric CO2 record from the Vostok ice core (Petit et al.,1999), and summer insolation at 45°N (Laskar et al., 2004). Shaded areas highlight theinterglacial periods when most speleothem growth occurred.
320 V. Ersek et al. / Earth and Planetary Science Letters 279 (2009) 316–325
Author's personal copy
environmental conditions above the cave, or was continuous, but veryslow, and the 230Th dates average large intervals of time.
The eight 230Th dates from stalagmite OCNM02-2 yielded agesbetween 10 ka and 241 ka, with 87% of the speleothemvertical growthoccurring during interglaciations (MIS 1, 5a, 5e, and 7) and 13%growing during glaciations (MIS 2, 3, 4, and 6) (Fig. 3). The speleothemcalcite that grew during the last interglaciation is characterized by alarge diameter and coarsely crystalline structure, suggesting abundantwater supply and a thick water film on the speleothem surface(Dreybrodt, 1999). Of particular interest is the fact that growth beganat 135±1.2 ka, a time when atmospheric CO2 (Petit et al., 1999) andsummer insolation at the cave site (Laskar et al., 2004) were still nearglacial levels (Fig. 3). The early warming suggested from this intervalof growth, however, is similar to records elsewhere that indicate anearly start to the last interglaciation (Stirling et al., 1998; Hendersonand Slowey, 2000; Spötl et al., 2002; Gallup et al., 2002). There is avisible discontinuity in the speleothem layer structure between lateMIS 6 and MIS 7, indicating dissolution of the older layers, whichsuggests that water undersaturated with respect to calcite wasentering the cave at this location during some of the glacial intervalof MIS 6. Growth occurred duringMIS 7, but an apparent age inversion(Table 1), likely due to contamination by detrital clays as indicated bythe high 232Th concentrations of sample OCNM02-2-18 (Table 1),prevents an assessment of growth rates in this interval.
The seven 230Th dates for OCNM05-1A range from 119 ka to 123 ka,with all ages in stratigraphic order except for sample OCNM05-1-20.6.Accordingly, this speleothem grew exclusively during MIS 5e. The ten230Th dates from stalagmite OCNM05-1B indicate that 81% ofstalagmite vertical accumulation occurred during the present inter-glaciation and the remaining 19% occurring during the last glaciation(Table 1, Fig. 3). The four 230Th dates for OCNM07-1 range from 2.3 kato 6.1 ka, with all ages in stratigraphic order, indicating that all of thisformation grew during the present interglaciation (Table 1).
In summary, the compilation of all of our new data indicates that92% of speleothem vertical accumulation occurred during interglacia-tions and 8% during glaciations. Although growth of any givenindividual speleothem was not necessarily continuous through theentirety of any given interglaciation, suggesting some internalhydrological variability in controlling growth, a primary climaticcontrol is clearly indicated when including the results of all fivesamples (Fig. 3). The combination of our new ages with previouslypublished 230Th dates from OCNM (Turgeon and Lundberg, 2004;Vacco et al., 2005) further supports this strong relation betweenspeleothem growth and climate for the past 380 ka, indicatingthat interglacial environmental conditions (warm climate, high soilpCO2) were favorable to speleothem formation. However, speleothemgrowth also occurred intermittently during cold (glacial) periods(MIS 3,4 and 6), demonstrating that at these times temperatures wereabove 0 °C, processes in the soil were sufficiently active to maintainhigh pCO2 and promote carbonate dissolution, andwaterwas drippingin the cave.
5.2. Temperature modeling
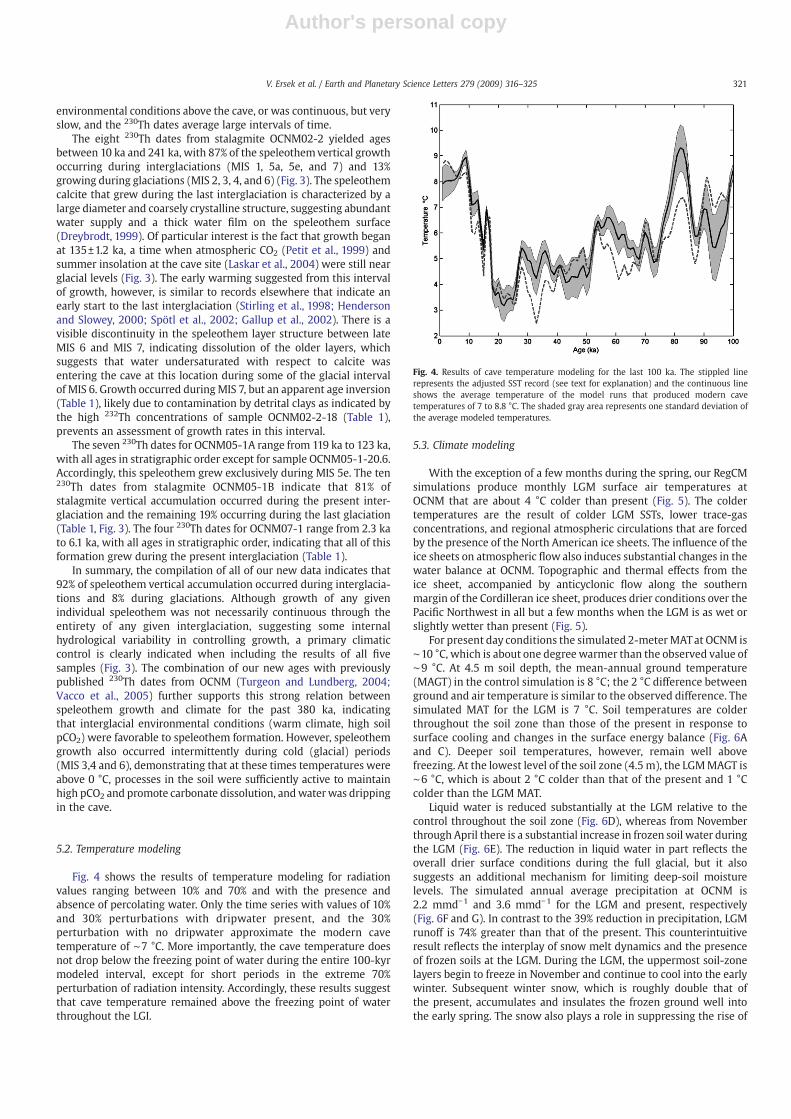
Fig. 4 shows the results of temperature modeling for radiationvalues ranging between 10% and 70% and with the presence andabsence of percolating water. Only the time series with values of 10%and 30% perturbations with dripwater present, and the 30%perturbation with no dripwater approximate the modern cavetemperature of ∼7 °C. More importantly, the cave temperature doesnot drop below the freezing point of water during the entire 100-kyrmodeled interval, except for short periods in the extreme 70%perturbation of radiation intensity. Accordingly, these results suggestthat cave temperature remained above the freezing point of waterthroughout the LGI.
5.3. Climate modeling
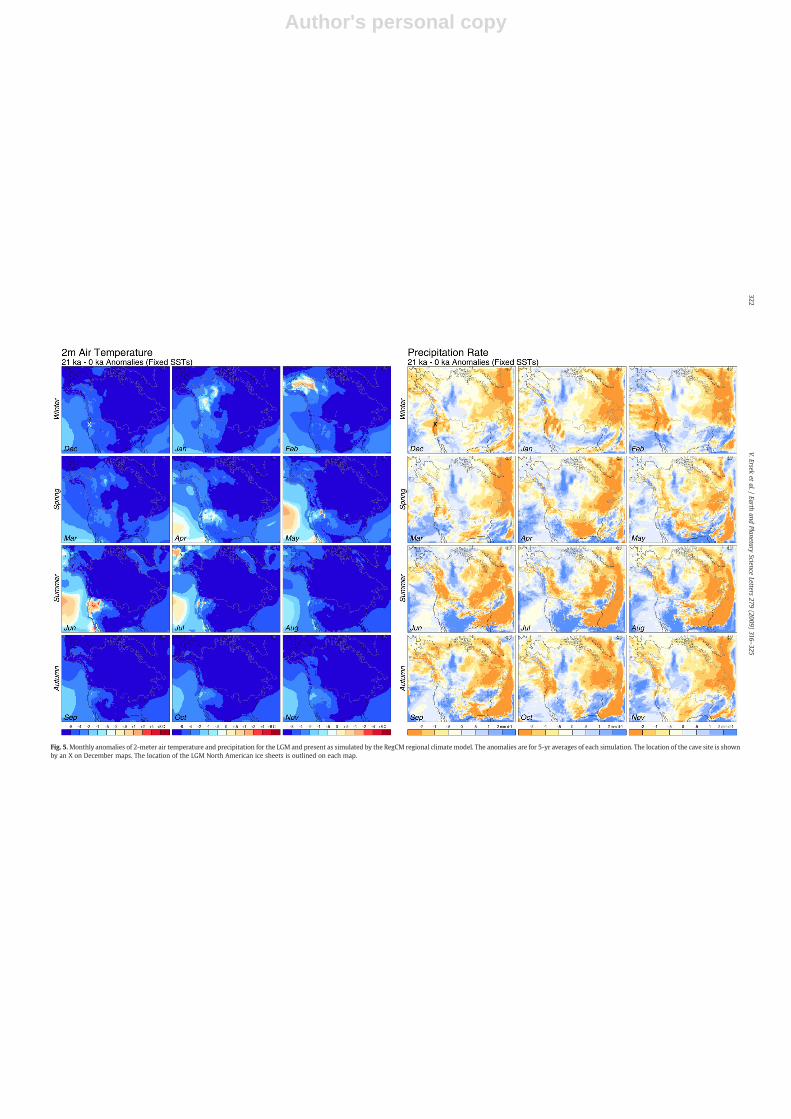
With the exception of a few months during the spring, our RegCMsimulations produce monthly LGM surface air temperatures atOCNM that are about 4 °C colder than present (Fig. 5). The coldertemperatures are the result of colder LGM SSTs, lower trace-gasconcentrations, and regional atmospheric circulations that are forcedby the presence of the North American ice sheets. The influence of theice sheets on atmospheric flow also induces substantial changes in thewater balance at OCNM. Topographic and thermal effects from theice sheet, accompanied by anticyclonic flow along the southernmargin of the Cordilleran ice sheet, produces drier conditions over thePacific Northwest in all but a few months when the LGM is as wet orslightly wetter than present (Fig. 5).
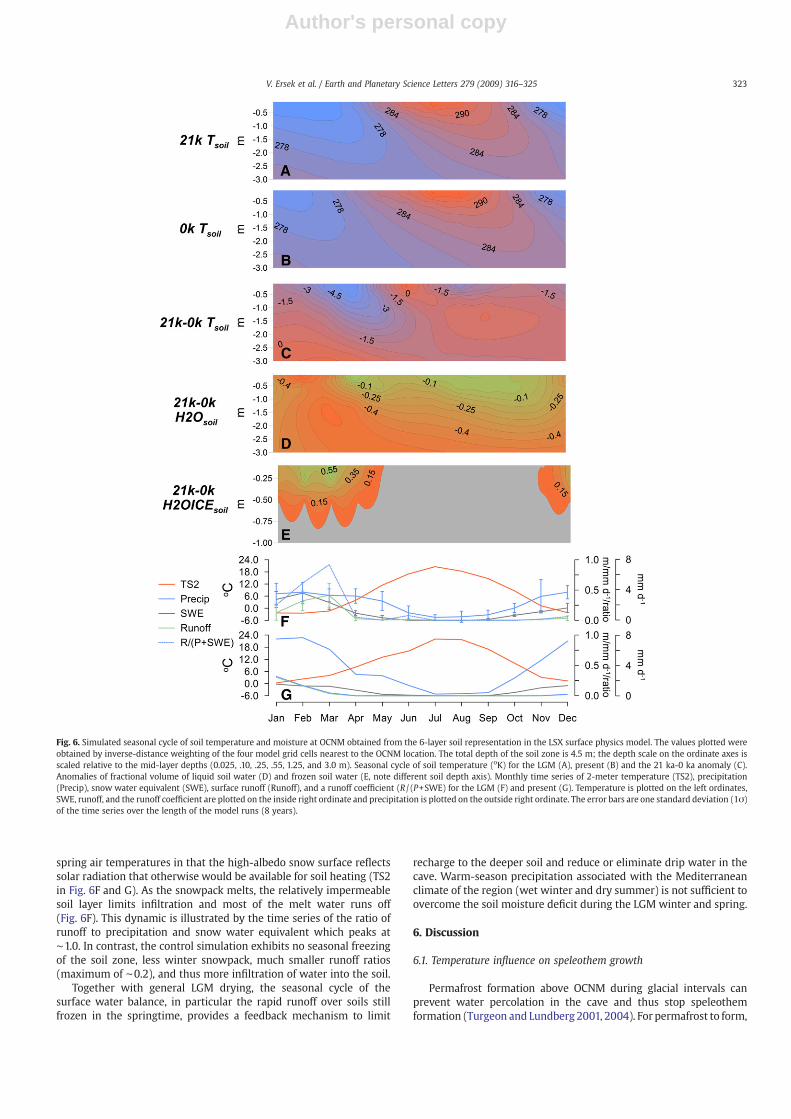
For present day conditions the simulated 2-meterMATat OCNM is∼10 °C, which is about one degreewarmer than the observed value of∼9 °C. At 4.5 m soil depth, the mean-annual ground temperature(MAGT) in the control simulation is 8 °C; the 2 °C difference betweenground and air temperature is similar to the observed difference. Thesimulated MAT for the LGM is 7 °C. Soil temperatures are colderthroughout the soil zone than those of the present in response tosurface cooling and changes in the surface energy balance (Fig. 6Aand C). Deeper soil temperatures, however, remain well abovefreezing. At the lowest level of the soil zone (4.5 m), the LGMMAGT is∼6 °C, which is about 2 °C colder than that of the present and 1 °Ccolder than the LGM MAT.
Liquid water is reduced substantially at the LGM relative to thecontrol throughout the soil zone (Fig. 6D), whereas from Novemberthrough April there is a substantial increase in frozen soil water duringthe LGM (Fig. 6E). The reduction in liquid water in part reflects theoverall drier surface conditions during the full glacial, but it alsosuggests an additional mechanism for limiting deep-soil moisturelevels. The simulated annual average precipitation at OCNM is2.2 mmd−1 and 3.6 mmd−1 for the LGM and present, respectively(Fig. 6F and G). In contrast to the 39% reduction in precipitation, LGMrunoff is 74% greater than that of the present. This counterintuitiveresult reflects the interplay of snow melt dynamics and the presenceof frozen soils at the LGM. During the LGM, the uppermost soil-zonelayers begin to freeze in November and continue to cool into the earlywinter. Subsequent winter snow, which is roughly double that ofthe present, accumulates and insulates the frozen ground well intothe early spring. The snow also plays a role in suppressing the rise of
Fig. 4. Results of cave temperature modeling for the last 100 ka. The stippled linerepresents the adjusted SST record (see text for explanation) and the continuous lineshows the average temperature of the model runs that produced modern cavetemperatures of 7 to 8.8 °C. The shaded gray area represents one standard deviation ofthe average modeled temperatures.
321V. Ersek et al. / Earth and Planetary Science Letters 279 (2009) 316–325
Author's personal copy
Fig. 5.Monthly anomalies of 2-meter air temperature and precipitation for the LGM and present as simulated by the RegCM regional climate model. The anomalies are for 5-yr averages of each simulation. The location of the cave site is shownby an X on December maps. The location of the LGM North American ice sheets is outlined on each map.
322V.Ersek
etal./
Earthand
PlanetaryScience
Letters279
(2009)316
–325
Author's personal copy
spring air temperatures in that the high-albedo snow surface reflectssolar radiation that otherwise would be available for soil heating (TS2in Fig. 6F and G). As the snowpack melts, the relatively impermeablesoil layer limits infiltration and most of the melt water runs off(Fig. 6F). This dynamic is illustrated by the time series of the ratio ofrunoff to precipitation and snow water equivalent which peaks at∼1.0. In contrast, the control simulation exhibits no seasonal freezingof the soil zone, less winter snowpack, much smaller runoff ratios(maximum of ∼0.2), and thus more infiltration of water into the soil.
Together with general LGM drying, the seasonal cycle of thesurface water balance, in particular the rapid runoff over soils stillfrozen in the springtime, provides a feedback mechanism to limit
recharge to the deeper soil and reduce or eliminate drip water in thecave. Warm-season precipitation associated with the Mediterraneanclimate of the region (wet winter and dry summer) is not sufficient toovercome the soil moisture deficit during the LGM winter and spring.
6. Discussion
6.1. Temperature influence on speleothem growth
Permafrost formation above OCNM during glacial intervals canprevent water percolation in the cave and thus stop speleothemformation (Turgeon and Lundberg 2001, 2004). For permafrost to form,
Fig. 6. Simulated seasonal cycle of soil temperature and moisture at OCNM obtained from the 6-layer soil representation in the LSX surface physics model. The values plotted wereobtained by inverse-distance weighting of the four model grid cells nearest to the OCNM location. The total depth of the soil zone is 4.5 m; the depth scale on the ordinate axes isscaled relative to the mid-layer depths (0.025, .10, .25, .55, 1.25, and 3.0 m). Seasonal cycle of soil temperature (oK) for the LGM (A), present (B) and the 21 ka-0 ka anomaly (C).Anomalies of fractional volume of liquid soil water (D) and frozen soil water (E, note different soil depth axis). Monthly time series of 2-meter temperature (TS2), precipitation(Precip), snow water equivalent (SWE), surface runoff (Runoff), and a runoff coefficient (R / (P+SWE) for the LGM (F) and present (G). Temperature is plotted on the left ordinates,SWE, runoff, and the runoff coefficient are plotted on the inside right ordinate and precipitation is plotted on the outside right ordinate. The error bars are one standard deviation (1σ)of the time series over the length of the model runs (8 years).
323V. Ersek et al. / Earth and Planetary Science Letters 279 (2009) 316–325
Author's personal copy
theMATshould be atmost 0 °C, but usually aMAT limit of −3 to −5 °C isrequired for discontinuous permafrost formation and even lowertemperatures are necessary for continuous permafrost (French, 1976;Washburn,1980). Given that the averageMATatOCNM is 8.8 °C±0.7 °C,a minimum temperature depression of 9 °C and more likely of at least10 °C would be necessary to sustain permafrost.
The computed LGM temperature of the cave based on the thermaladvection-diffusion model is 2.5 °C, a 4.5 °C cooling relative to presentfor a 4 °C depression in air temperature. Under our assumptions, thisrepresents the plausible extreme in LGM cooling. The absence offreezing temperatures at the LGM is robust to a range of specifiedchanges in radiation intensity. The temperature computations andclimate model simulations thus support the assertion of ice-freeconditions in the cave, and the analysis of the simulated thermal andhydrologic dynamics in the climate model output provide a mechan-ism and support for a limited supply of drip water and thus ofspeleothem growth at the LGM. Similar but less extreme dynamicslikely operated during times of intermediate ice volume, atmosphericCO2 concentrations, and SSTs, thus allowing for the intermittentoccurrence of some growth at other times during the LGI (Fig. 3).
Proxy data from OCNM and the surrounding region support themodeled temperatures. Pollen data suggest that the MAT duringMIS 2was lower by 3–5 °C in southern Oregon and northern California(Thompson et al., 1993; Heusser, 1998; Briles et al., 2005) while asurvey of alpine periglacial features indicate that permafrost duringthe LGI only occurred in limited high-altitude areas of the CascadeRange in Oregon and northern California (Péwé, 1983).
6.2. Precipitation and vegetation influence on speleothem growth
Climate model simulations suggest that precipitation ratesdecreased significantly during the LGM relative to modern (Fig. 6),indicating that water balance was likely an important control onspeleothem growth. In particular, maximum reduction in LGMprecipitation occurs during the winter months, which is the wetseason todaywhenpercolationwaters enter the cave. Because the LGMchanges are largely induced by topographic and thermal effects fromthe ice sheet, modulation of precipitation by ice-sheet size may be animportant factor in controlling the timing of speleothem growth.
In addition to the direct effect of water availability on speleothemgrowth, moisture supply, combined with temperature, also induceschanges in biologic productivity, thus influencing soil pCO2 andcarbonate dissolution rate. For example, a pollen sequence from CarpLake, WA (45°55'N, 120°53'W) indicates that for the past 125 ka,vegetation changes at this site were closely related to changes in icevolume, solar insolation, and atmospheric CO2 (Whitlock and Bartlein,1997), while a pollen record from Bolan Lake, ∼10 km SW of OCNM,indicates that the surrounding areawas covered by parkland vegetationduring late MIS 2, similar to the modern subalpine environment (Brileset al., 2005). Such a change in vegetation would reduce biomass, andthus soil respiration rates over the cave site, inducing a decrease in soilpCO2 and limiting dissolution of the carbonate bedrock.
We thus expect that changes in ice volume, solar radiation, andatmospheric CO2 influence speleothem growth at OCNM throughtheir influence onwater balance, seasonal snow cover, and vegetationtype. This relation is supported by our data, which demonstrate thatgreatest growth occurred during interglaciations (minima in icevolume, maxima in solar radiation and atmospheric CO2), and little orno growth occurred during glaciations (Fig. 3).
Both OCNM02-1 and OCNM05-1B have growth phases duringMIS 3corresponding to intermediate ice volumes and relatively high summerinsolation (Fig. 3). This coincides with growth phases identified duringthis period in a British speleothem (Baker et al., 1995) and withspeleothem growth in the Austrian Alps (Spötl and Mangini, 2002),perhaps suggesting that these MIS 3 boundary conditions favoredhemispheric-wide speleothem growth at mid-latitudes.
7. Conclusions
Speleothem growth at OCNM provides a first-order indication ofpast climate conditions because it requires the presence of liquidwater in the karst system, and vegetation cover above the cave. Thecombination of 27 previously published 230Th ages (Turgeon andLundberg, 2004; Vacco et al., 2005) and 46 new ages from fivestalagmites indicates that maximum speleothem growth at OCNMoccurred during interglaciations, and little growth occurred duringglacial intervals.
To evaluate whether speleothem growth was interrupted by atemperature decrease sufficient to establish permafrost, by changes inwater availability, or by some combination of these factors, we used aregional climate model to evaluate the magnitude and direction ofchanges in environmental variables (temperature, precipitation, soilmoisture), and an energy balance model to assess the probability offreezing temperatures in the cave. The energy balance model resultssuggest that for the past 100 ka cave temperature remained above0 °C. Similarly, the regional climate model simulation of LGM climateindicates that while surface soils froze seasonally, deeper soilsremained unfrozen throughout the year. Accordingly, these resultsdo not support the presence of permafrost as a mechanism to reducespeleothem growth during glaciations. On the other hand, the regionalclimate model suggests that from November to April the topsoil wasfrozen, including during the time of maximum surface runoff in thespring, which combinedwith the overall drier LGM climate provided afeedback mechanism that limited recharge to the deeper soil horizonsand reduced or eliminated drip water in the cave. Warm-seasonprecipitation associated with the Mediterranean climate of the regionwas not sufficient to overcome the soil moisture deficit during thewinter and spring. This mechanism may have also been an importantfactor in limiting speleothem growth at other cave sites frommid- andhigh-latitudes that were affected by relatively large temperaturechanges on glacial-interglacial timescales, but not severe enough toallow permafrost formation. Our modeling results, which aresupported by proxy data, thus indicate that OCNM climate andspeleothem growth are sensitive to changes in precipitation andrunoff associated with changes in ice-sheet size and radiative forcing.Our finding that speleothem growth was suppressed during glacialintervals without requiring the presence of permafrost resolves anapparent conflict that would have required very large temperaturechanges on land in spite of a modest (∼3 °C glacial-interglacialchange) temperature depression inferred for the nearby North PacificOcean (Ortiz et al., 1997).
Acknowledgments
We thank John Roth, Elizabeth Hale and Deana DeWire forfacilitating our research at OCNM, Xianfeng Wang for help with230Th dating, and Sarah Shafer, Joe Stoner, Nick Pisias, Bogdan Onacand four anonymous reviewers for comments and suggestions thathelped improve this manuscript. This research was supported by theNational Science Foundation Paleoclimate Program and the U.S.Geological Survey.
References
Atkinson, T.C., 1983. Growthmechanisms of speleothems in Castleguard Cave, Colombialcefield, Alberta, Canada. Arct. Alp. Res. 15, 523–536.
Baker, A., Smart, P.L., Ford, D.C., 1993. Northwest European palaeoclimate as indicated bygrowth frequencyvariationsof secondarycalcite deposits. Palaeogeogr. Palaeoclimatol.Palaeoecol. 100, 291–301.
Baker, A., Smart, P.L., Lawrence Edwards, R., 1995. Paleoclimate implications of massspectrometric dating of a British flowstone. Geology 23, 309–312.
Baker, A., Smart, P.L., Edwards, R.L., 1996. Mass spectrometric dating of flowstones fromStump Cross Caverns and Lancaster Hole, Yorkshire: palaeoclimate implications.J. Quat. Sci. 11, 107–114.
324 V. Ersek et al. / Earth and Planetary Science Letters 279 (2009) 316–325
Author's personal copy
Barron, J.A., Heusser, L., Herbert, T., Lyle, M., 2003. High-resolution climatic evolution ofcoastal northern California during the past 16,000 years. Paleoceanography 18,1–20.
Bartlein, P.J., Anderson, K.H., Anderson, P.M., Edwards, M.E., Mock, C.J., Thompson, R.S.,Webb, R.S., Webb, T.I., Whitlock, C., 1998. Paleoclimate simulations for NorthAmerica over the past 21,000 years: features of the simulated climate andcomparisons with paleoenvironmental data. Quat. Sci. Rev. 17, 549–585.
Berger, A., Loutre, M.-F., 1991. Insolation values for the climate of the last 10 millionyears. Quat. Sci. Rev. 10, 297–317.
Briles, C.E., Whitlock, C., Bartlein, P.J., 2005. Postglacial vegetation, fire, and climatehistory of the Siskiyou Mountains, Oregon, USA. Quat. Res. 64, 44–56.
Brook, G.A., Ellwood, B.B., Railsback, L.B., Cowart, J.B., 2006. A 164 ka record ofenvironmental change in the American Southwest from a Carlsbad Cavernspeleothem. Palaeogeogr. Palaeoclimatol. Palaeoecol. 237, 483–507.
Cheng, H., Adkins, J.F., Edwards, R.L., Boyle, E.A., 2000. 230Th dating of deep-sea corals.Geochim. Cosmochim. Acta 64, 2401–2416.
Dorr, H., Munnich, K.O., 1989. Downward movement of soil organic matter and itsinfluence on trace-element transport (210Pb, 37Cs). Radiocarbon 31, 655–663.
Dreybrodt, W., 1980. Deposition of calcite from thin film of calcareous solutions and thegrowth of speleothems. Chem. Geol. 29, 89–105.
Dreybrodt, W., 1999. Chemical kinetics, speleothem growth and climate. Boreas 28,347–356.
Edwards, L.R., Chen, J.H., Wasserburg, G.J., 1987. 238U-234U-230Th-232Th systematics andthe precisemeasurement of time over the past 500,000 years. Earth Planet. Sci. Lett.81, 175–192.
Fairchild, I.J., Smith, C.L., Baker, A., Fuller, L., Spötl, C., Mattey, D., McDermott, F., E.I.M.F.,2006. Modification and preservation of environmental signals in speleothems.Earth Sci. Rev. 75, 105–153.
French, H.M., 1976. The Periglacial Environment. Longman, London. 309 pp.Gallup, C.D., Cheng, H., Taylor, F.W., Edwards, R.L., 2002. Direct determination of the
timing of sea level change during termination II. Science 295, 310–313.Genty, D., Blamart, D., Ouahdi, R., Gilmour, M., Baker, A., Jouzel, J., Van-Exter, S., 2003.
Precise dating of Dansgaard–Oeschger climate oscillations in western Europe fromstalagmite data. Nature 421, 833–837.
Giorgi, F., Marinucci, M.R., Bates, G.T., 1993. Development of a second-generationregional climate model (RegCM2). Part I: boundary-layer and radiative transferprocesses. Mon. Weather Rev. 121, 2794–2813.
Gordon, D., Smart, P.L., Ford, D.C., Andrews, J.N., Atkinson, T.C., Rowe, P.J., Christopher,N.S.J., 1989. Dating of late Pleistocene interglacial and interstadial periods in theUnited Kingdom from speleothem growth frequency. Quat. Res. 31, 14–26.
Harmon, R.S., Ford, D.C., Schwarcz, H.P., 1977. Interglacial chronology of the Rocky andMackenzie Mountains based upon 230Th-234U dating of calcite speleothems. Can. J.Earth Sci. 14, 2543–2552.
Harmon, R.S., Atkinson, T.C., Atkinson, J.L., 1983. The mineralogy of Castleguard Cave,Columbia lcefields, Alberta, Canada. Arct. Alp. Res. 15, 503–516.
Henderson, G.M., Slowey, N.C., 2000. Evidence against northern-hemisphere forcing ofthe penultimate deglaciation from U-Th dating. Nature 402, 61–66.
Herbert, T.D., Schuffert, J.D., Andreasen, D., Heusser, L., Lyle, M., Mix, A., Ravelo, A.C.,Stott, L.D., Herguera, J.C., 2001. Collapse of the California current during glacialmaxima linked to climate change of land. Science 293, 71–76.
Heusser, L., 1998. Direct correlation of millennial-scale changes in western NorthAmerican vegetation and climate with changes in California Current system overthe past ~60 kyr. Paleoceanography 13, 252–262.
Hostetler, S.W., Bartlein, P.J., 1999. Simulation of the potential responses of regionalclimate and surface processes in western North America to a canonical Heinrichevent. In: Clark, P.U., Webb, R.S., Keigwin, L.D. (Eds.), Mechanisms of Global ClimateChange at Millennial Time Scales. American Geophysical Union, Washington, D.C.
Hostetler, S.W., Clark, P.U., Bartlein, P.J., Mix, A.C., Pisias, N.G., 1999. Atmospherictransmission of North Atlantic Heinrich events. J Geophys. Res. 104, 3947–3952.
Hostetler, S.W., Bartlein, P.J., Clark, P.U., Small, E.E., Solomon, A.E., 2000. Simulatedinteractions between Lake Agassiz and the Laurentide Ice Sheet 11,000 years ago.Nature 405, 334–337.
Hostetler, S.W., Bartlein, P.J., Holman, J.O., 2006. Atlas of Climatic Controls of Wildfire inthe Western United States. US Geological Survey Scientific Investigations Report2006-5139. (http://pubs.usgs.gov/sir/2006/5139).
Kaufmann, G., 2003. Stalagmite growth and palaeo-climate: the numerical perspective.Earth Planet. Sci. Lett. 214, 251–266.
Laskar, J., Robutel, P., Joutel, F., Gastineau, M., Correia, A.C.M., Levrard, B., 2004. A longtermnumerical solution for the insolation quantities of the Earth. Astron. Astrophys.428, 261–285.
Lauritzen, S.-E., Løvlie, R., Moe, D., Østbye, E., 1990. Paleoclimate deduced from amultidisciplinary study of a half-million-year-old stalagmite from Rana, northernNorway. Quat. Res. 34, 306–316.
Levitus, S., 1982. Climatological Atlas of the World Ocean. NOAA Professional PaperNo. 13. 173.
Lisiecki, L.E., Raymo, M.E., 2005. A Pliocene–Pleistocene stack of 57 globally distributedbenthic δ18O records. Paleoceanography 20. doi:10.1029/2004PA001071.
Mantua, N.J., Hare, S.R., Zhang, Y., Wallace, J.M., Francis, R.C., 1997. A Pacific interdecadalclimate oscillation with impacts on salmon production. Bull. Am. Meteorol. Soc. 78,1069–1079.
McDermott, F., 2004. Paleo-climate reconstruction from stable isotope variations inspeleothems: a review. Quat. Sci. Rev. 23, 901–918.
Mix, A.C., Lund, D.C., Pisias, N.G., Bodén, P., Bornmalm, L., Lyle, M., Pike, J., 1999. Rapidclimate oscillations in the northeast Pacific during the last deglaciation reflectNorthern and Southern Hemisphere sources. In: Clark, P.U., Webb, R.S., Keigwin, L.D.(Eds.), Mechanisms of Global Climate Change at Millennial Time Scales. AmericanGeophysical Union, Washington, D.C.
Moore, G.W., 1952. Speleothem— a new cave term. Nat. Speleo. Soc. News 10, 32–33.Ortiz, J., Mix, A., Hostetler, S., Kashgarian, M., 1997. The California current of the last glacial
maximum: reconstruction at 42°N based on multiple proxies. Paleoceanography 12,191–205.
Petit, J.R., Jouzel, J., Raynaud, D., Barkov, N.I., Barnola, J.-M., Basile, I., Bender, M.,Chappellaz, J., Davis, M., Delaygue, G., Delmotte, M., Kolyakov, V.M., Legrand, M.,Lipenkov, V.Y., Lorius, C., Pépin, L., Ritz, C., Saltzman, E., Stievenard,M.,1999. Climateand atmospheric history of the past 420,000 years from the Vostok ice core,Antarctica. Nature 399, 429–436.
Péwé, T.L., 1983. The periglacial environment in North America during Wisconsin time.In: Porter, S.C. (Ed.), Late-Quaternary environments of the United States. Universityof Minnesota Press, Minneapolis.
Richards, D.A., Dorale, J.A., 2003. Uranium-series chronology and environmentalapplications of speleothems. Rev. Mineral. Geochem. 52, 407–460.
Shen, C.-C., Edwards, R.L., Cheng, H., Dorale, J.A., Thomas, R.B., Moran, S.B., Weinstein,S.E., Edmonds, H.N., 2002. Uranium and thorium isotopic and concentrationmeasurements by magnetic sector inductively coupled plasma mass spectro-metry. Chem. Geol. 185, 165–178.
Snoke, A.W., Barnes, C.G., 2006. The development of tectonic concepts for the KlamathMountains province, California and Oregon. In: Snoke, A.W., Barnes, C.G. (Eds.),Geological studies in the Klamath Mountains Province, California and Oregon. . TheGeological Society of America Special Paper 410. Geological Society of America,Boulder.
Spötl, C., Mangini, A., 2002. Stalagmite from the Austrian Alps reveals Dansgaard–Oeschger events during isotope stage 3: implications for the absolute chronology ofGreenland ice cores. Earth Planet. Sci. Lett. 203, 507–518.
Spötl, C., Mangini, A., Frank, N., Eichstadter, R., Burns, S., 2002. Start of the lastinterglacial period at 135 ka: evidence from a high Alpine speleothem. Geology 30,815–818.
Stirling, C.H., Esat, T.M., Lambeck, K., McCulloch, M.T., 1998. Timing and duration of theLast Interglacial: evidence for a restricted interval of widespread coral reef growth.Earth Planet. Sci. Lett. 160, 745–762.
Taylor, G.H., Hannan, C., 1999. The Climate of Oregon: From Rain Forest to Desert.Oregon State University Press, Corvallis.
Thompson, S.L., Pollard, D., 1995. A global climate model (GENESIS) with a land-surface-transfer scheme (LSX). Part 1: Present-day climate. J. Climate 8, 732–761.
Thompson, P., Schwarcz, H.P., Ford, D.C., 1974. Continental Pleistocene climaticvariations from speleothem age and isotopic data. Science 184, 893–895.
Thompson, R.S., Whitlock, C., Bartlein, P.J., Harrison, S.P., Spaulding, W.G., 1993. Climaticchanges in the western United States since 18,000 yr B.P. In: Wright, H.E.J.,Kutzbach, J.E., Webb, T.I., Ruddiman, W.F., Street-Perrott, F.A., Bartlein, P.J. (Eds.),Global Climates Since the Last Glacial Maximum. University of Minnesota Press,Minneapolis.
Turgeon, S., Lundberg, J., 2001. Chronology of discontinuities and petrology ofspeleothems as paleoclimatic indicators of the Klamath Mountains, SouthwestOregon, USA. Carbonates and Evaporites 16, 153–167.
Turgeon, S.C., Lundberg, J., 2004. Establishing a speleothem chronology for southwesternOregon— climatic controls and growth modeling. In: Sasowsky, I.D., Mylroie, J. (Eds.),Studies of Cave Sediments. Physical and Chemical Records of Paleoclimate. Kluwer,New York.
Vacco, D.A., Clark, P.U., Mix, A.C., Cheng, H., Edwards, R.L., 2005. A speleothem record ofYounger Dryas cooling, Klamath Mountains, Oregon, USA. Quat. Res. 64, 249–256.
Washburn, A.L., 1980. Geocryology. A Survey of Periglacial Processes and Environments.John Wiley & Sons, New York. 406 pp.
White, W.B., 1988. Geomorphology and Hydrology of Karst Terrains. Oxford UniversityPress, New York.
Whitlock, C., Bartlein, P.J., 1997. Vegetation and climate change in northwest Americaduring the past 125 kyr. Nature 388, 57–61.
325V. Ersek et al. / Earth and Planetary Science Letters 279 (2009) 316–325