author's personal copy - ucla engineering
TRANSCRIPT

Author's personal copy
Electrochimica Acta 64 (2012) 130– 139
Contents lists available at SciVerse ScienceDirect
Electrochimica Acta
j ourna l ho me pag e: www.elsev ier .com/ locate /e lec tac ta
Physical interpretation of cyclic voltammetry for measuring electric doublelayer capacitances
Hainan Wang, Laurent Pilon ∗
University of California, Los Angeles, Henry Samueli School of Engineering and Applied Science, Mechanical and Aerospace Engineering Department, 420 Westwood Plaza,Los Angeles, CA 90095, USA
a r t i c l e i n f o
Article history:Received 29 October 2011Received in revised form28 December 2011Accepted 29 December 2011Available online 8 January 2012
Keywords:Cyclic voltammetryElectric double layerElectrochemical capacitorElectric double layer capacitorModified Poisson–Nernst–Planck modelDimensional analysis
a b s t r a c t
This paper aims to develop a model for simulating the electric double layer dynamics in CV measurementswhile simultaneously accounting for transport phenomena in both the electrode and the electrolyte. Italso aims (i) to identify the dimensionless parameters that govern the CV measurements, (ii) to providea physical interpretation of the shape of CV curves, and (iii) to investigate the effect of the electrode elec-trical conductivity on the predicted double layer capacitance. The transient double layer dynamics wassimulated using the modified Poisson–Nernst–Planck (MPNP) model with a Stern layer and accountingfor the presence of the electrode. A dimensional analysis was performed and four dimensionless numbersgoverning the CV measurements were identified. This study established that the hump in CV curves forelectrodes with large radius of curvature was due to the saturation of ion concentration near the electrodesurface before reaching the maximum potential. It also demonstrates that CV curves became symmetricfor large ion diffusion coefficient due to rapid ion transport. This study confirmed that the EDL capaci-tance retrieved from CV measurements is constant for low scan rates and corresponds to the capacitanceunder equilibrium conditions. Larger ion diffusion coefficient and electrode electrical conductivity led tolarger EDL capacitance at large scan rates corresponding to better charging performance.
© 2012 Elsevier Ltd. All rights reserved.
1. Introduction
Cyclic voltammetry (CV) is a powerful tool in the field of elec-trochemistry [1,2]. It has been used extensively to characterize theperformance of various electrical energy storage devices such aselectrochemical capacitors (also known as supercapacitors) [3–5],batteries [6,7], and fuel cells [8,9]. In these applications, the chargedelectrodes are typically immersed in the electrolyte solution. Elec-tric double layers form at the electrode/electrolyte interfaces whichare accessible to ions present in the electrolyte. Fig. 1 shows aschematic of the electric double layer structure forming near thesurface of an anode. Solvated cations of diameter a migrate andadsorb to the electrode surface due to electrostatic forces [1,10–12].The Stern layer is defined as the compact layer of immobile ionsstrongly adsorbed to the electrode surface [1,10–12]. Note thatthere are no free charges within the Stern layer [1,10,11]. Beyondthe Stern layer is the so-called diffuse layer where ions are mobileunder the coupled influence of electrostatic forces and diffusion[1,10–12]. Fig. 1b shows the electric circuit representation of an
∗ Corresponding author. Tel.: +1 310 206 5598; fax: +1 310 206 2302.E-mail address: [email protected] (L. Pilon).
electric double layer capacitance including the electrode resistance,the Stern layer and diffuse layer capacitances in series [1,3,10,12].
CV measurements consist of imposing an electric potential atthe electrodes which varies periodically and linearly with time[1,2]. The resulting electric current is recorded. The total chargeaccumulated at the electrode surface can be found by integrat-ing the electric current with respect to time [3,13–16]. Then, thecapacitance can be estimated as the total charge divided by the“potential window” [3,14–17]. Capacitance is typically measuredat different scan rates to characterize the performance of energystorage devices such as electric double layer capacitors (EDLCs)[3–5,13–17]. The capacitance measured at low scan rates is maxi-mum and close to the capacitance under equilibrium conditions.
Moreover, the shape of CV curves has been used extensivelyto deduce the electrochemical processes involved in the chargingand discharging of EDLCs [18–22]. For example, the current ini-tially increases when charging EDLCs from zero potential. Then,it decreases upon further increase in the electric potential. Thus,a “hump” is typically observed in the CV curves. Different inter-pretations have been proposed in the literature to explain thisobservation. For example, Pell et al. [23] investigated the effectof the electrolyte concentration on the charging/discharging ofEDLCs. The electrode was carbon foil formed using carbon powderswhile the electrolyte was tetraethylammonium tetrafluoroborate
0013-4686/$ – see front matter © 2012 Elsevier Ltd. All rights reserved.doi:10.1016/j.electacta.2011.12.118

Author's personal copy
H. Wang, L. Pilon / Electrochimica Acta 64 (2012) 130– 139 131
Fig. 1. Schematic of (a) the electric double layer structure showing the arrangementof solvated anions and cations near an anode/electrolyte interface and the simulatedcomputational domain consisting of a Stern layer and the diffuse layer and (b) theelectrode resistance along with the Stern and diffuse layer capacitances in series[10,1,3].
(TEATFB) in propylene carbonate with concentration ranging from0.08 to 1 mol/L. The authors observed a hump in CV curves atlow electrolyte concentration of 0.08 mol/L which was absent atlarger ones. Consequently, the authors attributed its reason tothe “electrolyte starvation” due to limited amount of ions at lowconcentrations. The same interpretation was suggested for EDLCswith both aqueous (H2SO4) and organic (TEABF4) electrolytes with1 mol/L concentration [24]. Moreover, the hump was also attributedto redox reactions at the electrode surface [4,25–34] as well as the“difference of diffusion capability between solvated anions and cationsin the electrolyte” [32]. Recently, Mysyk et al. [35,36] experimentallyinvestigated this effect for EDLCs with electrodes made of pitch-derived and viscose-based carbons in both aqueous and organicelectrolytes. The authors systematically measured the CV curvesfor these carbon electrodes featuring different specific surface areaand pore size. They observed the hump for carbon electrodes withsmall pore size in electrolytes with large ion size. Thus, they spec-ulated that the “available active surface becomes fully saturated withions” before reaching the maximum potential. Then, the currentbegan to decrease even as the potential further increased. However,there is still no clear and definitive explanations to this observedphenomenon. In addition, to the best of our knowledge, no stud-ies have attempted to elucidate this question using physics-basednumerical simulations.
This paper aims to develop a model for simulating electric dou-ble layer capacitors by accounting for transport phenomena in boththe electrode and the electrolyte under large potential and withconcentrated electrolyte solutions. It also aims to provide physi-cal interpretations of CV measurements used to determine electricdouble layer capacitance.
2. Background
2.1. Cyclic voltammetry
In CV measurements, the electrode surface potential is imposedto vary periodically and linearly with time as,
s(t) ={ min + vt for 2(n − 1)t0 ≤ t < (2n − 1)t0 (a) max − v [t − (2n − 1)t0] for (2n − 1)t0 ≤ t < 2nt0 (b)
(1)
where v is the scan rate in V/s, n(= 1, 2, 3, . . .) is the cycle number,and t0 = ( max − min)/v is half the cycle period. It represents the
time for the surface potential to vary from its minimum ( min) toits maximum ( max) values or versa vice. Here, � = max − min isreferred to as the “potential window”. The charge per unit surfacearea (or surface charge density) qs accumulated at the electrodesurface during one cycle can be found by integrating the currentdensity js (in A/m2) at the electrode surface with respect to time as[3,13–17,23],
qs = 12
∫ 2nt0
2(n−1)t0
jsdt = 12
∮jsvd (2)
Then, the capacitance per unit surface area (or specific capacitance)can be estimated from CV measurements as [3,14–17],
Cs = qs max − min
(3)
2.2. Numerical simulations of cyclic voltammetry
Numerous studies have simulated CV measurements ofelectric double layers. These simulations were based oneither equivalent RC circuit models [13,37–39] or the classi-cal Poisson–Nernst–Planck (PNP) model [2,40–42]. However, thesemodels suffer from severe limitations. First, the classical RC circuitmodels inherently neglects ion diffusion and non-uniform ionconcentration in the electrolyte [43–46]. These models may not bevalid for EDLCs under large electric potential and electrolyte con-centration [43–47]. Second, the PNP model neglects the finite sizeof ions and treated as point-charges [45,46,48,49]. This assumptionbreaks down when either the electrolyte concentration c∞ or theelectric potential is large [46,48,49]. Therefore, the PNP model isinvalid for practical EDLCs with typical electrolyte concentrationlarger than 1 mol/L and electric potential larger than 1 V. Moreover,the effects of electrodes were typically neglected in simulating CVmeasurements using the PNP model [2,40–42]. However, studieshave demonstrated that the electrode electrical conductivitysignificantly affected the charging performance of EDLCs [50–54].
Efforts have been made in recent literature to account for theeffect of finite ion size in modeling ion transport in concentratedelectrolyte solutions under large electric potential [45,48,49]. Forexample, Kilic et al. [48] derived a modified PNP (MPNP) model validfor binary and symmetric electrolytes under large electrolyte con-centration and electric potential. The authors added an excess termin the expression of the electrochemical potential to account for thefinite ion size [45,48,49]. However, to the best of our knowledge,no studies have simulated CV measurements for electric doublelayers under large electrolyte concentrations and electric poten-tial other than by using RC circuit models [2,13,37–41]. Given thelimitations of the latter, it is important to develop a model thatcan simulate CV measurements under practical conditions andaccount for the presence of the electrode in simulating the charg-ing/discharging of EDLCs. This model will be useful to identify theimportant parameters affecting the performance of EDLCs and toelucidate the electrochemical processes involved.
This paper aims to develop a model for simulating the electricdouble layer dynamics in CV measurements while simultaneouslyaccounting for transport phenomena in both the electrode and theelectrolyte. It also aims (i) to identify the dimensionless parame-ters that govern the CV measurements, (ii) to provide a physicalinterpretation of the shape of CV curves, and (iii) to investigatethe effect of the electrode electrical conductivity on the predicteddouble layer capacitance. The dynamics of the electric double layerforming near a planar electrode in aqueous electrolyte solutionsduring CV measurements was simulated as a function of scan rate.A modified PNP model with a Stern layer [45,46,48,49] was usedwhile simultaneously accounting for the electrode. The results were

Author's personal copy
132 H. Wang, L. Pilon / Electrochimica Acta 64 (2012) 130– 139
compared with analytical expressions for the capacitances underequilibrium conditions.
3. Analysis
3.1. Schematics and assumptions
Fig. 1 shows the schematic of the computational domain usedto simulate a planar electrode of thickness Le immersed in an elec-trolyte solution. The region of electrolyte solution consists of twolayers corresponding to (1) a Stern layer of thickness H near theelectrode surface and (2) a diffuse layer beyond. A time-dependentelectric potential s(t) was prescribed at the electrode surface(x = − Le) and was zero far away from the electrode surface (x = Li).The electrode thickness Le and the length of the electrolyte domainLiwere specified to be Le = 0 or 100 nm and Li = 80 nm, respectively.Here, the length Li corresponded to half of the distance betweenthe anode and the cathode. Both the electric potential and the elec-trolyte concentration remained unchanged at the middle plane(x = Li) when Li was much larger than the double layer thickness[43,55–57]. Thus, it sufficed to simulate only half of the domain byimposing zero electric potential and bulk electrolyte concentrationc∞ at x = Li. In addition, the electric double layer thickness decreaseswith increasing electrolyte concentration [1,10–12,48,49]. Increas-ing the value of Li by a factor of two was found to have no effect(i) on the predicted specific capacitance under equilibrium condi-tions and (ii) on the capacitance Cs and js versus s curves retrievedfrom CV simulations at low scan rates defined by Eqs. (3) and (12),respectively. However, the values of Cs predicted at large scan rateswere found to decrease with increasing Li. In addition, the js versus s curves predicted at large scan rates became more asymmetricas Li increased as discussed in Section 4.4. These can be attributedto the fact that the charge storage took longer as it could not followthe fast variation in the electric potential under large scan rateswhen the electrolyte domain length Li increased [43,46,55].
To make the problem mathematically tractable, the followingassumptions were made: (1) anions and cations had the same effec-tive diameter and diffusion coefficient which were assumed to beconstant and independent of electrolyte concentration [48,49,58],(2) the electrolyte dielectric permittivity was constant and equalsto that of water, (3) isothermal conditions prevailed through-out the electrode and electrolyte, (4) advection of the electrolytewas assumed to be negligible, (5) the ions could only accumulateat the electrode surface and could not diffuse into the elec-trode, i.e., there was no ion insertion, and (6) the specific ionadsorption due to non-electrostatic forces were assumed to benegligible.
3.2. Dimensional analysis and formulation
The local electric potential (x, t) in the electrode was governedby the Poisson equation [59–65]. In the absence of the electric cur-rent caused by redox reactions [assumption (5)], it is expressed as[61–65],
∂∂x
(�e∂ ∂x
)= 0 for − Le ≤ x < 0 (4)
where �e is the electrical conductivity of the electrode materialexpressed in S/m. Moreover, the local electric potential (x, t) andion concentrations ci(x, t) at time t and location x in the electrolytesolution were computed by solving the MPNP model with a Sternlayer for large electrolyte concentration [45,46,48,49]. For binaryand symmetric electrolytes, the valency is such that z1 = − z2 = zand the bulk ion concentration is given by c1∞ = c2∞ = c∞. Then,
assuming identical diffusion coefficient D1 = D2 = D, the MPNPmodel with Stern layer can be written as [45,46,48,49],
∂
∂x
(�0�r
∂
∂x
)=
{0 for 0 ≤ x < H (a)eNAz(c1 − c2) for x ≥ H (b)
∂ci∂t
= ∂
∂x
(D∂ci∂x
+ ziD
RuTFci∂
∂x+ �Dci
2c∞ − �(c1 + c2)∂(c1 + c2)
∂x
)for x ≥ H (c)
(5)
where ci(x, t) is the local molar concentration of ion species “i” (i = 1,2) while �0 and �r are the free space permittivity (�0 = 8.854 × 10⁻¹²
F/m) and the relative permittivity of the electrolyte solution,respectively. The absolute temperature is denoted by T, e is the ele-mentary charge (e = 1.602 × 10⁻¹⁹ C), NA is the Avogadro’s number(NA = 6.022 × 10²³ mol−1) while F and Ru are the Faraday con-stant (F = eNA sA/mol) and the universal gas constant (Ru = 8.314JK−1mol−1), respectively. The packing parameter is defined as� = 2a3NAc∞ where a is the effective ion diameter. It represents theratio of the total bulk ion concentration to the maximum ion con-centration cm = 1/NAa3 assuming a simple cubic packing [45,49,66].Therefore, � should not be larger than unity for the model to bephysically acceptable [45,49,66]. Eqs. (5b) and (5c) reduce to theclassical Poisson–Nernst–Planck model when � = 0 [45,48,49]. Notethat in Refs. [45,48,49], the Stern layer was accounted for via aboundary condition relating the potential drop across the Sternlayer and the potential gradient at the Stern/diffuse layer interface.Here, the electric potential in the Stern layer was solved explicitly.In fact, these two approaches are equivalent for planar electrodes[45,46,48,67].
Moreover, the surface electric potential s(t) expressed by Eq.(1) was imposed, i.e.,
= s(t), at x = −Le (6a)
The electric potential and current density were continuous acrossthe electrode/electrolyte interface located at x = 0 nm so that [68],
|x=0− = |x=0+ and − �e∂ ∂x
∣∣x=0− = −�0�r
∂2
∂x∂t
∣∣x=0+ (6b)
Similarly, the electric potential and displacement were continuousacross the Stern/diffuse layer interface located at x = H [10,69,46],
∣∣x=H− =
∣∣x=H+ and �0�r
∂ ∂x
∣∣x=H− = �0�r
∂ ∂x
∣∣x=H+ , (6c)
In addition, the mass flux vanishes for both ion species at the elec-trode surface since there is no ion insertion [assumption (5)] planarelectrodes [45,46,48,49],
D∂ci∂x
+ ziD
RuTFci∂ ∂x
+ �Dci2c∞ − �(c1 + c2)
∂(c1 + c2)∂x
= 0, at x = H
(6d)
Far away from the electrode surface, the electric potential and ionconcentration are such that,
(x = Li, t) = 0 and ci(x = Li, t) = c∞, (6e)
Finally, the initial conditions are given by,
(x, t = 0) = 0 and ci(x, t = 0) = c∞, for 0 ≤ x ≤ Li (6f)
Note that, when Le = 0 nm, Eqs. (4)–(6) correspond to simulationswithout accounting for the presence of the electrode.
The following scaling parameters were introduced to make theformulation dimensionless,
∗ =
max − min, x∗ = x
Li, t∗ = tD
L2i
, c∗i
= cic∞, j∗s = js
2zeNADc∞/Li(7)

Author's personal copy
H. Wang, L. Pilon / Electrochimica Acta 64 (2012) 130– 139 133
Then, the governing Eqs. (4)–(6) were transformed into dimension-less form as,
∂2 ∗
∂x∗2= 0 for − Le/Li ≤ x∗ < 0 (a)
RuT/zF
max − min
(�DLi
)2∂
2 ∗
∂x∗2=
{0 for 0 ≤ x∗ < H/Li (b)12
(c∗1 − c∗
2) for x∗ ≥ H/Li (c)
∂c∗i
∂t∗= ∂
∂x∗
(∂c∗i
∂x∗ + RuT/zF
max − minsgn(zi)ci
∂ ∗
∂x∗ +�c∗i
2 − �(c∗1 + c∗
2)
∂(c∗1 + c∗
2)
∂x∗
)for x∗ ≥ H/Li (d)
(8)
The associated dimensionless boundary and initial conditions [Eqs.(6)] became,
∗(t∗) = �3t∗, at x∗ = −Le/Li (9a)
∗∣∣x∗=0− = ∗
∣∣x∗=0+ and
�e( max − min)/Le2zeNADc∞/Li
LeLi
∂ ∗
∂x∗
∣∣x∗=0− = max − min
RuT/zF
(�DLi
)2∂
2 ∗
∂x∗∂t∗
∣∣x∗=0+
(9b)
∗∣∣x∗=(H/Li )
− = ∗∣∣x∗=(H/Li )
+ and∂ ∗
∂x∗
∣∣x∗=(H/Li )
− = ∂ ∗
∂x∗
∣∣x∗=(H/Li )
+ , (9c)
∂c∗i
∂x∗ + RuT/zF
max − minsgn(zi)ci
∂ ∗
∂x∗ +�c∗i
2 − �(c∗1 + c∗
2)
∂(c∗1 + c∗
2)
∂x∗ , at x∗ = H/Li (9d)
∗(x∗ = 1, t∗) = 0 and c∗i (x∗ = 1, t∗) = 1, (9e)
∗(x∗, t∗ = 0) = 0 and c∗i (x∗, t∗ = 0) = 1, for 0 ≤ x∗ ≤ 1 (9f)
Here, four key dimensionless numbers were identified in Eqs. (8)and (9) as
�1 = RuT/zF
max − min, �2 = �D
Li, �3 = vL2
i/D
max − min, and
�4 = �e( max − min)/Le2zeNADc∞/Li
(10)
where �1 represents the ratio of thermal potential (RuT/zF) and thepotential window in CV measurements. The dimensionless num-ber �2 = �D/Li is the ratio of Debye length and the thickness ofelectrolyte layer while �3 is the dimensionless scan rate. Here,the Debye length for symmetric electrolytes is defined as �D =(�0�rRuT/2e2z2N2
Ac∞)1/2 [1,10–12]. The dimensionless number �4represents the ratio of the characteristic current densities in theelectrode and in the electrolyte.
Note that the thermal voltage RuT/F can also be used as a char-acteristic potential in the electric double layers. This has beendone frequently to scale the electric potential in the electrolyte[43–45,48,49,57,66]. However, RuT/F is not a characteristic poten-tial in the electrodes since the governing equation for the electricpotential [Eq. (4)] is independent of temperature. By contrast,the potential window ( max − min) is a realistic and importantparameter in the CV measurements and thus was used as the char-acteristic potential in the present study. It is interesting to notethat when RuT/F is used to scale the electric potential, the asso-ciated set of dimensionless numbers, denoted by �1
′ to �4′, is a
combination of �1 to �4 given by Eq. (10), namely, �1′ = 1/�1,
�2′ = �2, �3
′ = �3/�1, and �4′ = �1�4. Thus, both approaches
are consistent with one another and lead to the same dimensionlessnumbers.
3.3. Constitutive relations
In order to solve Eqs. (8) and (9), the electrode conductivity�e and electrolyte properties �r, z, c∞, a and D along with thetemperature T and the surface potential s(t) are needed. The elec-trical conductivity of activated carbons is on the order of 10−6
to 102 S/m [50,53]. Here, the electrode electrical conductivity wastaken as �e = 10 or 0.01 S/m. The present study focuses on aque-ous electrolyte solution at room temperature so that T = 298 K with
�r = 78.5 [70]. The effective ion diameter and diffusion coefficientwere taken as a = 0.66 nm [58] and D = 2 × 10⁻⁹ m2/s [70], respec-tively, while the valency was z = 1. These values correspond tosolvated ions such as K+ and Cl− in aqueous solutions [58,70]. Theelectrolyte concentration was chosen as c∞ = 1.0 mol/L correspond-ing to typical values in actual EDLCs. In addition, the Stern layerthickness H was approximated as the radius of solvated ions, i.e.,H = a/2 = 0.33 nm [1,11,12]. Moreover, in the surface electric poten-tial s(t) [Eq. (1)], max was varied from 0.3 to 0.5 V while min = 0.0V. The case of max = 0.5 V corresponds to a typical potential differ-ence of 1.0 V between the anode and the cathode typical of aqueousEDLCs.
Finally, a parametric study was carried out for scan rate v rang-ing from 102 to 109 V/s to explore the limiting behaviors of electricdouble layers. These scan rates were several orders of magnitudelarger than those encountered in CV measurements of actual EDLCswith mesoporous electrodes which typically range from 0.001 to200 V/s [5,18–22]. The difference was due to (i) the small electrodethickness Le and the small electrical resistance of planar electrodescompared with that of mesoporous electrodes and (ii) the smallelectrolyte thickness Li and thus the small ionic resistance [Eq.(14)] compared with that in actual EDLCs. A parametric study wasalso carried out for other values of diffusion coefficient, namely,D = 2 × 10⁻¹⁰ to 2 × 10⁻⁷ m2/s.
3.4. Method of solution and data processing
The models were solved using the commercial finite elementsolver COMSOL 4.1. The capacitance under equilibrium conditionsand the capacitance retrieved from CV simulations were computedas follows.
3.4.1. Capacitance under equilibrium conditionsThe capacitance under equilibrium conditions corresponds to
the time-independent surface potential, i.e., s(t) = max. Then, theStern and diffuse layer specific capacitances CSts and CDs are definedby dividing the surface charge density [11,60] qs(x) = �0�rE(x) bytheir respective potential difference [1,67,69]. Here, E(x) =|− d /dx|is the norm of the local electric field. The capacitances CSts and CDsof planar electrodes assuming constant electrolyte properties andaccounting for the finite ion size are given by [1,49,66,67,69],
CSts = �0�rH
(11a)
CDs = 2zeNAc∞�D D
√2�
log
[1 + 2� sinh2
(ze D2kBT
)](11b)
where D = (H) is the electric potential computed at the Sternlayer/diffuse layer interface x = H. Here, it was obtained by solvingthe steady-state equilibrium modified Poisson–Boltzmann (MPB)model at surface potential dc and electrolyte concentration c∞[48,49,66,67]. Then, the total specific capacitance Cs under equi-librium conditions was calculated using the series formula as[1,67,69],
1Cs
= 1
CSts+ 1CDs
(12)
Numerical convergence study was performed as discussed in Refs.[46,67]. The maximum mesh size was specified to be 0.01 nm at theelectrode surface and 1 nm in the rest of the domain.
3.4.2. Simulating CV measurementsCV measurements were simulated by numerically imposing the
periodic surface electric potential given by Eq. (1). The dimension-less governing Eqs. (8) were solved along with the boundary and
Author's personal copy
134 H. Wang, L. Pilon / Electrochimica Acta 64 (2012) 130– 139
initial conditions given by Eqs. (9). The corresponding transientsurface current density was estimated as [57,59,60,71–76],
j∗s (t∗) = �4
LeLi
∂ ∗
∂x∗∣∣x∗=0− = �1
(�DLi
)2 ∂2 ∗
∂x∗∂t∗∣∣x∗=0+ (13)
Simulations of CV measurements were run for at least 5 periods(i.e., t ≥ 10t0) to ensure the current density had reached its station-ary and periodic states. Then, the surface charge density qs(t) wasestimated by Eq. (2) and the specific capacitance Cs was computedusing Eq. (3). The numerical convergence criterion was definedsuch that the maximum relative difference in the retrieved valueof Cs was less than 1% when (1) reducing the mesh size by a fac-tor five, (2) dividing the time step by five, and (3) running theCV simulations for 5 more periods. The time step was imposed tobe �t ≈ t0/1000 = ( max − min)/1000v. Note that this time stepdecreased with increasing scan rate v and was several orders ofmagnitude smaller than the characteristic time for diffusion L2
i/D.
In addition, further reduction in the time step below the Debyerelaxation time �2
D/D was also found to have no effect on the pre-dicted values of js and Cs. The mesh size was the smallest at theelectrode surface due to large potential gradient and then graduallyincreased. The maximum mesh size was specified to be 0.001 nm atthe electrode surface and 1 nm in the rest of the domain. The totalnumber of finite elements was less than 400 for all cases simulatedin the present study.
3.4.3. ValidationThe numerical tool was validated based on three equilibrium
and transient cases reported in the literature. First, the equilibriumelectric potential profile in the diffuse layer predicted by solving theMPB model was validated against the exact solution for planar elec-trodes [10,11,69] with �r = 78.5, c∞ = 0.01 and 0.001 mol/L, � = 0, and D = 0.1 V. Second, the computed specific capacitances for the Sternand diffuse layers obtained from the MPB model were validatedagainst Eqs. (11a) and (11b) for (i) s = 0.1 V, c∞ = 0.01 mol/L, anda = 0.66 nm as well as (ii) s = 0.5 V, c∞ = 1 mol/L, and a = 0.66 nm.Third, the transient ion concentration and electric potential pro-files predicted by solving the PNP and MPNP models with constantsurface potential were compared with the numerical solutionsfor planar electrodes reported in Ref. [48]. Comparison was madeagainst the reported values of ci(x, t) and (x, t) for a wide range ofpacking parameter � and dimensionless potential (zF D/RuT) [48].Good agreement was obtained between our results and reportedvalues for all cases considered.
4. Results and discussion
4.1. Dimensional analysis
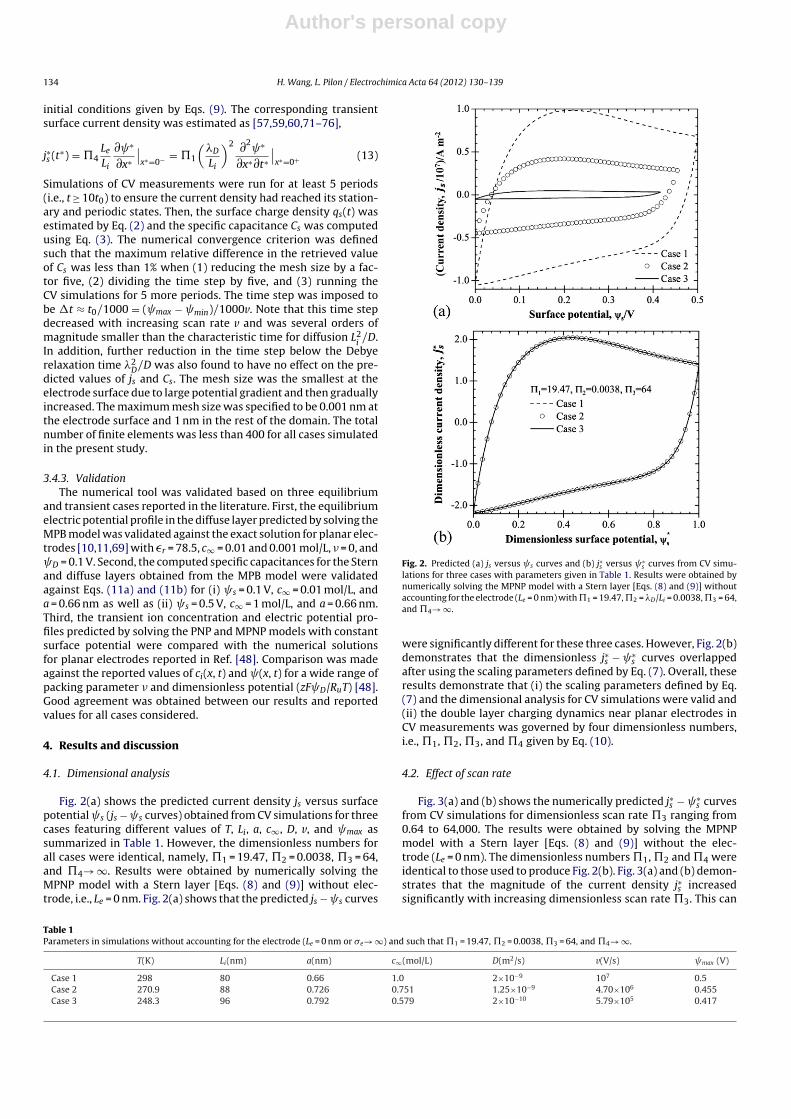
Fig. 2(a) shows the predicted current density js versus surfacepotential s (js − s curves) obtained from CV simulations for threecases featuring different values of T, Li, a, c∞, D, v, and max assummarized in Table 1. However, the dimensionless numbers forall cases were identical, namely, �1 = 19.47, �2 = 0.0038, �3 = 64,and �4→ ∞. Results were obtained by numerically solving theMPNP model with a Stern layer [Eqs. (8) and (9)] without elec-trode, i.e., Le = 0 nm. Fig. 2(a) shows that the predicted js − s curves
Fig. 2. Predicted (a) js versus s curves and (b) j∗s versus ∗s curves from CV simu-
lations for three cases with parameters given in Table 1. Results were obtained bynumerically solving the MPNP model with a Stern layer [Eqs. (8) and (9)] withoutaccounting for the electrode (Le = 0 nm) with �1 = 19.47, �2 = �D/Li = 0.0038, �3 = 64,and �4→ ∞.
were significantly different for these three cases. However, Fig. 2(b)demonstrates that the dimensionless j∗s − ∗
s curves overlappedafter using the scaling parameters defined by Eq. (7). Overall, theseresults demonstrate that (i) the scaling parameters defined by Eq.(7) and the dimensional analysis for CV simulations were valid and(ii) the double layer charging dynamics near planar electrodes inCV measurements was governed by four dimensionless numbers,i.e., �1, �2, �3, and �4 given by Eq. (10).
4.2. Effect of scan rate
Fig. 3(a) and (b) shows the numerically predicted j∗s − ∗s curves
from CV simulations for dimensionless scan rate �3 ranging from0.64 to 64,000. The results were obtained by solving the MPNPmodel with a Stern layer [Eqs. (8) and (9)] without the elec-trode (Le = 0 nm). The dimensionless numbers �1, �2 and �4 wereidentical to those used to produce Fig. 2(b). Fig. 3(a) and (b) demon-strates that the magnitude of the current density j∗s increasedsignificantly with increasing dimensionless scan rate �3. This can
Table 1Parameters in simulations without accounting for the electrode (Le = 0 nm or �e→ ∞) and such that �1 = 19.47, �2 = 0.0038, �3 = 64, and �4→ ∞.
T(K) Li(nm) a(nm) c∞(mol/L) D(m2/s) v(V/s) max (V)
Case 1 298 80 0.66 1.0 2×10⁻⁹ 107 0.5Case 2 270.9 88 0.726 0.751 1.25×10⁻⁹ 4.70×10⁶ 0.455Case 3 248.3 96 0.792 0.579 2×10⁻¹⁰ 5.79×10⁵ 0.417

Author's personal copy
H. Wang, L. Pilon / Electrochimica Acta 64 (2012) 130– 139 135
Fig. 3. Predicted j∗s versus ∗s curves from CV simulations for dimensionless scan rate
ranging from (a) �3 = 0.64 − 64 and (b) �3 = 640 − 64000. Results were obtained bynumerically solving the MPNP model with a Stern layer [Eqs. (8) and (9)] withoutaccounting for the electrode (Le = 0 nm) with �1 = 19.47, �2 = 0.0038, and �4→ ∞.
be attributed to the fact that a fast change in the surface potentialresulted in a large local electric field and thus a large current den-sity according to Eq. (13). In addition, a “hump” was observed inthe j∗s − ∗
s curve for �3 = 64 shown in Fig. 3(a). The hump disap-peared when further increasing �3 and the j∗s − ∗
s curve became“leaf-like” for �3 = 640 as shown in Fig. 3(b). This is typical of EDLCsat large scan rates corresponding to large resistance to ionic cur-rent [4,5,30,34,77]. These trends are similar to those experimentallyobserved for EDLCs made of porous carbons [4,5,30,34,77]. More-over, the predicted j∗s became nearly linearly proportional to theimposed surface potential ∗
s for �3 > 6400. In these cases, theelectric double layer behaved as a pure resistor [4].
Fig. 4 shows the slope of the js − s curves as a function of dimen-sionless scan rate �3 ranging from 640 to 6.4 × 10⁶. The model andother parameters were identical to those used to produce Fig. 3(b).It is evident that the slope of js − s curves increased with increas-ing �3 and gradually reached a constant plateau for �3 ≥ 6400. Itis interesting to note that this plateau corresponds to the conduc-tance of an electrolyte solution with ionic conductivity �i (in S/m)and thickness Li given by [72,73,78,79],
S = �iLi
= 1Li
F2
RuT
2∑i=1
z2i Dici∞ (14)
This result confirms that the predicted electrolyte ionic conductiv-ity was indeed equal to the theoretical value when ignoring theelectrode contribution to the resistance.
Fig. 4. Slope of the predicted js versus s curves from CV simulations as a function ofdimensionless scan rate �3. Results were obtained by numerically solving the MPNPmodel with a Stern layer [Eqs. (8) and (9)] without accounting for the electrode(Le = 0 nm) with �1 = 19.47, �2 = 0.0038, and �4→ ∞.
4.3. Effect of diffusion coefficient
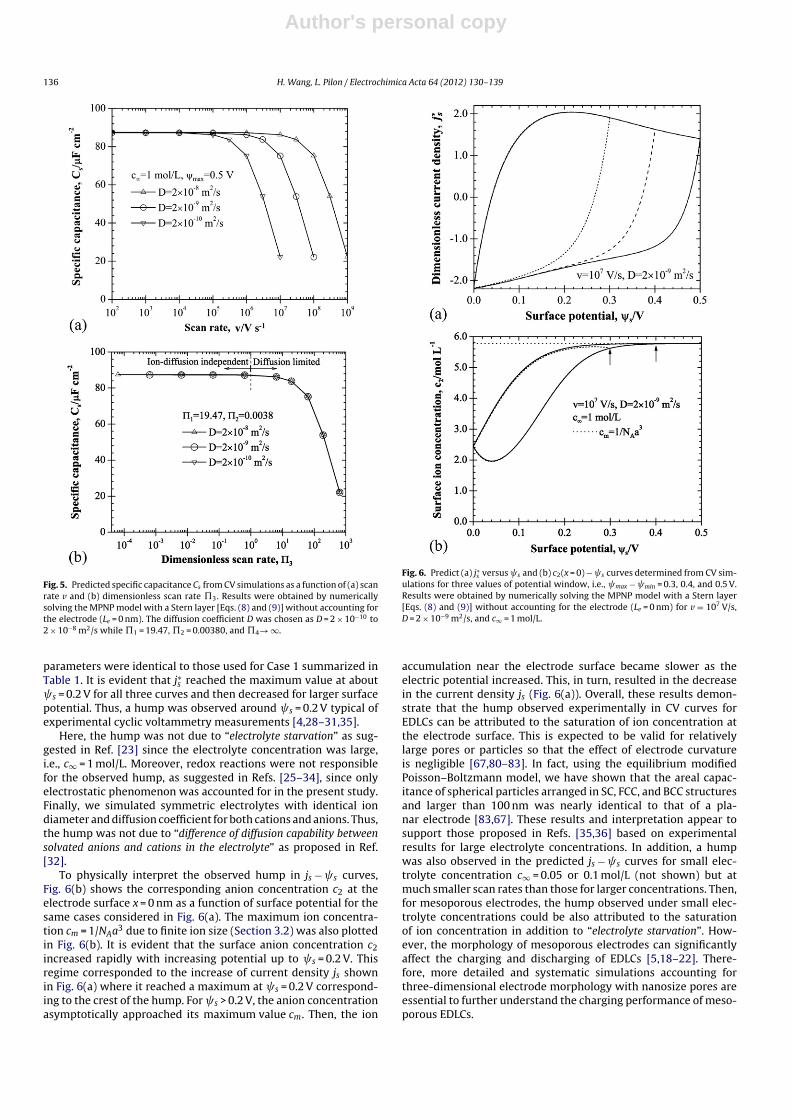
Fig. 5(a) shows the specific capacitance Cs retrieved from CVsimulations using Eq. (3) as a function of scan rate v ranging from102 to 109 V/s. Three values of ion diffusion coefficient were used,i.e., D = 2 × 10⁻¹⁰, 2 × 10⁻⁹, or 2 × 10⁻⁸ m2/s. The model and otherparameters were identical to those used in Case 1 and summa-rized in Table 1. Fig. 5(a) demonstrates that Cs was constant andindependent of diffusion coefficient D for scan rate v smaller thana critical value and decreased rapidly beyond. This critical scanrate increased with increasing ion diffusion coefficient. For scanrates larger than a critical value, ion diffusion becomes a limitingfactor in charge storage. Note that the scan rate v in CV measure-ments on mesoporous EDLCs typically ranged from 10−3 to 200 V/s[5,30,34,77]. The scan rate for planar electrodes considered herewas larger due to the small electrical resistance compared withthat of mesoporous electrodes.
Fig. 5(b) shows the specific capacitance Cs shown in Fig. 5(a) butplotted as a function of dimensionless scan rate �3. It is evidentthat all the curves now collapsed on a single line for the three dif-ferent values of diffusion coefficient. Moreover, two regimes can beidentified in Fig. 5(b). First, for �3 < 1, ion transport is fast enough tofollow the variation in the electric potential s(t) and the retrievedspecific capacitance Cs is independent of scan rate and ion diffu-sion. In these cases, Cs was equal to Cs = 87.5 �F/cm2. This value wasidentical to the specific capacitance under equilibrium conditionspredicted by Eqs. (11) and (12). Second, for �3 > 1, ion diffusion wasthe limiting phenomenon for charge storage and Cs decreased withincreasing scan rate. Note that similar behavior was also observedin simulating double layer charging dynamics for electrochemicalimpedance spectroscopy (EIS) in our previous study [46]. However,unlike CV simulations, the capacitance retrieved from EIS predic-tions did not match the capacitance under equilibrium conditionseven at small frequencies [46]. This suggests that CV measure-ments should be preferred to EIS when measuring the capacitanceof EDLCs.
4.4. Interpretation of the hump in CV curves
Fig. 6(a) shows the predicted j∗s − s curves from CV simula-tions for three values of potential window, i.e., � = 0.3, 0.4, and0.5 V. Results were obtained by solving the MPNP model with aStern layer [Eqs. (8) and (9)] without the electrode (Le = 0 nm). Other
Author's personal copy
136 H. Wang, L. Pilon / Electrochimica Acta 64 (2012) 130– 139
Fig. 5. Predicted specific capacitance Cs from CV simulations as a function of (a) scanrate v and (b) dimensionless scan rate �3. Results were obtained by numericallysolving the MPNP model with a Stern layer [Eqs. (8) and (9)] without accounting forthe electrode (Le = 0 nm). The diffusion coefficient D was chosen as D = 2 × 10⁻¹⁰ to2 × 10−8 m2/s while �1 = 19.47, �2 = 0.00380, and �4→ ∞.
parameters were identical to those used for Case 1 summarized inTable 1. It is evident that j∗s reached the maximum value at about s = 0.2 V for all three curves and then decreased for larger surfacepotential. Thus, a hump was observed around s = 0.2 V typical ofexperimental cyclic voltammetry measurements [4,28–31,35].
Here, the hump was not due to “electrolyte starvation” as sug-gested in Ref. [23] since the electrolyte concentration was large,i.e., c∞ = 1 mol/L. Moreover, redox reactions were not responsiblefor the observed hump, as suggested in Refs. [25–34], since onlyelectrostatic phenomenon was accounted for in the present study.Finally, we simulated symmetric electrolytes with identical iondiameter and diffusion coefficient for both cations and anions. Thus,the hump was not due to “difference of diffusion capability betweensolvated anions and cations in the electrolyte” as proposed in Ref.[32].
To physically interpret the observed hump in js − s curves,Fig. 6(b) shows the corresponding anion concentration c2 at theelectrode surface x = 0 nm as a function of surface potential for thesame cases considered in Fig. 6(a). The maximum ion concentra-tion cm = 1/NAa3 due to finite ion size (Section 3.2) was also plottedin Fig. 6(b). It is evident that the surface anion concentration c2increased rapidly with increasing potential up to s = 0.2 V. Thisregime corresponded to the increase of current density js shownin Fig. 6(a) where it reached a maximum at s = 0.2 V correspond-ing to the crest of the hump. For s > 0.2 V, the anion concentrationasymptotically approached its maximum value cm. Then, the ion
Fig. 6. Predict (a) j∗s versus s and (b) c2(x = 0) − s curves determined from CV sim-ulations for three values of potential window, i.e., max − min = 0.3, 0.4, and 0.5 V.Results were obtained by numerically solving the MPNP model with a Stern layer[Eqs. (8) and (9)] without accounting for the electrode (Le = 0 nm) for v = 107 V/s,D = 2 × 10⁻⁹ m2/s, and c∞ = 1 mol/L.
accumulation near the electrode surface became slower as theelectric potential increased. This, in turn, resulted in the decreasein the current density js (Fig. 6(a)). Overall, these results demon-strate that the hump observed experimentally in CV curves forEDLCs can be attributed to the saturation of ion concentration atthe electrode surface. This is expected to be valid for relativelylarge pores or particles so that the effect of electrode curvatureis negligible [67,80–83]. In fact, using the equilibrium modifiedPoisson–Boltzmann model, we have shown that the areal capac-itance of spherical particles arranged in SC, FCC, and BCC structuresand larger than 100 nm was nearly identical to that of a pla-nar electrode [83,67]. These results and interpretation appear tosupport those proposed in Refs. [35,36] based on experimentalresults for large electrolyte concentrations. In addition, a humpwas also observed in the predicted js − s curves for small elec-trolyte concentration c∞ = 0.05 or 0.1 mol/L (not shown) but atmuch smaller scan rates than those for larger concentrations. Then,for mesoporous electrodes, the hump observed under small elec-trolyte concentrations could be also attributed to the saturationof ion concentration in addition to “electrolyte starvation”. How-ever, the morphology of mesoporous electrodes can significantlyaffect the charging and discharging of EDLCs [5,18–22]. There-fore, more detailed and systematic simulations accounting forthree-dimensional electrode morphology with nanosize pores areessential to further understand the charging performance of meso-porous EDLCs.

Author's personal copy
H. Wang, L. Pilon / Electrochimica Acta 64 (2012) 130– 139 137
Fig. 7. Plots of (a) js versus s and (b) qs versus dimensionless time t/2t0 predictedfrom CV simulations for three values of ion diffusion coefficient, i.e., D = 2 × 10−9,2 × 10−8, and 2 × 10⁻⁷ m2/s. Results were obtained by numerically solving the MPNPmodel with a Stern layer [Eqs. (8) and (9)] without accounting for the electrode(Le = 0 nm) for v = 107 V/s and c∞ = 1 mol/L.
Finally, Fig. 7(a) shows the js − s curves predicted for three dif-ferent values of ion diffusion coefficient, i.e., D = 2 × 10⁻⁹, 2 × 10⁻⁸,or 2 × 10⁻⁷ m2/s. The potential window was � = 0.5 V. The modeland other parameters were identical to those used to generateFig. 6(a) and (b). Fig. 7(a) shows that the hump was observed inthe js − s curve for small diffusion coefficient D = 2 × 10⁻⁹ m2/s.However, the hump disappeared when increasing the ion diffu-sion coefficient to D = 2 × 10⁻⁸ and 2 × 10⁻⁷ m2/s. In addition, thejs − s curves became nearly symmetric along the line of zero cur-rent density js = 0 A/m2. It is interesting to note that Lin et al. [21,22]observed a similar trend for EDLCs made of TiC-derived carbonswith pore diameter ranging from 0.68 to 1.0 nm in organic elec-trolytes. The authors attributed the symmetry of CV curves to thereduction in “steric hindering” of ions in large pores, i.e., smallerelectrolyte ionic resistance [21,22]. Here, the symmetry in the CVcurves can be attributed to the fact that the ion transport canrespond nearly instantaneously to the variation in electric poten-tial for large ion diffusion coefficient. This, in turn, leads to smallerionic resistance according to Eq. (14).
To justify this interpretation, Fig. 7(b) shows the correspond-ing transient surface charge density qs(t) = �0�rEs(t) as a functionof dimensionless time t/2t0 corresponding to results shown inFig. 7(a). It also shows the imposed surface potential s(t). It isevident that the surface charge density qs(t) responded nearlyinstantaneously to the surface potential s(t) for large diffusioncoefficient D = 2 × 10⁻⁸ and 2 × 10⁻⁷ m2/s. However, there was alag between qs(t) and s(t) for small ion diffusion coefficientD = 2 × 10⁻⁹ m2/s. This confirms that the ion transport was unable
Fig. 8. Slope of the js versus s curves predicted from CV simulations as a functionof dimensionless scan rate �3 for �e→ ∞, �e = 10, and 0.01 S/m, respectively. Resultswere obtained by numerically solving the MPNP model with a Stern layer [Eqs. (8)and (9)] accounting for the electrode with Li = 80 nm and Le = 100 nm.
to follow the fast variation of surface potential for small diffusioncoefficients. In practice, EDLC electrodes are made of mesoporousmaterials. Then, a large effective ion diffusion coefficient wouldbe beneficial for improving the charging performance and powerdensity of EDLCs. Note that decreasing the electrolyte thickness Liwas found to have the same effect on the predicted js − s curves(Fig. 7(a)) and on qs versus t/2t0 curves (Fig. 7(b)) as proportionallyincreasing the ion diffusion coefficient (not shown). Thus, theseresults justified the choices of the characteristic length Li and thecharacteristic time for diffusion L2
i/D [Eq. (7)] in our dimensional
analysis.
4.5. Effect of the electrode
Previous simulations did not account for the electrode.These simulations corresponded to electrode with zero thick-ness Le = 0 nm or infinite electrical conductivity �e→ ∞. If taking�e = 10 S/m and Le = 100 nm, the magnitude of the predicted j∗s wasfound to decrease by a factor 2 (not shown) compared with resultsobtained without electrode (Fig. 3(a)). This was due to the increasein the overall electrical resistance of the system.
Fig. 8 shows the slope of the js − s curves from CV simula-tions as a function of dimensionless scan rate �3 for three caseswith or without electrode, namely, (i) �e→ ∞ S/m (or Le = 0 nm), (ii)�e = 10 S/m and Le = 100 nm, and (iii) �e = 0.01 S/m and Le = 100 nm.Other parameters were identical to those used to generate Fig. 3(a).Results for the limiting case of �e→ ∞ were taken from Fig. 4. Fig. 8demonstrates that the slope of js − s curve was dominated by theelectrode when its conductivity was small (e.g., �e = 0.01 S/m). For arelatively large electrode conductivity (e.g., �e = 10 S/m), the slopecorresponded to the effective conductance of the electrode andelectrolyte in series expressed as (L/�)eff = Li/�i + Le/�e.
Finally, Fig. 9 shows the predicted specific capacitance Cs fromCV simulations as a function of dimensionless scan rate �3 for thethree cases considered in Fig. 8. Here again, the value of Cs retrievedfrom CV curves was constant and equal to Cs = 87.5 �F/cm2 for�3 smaller than a critical value which depended on �e. Then, itwas identical to the specific capacitance under equilibrium con-ditions predicted by Eqs. (11) and (12) and was independent ofthe electrode electrical conductivity �e. Beyond the critical dimen-sionless scan rate �3,cr, predicted values of Cs decreased rapidlywith increasing �3. In addition, �3,cr increased significantly withincreasing electrode electrical conductivity �e. Fig. 9 established

Author's personal copy
138 H. Wang, L. Pilon / Electrochimica Acta 64 (2012) 130– 139
Fig. 9. Predicted specific capacitance from CV simulations as a function of dimen-sionless scan rate �3 for three cases corresponding to �e→ ∞, �e = 10, and 0.01 S/m.Results were obtained by numerically solving the MPNP model with a Stern layer[Eqs. (8) and (9)] accounting for the electrode with Le = 100 nm.
that the electrode electrical conductivity does not affect the dou-ble layer capacitance retrieved from CV measurements at low scanrates. However, it significantly affects the measured capacitance atlarge scan rates which reflects the charging rate performance ofEDLCs.
5. Conclusions
This paper presented numerical simulations of cyclic voltam-metry measurements for determining the electric double layercapacitance near a planar electrode in aqueous electrolyte solu-tions. For the first time, a modified Poisson–Nernst–Planck modelaccounting for the Stern layer was used to simulate the transientdouble layer dynamics under large electrolyte concentration andelectric potential while simultaneously accounting for the elec-trode electrical conductivity. A dimensional analysis was also firstperformed for CV measurements based on the model. The followingconclusions can be drawn:
1. Four dimensionless numbers were identified to govern the elec-tron and ion transport in the charging dynamics of electricdouble layers for planar electrode during CV measurements,namely,
�1 = RuT/zF
max − min, �2 = �D
Li, �3 = vL2/D
max − min,
�4 = �e( max − min)/Le2zeNADc∞/Li
2. For electrodes with large radius of curvature, the hump observedin CV curves was due to the saturation of ion concentration atthe electrode surface as the electric potential increased.
3. The predicted EDL capacitance from CV simulations was constantand equal to the capacitance under equilibrium conditions fordimensionless scan rate �3 < 1.
4. The electrode had no effect on the EDL capacitance measured atscan rates smaller than a critical value.
The model developed here can be readily extended to simu-late the charging/discharging of mesoporous EDLCs by accountingfor the three-dimensional electrode architecture [83,84]. In fact,the above governing equations and boundary conditions remainvalid for mesoporous electrodes as long as continuum theory is
valid. The latter has been examined in the literature [85–88] andis typically accepted when the pore diameter is larger than 3–5 nm[85–88]. Then, the model can be used to identify the optimum elec-trode architecture to achieve maximum capacitance and chargingperformance.
Acknowledgements
This material is based upon work supported as part of theMolecularly Engineered Energy Materials, an Energy FrontierResearch Center funded by the U.S. Department of Energy, Officeof Science, Office of Basic Energy Sciences under Award NumberDE-SC0001342.
References
[1] A.J. Bard, L.R. Faulkner, Electrochemical Methods: Fundamentals and Applica-tions, John Wiley & Sons, New York, NY, 2001.
[2] R.G. Compton, C.E. Banks, Understanding Voltammetry, World Scientific, Hack-ensack, NJ, 2007.
[3] B.E. Conway, Electrochemical Supercapacitors: Scientific Fundamentals andTechnological Applications, Kluwer Academic/Plenum Publishers, New York,NY, 1999.
[4] E. Frackowiak, F. Beguin, Carbon 39 (2001) 937.[5] D. Pech, M. Brunet, H. Durou, P. Huang, V. Mochalin, Y. Gogotsi, P.L. Taberna, P.
Simon, Nat. Nanotechnol. 5 (2010) 651.[6] K. Xu, Chem. Rev. 104 (2004) 4303.[7] S.W. Lee, N. Yabuuchi, B.M. Gallant, Nat. Nanotechnol. 5 (2010) 531.[8] F. Zhao, R.C. Slade, J.R. Varcoe, Chem. Soc. Rev. 38 (2009) 1926.[9] M.B. Pomfret, J.C. Owrutsky, R.A. Walker, Ann. Rev. Anal. Chem. 3 (2010) 151.
[10] R.J. Hunter, Foundations of Colloid Science, 2nd ed., Oxford University Press,New York, NY, 2001.
[11] J.H. Masliyah, S. Bhattacharjee, Electrokinetic and Colloid Transport Phenom-ena, John Wiley & Sons, Hoboken, NJ, 2006.
[12] H.J. Butt, M. Kappl, Surface and Interfacial Forces, Wiley-VCH Verlag GmbH &Co. KGaA, Weinheim, Germany, 2010.
[13] W.G. Pell, B.E. Conway, J. Electroanal. Chem. 500 (2001) 121.[14] I. Kovalenko, D.G. Bucknall, G. Yushin, Adv. Funct. Mater. 30 (2010) 3979.[15] H. Wang, H.S. Casalongue, Y. Liang, H. Dai, J. Am. Chem. Soc. 132 (2010) 7472.[16] J. Yan, T. Wei, B. Shao, F. Ma, Z. Fan, M. Zhang, C. Zheng, Y. Shang, W. Qian, F.
Wei, Carbon 48 (2010) 1731.[17] H.R. Byon, S.W. Lee, S. Chen, P.T. Hammond, Y. Shao-Horn, Carbon 49 (2011)
457.[18] G. Salitra, A. Soffer, L. Eliad, Y. Cohen, D. Aurbach, J. Electrochem. Soc. 147 (2000)
2486.[19] J. Chmiola, C. Largeot, P.L. Taberna, P. Simon, Y. Gogotsi, Angew. Chem. Int. Ed.
47 (2008) 3392.[20] D. Aurbach, M.D. Levi, G. Salitra, N. Levy, E. Pollak, J. Muthu, J. Electrochem. Soc.
155 (2008) 745.[21] R. Lin, P.L. Taberna, J. Chmiola, D. Guay, Y. Gogotsi, P. Simon, J. Electrochem. Soc.
156 (2009) 7.[22] R. Lin, P. Huang, J. Segalini, C. Largeot, P.L. Taberna, J. Chmiola, Y. Gogotsi, P.
Simon, Electrochim. Acta 54 (2009) 7025.[23] W.G. Pell, B.E. Conway, N. Marincic, J. Electroanal. Chem. 491 (2000) 9.[24] J. Chmiola, C. Largeot, P.L. Taberna, P. Simon, Y. Gogotsi, Science 328 (2010) 480.[25] M. Inagaki, H. Konno, O. Tanaike, J. Power Sources 195 (2010) 7880.[26] F. Béguin, K. Szostak, G. Lota, E. Frackowiak, Adv. Mater. 17 (2005) 2380.[27] D. Hulicova, J. Yamashita, Y. Soneda, H. Hatori, M. Kodama, Chem. Mater. 17
(2005) 1241.[28] H.A. Andreas, B.E. Conway, Electrochim. Acta 51 (2006) 6510.[29] W. Li, D. Chen, Z. Li, Y. Shi, Y. Wan, J. Huang, J. Yang, D. Zhao, Z. Jiang, Electrochem.
Commun. 9 (2007) 569.[30] B. Xu, F. Wu, R. Chen, G. Cao, S. Chen, Z. Zhou, Y. Yang, Electrochem. Commun.
10 (2008) 795.[31] T. Wang, A. Kiebele, J. Ma, S. Mhaisalkar, G. Gruner, J. Electrochem. Soc. 158
(2011) 1.[32] M. Kawaguchi, A. Itoh, S. Yagi, H. Oda, J. Power Sources 172 (2007) 481.[33] M. Seredych, D. Hulicova-Jurcakova, G.Q. Lu, T.J. Bandosz, Carbon 46 (2008)
1475.[34] H. Konno, H. Onishi, N. Yoshizawa, K. Azumi, J. Power Sources 195 (2010) 667.[35] R. Mysyk, E. Raymundo-Pinero, J. Pernak, F. Béguin, J. Phys. Chem. C 113 (2009)
13443.[36] R. Mysyk, E. Raymundo-Pinero, F. Béguin, Electrochem. Commun. 11 (2009)
554.[37] W.G. Pell, B.E. Conway, J. Power Sources 96 (2001) 57.[38] F. Fabregat-Santiago, I. Mora-Sero, G. Garcia-Belmonte, J. Bisquert, J. Phys.
Chem. B 107 (2003) 758.[39] W. Lajnef, J.M. Vinassa, O. Briat, S. Azzopardi, E. Woirgard, J. Power Sources 168
(2007) 553.[40] J.D. Norton, H.S. White, S.W. Feldberg, J. Phys. Chem. 94 (1990) 6772.[41] C.P. Smith, H.S. White, Anal. Chem. 65 (1993) 3343.
Author's personal copy
H. Wang, L. Pilon / Electrochimica Acta 64 (2012) 130– 139 139
[42] M. Ciszkowska, Z. Stojek, J. Electroanal. Chem. 466 (1999) 129.[43] M.Z. Bazant, K. Thornton, A. Ajdari, Phys. Rev. E 70 (2004) 1 (No. 021506).[44] K.T. Chu, M.Z. Bazant, Phys. Rev. E 74 (2006) 1 (No. 011501).[45] L.H. Olesen, M.Z. Bazant, H. Bruus, Phy. Rev. E 82 (2010) 1 (No. 011501).[46] H. Wang, L. Pilon, Electrochim. Acta (2012), doi:10.1016/j.electacta.
2011.12.051, in press.[47] E.J.F. Dickinson, R.G. Compton, J. Electroanal. Chem. 655 (2011) 23.[48] M.S. Kilic, M.Z. Bazant, A. Ajdari, Phys. Rev. E 75 (2007) 1 (No. 021503).[49] M.Z. Bazant, M.S. Kilic, B.D. Storey, A. Ajdari, Adv. Colloid Interface Sci. 152
(2009) 48.[50] J. Sanchez-Gonzalez, F. Stoeckli, T.A. Centeno, J. Electroanal. Chem. 657 (2011)
176.[51] A.G. Pandolfo, A.F. Hollenkamp, J. Power Sources 157 (2006) 11.[52] L.L. Zhang, X.S. Zhao, Chem. Soc. Rev. 38 (2009) 2520.[53] L.L. Zhang, R. Zhou, X.S. Zhao, J. Mater. Chem. 20 (2010) 5983.[54] M.D. Stoller, S. Park, Y. Zhu, J. An, R.S. Ruoff, Nano Lett. 8 (2008) 3498.[55] M. van Soestbergen, P.M. Biesheuvel, M.Z. Bazant, Phys. Rev. E 81 (2010) 1 (No.
021503).[56] J. Lim, J. Whitcomb, J. Boyda, J. Varghese, J. Colloid Interface Sci. 305 (2007) 159.[57] I. Rubinstein, B. Zaltzman, Adv. Colloid Interface Sci. 159 (2010) 117.[58] J.N. Israelachvili, Intermolecular and Surface Forces, 3rd ed., Academic Press,
San Diego, CA, 2010.[59] D.J. Griffiths, Introduction to Electrodynamics, 3rd ed., Prentice Hall, Upper
Saddle River, NJ, 1999.[60] R.P. Feynman, R.B. Leighton, M. Sands, The Feynman Lectures on Physics, vol.
2, 2nd ed., Addison Wesley, New York, NY, 2005.[61] Y.-H. Chen, C.-W. Wang, X. Zhang, A.M. Sastry, J. Power Sources 195 (2010)
2851.[62] A.M. Colclasure, R.J. Kee, Electrochim. Acta 55 (2010) 8960.[63] C.Y. Wang, Chem. Rev. 104 (2004) 4727.[64] P.P. Mukherjee, G. Wang, C.Y. Wang, in: R. White, C. Vayenas, M. Gamboa-
Aldeco (Eds.), Modern Aspects of Electrochemistry, No. 40, Springer, New York,NY, 2007, pp. 285–341.
[65] T. Berning, D.M. Lu, N. Djilali, J. Power Sources 106 (2002) 284.[66] M.S. Kilic, M.Z. Bazant, A. Ajdari, Phys. Rev. E 75 (2007) 1 (No. 021502).[67] H. Wang, L. Pilon, J. Phys. Chem. C 115 (2011) 16711.[68] H.C. Yeh, R.J. Yang, W.-J. Luo, Phys. Rev. E 83 (2011) 1 (No. 056326).[69] J. Lyklema, Fundamentals of Interface and Colloid Science, Vol. II: Solid–Liquid
Interfaces, Academic Press, San Diego, CA, 2001.[70] D.R. Lide (Ed.), CRC Handbook of Chemistry and Physics, 90th ed., CRC
Press/Taylor & Francis, Boca Raton, FL, 2010.[71] H. Cohen, J.W. Cooley, Biophys. J. 5 (1965) 145.[72] T.R. Brumleve, R.P. Buck, J. Electroanal. Chem. 90 (1978) 1.[73] T.R. Brumleve, R.P. Buck, J. Electroanal. Chem. 126 (1981) 73.[74] J.R. Macdonald, J. Chem. Phys. 58 (1973) 4982.[75] R.P. Buck, J. Membr. Sci. 17 (1984) 1.[76] F. Beunis, F. Strubbe, M. Marescaux, J. Beeckman, K. Neyts, A.R.M. Verschueren,
Phys. Rev. E 78 (2008) 1 (No. 011502).[77] J.J. Yoo, K. Balakrishnan, J. Huang, V. Meunier, B.G. Sumpter, A. Srivastava, M.
Conway, A.L.M. Reddy, J. Yu, R. Vajta, P.M. Ajayan, Nano Lett. 11 (2011) 1423.[78] J.S. Newman, K.E. Thomas-Alyea, Electrochemical Systems, 3rd ed., John Wiley
& Sons, Hoboken, N.J, 2004.[79] R.P. Buck, J. Electroanal. Chem. 210 (1986) 1.[80] J. Huang, B.G. Sumpter, V. Meunier, Angew. Chem. Int. Ed. 47 (2008) 520.[81] J. Huang, B.G. Sumpter, V. Meunier, Chem. Eur. J. 14 (2008) 6614.[82] J. Huang, B.G. Sumpter, V. Meunier, G. Yushin, C. Portet, Y. Gogotsi, J. Mater. Res.
25 (2010) 1525.[83] H. Wang, J. Varghese, L. Pilon, Electrochim. Acta 56 (2011) 6189.[84] J. Varghese, H. Wang, L. Pilon, J. Electrochem. Soc. 158 (2011) 1106.[85] R. Qiao, N.R. Aluru, J. Chem. Phys. 118 (2003) 4692.[86] H. Daiguji, Chem. Soc. Rev. 39 (2010) 901.[87] J.C.T. Eijkel, A. van den Berg, Chem. Soc. Rev. 39 (2010) 957.[88] W. Sparreboom, A. van den Berg, J.C.T. Eijkel, New J. Phys. 12 (2010) 1 (No.
015004).