author's personal copy - math.iisc.ac.in
TRANSCRIPT

Author's personal copy
Profiling of late Tertiary–early Quaternary surface in the lower reachesof Narmada valley using microtremors
Prabhin Sukumaran a,⇑, Imtiyaz A. Parvez b, Dhananjay A. Sant a, Govindan Rangarajan c, K. Krishnan d
a Department of Geology, Faculty of Science, The Maharaja Sayajirao University of Baroda, Vadodara 390 002, Indiab CSIR Centre for Mathematical Modeling and Computer Simulation (C-MMACS), NAL Belur Campus, Bangalore 560 037, Indiac Department of Mathematics, Indian Institute of Science, Bangalore 560 012, Indiad Department of Archaeology and Ancient History, Faculty of Arts, The Maharaja Sayajirao University of Baroda, Vadodara 390 002, India
a r t i c l e i n f o
Article history:Received 13 June 2010Received in revised form 19 February 2011Accepted 21 February 2011Available online 1 March 2011
Keywords:Lower reaches of Narmada valleyMicrotremorPalaeo-topographyAmbient noiseH/V spectral ratioEarly QuaternaryLate Tertiary
a b s t r a c t
In this paper, we propose the first approximation for thickness of Quaternary sediment and late Quater-nary–early Tertiary topography for the part of lower reaches of Narmada valley in a systematic way usingthe shallow seismic method, that records both horizontal and vertical components of the microtremor(ambient noise) caused by natural processes. The measurements of microtremors were carried out at31 sites spaced at a grid interval of 5 km s using Lennartz seismometer (5 s period) and City shark-II dataacquisition system. The signals recorded were analysed for horizontal to the vertical (H/V) spectral ratiousing GEOPSY software. For the present study, we concentrate on frequency range between 0.2 Hz and10 Hz. The thickness of unconsolidated sediments at various sites is calculated based on non-linearregression equations proposed by Ibs-von Seht and Wohlenberg (1999) and Parolai et al. (2002). The esti-mated thickness is used to plot digital elevation model and cross profiles correlating with geomorphologyand geology of the study area.
� 2011 Elsevier Ltd. All rights reserved.
1. Introduction
The frequency of seismic noise shows both temporal and regio-nal variations depending on the influence of source and site. In caseof thick unconsolidated sediment overlying the bedrock, the seis-mic waves give high mechanical contrast, where the upper uncon-solidated sediment amplifies the seismic motion. The frequency ofresonating waves in the unconsolidated upper layer is related tothe velocity as well as the thickness of the sediment. Such siteamplification can be estimated using an ambient noise methodintroduced by Kanai (1957). Several studies have shown that ambi-ent seismic noise records reveal the fundamental resonant fre-quency of surface sediments (Ohta et al., 1978; Celebi et al.,1987; Lermo et al., 1988; Field et al., 1990; Hough et al., 1991;Konno and Ohmachi, 1998). To infer the site amplification charac-teristics from ambient noise, one however needs to remove sourceeffect. Nakamura (1989) proposed a method to remove the sourceeffect and estimate site response by dividing the horizontal com-ponent noise spectrum by the vertical component (H/V). Severalmodifications, shortcomings and applications of this method werestudied thereafter (Ohta et al., 1978; Celebi et al., 1987; Lermoet al., 1988; Hough et al., 1991; Field and Jacob, 1993; Lermo and
Chavez-Garcia, 1993, 1994; Konno and Ohmachi, 1998; Zhaoet al., 2007). Several researchers have applied microtremor H/Vspectrum for site investigation and measuring thickness of thetop soil cover over the bedrock in Europe, China, Japan (Tertiary–Quaternary interphase: Yamanaka et al., 1994; Ibs-von Seht andWohlenberg, 1999; Delgado et al., 2000; Parolai et al., 2002;Garcia-Jerez et al., 2006; Zhao et al., 2007) and mapping of regoliththickness over Archaeans (Dinesh et al., 2010). In both cases thereis high mechanical contrast, however, in the former case the vari-ation of Quaternary–Tertiary interphase in the basin is predictable,whereas regolith cover would have wide variation locally. Studiesby Ibs-Von Seht and Wohlenberg (1999) and Parolai et al. (2002)proposed equations relating the fundamental resonant frequencyto the thickness of soft sediment cover (Quaternary sediments)from the observed well data and theoretical calculations. Ibs-VonSeht and Wohlenberg (1999) investigated western Lower RhineEmbayment in Germany comprising a variable thickness of sedi-ment belonging to Tertiary and Quaternary age. On the other hand,Parolai et al. (2002) investigated Cologne area in Germany com-prising sediments of Quaternary and Tertiary age covering Devo-nian bedrock. In the recent work of Dinesh et al. (2010), theyhave derived an equation for the Archaean meta-sediments andthe overlying sediment cover at Bangalore City, India.
The present investigation is the first attempt to map the thick-ness of the Quaternary sediments in the lower reaches of Narmada
1367-9120/$ - see front matter � 2011 Elsevier Ltd. All rights reserved.doi:10.1016/j.jseaes.2011.02.011
⇑ Corresponding author.E-mail address: [email protected] (P. Sukumaran).
Journal of Asian Earth Sciences 41 (2011) 325–334
Contents lists available at ScienceDirect
Journal of Asian Earth Sciences
journal homepage: www.elsevier .com/locate / jseaes

Author's personal copy
valley located at the southern margin of Jambusar–Bharuch Blockof Cambay Basin, a potential hydrocarbon block in western India(Mukherjee, 1983) using microtremors (Fig. 1A). In the study areaalong the south eastern portion (Ankleshwer and Rajpardi seg-ment) the Tertiary sediments occur at shallow depths and areenveloped by unconsolidated thin layer of Quaternary sediment,whereas towards the northwest portion of the study area (Bharuchand Nareshwar segment) the Tertiary sediments extend only in thesubsurface (Rao, 1969; Agarwal, 1986; Ramanathan and Pandey,1988). The only subsurface information regarding Quaternary–Tertiary contact in the lower reaches of Narmada Valley is
estimated through cross profiles along Broach–Dadhal (Rao,1969) as shown in Fig. 2. Further, the area has been investigatedby different researchers in terms of mapping of the exposedsedimentary sequence, their depositional environment and neo-tectonic characteristics (Allchin and Hegde, 1969; Gadekar et al.,1973; Bedi and Vaidyanadhan, 1982; Sant and Karanth, 1993;Rajaguru et al., 1995; Bhandari et al., 2001; Chamyal et al., 2002;Bhandari, 2004; Bhandari et al., 2005; Raj, 2007, 2008; Raj and Yad-ava, 2009). However, the area still lacks information on the floorvariation of Tertiary bedrock, thickness of Quaternary sedimentsand its relation with surface topography/landforms. The recent
Fig. 1. Location map of the study area. (A) Inset demarcates lower reaches of Narmada with reference to western India. (B) Study area within lower reaches of Narmadavalley. (C) Geology and geomorphology of the study area (modified after Bedi and Vaidyanadhan (1982). Loc 1–Loc 31 represents locations for microtremor recording.
326 P. Sukumaran et al. / Journal of Asian Earth Sciences 41 (2011) 325–334

Author's personal copy
discovery of hydrocarbon occurrence at a shallow depth (totaldepth of 540 m; occurrence of hydrocarbons is reported from328–325 m, 315–313 m and 309–305 m, 293–290 m levels) imme-
diate outside the study area would further open avenues forexploring shallow hydrocarbon traps and 3D geometry of land-forms (ONGC Report, 2010).
Fig. 2. Image showing borehole correlations from the available boreholes in the present study area (adopted from Rao (1969), Fig. 2, p. 27). See Fig. 1 for location of boreholes.Broach 6 shows a thick sediment accumulation compared to the SE portion is well correspond with the present finding.
Fig. 3. An example of waveform recorded (Location 13) by Lennartz seismometer (5 s period) with City shark-II data acquisition system. X axis shows the time and Y axisshows the different components of amplitude viz. NS, EW and vertical.
P. Sukumaran et al. / Journal of Asian Earth Sciences 41 (2011) 325–334 327
Author's personal copy
2. Field observations and methodology
The lower reaches of Narmada exemplify various palaeo andneolandforms well preserved within the flood plain of River
Narmada. In general, the southern portion of the study areaforms three surfaces, viz. Late Holocene surface, Palaeo bankand exposed Tertiary uplands, whereas the northern portionremains an uncategorised alluvial plain surface (Bedi and
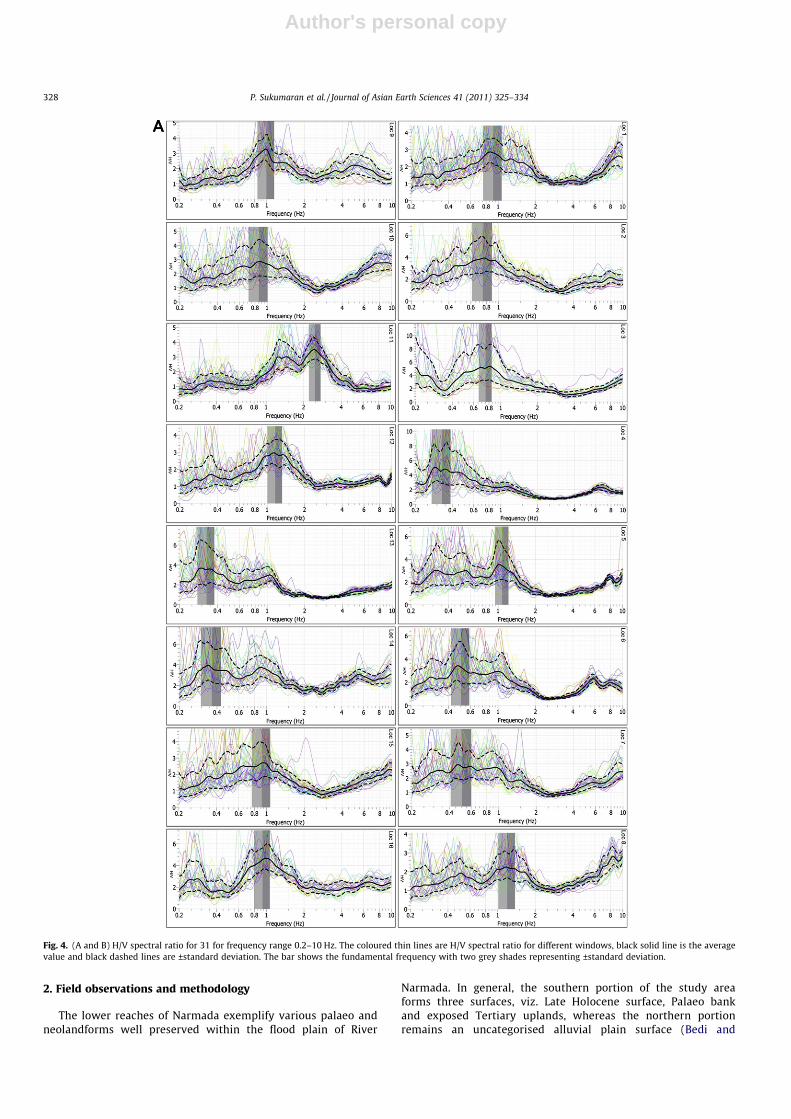
Fig. 4. (A and B) H/V spectral ratio for 31 for frequency range 0.2–10 Hz. The coloured thin lines are H/V spectral ratio for different windows, black solid line is the averagevalue and black dashed lines are ±standard deviation. The bar shows the fundamental frequency with two grey shades representing ±standard deviation.
328 P. Sukumaran et al. / Journal of Asian Earth Sciences 41 (2011) 325–334

Author's personal copy
Vaidyanadhan, 1982: Fig. 1C). The area poses flat to rollingtopography with Palaeo bank and neobank as a paired landformwhich runs ENE–WSW direction from Jhagadia in east toAnkleshwer in west with a length of more than 30 km (Allchin
and Hegde, 1969; Bedi and Vaidyanadhan, 1982; Mukherjee,1983; Sant and Karanth, 1993). The incised river channels haveexposed a few metres to 40 m of Quaternary sediments in thestudy area.
Fig. 4 (continued)
P. Sukumaran et al. / Journal of Asian Earth Sciences 41 (2011) 325–334 329
Author's personal copy
An ENE–WSW trending reverse basin marginal fault, traversethrough the southern boundary of the study area (Kaila et al.,1981). As a result, the basin marginal fault exposes Tertiary sequenceimmediately along the southern periphery. The structural studies onexposed Tertiary rocks suggest that they have undergone last defor-mation during Plio–Pleistocene time, resulting in development ofseveral anticlines–syncline structures (Agarwal, 1986). Towardsthe north of the fault, the late Tertiary rocks form the bedrock forunconsolidated Quaternary sediments whose thickness variesdepending on the late Tertiary–early Quaternary topography.
We apply the seismic method using ambient noise to decode atwo-layered model demarcating unconsolidated Quaternary sedi-ment and the bedrock belonging to Tertiary age. The measure-ments using ambient noise were carried out using the Lennartzseismometer (5 s period) with City shark-II data acquisition systemfor 31 sites located on different landforms (Fig. 1C). The data acqui-sition was done in a gridded pattern at a resolution of 5 km cover-ing an area of 470 km2 that includes Tertiary high land surface inthe south east to a flat flood plain towards North West (Fig. 1).We have acquired the microtremor data at 100 samples/s for eachsite. However, the frequency range between 0.2 Hz and 10 Hz hasbeen analysed in the present study. The acquisition system recordsfrequencies as three components viz. EW, NS and vertical vibrationdirections for a time duration of 40 min (Fig. 3).The noise record-ings were processed using GEOPSY freeware (http://www.geopsy.org/) to determine the fundamental resonant frequency aftergenerating the H/V spectral ratio for each station (Fig. 4A and B).
3. Theoretical calculation
Theoretical estimation of the thickness (h) of the soil layer overthe bedrock can be related to the fundamental resonant frequency
(fr) of H/V spectral ratio by a allometric function as given by Eq. (1)(Ibs-von Seht and Wohlenberg, 1999),
h ¼ af br ð1Þ
where ‘a’ and ‘b’ are the standard errors of the correlationcoefficients.
The estimated terrain specific equation was justified studyingQuaternary–Tertiary inter phase at western Lower Rhine Embay-ment (Ibs-von Seht and Wohlenberg, 1999; based on 34 boreholesranging in depth from 15 m to 1257 m and data from 102 seismicstations: Eq. (2A)) and the Cologne area in Germany (Parolai et al.,2002; based on 32 boreholes having a depth of <402 m and 337data from seismic stations: Eq. (2B)) simulating the thickness ofsoil cover (Quaternary sediments) above bedrock (Tertiary rocks).Dinesh et al. (2010) derived terrain specific equation (Eq. (2C))for the distinctly different terrain around Bangalore in India (interphase of soil and regolith with metamorphic rock and granites).
h ¼ 96f�1:388r ð2AÞ
h ¼ 108f�1:551r ð2BÞ
h ¼ ð58� 8:8Þf ð�0:95�0:1Þr ð2CÞ
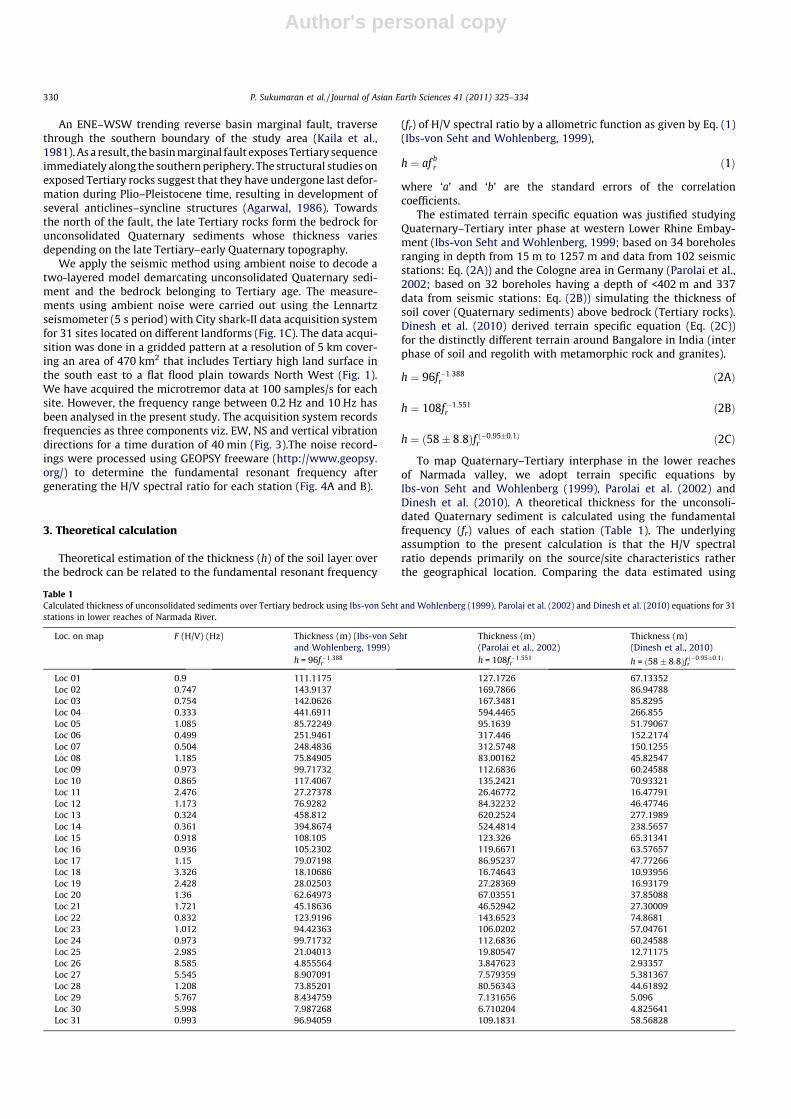
To map Quaternary–Tertiary interphase in the lower reachesof Narmada valley, we adopt terrain specific equations byIbs-von Seht and Wohlenberg (1999), Parolai et al. (2002) andDinesh et al. (2010). A theoretical thickness for the unconsoli-dated Quaternary sediment is calculated using the fundamentalfrequency (fr) values of each station (Table 1). The underlyingassumption to the present calculation is that the H/V spectralratio depends primarily on the source/site characteristics ratherthe geographical location. Comparing the data estimated using
Table 1Calculated thickness of unconsolidated sediments over Tertiary bedrock using Ibs-von Seht and Wohlenberg (1999), Parolai et al. (2002) and Dinesh et al. (2010) equations for 31stations in lower reaches of Narmada River.
Loc. on map F (H/V) (Hz) Thickness (m) (Ibs-von Sehtand Wohlenberg, 1999)h = 96f�1:388
r
Thickness (m)(Parolai et al., 2002)h = 108f�1:551
r
Thickness (m)(Dinesh et al., 2010)
h = ð58� 8:8Þf ð�0:95�0:1Þr
Loc 01 0.9 111.1175 127.1726 67.13352Loc 02 0.747 143.9137 169.7866 86.94788Loc 03 0.754 142.0626 167.3481 85.8295Loc 04 0.333 441.6911 594.4465 266.855Loc 05 1.085 85.72249 95.1639 51.79067Loc 06 0.499 251.9461 317.446 152.2174Loc 07 0.504 248.4836 312.5748 150.1255Loc 08 1.185 75.84905 83.00162 45.82547Loc 09 0.973 99.71732 112.6836 60.24588Loc 10 0.865 117.4067 135.2421 70.93321Loc 11 2.476 27.27378 26.46772 16.47791Loc 12 1.173 76.9282 84.32232 46.47746Loc 13 0.324 458.812 620.2524 277.1989Loc 14 0.361 394.8674 524.4814 238.5657Loc 15 0.918 108.105 123.326 65.31341Loc 16 0.936 105.2302 119.6671 63.57657Loc 17 1.15 79.07198 86.95237 47.77266Loc 18 3.326 18.10686 16.74643 10.93956Loc 19 2.428 28.02503 27.28369 16.93179Loc 20 1.36 62.64973 67.03551 37.85088Loc 21 1.721 45.18636 46.52942 27.30009Loc 22 0.832 123.9196 143.6523 74.8681Loc 23 1.012 94.42363 106.0202 57.04761Loc 24 0.973 99.71732 112.6836 60.24588Loc 25 2.985 21.04013 19.80547 12.71175Loc 26 8.585 4.855564 3.847623 2.93357Loc 27 5.545 8.907091 7.579359 5.381367Loc 28 1.208 73.85201 80.56343 44.61892Loc 29 5.767 8.434759 7.131656 5.096Loc 30 5.998 7.987268 6.710204 4.825641Loc 31 0.993 96.94059 109.1831 58.56828
330 P. Sukumaran et al. / Journal of Asian Earth Sciences 41 (2011) 325–334

Author's personal copy
the three equations; it has been observed that the variation ofestimated depth is more in the case of Dinesh et al. (2010).The large deviation in the depths could be inferred due to thehigh mechanical contrast between Archaean meta-sedimentsand the overlying soil cover. While, the depths calculated usingIbs-von Seht and Wohlenberg (1999) and Parolai et al. (2002)show significantly smaller variations in the thickness due tothe comparable geotechnical characteristics of geological forma-tion. Further, the values of thickness obtained from Ibs-von Sehtand Wohlenberg (1999) and Parolai et al. (2002) were more com-patible with each other (Fig. 5). This analysis clearly brings outthat the thickness calculated for H/V spectral frequency >0.5 Hz(26 data points) show an averaged standard deviation of 8 m in
thickness, whereas, the H/V spectra frequency <0.5 Hz (5 datapoints) show averaged standard deviation of 114 m in thickness.In other words, there is not much difference between results ob-tained using the above two equations.
We further averaged the values derived using Eqs. (2A) and(2B) giving a best fit equation for the lower reaches of theNarmada valley (Eq. (3)). This is further used for deriving pri-mary information on the relative depth variation of the interfacebetween the two mechanically contrasting layers of Quaternarysediment (soft sediment) and Tertiary rock (bedrock) in the studyarea (Table 2).
�h ¼ 102:1f�1:47r ð3Þ
Fig. 5. Comparison between depths calculated using Ibs-von Seht and Wohlenberg (1999) and Parolai et al. (2002) relationships (Eqs. (2A) and (2B)). The circle indicates theaverage value whereas the length of the line suggests deviation from the average.
Table 2Relative variation of the thickness of Quaternary sediment cover at 31 locations which is further used for the elevation models.
Loc. on map Latitude Longitude Elevation (m) F (H/V) (Hz) Relative variation of average thickness (m)Present workRepresents the equation �h ¼ 102:1f�1:47
r
Loc 01 21.84895� 73.08142� 25 0.9 119.1451Loc 02 21.8773� 73.12202� 22 0.747 156.8502Loc 03 21.90541� 73.1619� 25 0.754 154.7054Loc 04 21.71003� 72.95635� 28 0.333 518.0688Loc 05 21.73744� 72.99498� 24 1.085 90.44319Loc 06 21.7622� 73.02984� 18 0.499 284.696Loc 07 21.78819� 73.0663� 20 0.504 280.5292Loc 08 21.81587� 73.1064� 36 1.185 79.42534Loc 09 21.84444� 73.14631� 23 0.973 106.2005Loc 10 21.87292� 73.18669� 34 0.865 126.3244Loc 11 21.67962� 72.98013� 19 2.476 26.87075Loc 12 21.70752� 73.01841� 19 1.173 80.62526Loc 13 21.7323� 73.05333� 23 0.324 539.5322Loc 14 21.75803� 73.09002� 15 0.361 459.6744Loc 15 21.78613� 73.12948� 23 0.918 115.7155Loc 16 21.81451� 73.16965� 20 0.936 112.4487Loc 17 21.84339� 73.20974� 20 1.15 83.01217Loc 18 21.64826� 73.00391� 11 3.326 17.42665Loc 19 21.67547� 73.04317� 17 2.428 27.65436Loc 20 21.70058� 73.07807� 14 1.36 64.84262Loc 21 21.72634� 73.11506� 12 1.721 45.85789Loc 22 21.75382� 73.15429� 17 0.832 133.7859Loc 23 21.78227� 73.19457� 14 1.012 100.2219Loc 24 21.8104� 73.23541� 33 0.973 106.2005Loc 25 21.61547� 73.0295� 29 2.985 20.4228Loc 26 21.64276� 73.06886� 25 8.585 4.351594Loc 27 21.6674� 73.10354� 39 5.545 8.243225Loc 28 21.69308� 73.14048� 22 1.208 77.20772Loc 29 21.72093� 73.18014� 29 5.767 7.783208Loc 30 21.74903� 73.22044� 48 5.998 7.348736Loc 31 21.77744� 73.26117� 19 0.993 103.0619
P. Sukumaran et al. / Journal of Asian Earth Sciences 41 (2011) 325–334 331

Author's personal copy
The calculated values give a shallow interface of Quaternary andTertiary sediments in the Ankleshwer and Rajpardi segment anddeep in the Bharuch and Nareshwar segment. This observation isvalidated by correlation of wells across Narmada River (Fig. 2).The correlation profile shows a thick sediment cover at the Broachwell. A thin cover of sediment inferred from the locations Loc 26,Loc 27, Loc 29 and Loc 30 validates the occurrence of Tertiary rocksat observed shallower depth. However, the observed depth of 77 mat Loc 28 within the Tertiary bedrock indicates a local depression.
4. Results and discussion
Calculated depth of the interface between the two layers (usingEq. (3)) is used to plot cross-profiles and digital elevation model
(DEM) for lower reaches of Narmada valley. Fig. 6A and B showsNW–SE and NE–SW cross-sections respectively. The NW–SE profileshows a gentle northerly slope of the consolidated bedrock viz. Loc1–Loc 29, Loc 2–Loc 30 and Loc 3–Loc 31 profiles, whereas the pro-files along Loc 4–Loc 25, Loc 6–Loc 27 and Loc 7–Loc 28 show stee-per slope and increase in the unconsolidated sediment thickness.The profile Loc 5–Loc 26 appears to form a ridge dividing depres-sions into two (Loc 4 and Loc 6). The variation in the depth of con-solidated bedrock in the SW portion of the study area can better beappreciated along NE–SW profiles (Fig. 6B). The study of cross pro-files implies linkages between the depocentres and the source inthe different direction. The DEM for the bedrock further revealslate Tertiary–early Quaternary palaeo-depressions (I) betweenLoc 6, Loc 7, Loc 13 and Loc 14 showing relative depth variationsof 284 m, 280 m, 539 m, 459 m respectively and depression (II)
Fig. 6. Cross profiles showing the contact of unconsolidated soft sediment and consolidated bedrock variations of Quaternary sediments. (A) NW–SE profile and (B) NE–SWprofiles.
332 P. Sukumaran et al. / Journal of Asian Earth Sciences 41 (2011) 325–334

Author's personal copy
Loc 4 reaching a depth of 518 m (Fig. 7). Comparing the geomor-phology with digital elevation model of the bedrock raises twopossible explanations for the variation in the bedrock profile(Fig. 7). Firstly, the steeply dipping Tertiary rock between Loc 18and Loc 23 is correlating with the surface expression of Palaeobank. While the region connecting Loc 18, Loc 19, Loc 20, Loc 21,Loc 22, Loc 15 and Loc 14 shows control of shallow Tertiary rocksto the present braided channel of River Narmada. The profile con-necting Loc 15 and Loc 12 suggest a steep channel gradient of RiverNarmada during late Tertiary–early Quaternary. The ridge formedbetween Loc 4, 5, 11 and 12 that differentiate depressions I andII may be correlated with the thick gravel lobe exposed along thesouthern bank of Narmada (within locations 19–21 and 25–27)brought by transverse River system in to the depression. Secondly,both the Quaternary depressions appear to be structural control asthey lie adjacent to ENE–WSW Cambay basin block fault identifiedalong DSS profile (Kaila et al., 1981).
The studies using high resolution H/V spectral records from theregion using area specific shear wave velocity model and boreholerecords would capture further local details enhancing the surfacetopography of Tertiary top as the topography captures relative dif-ferences instead of absolute values. The deviation in the new val-ues would fall within its standard deviation (Fig. 5 explains thepresent case). Such records would give better opportunity to accessrole of climate and/or tectonics in sculpturing the palaeo surface.
5. Conclusion
The present study evaluates the usefulness of the H/V spectralratio of microtremor investigations. This is a relatively quick, easyand economic method for estimating the thickness of unconsoli-dated sediments for a given terrain. An equation for a geologicallycomparable terrain can be recalculated using the average values of
Ibs-von Seht and Wohlenberg (1999) and Parolai et al. (2002) andrecords of H/V measured from the terrain.
The lower reaches of Narmada valley where estimation of pre-Quaternary topography has been difficult due to its wide variationhas now been profiled using a non-linear regression equationð�h ¼ 102:1f�1:47
r Þ. Two significant Quaternary depocentres havebeen outlined in the lower reaches of Narmada valley. The presentdiscovery is significant as it lies adjacent to ENE–WSW Jambusar–Bharuch margin fault where the presence of shallow gas reservoirsis being exploited.
Acknowledgements
The authors are grateful to the Department of Science and Tech-nology, Shallow Sub-surface Science program – Narmada Window(SR/S4/ES-21/NARMADA WINDOW/P 6) for the financial supportthrough a project grant. We extend our sincere thanks to ShriM.C. Kandpal (General Manager-GP-BM-1), ONGC, Vadodara forvaluable discussions. We also express our sincere thanks to Shri.Sagar Mehta (Head Cambay Basin Unit, Hindustan Oil ExplorationCompany Ltd.) and Shri. Amardeep Jain (Lead Technical Support,Subsurface Group, Hindustan Oil Exploration Company Ltd.) forthe valuable discussions, suggestions and the critical commentson the manuscript. We wish to thank Mr. Rahul. R, for his invalu-able support during the field work. G.R. was also supported by anUGC SAP (Phase IV) grant. I.A.P. thanks SIC, C-MMACS for his sup-port and encouragement. We thank the reviewer for the valuablesuggestions which help to modify the manuscript.
References
Agarwal, G.C., 1986. Structure and tectonics of exposed Tertiary rocks betweenNarmada and Kim Rivers in South Gujarat. Journal of the Geological Society ofIndia 27, 531–542.
Fig. 7. Late Tertiary–early Quaternary palaeo-topography of area under study in the lower reaches of Narmada valley. I and II are the depressions carved over late Tertiary–early Quaternary surface forming the sites of thickest Quaternary sediment in the study area.
P. Sukumaran et al. / Journal of Asian Earth Sciences 41 (2011) 325–334 333

Author's personal copy
Allchin, B., Hegde, K.T.M., 1969. The background of early man in the NarmadaValley, Gujarat: a preliminary report of the 1969 season’s field work. Journal ofthe MS University of Baroda 12, 141–145.
Bedi, N., Vaidyanadhan, R., 1982. Effect of neotectonics on the morphology of theNarmada River in Gujarat, Western India. Zeitschrift fur Gastroenterologie N.F.F, 87–102.
Bhandari, S., 2004. The Quaternary sedimentation, neotectonics andpalaeoenvironment of the lower Narmada Basin, Western India. Ph.D. ThesisSubmitted to Maharaja Sayajirao University of Baroda.
Bhandari, S., Raj, R., Maurya, D.M., Chamyal, L.S., 2001. Formation and erosion ofHolocene alluvial fans along the Narmada-Son fault near Rajpipla in lowerNarmada Basin, Western India. Journal of the Geological Society of India 58,519–532.
Bhandari, S., Maurya, D.M., Chamyal, L.S., 2005. Late Pleistocene alluvial plainsedimentation in lower Narmada Valley, Western India: palaeoenvironmentalimplications. Journal of Asian Earth Sciences 24, 433–444.
Celebi, M., Dietel, C., Prince, J., Onate, M., Chavez, G., 1987. Site amplification inMexico City (determined from 19 September 1985 strong-motion records andfrom recording of weak motions). Ground Motion and Engineering Seismology,141–152.
Chamyal, L.S., Maurya, D.M., Bhandari, S., Raj, R., 2002. Late Quaternary geomorphicevolution of the lower Narmada valley, Western India: implications forneotectonic activity along the Narmada-Son Fault. Geomorphology 46, 177–202.
Delgado, J., Lopez Casado, C., Estevez, A., Giner, J., Cuenca, A., Molina, S., 2000.Mapping soft soils in the Segura River valley (SE Spain): a case study ofmicrotremors as an exploration tool. Journal of Applied Geophysics 45, 19–32.
Dinesh, B.V., Nair, G.J., Prasad, A.G.V., Nakkeeran, P.V., Radhakrishna, M.C., 2010.Estimation of sedimentary layer shear wave velocity using micro-tremor H/Vratio measurements for Bangalore city. Soil Dynamics and EarthquakeEngineering 30, 1377–1382.
Field, E., Jacob, K., 1993. The theoretical response of sedimentary layers to ambientseismic noise. Geophysical Research Letters 20, 2925–2928.
Field, E.H., Hough, S.E., Jacob, K.H., 1990. Using microtremors to assess potentialearthquake site response: a case study in Flushing Meadows, New York City.Bulletin of the Seismological Society of America 80, 1456–1480.
Gadekar, D.R., Naik, S.D., Sahai, B., 1973. Some aspects of geomorphic evolution ofthe lower Narmada and Mahi Rivers from Landsat Imagery. Recent Researchesin Geology, 32–41.
Garcia-Jerez, A., Luzon, F., Navarro, M., Perez-Ruiz, J.A., 2006. Characterization of thesedimentary cover of the Zafarraya basin, southern Spain, by means of ambientnoise. Bulletin of the Seismological Society of America 96, 957–967.
Hough, S.E., Field, E.H., Jacob, K.H., 1991. Using microtremors to assess site-specificearthquake hazard. In: Earthquake Engineering Research Institute, p. 385.
Ibs-von Seht, M., Wohlenberg, J., 1999. Microtremor measurements used to mapthickness of soft sediments. Bulletin of the Seismological Society of America 89,250–259.
Kaila, K.L., Krishna, V.G., Mall, D.M., 1981. Crustal structure along Mehmadabad–Billimora profile in the Cambay basin, India from deep seismic soundings.Tectonophysics 76, 99–113.
Kanai, K., 1957. The requisite conditions for the predominant vibration of ground.Bulletin Earthquake Research Institute 35, 457–471.
Konno, K., Ohmachi, T., 1998. Ground-motion characteristics estimated fromspectral ratio between horizontal and vertical components of microtremor.Bulletin of the Seismological Society of America 88, 228–241.
Lermo, J., Chavez-Garcia, F.J., 1993. Site effect evaluation using spectral ratios withonly one station. Bulletin of the Seismological Society of America 83, 1574–1594.
Lermo, J., Chavez-Garcia, F.J., 1994. Are microtremors useful in site responseevaluation? Bulletin of the Seismological Society of America 84, 1350–1364.
Lermo, J., Rodriguez, M., Singh, S.K., 1988. The Mexico earthquake of September 19,1985 ùNatural period of sites in the valley of Mexico from microtremormeasurements and strong motion data. Earthquake Spectra 4, 805–814.
Mukherjee, M.K., 1983. Petroleum prospects of Cretaceous sediments of the Cambaybasin, Gujarat, India. Journal of Petroleum Geology 5, 275–286.
Nakamura, Y., 1989. A method for dynamic characteristics estimation of subsurfaceusing microtremor on the ground surface. Quarterly Report of RailwayTechnical Research Institute 30, 25–33.
Ohta, Y., Kagami, H., Goto, N., Kudo, K.A., 1978. Observation of 1- to 5-secondmicrotremors and their application to earthquake engineering. Part I:comparison with long-period accelerations at the Tokachi-oki earthquake of1968. Bulletin of the Seismological Society of America 68, 767–779.
ONGC Report, 2010. In: 203rd ONGC Board Meeting Reports. <http://www.ongcindia.com/def1.asp?fold=headline&file=headline244.txt>.
Parolai, S., Bormann, P., Milkereit, C., 2002. New relationships between Vs, thicknessof sediments, and resonance frequency calculated by the H/V ratio of seismicnoise for the Cologne area (Germany). Bulletin of the Seismological Society ofAmerica 92, 2521–2527.
Raj, R., 2007. Strike slip faulting inferred from offsetting of drainages: lowerNarmada basin, western India. Journal of Earth System Science 116, 413–421.
Raj, R., 2008. Occurrence of volcanic ash in the Quaternary alluvial deposits, lowerNarmada basin, western India. Journal of Earth System Science 117, 41–48.
Raj, R., Yadava, M.G., 2009. Late Holocene uplift in the lower Narmada basin,western India. Current Science 96, 985–988.
Rajaguru, S.N., Gupta, A., Kale, V.S., Mishra, S., Ganjoo, R.K., Ely, L.L., Enzel, Y., Baker,V.R., 1995. Channel form and processes of the flood-dominated Narmada River,India. Earth Surface Processes and Landforms 20, 407–421.
Ramanathan, S., Pandey, J., 1988. Neogene/Quaternary boundary in Indian basins.Journal of the Palaeontological Society of India 33, 21–45.
Rao, K., 1969. Lithostratigraphy of Paleogene succession of southern Cambay basin.Bulletin of the Oil and Natural Gas Commission 6, 24–37.
Sant, D.A., Karanth, R.V., 1993. Drainage evolution of the lower Narmada valley,western India. Geomorphology 8, 221–244.
Yamanaka, H., Takemura, M., Ishida, H., Niwa, M., 1994. Characteristics of long-period microtremors and their applicability in exploration of deep sedimentarylayers. Bulletin of the Seismological Society of America 84, 1831–1841.
Zhao, B., Xie, X., Chai, C., Ma, H., Xu, X., Peng, D., Yin, W., Tao, J., 2007. Imaging thegraben structure in the deep basin with a microtremor profile crossing theYinchuan City. Journal of Geophysics and Engineering 4, 293–300.
334 P. Sukumaran et al. / Journal of Asian Earth Sciences 41 (2011) 325–334