author's personal copy - pure.strath.ac.uk · author's personal copy ... most large...
TRANSCRIPT

This article appeared in a journal published by Elsevier. The attachedcopy is furnished to the author for internal non-commercial researchand education use, including for instruction at the authors institution
and sharing with colleagues.
Other uses, including reproduction and distribution, or selling orlicensing copies, or posting to personal, institutional or third party
websites are prohibited.
In most cases authors are permitted to post their version of thearticle (e.g. in Word or Tex form) to their personal website orinstitutional repository. Authors requiring further information
regarding Elsevier’s archiving and manuscript policies areencouraged to visit:
http://www.elsevier.com/copyright
Author's personal copy
Street centrality and land use intensity in Baton Rouge, Louisiana
Fahui Wang a,*, Anzhelika Antipova a, Sergio Porta b
a Department of Geography & Anthropology, Louisiana State University, Baton Rouge, LA 70803, USAb Department of Architecture, University of Strathclyde, Glasgow, UK
a r t i c l e i n f o
Keywords:Street centralityLand use intensityKernel density estimationFloating catchment area method
a b s t r a c t
This paper examines the relationship between street centrality and land use intensity in Baton Rouge,Louisiana. Street centrality is calibrated in terms of a node’s closeness, betweenness and straightnesson the road network. Land use intensity is measured by population (residential) and employment (busi-ness) densities in census tracts, respectively and combined. Two GIS-based methods are used to trans-form data sets of centrality (at network nodes) and densities (in census tracts) to one unit forcorrelation analysis. The kernel density estimation (KDE) converts both measures to raster pixels, andthe floating catchment area (FCA) method computes average centrality values around census tracts.Results indicate that population and employment densities are highly correlated with street centralityvalues. Among the three centrality indices, closeness exhibits the highest correlation with land use den-sities, straightness the next and betweenness the last. This confirms that street centrality captures loca-tion advantage in a city and plays a crucial role in shaping the intraurban variation of land use intensity.
� 2010 Elsevier Ltd. All rights reserved.
1. Introduction
The interrelatedness of transportation and settlement has been aconstant theme of theoretical and empirical inquiries, both in intra-urban and interurban settings. The focus of this paper is on theirinterdependence in an intraurban context. The classic economicmodel proposed by Mills (1972) and Muth (1969), often referredto as the monocentric model, assumes that all employment is con-centrated in the city center. Intuitively, as everyone commutes tothe city center for work, a household farther away from the centerspends more on commuting and is compensated by living in a lar-ger-lot house (also cheaper in terms of price per area unit). Theresulting population density exhibits a declining pattern with dis-tance from the city center. The monocentric model, with rootstraced back to the famous ‘‘Chicago School” (Park et al., 1925),emphasizes the role of central business district (CBD) on the differ-entiation of citywide land use intensity. Since the 1970s, more andmore researchers recognize the changing urban form from mono-centricity to polycentricity (Ladd and Wheaton, 1991; Berry andKim, 1993; Hoch and Waddell, 1993). In addition to the major cen-ter in the CBD, most large cities have secondary centers or subcen-ters, and thus are better characterized as polycentric cities. In apolycentric city, assumptions of whether residents need to accessall centers or some of the centers lead to various population densityfunctions (Heikkila et al., 1989; Wang, 2006, pp. 107–109).
The economic model is ‘‘simplification and abstraction that mayprove too limiting and confining when it comes to understanding
and modifying complex realities” (Casetti, 1993, p. 527), but high-lights the important role of transportation costs in shaping urbanstructure. Urban planners and geographers tend to be more recog-nizant of the complexity of urban structure, and have developedsome models to capture the relationship between urban transpor-tation networks and land use patterns. Lowry (1964) and Garin(1966) developed a model that emphasizes the interactions be-tween population and employment distributions. The interactionsbetween employment and population decline with distances,which are defined by a transportation network. The model hasthe flexibility of simulating population and employment distribu-tion patterns corresponding to a given road network. Wang(1998) used the model to examine how the population andemployment density patterns respond to changes in transportationnetworks. However, the Garin–Lowry model relies on the economicbase theory that divides employment into basic vs. nonbasicemployment, and requires the basic employment pattern as an in-put. Division of economy (employment) into basic (those indepen-dent of local economy) and nonbasic (e.g., service) sectors is notstraightforward and often infeasible in practice. Wang and Guld-mann (1996) proposed a gravity-based model to simulate urbandensities (in general, perhaps a combination of population andemployment densities) given a road network. The model assumesthat density at a location is proportional to its accessibility to allother locations in a city, measured as a gravity potential. It empha-sizes that location determined by the road network is the force thatshapes the variation of land use intensity. Like any gravity models,the Wang–Guldmann model needs a value for the distance frictioncoefficient, which is not conveniently available and requires addi-tional data and model calibration to derive.
0966-6923/$ - see front matter � 2010 Elsevier Ltd. All rights reserved.doi:10.1016/j.jtrangeo.2010.01.004
* Corresponding author. Fax: +1 225 578 4420.E-mail address: [email protected] (F. Wang).
Journal of Transport Geography 19 (2011) 285–293
Contents lists available at ScienceDirect
Journal of Transport Geography
journal homepage: www.elsevier .com/ locate / j t rangeo
Author's personal copy
Most recently, urban planners have benefited from advance-ment of network science (Barabási, 2002; Batty, 2005, 2008). Astreet network can be characterized by a well-defined geometricstructure consisting of nodes (points) and segments (lines). Miller(1999) developed a space–time accessibility measure based on atransportation network. Borruso (2003, 2005, 2008) used a simpleroad network density index to approximate land use intensity andthus delineate urban areas. Downs and Horner (2007a,b) used net-work-based measures in characterizing linear point patterns andestimating home ranges. Okabe et al. (2006a,b) developed a tool-box for network-based spatial analysis. With analogies to spacesyntax, Porta et al. (2006) implemented several indices to measurestreet systems and their connectivity. These network-based mea-sures capture location advantage of various places in a city interms of connectivity between opportunities or activities. Thisfamily of indices, grouped as the multiple centrality assessment(MCA) model, is used to explain densities of commercial and ser-vice activities in a city (Porta et al., 2009). The MCA model definescentrality of a place not only as being central in terms of closeness(proximity) to other places but also being ‘‘intermediary, straight. . . and critical” to others. Therefore, the model is a more compre-hensive assessment of location than the traditional gravity-basedaccessibility measures (Hansen, 1959), which were found to begood predictors of land development rate.
This paper will examine the relationship between street cen-trality measures and land use intensity. Street centrality is cali-brated in terms of a node’s closeness, betweenness andstraightness on the road network. Land use intensity is measuredby population and employment densities in census tracts, respec-tively and combined. The population (evening-time) density pat-tern reflects the variation of residential land use. Employment(daytime) density captures business-related land uses includingindustrial, commercial and others. Population and employmentdistributions are more general and comprehensive indicators ofland use intensity than service and commercial activities used inPorta et al. (2009). Such data are available and publicly accessiblefor any US metropolitan areas through the Census TransportationPlanning Package (CTPP), and thus permit empirical studies inany other major cities in the US. Two GIS-based methods are usedto transform data sets of centrality (at network nodes) and densi-ties (in tracts) to one unit for correlation analysis. The kernel den-sity estimation (KDE) converts both measures to raster pixels, andthe floating catchment area (FCA) method computes average cen-trality values around census tracts. The study area for this researchis Baton Rouge, Louisiana, with a total population of 430,770 andemployment of 224,550 in 2000.
Major contributions made by this research may be summarizedin three aspects:
(1) The study supports the proposition that urban land useintensity, in terms of population and employment densities,is shaped by the street network instead of proximity to citycenter(s) as suggested by urban economic models.
(2) Urban location is well captured by centrality metrics, someof which correlate with land use intensity better than others.
(3) Either the kernel density estimation or the floating catch-ment area method enables the transformations of networkcentrality and land use intensity to the same data frameand permits the examination of their relationship.
2. Study area and data sources
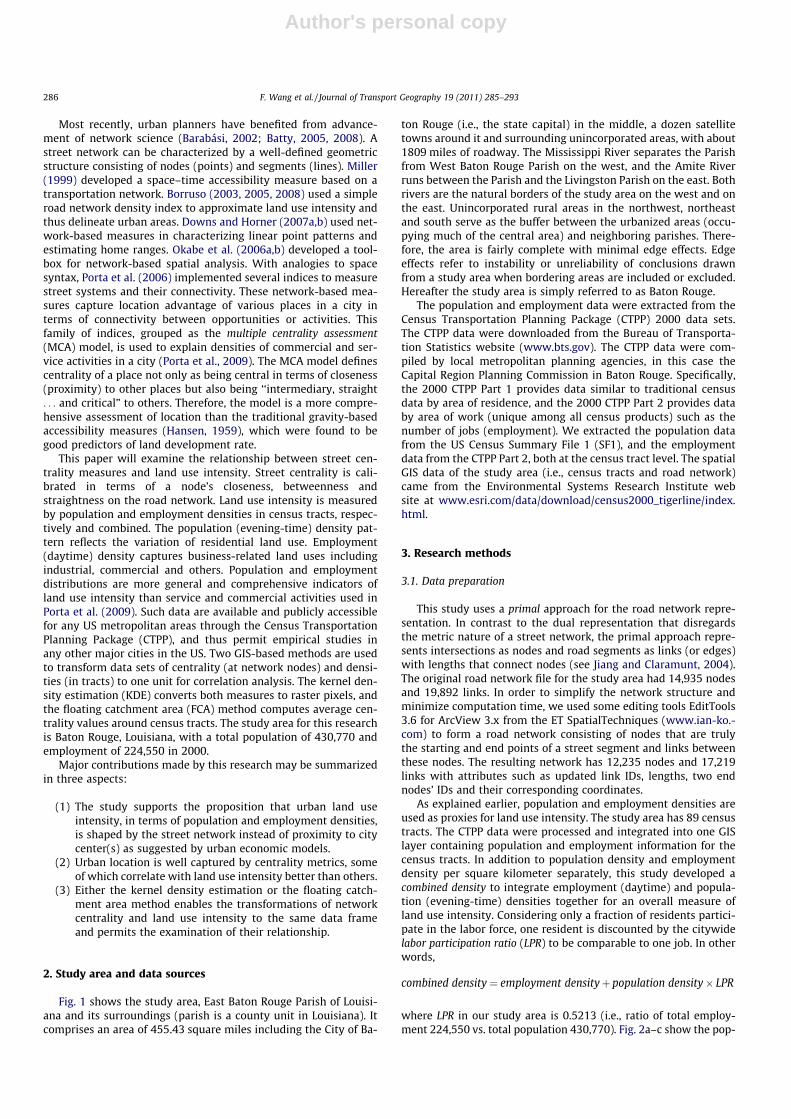
Fig. 1 shows the study area, East Baton Rouge Parish of Louisi-ana and its surroundings (parish is a county unit in Louisiana). Itcomprises an area of 455.43 square miles including the City of Ba-
ton Rouge (i.e., the state capital) in the middle, a dozen satellitetowns around it and surrounding unincorporated areas, with about1809 miles of roadway. The Mississippi River separates the Parishfrom West Baton Rouge Parish on the west, and the Amite Riverruns between the Parish and the Livingston Parish on the east. Bothrivers are the natural borders of the study area on the west and onthe east. Unincorporated rural areas in the northwest, northeastand south serve as the buffer between the urbanized areas (occu-pying much of the central area) and neighboring parishes. There-fore, the area is fairly complete with minimal edge effects. Edgeeffects refer to instability or unreliability of conclusions drawnfrom a study area when bordering areas are included or excluded.Hereafter the study area is simply referred to as Baton Rouge.
The population and employment data were extracted from theCensus Transportation Planning Package (CTPP) 2000 data sets.The CTPP data were downloaded from the Bureau of Transporta-tion Statistics website (www.bts.gov). The CTPP data were com-piled by local metropolitan planning agencies, in this case theCapital Region Planning Commission in Baton Rouge. Specifically,the 2000 CTPP Part 1 provides data similar to traditional censusdata by area of residence, and the 2000 CTPP Part 2 provides databy area of work (unique among all census products) such as thenumber of jobs (employment). We extracted the population datafrom the US Census Summary File 1 (SF1), and the employmentdata from the CTPP Part 2, both at the census tract level. The spatialGIS data of the study area (i.e., census tracts and road network)came from the Environmental Systems Research Institute website at www.esri.com/data/download/census2000_tigerline/index.html.
3. Research methods
3.1. Data preparation
This study uses a primal approach for the road network repre-sentation. In contrast to the dual representation that disregardsthe metric nature of a street network, the primal approach repre-sents intersections as nodes and road segments as links (or edges)with lengths that connect nodes (see Jiang and Claramunt, 2004).The original road network file for the study area had 14,935 nodesand 19,892 links. In order to simplify the network structure andminimize computation time, we used some editing tools EditTools3.6 for ArcView 3.x from the ET SpatialTechniques (www.ian-ko.-com) to form a road network consisting of nodes that are trulythe starting and end points of a street segment and links betweenthese nodes. The resulting network has 12,235 nodes and 17,219links with attributes such as updated link IDs, lengths, two endnodes’ IDs and their corresponding coordinates.
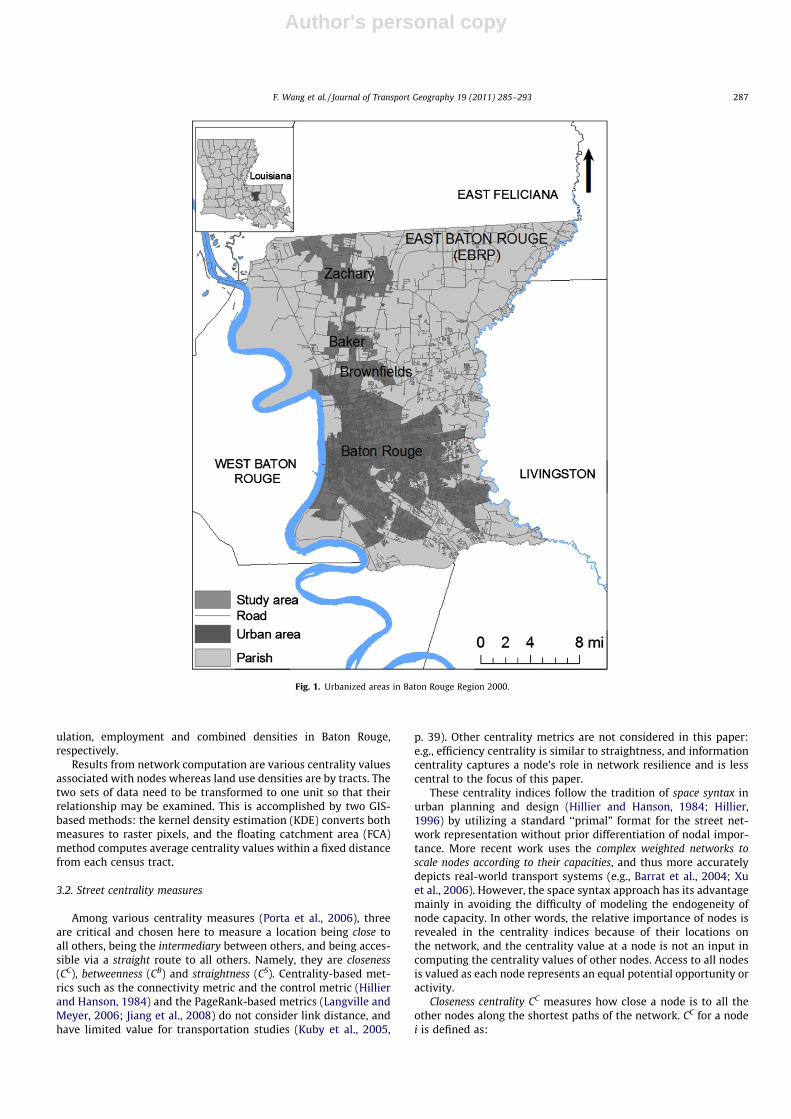
As explained earlier, population and employment densities areused as proxies for land use intensity. The study area has 89 censustracts. The CTPP data were processed and integrated into one GISlayer containing population and employment information for thecensus tracts. In addition to population density and employmentdensity per square kilometer separately, this study developed acombined density to integrate employment (daytime) and popula-tion (evening-time) densities together for an overall measure ofland use intensity. Considering only a fraction of residents partici-pate in the labor force, one resident is discounted by the citywidelabor participation ratio (LPR) to be comparable to one job. In otherwords,
combined density¼ employment densityþ population density� LPR
where LPR in our study area is 0.5213 (i.e., ratio of total employ-ment 224,550 vs. total population 430,770). Fig. 2a–c show the pop-
286 F. Wang et al. / Journal of Transport Geography 19 (2011) 285–293
Author's personal copy
ulation, employment and combined densities in Baton Rouge,respectively.
Results from network computation are various centrality valuesassociated with nodes whereas land use densities are by tracts. Thetwo sets of data need to be transformed to one unit so that theirrelationship may be examined. This is accomplished by two GIS-based methods: the kernel density estimation (KDE) converts bothmeasures to raster pixels, and the floating catchment area (FCA)method computes average centrality values within a fixed distancefrom each census tract.
3.2. Street centrality measures
Among various centrality measures (Porta et al., 2006), threeare critical and chosen here to measure a location being close toall others, being the intermediary between others, and being acces-sible via a straight route to all others. Namely, they are closeness(CC), betweenness (CB) and straightness (CS). Centrality-based met-rics such as the connectivity metric and the control metric (Hillierand Hanson, 1984) and the PageRank-based metrics (Langville andMeyer, 2006; Jiang et al., 2008) do not consider link distance, andhave limited value for transportation studies (Kuby et al., 2005,
p. 39). Other centrality metrics are not considered in this paper:e.g., efficiency centrality is similar to straightness, and informationcentrality captures a node’s role in network resilience and is lesscentral to the focus of this paper.
These centrality indices follow the tradition of space syntax inurban planning and design (Hillier and Hanson, 1984; Hillier,1996) by utilizing a standard ‘‘primal” format for the street net-work representation without prior differentiation of nodal impor-tance. More recent work uses the complex weighted networks toscale nodes according to their capacities, and thus more accuratelydepicts real-world transport systems (e.g., Barrat et al., 2004; Xuet al., 2006). However, the space syntax approach has its advantagemainly in avoiding the difficulty of modeling the endogeneity ofnode capacity. In other words, the relative importance of nodes isrevealed in the centrality indices because of their locations onthe network, and the centrality value at a node is not an input incomputing the centrality values of other nodes. Access to all nodesis valued as each node represents an equal potential opportunity oractivity.
Closeness centrality CC measures how close a node is to all theother nodes along the shortest paths of the network. CC for a nodei is defined as:
Fig. 1. Urbanized areas in Baton Rouge Region 2000.
F. Wang et al. / Journal of Transport Geography 19 (2011) 285–293 287
Author's personal copy
CCi ¼
N � 1PN
j¼1;j–idij
ð1Þ
where N is the total number of nodes in the network, and dij is theshortest distance between nodes i and j. In other words, CC is the in-verse of average distance from this node to all other nodes. In es-sence, it reflects the travel cost of overcoming spatial separationsbetween places with population and activities. All distances in thispaper are in kilometers.
Betweenness centrality CB measures how often a node is tra-versed by the shortest paths connecting all pairs of nodes in thenetwork. CB is defined as:
CBi ¼
1ðN � 1ÞðN � 2Þ
XN
j¼1;k¼1;j–k–i
njkðiÞnjk
ð2Þ
where njk is the number of shortest paths between nodes j and k,and njk(i) is the number of these shortest paths that contain nodei. CB captures a special property for a place: it does not act as an ori-gin or a destination for trips, but as a pass-through point. CB repre-sents a node’s volume of through traffic.
Straightness centrality CS measures how much the shortest pathsfrom a node to all others deviate from the virtual straight lines(Euclidean distances) connecting them. CS is defined as:
CSi ¼
1N � 1
XN
j¼1;j–i
dEuclij
dijð3Þ
where dEuclij is the Euclidean distance between nodes i and j. CS mea-
sures the extent to which a place can be reached directly, like on astraight line, from all other places in a city. It is a quality that makesit prominent in terms of ‘‘legibility” and ‘‘presence” (Conroy-Dalton,2003).
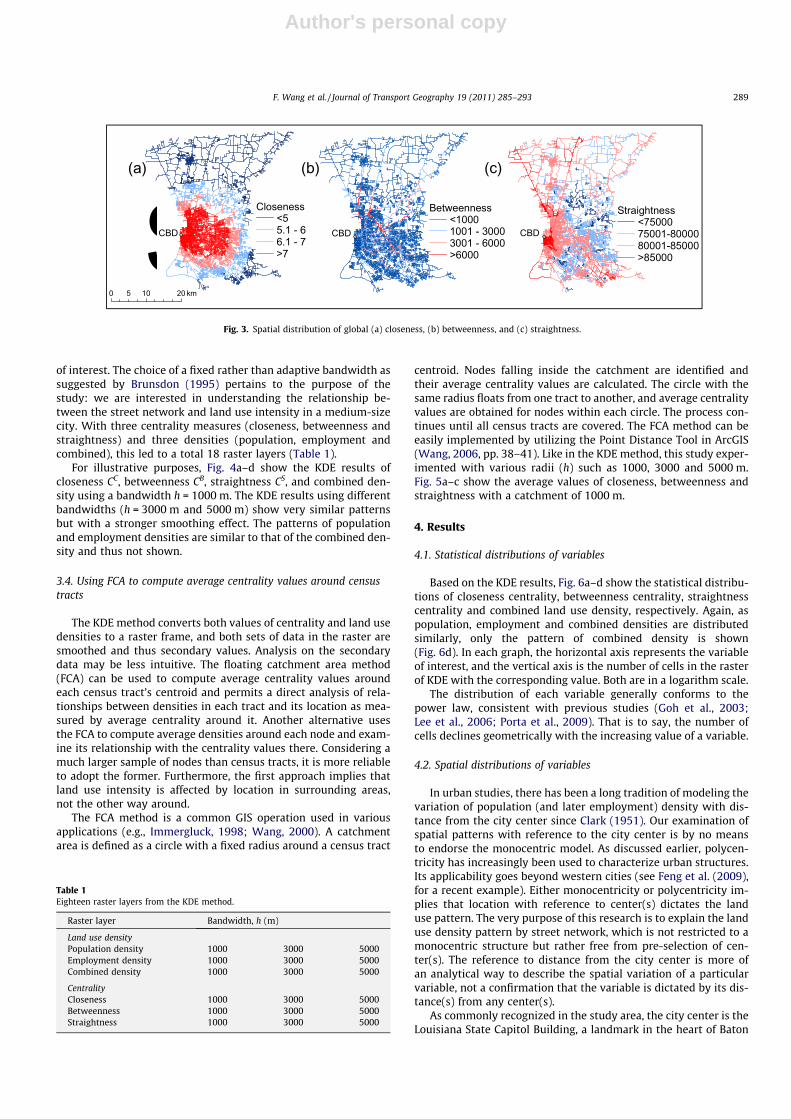
The above three global centrality indices were calculated in aC++ program, and the results were fed back into ArcGIS for map-ping and other spatial analysis. Fig. 3a–c show the spatial distribu-tions of closeness CC, betweenness CB and global straightness CS. Inthe maps, a centrality value for one link is computed as the averageof its two end nodes.
3.3. Using KDE to convert centrality and density values to one rasterframe
As explained earlier, the kernel density estimation (KDE) meth-od is used to transform both the street centrality and land use den-sity values into a new framework (i.e., a raster system) so that therelationship between them can be assessed at the same scale. Datatransformations from one scale or analysis unit to another utilizespatial smoothing or spatial interpolation techniques. There are richchoices for this task (Wang, 2006, pp. 37–47). While the choice of aparticular smoothing or interpolation technique should not signif-icantly affect the outcome of this research, this research uses theKDE.
The KDE estimates the density within a range (window) of eachobservation to represent the value at the center of the window.Within the window, the KDE weighs nearby objects more thanfar ones based on a kernel function (e.g., Fotheringham et al.,2000, pp. 146–149; O’Sullivan and Unwin, 2003, pp. 85–87).Among various kernel functions (Bailey and Gatrell, 1995, pp.83–108; Gatrell, 1994; Gatrell et al., 1996), popular choices includethe standard Gaussian (Levine, 2004, 2006; used in Crimestat) andquartic functions (Silverman, 1986, p. 76; used in ArcGIS).Epanechnikov (1969) finds that the choice among the various ker-nel functions does not affect significantly the outcomes of the pro-cess. The KDE generates a density of the events (discrete points) asa continuous field (e.g., raster). By using the density (or averageattributes) of nearby objects to represent the property at the mid-dle location, the KDE captures the very essence of location: it is notthe place itself but rather its surroundings that make it special andexplains its setting. Therefore, using the KDE here is not only con-venient with a built-in tool available in ArcGIS but also a necessityof accurately capturing the true intention of analyzing the relation-ship between two neighborhood features.
A rectangular area R consisting of 214,368 grid cells (462 rowsby 464 columns) was formed for the study area. Each cell was a100 m � 100 m square. Various methods are available for selectingan appropriate bandwidth (e.g., Silverman, 1986; Sheather andJones, 1991; Scott, 1992; Cao et al., 1994). Considering the averagenearest distance between the census tract centroids of about2200 m in the study area, we experimented with three search radiior bandwidths (h = 1000 m, 3000 m and 5000 m) for every variable
(b)(a) (c)
CBDCBDCBD
Combined density/sq km16.2 - 551.9
552 - 1162.7
1162.8- 1937.5
1937.6 - 4073.2
4073.3- 7315.7
1255- 2046.1
Employment density/sq km3.3 - 243.8
243.9 - 684.6
684.7 - 1254.9
2046.2 - 6275.8
24.8 - 493.1
Population density/sq km
493.2 - 1023.1
1023.2 - 1556.2
1556.3 - 2872.6
2872.7 - 4621.5
0 8 164 km
Fig. 2. Population, employment and combined densities in Baton Rouge 2000.
288 F. Wang et al. / Journal of Transport Geography 19 (2011) 285–293
Author's personal copy
of interest. The choice of a fixed rather than adaptive bandwidth assuggested by Brunsdon (1995) pertains to the purpose of thestudy: we are interested in understanding the relationship be-tween the street network and land use intensity in a medium-sizecity. With three centrality measures (closeness, betweenness andstraightness) and three densities (population, employment andcombined), this led to a total 18 raster layers (Table 1).
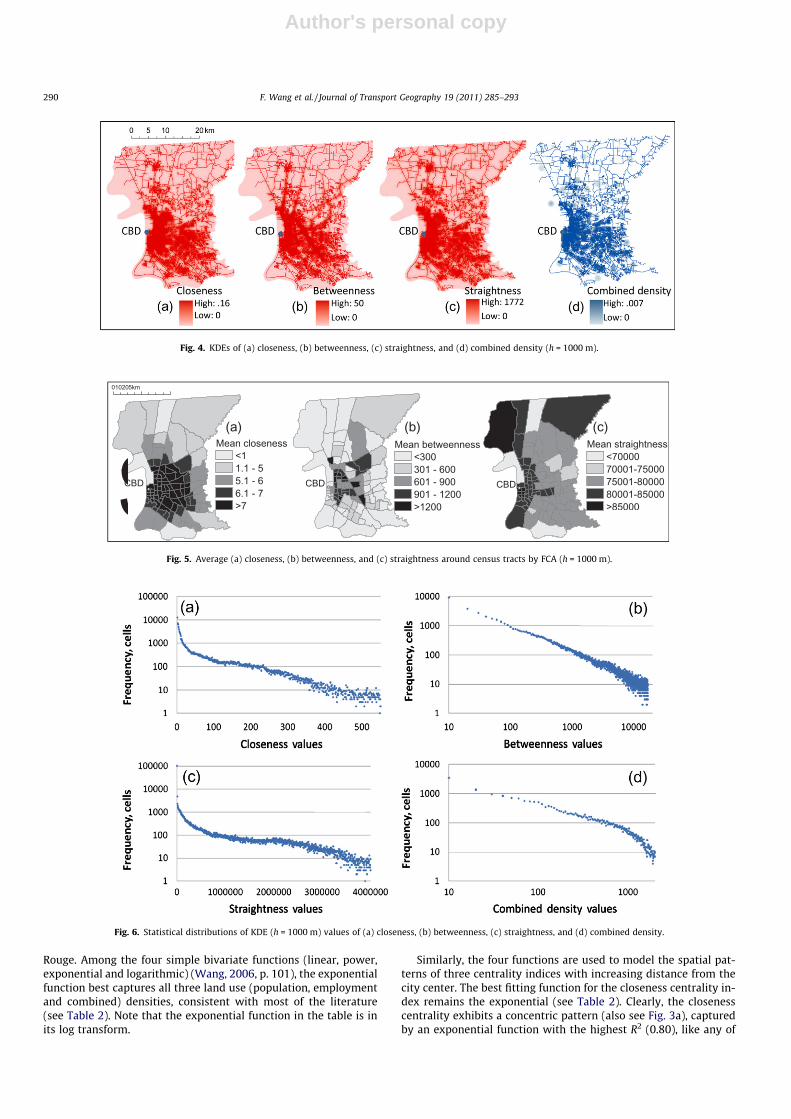
For illustrative purposes, Fig. 4a–d show the KDE results ofcloseness CC, betweenness CB, straightness CS, and combined den-sity using a bandwidth h = 1000 m. The KDE results using differentbandwidths (h = 3000 m and 5000 m) show very similar patternsbut with a stronger smoothing effect. The patterns of populationand employment densities are similar to that of the combined den-sity and thus not shown.
3.4. Using FCA to compute average centrality values around censustracts
The KDE method converts both values of centrality and land usedensities to a raster frame, and both sets of data in the raster aresmoothed and thus secondary values. Analysis on the secondarydata may be less intuitive. The floating catchment area method(FCA) can be used to compute average centrality values aroundeach census tract’s centroid and permits a direct analysis of rela-tionships between densities in each tract and its location as mea-sured by average centrality around it. Another alternative usesthe FCA to compute average densities around each node and exam-ine its relationship with the centrality values there. Considering amuch larger sample of nodes than census tracts, it is more reliableto adopt the former. Furthermore, the first approach implies thatland use intensity is affected by location in surrounding areas,not the other way around.
The FCA method is a common GIS operation used in variousapplications (e.g., Immergluck, 1998; Wang, 2000). A catchmentarea is defined as a circle with a fixed radius around a census tract
centroid. Nodes falling inside the catchment are identified andtheir average centrality values are calculated. The circle with thesame radius floats from one tract to another, and average centralityvalues are obtained for nodes within each circle. The process con-tinues until all census tracts are covered. The FCA method can beeasily implemented by utilizing the Point Distance Tool in ArcGIS(Wang, 2006, pp. 38–41). Like in the KDE method, this study exper-imented with various radii (h) such as 1000, 3000 and 5000 m.Fig. 5a–c show the average values of closeness, betweenness andstraightness with a catchment of 1000 m.
4. Results
4.1. Statistical distributions of variables
Based on the KDE results, Fig. 6a–d show the statistical distribu-tions of closeness centrality, betweenness centrality, straightnesscentrality and combined land use density, respectively. Again, aspopulation, employment and combined densities are distributedsimilarly, only the pattern of combined density is shown(Fig. 6d). In each graph, the horizontal axis represents the variableof interest, and the vertical axis is the number of cells in the rasterof KDE with the corresponding value. Both are in a logarithm scale.
The distribution of each variable generally conforms to thepower law, consistent with previous studies (Goh et al., 2003;Lee et al., 2006; Porta et al., 2009). That is to say, the number ofcells declines geometrically with the increasing value of a variable.
4.2. Spatial distributions of variables
In urban studies, there has been a long tradition of modeling thevariation of population (and later employment) density with dis-tance from the city center since Clark (1951). Our examination ofspatial patterns with reference to the city center is by no meansto endorse the monocentric model. As discussed earlier, polycen-tricity has increasingly been used to characterize urban structures.Its applicability goes beyond western cities (see Feng et al. (2009),for a recent example). Either monocentricity or polycentricity im-plies that location with reference to center(s) dictates the landuse pattern. The very purpose of this research is to explain the landuse density pattern by street network, which is not restricted to amonocentric structure but rather free from pre-selection of cen-ter(s). The reference to distance from the city center is more ofan analytical way to describe the spatial variation of a particularvariable, not a confirmation that the variable is dictated by its dis-tance(s) from any center(s).
As commonly recognized in the study area, the city center is theLouisiana State Capitol Building, a landmark in the heart of Baton
0 10 205 km
Closeness<55.1 - 66.1 - 7>7
Betweenness<10001001 - 30003001 - 6000>6000
Straightness<7500075001-8000080001-85000>85000
(c)(b)(a)
CBD CBD CBD
Fig. 3. Spatial distribution of global (a) closeness, (b) betweenness, and (c) straightness.
Table 1Eighteen raster layers from the KDE method.
Raster layer Bandwidth, h (m)
Land use densityPopulation density 1000 3000 5000Employment density 1000 3000 5000Combined density 1000 3000 5000
CentralityCloseness 1000 3000 5000Betweenness 1000 3000 5000Straightness 1000 3000 5000
F. Wang et al. / Journal of Transport Geography 19 (2011) 285–293 289
Author's personal copy
Rouge. Among the four simple bivariate functions (linear, power,exponential and logarithmic) (Wang, 2006, p. 101), the exponentialfunction best captures all three land use (population, employmentand combined) densities, consistent with most of the literature(see Table 2). Note that the exponential function in the table is inits log transform.
Similarly, the four functions are used to model the spatial pat-terns of three centrality indices with increasing distance from thecity center. The best fitting function for the closeness centrality in-dex remains the exponential (see Table 2). Clearly, the closenesscentrality exhibits a concentric pattern (also see Fig. 3a), capturedby an exponential function with the highest R2 (0.80), like any of
Fig. 4. KDEs of (a) closeness, (b) betweenness, (c) straightness, and (d) combined density (h = 1000 m).
010205km
Mean straightness<7000070001-7500075001-8000080001-85000>85000
Mean betweenness<300301 - 600601 - 900901 - 1200>1200
Mean closeness<11.1 - 55.1 - 66.1 - 7>7
(c)(b)(a)
CBD CBD CBD
Fig. 5. Average (a) closeness, (b) betweenness, and (c) straightness around census tracts by FCA (h = 1000 m).
Fig. 6. Statistical distributions of KDE (h = 1000 m) values of (a) closeness, (b) betweenness, (c) straightness, and (d) combined density.
290 F. Wang et al. / Journal of Transport Geography 19 (2011) 285–293
Author's personal copy
the three land use densities. In other words, the commonly ob-served population density pattern (i.e., exponentially decliningfrom the city center) is largely due to declining location advantagewith distance from the city center (particularly accessibility to allother places) shaped by the road network. This is different fromthe reliance of monocentric assumption of a single job center inthe central business district in the Mills–Muth economic model.The assumption has a significant gap from empirical evidence. Inthe study area, employment has increasingly been decentralizedover time, and conforms to a negative exponential function witha slightly steeper gradient (�0.1665) than that of the populationdensity function (�0.1180).
The spatial patterns of betweenness and straightness indicesare more complex than concentric (also see Fig. 3b and c). There-fore, none of the bivariate functions generates R2 higher than0.30. Nevertheless, the negative slopes in any regression models
remain statistically significant for both indices. The best fittingfunction for betweenness is still the exponential one with a lowR2 = 0.02, and for straightness is the logarithmic one with a moder-ate R2 = 0.27. That is to say, both the indices decline with distancefrom the city center in general, more so for straightness than forbetweenness; but there are local pockets of higher values outsideof the city center.
4.3. Correlation analysis
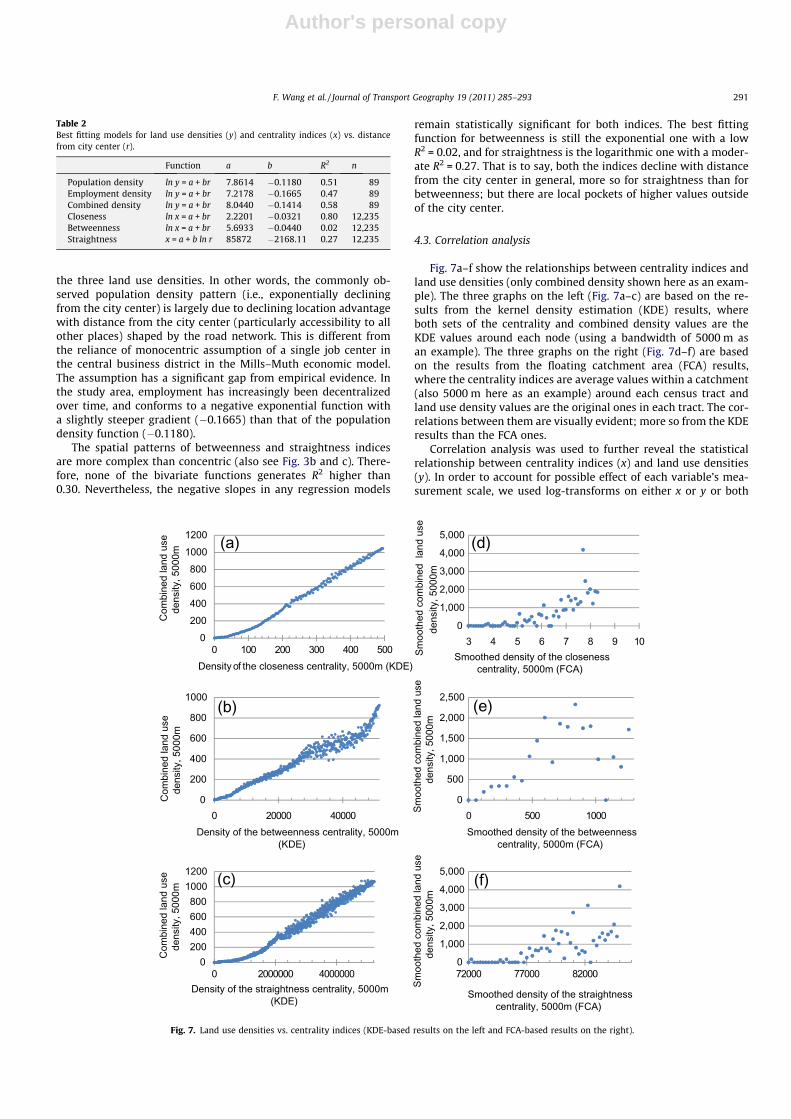
Fig. 7a–f show the relationships between centrality indices andland use densities (only combined density shown here as an exam-ple). The three graphs on the left (Fig. 7a–c) are based on the re-sults from the kernel density estimation (KDE) results, whereboth sets of the centrality and combined density values are theKDE values around each node (using a bandwidth of 5000 m asan example). The three graphs on the right (Fig. 7d–f) are basedon the results from the floating catchment area (FCA) results,where the centrality indices are average values within a catchment(also 5000 m here as an example) around each census tract andland use density values are the original ones in each tract. The cor-relations between them are visually evident; more so from the KDEresults than the FCA ones.
Correlation analysis was used to further reveal the statisticalrelationship between centrality indices (x) and land use densities(y). In order to account for possible effect of each variable’s mea-surement scale, we used log-transforms on either x or y or both
Table 2Best fitting models for land use densities (y) and centrality indices (x) vs. distancefrom city center (r).
Function a b R2 n
Population density ln y = a + br 7.8614 �0.1180 0.51 89Employment density ln y = a + br 7.2178 �0.1665 0.47 89Combined density ln y = a + br 8.0440 �0.1414 0.58 89Closeness ln x = a + br 2.2201 �0.0321 0.80 12,235Betweenness ln x = a + br 5.6933 �0.0440 0.02 12,235Straightness x = a + b ln r 85872 �2168.11 0.27 12,235
0
200
400
600
800
1000
1200
0 100 200 300 400 500
Com
bine
d la
nd u
se
dens
ity, 5
000m
Density of the closeness centrality, 5000m (KDE)
0
200
400
600
800
1000
0 20000 40000
Com
bine
d la
nd u
se
dens
ity, 5
000m
Density of the betweenness centrality, 5000m (KDE)
0200400600800
10001200
0 2000000 4000000
Com
bine
d la
nd u
se
dens
ity, 5
000m
Density of the straightness centrality, 5000m (KDE)
0
1,000
2,000
3,000
4,000
5,000
3 4 5 6 7 8 9 10
Smoo
thed
com
bine
d la
nd u
se
dens
ity, 5
000m
Smoothed density of the closeness centrality, 5000m (FCA)
0
500
1,000
1,500
2,000
2,500
0 500 1000Smoo
thed
com
bine
d la
nd u
se
dens
ity, 5
000m
Smoothed density of the betweennesscentrality, 5000m (FCA)
0
1,000
2,000
3,000
4,000
5,000
72000 77000 82000
Smoo
thed
com
bine
d la
nd u
se
dens
ity, 5
000m
Smoothed density of the straightness centrality, 5000m (FCA)
(a) (d)
(b)
(c) (f)
(e)
Fig. 7. Land use densities vs. centrality indices (KDE-based results on the left and FCA-based results on the right).
F. Wang et al. / Journal of Transport Geography 19 (2011) 285–293 291
Author's personal copy
in addition to plain x vs. y, and thus yielded four scenarios (x vs. y,ln x vs. y, x vs. ln y, ln x vs. ln y). All four scenarios on the KDE resultswere very similar, and Table 3 reports the correlation coefficientsbetween x and y. Table 4 reports the correlation coefficients basedon the FCA results (highest coefficient values generated betweenln x and ln y).
Two important findings can be obtained from Tables 3 and 4.The first is the strong correlations between the centrality indicesand land use densities in general. Secondly, among the three cen-trality indices, closeness exhibits the highest correlation with landuse densities, straightness the next and betweenness the last. Thatis to say, the classic notion of location as being close to all placesremains the strongest predictor for land use intensity in BatonRouge. For a medium-size city like Baton Rouge, residents andbusinesses may value access to citywide opportunities, all reach-able within a reasonable distance (time). For a large city with awide territory, not all opportunities are relevant, and it is conceiv-able that local centrality indices (based on areas within a searchrange of a node) may be better predictors of land use patterns thantheir global counterparts (based on all areas). A prior study in anItalian city reports that betweenness has a higher correlation withdensities of retail and service activities (one of many land usetypes) than closeness (Porta et al., 2009).
As explained earlier, the KDE values were smoothed and thussecondary values of centrality and land use densities. In contrast,the FCA method was only applied to obtain average centrality val-ues around each census tract, and thus only the centrality values inthe correlation analysis were smoothed. Therefore, understandablythe correlation coefficients based on the KDE results (as high as0.92 between combined density and closeness with a 5-km band-width) are noticeably higher than those based on the FCA results(e.g., 0.84 as the highest between combined density and closenesswith a 5-km catchment radius). In Table 3 on the KDE results, a lar-ger bandwidth leads to a stronger smoothing effect, and thus thecorrelation coefficients are higher. In Table 4, the effect of catch-
ment radius is less obvious. That is to say, land use densities are al-most equally related to centralities within various ranges.
5. Conclusions
This paper investigates the relationship between street central-ity and land use density in Baton Rouge, Louisiana. Based on theroad network composed of links (roads) and nodes (intersectionsof the roads), street centrality is quantified by three indices. Close-ness centrality measures how close a node is to all the other nodesalong the shortest paths of the network. Betweenness centralitymeasures how often a node is traversed by the shortest paths con-necting all pairs of nodes in the network. Straightness centralitymeasures how close the shortest paths from a node to all othersresemble virtual straight lines connecting them. The set of central-ity indices captures the very essence of location in terms of aplace’s accessibility, intermediacy and directness among others.Employment, population and their combined densities are usedto measure land use intensity. The kernel density estimation(KDE) and floating catchment areas (FCA) are used to convert thedata sets of centrality indices at nodes and land use densities incensus tracts to the same unit in order to investigate the associa-tion between them.
The statistical distributions of the KDE values of both centralityand land use densities conform to the power law, indicating geo-metrically declining locations with increasing centrality or densityvalues. The spatial patterns of population, employment and com-bined densities are concentric and are best captured by an expo-nential function. So is the closeness centrality index. Thebetweenness and straightness indices also decline with distancefrom the center (with negative slopes being statistically signifi-cant). However, the concentric pattern is far less evident for thebetweenness index, and moderately so for the straightness. Thecorrelation analysis shows a strong correlation between the streetcentrality indices and land use densities, supporting the notion ofstrong interdependence between the transport network and landuse structure in an intraurban setting. At times developmentencourages the construction of transport systems, whereas at othertimes the development of transportation helps the growth of a city(Vance, 1986, p. xiii). Only by analyzing data of both systems over asignificant period of time one may detect possible causality effectsbetween them.
Among the three centrality indices, closeness exhibits the high-est correlation with land use densities, straightness the next andbetweenness the last. The highest correlation coefficient is 0.92(i.e., R2 = 0.84) between combined density and closeness with a5-km bandwidth based on the KDE results, and 0.84 (i.e.,R2 = 0.71) between combined density and closeness with a 5-kmcatchment radius based on the FCA results. The less-than-perfectR2 is attributable to many factors. To list a few, the factors includethe time lag between road development and land use patterns, var-ious amenities valued by residents and business owners in addi-tion to location captured by centrality indices, and other complexsocial issues (e.g., possible discrimination in housing and job mar-kets, imperfect information in decision making). Given the wideavailability of data (street network and population/employmentdensities), validity of the results can be tested by empirical studiesin any cities in the US.
Acknowledgment
The first author would like to acknowledge the support by theNational Natural Science Foundation of China (No. 40928001).We thank Andrew Goetz and three anonymous reviewers for con-structive comments on earlier versions of the paper.
Table 3Correlation coefficients between KDEs of land use densities and centrality indices.
Bandwidth (m) Populationdensity
Employmentdensity
Combineddensity
1000 Closeness (CC) 0.64 0.42 0.56Betweenness (CB) 0.43 0.24 0.35Straightness (CS) 0.62 0.41 0.54
3000 Closeness (CC) 0.91 0.76 0.86Betweenness (CB) 0.81 0.66 0.76Straightness (CS) 0.89 0.73 0.83
5000 Closeness (CC) 0.95 0.88 0.92Betweenness (CB) 0.79 0.82 0.86Straightness (CS) 0.92 0.85 0.90
Table 4Correlation coefficients between land use densities and FCA-smoothed centralityindices (both in log-scales).
Catchmentradius (m)
Populationdensity
Employmentdensity
Combineddensity
1000 Closeness (CC) 0.78 0.77 0.83Betweenness (CB) 0.47 0.34 0.45Straightness (CS) 0.56 0.51 0.55
3000 Closeness (CC) 0.80 0.78 0.84Betweenness (CB) 0.43 0.36 0.43Straightness (CS) 0.42 0.56 0.51
5000 Closeness (CC) 0.81 0.77 0.84Betweenness (CB) 0.42 0.34 0.41Straightness (CS) 0.50 0.59 0.57
292 F. Wang et al. / Journal of Transport Geography 19 (2011) 285–293
Author's personal copy
References
Barabási, A.-L., 2002. Linked: The New Science of Networks. Plume, New York.Bailey, T.C., Gatrell, A.C., 1995. Interactive Spatial Data Analysis. Longman, Harlow,
England.Barrat, A., Barthélemy, M., Pastor-Satorras, R., Vespignani, A., 2004. The architecture
of complex weighted networks. In: Proceedings of the National Academy ofSciences of the USA, vol. 101, pp. 3747–3752.
Batty, M., 2005. Network geography: relations, interactions, scaling and spatialprocesses in GIS. In: Unwin, D.J., Fisher, P. (Eds.), Re-presenting GeographicalInformation Systems. John Wiley and Sons, Chichester, pp. 149–170.
Batty, M., 2008. Whither network science? Environment and Planning B: Planningand Design 35, 569–571.
Berry, B.J.L., Kim, H., 1993. Challenges to the monocentric model. GeographicalAnalysis 25, 1–4.
Borruso, G., 2003. Network density and the delimitation of urban areas.Transactions in GIS 72, 177–191.
Borruso, G., 2005. Network density estimation: analysis of point patterns over anetwork. In: Gervasi, O., Gavrilova, M.L., Kumar, V., Laganà, A., Lee, H.P., Mun, Y.,Taniar, D., Tan, C.J.K. (Eds.), Computational Science and its Applications (ICCSA2005). Berlin, Springer Lecture Notes in Computer Science No. 3482, pp. 126–132.
Borruso, G., 2008. Network density estimation: a GIS approach for analysing pointpatterns in a network space. Transactions in GIS 12, 377–402.
Brunsdon, C., 1995. Estimating probability surfaces for geographical points data: anadaptive Kernel algorithm. Computers and Geosciences 21, 877–984.
Cao, R., Cuevas, A., González-Manteiga, W., 1994. A comparative study of severalsmoothing methods in density estimation. Computational Statistics and DataAnalysis 17, 153–176.
Casetti, E., 1993. Spatial analysis: perspectives and prospects. Urban Geography 14,526–537.
Clark, C., 1951. Urban population densities. Journal of the Royal Statistical Society114, 490–494.
Conroy-Dalton, R., 2003. The secrete is to follow your nose: route path selection andangularity. Environment and Behavior 35, 107–131.
Downs, J.A., Horner, M.W., 2007a. Characterising linear point patterns. In:Proceedings of the GIScience Research UK Conference (GISRUK), Maynooth,Ireland.
Downs, J.A., Horner, M.W., 2007b. Network-based kernel density estimation forhome range analysis. In: Proceedings of the Ninth International Conference onGeocomputation, Maynooth, Ireland.
Epanechnikov, V., 1969. Nonparametric estimation of a multivariate probabilitydensity. Theory of Probability and its Applications 14, 153–158.
Feng, J., Wang, F., Zhou, Y.-X., 2009. Spatial restructuring of population in Beijingmetropolitan area: from monocentricity to polycentricity. Urban Geography 30,779–802.
Fotheringham, A.S., Brunsdon, C., Charlton, M., 2000. Quantitative Geography:Perspectives on Spatial Data Analysis. Sage, London.
Garin, R.A., 1966. A matrix formulation of the Lowry model for intrametropolitanactivity allocation. Journal of the American Institute of Planners 32, 361–364.
Gatrell, A., 1994. Density estimation and the visualisation of point patterns. In:Hearnshaw, H.M., Unwin, D. (Eds.), Visualisation in Geographical InformationSystems. John Wiley and Sons, Chichester, pp. 65–75.
Gatrell, A., Bailey, T., Diggle, P., Rowlingson, B., 1996. Spatial point pattern analysisand its application in geographical epidemiology. Transactions of the Instituteof British Geographers 21, 256–274.
Goh, K.-I., Oh, E., Kahng, B., Kim, D., 2003. Betweenness centrality correlation insocial networks. Physical Review E 67, 017101.
Hansen, W., 1959. How accessibility shapes land use. Journal of the AmericanInstitute of Planners 25, 73–76.
Heikkila, E.P., Gordon, P., Kim, J., Peiser, R., Richardson, H., Dale-Johnson, D., 1989.What happened to the CBD-distance gradient? Land values in a polycentric city.Environment and Planning A 21, 221–232.
Hillier, B., 1996. Space is the Machine: A Configurational Theory of Architecture.Cambridge University Press, Cambridge.
Hillier, B., Hanson, J., 1984. The Social Logic of Space. Cambridge University Press,Cambridge.
Hoch, I., Waddell, P., 1993. Apartment rents: another challenge to the monocentricmodel. Geographical Analysis 25, 20–34.
Immergluck, D., 1998. Job Proximity and the Urban Employment Problem: DoSuitable Nearby Jobs. Improve Neighbourhood Employment Rates? 35, 7–23
Jiang, B., Claramunt, C., 2004. Topological analysis of urban street networks.Environment and Planning B 31, 151–162.
Jiang, B., Zhao, S., Yin, J., 2008. Self-organized natural roads for predicting trafficflow: a sensitivity study. Journal of Statistical Mechanics – Theory andExperiment (Article Number P07008).
Kuby, M., Tierney, S., Roberts, T., Upchurch, C., 2005. A Comparison of GeographicInformation Systems, Complex Networks, and Other Models for AnalyzingTransportation Network Topologies. NASA/CR-2005-213522.
Ladd, H.F., Wheaton, W., 1991. Causes and consequences of the changing urbanform: introduction. Regional Science and Urban Economics 21, 157–162.
Langville, A.N., Meyer, C.D., 2006. Google’s PageRank and Beyond: The Science ofSearch Engine Rankings. Princeton University Press, Princeton, NJ.
Lee, S.H., Kim, P.-J., Jeong, H., 2006. Statistical properties of sampled networks.Physical Review E 73, 016102.
Levine, N., 2004. CrimeStat III: A Spatial Statistics Program for the Analysis of CrimeIncident Locations (Version 3.0). National Institute of Justice, Washington, DC.
Levine, N., 2006. Crime mapping and the CrimeStat program. Geographical Analysis38, 41–56.
Lowry, I.S., 1964. A Model of Metropolis. Rand Corporation, Santa Monica, CA.Miller, H.J., 1999. Measuring space–time accessibility benefits within transportation
networks: basic theory and computational methods. Geographical Analysis 31,187–212.
Mills, E.S., 1972. Studies in the Structure of the Urban Economy. Johns HopkinsUniversity, Baltimore.
Muth, R., 1969. Cities and Housing. University of Chicago, Chicago.Okabe, A., Okunuki, K., Shiode, S., 2006a. SANET: a toolbox for spatial analysis on a
network. Geographical Analysis 38, 57–66.Okabe, A., Okunuki, K., Shiode, S., 2006b. The SANET toolbox: new methods for
network spatial analysis. Transactions in GIS 10, 535–550.O’Sullivan, D., Unwin, D.J., 2003. Geographic Information Analysis. John Wiley and
Sons, Chichester.Park, R.E., Burgess, E.W., McKenzie, R.D., 1925. The City: Suggestions for the
Investigation of Human Behavior in the Urban Environment. University ofChicago Press, Chicago.
Porta, S., Crucitti, P., Latora, V., 2006. The network analysis of urban streets: a primalapproach. Environment and Planning B: Planning and Design 33, 705–725.
Porta, S., Latora, V., Wang, F., Strano, E., Cardillo, A., Iacoviello, V., Messora, R.,Scellato, S., 2009. Street centrality and densities of retails and services inBologna, Italy. Environment and Planning B 36, 450–465.
Scott, D., 1992. Multivariate Density Estimation: Theory, Practice and Visualisation.Wiley, New York.
Sheather, S.J., Jones, M.C., 1991. A reliable data-based bandwidth selection methodfor kernel density estimation. Journal of the Royal Statistical Society Series B 53,683–690.
Silverman, B.W., 1986. Density Estimation for Statistics and Data Analysis. Chapmanand Hall, London.
Vance Jr., J.E., 1986. Capturing the Horizon: The Historical Geography ofTransportation since the Transportation Revolution of the Sixteenth Century.Harper & Row, New York.
Wang, F., 1998. Urban population distribution with various road networks: asimulation approach. Environment and Planning B: Planning and Design 25,265–278.
Wang, F., 2000. Modeling commuting patterns in Chicago in a GIS environment: ajob accessibility perspective. Professional Geographer 52, 120–133.
Wang, F., 2006. Quantitative Methods and Applications in GIS. Taylor & Francis,Boca Raton, FL.
Wang, F., Guldmann, J.M., 1996. Simulating urban population density with agravity-based model. Socio-Economic Planning Sciences 30, 245–256.
Xu, X.-J., Wu, Z.-X., Wang, Y.-H., 2006. Properties of weighted complex networks.International Journal of Modern Physics C 17, 521–529.
F. Wang et al. / Journal of Transport Geography 19 (2011) 285–293 293