author's personal copy - bioenergy 2020...author's personal copy conversion of mixed...
TRANSCRIPT

This article appeared in a journal published by Elsevier. The attachedcopy is furnished to the author for internal non-commercial researchand education use, including for instruction at the authors institution
and sharing with colleagues.
Other uses, including reproduction and distribution, or selling orlicensing copies, or posting to personal, institutional or third party
websites are prohibited.
In most cases authors are permitted to post their version of thearticle (e.g. in Word or Tex form) to their personal website orinstitutional repository. Authors requiring further information
regarding Elsevier’s archiving and manuscript policies areencouraged to visit:
http://www.elsevier.com/copyright

Author's personal copy
Conversion of mixed plastic wastes in a dual fluidized bed steam gasifier
V. Wilk a,⇑, H. Hofbauer b
a Bioenergy2020+ GmbH, Wienerstraße 49, 7540 Güssing, Austriab Institute of Chemical Engineering, Vienna University of Technology, Getreidemarkt 9/166, 1060 Vienna, Austria
h i g h l i g h t s
" Steam gasification of plastic materials in a dual fluidized bed pilot plant." The product gas from PE is rich in CH4 and C2H4." The polymer mixtures behave differently from the pure substances." Mixtures interact strongly, higher gas yield and enhances reforming reactions." Extensive tar formation.
a r t i c l e i n f o
Article history:Received 2 November 2012Received in revised form 9 January 2013Accepted 30 January 2013Available online 15 February 2013
Keywords:PolyethylenePolypropylenePolystyrenePETSteam gasification
a b s t r a c t
Steam gasification of plastic materials was studied in a dual fluidized bed gasification pilot plant (DFB).Several types of plastics, which are available in large amounts in waste streams, were investigated: PE, PP,and mixtures of PE + PS, PE + PET and PE + PP. It was found that the product gas from PE was rich in CH4
and C2H4 and had a LCV of 25 MJ/N m3. About 22% of PE was converted to the monomer C2H4. Differentmixtures of PE with other polymers showed, that the concentrations of CH4 and C2H4 increased with anincreasing proportion of PE and that they were the main decomposition products of PE. The product gasfrom pure PP contained more CH4 and less C2H4 compared to the product gas from PE. The polymer mix-tures behaved differently from the pure substances. Significantly more H2 and CO were generated fromPE + PP and PE + PS. It can be assumed that the decomposition products of the two polymers in the mix-ture interacted strongly and alternately influenced the gasification process. More water was converted, sothe gas production increased. The reforming reactions were enhanced and yielded H2 and CO at theexpense of CH4 and C2H4. The mixture of PE + PET differed from the other polymers because of the highoxygen content of PET. Thus, 28% of CO2 were measured in the product gas. By contrast, CO2 was in therange of 8%, when oxygen-free polymers were gasified and CO2 was only produced from reactions withsteam. Gasification of polymers resulted in significantly high tar loads in the product gas in the range of100 g/N m3. The GCMS analysis of tars showed that tars from polymers mainly consisted of PAH and aro-matics. Naphthalene was the most important tar compound.
� 2013 Elsevier Ltd. All rights reserved.
1. Introduction
Modern societies generate more and more plastic residuesevery year as the quantity of disposable commodities increases.In 2007, 10% of the municipal solid waste in Austria consisted of
plastics [1]. Different methods of plastic waste treatment are pos-sible: disposal at landfill sites, thermal recovery or mechanicalrecycling. The European Union aims to enhance the recycling ofwaste streams and gives priority to prevention and recycling overrecovery and disposal in the waste hierarchy [2]. Owing to initia-tives for selective collection, 35% of plastic residues have beenrecycled in a material-sensitive way in Austria in 2008. In thecountries of EU27, the share of material-sensitive recycling of plas-tics amounts to 30% [3]. Most commonly plastic residues are dis-posed of with the mass of municipal solid waste in wasteincineration plants. Gasification and pyrolysis are interesting ap-proaches for the thermal treatment of plastic residues, becausethey offer high conversion efficiency and recovery of the chemical
0016-2361/$ - see front matter � 2013 Elsevier Ltd. All rights reserved.http://dx.doi.org/10.1016/j.fuel.2013.01.068
Abbreviations: comb., combustion; DFB, dual fluidized bed; ER, equivalenceratio; EU 27, 27 member states of the European Union; gasif., gasification reactor;GCMS, gas chromatograph with mass spectrometer; LCV, lower calorific value; PAH,polyaromatic hydrocarbons; PE, polyethylene; PET, polyethylene terephthalate; PP,polypropylene; PS, polystyrene; S/C, steam-to-carbon ratio.⇑ Corresponding author. Tel.: +43 158801166387; fax: +43 15880116699.
E-mail addresses: [email protected] (V. Wilk), [email protected] (H. Hofbauer).
Fuel 107 (2013) 787–799
Contents lists available at SciVerse ScienceDirect
Fuel
journal homepage: www.elsevier .com/locate / fuel
Author's personal copy
energy of the plastic material. The gas generated in these processescan be used further for chemical synthesis processes.
Extensive studies are available in the literature on feedstockrecycling of plastics carried out in reactors of different types andscales. Many researchers have focused on pyrolysis or catalyticprocesses. Kaminsky et al. investigated fluidized bed pyrolysis ofvarious materials, for example mixed plastic waste from house-holds, polyethylene (PE) [4] or polyethylene terephthalate (PET)[5]. The aim of this process was the production of monomers forpolymer synthesis. The composition of the pyrolysis gas wasstrongly influenced by the feedstock and the fluidization media.The main pyrolysis products of PE were olefins, such as C2H4 andC3H6 and methane. Pyrolysis of PET also yielded acids, among thembenzoic acid and terephthalic acid, that decreased with an increasein the pyrolysis temperature. Serrano et al. tested specialized cat-alysts in a small screw kiln reactor for the catalytic degradationof PE. The focus of the work was the production of usable liquidsfrom polymers. Due to the reactor design the production of gaseswas considerably low. Thermal degradation of PE without catalystsyielded hydrocarbons in the boiling range of gasoline and middledistillates. The catalysts influenced the product distribution andsignificantly increased the amount of gasoline in the product[6,7]. Marcilla et al. also investigated catalysts for degradation ofPE and used a small fixed reactor [8]. They reported the formationof C3- and C4-hydrocarbons as the main products of thermal degra-dation. The use of catalysts enhanced the formation of C4- and C5-compounds. The reaction mechanisms that generate the differentproducts of pyrolysis processes have been described by Bockhornet al. The reactions of PE and polypropylene (PP) are radical chainreactions, and are described in [9]. The reactions of polystyrene(PS) can be found in [10].
Gasification processes of plastic materials are the topic of manyresearch activities. Numerous co-gasification studies of plastics,coal and/or biomass have been carried out in bubbling fluidizedbed gasifiers. Pinto et al. gasified different mixtures of PE and pinewood with steam [11]. With an increase in PE in the mixture, high-er gas yields were achieved and more H2, CH4 and CxHy, but less COand CO2 were formed. The highest share of PE in the mixture was60%. In another study, Pinto et al. investigated mixtures of coal, PEand pine wood and used air and steam as the fluidization agent[12]. A total of 10% PE in a mixture with coal increased the concen-tration of CH4 and CxHy and more tar was also generated. Pohorelyet al. [13] reported gasification of PET and coal. They used abubbling fluidized bed reactor fluidized with 10% oxygen in bulknitrogen. They stated that PET was far more reactive than coal
and thus consumed rapidly the available free oxygen. Therefore,coal decomposed more slowly with less contact to O2 and morebottom char was formed compared to coal gasification. In theproduct gas from PET and coal, more benzene, C2H4 and tar werefound. Ruoppolo et al. gasified pellets made of PE and pine woodwith a mixture of air and steam [14]. Compared to the gasificationof pine, more CH4 and more tar were measured. Mastellone et al.[15] investigated air gasification of mixed plastic waste, coal andwood in order to determine the influence of the different constitu-ents of the mixtures. Plastics increased the gas yield and the tarformation. As the product gas was richer in CH4 and light hydrocar-bons, the lower calorific value of the product gas increased. Allthese co-gasification studies show that gasification of plastic mate-rials enhances the formation of CH4, light hydrocarbons and tarand increase the gas yield.
There have also been some studies on the mono-gasification ofplastic materials in bubbling fluidized bed gasifiers. The use ofplastic materials in gasification processes caused some difficulties.Several authors reported problems with the feeding system, theformation of large amounts of fine black powder [11], as well aschar depositions and catalyst deactivation [7,8,16].
Mastral et al. [17] compared pyrolysis and air gasification of PEin a lab-scale gasifier. At 850 �C, the main products of PE were C2H4
and aromatics, which were found to be independent of the atmo-sphere in the gasifier. CO and CO2 were produced only during gas-ification via reactions with the gasification agent. Arena et al. [18]and Mastellone and Arena [16] gasified recycled PE with air andSancho et al. [19] and Xiao et al. [20] carried out gasification testswith PP waste in an air-blown gasifier. As different inert and cata-lytic bed materials were used, the results of these studies differmuch, however some similarities can be stated. Air gasification isa suitable conversion technology for PE and PP to yield a productgas with a lower calorific value of approximately 6 MJ/N m3. Theproduct gas composition strongly depends on the bed materialand the amount of fluidization air (the equivalence ratio; ER).The tar formation has been reported to be minimized by in-bedcatalysts.
Recently, two-stage gasification processes have been developedfor plastic materials; Wu and Williams investigated hydrogen pro-duction from several types of polymers and waste [21] in a two-stage fixed bed gasifier. In this reactor, polymers were pyrolyzedfirst and the pyrolysis gas was further converted by catalytic steamreforming. Kim et al. used a two-stage fluidized bed reactor [22] inorder to reduce the tar formation during the gasification of mixedplastic waste.
Nomenclature
CxHy sum of C2H6, C3- and C4-gaseous hydrocarbons (vol.%)k excess air ratio (kg/kg)_m mass flow (kg/h)_mcarbon; feedstock mass flow of carbon in the feedstock (kg/h)_mH2O; consumed mass flow of water consumed in gasification reac-
tions (kg/h)_mH2O; feedstock mass flow of water in the feedstock (kg/h)_mH2O; fluidization mass flow of fluidization steam fed to the gasifica-
tion reactor (kg/h)_mO2 ; available mass flow of oxygen available in the combustion
reactor (kg/h)_mO2 ; stoichiometric mass flow of oxygen required for stoichiometric
combustion in the combustion reactor (kg/h)_mPE; feedstock mass flow of PE in the feedstock mixture (kg/h)
N m3 volume at 273.15 K and 101,325 Pa (m3)P power (kW)
Pbed,in power of bed material coming into the gasification reac-tor (kW)
Pbed,out power of bed material leaving the gasification reactor(kW)
Pfuel,combustion power of fuel fed to the combustion reactor (lightfuel oil at pilot plant) (kW)
Pfeedstock power of feedstock inserted into the gasification reactor(PE, PP, etc.) (kW)
SPC specific power of combustion (kW/kW)SPG specific power of gasification (kW/kW)XH2O water conversion (%)XPE PE conversion to ethylene (%)vol.% concentration based on volume m3/m3 � 100%wt.% concentration based on weight kg/kg�100%
788 V. Wilk, H. Hofbauer / Fuel 107 (2013) 787–799

Author's personal copy
Besides these investigations at laboratory scale, there are alsoseveral industrial gasifiers, where plastic residues are used as feed-stock. Mixtures of plastic residues and other fuels are gasified in airblown large scale circulating fluidized bed gasifiers in Lahti [23],Rüdersdorf [24] and Grève-in-Chianti [25]. The new gasificationplant in Lahti recently started operation on refuse-derived fuels,which consist mainly of plastics and paper [26]. Automotive shred-der residues and other plastic waste are used as feedstock for apyrolysis plant coupled to the boiler of a hard coal power plant[27]. However, there have been no detailed studies on the gasifica-tion behavior of these plastic wastes.
The literature cited above primarily describes how plastic mate-rials are converted by air blown bubbling fluidized bed gasification,whereas the number of publications on the mono-gasification ofplastics is limited. Only little information is available on steamgasification.
This paper presents the results of a study on steam gasificationof plastic materials in a dual fluidized bed gasifier. Several types ofplastics, which are available in large amounts in waste streams,were investigated in a 100 kW pilot plant: PE, PP, mixtures ofPE + PS, mixtures of PE + PET and mixtures of PE + PP. The gasifica-tion characteristics of the materials were analyzed and the massand energy balances of the process are established. Special focuswas placed on the conversion of PE and PP to their monomers inthe product gas as well as on tar formation.
2. Dual fluidized bed gasification
Since the 1990s, steam blown dual fluidized bed (DFB) gasifica-tion technology has been subject of scientific studies at ViennaUniversity of Technology [28,29]. The basic principle of the DFBreactor is shown in Fig. 1. Gasification and combustion take placein separate reactors, which are thermally connected by a circulat-ing bed material. Feedstock is inserted in the gasification reactor,where it reacts with steam and forms the product gas. Some unga-sified char remains and it is transported to the combustion reactorwith the bed material. Char is combusted with air and thus the bedmaterial is heated up. The bed material is separated from the fluegas stream, returns to the gasification reactor and supplies the heatfor the endothermic gasification reactions. Two different gasstreams are yielded: product gas and conventional flue gas.
The gasification system was originally designed for the thermalconversion of biomass aiming at the generation of high qualityproduct gas. Steam is used as the fluidization and gasification agentin the gasification reactor of the DFB system and, therefore, theproduct gas has a high hydrogen content (>40%) and a moderatelower calorific value of 12–14 MJ/N m3, when wood is gasified.The DFB gasification process was demonstrated successfully in2001 with the first industrial sized plant in Güssing (Austria). It
has since exceeded an operation time of approximately 60,000 h.Further information on the demonstration plant is available in[30,31]. Several industrial gasifiers based on this technology arein operation or under construction by now, for example in Ober-wart (Austria), Villach (Austria), Senden/Neu-Ulm (Germany), andGothenburg (Sweden). In industrial gasifiers, the product gas isused for electricity production in a gas engine, as well as for heatsupply e.g. for district heating grids. Due to steam gasification,the product gas is also well-suited for chemical syntheses of inter-esting products. Various research activities at the locations of thegasification plants in Güssing and Oberwart focus on the produc-tion of hydrogen, Fischer–Tropsch diesel [32], synthetic naturalgas [33], and other chemicals [34].
3. Materials and methods
3.1. Pilot plant
Industrial DFB gasifiers mainly operate with wood chips fromthe forestry industry. However, alternative feedstock for these gas-ifiers are in increasing demand by operators. At Vienna Universityof Technology, a 100 kW pilot plant is operated for scientific pur-poses. It is similar in design to industrial DFB gasifiers and it isan essential tool for further development of the DFB gasifier andevaluation of new feedstock. Fig. 2 provides a schematic illustra-tion of the pilot plant.
The pilot plant is equipped with several gas-tight hoppers forfeedstock storage and feeding. Usually, the material is inserted di-rectly into the fluidized bed by the screw conveyor of hopper 1. Ontop of the gasification reactor, a special hopper for plastics hasbeen installed, hopper 3. There the screw conveyor transportsthe feedstock to a downpipe. The downpipe conically increases indiameter and has a water-cooled jacket in order to prevent meltingof the plastic material while feeding. The feedstock falls throughthe downpipe onto the fluidized bed.
Gasification takes place in a bubbling fluidized bed, which isgenerated by superheated steam. The temperature in the centerof the fluidized bed amounts to 850 �C. Olivine is used as bed mate-rial, because it shows moderate tar cracking activity and has good
Fig. 1. Basic principle of the dual fluidized bed gasification technology. Fig. 2. Schematic illustration of the 100 kW gasification pilot plant.
V. Wilk, H. Hofbauer / Fuel 107 (2013) 787–799 789

Author's personal copy
mechanical stability [35]. As different feedstock are investigated inthe pilot plant, the bed material is disposed of after each experi-ment and fresh material is used. Thus, it is ensured that all feed-stock are tested in the same environment. The gasification andthe combustion reactor are connected by loop seals. The loop sealsare fluidized with steam, so that the transport of solids is promotedand gas leakage between the two reactors is efficiently prevented.
The combustion reactor is fluidized with air. It is injected in twostages: primary air at the bottom of the reactor, where a dense flu-idized bed is formed, and secondary air at a higher level in order totransport particles to the top of the reactor. In the combustionreactor, heat is generated via char combustion for the gasificationreactions. In addition to char from the feedstock, some other fuelis inserted into the combustion reactor to control the temperaturein the gasification reactor. In industrial gasifiers, tars and char fromthe product gas and other combustible streams are recycled to thecombustion reactor for this purpose. In the pilot plant, light fuel oilis used instead of recycled streams. If no fuel is added to the com-bustion reactor, the temperature in the gasification reactor is mod-erated according to the energy demand of the gasification reactionsand the amount of char transported into the combustion reactortogether with the bed material. The bed material is heated by com-bustion; the temperature difference between the combustion andthe gasification reactor amounts to 40–60 �C on average. Bed mate-rial is precipitated from the flue gas stream and is returned to thegasification reactor. There, it supplies heat for the endothermicgasification reactions.
Fig. 2 does not present downstream equipment. After leavingthe gasifier, the product gas is cooled in a heat exchanger toapproximately 250 �C and is then sampled for analysis. Productgas and flue gas are mixed and combusted in a post-combustionchamber with air. A cyclone removes particles before the gasreaches the stack.
3.2. Measurement equipment
Extensive measurement equipment and automatic data record-ing are provided at the pilot plant. The main product gas compo-nents, H2, CO, CO2, CH4 and O2, are analyzed online with aRosemount NGA2000 device. C2H4, C2H6, N2 and the sum of gas-eous C3- and C4-hydrocarbons are measured with a Syntech Spec-tras GC 955 gas chromatograph, which samples every 20 min. Fluegas from the combustion reactor is also analyzed continuously. CO,CO2, O2, NO and SO2 are measured by a Rosemount NGA2000.
An impinger bottle method is used for tar measurement, whichwas developed at the Vienna University of Technology. It is basedon the conventional tar protocol, but has been adapted for theproduct gas from steam gasification. Toluene is used as tar absor-bent. It is immiscible with water, therefore water, dust, entrainedchar, and tar content of the product gas can be analyzed using asingle sample. Two different methods of tar analysis are applied:gravimetric tar and GCMS tar measurement. Gravimetric tars areweighed after vacuum evaporation of the solvent; they comprisemostly tars with a high molecular weight. A GCMS device (gaschromatography with mass spectrometer) is used to measure thecontent of 50 different tar species of medium molecular weightin the product gas. The measurement ranges of the two techniquesoverlap, therefore, both values are given. A further description oftar measurement is available in [36].
3.3. Mass and energy balances with IPSEpro
The process simulation tool IPSEpro is used for the evaluationand validation of the process data which are measured in theexperiments. IPSEpro offers stationary process simulation basedon flow sheets. The software uses an equation-oriented solver
and contains a comprehensive model library for gasification plants,which was developed at Vienna University of Technology. It is de-scribed in detail in [37]. The mass and energy balances of theexperimental runs are computed with IPSEpro. For this purpose,measured data from stationary operation of the pilot plant areused. An over-determined equation system is formed which issolved by the Method of Least Squares. More information aboutthis procedure can be found in [38]. The reconciled solution bestdescribes the actual operation of the pilot plant within the limitsof the model.
4. Feedstock
Several types of plastics, which are available in large amounts inwaste streams, were investigated in this study: PE, PP, mixtures ofPE + PS, mixtures of PE + PET and mixtures of PE + PP. These poly-mers are typically used for the production of foils and other typesof packaging for consumer goods. Most commonly, polymers areused in mixtures (blends) to adjust the properties of the product.Hence, three different mixtures of PE and other polymers were gas-ified, which are listed in Table 1. The mixtures were based on massand represent frequently used polymer blends. Polystyrene (PS) isused for packaging in the form of foils or foams. The main applica-tion of PET is the production of beverage bottles. For the experi-ments, the mixture of PE and PP, and the mixture of PE and PETwere made of granulates of the pure substances. The mixture ofPE and PS was in the form of flakes that were waste material froma foil production process. In addition to these mixtures, mono-gas-ification of PE and PP was also carried out using virgin polymers inorder to investigate the conversion process in more detail and toprovide a basis for comparison. Pure PE and PP were provided bythe manufacturer Borealis Polyolefine GmbH Austria in the formof granulates.
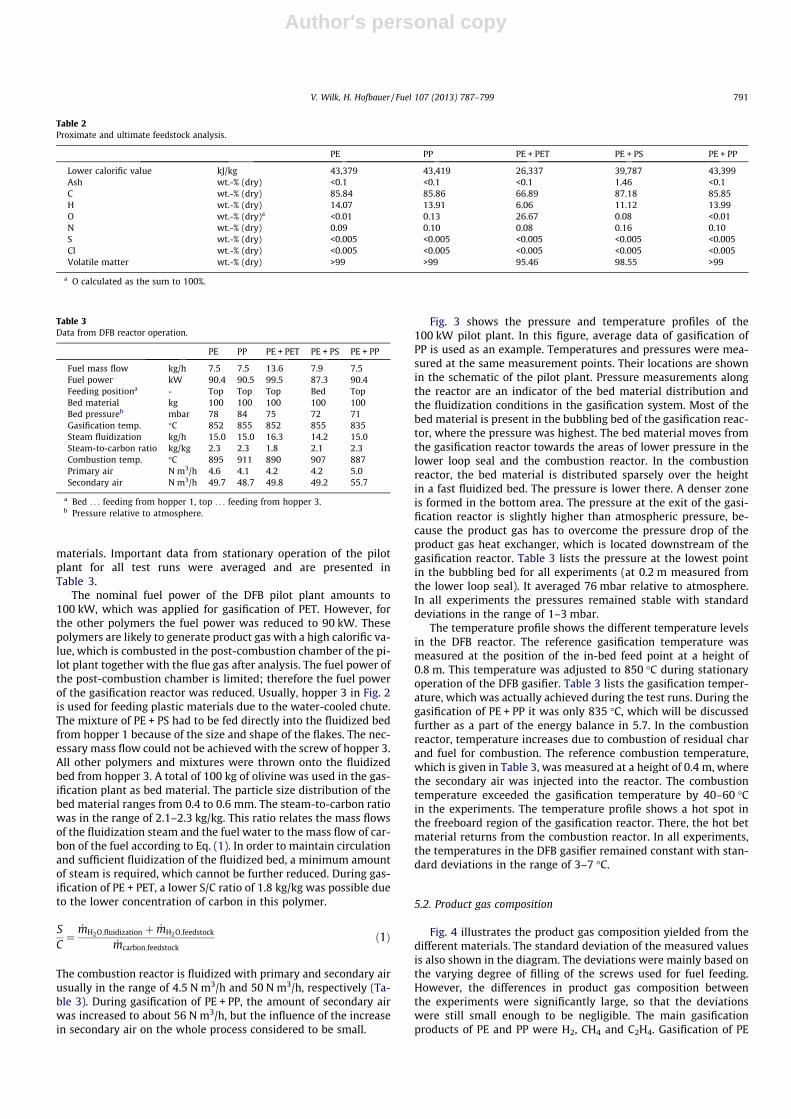
Table 2 presents the proximate and ultimate analysis of thepure substances and the mixtures. The main constituent of PP, PEand PE + PS was carbon. The carbon content amounted to approx-imately 86% and the hydrogen content to about 14%. PET also con-tained a significant amount of oxygen. Therefore, the lowercalorific value (LCV) of PE + PET was significantly lower than theLCV of the other polymers. The polymers contained virtually nowater. The concentrations of sulfur and chlorine were also belowthe detection limit. All pure substances and their mixtures didnot contain ash, except for PE + PS, which was waste material froma production process. Traces of nitrogen were found in all poly-mers. The content of volatiles allows a first assessment of the dev-olatilization and gasification behavior of the fuels. In general,polymers are highly volatile materials. Virtually no solid residues(char and ash) remained, when PE and PP were heated in an atmo-sphere of nitrogen. Some solid residue was found when PE + PS washeated that was mainly ash. PE + PET had a slightly lower contentof volatile matter than PE, PP and PS. As virtually no ash was pres-ent in PE + PET, char remained after devolatilization.
5. Results and discussion
5.1. General reactor performance
During the gasification tests the main parameters of the DFBpilot plant were kept constant to allow for the comparison of the
Table 1Pure substances and polymer mixtures.
PE PP PE + PET PE + PS PE + PP
Share of PE wt.-% 100 0 20 40 50Share of other polymer wt.-% 0 100 80 60 50
790 V. Wilk, H. Hofbauer / Fuel 107 (2013) 787–799
Author's personal copy
materials. Important data from stationary operation of the pilotplant for all test runs were averaged and are presented inTable 3.
The nominal fuel power of the DFB pilot plant amounts to100 kW, which was applied for gasification of PET. However, forthe other polymers the fuel power was reduced to 90 kW. Thesepolymers are likely to generate product gas with a high calorific va-lue, which is combusted in the post-combustion chamber of the pi-lot plant together with the flue gas after analysis. The fuel power ofthe post-combustion chamber is limited; therefore the fuel powerof the gasification reactor was reduced. Usually, hopper 3 in Fig. 2is used for feeding plastic materials due to the water-cooled chute.The mixture of PE + PS had to be fed directly into the fluidized bedfrom hopper 1 because of the size and shape of the flakes. The nec-essary mass flow could not be achieved with the screw of hopper 3.All other polymers and mixtures were thrown onto the fluidizedbed from hopper 3. A total of 100 kg of olivine was used in the gas-ification plant as bed material. The particle size distribution of thebed material ranges from 0.4 to 0.6 mm. The steam-to-carbon ratiowas in the range of 2.1–2.3 kg/kg. This ratio relates the mass flowsof the fluidization steam and the fuel water to the mass flow of car-bon of the fuel according to Eq. (1). In order to maintain circulationand sufficient fluidization of the fluidized bed, a minimum amountof steam is required, which cannot be further reduced. During gas-ification of PE + PET, a lower S/C ratio of 1.8 kg/kg was possible dueto the lower concentration of carbon in this polymer.
SC¼
_mH2O;fluidization þ _mH2O;feedstock
_mcarbon;feedstockð1Þ
The combustion reactor is fluidized with primary and secondary airusually in the range of 4.5 N m3/h and 50 N m3/h, respectively (Ta-ble 3). During gasification of PE + PP, the amount of secondary airwas increased to about 56 N m3/h, but the influence of the increasein secondary air on the whole process considered to be small.
Fig. 3 shows the pressure and temperature profiles of the100 kW pilot plant. In this figure, average data of gasification ofPP is used as an example. Temperatures and pressures were mea-sured at the same measurement points. Their locations are shownin the schematic of the pilot plant. Pressure measurements alongthe reactor are an indicator of the bed material distribution andthe fluidization conditions in the gasification system. Most of thebed material is present in the bubbling bed of the gasification reac-tor, where the pressure was highest. The bed material moves fromthe gasification reactor towards the areas of lower pressure in thelower loop seal and the combustion reactor. In the combustionreactor, the bed material is distributed sparsely over the heightin a fast fluidized bed. The pressure is lower there. A denser zoneis formed in the bottom area. The pressure at the exit of the gasi-fication reactor is slightly higher than atmospheric pressure, be-cause the product gas has to overcome the pressure drop of theproduct gas heat exchanger, which is located downstream of thegasification reactor. Table 3 lists the pressure at the lowest pointin the bubbling bed for all experiments (at 0.2 m measured fromthe lower loop seal). It averaged 76 mbar relative to atmosphere.In all experiments the pressures remained stable with standarddeviations in the range of 1–3 mbar.
The temperature profile shows the different temperature levelsin the DFB reactor. The reference gasification temperature wasmeasured at the position of the in-bed feed point at a height of0.8 m. This temperature was adjusted to 850 �C during stationaryoperation of the DFB gasifier. Table 3 lists the gasification temper-ature, which was actually achieved during the test runs. During thegasification of PE + PP it was only 835 �C, which will be discussedfurther as a part of the energy balance in 5.7. In the combustionreactor, temperature increases due to combustion of residual charand fuel for combustion. The reference combustion temperature,which is given in Table 3, was measured at a height of 0.4 m, wherethe secondary air was injected into the reactor. The combustiontemperature exceeded the gasification temperature by 40–60 �Cin the experiments. The temperature profile shows a hot spot inthe freeboard region of the gasification reactor. There, the hot betmaterial returns from the combustion reactor. In all experiments,the temperatures in the DFB gasifier remained constant with stan-dard deviations in the range of 3–7 �C.
5.2. Product gas composition
Fig. 4 illustrates the product gas composition yielded from thedifferent materials. The standard deviation of the measured valuesis also shown in the diagram. The deviations were mainly based onthe varying degree of filling of the screws used for fuel feeding.However, the differences in product gas composition betweenthe experiments were significantly large, so that the deviationswere still small enough to be negligible. The main gasificationproducts of PE and PP were H2, CH4 and C2H4. Gasification of PE
Table 2Proximate and ultimate feedstock analysis.
PE PP PE + PET PE + PS PE + PP
Lower calorific value kJ/kg 43,379 43,419 26,337 39,787 43,399Ash wt.-% (dry) <0.1 <0.1 <0.1 1.46 <0.1C wt.-% (dry) 85.84 85.86 66.89 87.18 85.85H wt.-% (dry) 14.07 13.91 6.06 11.12 13.99O wt.-% (dry)a <0.01 0.13 26.67 0.08 <0.01N wt.-% (dry) 0.09 0.10 0.08 0.16 0.10S wt.-% (dry) <0.005 <0.005 <0.005 <0.005 <0.005Cl wt.-% (dry) <0.005 <0.005 <0.005 <0.005 <0.005Volatile matter wt.-% (dry) >99 >99 95.46 98.55 >99
a O calculated as the sum to 100%.
Table 3Data from DFB reactor operation.
PE PP PE + PET PE + PS PE + PP
Fuel mass flow kg/h 7.5 7.5 13.6 7.9 7.5Fuel power kW 90.4 90.5 99.5 87.3 90.4Feeding positiona - Top Top Top Bed TopBed material kg 100 100 100 100 100Bed pressureb mbar 78 84 75 72 71Gasification temp. �C 852 855 852 855 835Steam fluidization kg/h 15.0 15.0 16.3 14.2 15.0Steam-to-carbon ratio kg/kg 2.3 2.3 1.8 2.1 2.3Combustion temp. �C 895 911 890 907 887Primary air N m3/h 4.6 4.1 4.2 4.2 5.0Secondary air N m3/h 49.7 48.7 49.8 49.2 55.7
a Bed . . . feeding from hopper 1, top . . . feeding from hopper 3.b Pressure relative to atmosphere.
V. Wilk, H. Hofbauer / Fuel 107 (2013) 787–799 791

Author's personal copy
resulted in a high concentration of the monomer C2H4, while PPyielded a higher concentration of CH4 and less C2H4. PP containsa methyl group in the constitutional repeating unit, which appar-ently favored the formation of CH4, a stable gaseous product. TheCO and CO2 content were in the range of 5–10% during gasificationof PE or PP. As neither polymer contains oxygen, CO and CO2 werethe reaction products of carbon with steam.
In contrast, the mixture of PE + PET contained about 27% of oxy-gen and the product gas consisted of about 50% of CO and CO2. TheS/C ratio was significantly lower than during the gasification of theother polymers. When wood is gasified, an increase in S/C ratio in-creases the yield of H2 and CO2 and lowers the concentration of COand CH4 [39]. If PE + PET behaved similarly to wood, even more CO2
would have been yielded at a higher S/C ratio.The mixtures of PE + PS and PE + PP yielded the highest con-
centrations of H2 in the range of 50%. The concentrations ofCO were relatively high (20%), although there was no oxygenin the mixtures of PE + PS and PE + PP. The reaction of carbonwith steam forms CO and H2 is also produced from steam. Thus,an increase in CO and H2 occurs together and indicates moreinteraction with steam. This is also supported by the decreasein CH4 and C2H4 compared to pure PE. CxHy is the sum ofC2H6 and the gaseous C3- and C4-hydrocarbons, which was inthe range of 1%.
5.3. Influence of PE content on the gas composition
In Fig. 5 the product gas composition is plotted versus the shareof PE in the mixtures. As PE is mixed with different polymers, thefigure shows a global trend rather than a strict relationship. Themixture of 20% PE and PET contained oxygen, which resulted in asignificantly different product gas composition. However, highershares of PE increased the concentration of CH4 and C2H4 and de-creased the concentration of CO, which shows that CH4 and C2H4
were the main decomposition products of PE.
5.4. Gas production
Several key parameters characterize gas formation, which aresummarized in Table 4. The specific gas production relates thedry product gas volume flow and the mass flow or the energy con-tent of the fuel. The mass-based specific gas production is, there-fore, highly influenced by the energy density of the material. Themass-based specific gas productions of the pure substances werelower than those of the mixtures, except for PE + PET, which hada lower LCV and required a greater mass flow. The energy-basedspecific gas production eliminates the influence of the LCV of thefeedstock. Gasification of the mixtures yielded higher concentra-tion of H2 and CO than the gasification of PE or PP. When PE or
3.0
3.5
4.0
4.5
5.0
3.0
3.5
4.0
4.5
5.0
flue gas
fuel feeding 3
0.0
0.5
1.0
1.5
2.0
2.5
750 850 9500.0
0.5
1.0
1.5
2.0
2.5
0 20 40 60 80 100
reac
tor h
eigh
t, m
product gas
fuel feeding 2
fuel feeding 1
secondary air
upper loop seal
primary air +fuel for combustion
steamfluidization
temperature, oCpressure relative to atmosphere, mbarlower loop seal
gasification reactor
combustion reactor
upper/lower loop seal
gasification reactor
combustion reactor
upper/lower loop seal
Fig. 3. Temperature and pressure profile of gasification of PP in the 100 kW pilot plant.
0
10
20
30
40
50
60
PE PP PE + PET PE + PS PE + PP
conc
entra
tion
in d
ry p
rodu
ct g
as, v
ol.-%
H2 CO CO2 CH4 C2H4 CxHyH2 CO CO2 CH4 C2H4 CxHy
Fig. 4. Product gas composition from pure substances and mixtures.
0
5
10
15
20
25
30
35
40
45
50
55
20 40 60 80 100
conc
entra
tion
in d
ry p
rodu
ct g
as, v
ol.-%
share of PE in the mixture, wt.-%
COH2
CO2
CH4
C2H4
CxHy
Fig. 5. Influence of PE content in the mixtures on gas composition.
792 V. Wilk, H. Hofbauer / Fuel 107 (2013) 787–799
Author's personal copy
PP was gasified as virgin polymer, it resulted in CH4 and C2H4 richproduct gases. Larger gaseous molecules led to lower gas produc-tion from a fixed quantity of substance.
The LCV of the gas was also calculated. Tar and dust were notconsidered in the calculation. Due to higher concentration of CH4
and C2H4, the LCV of the product gas from PE or PP amounted toabout 26 MJ/N m3. The product gas from PE + PET had a lowerLCV because of the formation of 28% CO2 which dilutes the gasand does not contribute to the LCV. The product gas from PE + PSand PE + PP had a LCV in the range of 18 MJ/m3, because more H2
and CO were formed compared to gasification of pure PE or PP.The concentrations of CH4 and C2H4 decreased, which would haveincreased the LVC.
The water conversion (XH2O) describes the ratio of water con-sumed by the gasification reactions and water supplied to the gas-ification reactor in the form of steam and fuel water; Eq. (2). Thesteam mass flow and the amount of fuel water were measured val-ues. The amount of water consumed by the gasification reactionsresulted from the mass and energy balance calculated withIPSEpro.
XH2O ¼_mH2O;consumed
_mH2O;fluidization þ _mH2O;feedstock� 100% ð2Þ
The water conversion shows the interaction with the gasificationagent, similar to CO and CO2 formation for oxygen-free polymers.Lower values were found for pure substances compared to the mix-tures. It can be explained by the thermal decomposition mechanismof polymers that is mainly based on radical chain scission. The poly-mer chain breaks into smaller molecules, which leads to a variety ofmolecules that continue to react further. The detailed degradationmechanisms of PE, PP and PS are described by Bockhorn et al. in[9] and [10] and are comprised of random chain scission and betascission of radicals. Pyrolysis of PE yields mainly linear alkanesand alkenes, in contrast to PP, which predominantly produces al-kenes [9]. When pure PS is pyrolyzed, the main product is themonomer styrene [10]. PET is decomposed by scission of the al-kyl–oxygen bond into acetaldehyde, CO, CO2 and water whenheated [40]. When mixtures of polymers were gasified, it is likelythat a larger variety of radicals was available. These radicals inter-acted with the steam and enhanced the formation of the smallermolecules such as H2 and CO.
5.5. Tar formation
Tars are condensable higher hydrocarbons and are undesiredbyproducts of gasification. When the product gas is cooled to lowertemperatures, tars condense and form depositions on heatexchangers and other downstream equipment of the gasifier. Usu-ally, tars have to be removed prior to product gas utilization in gasengines or syntheses processes. Therefore, the tar concentration inthe product gas has important consequences on the design of thegasification process and in particular on the gas cleaningequipment.
In the DFB gasifier, a low concentration of tars is achieved, whenwoody biomass is gasified. The tar content ranges from 2 to6 g/N m3 of gravimetric tar and 5–15 g/N m3 of GCMS tars. In order
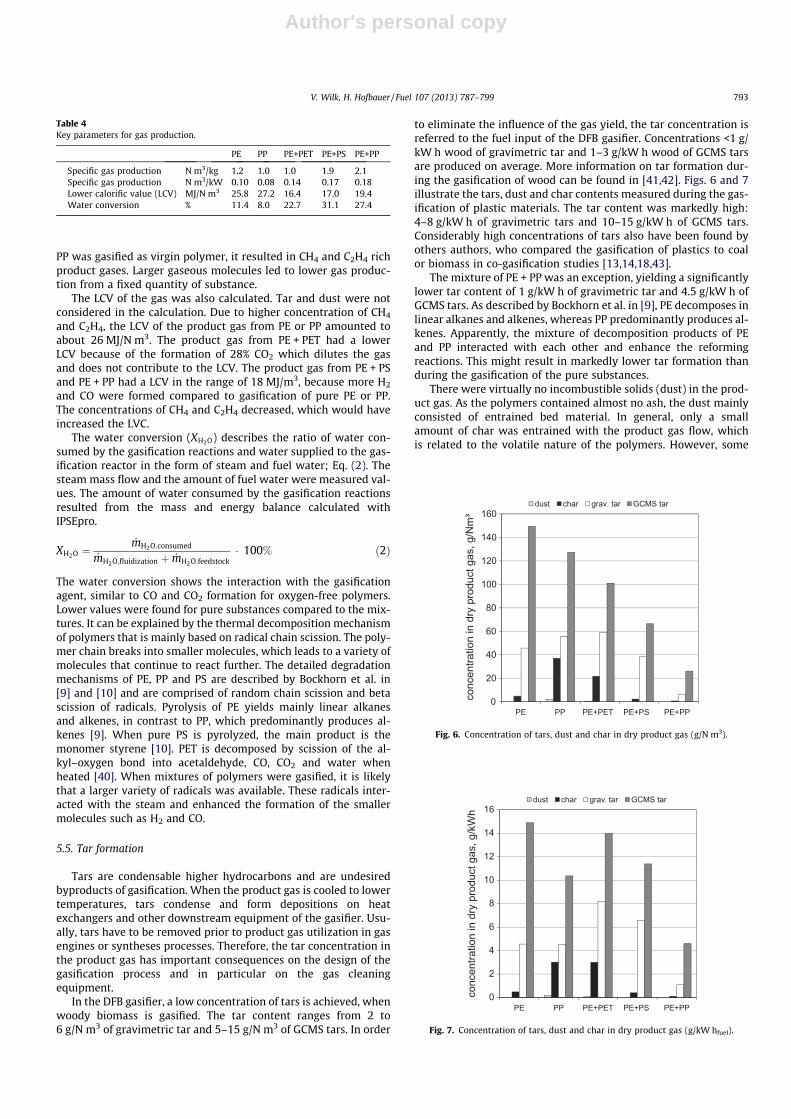
to eliminate the influence of the gas yield, the tar concentration isreferred to the fuel input of the DFB gasifier. Concentrations <1 g/kW h wood of gravimetric tar and 1–3 g/kW h wood of GCMS tarsare produced on average. More information on tar formation dur-ing the gasification of wood can be found in [41,42]. Figs. 6 and 7illustrate the tars, dust and char contents measured during the gas-ification of plastic materials. The tar content was markedly high:4–8 g/kW h of gravimetric tars and 10–15 g/kW h of GCMS tars.Considerably high concentrations of tars also have been found byothers authors, who compared the gasification of plastics to coalor biomass in co-gasification studies [13,14,18,43].
The mixture of PE + PP was an exception, yielding a significantlylower tar content of 1 g/kW h of gravimetric tar and 4.5 g/kW h ofGCMS tars. As described by Bockhorn et al. in [9], PE decomposes inlinear alkanes and alkenes, whereas PP predominantly produces al-kenes. Apparently, the mixture of decomposition products of PEand PP interacted with each other and enhance the reformingreactions. This might result in markedly lower tar formation thanduring the gasification of the pure substances.
There were virtually no incombustible solids (dust) in the prod-uct gas. As the polymers contained almost no ash, the dust mainlyconsisted of entrained bed material. In general, only a smallamount of char was entrained with the product gas flow, whichis related to the volatile nature of the polymers. However, some
Table 4Key parameters for gas production.
PE PP PE+PET PE+PS PE+PP
Specific gas production N m3/kg 1.2 1.0 1.0 1.9 2.1Specific gas production N m3/kW 0.10 0.08 0.14 0.17 0.18Lower calorific value (LCV) MJ/N m3 25.8 27.2 16.4 17.0 19.4Water conversion % 11.4 8.0 22.7 31.1 27.4
0
20
40
60
80
100
120
140
160
PE PP PE+PET PE+PS PE+PP
conc
entra
tion
in d
ry p
rodu
ct g
as, g
/Nm
³
dust char grav. tar GCMS tar
Fig. 6. Concentration of tars, dust and char in dry product gas (g/N m3).
0
2
4
6
8
10
12
14
16
PE PP PE+PET PE+PS PE+PP
conc
entra
tion
in d
ry p
rodu
ct g
as, g
/kW
h
dust char grav. tar GCMS tar
Fig. 7. Concentration of tars, dust and char in dry product gas (g/kW hfuel).
V. Wilk, H. Hofbauer / Fuel 107 (2013) 787–799 793
Author's personal copy
char entrainment occurred during the gasification of PP andPE + PET.
According to Figs. 6 and 7, there was no significant influence ofthe feeding position on tar formation. PE + PS was fed directly intothe fluidized bed. In this way the volatiles flow through the fluid-ized bed and can have more contact with the catalytic bed materialthan during on-bed feeding. Thus, the tar content could be lowerduring in-bed feeding. However, the concentration of tars duringthe gasification of PE + PS did not differ much from the other mate-rials, so no significant influence can be attributed to the feedingposition.
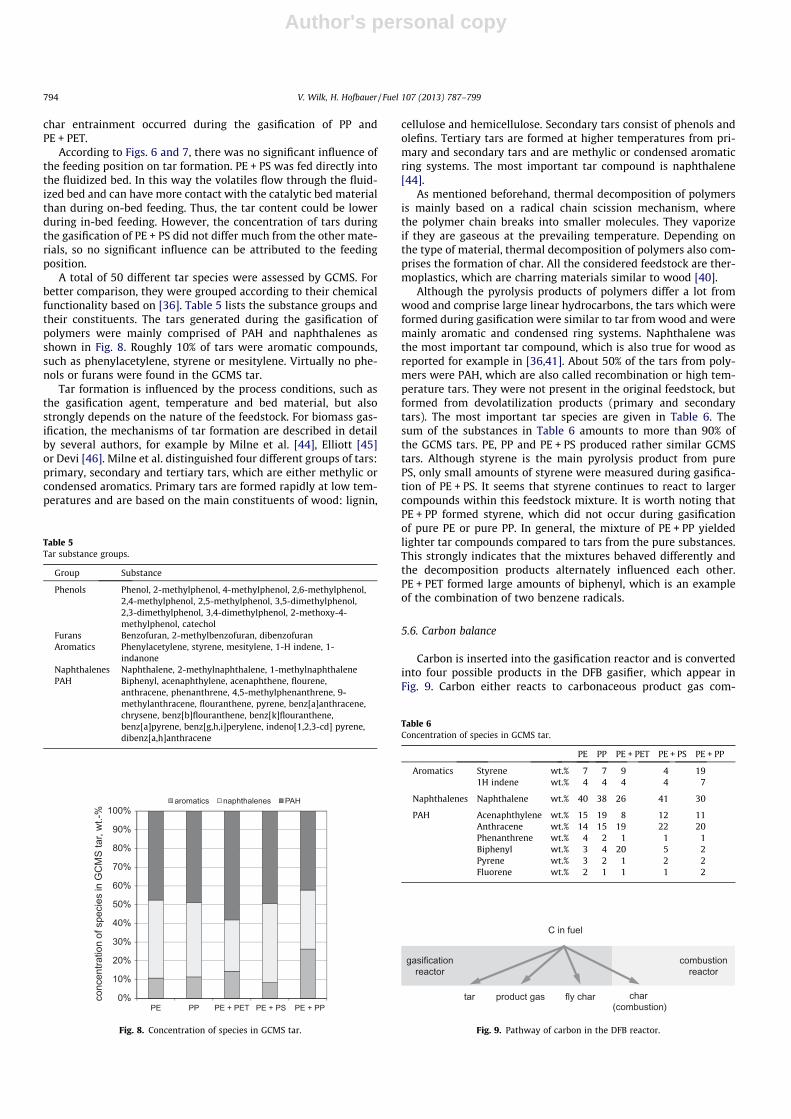
A total of 50 different tar species were assessed by GCMS. Forbetter comparison, they were grouped according to their chemicalfunctionality based on [36]. Table 5 lists the substance groups andtheir constituents. The tars generated during the gasification ofpolymers were mainly comprised of PAH and naphthalenes asshown in Fig. 8. Roughly 10% of tars were aromatic compounds,such as phenylacetylene, styrene or mesitylene. Virtually no phe-nols or furans were found in the GCMS tar.
Tar formation is influenced by the process conditions, such asthe gasification agent, temperature and bed material, but alsostrongly depends on the nature of the feedstock. For biomass gas-ification, the mechanisms of tar formation are described in detailby several authors, for example by Milne et al. [44], Elliott [45]or Devi [46]. Milne et al. distinguished four different groups of tars:primary, secondary and tertiary tars, which are either methylic orcondensed aromatics. Primary tars are formed rapidly at low tem-peratures and are based on the main constituents of wood: lignin,
cellulose and hemicellulose. Secondary tars consist of phenols andolefins. Tertiary tars are formed at higher temperatures from pri-mary and secondary tars and are methylic or condensed aromaticring systems. The most important tar compound is naphthalene[44].
As mentioned beforehand, thermal decomposition of polymersis mainly based on a radical chain scission mechanism, wherethe polymer chain breaks into smaller molecules. They vaporizeif they are gaseous at the prevailing temperature. Depending onthe type of material, thermal decomposition of polymers also com-prises the formation of char. All the considered feedstock are ther-moplastics, which are charring materials similar to wood [40].
Although the pyrolysis products of polymers differ a lot fromwood and comprise large linear hydrocarbons, the tars which wereformed during gasification were similar to tar from wood and weremainly aromatic and condensed ring systems. Naphthalene wasthe most important tar compound, which is also true for wood asreported for example in [36,41]. About 50% of the tars from poly-mers were PAH, which are also called recombination or high tem-perature tars. They were not present in the original feedstock, butformed from devolatilization products (primary and secondarytars). The most important tar species are given in Table 6. Thesum of the substances in Table 6 amounts to more than 90% ofthe GCMS tars. PE, PP and PE + PS produced rather similar GCMStars. Although styrene is the main pyrolysis product from purePS, only small amounts of styrene were measured during gasifica-tion of PE + PS. It seems that styrene continues to react to largercompounds within this feedstock mixture. It is worth noting thatPE + PP formed styrene, which did not occur during gasificationof pure PE or pure PP. In general, the mixture of PE + PP yieldedlighter tar compounds compared to tars from the pure substances.This strongly indicates that the mixtures behaved differently andthe decomposition products alternately influenced each other.PE + PET formed large amounts of biphenyl, which is an exampleof the combination of two benzene radicals.
5.6. Carbon balance
Carbon is inserted into the gasification reactor and is convertedinto four possible products in the DFB gasifier, which appear inFig. 9. Carbon either reacts to carbonaceous product gas com-
Table 5Tar substance groups.
Group Substance
Phenols Phenol, 2-methylphenol, 4-methylphenol, 2,6-methylphenol,2,4-methylphenol, 2,5-methylphenol, 3,5-dimethylphenol,2,3-dimethylphenol, 3,4-dimethylphenol, 2-methoxy-4-methylphenol, catechol
Furans Benzofuran, 2-methylbenzofuran, dibenzofuranAromatics Phenylacetylene, styrene, mesitylene, 1-H indene, 1-
indanoneNaphthalenes Naphthalene, 2-methylnaphthalene, 1-methylnaphthalenePAH Biphenyl, acenaphthylene, acenaphthene, flourene,
anthracene, phenanthrene, 4,5-methylphenanthrene, 9-methylanthracene, flouranthene, pyrene, benz[a]anthracene,chrysene, benz[b]flouranthene, benz[k]flouranthene,benz[a]pyrene, benz[g,h,i]perylene, indeno[1,2,3-cd] pyrene,dibenz[a,h]anthracene
0%
10%
20%
30%
40%
50%
60%
70%
80%
90%
100%
PE PP PE + PET PE + PS PE + PP
conc
entra
tion
of s
peci
es in
GC
MS
tar,
wt.-
%
aromatics naphthalenes PAH
Fig. 8. Concentration of species in GCMS tar.
Table 6Concentration of species in GCMS tar.
PE PP PE + PET PE + PS PE + PP
Aromatics Styrene wt.% 7 7 9 4 191H indene wt.% 4 4 4 4 7
Naphthalenes Naphthalene wt.% 40 38 26 41 30
PAH Acenaphthylene wt.% 15 19 8 12 11Anthracene wt.% 14 15 19 22 20Phenanthrene wt.% 4 2 1 1 1Biphenyl wt.% 3 4 20 5 2Pyrene wt.% 3 2 1 2 2Fluorene wt.% 2 1 1 1 2
C in fuel
tar product gas fly char char (combustion)
gasificationreactor
combustionreactor
Fig. 9. Pathway of carbon in the DFB reactor.
794 V. Wilk, H. Hofbauer / Fuel 107 (2013) 787–799
Author's personal copy
pounds, such as CO, CO2, and CH4 or is present in the form of tar orchar in the product gas. In the DFB gasifier, ungasified char fromgasification is transported to the combustion reactor by the circu-lating bed material. There, it is combusted with air and supplies theheat for the endothermal gasification reactions. In this way, carbonis also present in the combustion reactor in the form of char forcombustion.
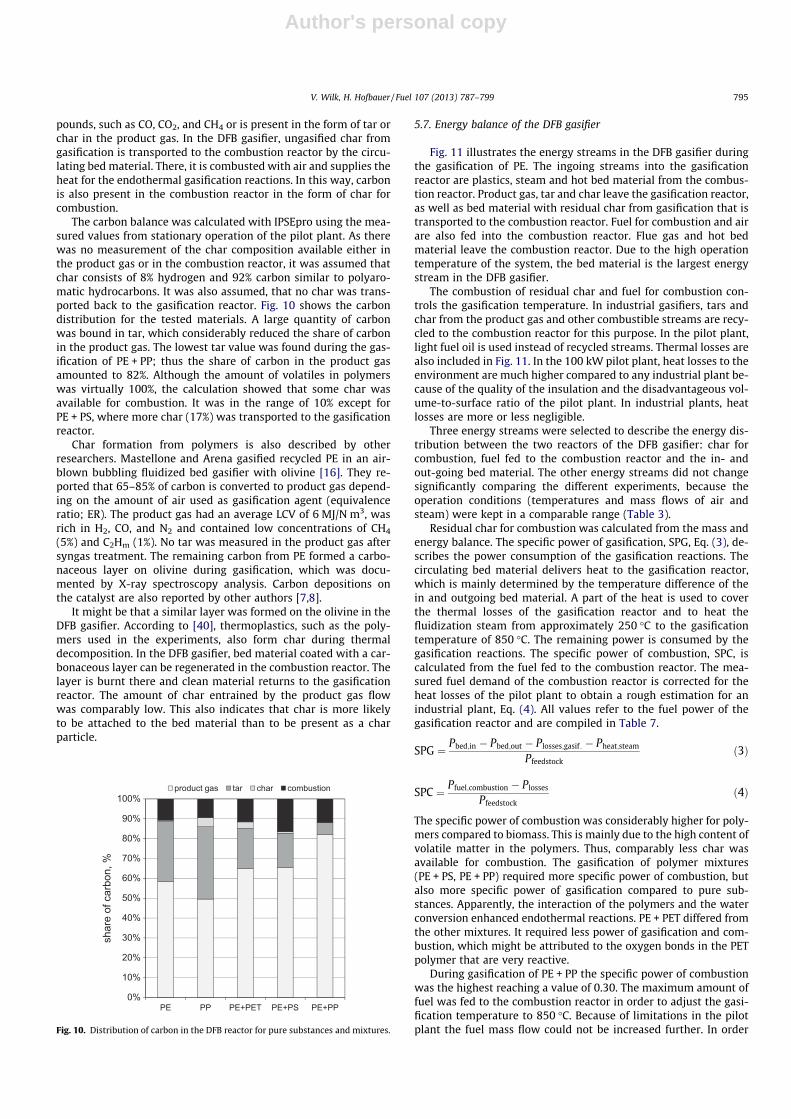
The carbon balance was calculated with IPSEpro using the mea-sured values from stationary operation of the pilot plant. As therewas no measurement of the char composition available either inthe product gas or in the combustion reactor, it was assumed thatchar consists of 8% hydrogen and 92% carbon similar to polyaro-matic hydrocarbons. It was also assumed, that no char was trans-ported back to the gasification reactor. Fig. 10 shows the carbondistribution for the tested materials. A large quantity of carbonwas bound in tar, which considerably reduced the share of carbonin the product gas. The lowest tar value was found during the gas-ification of PE + PP; thus the share of carbon in the product gasamounted to 82%. Although the amount of volatiles in polymerswas virtually 100%, the calculation showed that some char wasavailable for combustion. It was in the range of 10% except forPE + PS, where more char (17%) was transported to the gasificationreactor.
Char formation from polymers is also described by otherresearchers. Mastellone and Arena gasified recycled PE in an air-blown bubbling fluidized bed gasifier with olivine [16]. They re-ported that 65–85% of carbon is converted to product gas depend-ing on the amount of air used as gasification agent (equivalenceratio; ER). The product gas had an average LCV of 6 MJ/N m3, wasrich in H2, CO, and N2 and contained low concentrations of CH4
(5%) and C2Hm (1%). No tar was measured in the product gas aftersyngas treatment. The remaining carbon from PE formed a carbo-naceous layer on olivine during gasification, which was docu-mented by X-ray spectroscopy analysis. Carbon depositions onthe catalyst are also reported by other authors [7,8].
It might be that a similar layer was formed on the olivine in theDFB gasifier. According to [40], thermoplastics, such as the poly-mers used in the experiments, also form char during thermaldecomposition. In the DFB gasifier, bed material coated with a car-bonaceous layer can be regenerated in the combustion reactor. Thelayer is burnt there and clean material returns to the gasificationreactor. The amount of char entrained by the product gas flowwas comparably low. This also indicates that char is more likelyto be attached to the bed material than to be present as a charparticle.
5.7. Energy balance of the DFB gasifier
Fig. 11 illustrates the energy streams in the DFB gasifier duringthe gasification of PE. The ingoing streams into the gasificationreactor are plastics, steam and hot bed material from the combus-tion reactor. Product gas, tar and char leave the gasification reactor,as well as bed material with residual char from gasification that istransported to the combustion reactor. Fuel for combustion and airare also fed into the combustion reactor. Flue gas and hot bedmaterial leave the combustion reactor. Due to the high operationtemperature of the system, the bed material is the largest energystream in the DFB gasifier.
The combustion of residual char and fuel for combustion con-trols the gasification temperature. In industrial gasifiers, tars andchar from the product gas and other combustible streams are recy-cled to the combustion reactor for this purpose. In the pilot plant,light fuel oil is used instead of recycled streams. Thermal losses arealso included in Fig. 11. In the 100 kW pilot plant, heat losses to theenvironment are much higher compared to any industrial plant be-cause of the quality of the insulation and the disadvantageous vol-ume-to-surface ratio of the pilot plant. In industrial plants, heatlosses are more or less negligible.
Three energy streams were selected to describe the energy dis-tribution between the two reactors of the DFB gasifier: char forcombustion, fuel fed to the combustion reactor and the in- andout-going bed material. The other energy streams did not changesignificantly comparing the different experiments, because theoperation conditions (temperatures and mass flows of air andsteam) were kept in a comparable range (Table 3).
Residual char for combustion was calculated from the mass andenergy balance. The specific power of gasification, SPG, Eq. (3), de-scribes the power consumption of the gasification reactions. Thecirculating bed material delivers heat to the gasification reactor,which is mainly determined by the temperature difference of thein and outgoing bed material. A part of the heat is used to coverthe thermal losses of the gasification reactor and to heat thefluidization steam from approximately 250 �C to the gasificationtemperature of 850 �C. The remaining power is consumed by thegasification reactions. The specific power of combustion, SPC, iscalculated from the fuel fed to the combustion reactor. The mea-sured fuel demand of the combustion reactor is corrected for theheat losses of the pilot plant to obtain a rough estimation for anindustrial plant, Eq. (4). All values refer to the fuel power of thegasification reactor and are compiled in Table 7.
SPG ¼ Pbed;in � Pbed;out � Plosses;gasif : � Pheat;steam
Pfeedstockð3Þ
SPC ¼ Pfuel;combustion � Plosses
Pfeedstockð4Þ
The specific power of combustion was considerably higher for poly-mers compared to biomass. This is mainly due to the high content ofvolatile matter in the polymers. Thus, comparably less char wasavailable for combustion. The gasification of polymer mixtures(PE + PS, PE + PP) required more specific power of combustion, butalso more specific power of gasification compared to pure sub-stances. Apparently, the interaction of the polymers and the waterconversion enhanced endothermal reactions. PE + PET differed fromthe other mixtures. It required less power of gasification and com-bustion, which might be attributed to the oxygen bonds in the PETpolymer that are very reactive.
During gasification of PE + PP the specific power of combustionwas the highest reaching a value of 0.30. The maximum amount offuel was fed to the combustion reactor in order to adjust the gasi-fication temperature to 850 �C. Because of limitations in the pilotplant the fuel mass flow could not be increased further. In order
0%
10%
20%
30%
40%
50%
60%
70%
80%
90%
100%
PE PP PE+PET PE+PS PE+PP
shar
e of
car
bon,
%
product gas tar char combustion
Fig. 10. Distribution of carbon in the DFB reactor for pure substances and mixtures.
V. Wilk, H. Hofbauer / Fuel 107 (2013) 787–799 795

Author's personal copy
to ensure complete combustion, the secondary air flow was raisedto about 56 N m3/h. The combustion temperature was the highestof all experiments at 911 �C (Table 3). Despite all that, only a gas-ification temperature of 835 �C was reached.
Excess air ratio k : k ¼_mO2 ;available
_mO2 ;stoichiometricð5Þ
The excess air ratio k of the combustion reactor is also given in Ta-ble 7. The excess air ratio relates the oxygen supply of the combus-tion reactor to the oxygen demand of stoichiometric combustion ofchar and fuel for combustion. It amounted to 1.13 during the exper-iments except for the gasification of PE + PS. It was lower, becausecomparably more char was transported to the combustion reactor(Fig. 10). The specific power of combustion of PE + PS was in goodagreement with the other polymers. As the amount of carbon inthe combustion reactor increased at constant air fluidization, theexcess air ratio decreased to 1.01.
5.8. Influence of temperature on gasification of PP
The influence of gasification temperature was investigated withpure PP. Table 8 shows how the performance at lower tempera-tures differed from gasification at 850 �C. At lower temperatures,less product gas was generated. As product gas flows through thefluidized bed, it also serves as a fluidization agent. Thus, steam flu-idization was increased slightly to compensate for the lower gasformation and to maintain the fluidized bed in a comparable state,when the gasification temperature decreased. Fig. 12 shows theinfluence of gasification temperature on the product gas composi-tion. At higher temperatures, the concentration of C2H4 and higherhydrocarbons, CxHy, decreased. The sum of C2H4 and CxHy
amounted to 36% at 640 �C. In contrast to that, the sum was re-duced to 21% at 850 �C. The CH4 content increased between 640and 760 �C and decreased then. The H2 content increased steeplyas did the CO and CO2 concentrations. This indicates that morereactions occurred with steam at higher temperatures and alsothe reforming of larger carbonaceous molecules into smaller oneswas favored. At lower temperatures, a significant amount of gas-eous compounds were produced, which could not be analyzed bythe measurement equipment at the pilot plant. These compounds
Fig. 11. Energy streams in the DFB gasifier for gasification of PE.
Table 7Reaction parameters for energy streams in the DFB gasifier.
PE PP PE + PET PE + PS PE + PP
Specific power of gasification kW/kW 0.07 0.06 0.06 0.15 0.11Char for combustion kW/kW 0.10 0.09 0.13 0.16 0.11Specific power of combustion kW/kW 0.25 0.25 0.18 0.27 0.30Excess air ratioa kg/kg 1.13 1.13 1.13 1.01 1.13
a Calculated.
Table 8General reactor performance (temperature variation with pure PP).
640 �C 760 �C 850 �C
Gasification temperature �C 642 759 855Combustion temperature �C 754 856 911Steam fluidization kg/h 16.6 15.3 15.0Steam-to-carbon ratio kg/kg 2.6 2.4 2.3
0
5
10
15
20
25
30
35
40
45
50
640 670 700 730 760 790 820 850
conc
entra
tion
in d
ry p
rodu
ct g
as, v
ol.-%
gasification temperature, oC
CH4
H2
C2H4
CO2
COCxHy
Fig. 12. Influence of gasification temperature on gasification of PP.
796 V. Wilk, H. Hofbauer / Fuel 107 (2013) 787–799

Author's personal copy
were benzene, toluene and the like. At 850 �C, the sum of the mea-sured gaseous compounds was close to 100%, but this value waslowered to 93% at 760 �C and to 83% at 640 �C. Because of thisgap, the mass- and energy balances for 640 �C and 760 �C werenot as reliable as for the other experiments at 850 �C and shouldbe interpreted as trends rather than as strict values.
A decrease in the tar content was observed with a reduction inthe gasification temperature, which is illustrated in Fig. 13. It ispossible that benzene, toluene and other undetected compoundsoccurred in higher concentrations at 640 �C, which could increasethe tar content with a decrease in gasification temperature. The de-tailed composition of the GCMS tars is shown in Fig. 14. At 640 �C asmall amount of furans was formed, which are similar to secondarytars from biomass. With an increase in temperature, they disap-peared. The amount of aromatic tars diminished and the PAH con-tent rose to almost 50% at 850 �C.
Table 9 presents the influence of gasification temperature onimportant reaction parameters. At 640 �C the specific gas produc-tion was the lowest; it increased with an increase in the gasifica-tion temperature. The lower calorific value likewise decreased, asthe concentration of C2- and C3-hydrocarbons in the product gasdeclined. In general, reactions proceed faster at higher gasificationtemperatures. The increase in water conversion showed a moreintensive interaction with steam. More power was also consumedby the gasification reactions, which can be explained by enhanced
endothermal reforming reactions of C2-, C3- and C4-hydrocarbons.More power for combustion was required with increase in temper-ature to maintain the higher temperature in the gasification reac-tor, although more char for combustion is available.
5.9. Conversion to monomers
According to Fig. 5, the monomer of PE, C2H4, was an importantgasification product of PE. Fig. 15 shows the extent of PE conver-sion to C2H4. The PE conversion was calculated as the ratio ofC2H4 in the product gas to PE in the polymer mixture, Eq. (6). When100% PE was gasified, the PE conversion amounted to 22%. MoreC2H4 was produced from the mixtures with PE. The surplus ofC2H4 in the product gas from the mixtures showed that PS, PPand PET also generated ethylene as a decomposition product.
XPE ¼_mC2H4 ;product gas
_mPE;feedstock� 100% ð6Þ
The monomer of PP, C3H6, could not be measured explicitly with theequipment that was currently available at the pilot plant. However,CH4 and the gaseous hydrocarbons CxHy were detected and werealso suitable to describe the conversion of PP in Fig. 16. The conver-sions of PP to CH4 and CxHy were calculated in analogy to Eq. (6) andrelate the concentrations of CH4 and CxHy in the product gas to themass flow of PP as feedstock. At 850 �C, the predominating conver-sion product of PP was CH4. A total of 28% of PP fed to the gasifica-tion reactor formed CH4 in the product gas. With a decrease ingasification temperature, the conversion of PP to CH4 decreasedsteadily, although the CH4 concentration in the gas was maximalat 750 �C. As the gas production was lower at lower temperatures,the conversion of PP to CH4 also decreased. The conversion of PP
0
2
4
6
8
10
12
640 670 700 730 760 790 820 850
conc
entra
tion
in d
ry p
rodu
ct g
as, g
/kW
h
gasification temperature, oC
dust char grav. tar GCMS tar
Fig. 13. Influence of gasification temperature on tar formation (PP).
0%
10%
20%
30%
40%
50%
60%
70%
80%
90%
100%
conc
entra
tion
of s
peci
es in
GC
MS
tar,
wt.-
%
furans aromatics naphthalenes PAH
640oC 760oC 850oC
Fig. 14. Influence of gasification temperature on GMCS tar composition (PP).
Table 9Specific reaction parameters.
640 �C 750 �C 850 �C
Specific gas production N m3/kg 0.6 0.8 1.0Specific gas production N m3/kW 0.05 0.06 0.21Lower calorific value (LCV) MJ/N m3 41.2 32.5 27.2Water conversion % 1.7 4.3 8.0Specific power of gasification kW/kW 0.01 0.04 0.06Char for combustion kW/kW 0.06 0.09 0.09Specific power of combustion kW/kW 0.19 0.20 0.25
0%
10%
20%
30%
40%
50%
60%
20% 40% 60% 80% 100%
conc
entra
tion
in d
ry p
rodu
ct g
as, v
ol.-%
PE c
onve
rsio
n, k
g/kg
·100
%
share of PE in the mixture, wt.-%
C2H4 in product gasConversion of PE to C2H4
Fig. 15. Conversion of PE to C2H4.
V. Wilk, H. Hofbauer / Fuel 107 (2013) 787–799 797

Author's personal copy
to CxHy increased steadily, when the gasification temperature waslowered. At 640 �C, CxHy was the predominating conversion productyielded from 18% of PP.
6. Conclusion
Steam gasification of plastic waste materials was carried outsuccessfully in the DFB pilot plant. In order to investigate theimportant reaction parameters of gasification, pure PE and PP, aswell as mixtures of PE with PP, PS and PET were tested. It wasfound that the product gas from PE was rich in CH4 and C2H4 andhad a high LCV of 26 MJ/N m3. About 22% of PE was converted tothe monomer C2H4. Different mixtures of PE with other polymersshowed, that CH4 and C2H4 increased with increasing share of PEand were the main decomposition products. The mixtures yieldedhigher conversion of PE to C2H4, which showed, that the otherpolymers also generated C2H4 as a decomposition product. Productgas from pure PP contained more CH4 and less C2H4 compared tothe product gas from PE. The formation of CH4 seems to be attrib-utable to the methyl group in the repeating unit of PP.
The polymer mixtures behaved differently from the pure sub-stances. Significantly more H2 and CO were generated from PE + PPand PE + PS. It was assumed that the decomposition products of thetwo polymers in the mixture interacted strongly and influencedalternately the gasification process. As CO was generated fromreactions with steam, H2 was also released and increased similarly.More steam was converted to product gas, therefore, the gas pro-duction increased. The reforming reactions were enhanced andyielded H2 and CO at the expense of CH4 and C2H4. Also morepower for gasification and combustion was necessary for gasifica-tion of the mixtures. The mixture of PE + PET differed from theother polymers because of the high oxygen content of PET. Thus,28% of CO2 were measured in the product gas. By contrast, CO2
was the range of 8%, when oxygen-free polymers were gasified.Gasification of polymers resulted in significantly high tar loads
in the product gas in the range of 100 g/N m3 or 13 g/kW h fuel.GCMS analysis of tars showed that the tars from polymers mainlyconsisted of PAH and aromatics. Naphthalene was the most impor-tant compound. Despite of the originally linear structure of thepolymers, the tars generated were aromatic molecules, similar totertiary tars from the gasification of biomass. Gasification of PPat different temperatures showed that PP also formed secondarytars, such as furans, and smaller aromatics at lower temperatures.
The furans disappeared with an increase in temperature and thesmaller aromatic compounds recombined to tertiary tars at850 �C. Interestingly, the compositions of the GCMS tar from thepure substances PE and PP and the mixture of PE + PS were similar.The PE + PP mixture yielded considerably less tar, which had a dif-ferent composition than the tars from the two pure substances, PEand PP. This also indicates interactions between the polymers inthe mixtures.
This experimental work demonstrates that the tested polymersare suitable feedstock for the DFB gasifier. In contrast to incinera-tion, steam gasification can also be applied for chemical recyclingof polymer wastes. In addition to heat and power production, theselective separation of valuable compounds, such as CH4 andC2H4, could also be an interesting application for the product gasfrom plastic gasification. Therefore, further investigations how tocontrol and reduce tar formation from plastic materials are neces-sary. Both primary and secondary measures should be considered,such as enhanced contact to catalytic bed material or adaption ofthe downstream equipment of the gasifier (heat exchangers andgas cleaning equipment).
Acknowledgements
The authors would like to thank the working group ‘‘Gasifica-tion and Gas Cleaning’’ and ‘‘Test Laboratory for Combustion Sys-tems’’ team at the Institute of Chemical Engineering at ViennaUniversity of Technology for their support. Many thanks to BorealisPolyolefine GmbH Austria for providing the virgin polymers. Bioen-ergy2020+ is funded within the Austrian COMET program managedby the Austria Research Promotion Agency (FFG). The financial sup-port from the funding association FFG and the industrial partnersMagna International AG, Repotec Umwelttechnik GmbH and Bio-masse-Kraftwerk-Güssing GmbH is gratefully acknowledged.
References
[1] Umweltbundesamt. Die Bestandsaufnahme der Abfallwirtschaft in Österreich.Umweltbundesamt Österreich; 2008.
[2] Directive 2008/98/EC of the European Parliament and of the Council of 19November 2008 on waste; 2008.
[3] Eurostat Database on Environment; 2011.[4] Kaminsky W, Schlesselmann B, Simon C. Olefins from polyolefins and mixed
plastics by pyrolysis. J Anal Appl Pyrol 1995;32:19–27.[5] Yoshioka T, Grause G, Eger C, Kaminsky W, Okuwaki A. Pyrolysis of
poly(ethylene terephthalate) in a fluidised bed plant. Polym Degrad Stab2004;86(3):499–504.
[6] Serrano DP, Aguado J, Escola JM, Garagorri E. Conversion of low densitypolyethylene into petrochemical feedstocks using a continuous screw kilnreactor. J Anal Appl Pyrol 2001;58–59:789–801.
[7] Serrano DP, Aguado J, Rodriguez JM, Peral A. Catalytic cracking of polyethyleneover nanocrystalline HZSM-5: catalyst deactivation and regeneration study. JAnal Appl Pyrol 2007;79:456–64.
[8] Marcilla A, Gomez-Siurana A, Valdos F. Catalytic pyrolysis of LDPE over H-betaand HZSM-5 zeolites in dynamic conditions: study of the evolution of theprocess. J Anal Appl Pyrol 2007;79:433–42.
[9] Bockhorn H, Hornung A, Hornung U, Schawaller D. Kinetic study on thethermal degradation of polypropylene and polyethylene. J Anal Appl Pyrol1999;48(2):93–109.
[10] Bockhorn H, Hornung A, Hornung U. Gasification of polystyrene as initial stepin incineration, fires, or smoldering of plastics. In: Symposium (international)on combustion, vol. 27. No. 1; 1998. p. 1343–9.
[11] Pinto F, Franco C, André RN, Miranda M, Gulyurtlu I, Cabrita I. Co-gasificationstudy of biomass mixed with plastic wastes. Fuel 2002;81(3):291–7.
[12] Pinto F, Franco C, Andre RN, Tavares C, Dias M, Gulyurtlu I, et al. Effect ofexperimental conditions on co-gasification of coal, biomass and plasticswastes with air/steam mixtures in a fluidized bed system. Fuel 2003;82(15–17):1967–76.
[13] Pohorely M, Vosecky M, Hejdová P, Puncochár M, Skoblja S, Staf M, et al.Gasification of coal and PET in fluidized bed reactor. Fuel 2006;85(17–18):2458–68.
[14] Ruoppolo G, Ammendola P, Chirone R, Miccio F. H2-rich syngas production byfluidized bed gasification of biomass and plastic fuel. Waste Manage2012;32(4):724–32.
[15] Mastellone ML, Zaccariello L, Arena U. Co-gasification of coal, plastic waste andwood in a bubbling fluidized bed reactor. Fuel 2010;89(10):2991–3000.
0%
5%
10%
15%
20%
25%
30%
35%
40%
45%
50%
640 670 700 730 760 790 820 850
Con
cent
ratio
n in
dry
pro
duct
gas
, vol
.-%C
onve
rsio
n of
PP
to C
H4
and
CxH
y, k
g/kg
·100
%
gasification temperature, oC
CH4 in product gas
Conversion of PP to CH4
Conversion of PP to CxHy
Fig. 16. Conversion of PP to CH4 and CxHy.
798 V. Wilk, H. Hofbauer / Fuel 107 (2013) 787–799
Author's personal copy
[16] Mastellone ML, Arena U. Olivine as a tar removal catalyst during fluidized bedgasification of plastic waste. AIChE J 2008;54(6):1656–67.
[17] Mastral FJ, Esperanza E, Berrueco C, Juste M, Ceamanos J. Fluidized bed thermaldegradation products of HDPE in an inert atmosphere and in air–nitrogenmixtures. J Anal Appl Pyrol 2003;70(1):1–17.
[18] Arena U, Zaccariello L, Mastellone ML. Tar removal during the fluidized bedgasification of plastic waste. Waste Manage 2009;29(2):783–91.
[19] Sancho JA, Aznar MP, Toledo JM. Catalytic air gasification of plastic waste(polypropylene) in fluidized bed. Part I: Use of in-gasifier bed additives. IndEng Chem Res 2008;47(4):1005–10.
[20] Xiao R, Jin B, Zhou H, Zhong Z, Zhang M. Air gasification of polypropyleneplastic waste in fluidized bed gasifier. Energy Convers Manage 2007;48(3):778–86.
[21] Wu C, Williams PT. Pyrolysis – gasification of plastics, mixed plastics and real-world plastic waste with and without Ni–Mg–Al catalyst. Fuel 2010;89(10):3022–32.
[22] Kim JW, Mun TY, Kim JO, Kim JS. Air gasification of mixed plastic wastes usinga two-stage gasifier for the production of producer gas with low tar and a highcaloric value. Fuel 2011;90(6):2266–72.
[23] Granatstein D. Case study on Lahden Lampovoima Gasification ProjectKymijarvi power station, Lahti. IEA Bioenergy Agreement Task 36; 2002.
[24] Wirthwein R, Scharf KF, Scur P, Drebbelhoff S. Betriebserfahrungen mit einemWirbelschichtvergaser beim Einsatz von Sekundärstoffen für dieSchwachgaserzeugung. ZKG Int 2002;55(1):61–9.
[25] Granatstein D. Case study on waste-fuelled gasification project Grève inChianti. IEA bioenergy agreement – task 36; 2003.
[26] Isaksson J. Kymijärvi II waste gasification plant. In: Seminar on advanced WtEtechnologies; 2012.
[27] Malkow T. Novel and innovative pyrolysis and gasification technologies forenergy efficient and environmentally sound MSW disposal. Waste Manage2004;24(1):53–79.
[28] Zschetzsche A, Hofbauer H, Schmidt A. Biomass gasification in an internalcirculating fluidized bed. In: Chartier P, Beenackers AA, Grassi G, editors.Proceedings of the 8th European conference on biomass for agriculture andindustry. Oxford, UK: Elsevier; 1994. p. 1771–6.
[29] Hofbauer H, Stoiber H, Veronik G. Gasification of organic material in a novelfluidisation bed system. In: The Society of Chemical Engineers Japan, editor.Proceedings of 1st SCEJ symposium on fluidisation. Tokyo; 1995. p. 291–9.
[30] Hofbauer H, Rauch R, Bosch K, Koch R, Aichernig C. Biomass CHP plant Güssing– a success story. In: Pyrolysis and gasification of biomass andwaste. CPLPress; 2003. p. 527–36.
[31] Kirnbauer F, Hofbauer H. Investigations on bed material changes in a dualfluidized bed steam gasification plant in güssing, Austria. Energy Fuels2011;25(8):3793–8.
[32] Sauciuc A, Potetz A, Weber G, Rauch R, Hofbauer H, Dumitrescu L. Syntheticdiesel from biomass by Fischer–Tropsch synthesis. In: Internationalconference of renewable energies and power quality (ICREPQ ’11), LasPalmas de Gran Canaria, Spain; 2011.
[33] Rehling B, Hofbauer H, Rauch R, Aichernig C. BioSNG process simulation andcomparison with first results from a 1-MW demonstration plant. BiomassConvers Biorefinery 2011;1:111–9.
[34] Falk G, Weber G, Rauch R, Hofbauer H, Weiß C. Mixed alcohols from biomasssteam gasification. In: Proceedings of the international conference onpolygeneration strategies (ICPS11), Vienna; 2011.
[35] Rauch R, Pfeifer C, Bosch K, Hofbauer H, Swierczynski D, Courson C, et al.Comparison of different olivines for biomass steam gasification. In: Science inthermal and chemical biomass conversion, Victoria, Canada; 2004.
[36] Wolfesberger U, Aigner I, Hofbauer H. Tar content and composition inproducer gas of fluidized bed gasification of wood – influence oftemperature and pressure. Environ Prog Sust Energy 2009;28(3):372–9.
[37] Pröll T, Hofbauer H. Development and application of a simulation tool forbiomass gasification based processes. Int J Chem React Eng 2008;6:A89.
[38] Pröll T, Rauch R, Aichernig C, Hofbauer H. Fluidized bed steam gasification ofsolid biomass – performance characteristics of an 8 MWth combined heat andpower plant. Int J Chem React Eng 2007;5:A54.
[39] Pfeifer C, Koppatz S, Hofbauer H. Steam gasification of various feedstocks at adual fluidised bed gasifier: impacts of operation conditions and bed materials.Biomass Convers Biorefinery 2011;1:39–53.
[40] Beyler CL, Hirschler MM. Thermal decomposition of polymers. In: DiNennoPJ, editor. SFPE handbook of fire protection engineering. NFPA; 2001. p.110–31.
[41] Koppatz S, Pfeifer C, Hofbauer H. Comparison of the performance behaviour ofsilica sand and olivine in a dual fluidised bed reactor system for steamgasification of biomass at pilot plant scale. Chem Eng J 2011;175:468–83.
[42] Kirnbauer F, Wilk V, Kitzler H, Kern S, Hofbauer H. The positive effects of bedmaterial coating on tar reduction in a dual fluidized bed gasifier. Fuel2012;95:553–62.
[43] Pinto F, Andre RN, Franco C, Lopes H, Gulyurtlu I, Cabrita I. Co-gasification ofcoal and wastes in a pilot-scale installation 1: effect of catalysts in syngastreatment to achieve tar abatement. Fuel 2009;88(12):2392–402.
[44] Milne TA, Abatzoglou N, Evans RJ. Biomass gasifier ‘tars’: their nature,formation, and conversion. Golden, Colorado: NREL; 1998.
[45] Elliott DC. Relation of reaction time and temperature to chemical compositionof pyrolysis oils. In: Soltes EJ, Milne TA, editors. Proceedings of the ACSsymposium series 376, pyrolysis oils from, biomass; 1988.
[46] Devi L. Catalytic removal of biomass tars; Olivine as prospective in-bedcatalyst for fluidized-bed biomass gasifiers. Technische UniversiteitEindhoven; 2005.
V. Wilk, H. Hofbauer / Fuel 107 (2013) 787–799 799