author's personal copy article was originally published in a journal published by elsevier, and...
TRANSCRIPT

This article was originally published in a journal published byElsevier, and the attached copy is provided by Elsevier for the
author’s benefit and for the benefit of the author’s institution, fornon-commercial research and educational use including without
limitation use in instruction at your institution, sending it to specificcolleagues that you know, and providing a copy to your institution’s
administrator.
All other uses, reproduction and distribution, including withoutlimitation commercial reprints, selling or licensing copies or access,
or posting on open internet sites, your personal or institution’swebsite or repository, are prohibited. For exceptions, permission
may be sought for such use through Elsevier’s permissions site at:
http://www.elsevier.com/locate/permissionusematerial

Autho
r's
pers
onal
co
py
Energy balance measurements and a simple model forestimating pecan water use efficiency
Junming Wang a,*, David R. Miller b, Ted W. Sammis a, Vince P. Gutschick c,Luke J. Simmons a, Allan A. Andales d
aDepartment of Plant and Environmental Sciences, Box 30003, MSC3Q, New Mexico State University, Las Cruces NM 88003, USAbDepartment of Natural Resources Management and Engineering, University of Connecticut, Storrs CT 06269-4087, USAcDepartment of Biology, Box 30001, MSC3AF, New Mexico State University, Las Cruces NM 88003, USAdUSDA-ARS Agricultural Systems Research Unit, Fort Collins CO 80526, USA
1. Introduction
WUEhasgenerallybeendefinedasunitsofplantgrowthperunit
ofevapotranspiration(ET)orconsumptivewateruse. Ithasbeen
expressedasunits ofdrymatter produced (DM) per unitof water
used (Jensen et al., 1981; Begg and Turner, 1976) and as
photosynthesisperunitofwater transpired(FischerandTurner,
1978; Sinclair et al., 1984). The term WUE has also been used to
a g r i c u l t u r a l w a t e r m a n a g e m e n t 9 1 ( 2 0 0 7 ) 9 2 – 1 0 1
a r t i c l e i n f o
Article history:
Accepted 3 May 2007
Keywords:
Eddy covariance
Oasis advection
Consumptive water use
Energy budget
Model
Water use efficiency
a b s t r a c t
Plant water use efficiency (WUE) is defined as the net dry matter production (DM) per unit of
consumptive water use. It is a vital variable for plant growth, yield, and irrigation-manage-
ment models. Pecan [Carya illinoinensis (Wangenh.) C. Koch] WUE has been estimated for
above ground biomass growth using evapotranspiration (ET) and DM data measured sepa-
rately in different experiments. The WUE for whole pecan trees (including above and below
ground parts), a direct measurement (ET and DM measured in one experiment), and a simple
model for WUE based on weather conditions, are currently lacking. A 16.5 m walk-up tower in
a flood irrigated pecan orchard, located in the Mesilla Valley of NM, was instrumented with
energy budget and eddy flux sensors. Continuous, above canopy measurements of vertical
fluxes of sensible heat, H2O vapor, and CO2 were made by the eddy covariance technique in
growing seasons from 2002 to 2005. ET was calculated from vapor flux. DM production was
calculated from CO2 flux assuming that dry matter of pecan trees was 46.4% carbon.
During the growing seasons (May through November), the mean ET was 122.7 cm (48
inch) per season; the mean dry matter production for the whole trees was 22082.3 kg ha�1
(19684.4 lb acre�1) per season. The average seasonal water use efficiency for the whole trees
was 179.7 kg ha�1 cm�1 (406.5 lbs acre�1 inch�1). In ‘on’ years (high-yield years) 13.8% of the
dry matter produced was allocated to the harvested nut crop, while in ‘off’ years only 8.0%
was so allocated. Similarly, the nut WUE as nut yield per unit water used (as cm depth) was
higher in ‘on’ years, at 26.2 kg nuts ha�1 cm�1 versus 14.9 kg nuts ha�1 cm�1. A simple model
for monthly WUE (kg ha�1 cm�1) as a function of vapor pressure deficit (VPD) and relative
humidity (RH) was obtained. It is anticipated that the measured WUE, the simple WUE
model, and other data obtained in this study will be useful in developing and validating
pecan growth, yield, and irrigation-management models.
# 2007 Elsevier B.V. All rights reserved.
* Corresponding author. Tel.: +1 505 646 3239; fax: +1 505 646 6041.E-mail address: [email protected] (J. Wang).
avai lable at www.sc iencedi rec t .com
journal homepage: www.e lsev ier .com/ locate /agwat
0378-3774/$ – see front matter # 2007 Elsevier B.V. All rights reserved.doi:10.1016/j.agwat.2007.05.003

Autho
r's
pers
onal
co
py
describe harvested yield per unit of water used (Evans and
Wardlaw, 1976). WUE is a vital parameter for plant growth, yield
andirrigation-managementmodels.Forexample,Al-Jamaletal.
(2002) developed a Eucalyptus tree irrigation model in which the
total tree growth (DM production) was a product of WUE and ET.
In New Mexico, the site of the study reported here, annual
WUE has been reported as ranging from 14 kg ha�1 cm�1 for
cotton fiber (Sammis, 1981) to 90 to 140 kg ha�1 cm�1 for dry
alfalfa forage (Abdul-Jabbar et al., 1983). Consequently, reported
estimates of WUE can vary by a factor of 10, depending on the
definition of WUE used, the type of crop, and what portion of the
crop is harvested. WUE can also be affected by weather
conditions. For example, Law et al. (2002) found that WUE for
forest trees, crops, and grasslands are stronglyaffectedby vapor
pressure deficit. Thus the current literature cannot be used to
quantify the basic consumptive use - productivity interactions
between different fields, crops, and weather.
Pecan water use is greater than that of most row crops. In the
arid southwest USA, the portion of irrigation water allocated to
pecans is increasing as pecan acreage increases compared to
other crops. Using total above ground biomass (including nuts)
measured by Kraimer (1998) and ET measured by Miyamoto
(1983), a WUE estimate for pecans is 150 kg ha�1 cm�1. Based on
lower values of seasonal ET measured by Sammis et al. (2004)
combined with Kraimer’s (1998) data, the WUE estimate is
160 kg ha�1 cm�1. But these estimates are based on separate ET
and biomass (DM) measured in different experiments, and do
not include below ground biomass.
Dry matter production of a plant can be directly measured
by drying and weighing the biomass such as in the above-
mentioned studies. However, the direct measurements are
time and labor intensive and the daily DM production cannot
be easily measured. Eddy covariance technology can measure
CO2 assimilation (CO2 flux) such as in the international
network FLUXNET (e.g., Law et al., 2002). Then, the DM
production can be estimated from the CO2 assimilation based
on the percentage carbon weight in the plants.
Complex physiological models can be used to calculate
WUE by simulating leaf photosynthesis, CO2 assimilation, DM
production, and water use. For example, Gutschick (2007)
calculated WUE using CO2, N, solar radiation, and VPD
estimates. The model solves a series of equations describing
a combination of carboxylation kinetics, the Ball-Berry model
of stomatal control (Ball et al., 1987), the energy balance, and
the functional balance for N and carbon gains. However, this
model is too complex to be easily built and operated. A simple
model for WUE is needed for pecan trees.
The objective of this research was to establish the WUE of
flood irrigated pecans, and develop a simple model for WUE
based on weather conditions. The WUE was for the whole tree,
including above (crown, shoots, and nuts) and below ground
parts (roots).
2. Methods
2.1. Site description
The experimental site was located within a pecan orchard
(cultivar Western Schley) on a farm south of Las Cruces, NM
(latitude: 32.2 N; longitude: 106.8 W; elevation, 1180 m). The
orchard consisted of mature pecan trees with an average tree
height (h) of 12 m with branches occasionally reaching 15 m.
The zero plane displacement, d (m), was estimated as d = 0.7 h
following the methods reported by Baldocchi and Hutchison
(1987) for an almond orchard. The roughness length, zo (m),
was estimated as zo = 0.1 h. The trees were squarely spaced
9.7 m (32 ft) from one another. Wet pecan yields were obtained
by weighing the harvested nuts and dry yield was calculated
by assuming 12% moisture content. There was little weed
cover on the floor of the orchard during the experiments.
The orchard was flood-irrigated at intervals varying from 8
to 21 days, averaging about every 14 days. Irrigations were
frequent enough that the soil water potential in the top 20 cm
was never below �65 kPa. This practice ensured the plants
were never water stressed. Irrigation amounts were measured
by calibrated floodgate openings using HoboTM automated
data loggers and sensors (Onset Computer Corporation,
Bourne, MA). Table 1 lists the dates and amounts of flood
irrigation applied during the four seasons. The farmer applied
320 kg ha�1 of actual nitrogen through the irrigation system
throughout each growing season.
2.2. Measurements
A 16.5 m (54 ft) tower was constructed within the orchard and
instrumented with micrometeorological sensors (Fig. 1).
Table 2 lists the sensor information including mounting
height, model, manufacturer and parameter measured. The
sonic anemometers were carefully leveled and oriented south.
Wind statistics were rotated into the mean wind stream for
30 min averaging periods following traditional rotational
techniques developed by Tanner and Thurtell (1969) and
detailed by Kaimal and Finnigan (1994). Soil heat flux disks
were buried 1 cm beneath the soil surface to minimize heat
flux divergence (Mayocchi and Bristow, 1995). The soil
temperature profile was not measured in this study. The eddy
covariance instruments were sampled continuously at 10 hz
and 30-min averages were saved in the data logger. A CS500
temperature and relative humidity sensor (Campbell Sci., Inc.,
Logan, Utah) was placed on top of the tower to collect data for
correcting the latent heat, sensible heat, and CO2 fluxes. The
temperature profile of the pecan canopy was measured by
placing four thermocouples at four different heights (3, 6, 9,
and 13 m).
A Campbell Scientific 23� data logger was used to control
the instruments and record the data. A Campbell Scientific
21� data logger was used to control and record the slow
response sensors that were sampled at 1-min intervals and
averaged for 15 and 30 min periods. All sensors and data
loggers were powered by three deep-cycle marine 12 V
batteries, and were recharged by solar panels.
Data were continuously acquired from May 1 to November
30, 2002, from April 1 to November 30, 2003, from May 1 to
November 30, 2004, and from April 1 to October 30, 2005 with
only a few missing periods. Missing data points were
estimated by linear interpolation between surrounding data
for periods less than 1 h. For periods greater than 1 h and less
than three days, data were estimated from values taken at the
same time the previous and following days with similar
a g r i c u l t u r a l w a t e r m a n a g e m e n t 9 1 ( 2 0 0 7 ) 9 2 – 1 0 1 93

Autho
r's
pers
onal
co
py
meteorological conditions. The longest data gap was three
days.
A local weather station, Leyendecker Plant Science
Research Center Weather Station, NM (weather.nmsu.edu),
3 km southeast of the orchard, measured hourly weather data,
including: wind speed (m s�1) and direction (degree), pre-
cipitation (cm), solar radiation (MJ m�2), humidity (%), air
temperature (8C), and soil temperature (8C).
2.3. Energy budget
The energy budget of the pecan orchard was considered using
the traditional approach:
Rn� G ¼ Hþ LE (1)
Here Rn is the net radiation, G is the soil heat flux, H is the
sensible heat flux, and LE is the latent heat flux (W m�2 or
J m�2 s�1). H and LE fluxes were estimated by eddy covariance
using the vertical velocity and the sonic temperature from the
CSAT3 along with the H2O fluctuations from the LI-COR 7500.
The signs of H, LE and G were positive away from the orchard
floor and Rn was positive toward the surface (net downward
flux). We did not count the diurnal storage term in the energy
budget. The storage term, when integrated over a diurnal cycle
in a forest, can be negligible according to the measurements by
Gay et al. (1996). We assumed that this was also the case in the
pecan orchard.
2.4. Sensible heat, evapotranspiration, carbon flux, andenergy residual
Eddy covariance (EC) techniques (Swinbank, 1951; Dyer, 1961)
were used to derive H, LE and FCO2(Garratt, 1992):
H ¼ rcpðw0T0vÞ (2)
LE ¼ Lðw0r0wÞ (3)
FCO2 ¼ ðw0½CO2�0Þ (4)
where r is the density of air (kg m�3), cp is the specific heat of
air (J kg�1 K�1), Tv is the sonic anemometer virtual temperature
(Kaimal and Gaynor, 1991) (K), L is the latent heat of vaporiza-
tion (J kg�1), rw is the concentration of water vapor in the air
(kg m�3), [CO2] is the CO2 concentration in air (mg m�3), and
FCO2 is the net flux of CO2 (mg m�2 s�1). In this paper, a
component prime (‘) indicates a deviation from the mean
Table 1 – Flood irrigations to the pecan orchard from 2002 through 2005
2002 Date Depth (mm) 2003 Date Depth (mm) 2004 Date Depth (mm) 2005 Date Depth (mm)
3/14 115.0 3/24 120.4 3/22 116.8 4/6 146.3
4/17 114.4 4/28 135.4 4/25 111.8 5/2 111.7
5/5 203.6 5/14 139.8 5/16 134.6 5/22 119.8
5/21 122.1 5/20 151.8 5/30 109.2 6/5 118.1
6/3 114.3 5/28 124.3 6/10 160.0 6/18 148.3
6/14 125.2 6/10 124.2 6/21 152.4 6/28 155.1
6/23 115.0 6/16 147.0 7/6 139.7 7/6 115.5
7/4 111.3 6/22 195.9 7/14 127.0 7/15 116.3
7/15 96.8 7/1 119.5 7/23 127.0 7/25 111.7
7/25 95.0 7/9 93.0 8/2 111.8 8/2 110.9
8/5 94.0 7/17 88.0 8/11 111.8 8/10 119.1
8/14 87.9 7/25 93.2 8/24 99.1 8/22 116.7
8/23 81.3 8/2 87.6 9/2 101.6 9/1 N/Aa
8/30 94.3 8/14 94.2 9/9 96.5 9/14 N/A
9/14 107.2 8/21 92.0 9/17 101.6 9/22 127.2
9/23 80.4 8/28 49.7 9/28 101.6 10/4 73.4
10/4 112.8 9/5 107.1 10/14 88.9 10/24 73.4
10/22 83.6 9/13 101.0 10/27 68.6
9/23 75.6
10/6 95.4
10/22 94.2
Total 1954.2 2329.5 2059.9 1997.3
a N/A: not available.
Fig. 1 – Eddy-covariance instrument tower in the pecan
orchard in January 2003.
a g r i c u l t u r a l w a t e r m a n a g e m e n t 9 1 ( 2 0 0 7 ) 9 2 – 1 0 194

Autho
r's
pers
onal
co
py
and the overbar denotes a time average. Energy residual is
calculated as the difference between the LE measured using
Eq. (3) and the energy balance using Eq. (1) (J m�2 s�1 or
W m�2).
Daily/monthly energy terms Rn, H, G, and LE and the
residual (all in J m�2 d�1 or J m�2 month�1) were calculated by
integrating the corresponding measured term (J m�2 s�1) over
each day /month.
LE was converted to ET (cm s�1).
ET ¼ 100LELr
(5)
where r is water density (1000 kg m�3).
Monthly ET (cm month�1) was calculated by integrating ET
(cm s�1) throughout each month. Growing season total ET (cm
season�1) was calculated by summing monthly ET from May
through November for each year.
Net flux of CO2 was converted to net dry matter production
(mg m�2 s�1) by multiplying with 0.593, which was derived
from the following:
12 gC44 gCO2
2:17 gDM1 gC
� �¼ 26:1 gDM
44 gCO2¼ 0:593
gDMgCO2
ðmg m�2 s�1Þ
(6)
where there are 12 g C in 44 g of CO2 (per mole) and the plant
dry matter (DM) is, on average, composed of 46.4% C (i.e. 2.17 g
DM per g C,). Shafizadeh (1984) reported the average C weight
composition (46.4% C) for tree woody parts. Negi et al. (2003)
reported trees in Australia having an average of 45% C (weight)
in leaves. Stewart and Silcox (1999) reported that pecan shells
are 47.74% C. There are little information in the literature for
the C percent composition for fine roots and nutmeat, and new
shoots. The average C composition in annual dry matter
growth was assumed to be 46.4%.
Consequently, 1 mg CO2 m�2 s�1 can produce 0.593 mg DM
m�2 s�1. This DM is total DM production including pecans root,
tree trunk, leaves, branches and pecan nuts, along with any
biomass in the soil other than roots.
Hourly/daily/monthly net DM production (mg m�2 hour�1,
kg ha�2 day�1, kg ha�2 month�1) was calculated by integrating
DM production (mg m�2 s�1) over each hour/day/month. The
yearly DM production was calculated from May 1 to November
30. In 2005, because the November ET and DM data were not
available, 2004 November data was used for the 2005 yearly ET
and DM production calculations.
Daily average night CO2 flux (net respiration flux) was
calculated from 20:00 h to 4:00 h every day. Average daily net
respiration flux was obtained by multiplying 1.66 to the
corresponding average night CO2 flux. The parameter 1.66 was
derived as the ratio of the whole-day to night-only integrals of
exp(0.085Tsoil), which is the soil-temperature (Tsoil) response
of respiration, in the short term (Fang and Moncrieff, 2001).
This response was, in turn, derived by fitting this exponential
form of soil temperature (8C) against the nighttime flux data.
Then, average daily net respiration flux was multiplied by
0.593 to convert to a flux representing DM consumption
(mg m�2 s�1). Monthly DM consumption (Rd) from respiration
(kg ha�2 month�1) was calculated by integrating the corre-
sponding daily average DM consumption over each month.
The monthly total DM production (A) (kg ha�2 month�1) was
calculated as the summation of net DM production and the DM
consumption. The ratio (Rd/A) was calculated for each month
to estimate the seasonal variation.
2.5. Corrections to LE, H, and CO2 fluxes
The H was calculated using the sonic virtual temperature (Tv),
which is affected by moisture in the air. A CS500 air
temperature and humidity sensor (Campbell Sci., Inc., Logan,
Utah) was mounted next to the eddy covariance system in
order to obtain the vapor pressure in the air, which was used to
make moisture corrections to H (Schotanus et al., 1983). In
addition to this correction, when the turbulent flux of any
constituent is measured by the eddy covariance system, the
simultaneous flux of any other entity needs to be taken into
account. In particular, heat or water vapor can cause
expansion of the air and thus affects the constituent’s density
and flux. Corrections were done for LE and CO2 fluxes based on
the vapor and heat fluxes’ effects on the densities of moist air
(Webb et al., 1980).
2.6. Measured WUE and VPD
Monthly/yearly WUE (kg ha�1 cm�1) was calculated using
monthly/yearly net DM production divided by corresponding
ET.
Table 2 – Eddy covariance instrumentation in the pecan orchard
Height aboveground (m)
Instrument/Manufacturer Variable measured Samplingfrequency
Comment
16.5 CSAT3, 3-axis sonic anemometer
(Campbell Sci., Inc., Logan, Utah)
Component wind speeds
u, v, w (m s�1)
10 hz
16.5 LI-COR 7500, open path H2O-CO2 sensor
(LI-COR Corporate, Lincoln, Nebraska)
CO2 concentration (mg m�3)
H2O concentration (kg m�3)
10 hz Mounted
below CSAT3
16.5 IRTP-P, Infrared thermocouple
(Apogee Instruments, Inc., Logan, UT)
Canopy surface temperature (K) 1 min�1
16 Q 7, net radiometer (Radiation Energy
Balance System, Seattle, Washington)
Net radiation (W m�2) 1 min�1
16 LI-COR Silicon Pyranometer, (LI-COR
Corporate, Lincoln, Nebraska)
Solar radiation (W m�2) 1 min�1
�.01 HFT3, 3 Soil heat flux disks (Radiation Energy
Balance System, Seattle, Washington)
Soil heat flux (W m�2) 1 min�1
a g r i c u l t u r a l w a t e r m a n a g e m e n t 9 1 ( 2 0 0 7 ) 9 2 – 1 0 1 95

Autho
r's
pers
onal
co
py
At the experimental orchard, the daily VPD was calculated
using local weather data from Leyendecker Plant Science
Research Center Weather Station, NM (weather.nmsu.edu).
The daily VPD was calculated as the average of hourly VPD.
Hourly VPD was calculated as the following.
VPD ¼ 0:6108� 2:71817:269�TTþ237:3 � ð1� RHÞ (7)
where T is the mean air temperature (8C), and RH is the hourly
relative humidity (%/%). Monthly average of VPD was calcu-
lated for future WUE regression analysis.
2.7. Complex model simulation
To obtain a simple model for WUE, the input weather variables
and the mathematical form of the equation (exponential,
linear, etc.) should be determined. A physiological model by
Gutschick (2007) was used to deduce the framework of the
mathematical form for WUE. The following simply describes
the physiological model structure. The details are described by
Gutschick (2007).
This physiological model can calculate WUE by simulating
leaf photosynthesis, CO2 assimilation and water use. The
model solves a series of equations describing combination of
carboxylation kinetics, the Ball-Berry model of stomatal
control (Ball et al., 1987), the energy balance, and the
functional balance for N and carbon gains. Standard values
of the physiological parameters were used.
(A) Photosynthetic capacity of leaves: 100 m mol CO2 m�2 s�1.
(B) PAR (Photosynthetic active radiation) absorptivity of
leaves: 0.85.
(C) Ball-Berry slope: 10.
(D) Ball-Berry intercept: 0.03 mol m�2 s�1.
(E) ‘‘Convexity’’ factor in the shift from light-limited to light-
saturated
(F) photosynthetic rate: 0.8.
(G) PPFD (photosynthetic photon flux density): 1000 m mol
(H) photons m�2 s�1.
(I) Ca (CO2 partial pressure in the canopy), on average: 34 Pa.
2.8. Simple model
The input weather variables and mathematical form for the
WUE simple model was derived according to the theory
presented by Gutschick (2007). The procedure is as follows.
WUE ¼ A� Rd
E¼ A
E1� Rd
A
� �(8)
where A is plant CO2 assimilation, Rd is plant and soil respira-
tion, and E is plant transpiration (we ignore the soil evapora-
tion here and it is generally small because of the large
attenuation of both Rn and u near the ground under canopies).
AE¼ g0sðCa � CiÞ
gsðei � eaÞ¼ 0:62Cað1� Ci=CaÞ
VPDLeaf(9)
gs is stomatal conductance per unit leaf area for water vapor,
gs’ is stomatal conductance per unit leaf area, for CO2
(=0.62 � gs), Ci and Ca are leaf-interior and exterior partial
pressures of CO2, ei and ea are leaf-interior and exterior partial
pressures of water vapor. We set VPDLeaf = ei � ea, where
VPDLeaf is the vapor pressure deficit between the leaf interior
and the air.
VPDLeaf � VPD ¼ ei � ea � ðesðTÞ � eaÞ ¼ ei � esðTÞ (10)
es(T) is saturation vapor pressure when air temperature is T.
ei � esðTÞ ¼ ½Tleaf � T� � dðesðTÞÞdT
(11)
From our measured canopy temperature compared to air
temperature, TLeaf–T is close to 0. This is similar to the finding
of Campbell and Norman (1998) where TLeaf–T ranges from 0 to
1.2 8C if leaf characteristic dimension is 5 cm, air temperature
is 30 8C, u = 1 m s�1, and RH = 0.2.
Then Eq. (9) can be written as:
AE¼ 0:62Cað1� Ci=CaÞ
VPD(12)
There is a normal response of Ci/Ca to the environment,
particularly to relative humidity or VPD (Ball et al., 1987). High
VPD (low humidity) tends to close stomata. To find the
relationship between Ci/Ca and VPD and humidity, Gutschick’s
model was run using our monthly weather data (air
temperature, relative humidity, wind speed, and solar radia-
tion) (total 26 cases). Ci/Ca in the model is highly correlated to
relative humidity (R2 = 0.84, Fig. 2) and not strongly related to
VPD (R2 = 0.25, Fig. 3).
Then, we derive a new equation.
A
E¼ 0:62Cað1� 0:86RH� 0:3Þ
VPD¼ 0:62Cað0:7� 0:86RHÞ
VPD(13)
Now, Rd/A in Eq. (8) needs to be determined. We found Rd/A
(average = 0.67) did not vary much over the study period
(Fig. 4).
Eq. (8) can be written as:
WUE ¼ AE
1� Rd
A
� �¼ a
Cað0:7� 0:85RHÞVPD
0:33 (14)
Fig. 2 – The relationship between Ci/Ca and relative
humidity (RH) for pecan trees simulated by the
physiological model in Gutschick (2007). Ci and Ca are
leaf-interior and exterior partial pressures of CO2.
a g r i c u l t u r a l w a t e r m a n a g e m e n t 9 1 ( 2 0 0 7 ) 9 2 – 1 0 196

Autho
r's
pers
onal
co
py
where a is a constant. Assuming monthly Ca (CO2 partial
pressure in the canopy) is similar during a growing season,
we set (0.7–0.85RH)/(VPD) as the independent variable and the
intercept as 0 and then a regression equation for WUE was
determined. All the data from May to November (excluding
May to July of 2003) were used for the regression analysis.
Residual analysis and F test were conducted for this equation
to check if it was statistically significant. All the statistical
analyses were conducted using MINITAB (2000).
3. Results and discussion
3.1. Energy budgets
Typical seasonal energy budgets presented in Fig. 5 show that
ET (LE in the figure) increased sharply from April to June and
peaked in June in response to the available radiation and
increasing leaf area. Fig. 6 also gives monthly ET totals in the
four experimental years and supports the above statement.
Energy budgets from this orchard for 2001 and 2002 were
reported by Sammis et al. (2004), where LE was estimated as
the residual of the energy budget (Eq. (1)) and an one-propeller
eddy covariance (OPEC) system (Blanford and Gay, 1992) was
used to measure sensible heat flux. The LE fluxes measured in
this study during 2002 were 8% higher in June, 10% higher in
July, 2% higher in August, and 15% higher in September than
LE in the same orchard in the same year (Sammis et al., 2004).
The differences may be explained by several possible
causes. One cause may be that the OPEC system may have
produced erroneous estimates of H, which then led to
erroneous LE. In order for the OPEC system to work correctly,
the conditions have to be right: larger eddies of medium to low
frequency, which typically precludes nighttime data. Another
cause may be error in the flux measurements by the eddy
covariance technique, especially at night when stable condi-
tions result in eddies smaller than the path lengths of the sonic
anemometer and the LI-COR 7500.
We also compared our monthly LE fluxes (ET) to those
reported by Miyamoto (1983). Our data were slightly lower
than those reported by Miyamoto (1983), who used soil
moisture depletion measurements. Based on the compar-
isons, our measured ET seemed reasonable.
Fig. 5 demonstrates a positive residual (error) in the energy
budget closure during the summer months. The soil heat flux
plates were buried 1 cm beneath the ground in this study. It
may have had errors in measuring the soil surface heat flux
Fig. 3 – The relationship between Ci/Ca and vapor pressure
deficit (VPD) for pecan trees simulated by the physiological
model in Gutschick (2007). Ci and Ca are leaf-interior and
exterior partial pressures of CO2.
Fig. 4 – Rd/A variation with month from 2002 through 2005
in the pecan orchard. Monthly dry-matter consumption
(Rd) from respiration (kg haS2 monthS1) was calculated by
integrating the corresponding daily dry-matter
consumption (calculated from CO2 flux) over each month.
The monthly total dry-matter production (A) (kg haS2
monthS1) was calculated as the summation of net dry-
matter production (calculated from CO2 flux) and the dry-
matter consumption. Data during April to July 2003 were
not included because of CO2 sensor calibration problems.
Fig. 5 – Typical seasonal energy budgets of the pecan
orchard (2003 growing season). LE: latent heat flux, Rn: net
solar radiation, G: soil heat flux, H: sensible heat flux, and
residual = Rn-G-H-LE.
Fig. 6 – Monthly values of evapotranspiration (ET) of pecan
trees during 2002–2005 growing seasons measured by
eddy covariance technology.
a g r i c u l t u r a l w a t e r m a n a g e m e n t 9 1 ( 2 0 0 7 ) 9 2 – 1 0 1 97
Autho
r's
pers
onal
co
pyand partially contributed to the non-zero residual. Wilson
et al. (2002) showed that at 22 FLUXNET sites, there was a
general lack of closure at most sites, with a mean imbalance in
the order of 25%. The closure in this study was improved
because LI-COR 7500 was calibrated relative to a Krypton
Hygrometer (KH20, Campbell Sci., Inc., Logan, Utah).
Fig. 6 shows that 2004 ET estimates in May and June were
lower than in the other three years; and 2002 and 2004 ET
estimates in September and October were higher than in 2003
and 2005. These can be partially explained by the irrigation
and precipitation amounts. In 2004 May and June, the
irrigation and precipitation amounts were lower than in the
other three years (Table 3). This may have caused 2004 May
and June ET to be lower than the other three years. In 2002 and
2004 September and October, the irrigation and precipitation
amounts were higher than in 2003 and 2005 (September data
was missing from 2005). This may have caused the ET to be
higher in September and October of 2002 and 2004 than in the
months of 2003 and 2005.
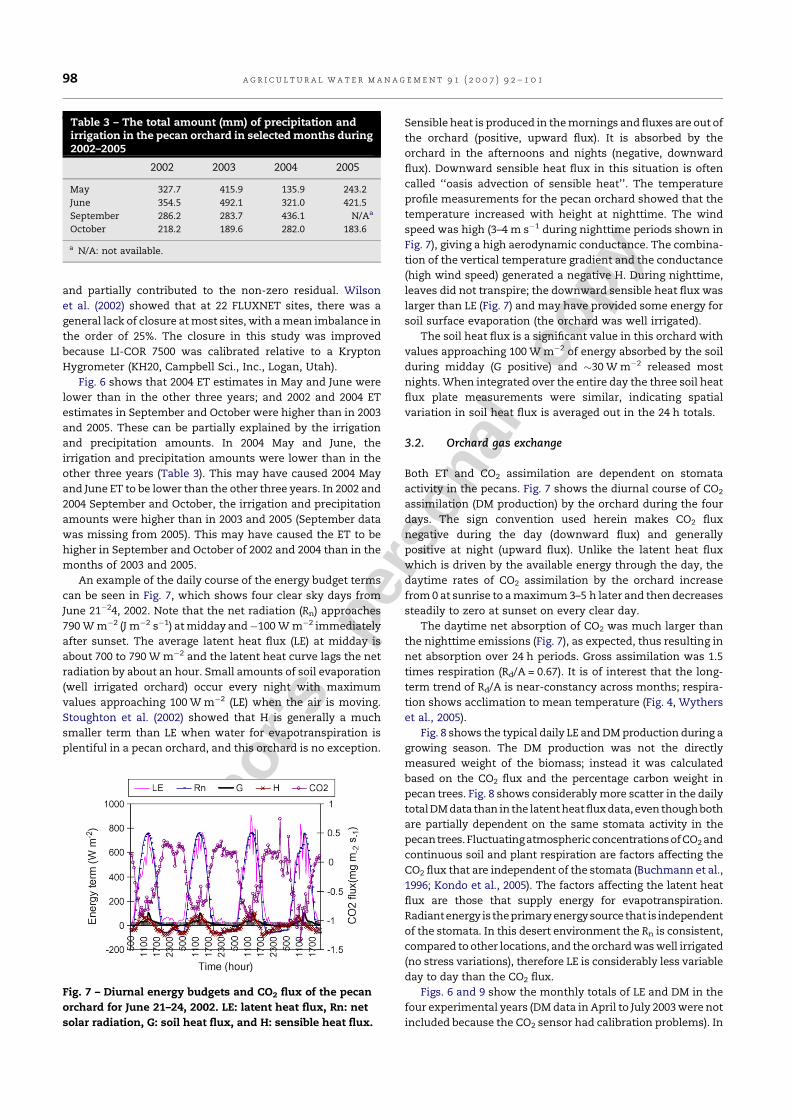
An example of the daily course of the energy budget terms
can be seen in Fig. 7, which shows four clear sky days from
June 21�24, 2002. Note that the net radiation (Rn) approaches
790 W m�2 (J m�2 s�1) at midday and�100 W m�2 immediately
after sunset. The average latent heat flux (LE) at midday is
about 700 to 790 W m�2 and the latent heat curve lags the net
radiation by about an hour. Small amounts of soil evaporation
(well irrigated orchard) occur every night with maximum
values approaching 100 W m�2 (LE) when the air is moving.
Stoughton et al. (2002) showed that H is generally a much
smaller term than LE when water for evapotranspiration is
plentiful in a pecan orchard, and this orchard is no exception.
Sensible heat is produced in the mornings and fluxes are out of
the orchard (positive, upward flux). It is absorbed by the
orchard in the afternoons and nights (negative, downward
flux). Downward sensible heat flux in this situation is often
called ‘‘oasis advection of sensible heat’’. The temperature
profile measurements for the pecan orchard showed that the
temperature increased with height at nighttime. The wind
speed was high (3–4 m s�1 during nighttime periods shown in
Fig. 7), giving a high aerodynamic conductance. The combina-
tion of the vertical temperature gradient and the conductance
(high wind speed) generated a negative H. During nighttime,
leaves did not transpire; the downward sensible heat flux was
larger than LE (Fig. 7) and may have provided some energy for
soil surface evaporation (the orchard was well irrigated).
The soil heat flux is a significant value in this orchard with
values approaching 100 W m�2 of energy absorbed by the soil
during midday (G positive) and �30 W m�2 released most
nights. When integrated over the entire day the three soil heat
flux plate measurements were similar, indicating spatial
variation in soil heat flux is averaged out in the 24 h totals.
3.2. Orchard gas exchange
Both ET and CO2 assimilation are dependent on stomata
activity in the pecans. Fig. 7 shows the diurnal course of CO2
assimilation (DM production) by the orchard during the four
days. The sign convention used herein makes CO2 flux
negative during the day (downward flux) and generally
positive at night (upward flux). Unlike the latent heat flux
which is driven by the available energy through the day, the
daytime rates of CO2 assimilation by the orchard increase
from 0 at sunrise to a maximum 3–5 h later and then decreases
steadily to zero at sunset on every clear day.
The daytime net absorption of CO2 was much larger than
the nighttime emissions (Fig. 7), as expected, thus resulting in
net absorption over 24 h periods. Gross assimilation was 1.5
times respiration (Rd/A = 0.67). It is of interest that the long-
term trend of Rd/A is near-constancy across months; respira-
tion shows acclimation to mean temperature (Fig. 4, Wythers
et al., 2005).
Fig. 8 shows the typical daily LE and DM production during a
growing season. The DM production was not the directly
measured weight of the biomass; instead it was calculated
based on the CO2 flux and the percentage carbon weight in
pecan trees. Fig. 8 shows considerably more scatter in the daily
total DM data than in the latent heat flux data, even though both
are partially dependent on the same stomata activity in the
pecantrees.Fluctuating atmospheric concentrations ofCO2 and
continuous soil and plant respiration are factors affecting the
CO2 flux that are independent of the stomata (Buchmann et al.,
1996; Kondo et al., 2005). The factors affecting the latent heat
flux are those that supply energy for evapotranspiration.
Radiantenergy is theprimary energy source that is independent
of the stomata. In this desert environment the Rn is consistent,
compared to other locations, and the orchard was well irrigated
(no stress variations), therefore LE is considerably less variable
day to day than the CO2 flux.
Figs. 6 and 9 show the monthly totals of LE and DM in the
four experimental years (DM data in April to July 2003 were not
included because the CO2 sensor had calibration problems). In
Table 3 – The total amount (mm) of precipitation andirrigation in the pecan orchard in selected months during2002–2005
2002 2003 2004 2005
May 327.7 415.9 135.9 243.2
June 354.5 492.1 321.0 421.5
September 286.2 283.7 436.1 N/Aa
October 218.2 189.6 282.0 183.6
a N/A: not available.
Fig. 7 – Diurnal energy budgets and CO2 flux of the pecan
orchard for June 21–24, 2002. LE: latent heat flux, Rn: net
solar radiation, G: soil heat flux, and H: sensible heat flux.
a g r i c u l t u r a l w a t e r m a n a g e m e n t 9 1 ( 2 0 0 7 ) 9 2 – 1 0 198

Autho
r's
pers
onal
co
py
April, pecan trees were in the leaf out stage and ET rates and
DM production were low. During May to August, leaves were
fully developed and there was high radiation, consequently,
the DM and ET were high during these months. From
September to November, solar radiation decreased, as did
ET and DM. During the growing seasons in the four years (May
to November), the mean ET was 122.7 cm per season and the
standard deviation was 3.0 cm per season; the mean dry
matter production was 22082.3 kg ha�1 (19684.4 lb acre�1) and
the standard deviation was 1190.1 kg ha�1 (1060.9 lb acre�1).
3.3. Water use efficiency
Fig. 10 shows the monthly average of WUE was about
260 kg ha�1 cm�1 at the beginning of the growing seasons,
decreasing to �120 to 200 during the growing season and
returning to high values, 360–470 kg ha�1 cm�1 at the end of
the season. The higher water use efficiency at the beginning
and end of the seasons is partially due to lower water flux at
the leaf-level in response to lower vapor pressure deficits
(VPD) (Figs. 10 and 11). The international network FLUXNET
measured the net CO2 flux and LE flux at different sites during
the day and then calculated a WUE as the difference between
the net CO2 flux and the daytime ecosystem respiration
divided by the water flux (gross ecosystem production, GEP).
These studies showed a decrease in WUE with an increase in
VPD (Law et al., 2002). Gutschick (2007) model simulations also
supported the above remark (Fig. 12) and proved our measured
WUE was reasonable.
Fig. 9 – Monthly values of dry matter (DM) production of
pecan trees during 2002–2005 growing seasons. Data in
months of April to July in 2003 were not included. DM
production was calculated from CO2 flux assuming that
dry matter of pecan trees was 46.4% carbon. CO2 flux was
measured by eddy covariance technology.
Fig. 10 – Monthly values of Water Use Efficiency (WUE) of
pecan trees measured by eddy covariance technology
during 2002–2005 growing seasons. Data in months of
April to July in 2003 were not included because of CO2
sensor calibration problems.
Fig. 11 – Monthly values of Vapor Pressure Deficit (VPD) in
the pecan orchard during 2002–2005 growing seasons.
Fig. 12 – Measured and predicted monthly mean water use
efficiency (WUE) of pecan trees against vapor pressure
deficit (VPD). Predicted values are from the simple
regression model and Gutschick (2007) complex
physiological model.
Fig. 8 – Typical daily values of latent heat flux (LE) and dry
matter (DM) production of pecan trees in 2002 growing
season. DM production was calculated from CO2 flux
assuming that dry matter of pecan trees was 46.4% carbon.
LE and CO2 flux was measured by eddy covariance
technology.
a g r i c u l t u r a l w a t e r m a n a g e m e n t 9 1 ( 2 0 0 7 ) 9 2 – 1 0 1 99

Autho
r's
pers
onal
co
py
The eddy covariance measurements in this study were
used to estimate the combined above and below ground
biomass production, which was used in calculating WUE. The
average seasonal water use efficiency (May to November) was
179.7 kg ha�1 cm�1 (406.5 lbs acre�1 inch�1) and the standard
deviation was 22.5 kg ha�1 cm�1 (50.8 lbs acre�1 inch�1).
Consequently these are 25–35% higher than previous WUE
estimates (150–160 kg ha�1 cm�1), which included only above
ground biomass. Thus, it appears that about 25–35% of the
total seasonal tree growth was in the roots.
The pecan nut yield (dry weight) was 2106, 3239, 1557, and
3256 kg ha�1 in 2002, 2003, 2004, and 2005, respectively. In ‘on’
years (2003 and 2005), 13.8% (standard deviation = 4.2%) was
allocated to the harvested nut crop and in ‘off’ years (2002 and
2004) 8.0% (standard deviation = 1.7%) was allocated to the
harvested nut crop. The 2005 (‘on’ year) DM production data
from May to July was used for the same period in 2003 (’on’
year), in lieu of outliers in 2003 caused by faulty calibration of
CO2 sensors.
The average water use efficiency based on nut yield was
14.9 kg nut yield ha�1 cm�1 (standard deviation = 2.6 kg nut
yield ha�1 cm �1) in ‘off’ years and 26.2 kg nut yield ha�1 cm�1
water (standard deviation = 0.4 kg nut yield ha�1 cm�1) in ‘on’
years.
3.4. Simple model for WUE
Given below is the derived form of the simple model for WUE.
WUE ¼ 1095� ð0:7� 0:86RHÞVPD
(15)
The residual analysis and F test (F = 634.34, P < 0.001,
R2 = 0.74) show that the equation is significant. Using our VPD
and RH data inputs, predictions from the equation are shown
in Fig. 12 (because VPD was calculated from and correlated to
RH, only the plot of WUE vs VPD is shown). This figure shows
that when VPD is high (RH is low), WUE is low. Higher VPD can
result in stomatal closure and decreased WUE (Law et al., 2002;
Gutschick, 2007).
WUE for pecan DM and pecan nut yield would be greater in
southeastern states such as Georgia where the VPD would be
lower during the growing season compared to southern New
Mexico. One hypothesis is that the simple model presented in
Fig. 12 can be used to estimate WUE of pecans at other
locations, such as Georgia. However, the hypothesis needs to
be evaluated in future studies.
In the derivation of the simple model, Ci/Ca (the ratio of
leaf-interior and external partial pressures of CO2) was found
to be highly correlated with relative humidity (R2 = 0.84, Fig. 2)
but was not strongly related to VPD (R2 = 0.25, Fig. 3). This
agrees with the conclusions of Gutschick and Simonneau
(2002) and Gutschick (2007), that the Ball-Berry model (using
leaf surface humidity) is generally better than the Leuning
(1995) or Dewar (1995) models that use VPD.
We attempted to exclude November data (at the end of
the growing seasons) in our regression. However, the R2
decreased to 0.4. Nevertheless, this is still better than what
Law et al. (2002) obtained across one type of ecosystem (e.g.
grassland). Considering that significant DM production
occurred in November, we included the data in the final
regression analysis (Eq. (15)). Leaf stomatal control and
carboxylation capacity may be different in these months
than the months before. We have only partial data on these
months and, in the future, a better model that includes
degree days to distinguish different growth phases will be
needed.
A non-mechanistic regression equation for WUE was also
obtained with a high R2 = 0.82 and P < 0.01 (F test).
WUE ¼ 146þ 839
VPDexpð�0:09TÞ (16)
Although the R2 of the equation is higher than the
mechanistic one, the mechanistic equation is recommended.
Although the non-mechanistic equation fits the experimental
data better, it may not fit other experimental data well. The
mechanistic model was derived based on physiological
principles and should be more robust (i.e. applicable at
different locations) than the non-mechanistic model.
4. Conclusions
During the 2002 to 2005 growing seasons, mean pecan ET
was 122.7 cm (48 inch) per season; mean dry matter
production for the whole pecan trees was 22082.3 kg ha�1
(19684.4 lb acre�1) per season. The average seasonal water
use efficiency for the whole trees was 179.7 kg ha�1 cm�1
(406.5 lbs acre�1 inch�1). Dry matter allocation to nuts
averaged 13.8% in the high-yielding ‘on’ years (2003 and
2005) and 8.0% in the lower-yielding ‘off’ years (2002 and
2004). Corresponding nut yield WUE values were 26.3 kg nut
yield ha�1 cm �1 in the ‘on’ years and 14.9 kg nut yield
ha�1 cm�1 in the ‘off’ years.
A simple model for monthly pecan WUE (kg ha�1 cm�1) as a
function of VPD and RH was obtained (WUE = 1095 � ((0.7–
0.86RH)/(VPD)), R2 = 0.74, F = 23.39, P < 0.001). This model,
derived from data measured at the Mesilla Valley in New
Mexico, may possibly be used at other locations. However, this
hypothesis must be tested with data from other locations. We
anticipate that the measured WUE, the simple WUE model,
and other data obtained in this study will be useful in
developing and validating pecan growth, yield, and irrigation-
management models.
Finally, it appears that energy budget estimates of ET using
the OPEC system should be calibrated against an eddy
covariance system over the crop canopy under consideration
to avoid underestimates of ET.
Acknowledgements
The authors wish to thank Mr. David Salopek, for allowing
the use of his commercial orchard and his continuous
cooperation on this project. This research was supported by
the New Mexico State University Agricultural Experiment
Station, Las Cruces, NM 88005 and the Storrs Agricultural
Experiment Station, University of Connecticut, Storrs Con-
necticut, 06250.
a g r i c u l t u r a l w a t e r m a n a g e m e n t 9 1 ( 2 0 0 7 ) 9 2 – 1 0 1100

Autho
r's
pers
onal
co
py
r e f e r e n c e s
Abdul-Jabbar, A.S., Sammis, T.W., Lugg, D.G., Kallsen, C.E.,Smeal, D., 1983. Water use by alfalfa, corn and barley asinfluenced by available soil water. Agric. Water Manage. 6,351–363.
Al-Jamal, M.S., Sammis, T.W., Mexal, J.G., Picchioni, G.A.,Zachritz, W.H., 2002. A growth-irrigation scheduling modelfor wastewater use in forest production. Agric. WaterManage. 56, 57–79.
Ball, J.T., Woodrow, I.E., Berry, J.A., 1987. A model predictingstomatal conductance and its contribution to the control ofphotosynthesis under different environmental conditions.In: Biggins, J. (Ed.), Progress in Photosynthesis Research,vol. IV. Martinus, Nijhoff, Dordrecht, The Netherlands, pp.221–224.
Baldocchi, D.D., Hutchison, B.A., 1987. Turbulence in an almondorchard. Boundary-Layer Meteorol. 40, 127–164.
Begg, J.E., Turner, N.C., 1976. Crop water deficits. Adv. Agron. 28,161–217.
Blanford, J.H., Gay, L.W., 1992. Test of a robust eddycorrelation system for sensible heat flux. Theor. Appl.Climatol. 46, 53–56.
Buchmann, N., Kao, W.Y., Ehleringer, J.R., 1996. Carbon dioxideconcentrations within forest canopies-variation with time,stand structure, and vegetation type. Global Change Biol. 2,421–432.
Campbell, G.S., Norman, J.M., 1998. An Introduction toEnvironmental Biophysics, Second edition. Springer, NewYork, p. 227.
Dewar, R.C., 1995. Interpretation of an empirical model forstomatal conductance in terms of guard cell function:theoretical paper. Plant Cell Environ. 18, 365–372.
Dyer, A.J., 1961. Measurements of evaporation and heat transferin the lower atmosphere by an automatic eddy-correlationtechnique. Quart. J. R. Meteorol. Soc. 87, 401–412.
Evans, L.T., Wardlaw, I.F., 1976. Aspects of the comparativephysiology of grain yield in cereals. Adv. Agron. 28, 301–359.
Fang, C., Moncrieff, J.B., 2001. The dependence of soil CO2 efluxon temperature. Soil Biol. Biochem. 33, 155–165.
Fischer, R.A., Turner, N.C., 1978. Plant productivity in thearid and semiarid zones. Annu. Rev. Plant Physiol. 29,277–317.
Garratt, J.R., 1992. The Atmospheric Boundary Layer. CambridgeUniversity Press, New York, p. 316.
Gay, L.W., Vogt, R., Kessler, A., 1996. The May-October energybudget of a Scots pine plantation at Hartheim Germany.Theor. Appl. Climatol. 46, 79–94.
Gutschick, V.P., 2007. Plant acclimation to elevated CO2 - fromsimple regularities to biogeographic chaos. Ecol. Model. 200,433–451.
Gutschick, V.P., Simonneau, T., 2002. Modelling stomatalconductance of field-grown sunflower under varying soilwater status and leaf environment: comparison of threemodels of response to leaf environment and coupling withan ABA-based model of response to soil drying. Plant CellEnviron. 25, 1423–1434.
Jensen, M.E., Harrison, D.S., Korven, H.C., Robinson, F.E., 1981.The role of irrigation in food and fiber production. In:Jensen, M.E. (Ed.), Design and Operation of Farm IrrigationSystems. ASAE Monograph No. 3, pp. 15–41.
Kaimal, J.C., Gaynor, J.E., 1991. Another look at sonicthermometry. Boundary-Layer Meteorol. 56, 401–410.
Kaimal, J.C., Finnigan, J.J., 1994. Atmospheric Boundary LayerFlows. Oxford Univ. Press, New York, p. 289.
Kondo, M., Muraoka, H., Uchida, M., Yazaki, Y., Koizumi, H.,2005. Refixation of respired CO2 by understory vegetation in
a cool-temperate deciduous forest in Japan. Agric. For.Meteorol. 34 (1–4), 110–121.
Kraimer, R.A., 1998. Fate of labeled fertilizer applied to pecans.M.S. Thesis, New Mexico State University.
Law, B.E., Falge, E., Gu, L., Baldocchi, D.D., Bakwin, P., Berbigier,P., Davis, K., Dolman, A.J., Falk, M., Fuentes, J.D., Goldstein,A., Granier, A., Grelle, A., Hollinger, D., Janssens, L.A., Jarvis,P., Jensen, N.O., Katul, G., Mahli, Y., Matteucci, G., Meyers,T., Monson, R., Munger, W., Oechel, W., Olson, R., Pilegaard,K., Paw, U.K.T., Thorgeirsson, H., Valentini, R., Verma, S.,Vesala, T., Wilson, K., Wofsy, S., 2002. Environmentalcontrols over carbon dioxide and water vapor exchange of 9terrestrial vegetation. Agric. For. Meteorol. 113, 97–120.
Leuning, R., 1995. A critical appraisal of a combined stomatal-photosynthesis model for C3 plants. Plant Cell Environ. 18,339–355.
Mayocchi, C.L., Bristow, K.L., 1995. Soil surface heat flux: Somegeneral questions and comments on measurements. Agric.For. Meteorol. 75, 43–50.
MINITAB, 2000. Minitab reference manual, release 13.3. MinitabInc., State College, PA.
Miyamoto, S., 1983. Consumptive water use of irrigated pecans.J. Am. Soc. Hort. Sci. 108 (5), 676–681.
Negi, J.D.S., Manhas, R.K., Chauhan, P.S., 2003. Current Science85: 1528–1531.
Sammis, T.W., 1981. Yield of alfalfa and cotton as influenced byirrigation. Agron. J. 73, 323–329.
Sammis, T.W., Mexal, J.G., Miller, D.R., 2004. Evapotranspirationof flood irrigated pecans. Agric. Water Manage. 69 (3),179–190.
Schotanus, P., Nieuwstadt, F.T.M., De Bruin, H.A.R., 1983.Temperature measurement with a sonic anemometer andits application to heat and moisture fluxes. Boundary-LayerMeteorol. 26, 81–93.
Shafizadeh, F., 1984. The chemistry of pyrolysis andcombustion. In: Rowell, R.M. (Ed.), The chemistry of solidwood. Advances in Chemistry Series No. 207. AmericanChemical Society, Washington, DC, pp. 489–529.
Sinclair, T.R., Tanner, C.B., Bennett, J.M., 1984. Water-useefficiency in crop production. Bioscience 34, 36–40.
Stewart, E.S., Silcox G.D., 1999. Selection and analysis of the useof alternative fuels in brick manufacturing. Project report ofthe Southwest Consortium for Environmental Research andPolicy. Project number: AQ95–9. http://www.scerp.org/projects/AQ95_9.html.
Stoughton, T.E., Miller, D.R., Huddleston, E.W., Ross, J.B., 2002.Evapotranspiration and turbulent transport in an irrigateddesert orchard. J. Geophys. Res. 107 No. D20, 4425,doi:10.1029/2001JD1198.
Swinbank, W.C., 1951. The measurement of vertical transfer ofheat and water vapor by eddies in the lower atmosphere. J.Meteorol. 8, 135–145.
Tanner, C.B., Thurtell, G.W., 1969. Anemoclinometermeasurements of Reynolds stress and heat transport in theatmospheric surface layer, Res. Dev. Tech. Rep. ECOM-66-G22F, Univ. of Wisconsin, Madison.
Webb, E.K., Pearman, G.I., Leuning, R., 1980. Correction of fluxmeasurements for density effects due to heat and watervapour transfer. Quart. J. R. Meteorol. Soc 106, 85–100.
Wilson, K., Goldstein, A., Falge, E., Aubinet, M., Baldocchi, D.D.,Bernhofer, C., Ceulemans, R., Dolman, H., Field, C., Grelle,A., Law, B., Loustau, D., Meyers, T., Moncrieff, J., Monson, R.,Oechel, W., Tenhunen, J., Valentini, R., Verma, S., 2002.Energy balance closure at FLUXNET sites. Agric. For.Meteorol. 113, 223–243.
Wythers, K.R., Reich, P.B., Tjoelker, M.G., Bolstad, P.B., 2005.Foliar respiration acclimation to temperature andtemperature variable Q(10) alter ecosystem carbon balance.Global Change Biol. 11 (3), 435–449.
a g r i c u l t u r a l w a t e r m a n a g e m e n t 9 1 ( 2 0 0 7 ) 9 2 – 1 0 1 101