author's personal copy - ΤΜΗΜΑ ΜΗΧΑΝΙΚΩΝ Η ...arly/full/journals/j81.pdf ·...
TRANSCRIPT

This article appeared in a journal published by Elsevier. The attachedcopy is furnished to the author for internal non-commercial researchand education use, including for instruction at the authors institution
and sharing with colleagues.
Other uses, including reproduction and distribution, or selling orlicensing copies, or posting to personal, institutional or third party
websites are prohibited.
In most cases authors are permitted to post their version of thearticle (e.g. in Word or Tex form) to their personal website orinstitutional repository. Authors requiring further information
regarding Elsevier’s archiving and manuscript policies areencouraged to visit:
http://www.elsevier.com/authorsrights

Author's personal copy
The MinMax k-Means clustering algorithm
Grigorios Tzortzis n, Aristidis LikasDepartment of Computer Science & Engineering, University of Ioannina, Ioannina 45110, Greece
a r t i c l e i n f o
Article history:Received 18 February 2013Received in revised form20 January 2014Accepted 28 January 2014Available online 6 February 2014
Keywords:Clusteringk-Meansk-Means initializationBalanced clusters
a b s t r a c t
Applying k-Means to minimize the sum of the intra-cluster variances is the most popular clusteringapproach. However, after a bad initialization, poor local optima can be easily obtained. To tackle theinitialization problem of k-Means, we propose the MinMax k-Means algorithm, a method that assignsweights to the clusters relative to their variance and optimizes a weighted version of the k-Meansobjective. Weights are learned together with the cluster assignments, through an iterative procedure. Theproposed weighting scheme limits the emergence of large variance clusters and allows high qualitysolutions to be systematically uncovered, irrespective of the initialization. Experiments verify theeffectiveness of our approach and its robustness over bad initializations, as it compares favorably toboth k-Means and other methods from the literature that consider the k-Means initialization problem.
& 2014 Elsevier Ltd. All rights reserved.
1. Introduction
Clustering is a fundamental problem in data analysis that arisesin a variety of fields, such as pattern recognition, machine learning,bioinformatics and image processing [1,2]. It aims at partitioning aset of instances into homogeneous groups, i.e. the intra-clustersimilarities are high while the inter-cluster similarities are low,according to some clustering objective. However, exhaustivelysearching for the optimal assignment of instances to clusters iscomputationally infeasible and usually a good local optimum ofthe clustering objective is sought.
One of the most well-studied clustering algorithms is k-Means [3],which minimizes the sum of the intra-cluster variances. Its simplicityand efficiency have established it as a popular means for performingclustering across different disciplines. Even an extension to kernelspace has been developed [4,5] to enable the identification of non-linearly separable groups. Despite its wide acceptance, k-Means suffersfrom a serious limitation. Its solution heavily depends on the initialpositions of the cluster centers, thus after a bad initialization it easilygets trapped in poor local minima [6,7]. To alleviate this shortcoming,k-Means with multiple random restarts is often employed in practice.
Several methods attempt to overcome the sensitivity to theinitialization in a more principled way. A first group of methodsapplies special techniques aiming at systematically avoiding partition-ings of poor quality during the restarts. In [8], the initial centers areselected through a stochastic procedure such that the entire data spaceis covered. Theoretical guarantees are provided about the capability ofthe method to approximate the optimal clustering. Two approaches
that start from random centers and penalize clusters relative to thewinning frequency of their representatives are presented in [9,10].Discouraging clusters to which several points have already beenassigned from attracting new points in the subsequent steps has aregularizing effect. Centers that were initially ill-placed and arecurrently underutilized can actively participate in the solution on thefollowing steps, which obstructs outlier clusters from forming and ineffect balances the sizes of the clusters. Some other, analogous,strategies can be found in [11,12].
A second group of methods attempts to eliminate the dependenceon random initial conditions, hence restarts are not anymore neces-sary. Global k-Means [13] and its modifications [14,15] are incrementalapproaches that start from a single cluster and at each step a newcluster is deterministically added to the solution according to anappropriate criterion. A kernel-based version of global k-Means is alsoavailable [16,17]. In [18] and its extension [19], spectral clustering isapplied to locate the global optimum of a relaxed version of thek-Means objective, by formulating the problem as a trace maximiza-tion. Although these algorithms are not susceptible to bad initializa-tions, they are computationally more expensive.
In this paper we propose MinMax k-Means, a novel approach thattackles the k-Means initialization problem by altering its objective. Ourmethod starts from a randomly picked set of centers and tries tominimize the maximum intra-cluster variance instead of the sum ofthe intra-cluster variances. Specifically, a weight is associated with eachcluster, such that clusters with larger variance1 are allocated higherweights, and a weighted version of the sum of the intra-clustervariances criterion is derived. Different notions of weights have been
Contents lists available at ScienceDirect
journal homepage: www.elsevier.com/locate/pr
Pattern Recognition
http://dx.doi.org/10.1016/j.patcog.2014.01.0150031-3203 & 2014 Elsevier Ltd. All rights reserved.
n Corresponding author. Tel.:þ30 26510 08838; fax:þ30 26510 08882.E-mail addresses: [email protected] (G. Tzortzis), [email protected] (A. Likas).
1 To avoid cluttering the text, we shall also refer to the intra-cluster variances,simply, as the variances of the clusters.
Pattern Recognition 47 (2014) 2505–2516

Author's personal copy
exploited in the literature across several k-Means variants. In fuzzyc-means and Gaussian mixture models [20] weights are used tocompute the degree of cluster membership of the instances, whilein other variants weights are assigned to features, or groups offeatures, such that the tasks of clustering and feature selection aresimultaneously performed [21,22]. Also, in [23], a weighting factor isadded to each instance in order to detect outliers.
The per cluster weights predispose our algorithm towardsprimarily minimizing those clusters that currently exhibit a largevariance, in essence confining the occurrence of large varianceclusters in the outcome, and are learned automatically, togetherwith the cluster assignments. The proposed method alternatesbetween a minimization step, resembling the k-Means procedure,and an additional maximization step, in which the weights arecalculated using closed-form expressions. By applying this weight-ing mechanism, results become less affected by the initializationand solutions of high quality can be more consistently discovered,even after starting from a bad initial set of centers. In addition, theobtained clusters are balanced with respect to their variance.
The presented algorithm also incorporates a parameter p, whosevalue must be specified prior to execution, that adjusts the degreeof its bias towards penalizing large variance clusters. When p¼0,k-Means, which has a zero bias, can be deduced as a special case ofour method. A practical framework extending MinMax k-Means toautomatically adapt this parameter to the dataset has been alsodeveloped in this work, so that the hidden group structures in thedata can be successfully uncovered.
Experiments are conducted on several diverse datasets, includ-ing images, handwritten digits, proteins and patient records.MinMax k-Means is compared to k-Means, as well as to k-Mean-sþþ [8] and pifs k-Means [10] that evade degenerate optima, thefirst by methodically picking the initial centers and the second bybalancing the cluster sizes. Our empirical evaluation reveals theeffectiveness of the proposed clustering scheme in restricting theemergence of large variance clusters and producing superior solu-tions compared to the other three approaches, while restarted fromrandom initializations. Furthermore, we observe that our algorithmconstitutes a very promising technique for initializing k-Means.
The rest of this paper is organized as follows. We next brieflydescribe k-Means, while in Section 3 the proposed MinMaxk-Means algorithm is presented and its properties are analyzed.Section 4 introduces our practical framework for setting the pparameter. The experiments follow in Section 5, before theconcluding remarks of Section 6.
2. k-Means
To partition a dataset X ¼ fxigNi ¼ 1, xiARd into M disjoint
clusters, fCkgMk ¼ 1, k-Means [3] minimizes the sum of the intra-cluster variances (1), where Vk ¼∑N
i ¼ 1δik‖xi�mk‖2 andmk ¼∑N
i ¼ 1δikxi=∑Ni ¼ 1δik are the variance2 and the center of the
k-th cluster, respectively, and δik is a cluster indicator variable withδik ¼ 1 if xiACk and 0 otherwise.
Esum ¼ ∑M
k ¼ 1Vk ¼ ∑
M
k ¼ 1∑N
i ¼ 1δik‖xi�mk‖2 ð1Þ
Clustering proceeds by alternating between assigning instances totheir closest center and recomputing the centers, until a localminimum is (monotonically) reached.
Despite its simplicity and speed, k-Means has some drawbacks,with the most prominent being the dependence of the solution on
the choice of initial centers [6,7]. Bad initializations can lead to poorlocal minima, thus multiple random restarts are usually executed tocircumvent the initialization problem. Often, the solutions returnedby the restarts significantly vary in terms of the achieved objectivevalue, ranging from good to very bad ones, particularly for problemswith a large search space (e.g. many clusters and dimensions).Therefore, numerous runs of the algorithm are required to increasethe possibility of locating a good local minimum.
3. MinMax k-Means
As discussed in Section 2, the sensitivity of k-Means to initializa-tion and the diverse solutions uncovered during the restarts make itdifficult to find a good partitioning of the data. Motivated by this, wepropose the optimization of a different objective and a new meth-odology that allows k-Means to produce high quality partitioningsmore systematically, while restarted from random initial centers.
3.1. The maximum variance objective
Consider a dataset X ¼ fxigNi ¼ 1, xiARd to be split into Mdisjoint clusters, fCkgMk ¼ 1. Instead of minimizing the sum of theintra-cluster variances (1), we propose to minimize the maximumintra-cluster variance
Emax ¼ max1rkrM
Vk ¼ max1rkrM
∑N
i ¼ 1δik‖xi�mk‖2
( ); ð2Þ
where Vk, mk and δik are defined as in (1).The rationale for this approach is the following: the summation
over all clusters in the k-Means objective (1) allows for similar Esum
values to be achieved either by having a few clusters with largevariance that are counterbalanced by others with small variance,or by having a moderate variance for all clusters. This means thatthe relative differences among the cluster variances are not takeninto account. Note that the variance of a cluster is a measure of itsquality. The above remark does not hold when minimizing Emax
though, as the first case above would lead to a higher objectivevalue. Hence, when minimizing Emax, large variance clusters areavoided and the solution space is now restricted towards clustersthat exhibit more similar variances.
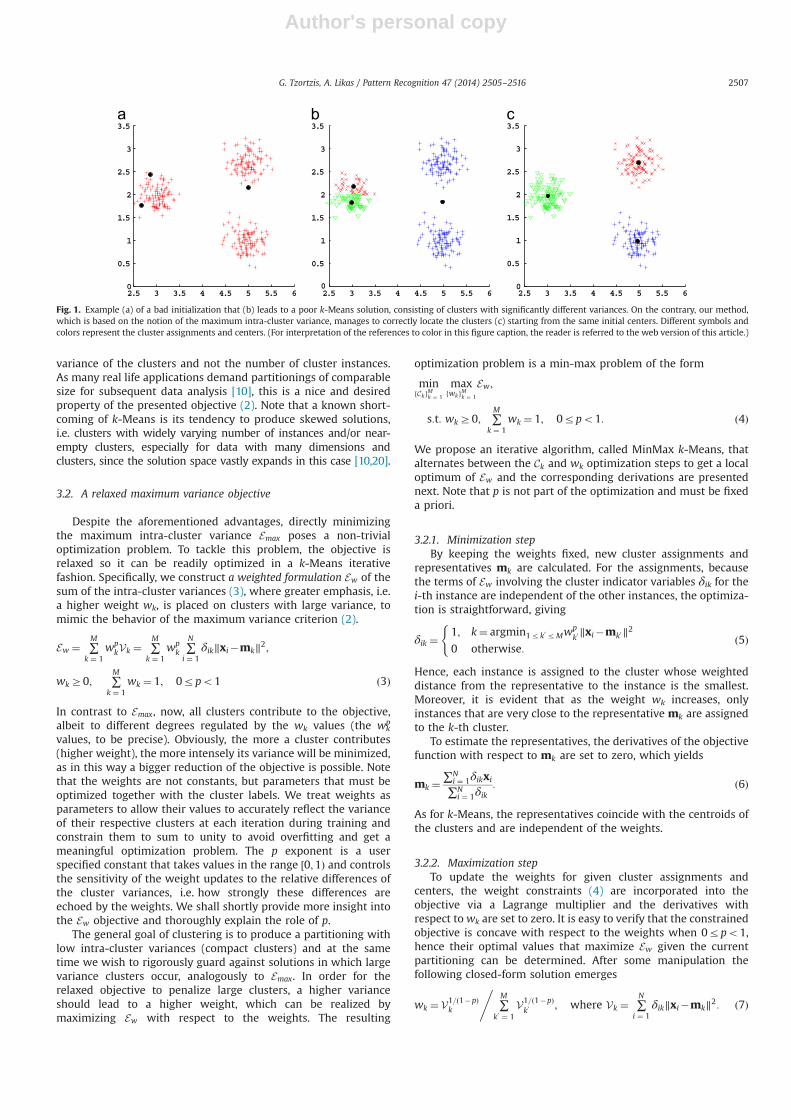
The previous observation has two important implications.Since k-Means minimizes Esum, it cannot distinguish between thetwo cases, thus a bad initialization yields a poor solution that ischaracterized by substantially different variances among thereturned clusters; a result of natural groups getting merged (largevariance clusters) and others getting split (small variance clusters),or of outlier clusters being formed.3 As explained, the maximumintra-cluster variance objective Emax is less likely to converge tosuch solutions, hence it is easier to overcome a bad initialization.Thus, we expect a k-Means type algorithm coupled with thisobjective to be able to uncover better group structures moreconsistently during the restarts. An example is illustrated in Fig. 1.
Additionally, a balancing effect on the clusters occurs. Balancedoutcomes have been pursued in different ways in the literature.For example, in [10] k-Means and spherical k-Means are modifiedto penalize clusters in proportion to the number of instancesassigned to them, while in [24,25] a graph cut criterion isoptimized which favors the creation of subgraphs where the sumsof the edge weights within the subgraphs (subgraph associations)are similar. In our case, balancing is done with regard to the
2 In this work, we define cluster variance as the sum, and not the average, ofthe squared distances from the instances belonging to the cluster to its center.
3 Let us clarify that a solution with quite different variances on the clusters isnot necessarily a bad one. There are datasets where the natural groups exhibit suchstructure. We simply claim that such behavior also arises after a bad initialization,where some groups are merged and others are split.
G. Tzortzis, A. Likas / Pattern Recognition 47 (2014) 2505–25162506
Author's personal copy
variance of the clusters and not the number of cluster instances.As many real life applications demand partitionings of comparablesize for subsequent data analysis [10], this is a nice and desiredproperty of the presented objective (2). Note that a known short-coming of k-Means is its tendency to produce skewed solutions,i.e. clusters with widely varying number of instances and/or near-empty clusters, especially for data with many dimensions andclusters, since the solution space vastly expands in this case [10,20].
3.2. A relaxed maximum variance objective
Despite the aforementioned advantages, directly minimizingthe maximum intra-cluster variance Emax poses a non-trivialoptimization problem. To tackle this problem, the objective isrelaxed so it can be readily optimized in a k-Means iterativefashion. Specifically, we construct a weighted formulation Ew of thesum of the intra-cluster variances (3), where greater emphasis, i.e.a higher weight wk, is placed on clusters with large variance, tomimic the behavior of the maximum variance criterion (2).
Ew ¼ ∑M
k ¼ 1wp
kVk ¼ ∑M
k ¼ 1wp
k ∑N
i ¼ 1δik‖xi�mk‖2;
wkZ0; ∑M
k ¼ 1wk ¼ 1; 0rpo1 ð3Þ
In contrast to Emax, now, all clusters contribute to the objective,albeit to different degrees regulated by the wk values (the wk
p
values, to be precise). Obviously, the more a cluster contributes(higher weight), the more intensely its variance will be minimized,as in this way a bigger reduction of the objective is possible. Notethat the weights are not constants, but parameters that must beoptimized together with the cluster labels. We treat weights asparameters to allow their values to accurately reflect the varianceof their respective clusters at each iteration during training andconstrain them to sum to unity to avoid overfitting and get ameaningful optimization problem. The p exponent is a userspecified constant that takes values in the range ½0;1Þ and controlsthe sensitivity of the weight updates to the relative differences ofthe cluster variances, i.e. how strongly these differences areechoed by the weights. We shall shortly provide more insight intothe Ew objective and thoroughly explain the role of p.
The general goal of clustering is to produce a partitioning withlow intra-cluster variances (compact clusters) and at the sametime we wish to rigorously guard against solutions in which largevariance clusters occur, analogously to Emax. In order for therelaxed objective to penalize large clusters, a higher varianceshould lead to a higher weight, which can be realized bymaximizing Ew with respect to the weights. The resulting
optimization problem is a min-max problem of the form
minfCkgMk ¼ 1
maxfwkgMk ¼ 1
Ew;
s:t: wkZ0; ∑M
k ¼ 1wk ¼ 1; 0rpo1: ð4Þ
We propose an iterative algorithm, called MinMax k-Means, thatalternates between the Ck and wk optimization steps to get a localoptimum of Ew and the corresponding derivations are presentednext. Note that p is not part of the optimization and must be fixeda priori.
3.2.1. Minimization stepBy keeping the weights fixed, new cluster assignments and
representatives mk are calculated. For the assignments, becausethe terms of Ew involving the cluster indicator variables δik for thei-th instance are independent of the other instances, the optimiza-tion is straightforward, giving
δik ¼1; k¼ argmin1rk0 rMw
pk0‖xi�mk0‖2
0 otherwise:
(ð5Þ
Hence, each instance is assigned to the cluster whose weighteddistance from the representative to the instance is the smallest.Moreover, it is evident that as the weight wk increases, onlyinstances that are very close to the representative mk are assignedto the k-th cluster.
To estimate the representatives, the derivatives of the objectivefunction with respect to mk are set to zero, which yields
mk ¼∑N
i ¼ 1δikxi
∑Ni ¼ 1δik
: ð6Þ
As for k-Means, the representatives coincide with the centroids ofthe clusters and are independent of the weights.
3.2.2. Maximization stepTo update the weights for given cluster assignments and
centers, the weight constraints (4) are incorporated into theobjective via a Lagrange multiplier and the derivatives withrespect towk are set to zero. It is easy to verify that the constrainedobjective is concave with respect to the weights when 0rpo1,hence their optimal values that maximize Ew given the currentpartitioning can be determined. After some manipulation thefollowing closed-form solution emerges
wk ¼ V1=ð1�pÞk ∑
M
k0 ¼ 1V1=ð1�pÞk0
; where Vk ¼ ∑N
i ¼ 1δik‖xi�mk‖2:
,ð7Þ
Fig. 1. Example (a) of a bad initialization that (b) leads to a poor k-Means solution, consisting of clusters with significantly different variances. On the contrary, our method,which is based on the notion of the maximum intra-cluster variance, manages to correctly locate the clusters (c) starting from the same initial centers. Different symbols andcolors represent the cluster assignments and centers. (For interpretation of the references to color in this figure caption, the reader is referred to the web version of this article.)
G. Tzortzis, A. Likas / Pattern Recognition 47 (2014) 2505–2516 2507

Author's personal copy
As 1=ð1�pÞ40, since 0rpo1, it can be observed that the largerthe cluster variance Vk the higher the weight wk.
3.3. Discussion
In this section some aspects of the MinMax k-Means algorithmand its relaxed objective (3) are analyzed in more detail. Accordingto (7), for a given partitioning of the data the weights are setproportionally to the cluster variances. In the subsequent mini-mization step, the assignment of instances to clusters is madeusing the weighted distance from the cluster centers (5). Appar-ently, for highly weighted clusters, the weighted distance of theirrepresentatives from the instances increases. Consequently, acluster with large variance may lose some of its current instancesthat are away from its center (instances on the periphery of thecluster) and its variance is expected to decrease. At the same time,low variance clusters, due to the small weights, may also acquireinstances that are not close to their centers and their variance willincrease. Therefore, the iterative procedure of MinMax k-Meanspunishes large variance clusters and operates towards clusters withsimilar variances, resembling the maximum variance objective (2)whose advantages are carried over.
MinMax k-Means requires initial values for the cluster repre-sentatives and the weights. At the start no information about thevariance of the clusters is available and the weights should beuniformly initialized, i.e. wk ¼ 1=M. Similar to k-Means, the solu-tion depends on the initialization of the centers and multiplerestarts are necessary. However, as Ew shares the same propertieswith Emax, high quality solutions are anticipated on a regular basiscompared to k-Means.
Regarding the p values, the most natural choice would be topropose a method where p¼1. For p¼1 the estimation of theweights simplifies to
wk ¼1; k¼ argmax1rk0 rMVk0
0 otherwise:
�ð8Þ
Obviously, in each iteration only the highest variance clusterreceives a non-zero weight and thus in the following minimizationstep all its instances will be randomly assigned (5) to one of theother, zero-weight, clusters, which clearly signifies a degeneratecase. If p41 is selected, the relaxed objective becomes convexwith respect to the weights, thus the weight updates, which takethe same form as in (7), will minimize Ew instead of maximizing itas required by (4). Therefore, only 0rpo1 can be permitted.
As for the effect of the p exponent (0rpo1), based on (7) it canbe shown that the greater (smaller) the p value the less (more) similarthe weight values become, as the relative differences of the variancesamong the clusters are enhanced (suppressed). This remark also holdsfor thewk
p values, which are the actual coefficients used in the relaxedobjective (3). To demonstrate the above in detail, the ratio betweenany two weights, wk=wk0 , can be considered as an indicator of theirsimilarity. The more this ratio tends to 1 the more similar the weights.Assume a fixed clustering, i.e. fixed cluster variances Vk and Vk0 . From(7),
wk
wk0¼ Vk
Vk0
� �1=ð1�pÞ
and
wpk
wpk0¼ Vk
Vk0
� �p=ð1�pÞ;
0rpo1. As p increases, the value of the 1=ð1�pÞ and p=ð1�pÞexponents grows, thus the relative differences of the cluster variancesare enhanced and both ratios deviate more from 1, i.e. the weightsand coefficients wk
p attain less similar values (the exact opposite holds
when p is decreased). In other words, p adjusts how intensely thedifferences of the cluster variances are reflected on the weights.
Therefore, for a high p value, large variance clusters accumulateconsiderably higher wk and wk
p values compared to low varianceclusters, resulting in an objective that severely penalizes clusterswith high variance. Note that an extremely high p may force clusterswith large variance to lose most, or even all their instances, as theirenormous weights will excessively distance the instances from theircenters (5), something not desired of course. On the other hand, forp¼0, all wk
p coefficients equal 1, hence the differences of the clustervariances are ignored and actually the k-Means criterion is recovered,which permits high variance clusters. As shown in Section 3.1,preventing the appearance of large variance clusters is helpful inevading poor solutions after a bad initialization and also balances theclusters. However, this tactic may prove problematic when naturalgroups with different amounts of variance exist in the dataset, acommon scenario in practice, as it will hinder the clustering processfrom unveiling the true structure of the data. We believe thatintermediate p values provide a good compromise, since highvariance clusters will be admitted up to a certain extent. In a nutshell,the p exponent controls how strongly the relaxed objective of MinMaxk-means restricts the occurrence of large variance clusters, allowing itsadaptation to the dataset. This is an important advantage over themaximum variance objective Emax, whose strictness over largevariance clusters cannot be adjusted.
4. Improving MinMax k-Means
A crucial limitation of the MinMax k-Means algorithm is thetreatment of the p exponent as a predefined constant. While fromthe above discussion it is clear that a moderate p is preferable, thisis a rough assessment that hardly provides an indication as to whichexact p values suit a specific dataset. Therefore, manually selectingan appropriate p is not trivial and requires repeating the clusteringfor several p values. This task becomes even harder given thedependence of the solution on the initial centers for a particular p.
To circumvent this limitation, we devise a practical frameworkthat extends MinMax k-Means to automatically adapt the exponentto the dataset, while alternating between the minimization andmaximization steps as before. Specifically, we begin with a small p(pinit) that after each iteration is increased by step pstep, until amaximum value is attained (pmax). After pmax is reached, clusteringcontinues without changing p. The idea behind this strategy is thatthe clusters formed during the first steps are heavily influenced bythe initialization and should be allowed to freely evolve withoutconsidering their differences in variance, thus a small p is desirable(we set pinit ¼ 0). As clustering progresses, p is gradually increasedto restrain large variance clusters that persist in the solution andresult in poor outcomes, especially after a bad initialization. Notethat such a progressive punishment of large variance clusters is notpossible when p is fixed a priori. Moreover, since clusters with highvariance must not be completely eliminated in order to correctlyuncover the intrinsic structures in the data (Section 3.3), extremelyhigh values for pmax should be avoided.
As p grows, large variance clusters are susceptible to relinquish-ing most of their current instances (see Section 3.3). If an empty orsingleton cluster appears, it will receive zero weight in themaximization step as Vk ¼ 0. This will cause all the datasetinstances to be assigned to it in the subsequent minimization step(5) and the clustering process will collapse. This situation indicatesthat p has attained a very high value for the particular dataset.Whenever an empty or singleton cluster emerges, irrespective ofwhether pmax has been reached or not, we decrease p by pstep,revert back to the cluster assignments corresponding to theprevious p value and resume clustering from there. Note that
G. Tzortzis, A. Likas / Pattern Recognition 47 (2014) 2505–25162508
Author's personal copy
p is never increased again in the following iterations. Thismanipulation of the p exponent has the same effect as settingpmax to be equal to the reduced p value from the beginning (herethe adjustment is done automatically though) and actually showsthat the presented framework is not very sensitive to the choice ofpmax, as p will stop increasing when necessary.
To enhance the stability of the MinMax k-Means algorithm, amemory effect could be added to the weights:
wðtÞk ¼ βwðt�1Þ
k þð1�βÞ V1=ð1�pÞk ∑
M
k0 ¼ 1V1=ð1�pÞk0
!; 0rβr1;
, ð9Þ
where β controls the influence of the previous iteration weights tothe current update, allowing for smoother transitions of the weightvalues between consecutive iterations. It should be stressed thatwhenmemory is applied (β40), the newly derived weights no more
correspond to their optimal values for the current partitioning, incontrast to the case where memory is not employed (see Section3.2.2). However, this does not negatively affect our method, asconvergence to a local optimum cannot be guaranteed, irrespectiveof the use of memory, since at every iteration both a minimizationand a maximization of the objective is performed. On the contrary,our empirical evaluation has shown that memory is beneficial inseveral cases and that fewer empty clusters are created.
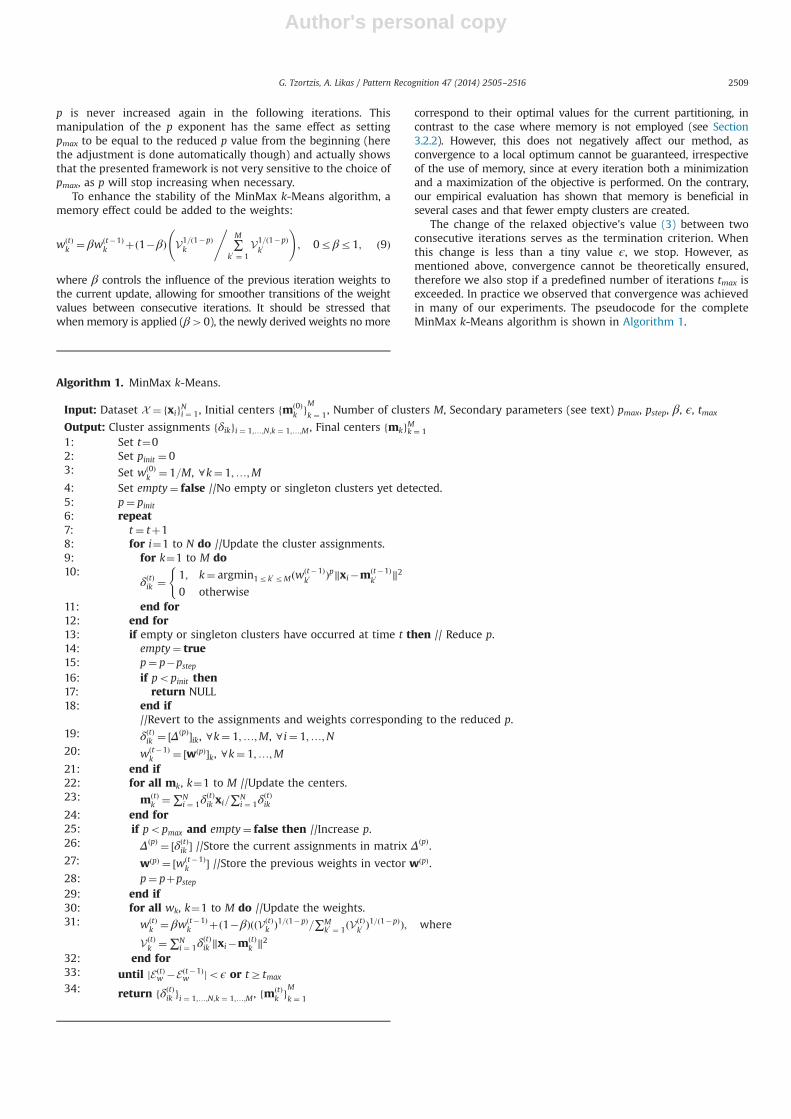
The change of the relaxed objective's value (3) between twoconsecutive iterations serves as the termination criterion. Whenthis change is less than a tiny value ϵ, we stop. However, asmentioned above, convergence cannot be theoretically ensured,therefore we also stop if a predefined number of iterations tmax isexceeded. In practice we observed that convergence was achievedin many of our experiments. The pseudocode for the completeMinMax k-Means algorithm is shown in Algorithm 1.
Algorithm 1. MinMax k-Means.
Input: Dataset X ¼ fxigNi ¼ 1, Initial centers fmð0Þk gMk ¼ 1, Number of clusters M, Secondary parameters (see text) pmax, pstep, β, ϵ, tmax
Output: Cluster assignments fδikgi ¼ 1;…;N;k ¼ 1;…;M , Final centers fmkgMk ¼ 1
1: Set t¼02: Set pinit ¼ 03: Set wð0Þ
k ¼ 1=M, 8k¼ 1;…;M4: Set empty¼ false //No empty or singleton clusters yet detected.5: p¼ pinit6: repeat7: t ¼ tþ18: for i¼1 to N do //Update the cluster assignments.9: for k¼1 to M do10:
δðtÞik ¼ 1; k¼ argmin1rk0 rMðwðt�1Þk0
Þp‖xi�mðt�1Þk0
‖2
0 otherwise
(
11: end for12: end for13: if empty or singleton clusters have occurred at time t then // Reduce p.14: empty¼ true15: p¼ p�pstep16: if popinit then17: return NULL18: end if
//Revert to the assignments and weights corresponding to the reduced p.19: δðtÞik ¼ ½ΔðpÞ�ik, 8k¼ 1;…;M, 8 i¼ 1;…;N20: wðt�1Þ
k ¼ ½wðpÞ�k, 8k¼ 1;…;M21: end if22: for all mk, k¼1 to M //Update the centers.23: mðtÞ
k ¼∑Ni ¼ 1δ
ðtÞik xi=∑N
i ¼ 1δðtÞik
24: end for25: if popmax and empty¼ false then //Increase p.26: ΔðpÞ ¼ ½δðtÞik � //Store the current assignments in matrix ΔðpÞ.27: wðpÞ ¼ ½wðt�1Þ
k � //Store the previous weights in vector wðpÞ.28: p¼ pþpstep29: end if30: for all wk, k¼1 to M do //Update the weights.31: wðtÞ
k ¼ βwðt�1Þk þð1�βÞððVðtÞ
k Þ1=ð1�pÞ=∑Mk0 ¼ 1ðV
ðtÞk0Þ1=ð1�pÞÞ; where
VðtÞk ¼∑N
i ¼ 1δðtÞik ‖xi�mðtÞ
k ‖2
32: end for33: until jEðtÞ
w �Eðt�1Þw joϵ or tZtmax
34: return fδðtÞik gi ¼ 1;…;N;k ¼ 1;…;M , fmðtÞk gMk ¼ 1
G. Tzortzis, A. Likas / Pattern Recognition 47 (2014) 2505–2516 2509

Author's personal copy
5. Empirical evaluation
The performance of MinMax k-Means4 is studied on severaldatasets and we wish to investigate if indeed its relaxed objective(3) limits the occurrence of large variance clusters and howeffective the proposed method is in overcoming bad initializationsand attaining good solutions more regularly than k-Means.
To demonstrate the above, first, a comparison to the basick-Means algorithm is made. As already discussed, k-Means doesnot consider the relative differences of the clusters, allowing highvariance clusters to emerge. Also, its solution is greatly affected bythe initial centers. Hence, this comparison will provide strongevidence on the effectiveness of MinMax k-Means. Moreover, wealso experiment with two k-Means variants, called k-Meansþþand partially incremental frequency sensitive (pifs) k-Means.
In k-Meansþþ [8] a stochastic procedure is employed to pickthe initial cluster centers and then k-Means is executed from thesecenters. Specifically, given that k�1 centers have already beenselected, instance xi may be selected as the k-th initial center witha probability that is proportional to its minimum distance from thek�1 centers. The above procedure aims at selecting initial centersthat cover the entire data space, thus providing better initializa-tions to k-Means (compared to random starts), and, therefore,constituting a worthy competitor against which to measure ourmethod.
Pifs k-Means [10] explicitly penalizes clusters in proportion tothe number of instances already assigned to them, according to thefollowing cluster update rule5:
δik ¼1; k¼ argmin1rk0 rM jCk0 j‖xi�mk0‖2
0 otherwise;
(ð10Þ
where jCkj is the current size of the k-th cluster. Based on (10), thelarger the cluster the lower the chance of an instance beingacquired by that cluster. Thus, clusters are balanced in terms oftheir size, which has been shown to decrease the sensitivity to badinitializations [9,10]. Remember (Section 3.3), that MinMax k-Means, implicitly, through its weighting strategy, operates towardsclusters with similar variances. Therefore, it is interesting toexamine how these two different balancing approaches compareagainst each other.
5.1. Datasets
Six popular datasets are utilized in our empirical study forwhich the ground-truth is available. Their features are normalizedto zero mean and unit variance, unless stated otherwise.
Coil-20 [26] contains 72 images taken from different angles foreach of the 20 included objects. As in [27], SIFT descriptors [28] arefirst extracted from the images which are then represented by thebag of visual words model using 1000 visual words and the datavectors are normalized to unit length. For our purposes, threesubsets of Coil-20 were created, Coil1 (objects 3, 9 and 10), Coil2(objects 15, 18 and 19) and Coil3 (objects 2, 4, 7, 10 and 11).
Multiple features & Pendigits are two collections of handwrittendigits (0–9) from the UCI repository [29]. Multiple features digits(200 per class) are described in terms of six different feature setsand we select two of them, namely pixel averages and profilecorrelations. Pendigits consists of 10 992 instances (roughly 1100samples per numeral) in 16-dimensional space.
Olivetti is a face database of 40 individuals with ten 64�64grayscale images per individual. Based on [30], we only retain thefirst 100 images, belonging to ten persons, and apply the samepreprocessing. Specifically, each image is smoothed using a Gaus-sian kernel and then rotated by �101, 01 and 101 and scaled by afactor of 0.9, 1.0 and 1.1, resulting in 900 images. Finally, a central50�50 window of the images is kept and its pixels are normalizedto zero mean and 0.1 variance.
Ecoli (UCI) [29] includes 336 proteins from the E. coli bacteriumand seven attributes, calculated from the amino acid sequences,are provided. Proteins belong to eight categories according to theircellular localization sites. Four of the classes are extremely under-represented and are not considered in our evaluation. Note thatclasses differ in size, i.e. it is an unbalanced dataset.
Dermatology (UCI) [29] is composed of 366 patient records thatsuffer from six different types of the Eryhemato-Squamous dis-ease. Each patient is described by both clinical and histopatholo-gical features (34 in total). This dataset is also unbalanced.
A summary of the datasets is provided in Table 1.
5.2. Experimental protocol
All tested algorithms, apart from k-Meansþþ , are restarted500 times from the same randomly chosen initial centers. For k-Meansþþ , the stochastic initialization procedure is executed 500times. The number of clusters is set equal to the number of classesin each dataset, throughout the experiments. To evaluate thequality of the returned solutions, the maximum cluster varianceEmax, defined in (2), and the sum of the cluster variances Esum,defined in (1), serve as the main performance measures and theiraverage and standard deviation over the 500 runs is reported. Notethat Esum favors k-Means and k-Meansþþ in the comparisons,since this is the objective optimized by these two methods.Likewise, Emax favors our framework which optimizes a relaxedversion of (2). Since the ground-truth is available, the achievedNMI score (11),6 is also reported. Higher NMI values indicate abetter match between the cluster labels and the class labels.
NMI¼2∑M
k ¼ 1∑Ch ¼ 1
nhk
Nlog
nhkN
∑Mi ¼ 1n
hi ∑
Ci ¼ 1n
ik
HMþHCð11Þ
Moreover, to assess the computational complexity of the algo-rithms, their average execution time (in seconds) is reported.
In a second series of experiments, the cluster centers derivedby each execution of MinMax k-Means and pifs k-Means are usedto initialize a subsequent k-Means run. This allows us to determineif k-Means performance can be improved when initialized by these
Table 1Main characteristics of the tested datasets.
Dataset Instances Features Classes Balanced
Coil1 & Coil2 216 1000 3 YesCoil3 360 1000 5 YesMultiple features—pixel averages 2000 240 10 YesMultiple features—profile
correlations2000 216 10 Yes
Pendigits 10 992 16 10 AlmostOlivetti 900 2500 10 YesEcoli 307 7 4 NoDermatology 366 34 6 No
4 Matlab code is available at: http://www.cs.uoi.gr/�gtzortzi.5 Note that the exact cluster update rule proposed in [10] contains an
additional d lnjCk0 j term, where d is the dataset dimensionality. However, betterresults were obtained without using this term in our experiments.
6 N is the dataset size, M is the number of clusters, C is the number of classes,nkh is the number of points in cluster k belonging to class h, and HM , HC is the
entropy of the clusters and the classes, respectively.
G. Tzortzis, A. Likas / Pattern Recognition 47 (2014) 2505–25162510
Author's personal copy
two approaches and also facilitates the comparison of the testedmethods under a common objective (Esum).
For MinMax k-Means, some additional parameters must be fixedprior to execution (pmax, pstep, β, ϵ and tmax). Our method is notparticularly sensitive to either pmax or pstep. Regarding pmax, p stopsincreasing when empty or singleton clusters are detected. For pstep,one should simply avoid a large step which will cause abruptchanges to the p value between consecutive iterations. Thus, we donot fine-tune these two parameters for each dataset and for all theexperiments we set pmax ¼ 0:5 and pstep ¼ 0:01. Note that emptyclusters appear quite often for the selected pmax value, indicatingthat it is already set to a high value. For β, we tried three differentlevels of memory, βAf0;0:1;0:3g, and present the correspondingresults. Finally, ϵ¼ 10�6 and tmax ¼ 500 for all experiments.
5.3. Performance analysis
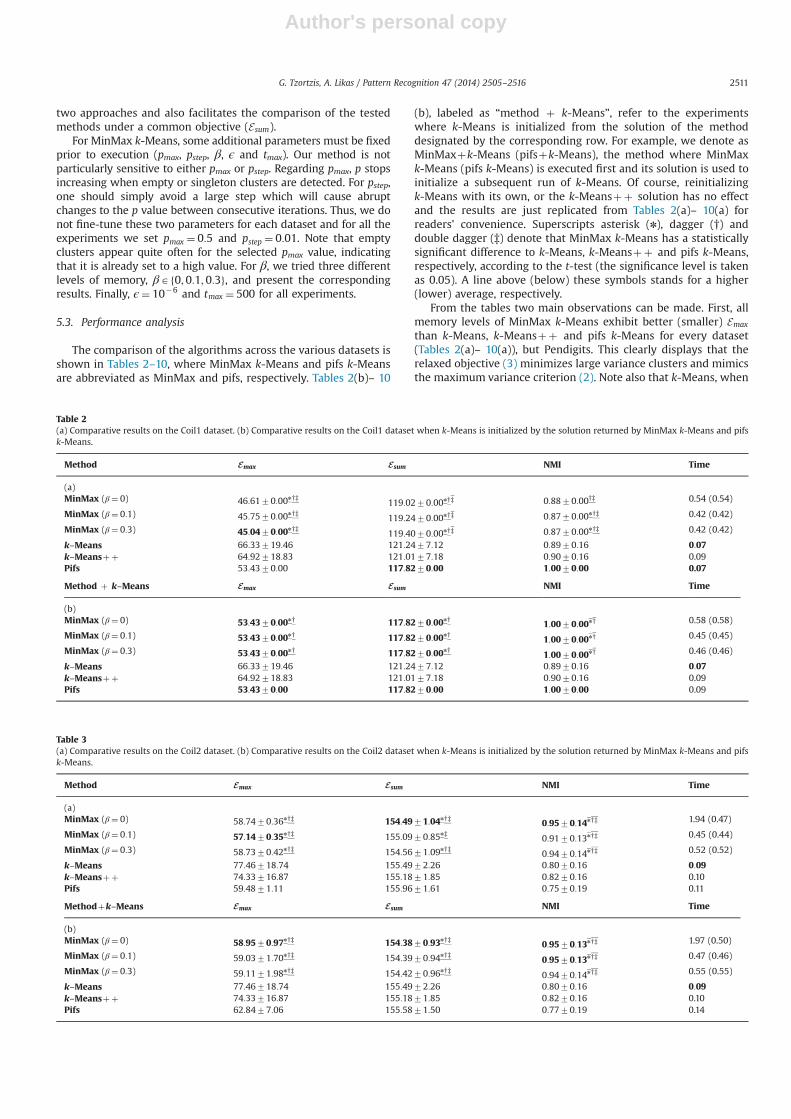
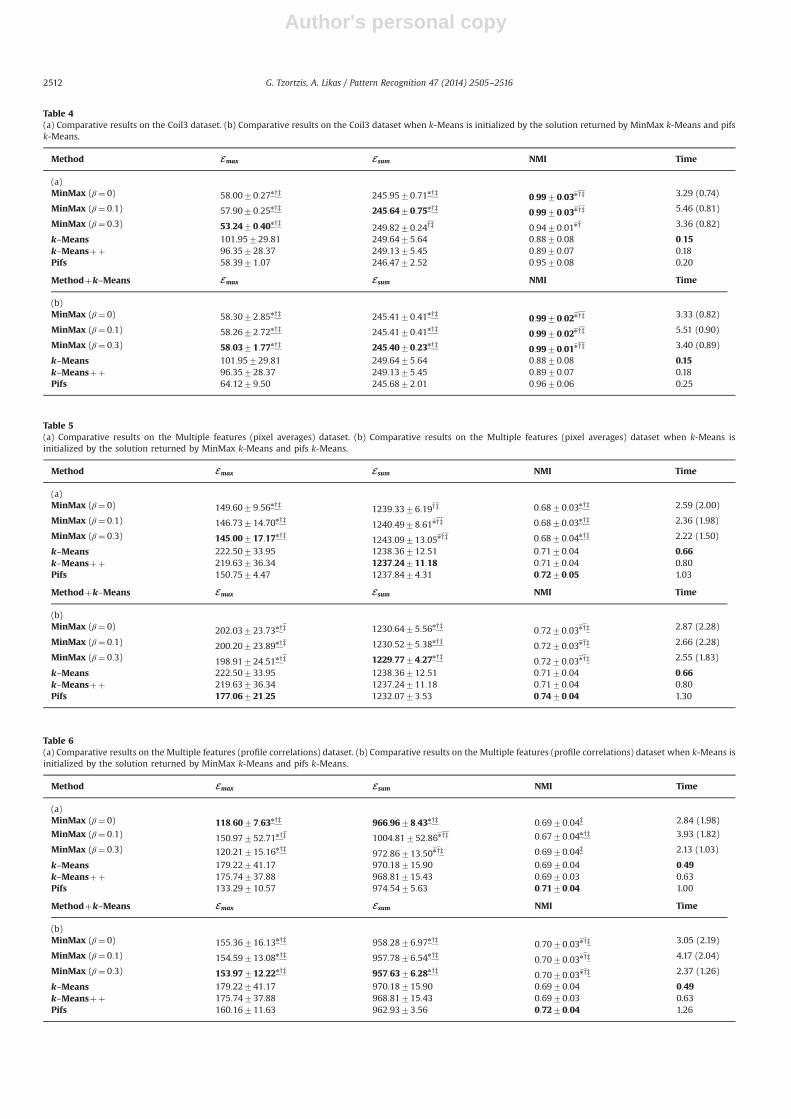
The comparison of the algorithms across the various datasets isshown in Tables 2–10, where MinMax k-Means and pifs k-Meansare abbreviated as MinMax and pifs, respectively. Tables 2(b)– 10
(b), labeled as “method þ k-Means”, refer to the experimentswhere k-Means is initialized from the solution of the methoddesignated by the corresponding row. For example, we denote asMinMaxþk-Means (pifsþk-Means), the method where MinMaxk-Means (pifs k-Means) is executed first and its solution is used toinitialize a subsequent run of k-Means. Of course, reinitializingk-Means with its own, or the k-Meansþþ solution has no effectand the results are just replicated from Tables 2(a)– 10(a) forreaders' convenience. Superscripts asterisk (n), dagger (†) anddouble dagger (‡) denote that MinMax k-Means has a statisticallysignificant difference to k-Means, k-Meansþþ and pifs k-Means,respectively, according to the t-test (the significance level is takenas 0.05). A line above (below) these symbols stands for a higher(lower) average, respectively.
From the tables two main observations can be made. First, allmemory levels of MinMax k-Means exhibit better (smaller) Emax
than k-Means, k-Meansþþ and pifs k-Means for every dataset(Tables 2(a)– 10(a)), but Pendigits. This clearly displays that therelaxed objective (3) minimizes large variance clusters and mimicsthe maximum variance criterion (2). Note also that k-Means, when
Table 2(a) Comparative results on the Coil1 dataset. (b) Comparative results on the Coil1 dataset when k-Means is initialized by the solution returned by MinMax k-Means and pifsk-Means.
Method Emax Esum NMI Time
(a)MinMax (β¼ 0) 46:6170:00n†‡
119:0270:00n†‡ 0:8870:00†‡ 0.54 (0.54)
MinMax (β¼ 0:1) 45:7570:00n†‡119:2470:00n†‡ 0:8770:00n†‡ 0.42 (0.42)
MinMax (β¼ 0:3) 45:0470:00n†‡119:4070:00n†‡ 0:8770:00n†‡ 0.42 (0.42)
k–Means 66:33719:46 121:2477:12 0:8970:16 0:07k–Meansþþ 64:92718:83 121:0177:18 0:9070:16 0.09Pifs 53:4370:00 117:8270:00 1:0070:00 0.07
Method þ k–Means Emax Esum NMI Time
(b)MinMax (β¼ 0) 53:4370:00n† 117:8270:00n†
1:0070:00n† 0.58 (0.58)
MinMax (β¼ 0:1) 53:4370:00n† 117:8270:00n†1:0070:00n† 0.45 (0.45)
MinMax (β¼ 0:3) 53:4370:00n† 117:8270:00n†1:0070:00n† 0.46 (0.46)
k–Means 66:33719:46 121:2477:12 0:8970:16 0:07k–Meansþþ 64:92718:83 121:0177:18 0:9070:16 0.09Pifs 53:4370:00 117:8270:00 1:0070:00 0.09
Table 3(a) Comparative results on the Coil2 dataset. (b) Comparative results on the Coil2 dataset when k-Means is initialized by the solution returned by MinMax k-Means and pifsk-Means.
Method Emax Esum NMI Time
(a)MinMax (β¼ 0) 58:7470:36n†‡ 154:4971:04n†‡
0:9570:14n†‡ 1.94 (0.47)
MinMax (β¼ 0:1) 57:1470:35n†‡ 155:0970:85n‡0:9170:13n†‡ 0.45 (0.44)
MinMax (β¼ 0:3) 58:7370:42n†‡ 154:5671:09n†‡0:9470:14n†‡ 0.52 (0.52)
k–Means 77:46718:74 155:4972:26 0:8070:16 0:09k–Meansþþ 74:33716:87 155:1871:85 0:8270:16 0.10Pifs 59:4871:11 155:9671:61 0:7570:19 0.11
Methodþk–Means Emax Esum NMI Time
(b)MinMax (β¼ 0) 58:9570:97n†‡ 154:3870:93n†‡
0:9570:13n†‡ 1.97 (0.50)
MinMax (β¼ 0:1) 59:0371:70n†‡ 154:3970:94n†‡0:9570:13n†‡ 0.47 (0.46)
MinMax (β¼ 0:3) 59:1171:98n†‡ 154:4270:96n†‡0:9470:14n†‡ 0.55 (0.55)
k–Means 77:46718:74 155:4972:26 0:8070:16 0:09k–Meansþþ 74:33716:87 155:1871:85 0:8270:16 0.10Pifs 62:8477:06 155:5871:50 0:7770:19 0.14
G. Tzortzis, A. Likas / Pattern Recognition 47 (2014) 2505–2516 2511
Author's personal copy
Table 4(a) Comparative results on the Coil3 dataset. (b) Comparative results on the Coil3 dataset when k-Means is initialized by the solution returned by MinMax k-Means and pifsk-Means.
Method Emax Esum NMI Time
(a)MinMax (β¼ 0) 58:0070:27n†‡ 245:9570:71n†‡
0:9970:03n†‡ 3.29 (0.74)
MinMax (β¼ 0:1) 57:9070:25n†‡ 245:6470:75n†‡0:9970:03n†‡ 5.46 (0.81)
MinMax (β¼ 0:3) 53:2470:40n†‡249:8270:24†‡ 0:9470:01n† 3.36 (0.82)
k–Means 101:95729:81 249:6475:64 0:8870:08 0:15k–Meansþþ 96:35728:37 249:1375:45 0:8970:07 0.18Pifs 58:3971:07 246:4772:52 0:9570:08 0.20
Methodþk–Means Emax Esum NMI Time
(b)MinMax (β¼ 0) 58:3072:85n†‡ 245:4170:41n†‡
0:9970:02n†‡ 3.33 (0.82)
MinMax (β¼ 0:1) 58:2672:72n†‡ 245:4170:41n†‡0:9970:02n†‡ 5.51 (0.90)
MinMax (β¼ 0:3) 58:0371:77n†‡ 245:4070:23n†‡0:9970:01n†‡ 3.40 (0.89)
k–Means 101:95729:81 249:6475:64 0:8870:08 0.15k–Meansþþ 96:35728:37 249:1375:45 0:8970:07 0.18Pifs 64:1279:50 245:6872:01 0:9670:06 0.25
Table 5(a) Comparative results on the Multiple features (pixel averages) dataset. (b) Comparative results on the Multiple features (pixel averages) dataset when k-Means isinitialized by the solution returned by MinMax k-Means and pifs k-Means.
Method Emax Esum NMI Time
(a)MinMax (β¼ 0) 149:6079:56n†‡
1239:3376:19†‡ 0:6870:03n†‡ 2.59 (2.00)
MinMax (β¼ 0:1) 146:73714:70n†‡1240:4978:61n†‡ 0:6870:03n†‡ 2.36 (1.98)
MinMax (β¼ 0:3) 145:00717:17n†‡1243:09713:05n†‡ 0:6870:04n†‡ 2.22 (1.50)
k–Means 222:50733:95 1238:36712:51 0:7170:04 0.66k–Meansþþ 219:63736:34 1237:24711:18 0:7170:04 0.80Pifs 150:7574:47 1237:8474:31 0:7270:05 1.03
Methodþk–Means Emax Esum NMI Time
(b)MinMax (β¼ 0) 202:03723:73n†‡ 1230:6475:56n†‡
0:7270:03n†‡ 2.87 (2.28)
MinMax (β¼ 0:1) 200:20723:89n†‡ 1230:5275:38n†‡0:7270:03n†‡ 2.66 (2.28)
MinMax (β¼ 0:3) 198:91724:51n†‡ 1229:7774:27n†‡0:7270:03n†‡ 2.55 (1.83)
k–Means 222:50733:95 1238:36712:51 0:7170:04 0:66k–Meansþþ 219:63736:34 1237:24711:18 0:7170:04 0.80Pifs 177:06721:25 1232:0773:53 0:7470:04 1.30
Table 6(a) Comparative results on the Multiple features (profile correlations) dataset. (b) Comparative results on the Multiple features (profile correlations) dataset when k-Means isinitialized by the solution returned by MinMax k-Means and pifs k-Means.
Method Emax Esum NMI Time
(a)MinMax (β¼ 0) 118:6077:63n†‡ 966:9678:43n†‡ 0:6970:04‡ 2.84 (1.98)
MinMax (β¼ 0:1) 150:97752:71n†‡ 1004:81752:86n†‡ 0:6770:04n†‡ 3.93 (1.82)
MinMax (β¼ 0:3) 120:21715:16n†‡972:86713:50n†‡ 0:6970:04‡ 2.13 (1.03)
k–Means 179:22741:17 970:18715:90 0:6970:04 0:49k–Meansþþ 175:74737:88 968:81715:43 0:6970:03 0.63Pifs 133:29710:57 974:5475:63 0:7170:04 1.00
Methodþk–Means Emax Esum NMI Time
(b)MinMax (β¼ 0) 155:36716:13n†‡ 958:2876:97n†‡
0:7070:03n†‡ 3.05 (2.19)
MinMax (β¼ 0:1) 154:59713:08n†‡ 957:7876:54n†‡0:7070:03n†‡ 4.17 (2.04)
MinMax (β¼ 0:3) 153:97712:22n†‡ 957:6376:28n†‡0:7070:03n†‡ 2.37 (1.26)
k–Means 179:22741:17 970:18715:90 0:6970:04 0:49k–Meansþþ 175:74737:88 968:81715:43 0:6970:03 0.63Pifs 160:16711:63 962:9373:56 0:7270:04 1.26
G. Tzortzis, A. Likas / Pattern Recognition 47 (2014) 2505–25162512

Author's personal copy
Table 7(a) Comparative results on the Pendigits dataset. (b) Comparative results on the Pendigits dataset when k-Means is initialized by the solution returned by MinMax k-Meansand pifs k-Means.
Method Emax Esum NMI Time
(a)MinMax (β¼ 0) 7769:5071249:80n†‡
61 140:867659:81†‡ 0:6870:01n†‡ 2.72 (2.23)
MinMax (β¼ 0:1) 17 497:2175431:65n†‡ 71 599:6175066:73n†‡ 0:6470:03n†‡ 4.79 (1.47)
MinMax (β¼ 0:3) 8849:2171706:73n†‡ 62 345:4471266:36n†‡ 0:6970:01‡ 2.27 (0.91)
k–Means 11 576:4373125:47 61 024:1771333:92 0:6970:02 0:55k–Meansþþ 11 857:8973039:04 60 940:9671294:01 0:6970:02 0.56Pifs 8623:377329:35 61 895:127643:98 0:7070:01 3.06
Methodþk–Means Emax Esum NMI Time
(b)MinMax (β¼ 0) 9403:2172760:33n† 60 681:717710:50n† 0:6970:01‡ 2.88 (2.39)
MinMax (β¼ 0:1) 9835:2172444:54n†‡ 60 447:717751:37n†‡0:7070:01n†‡ 4.99 (1.60)
MinMax (β¼ 0:3) 9258:1172590:49n† 60 366:927731:99n†‡ 0:6970:01‡ 2.50 (1.07)
k–Means 11 576:4373125:47 61 024:1771333:92 0:6970:02 0:55k–Meansþþ 11 857:8973039:04 60 940:9671294:01 0:6970:02 0.56Pifs 9289:797672:91 60 722:657684:59 0:7170:00 3.25
Table 8(a) Comparative results on the Olivetti dataset. (b) Comparative results on the Olivetti dataset when k-Means is initialized by the solution returned by MinMax k-Means andpifs k-Means.
Method Emax Esum NMI Time
(a)MinMax (β¼ 0) 1217:72755:18n†‡ 11 016:58744:35n†‡ 0:3470:04 7.80 (7.43)
MinMax (β¼ 0:1) 1207:91786:61n†‡ 11 019:11783:40n† 0:3470:04 7.26 (7.10)
MinMax (β¼ 0:3) 1198:19792:13n†‡ 11 019:25769:03n† 0:3470:04 6.50 (6.22)
k–Means 1610:497152:77 11 034:37761:38 0:3470:03 2:40k–Meansþþ 1624:467158:38 11 031:70764:07 0:3470:03 2.82Pifs 1305:87736:61 11 024:36745:72 0:3470:03 2.97
Methodþk–Means Emax Esum NMI Time
(b)MinMax (β¼ 0) 1383:357120:45n†‡ 10 985:52741:70n†‡ 0:3470:04 8.61 (8.24)
MinMax (β¼ 0:1) 1374:737117:89n† 10 984:49741:86n†‡ 0:3470:04 8.04 (7.88)
MinMax (β¼ 0:3) 1367:467116:57n† 10 980:86742:48n†‡ 0:3470:04 7.33 (7.05)
k–Means 1610:497152:77 11 034:37761:38 0:3470:03 2:40k–Meansþþ 1624:467158:38 11 031:70764:07 0:3470:03 2.82Pifs 1362:697101:90 10 993:37740:90 0:3470:03 3.91
Table 9(a) Comparative results on the Ecoli dataset. (b) Comparative results on the Ecoli dataset when k-Means is initialized by the solution returned by MinMax k-Means and pifs k-Means.
Method Emax Esum NMI Time
(a)MinMax (β¼ 0) 5:2970:15n†
15:9470:24n†‡ 0:5870:01n†‡ 0.18 (0.06)
MinMax (β¼ 0:1) 5:0270:25n†‡ 15:7270:04‡0:5770:01n†‡ 0.11 (0.05)
MinMax (β¼ 0:3) 4:8070:00n†‡ 15:7370:00‡0:5870:00n†‡ 0.05 (0.05)
k–Means 6:3870:88 15:6870:54 0:6170:02 0.02k–Meansþþ 6:6071:58 15:7971:02 0:6170:03 0.01Pifs 5:3070:28 16:1970:15 0:5570:01 0.04
Methodþk–Means Emax Esum NMI Time
(b)MinMax (β¼ 0) 6:2970:11n†‡ 15:4070:03n†‡
0:6370:00n†‡ 0.19 (0.06)
MinMax (β¼ 0:1) 6:2970:00n†‡ 15:3970:00n†‡0:6370:00n†‡ 0.12 (0.06)
MinMax (β¼ 0:3) 6:2970:00n†‡ 15:3970:00n†‡0:6370:00n†‡ 0.05 (0.05)
k–Means 6:3870:88 15:6870:54 0:6170:02 0.02k–Meansþþ 6:6071:58 15:7971:02 0:6170:03 0.01Pifs 6:0470:35 15:6570:19 0:6170:02 0.05
G. Tzortzis, A. Likas / Pattern Recognition 47 (2014) 2505–2516 2513

Author's personal copy
initialized by our algorithm, leads to clusters with lower Emax formost datasets (Tables 2(b)– 10(b)). However, k-Means optimizesthe sum of the variances and does not consider the maximumvariance. Hence, it is reasonable in this case that Emax increasescompared to that before employing k-Means and that pifsþk-Means produces equal or better Emax scores than MinMaxþk-Means for half of the datasets.
Second, our method outperforms k-Means for all the metrics(apart from execution time) reported in Tables 2–10, demonstrat-ing its ability to attain good partitionings on a more frequent basis.To add to the above, MinMaxþk-Means obtains lower Esum andhigher NMI values than k-Means, i.e. k-Means converges to betterlocal minima when initialized by MinMax k-Means. Actually, themain difference between k-Means and MinMaxþk-Means is thatsome restarts of the former return solutions with excessively highEsum (its higher standard deviation is indicative of that), while forthe latter such poor outcomes do not emerge, illustrating therobustness of MinMax k-Means over bad initializations.
Considering k-Meansþþ , its stochastic initialization processimproves performance, as lower Emax and Esum (and equal NMI)values are acquired on most cases compared to the randomlyrestarted k-Means. When put up against MinMax k-Means though,similar conclusions to those mentioned above for k-Means can bedrawn, further establishing the potential of the presented frame-work. It is of particular interest that MinMaxþk-Means yieldsbetter Esum and NMI scores on every dataset, despite k-Meansþþcarefully picking the initial centers. This definitely reveals that thecenters outputted by MinMax k-Means consist good initializationsfor k-Means.
The proposed algorithm is also superior to pifs k-Means.Specifically, it always reaches a lower Emax (the exception beingMultiple features-profile correlations for β¼ 0:1 and Pendigits forβ¼ 0:1 and β¼ 0:3), while for Esum it gets ahead on four of thenine datasets and it is only beaten two times. For the remainingthree (Coil3, Multiple features-profile correlations and Pendigits),there is at least one memory level for which pifs k-Means isoutperformed. As Emax is biased towards MinMax k-Means andEsum is optimized by neither algorithm, to get a more meaningfuland fair comparison we should focus on MinMaxþk-Means andpifsþk-Means. In this case, Esum is the most informative measure,since it coincides with the k-Means objective, and consistentlyMinMaxþk-Means edges ahead (apart from Dermatology whenβ¼ 0 or β¼ 0:1), signifying that the MinMax k-Means solutions
are of higher quality and thus when fed to k-Means improved localoptima are attained. In terms of NMI, they are closely matched,each achieving a better score than the other on half of the datasets(Tables 2–10). Note that apart from Ecoli and Dermatology, allother datasets consist of classes of equal size, thus we wouldexpect pifs k-Means, which explicitly balances the cluster sizes, tohave the upper hand for this metric. Therefore, we can concludethat balancing the variance of the clusters is a more effectivestrategy.
By examining how memory affects the results, the followingpattern arises. As the amount of memory grows, a greater reduc-tion of Emax is possible, which is usually accompanied by anincrease over Esum (Tables 2(a)– 10(a)). This can be explained fromTable 11, which depicts a remarkable rise on the number ofrestarts that are free of empty or singleton clusters as memoryincreases. When no empty or singleton clusters are detected, preaches pmax in our framework and, remember, that for higher pvalues large variance clusters are heavily punished, while lesseffort is put into minimizing the sum of the cluster variances. Twodatasets severely deviate from the previous pattern, Multiplefeatures-profile correlations and Pendigits, for which the use ofmemory (especially β¼ 0:1) yields partitionings of very poorquality. NMI-wise, β¼ 0:1 seems to be slightly worse than β¼ 0and β¼ 0:3. For MinMaxþk-Means, the setting where β¼ 0:3always displays (apart from Coil2) a better or, at least, equal scorefor Emax, Esum and NMI than the other two β settings. However, theperformance differences between the memory levels for Min-Maxþk-Means are small and, in general, not statistically signifi-cant on most datasets. Hence, larger memory seems to onlyslightly boost efficacy when initializing k-Means.
The average execution time per run (in seconds) unveils,as anticipated, that k-Means is the fastest method, followed byk-Meansþþ , pifs k-Means and MinMax k-Means. MinMax
Table 10(a) Comparative results on the Dermatology dataset. (b) Comparative results on the Dermatology dataset when k-Means is initialized by the solution returned by MinMaxk-Means and pifs k-Means.
Method Emax Esum NMI Time
(a)MinMax (β¼ 0) 1513:857316:42n†‡ 5672:827272:21n†‡
0:8270:03‡ 0.37 (0.18)
MinMax (β¼ 0:1) 1439:767296:76n†‡ 5685:167237:35n†‡0:8270:03‡ 0.37 (0.16)
MinMax (β¼ 0:3) 1368:057347:04n†‡ 5703:267195:87n†‡0:8270:01‡ 0.49 (0.16)
k–Means 2247:597804:75 5885:927542:49 0:8270:07 0.10k–Meansþþ 2134:547681:34 5800:237448:38 0:8270:07 0.11Pifs 1650:13791:99 6057:18750:62 0:8070:01 0:08
Methodþk–Means Emax Esum NMI Time
(b)MinMax(β¼ 0) 1683:337402:51n†‡
5578:957295:56n†‡ 0:8670:04n†‡ 0.42 (0.23)
MinMax (β¼ 0:1) 1609:887379:81n†‡5548:567263:49n†‡ 0:8670:03n†‡ 0.42 (0.21)
MinMax (β¼ 0:3) 1395:327109:48n†‡ 5441:137107:40n†‡0:8770:01n† 0.54 (0.21)
k–Means 2247:597804:75 5885:927542:49 0:8270:07 0.10k–Meansþþ 2134:547681:34 5800:237448:38 0:8270:07 0.11Pifs 1761:137358:36 5496:977207:25 0:8770:02 0.10
Table 11Percentage (%) of MinMax k-Means restarts over allnine datasets for which empty or singleton clustersnever occur, in relation to the memory level.
Memory level Percentage
β¼ 0 14.96β¼ 0:1 54.37β¼ 0:3 91.19
G. Tzortzis, A. Likas / Pattern Recognition 47 (2014) 2505–25162514

Author's personal copy
k-Means is slower than k-Means by a factor ranging between 3 and6, depending on the dataset. This higher execution time is a directconsequence of our method requiring more iterations to converge,due to the process employed for adapting p to the data, and alsothe fact that for some restarts convergence is not achieved, hencetmax iterations are performed. Note that tmax is set to a high valuein the experiments (tmax ¼ 500). For this reason, the executiontime for only those restarts that do converge is also shown (inparentheses) and for Coil3, Multiple features-profile correlations,Pendigits, Ecoli and Dermatology a significant reduction isobserved. However, MinMax k-Means is still more timeconsuming.
Overall, the experimental evaluation has revealed that MinMaxk-Means is superior to k-Means, k-Meansþþ and pifs k-Means,although it incurs a higher computational cost. Importantly, ourmethod guards against large variance clusters and evades poorsolutions after bad initializations. Furthermore, it constitutes asound approach for initializing k-Means. This superior perfor-mance has been attained for general pmax and pstep values thatwere not tailored to each particular dataset, which greatlyenhances the applicability of the presented algorithm. Regardingthe use of memory, a higher memory further limits large varianceclusters as well as the occurrence of empty or singleton clusters,but increases Esum and its gains when used to initialize k-Meansare small. We could argue that memory is helpful, but notconsiderably, and even without memory (β¼ 0) solutions of verygood quality can be obtained. As already discussed, the conver-gence of MinMax k-Means cannot be theoretically guaranteed.However, for the conducted experiments about 60% of the restartsacross all datasets do converge, empirically validating that runswhich stop at a local optimum of the relaxed objective (3) arefrequently encountered. Finally, a note on the Olivetti dataset,where the compared methods attain identical NMI scores (Tables 8(a)–(b)): despite the NMI being equal on average, many of theindividual restarts exhibit significant differences across the differ-ent methods.
6. Conclusions
We have proposed the MinMax k-Means algorithm, a prin-cipled approach to circumvent the initialization problem asso-ciated with k-Means. Weights are assigned to the clusters inproportion to their variance and a weighted version of thek-Means objective is optimized to restrain large variance clustersfrom appearing in the solution. A user specified p exponent isutilized to control the strictness of our method over large varianceclusters. By punishing large variance clusters, bad initializationscan be readily overcome to consistently uncover partitionings ofhigh quality, irrespective of the initial choice of the cluster centers.Additionally, clusters are balanced in terms of their variance,which may prove useful as many data analysis scenarios requiregroups of roughly the same size. Training involves a min-maxproblem that is iteratively solved, where the weights are updatedin the maximization step to accurately reflect the variances of theclusters at each iteration. Moreover, we have presented a metho-dology for adjusting the p exponent to the underlying datasetproperties, so that the intrinsic group structures can be identified,which greatly facilitates the application of our algorithm.
To draw reliable conclusions, MinMax k-Means was extensivelytested on various datasets. Results demonstrate its robustness overbad initializations and its efficacy, as for most cases it outperforms(in terms of clustering quality) all three compared methods,namely k-Means, k-Meansþþ [8] and pifs k-Means [10]. Further-more, we noticed that k-Means solutions can be significantlyimproved when initialized by MinMax k-Means, suggesting an
important additional usage of our approach. Overall, MinMaxk-Means appears to be a very competitive and easy to employmethod for dealing with the sensitivity to initialization ofk-Means.
As for future work, we plan to extend MinMax k-Means tokernel-based clustering [2], so that nonlinearly separable clusterscan be detected in the data. Also, it would be interesting to exploreother possible ways of automatically determining the p value andcompare them to the methodology proposed in this paper.
Conflict of interest statement
None declared.
Acknowledgments
This work was supported and co-financed by the EuropeanUnion (European Regional Development Fund—ERDF) and Greeknational funds through the Operational Program “THESSALY—MAINLAND GREECE AND EPIRUS 2007–2013” of the NationalStrategic Reference Framework (NSRF 2007–2013).
References
[1] R. Xu, D.C. Wunsch II, Survey of clustering algorithms, IEEE Trans. Neural Netw.16 (3) (2005) 645–678.
[2] M. Filippone, F. Camastra, F. Masulli, S. Rovetta, A survey of kernel and spectralmethods for clustering, Pattern Recognit. 41 (1) (2008) 176–190.
[3] S.P. Lloyd, Least squares quantization in PCM, IEEE Trans. Inf. Theory 28 (2)(1982) 129–136.
[4] B. Schölkopf, A.J. Smola, K.-R. Müller, Nonlinear component analysis as akernel eigenvalue problem, Neural Comput. 10 (5) (1998) 1299–1319.
[5] I.S. Dhillon, Y. Guan, B. Kulis, Kernel k-means, spectral clustering and normal-ized cuts, in: ACM SIGKDD International Conference on Knowledge Discoveryand Data Mining, 2004, pp. 551–556.
[6] J.M. Peña, J.A. Lozano, P. Larrañaga, An empirical comparison of four initializa-tion methods for the k-means algorithm, Pattern Recognit. Lett. 20 (10) (1999)1027–1040.
[7] M.E. Celebi, H.A. Kingravi, P.A. Vela, A comparative study of efficient initializa-tion methods for the k-means clustering algorithm, Expert Syst. Appl. 40 (1)(2013) 200–210.
[8] D. Arthur, S. Vassilvitskii, k-Meansþþ: the advantages of careful seeding, in:ACM-SIAM Symposium on Discrete Algorithms (SODA), 2007, pp. 1027–1035.
[9] C.-D. Wang, J.-H. Lai, J.-Y. Zhu, A conscience on-line learning approach forkernel-based clustering, in: International Conference on Data Mining (ICDM),2010, pp. 531–540.
[10] A. Banerjee, J. Ghosh, Frequency-sensitive competitive learning for scalablebalanced clustering on high-dimensional hyperspheres, IEEE Trans. NeuralNetw. 15 (3) (2004) 702–719.
[11] P.S. Bradley, U.M. Fayyad, Refining initial points for k-means clustering, in:International Conference on Machine Learning (ICML), 1998, pp. 91–99.
[12] T. Su, J.G. Dy, In search of deterministic methods for initializing k-means andgaussian mixture clustering, Intell. Data Anal. 11 (4) (2007) 319–338.
[13] A. Likas, N.A. Vlassis, J.J. Verbeek, The global k-means clustering algorithm,Pattern Recognit. 36 (2) (2003) 451–461.
[14] A.M. Bagirov, Modified global k-means for minimum sum-of-squares cluster-ing problems, Pattern Recognit. 41 (10) (2008) 3192–3199.
[15] A.M. Bagirov, J. Ugon, D. Webb, Fast modified global k-means algorithm forincremental cluster construction, Pattern Recognit. 44 (4) (2011) 866–876.
[16] G. Tzortzis, A. Likas, The global kernel k-means clustering algorithm, in:International Joint Conference on Neural Networks (IJCNN), 2008, pp. 1977–1984.
[17] G. Tzortzis, A. Likas, The global kernel k-means algorithm for clustering infeature space, IEEE Trans. Neural Netw. 20 (7) (2009) 1181–1194.
[18] H. Zha, X. He, C.H.Q. Ding, M. Gu, H.D. Simon, Spectral relaxation for k-meansclustering, in: Advances in Neural Information Processing Systems (NIPS),2001, pp. 1057–1064.
[19] C.H.Q. Ding, X. He, K-means clustering via principal component analysis, in:International Conference on Machine Learning (ICML), 2004, pp. 225–232.
[20] P.-N. Tan, M. Steinbach, V. Kumar, Introduction to Data Mining, Addison-Wesley, Boston, MA, USA, 2005.
[21] J.Z. Huang, M.K. Ng, H. Rong, Z. Li, Automated variable weighting in k-meanstype clustering, IEEE Trans. Pattern Anal. Mach. Intell. 27 (5) (2005) 657–668.
[22] D.S. Modha, W.S. Spangler, Feature weighting in k-means clustering, Mach.Learn. 52 (3) (2003) 217–237.
G. Tzortzis, A. Likas / Pattern Recognition 47 (2014) 2505–2516 2515

Author's personal copy
[23] A. Keller, Fuzzy clustering with outliers, in: International Conference of the NorthAmerican Fuzzy Information Processing Society (NAFIPS), 2000, pp. 143–147.
[24] C.H.Q. Ding, X. He, H. Zha, M. Gu, H.D. Simon, A min-max cut algorithm forgraph partitioning and data clustering, in: International Conference on DataMining (ICDM), 2001, pp. 107–114.
[25] F. Nie, C.H.Q. Ding, D. Luo, H. Huang, Improved minmax cut graph clusteringwith nonnegative relaxation, in: European Conference on Machine Learningand Principles and Practice of Knowledge Discovery in Databases (ECMLPKDD), 2010, pp. 451–466.
[26] S.A. Nene, S.K. Nayar, H. Murase, Columbia Object Image Library (COIL-20),Technical Report CUCS-005-96 1996.
[27] A. Kalogeratos, A. Likas, Dip-means: an incremental clustering method forestimating the number of clusters, in: Advances in Neural InformationProcessing Systems (NIPS), 2012, pp. 2402–2410.
[28] D.G. Lowe, Distinctive image features from scale-invariant keypoints, Int. J.Comput. Vis. 60 (2) (2004) 91–110.
[29] A. Frank, A. Asuncion, UCI machine learning repository, 2010. URL ⟨http://archive.ics.uci.edu/ml⟩.
[30] B.J. Frey, D. Dueck, Clustering by passing messages between data points,Science 315 (2007) 972–976 ⟨www.psi.toronto.edu/affinitypropagation⟩.
Grigorios Tzortzis received the B.Sc. and M.Sc. degrees in Computer Science from the University of Ioannina, Greece, in 2006 and 2008, respectively. Currently he is a Ph.D.candidate at the Department of Computer Science & Engineering, University of Ioannina, Greece. His research interests include machine learning, pattern recognition, multi-view learning and data mining.
Aristidis Likas received the Diploma degree in Electrical Engineering and the Ph.D. degree in Electrical and Computer Engineering from the National Technical University ofAthens, Greece, in 1990 and 1994, respectively. Since 1996, he has been with the Department of Computer Science & Engineering, University of Ioannina, Greece, where he iscurrently a Professor. His research interests include machine learning, pattern recognition, multimedia, and bioinformatics.
G. Tzortzis, A. Likas / Pattern Recognition 47 (2014) 2505–25162516