author(s) joan fitzgerald, lisa granquist, ishwar ...330211/...author(s) joan fitzgerald, lisa...
TRANSCRIPT

Author(s)Joan Fitzgerald, Lisa Granquist, Ishwar Khatiwada, Joe McLaughlin, Michael Renner, and Andrew Sum
This report is available at IRis: http://iris.lib.neu.edu/dukakis_pubs/4

Reviving theU.S. Rail and Transit Industry:Investments and Job Creation
Joan Fitzgerald Lisa Granquist Ishwar KhatiwadaJoe McLaughlin Michael Renner Andrew Sum
Reviving theU.S. Rail and Transit Industry:Investments and Job Creation

Reviving theU.S. Rail and Transit Industry:Investments and Job Creation
Joan FitzgeraldLisa Granquist
Ishwar KhatiwadaJoe McLaughlinMichael RennerAndrew Sum
September 2010

© 2010 Northeastern University
Printed on paper that is 50 percent recycled, 30 percentpost-consumer waste, process chlorine free.
The views expressed are those of the authors and do notnecessarily represent those of Northeastern University.
Editor: Lisa Mastny
Designer: Lyle Rosbotham
2 REVIVING THE U.S. RAIL AND TRANSIT INDUSTRY: INVESTMENTS AND JOB CREATION

Table of Contents
Summary . . . . . . . . . . . . . . . . . . . . . . . . . . . . . . . . . . . . . . . . . . . . . . . . . . . . . . . . . . . . . . . . . . . . 9
Linking U.S. Manufacturing and Transportation . . . . . . . . . . . . . . . . . . . . . . . . . . . . . . . . . . . . . 11
U.S. Rail and Transit Today . . . . . . . . . . . . . . . . . . . . . . . . . . . . . . . . . . . . . . . . . . . . . . . . . . . . . 13
Scenarios for U.S. Rail and Transit Investment . . . . . . . . . . . . . . . . . . . . . . . . . . . . . . . . . . . . . . . 17
Scenarios for U.S. Rail and Transit Employment . . . . . . . . . . . . . . . . . . . . . . . . . . . . . . . . . . . . . 23
Key Assumptions About the Investment Scenarios and Realizing Their Employment Impact . . . . 30
Conclusion . . . . . . . . . . . . . . . . . . . . . . . . . . . . . . . . . . . . . . . . . . . . . . . . . . . . . . . . . . . . . . . . . . 32
Appendix: Methodology for Employment Projections . . . . . . . . . . . . . . . . . . . . . . . . . . . . . . . . . 33
Endnotes . . . . . . . . . . . . . . . . . . . . . . . . . . . . . . . . . . . . . . . . . . . . . . . . . . . . . . . . . . . . . . . . . . . 36
Figures and Tables
Figure 1. Top Manufacturers of U.S. Railcars, by Market Share, Recent Years . . . . . . . . . . . . . . . . 13
Figure 2. U.S. Capital Expenditures on Transit Bus Rolling Stock,Percent Change, 1993–2008 . . . . . . . . . . . . . . . . . . . . . . . . . . . . . . . . . . . . . . . . . . . . . 15
Figure 3. U.S. Federal Spending on Transport Infrastructure, 1956–2006 . . . . . . . . . . . . . . . . . . . 17
Figure 4. U.S. Federal Appropriations for Amtrak, 1971–2010 . . . . . . . . . . . . . . . . . . . . . . . . . . . 18
Table 1. Investment in Passenger Rail in Selected Countries, Recent Years . . . . . . . . . . . . . . . . . . 14
Table 2. U.S. Transit Bus Manufacturers, Facts and Figures . . . . . . . . . . . . . . . . . . . . . . . . . . . . . 15
Table 3. U.S. Mass Transit Funding, Total versus Federal Share, 1990 and 2000–08 . . . . . . . . . . . 17
Table 4. Share of U.S. Urban Transit Spending, by Category, 2008 . . . . . . . . . . . . . . . . . . . . . . . . 18
Table 5. U.S. Federal Funding for Intercity Rail, Fiscal Years 2008–11 . . . . . . . . . . . . . . . . . . . . . 19
Table 6. Recent U.S. Transit and Intercity Rail Studies: Summary ofFunding Recommendations . . . . . . . . . . . . . . . . . . . . . . . . . . . . . . . . . . . . . . . . . . . . . . 20
Table 7. U.S. Urban Transit Capital Spending Under the Increased DomesticInvestment Scenario . . . . . . . . . . . . . . . . . . . . . . . . . . . . . . . . . . . . . . . . . . . . . . . . . . . 21
Table 8. Chinese Public Investment in Intercity Rail and Transit, Recent Years and Projections . . 21
Table 9. U.S. Urban Transit Capital Spending Under the Increased Domestic Investmentand International Competitiveness Scenarios . . . . . . . . . . . . . . . . . . . . . . . . . . . . . . . . . 22
3Table of Contents

Table 10. U.S. Annual Urban Transit Capital Spending: A Summary of the Three Scenarios . . . . 22
Table 11. Direct and Indirect Job Creation in U.S. Railcar Manufacturing Under theThree Investment Scenarios . . . . . . . . . . . . . . . . . . . . . . . . . . . . . . . . . . . . . . . . . . . . . . 23
Table 12. The 10 Manufacturing Subsectors that Would Gain the Most Jobs fromIncreased U.S. Railcar Purchases, Under the Three Investment Scenarios . . . . . . . . . . . 24
Table 13. Employment in the U.S. Railroad Rolling Stock Manufacturing Industry,by Geographic Division, 2006–08 . . . . . . . . . . . . . . . . . . . . . . . . . . . . . . . . . . . . . . . . . 25
Table 14. Estimated Distribution of Expenditures Across the Five U.S. Bus Manufacturersand Cummins, Under the Three Investment Scenarios . . . . . . . . . . . . . . . . . . . . . . . . . 25
Table 15. Employment Impacts of New U.S. Bus Purchases, Under the ThreeInvestment Scenarios . . . . . . . . . . . . . . . . . . . . . . . . . . . . . . . . . . . . . . . . . . . . . . . . . . . 26
Table 16. Distribution of Employment Impacts, by Industry, Under the ThreeInvestment Scenarios . . . . . . . . . . . . . . . . . . . . . . . . . . . . . . . . . . . . . . . . . . . . . . . . . . . 27
Table 17. Estimated Employment in Motor Vehicles Manufacturing Industries,with Current versus Fully Domestic Component Content, Under the ThreeInvestment Scenarios . . . . . . . . . . . . . . . . . . . . . . . . . . . . . . . . . . . . . . . . . . . . . . . . . . . 27
Table 18. Estimated Distribution of Jobs in Top 10 Industries Created from Investmentin the U.S. Motor Vehicles Manufacturing Industry, 2008 . . . . . . . . . . . . . . . . . . . . . . 28
Table 19. Number and Gender Distribution of Employment in U.S. Railroad RollingStock, Motor Vehicle and Motor Equipment Manufacturing, and All Industries,2006–08 . . . . . . . . . . . . . . . . . . . . . . . . . . . . . . . . . . . . . . . . . . . . . . . . . . . . . . . . . . . . 28
Table 20. Share of Employment in U.S. Railroad Rolling Stock, Motor Vehicle Manufacturing,and All Industries, by Education Level, 2006–08 . . . . . . . . . . . . . . . . . . . . . . . . . . . . . . 29
Table 21. Median Annual Earnings of Workers in U.S. Railroad Rolling Stock, MotorVehicle Manufacturing, and All Industries, by Gender, 2006–08 . . . . . . . . . . . . . . . . . . 29
4 REVIVING THE U.S. RAIL AND TRANSIT INDUSTRY: INVESTMENTS AND JOB CREATION

5Acknowledgments / About the Authors
Acknowledgments
The authors are grateful to many individuals who provided background information for this report. Key among
them are Michael Dukakis (Northeastern University), Robert Paaswell (City University of New York), and
Jonathan Feldman (Stockholm University). We thank several individuals for providing comments on the manu-
script and helping to shape the research: Matt Mayrl, Cathy Calfo, and Mac Lynch (Apollo Alliance); Michael
Renner (Worldwatch Institute); and Marcy Lowe (Duke University’s Center on Globalization, Governance & Com-
petitiveness). This report would not have been possible without their constructive critiques and guidance of the
larger project. Worldwatch Institute Senior Editor Lisa Mastny, Marketing Director Patricia Shyne, and independent
designer Lyle Rosbotham guided this report from manuscript to polished final product. Sheila Palma, Heather
Seligman, and Kathleen Simmons provided administrative support at Northeastern University. The report was made
possible by the financial support of the Rockefeller Foundation and the Surdna Foundation.
About the Authors
Joan Fitzgerald is professor and director of the graduate program in Law, Policy and Society and a Senior Research
Fellow at the Kitty and Michael Dukakis Center for Urban and Regional Policy at Northeastern University. Her
third book, Emerald Cities: Urban Sustainability and Economic Development, examines how cities are creating eco-
nomic development opportunities in several green sectors and discusses the state and national policy needed to
support these efforts. Emerald Cities builds on her 2002 book, Economic Revitalization: Strategies and Cases forCity and Suburb, which identifies strategies for incorporating sustainability and social justice goals into urban
economic development planning. Her 2006 book, Moving Up in the New Economy, focuses on how to build career
ladders for low-income workers. Fitzgerald has published in journals such as Economic Development Quarterly,Urban Affairs Quarterly, Urban Affairs, and The American Prospect. Her academic and consulting work has been
supported by the John D. and Catherine T. MacArthur, Annie E. Casey, Rockefeller Brothers, Rockefeller,
Surdna, Century, and Robert Wood Johnson Foundations. She has also conducted research for the U.S. Depart-
ment of Labor, the Massachusetts Technology Collaborative, the Boston Housing Authority, and other govern-
ment agencies.
Lisa Granquist is a Ph.D. student in the Law, Policy and Society Program in the School of Public Policy and Urban
Affairs at Northeastern University. She has worked in the manufacturing and nonprofit sectors and in business
development of new technologies. Her current research focuses on climate adaptation solutions for coastal areas.
Ishwar Khatiwada is a Senior Research Associate at the Center for Labor Market Studies at Northeastern Uni-
versity. He has authored or co-authored numerous journal articles, monographs, and research reports on labor mar-
ket information at the national and local level.

6 REVIVING THE U.S. RAIL AND TRANSIT INDUSTRY: INVESTMENTS AND JOB CREATION
Joseph McLaughlin is a Senior Research Associate at the Center for Labor Market Studies at Northeastern Uni-
versity. He has worked on numerous youth labor market research and program evaluations including a longitu-
dinal tracking study of the college persistence rates and college graduation rates of graduates from Boston Public
Schools’ Class of 2000, the education and employment outcomes for recent graduates from the Boston Public School
system, and the education and employment outcomes of Jobs for America’s Graduates program participants.
Michael Renner is a Senior Researcher at the Worldwatch Institute. His work has focused on a variety of link-
ages between the environment and other global concerns, with particular focus on transportation issues and the
connections between environment and employment. With colleagues at the Global Labor Institute (Cornell
University), Michael authored Green Jobs: Toward Decent Work in a Sustainable, Low-Carbon Economy, published
by the United Nations Environment Programme in 2008. He has also collaborated with a broad variety of other
organizations on this topic, including WWF, the Friedrich Ebert Foundation (Germany), Carbon Forum Asia,
the Workplace Research Centre at the University of Sydney, and the Political Economy Research Institute (PERI)
at the University of Massachusetts.
Andrew M. Sum is Professor of Economics and Director of the Center for Labor Market Studies at Northeast-
ern University. For the past 35 years, he has conducted research at the national, state, and local levels on a wide
array of labor market and workforce development topics, including the educational and labor market experiences
of teens and young adults. Among his recent research studies are: On-Time High School Graduation Rates and Col-lege Enrollment Rates for Massachusetts High School Graduates, Class of 2006 and 2007: The Existence of Large Dis-parities Between Affluent Suburban and Central City School Districts Across the Commonwealth (May 2008);
Declining Teen Employment Prospects in Massachusetts and the U.S.: The Case for An Immediate Youth Jobs Stimu-lus Program in the Nation and State (February 2008); The Collapse of the National Teen Job Market and the Casefor An Immediate Youth Jobs Creation Program (February 2008); and An Assessment of the Labor Market, Income,Social, Health, Civic, Incarceration, and Fiscal Consequences of Dropping Out of High School: Findings for Michi-gan Adults in the 21st Century (January 2008).
7The Apollo Transportation Manufacturing Initiative
The Apollo Transportation Manufacturing Initiative
With support from the Rockefeller and Surdna Foundations, the Apollo Alliance partnered with North-eastern University, the Worldwatch Institute, and the Duke University Center on Globalization, Gov-ernance & Competitiveness to conduct research, engage stakeholders, and develop policyrecommendations to inform the emergence of a comprehensive strategy to create good American jobsby bolstering the domestic manufacture of advanced rail and transit vehicles systems and componentparts. Over the course of 2010, the initiative culminated in the release of four separate reports:
U.S. Manufacture of Rail Vehicles for Intercity Passenger Rail and Urban Transit,Duke University Center on Globalization, Governance & Competitiveness
Modeled on its previous analyses of the hybrid truck and public transit bus supply chains, the Center on Glob-alization, Governance & Competitiveness mapped the supply chain for the U.S. passenger railcar industry.The study details nearly 250 existing manufacturing locations in 35 states that are currently producing railvehicles or component parts. While domestic manufacturers exist in many of the industry subsectors, theU.S. supply chain has several gaps, and many higher-value added activities are still performed abroad. TheU.S. passenger and transit rail supply chain currently supports between 10,000 and 14,000 employees,numbers that could grow with scaled-up U.S. investments in public transit and intercity rail.
Global Competitiveness in the Rail and Transit Industry,Worldwatch Institute
To inform ongoing discussions at the U.S. federal, state, and local levels regarding public investments in railand urban transit, the Worldwatch Institute analyzed global rail industry trends and profiled four countries—Germany, Spain, Japan, and China—that have made major commitments to public transportation andthat offer important lessons for the United States. The report finds that at least half a million people in totalare directly employed in rail vehicle manufacturing in these countries. The creation of strong rail manufac-turing industries has depended to a significant degree on steady domestic markets for these products, drivenby substantial and sustained investments in rail and transit infrastructure.
Reviving the U.S. Rail and Transit Industry: Investments and Job Creation,Northeastern University & Worldwatch Institute
Northeastern University and the Worldwatch Institute estimated potential manufacturing job creation in thetransit bus and passenger railcar supply chains under different scenarios of federal investment: the currentfunding levels, increased domestic investment, and international comparative investment. Building on thesupply chain analyses conducted by Duke University, the study finds that the United States could gain over79,000 jobs in rail and bus manufacturing and related industries if public transit were funded at a level thatwould double transit ridership in 20 years, and more than 250,000 jobs if the country were to invest as much

in transit as China does. Employment gains across both rail and bus supply chains could increase by up to30 percent if stronger domestic supply chains allowed for greater domestic content. The authors concludethat the United States needs a more coherent industrial policy to link public transportation and manufac-turing goals.
Make It in America: The Apollo Clean Transportation Manufacturing Action Plan,Apollo Alliance
Based on the successful GreenMAP initiative, which developed a comprehensive strategy for expanding theU.S. clean energy manufacturing sector, the Apollo Alliance convened a diverse set of political stakehold-ers, including labor and business leaders, transportation, economic development, and environmental pol-icy experts, to identify the policy needed to expand the domestic manufacture of advanced bus and rail transitsystems, clean freight technologies, and their component parts. The resulting policy recommendations callfor expanded investment in clean transportation options and for a comprehensive manufacturing strategyto create good American jobs by providing the supports needed to ensure that expanded demand for anadvanced transportation system is met by U.S. manufacturers.
For copies of the reports and more information about the Apollo Transportation Manufacturing Initiative, pleasevisit www.apolloalliance.org/programs/tmap.
8 REVIVING THE U.S. RAIL AND TRANSIT INDUSTRY: INVESTMENTS AND JOB CREATION

Summary
With the federal transportation bill up for renewal, the United States has an opportunity to invest in public trans-
portation and renew its manufacturing base. This report reveals that the country could gain more than 79,000
jobs in rail and bus manufacturing and related industries under an investment scenario sufficient to double tran-
sit ridership in 20 years. If the United States were to invest at even higher levels—similar to those of China—this
would yield more than a quarter million jobs.
The United States needs urgently to revive its rail and transit industry. The nation’s manufacturing sector accounts
for over 10 percent of GDP, but manufacturing has seen job losses in the millions in recent years. And the U.S.
trade deficit continues to rise. The country needs new manufacturing jobs now to address the trade deficit and
to put unemployed Americans back in well-paying jobs.
While the United States has lost its competitive edge in producing many high-tech goods, it is not too late to
follow the strategy of European nations and China in building a strong transit vehicle industry. Spain has con-
sistently invested $10 billion per year on average in its high-speed passenger rail system since 1992, and France
is rapidly expanding its already well-developed rail transit network, in part to help meet greenhouse gas emissions
reduction goals. Both countries have mature rail manufacturing sectors, and one of the world’s largest rail vehi-
cle manufacturers, Bombardier, is a French firm.
The lessons of Europe have not been lost on China, which plans to spend nearly $293 billion to meet its 2012
goals for high-speed rail and other rail and transit expansion. In addition to a world-class train network, China
is using the initiative as a vehicle to create 6 million jobs and to generate demand for 20 million tons of
domestic steel.
The United States, for the most part, has abandoned its domestic passenger rail and transit bus industries. The
loss of these industries in the 1970s and 80s was largely a function of unstable demand rather than of high labor
costs. As domestic demand for transit vehicles waned, U.S. companies did not keep up with state-of-the art tran-
sit technologies. To retain some degree of local production, Congress adopted “Buy America” legislation that requires
that 60 percent of the value of subcomponents of transit vehicles and equipment be produced domestically, and
that final assembly also occur in the country. This stipulation motivated foreign suppliers to enter the U.S. mar-
ket to supplement the more stable demand for equipment in their own countries.
The American Recovery and Reinvestment Act of 2009 (ARRA) has made a down payment on rebuilding the
U.S. transit infrastructure. Under ARRA, the federal government committed an initial $1.3 billion for the rail
operator Amtrak in addition to the $8 billion for new high-speed rail corridors and intercity passenger rail serv-
ice. Many cities and states are advocating that the government commit further funds so that they can upgrade and
expand their transit systems.
However, a much larger investment is needed to create the stable demand for bus and rail vehicles that will
motivate U.S. and foreign firms to expand their U.S. manufacturing operations and workforces. If more stimu-
lus funds are directed to rail infrastructure, and if the next federal transportation bill makes a significant invest-
ment in public transit, the United States could develop world-class public transportation and create highly needed
9Summary

10 REVIVING THE U.S. RAIL AND TRANSIT INDUSTRY: INVESTMENTS AND JOB CREATION
jobs while helping to reduce urban traffic congestion and greenhouse gas emissions in the nation’s cities.
This report uses three scenarios to estimate the job creation potential from increased federal investment in rail
and transit. A “Business-as-Usual” scenario would invest $2.7 billion in rail vehicles and $2.8 billion in bus pur-
chases. An “Increased Domestic Investment” scenario would invest $7.2 billion and $4.8 billion, respectively, toward
these purchases. And an “International Competitiveness” scenario would invest $24.4 billion and $12.8 billion,
respectively—a level that is comparable to China’s investment in rail and bus vehicles.
The “Business-as-Usual” scenario yields 34,563 jobs in U.S. rail car and bus manufacturing and their supplier
industries. The “Increased Domestic Investment” scenario would support 79,343 jobs, and the “International Com-
petitiveness” scenario would yield 252,213 jobs. The number of jobs would increase significantly if more than the
required 60 percent of inputs (as specified by the Buy America provision) were produced domestically. These jobs
would stimulate thousands more jobs in other sectors of the economy.
Such analysis does not apply just to transit vehicles, but also to other clean-technology industries that will be
growing dramatically over the coming decades. If U.S. manufacturing is to experience a serious revival that pro-
duces more than fragmented showcase projects and scattered jobs, the federal government needs to take much bolder
policy action that creates demand and supports research and development in key industries.
11Linking U.S. Manufacturing and Transportation
“U.S. manufacturers are not likely to decide to reenterthe market and manufacture railcars unless the U.S.Government (like other major Western countries andJapan) assures a stable, predictable, and planned railequipment market that spreads orders out more or lessevenly and in manageable sizes.” 1
—U.S. Congress, Office of Technology Assessment,1983
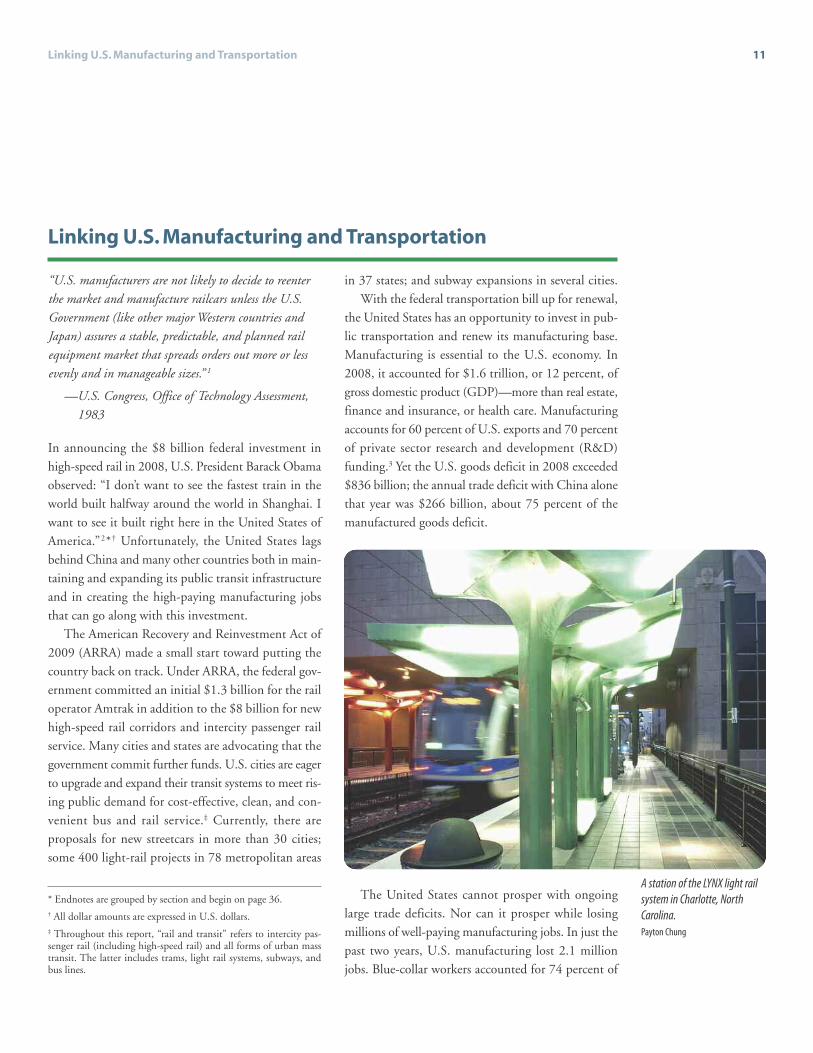
In announcing the $8 billion federal investment inhigh-speed rail in 2008, U.S. President Barack Obamaobserved: “I don’t want to see the fastest train in theworld built halfway around the world in Shanghai. Iwant to see it built right here in the United States ofAmerica.”2*† Unfortunately, the United States lagsbehind China and many other countries both in main-taining and expanding its public transit infrastructureand in creating the high-paying manufacturing jobsthat can go along with this investment.
The American Recovery and Reinvestment Act of2009 (ARRA) made a small start toward putting thecountry back on track. Under ARRA, the federal gov-ernment committed an initial $1.3 billion for the railoperator Amtrak in addition to the $8 billion for newhigh-speed rail corridors and intercity passenger railservice. Many cities and states are advocating that thegovernment commit further funds. U.S. cities are eagerto upgrade and expand their transit systems to meet ris-ing public demand for cost-effective, clean, and con-venient bus and rail service.‡ Currently, there areproposals for new streetcars in more than 30 cities;some 400 light-rail projects in 78 metropolitan areas
in 37 states; and subway expansions in several cities.With the federal transportation bill up for renewal,
the United States has an opportunity to invest in pub-lic transportation and renew its manufacturing base.Manufacturing is essential to the U.S. economy. In2008, it accounted for $1.6 trillion, or 12 percent, ofgross domestic product (GDP)—more than real estate,finance and insurance, or health care. Manufacturingaccounts for 60 percent of U.S. exports and 70 percentof private sector research and development (R&D)funding.3 Yet the U.S. goods deficit in 2008 exceeded$836 billion; the annual trade deficit with China alonethat year was $266 billion, about 75 percent of themanufactured goods deficit.
The United States cannot prosper with ongoinglarge trade deficits. Nor can it prosper while losingmillions of well-paying manufacturing jobs. In just thepast two years, U.S. manufacturing lost 2.1 millionjobs. Blue-collar workers accounted for 74 percent of
Linking U.S. Manufacturing and Transportation
* Endnotes are grouped by section and begin on page 36.† All dollar amounts are expressed in U.S. dollars.‡ Throughout this report, “rail and transit” refers to intercity pas-senger rail (including high-speed rail) and all forms of urban masstransit. The latter includes trams, light rail systems, subways, andbus lines.
A station of the LYNX light railsystem in Charlotte, NorthCarolina.Payton Chung

job losses between the onset of the economic recessionin September 2008 and November 2009. For experi-enced production workers, the unemployment rate in2009 was 14 percent.4
The United States needs to revitalize manufacturingto put people back to work, but also to stem the coun-try’s declining position in the world economic order.Conventional wisdom says that the nation has transi-tioned from a goods-producing economy to a knowl-edge- and innovation-based economy. But the two areintricately related. An innovation-based economy relieson R&D that is connected to manufacturing high-technology goods.5 Such goods are typically consid-ered to be products like computers, lithium-ionbatteries, and jumbo jets; however, passenger rail carsand buses also rely on high-technology systems. Thereis significant innovation occurring in both the bus and
rail production industries.Other developed and industrializing countries have
deliberate policies to link innovation to manufacturingadvantage—commercializing the products resultingfrom R&D programs, investing in the education ofskilled workers, and linking goals in other policy areas(such as transportation and energy) to develop exportindustries and create domestic jobs.6 Germany hasinvested heavily in wind and solar over the past 20 yearsand used demand-creation policies to gain technologi-cal leadership, employ skilled manufacturing workers,and become an export leader.7 France, Germany, Spain,and other countries have also built strong railcar man-ufacturing industries by aggressively expanding rail linesdomestically and then moving into exports. Even rela-tively new entrants such as China are successfully fol-lowing this model. The United States can do so as well.
12 REVIVING THE U.S. RAIL AND TRANSIT INDUSTRY: INVESTMENTS AND JOB CREATION
The United States once produced a wide range of tran-sit vehicles, including subways, light and heavy railcars,and streetcars. The last U.S. subway car producer, BuddCompany, stopped production in 1987. The last threestreetcar builders closed down by 1970. The reasonfor the loss of the U.S. industry was not high laborcosts—most of the countries that dominate the indus-try today have wages comparable to the United States.Rather, Rutgers transportation engineer ThomasBoucher identifies unstable demand as a key factor inthe demise of the U.S. railcar industry, noting thatduring the 1970s annual domestic demand and pro-duction of the cars bounced between 268 and 1,067units: “Instead of a series of steady orders for cars everyyear, the pattern of demand absorbed capacity for oneor two years and left the industry with little work inother years.” As the U.S. Office of Technology Assess-ment observed in 1983, maintaining a domestic rail-car industry requires a stable, predictable, and plannedrail equipment market.1
As domestic demand for transit vehicles waned,U.S. companies did not keep up with state-of-the-arttechnology as subway and other railcars became moresophisticated.2 Companies such as Pullman began sub-contracting out more complex electronics systems butwere not able to manage suppliers, leading to qualityproblems. The other domestic subway car producerssimply moved into other industries.3
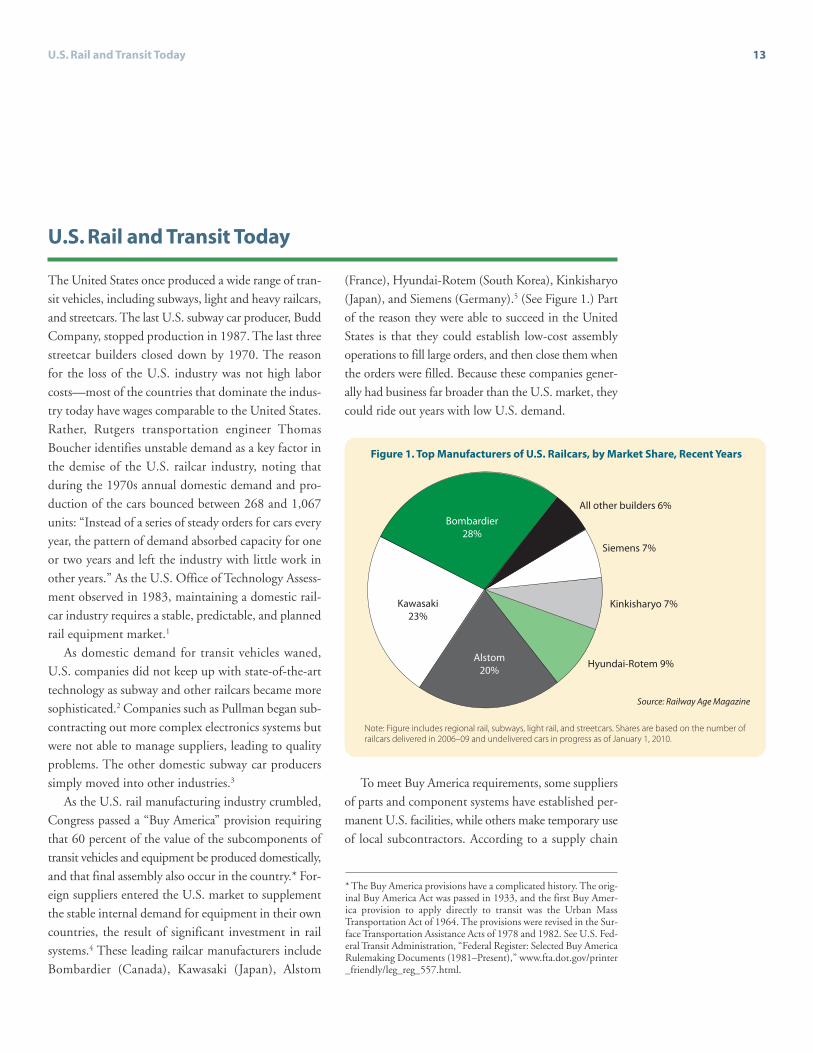
As the U.S. rail manufacturing industry crumbled,Congress passed a “Buy America” provision requiringthat 60 percent of the value of the subcomponents oftransit vehicles and equipment be produced domestically,and that final assembly also occur in the country.* For-eign suppliers entered the U.S. market to supplementthe stable internal demand for equipment in their owncountries, the result of significant investment in railsystems.4 These leading railcar manufacturers includeBombardier (Canada), Kawasaki (Japan), Alstom
(France), Hyundai-Rotem (South Korea), Kinkisharyo(Japan), and Siemens (Germany).5 (See Figure 1.) Partof the reason they were able to succeed in the UnitedStates is that they could establish low-cost assemblyoperations to fill large orders, and then close them whenthe orders were filled. Because these companies gener-ally had business far broader than the U.S. market, theycould ride out years with low U.S. demand.
To meet Buy America requirements, some suppliersof parts and component systems have established per-manent U.S. facilities, while others make temporary useof local subcontractors. According to a supply chain
13U.S. Rail and Transit Today
U.S. Rail and Transit Today
Source: Railway AgeMagazine
All other builders 6%
Siemens 7%
Kinkisharyo 7%
Hyundai-Rotem 9%
Note: Figure includes regional rail, subways, light rail, and streetcars. Shares are based on the number ofrailcars delivered in 2006–09 and undelivered cars in progress as of January 1, 2010.
Figure 1. TopManufacturers of U.S. Railcars, by Market Share, Recent Years
Bombardier28%
Kawasaki23%
Alstom20%
* The Buy America provisions have a complicated history. The orig-inal Buy America Act was passed in 1933, and the first Buy Amer-ica provision to apply directly to transit was the Urban MassTransportation Act of 1964. The provisions were revised in the Sur-face Transportation Assistance Acts of 1978 and 1982. See U.S. Fed-eral Transit Administration, “Federal Register: Selected Buy AmericaRulemaking Documents (1981–Present),” www.fta.dot.gov/printer_friendly/leg_reg_557.html.

study by Duke University’s Center on Globalization,Governance & Competitiveness, an estimated 86 per-cent of the 153 firms identified as parts and componentsystems suppliers have their global headquarters in theUnited States; 128 of these are U.S. firms. Like themajor equipment manufacturers, these parts and com-ponents firms perform their high-value engineering intheir home countries. Only 22 firms had non-U.S.headquarters, primarily in France and Germany.6
Countries that have made significant investmentsin building their rail systems, such as France and Spain,have strong rail manufacturing industries as well.7
President Obama has cited Spain as an example ofhow to develop high-speed rail in the United States.The country’s high-speed AVE (Alta VelocidadEspañola) line between Barcelona and Madrid covers324 miles in 150 minutes and has reduced air trafficbetween the two cities by half.* Spain has been build-ing high-speed rail lines since 1992 and plans to add6,000 more miles by 2020 to network the entire coun-try.8 Spain invested $130 billion in high-speed railbetween 1992 and 2010 and plans to spend $100 bil-lion more over the next decade.9 (See Table 1.)
France’s government recently announced a trans-portation plan aimed at reducing greenhouse gas emis-sions 20 percent by 2020. Achieving this goal requireslimiting the construction of new highways, expandinga well-developed passenger rail system (adding 1,429miles of high-speed rail by 2020), and creating two
new freight-rail corridors. The country will also dedi-cate an additional $73 billion to new public fixed-guideway transportation systems.10
Recognizing the link between developing rail linesand manufacturing, China has rapidly ramped up itsspending on rail infrastructure projects. In 2001, itbegan a $132 billion project to build 1,062 miles of rail,to be completed in 2012.11 By comparison, the lasttwo U.S. transportation bills appropriated only $19billion for rail construction over approximately thesame period.12 As part of its recession recovery package,China committed $88 billion in 2009 to railway infra-structure (doubling its 2008 investment), with the goalof establishing much-needed transportation links, cre-ating 6 million jobs, and generating demand for 20million tons of domestic steel.13 China plans to spend$293 billion to meet its 2012 target of 1.1 millionkilometers of railroad, of which 13,000 kilometers is tobe high-speed rail.14
Several countries have used rail investment to sup-port other domestic industries as well. The EuropeanUnion excludes procurement activity related to railfrom World Trade Organization (WTO) rules, andCanada applies the same exclusions to both the WTOand NAFTA (the North American Free Trade Agree-ment) and also excludes the iron and steel used in railprojects. China requires the use of 70 percent domes-tic content in all public transit equipment, as well as thesigning of technology-transfer agreements between for-eign-owned companies and domestic firms for allnationally funded transportation investments.15 Simi-larly, the United States will need to adopt strongermeasures than the current Buy America provisions tosupport a domestic railcar production industry that isengaged in R&D on the latest train technologies.
As detailed in the Apollo Alliance report Make It InAmerica: The Apollo Clean Transportation Manufactur-ing Action Plan, much could be done to strengthenexisting U.S. domestic content standards. While theBuy America provisions have helped the United Statesretain a portion of its rail and bus manufacturing indus-tries, the country needs a strategy that links domestictransportation investments to greater industry growthby increasing the transparency and accountability ofexisting domestic content requirements. Among othersteps, this means introducing incentives to go beyondminimally required domestic content and making tar-
14 REVIVING THE U.S. RAIL AND TRANSIT INDUSTRY: INVESTMENTS AND JOB CREATION
* Units of measure throughout this report are expressed in miles.
Table 1. Investment in Passenger Rail in Selected Countries, Recent Years
Country Pre-2011 2011 to 2015 Country Total
billion dollars
China $89 (2004–08) $61–750* $358–1,047*$88 (2009)
$120 (2010)
Spain $130 (1992–10) $100 $260
France(fixed guideway project only) $73 (2009–12) $73
United States $8 (1998–2002) $2.1 $32$8.2 (2008)
$10.3 (2009)$3.5 (2010)
*Range varies by source.Source: See Endnote 14 for this section.

geted investments to expand the U.S. role in high-value-added research and manufacturing within thetransit industry.
The story of the transit bus industry is similar to thatof rail. Starting in the 1930s, General Motors and Flx-ible were the only two U.S. transit bus manufacturersuntil the 1970s. The Canadian company New Flyerentered the U.S. market in the early 1970s, followed inthe early 1980s by European producers such as Volvoand Scania, who were lured by the U.S. government tohelp meet the anticipated rise in demand for buses dueto the oil crisis. This demand did not materialize, and,after several rounds of mergers and acquisitions, mostof the players closed by the end of the 1980s.
Today, only five companies produce 98 percent ofU.S. transit buses.16 (See Table 2.) Only one of thefive, Gillig, does all of its product development andvehicle manufacturing exclusively in the United States;the others produce domestically only roughly what isrequired under the Buy America provisions. Accordingto the Duke University study, these five bus manufac-turers employ 2,482 people in North America (althoughestimates vary), and total employment in the globalsupply chain is between 25,000 and 33,000 jobs.17
The recent economic recession as well as fundingcrises at local U.S. transit agencies have taken a toll onrelated employment. In 2008, New Flyer had a largebacklog of new bus orders from U.S. cities, includingSeattle, Portland, Phoenix, Cleveland, and Washing-ton, D.C. But these and other cities delayed or can-celled orders when the recession hit. As a result, NewFlyer laid off 13 percent of its workforce in 2009.18
Three other U.S. bus manufacturers have also laid offworkers, and Nova, a subsidiary of Volvo that openedits first U.S. facility in 2008, is gearing up more slowlythan planned.
The Duke University analysis identifies at least 76U.S. companies that manufacture inputs to buses. Butthere has been recent consolidation in the U.S. supplychain for major component systems. Of the 10 trans-mission suppliers listed in the Duke study, for example,only one, Allison Transmissions (formerly owned byGeneral Motors), is a major supplier for transit buses.19
The supply chain for transit bus axle systems also hasonly one U.S. manufacturer, ArvinMeritor. Due to thislimited production, if U.S. transit funding were toincrease it would be difficult for bus manufacturers to
expand domestic sourcing of these critical componentsand systems.
As with passenger rail cars, the unpredictability ofdemand is a key factor in the contraction of the U.S.bus industry and provides a disincentive for manufac-turers to invest in facilities, equipment, and R&D.20
Most transit agencies do not have a regular schedule ofbus replacement or refurbishing that would allow man-ufacturers to predict order streams over a longer period.Spending on new bus vehicles (i.e., rolling stock) hasbeen irregular, making it difficult for manufacturersto anticipate demand.21 (See Figure 2).
Facing shrinking budgets, many transit agencies
15U.S. Rail and Transit Today
Table 2. U.S. Transit Bus Manufacturers, Facts and Figures
Final Assembly 2009 U.S. MarketManufacturer Location Employment Transit Bus Sales Share
(million dollars) (percent)
New Flyer St. Cloud and 2,226 850 38Crookston, MN (U.S. and Canada) (U.S. only)
Gillig San Francisco, CA n.a. 563 (est.) 25
Orion (Daimler) Oriskany, NY 585 566 25(1,324 all locations) (in 2008)
Nova (Volvo) Plattsburg, NY 250 135 6
NABI Anniston, AL n.a. 90 4
Other 45 2
Source: See Endnote 16 for this section.
1993 1996 1999 2002 2005 2008
Source: National Transit Database Reports, 2008
Percen
tCha
ngefro
mPrevious
Year
-40
-30
-20
-10
0
10
20
30
40
50
Figure 2. U.S. Capital Expenditures onTransit Bus Rolling Stock,Percent Change, 1993–2008

have had to shift funds to preventive maintenance orother critical capital investments rather than purchas-ing new buses and railcars. As a result, at least 41 per-cent of U.S. transit buses are in poor or marginalcondition, and more than half of the rail vehicles inservice need to be replaced within six years.22 At thispoint, even funding U.S. transit systems just to main-tain them at acceptable operating standards wouldachieve long-term, predictable order streams.
The Federal Transportation Administration’s 2010National State of Good Repair Assessment estimates that$13.5 billion is needed to replace U.S. buses and $16.2billion to replace U.S. railcars that have exceeded theiruseful life or whose conditions fall below the acceptableminimum threshold.23 To remedy the bus backlog andmaintain the existing fleet, annual investments of $6.8billion over six years would be needed, or a total ofalmost $41 billion. For rail, remedying the backlogand maintaining the existing fleet would require $5.8billion annually over six years, or almost $35 billion.This combined investment of $76 billion would donothing to actually expand bus and rail and meet thepent up demand for additional transit services. Address-ing the needs for both maintenance and expanded serv-ice would require even further investments.
Substantial and sustained investment is needed tosupport safe transit and manufacturing jobs in theUnited States. Although bus and railcar manufacturershave welcomed the uptick in orders created by eco-nomic stimulus funds, company representatives empha-size that short-term funding will not maintain enoughdemand to support the industry.24 The same is truefor suppliers. The Duke University analysis notes thatalthough bus manufacturers depend heavily on suppliersof key components such as engines and transmissions,the bus industry is of low importance to many suppli-ers because most of their orders come from other indus-tries. If the increased demand from bus manufacturers
is viewed as temporary, suppliers will not increase theircapacity to meet it. Similar patterns are evident in therail industry supply chain.
Another challenge for producers of both buses andpassenger railcars is that most transit agencies specifycustomized features on their orders. Customizationcan increase production costs 20–30 percent, as itrequires more engineering work and changes on theassembly line. In both the bus and rail industries, com-ponent suppliers typically solicit transit agencies directlyto promote their products, and the agencies then requestthe specific components. This highly customized order-ing process results in more expense per unit at all pro-curement levels; more time needed for funding agenciesto review proposals and approve funding; more timeneeded for manufacturers to produce the items; andincreased delivery times. If a transit agency requestsan item (such as an electronic component) that is nota proven technology, warranty costs increase as well.
The challenges of both over-customization and theunpredictability of demand can be addressed in thecontext of the U.S. transportation bill now up forreview. What the United States needs to decide iswhether it has the political will to follow the path ofother rail and transit leaders—countries that have real-ized the relationship between investment in infra-structure, manufacturing, and leading the market in theassociated technologies. The failure to make this invest-ment has put the United States behind.
But it is not too late to revitalize the nation’s rail andbus manufacturing capacity. If the United States wereto dramatically increase its investment in public tran-sit, this would not only spur greater production of rail-cars and buses, but it would also lead to significant jobcreation in these industries. It is high time for the U.S.government to consider the critical links between man-ufacturing and transportation nationwide.
16 REVIVING THE U.S. RAIL AND TRANSIT INDUSTRY: INVESTMENTS AND JOB CREATION

Setting the Context:Past and Current SpendingOver the past half-century, U.S. funding priorities fortransport infrastructure have been extremely lopsided.1
(See Figure 3.) Starting in the 1950s, the federal gov-ernment undertook massive public investments andsubsidies to build the nation’s interstate highway system.According to a recent report by the U.S. Public Inter-est Research Group (PIRG), federal highway invest-ments over three decades totaled $425 billion. Aviationhas also received significant federal support. Between1956 and 2006, PIRG notes, “the nation invested $16in the highway system and $6 in aviation for everydollar invested in rail.”2
From 1990 to 2008, U.S. mass transit funding forcapital projects and operations grew from $21 billion to$55 billion.3 (See Table 3.) Of this total, capital expen-ditures at all levels of government grew from $5 billionto $17 billion. But the federal government’s share of cap-ital funding declined from 59 percent to 40 percent.
Intercity rail funding has been meager and relatively
stagnant. The Amtrak Reform and Accountability Actof 1997–2002, passed in 1997, authorized appropria-tions for Amtrak totaling $5.2 billion for 1998 through
17Scenarios for U.S. Rail and Transit Investment
1956 1966 1976 1986 1996 2006
Source: CBO
Billion
Dollars(current
dollars)
Figure 3. U.S. Federal Spending onTransport Infrastructure, 1956–2006
0
10
20
30
40
50
60
70
Aviation
Rail
Mass Transit
Highways
Scenarios for U.S. Rail and Transit Investment
Table 3. U.S. Mass Transit Funding, Total versus Federal Share, 1990 and 2000–08
Share of Capital Federal Federal ShareCapital Operations Total Spending in Total Capital of All Capital
Year Funding Funding Funding Government Spending Assistance Funding
billion dollars (current dollars) percent billion dollars percent(current dollars)
1990 16.1 4.9 21.0 23 2.9 592000 24.2 9.6 33.8 28 4.5 472001 25.3 11.4 36.7 31 5.8 512002 26.6 12.8 39.5 33 5.2 412003 28.0 13.2 41.3 32 5.3 402004 29.7 13.2 43.0 31 5.2 392005 31.7 12.4 44.1 28 4.8 392006 33.7 13.3 47.1 28 5.8 442007 35.5 14.3 49.9 29 5.9 412008 38.0 17.4 55.4 31 7.0 40
Source: See Endnote 3 for this section.

2002, or about $1 billion annually. (The Act also gaveaccess to some $2 billion from the Taxpayer Relief Actof 1997.) Since then, however, no new multi-yearappropriations legislation for Amtrak has been passed;instead, the rail operator has received only year-to-yeargrants from the Federal Railroad Administration.
These FRA grants increased from $1.05 billion inFiscal Year 2003 to $1.35 billion in FY2006 and $1.33billion in FY2008. Other federal programs also includesmall amounts of rail-related funding.4 Except for ahandful of peaks, federal funding for Amtrak intercityrail since the early 1970s (expressed in 2009 dollars) hasnever exceeded $3.7 billion in any year.5 (See Figure 4.)Amtrak capital funds have fluctuated from $609 mil-lion in FY1999, to only $213 million in FY2003, to amore substantial $738 million in FY2010.6
Not all spending on transit goes directly to pur-chasing vehicles. However, in order to develop scenar-ios for job creation in U.S. bus and rail manufacturing*,it is necessary to estimate how much federal invest-ment goes directly to purchases of rolling stock (railcarsand buses). In 2008, 59 percent of U.S. transit capitalspending went to infrastructure and facilities, 30 per-cent to rolling stock, and 11 percent to other pur-chases.7 (See Table 4.) Rolling stock purchases grewfrom $1.3 billion in 1992 to $4.4 billion in 2002, butthen declined. Only in 2008 did funding again increase,to $5.3 billion.8
Enter ARRA
The United States is finally getting serious about pub-lic transit, but so far the level of investment pales incomparison to many European and Asian nations.9
The American Recovery and Reinvestment Act of2009 (ARRA) represents a significant one-time boostto U.S. public transportation funding. For transit andintercity rail programs combined, the act provides atotal of $17.7 billion, out of $48.1 billion overall fortransportation.10
For urban transit (both bus service and intracityrail), ARRA includes $8.4 billion for three major pro-grams: $6.9 billion for the Transit Capital AssistanceProgram, $750 million for the Fixed Guideway Infra-structure Investment Program, and another $750 mil-lion for Capital Investment Grants.11 Some $2.4 billionof these funds has gone to the purchase or rehabilita-tion of 12,136 buses, railcars, and paratransit† vans.12
On the intercity rail side, ARRA includes $1.3 bil-lion for Amtrak (so far, no new rolling stock has beenpurchased, but 96 locomotives and coaches and Amtrakfacilities have been reconditioned) and $8 billion forcapital grants for new high-speed rail (HSR) corridorsand intercity passenger rail service.13 The ARRA funds
18 REVIVING THE U.S. RAIL AND TRANSIT INDUSTRY: INVESTMENTS AND JOB CREATION
Table 4. Share of U.S. Urban Transit Spending,by Category, 2008
Share of Share of TotalCategory Capital Spending Spending
percentCapital Spending 100 31
Purchase of buses 16 5
Purchase of rail vehicles 14 4
Purchase of supportingequipment 11 4
Construction of raillines/busways 33 11
Construction ofbuildings/facilities 26 8
Operations and Maintenance — 69
Total Urban Transit Spending — 100
Source: See Endnote 7 for this section.
1970 1975 1980 1985 1990 1995 2000 2005 2010
Source: Amtrak
Billion
2009
Dollars
Figure 4. U.S. Federal Appropriations for Amtrak, 1971–2010
0
0.5
1.0
1.5
2.0
2.5
3.0
3.5
4.0
* Although increased investment in transit will create many jobs inoperations and maintenance in addition to jobs created from capi-tal investments, the focus of this report is only on manufacturing.† Paratransit systems supplement regular transit systems and are usu-ally vans that run on a regular schedule for routes not served by thesystem—sometimes on demand and sometimes for riders with spe-cial needs.

represent a welcome initial boost for efforts to create anHSR network.
Table 5 summarizes U.S. federal funding for inter-city rail in recent years, including ARRA as well as theObama administration’s request for FY2011.14 Fund-ing for high-speed rail pushes overall budgets in FY2009and 2010 to unprecedented levels. The request forFY2011 is much smaller but nonetheless provides cap-ital funding at more than triple the level in the yearsbefore ARRA; meanwhile, operating funds are some-what higher than in earlier years.15 In July 2010, theSenate Appropriations Committee voted to provideAmtrak with $1.96 billion, $196.5 million more thanthe House of Representatives’ proposed appropriationand $363 million more than the Obama administra-tion’s request.16
As welcome as ARRA’s funding for high-speed railis, it provides only a down payment for enormous pent-up demand. Pre-applications filed by 40 states and theDistrict of Columbia for HSR funding under ARRAtotaled $102 billion for 278 proposed projects, out-stripping the available sum by a factor of 12. Even afterthe states subsequently narrowed their requests to $57billion in the final round of applications, this was stillseven times the amount of money available.17
Beyond ARRA, it remains unclear how much inregular annual appropriations will be made available incoming years, and whether the crunch in transit agen-cies’ operating funds can be relieved. On the capitalinvestment side, available funding vehicles include theTransportation Infrastructure Finance and InnovationAct (TIFIA), the Transportation Innovation Generat-ing Economic Recovery program (TIGER), and theTransportation Investments Generating GreenhouseGas Emissions Reductions program (TIGGER).
Yet these measures are not sufficient to ensure sus-tained growth in the U.S. bus and rail industries. Pass-ing new comprehensive surface transportationlegislation and laying out a strong long-term visionwill be essential for creating more manufacturing jobsin these industries.
Reviving U.S. Rail and Transit:Three Investment Scenarios
Numerous reports in recent years have assessed thecondition of U.S. transit and intercity rail systems, aswell as the need for replacement, modernization, and
expansion.18 (See Table 6.) Their findings and recom-mendations have varied widely, as have their estimatesof future funding needs. It is beyond question, however,that major investments that are orders of magnitudehigher than current spending, and carried out over sev-eral decades, will be required to rise to the task.
The United States needs to dramatically increaseits investment in public transit infrastructure in orderto build a system that boosts ridership and therebyhelps to reduce congestion in metropolitan areas, lowergreenhouse gas emissions, and create much-neededmanufacturing jobs. The current level of federal spend-ing—the so-called “Business-as-Usual” scenario—isunlikely to get us there. However, two other invest-ment scenarios over and above current spending can beuseful to guide estimates of potential job creation in railand bus manufacturing. These are: a scenario ofincreased domestic investment, and a scenario of inter-national competitiveness.
Increased Domestic Investment Scenario
Under this second scenario, the goal is to double U.S.transit ridership in 20 years. To do this, the consultingfirm Cambridge Systematics estimates that the U.S.government (at all levels—federal, state, and local)would need to invest $60 billion annually.19 The fed-eral government would need to increase its share oftransit capital investments from 40 percent in 2008 to50 percent, for an annual investment of $30 billion—a level that is consistent with the upper end of the
19Scenarios for U.S. Rail and Transit Investment
Table 5. U.S. Federal Funding for Intercity Rail, Fiscal Years 2008–11
FY2011Category FY2007 FY2008 FY2009 FY2010 Request
million dollars
Capital and Debt Service Funding 772 880 10,330 3,502 2,052
Amtrak capital and debt service 772 850 940 1,002 1,052
Amtrak capital grants — — 1,300* — —
Intercity Passenger Rail Grant Program — 30 90 — —
Capital assistance to states for intercitypassenger rail (high-speed rail) — — 8,000* 2,500 1,000†
Amtrak Operating Grants 490 475 550 563 563
Total Funding 1,262 1,355 10,880 4,065 2,615
* ARRA funds.† In July 2010, the House Appropriations Transportation, Housing and Urban Development Subcommitteeapproved $1.4 billion—more than the administration’s request, but far less than the $4 billion sought in Mayby high-speed rail advocacy groups.The administration has indicated that it will ask for a total of $5 billionover five years.Source: See Endnote 14 for this section.

$21–$32 billion range of federal spending recom-mended in the studies summarized in Table 6.
Federal spending at this level would allow for aclearing of the investment backlog identified earlier aswell as an expansion of transit services. Spending $30billion annually on transit capital programs yields a
federal budget of $180 billion over six years. Table 7shows the outcome of applying the 2008 breakdown oftransit capital spending provided in Table 4 to this$180 billion figure.
Assuming that federal funding for capital projectscovers 50 percent of total U.S. mass transit spending,
20 REVIVING THE U.S. RAIL AND TRANSIT INDUSTRY: INVESTMENTS AND JOB CREATION
Table 6. Recent U.S. Transit and Intercity Rail Studies: Summary of Funding Recommendations
Report/Source Observation/Recommendation Estimates for Required Funding
URBAN TRANSITReconnecting America,October 2008
National Surface Trans-portation and RevenueStudy Commission,December 2007
National Surface Trans-portation InfrastructureFinancing Commission,February 2009
APTA/AASHTO,September 2008
Federal RailwayAdministration, April 2009
Federal TransitAdministration, NationalState of Good RepairAssessment Study,June 2010
National Surface Trans-portation and RevenueStudy Commission,December 2007
Amtrak, September 2009
Amtrak, February 2010
AASHTO, May 2008
Senate Committee onCommerce, Science andTransportation, May 2007
78 regions in 37 states have proposed 400 projects worth $248 billion.This is 35times the annual federal transit investment (2008), or 15 times the annual totalamount. (Study focused on fixed guideways only.)
a) “Medium” capital investment to maintain transit conditions (i.e., roughly equiva-lent to current spending), 2005–20b) “High” investments to bring conditions up to “Good,” 2005–20 (adding a cumula-tive 51,000–96,000 new vehicles)c) “High” investments, but for longer timeframe, 2005–55
A base-case needs forecast offers spending levels required to sustain a business-as-usual approach to federal surface transportation investment. In estimating futureneeds, the Commission relied on a Transit Cooperative Research Program (TCRP)study that used a 2.4 percent annual growth in ridership figure (i.e., actual 1995–2007 average).
Projected investment needs were calculated assuming a range of average annualridership growth rates for urbanized areas:a) 2.4 percent (the average annual growth in 1995–2007)b) 3.52 percent (needed to double ridership over 20 years)c) 4.63 percent
Assessed condition of 26,654 vehicles. Capital investment required to attain andmaintain a state of good repair for the seven largest rail transit agencies (eliminatingbacklog of $50 billion, plus annual normal replacement). Actual investment level was$5.4 billion in 2006.
Assessed condition of 111,945 vehicles. Eliminating backlog of repairs to bring thenation’s transit systems up to a state of good repair: $77.7 billion ($59.2 billion for rail;$18.4 billion for bus). Beyond the backlog, regular annual maintenance needed is$14.4 billion (actual spending is $12–13 billion).
Maintaining Amtrak operations, upgrading passenger rail service, and providing newroutes requires $357 billion of investments over a 44-year period. (Accommodateexpansion in intercity passenger rail use of 8–9 times above the current level of 5.5billion annual passenger-miles.)
Total investment in rolling stock for FY 2010–14.
To modernize its existing fleet and manage 2 percent annual growth, Amtrak will need$11 billion over 14 years, including 25 high-speed trainsets, 334 locomotives, and1,200 railcars. Amtrak currently has some 1,800 railcars, trainsets, and locomotives.
2008 Update to AASHTO’s Intercity Passenger Rail Transportation Report: need forcapital investments through 2021.
Investment needed to fund deferred maintenance and capital backlog projects toreturn the Northeast Corridor to a “state of good repair,” under which only routinemaintenance would be needed.
$248 billion total, or $41 billion/year
In 2006 dollars:a) $14–18 billion/yearb) $21–32 billion/yearc) $26-46 billion/year
In 2008 dollars:Needed to maintain: $42 billion/year($19 billion federal share)Needed to improve: $49 billion/year($22 billion federal share)
In 2006 dollars:a) $46.1 billion/yearb) $59.2 billion/yearc) $75.2 billion/year
In 2008 dollars: $14.3 billion/year(over six years)
Combined annual need:$27.3 billion/year over six years$20.9 billion/year over 12 years$18.3 billion/year over 20 years
$357 billion total—$66 billion ($7.4 billion/year)
needed to 2020—$225 billion ($9.4 billion/year)
needed to 2035
$2.5 billion over five years
Cumulative, in 2009 dollars:—$9 billion by 2020—$15.6 billion by 2030—$23 billion by 2040
$71.3 billion, or $4.8 billion/year
$5 billion total
INTERCITY AND HIGH!SPEED RAIL
Source: See Endnote 18 for this section.

the figures presented in Table 7 can roughly be doubled,so that total (federal, state, and local) mass transit cap-ital spending over six years would be $360 billion, oran average of $60 billion per year.
For intercity and high-speed rail, we propose spend-ing $10 billion annually. This is slightly more than the$8.1 billion recommended by the Passenger Rail Work-ing Group in 2007, but their lower estimate includedthe development of only one new HSR line.20 The fed-eral government is the principal funder of intercitypassenger rail.21 Assuming an 80:20 federal and statematch implies federal funds of $10 billion and addi-tional state funds of $2.5 billion. This results in a com-bined total annual investment of $12.5 billion underthe Increased Domestic Investment scenario.
International Competitiveness Scenario
The third scenario is highly ambitious and is intended toclose the large gap in rail and transit manufacturingbetween the United States and countries in Europe andAsia that are more competitive internationally in thesetwo industries.22 European countries demonstrate whatwell-developed rail and transit systems look like and offerimportant lessons; however, they may not offer the bestcomparative experience for the United States, since themain challenge for these countries is to maintain maturesystems, keep up with ridership, and upgrade whereneeded. The United States, by contrast, needs to under-take a major expansion of its rail and transit systems.
China’s experience therefore comes closer to theU.S. situation. Until recently, China’s rail and transitsystems were seriously outdated and overstretched.But the country has committed to a major investmentprogram. China is also more similar to the UnitedStates with respect to geographic size and thus thetravel distances to be bridged. TheTransportPoliticblogger Yonah Freemark has commented that, “China’sexample…demonstrates how an efficient and usefulhigh-speed rail system can be implemented in a verylarge country such as the United States.”23
An analysis of key Chinese rail and transit invest-ment figures helps paint a rough picture of what a farmore ambitious scenario for the United States mightentail.24 (See Table 8.) Although official Chinese spend-ing figures at times diverge, and precise methodologiesare not always available, it is clear from the existing datathat even the above proposal for “increased domestic
investment” in the United States is still quite modestrelative to the need to create a capable and attractivemodern public transportation system.
Table 9 shows the outcome of applying the 2008breakdown of transit capital spending provided in Table4 to this International Competitiveness scenario.Because the spending categories used in China (seeTable 8) are somewhat different from those used inthe United States, Table 9 applies the following adjust-ments to enable comparison:• The $37 billion for urban rail infrastructure is applied
to the following U.S. transit capital spending cate-gories used in Table 4: purchase of supporting equip-ment, construction of rail lines and busways, andconstruction of buildings and facilities. The fundsare divided among the three categories to mirror theapportionment in Table 4. (For example, 47 percentof the $21 billion in Table 4 equals $9.9 billion forconstruction of rail lines/busways; thus, in Table 9, 47percent of the $37 billion equals $17.4 billion.)
• The $24 billion for rolling stock purchases is appliedto urban rail and bus purchases. Again, this mirrorsthe apportionment in Table 4.
21Scenarios for U.S. Rail and Transit Investment
Table 7. U.S. Urban Transit Capital Spending Under the IncreasedDomestic Investment Scenario
Share of Capital Spending Average AnnualExpenditure Capital Spending over Six Years Capital Spending
percent billion dollars
Purchase of buses 16 28.8 4.8Purchase of rail vehicles 14 25.2 4.2Purchase of supporting equipment 11 19.8 3.3Construction of rail lines/busways 33 59.4 9.9Construction of buildings/facilities 26 46.8 7.8Total 100 180.0 30.0
Table 8. Chinese Public Investment in Intercity Rail and Transit,Recent Years and Projections
Type of Investment Year(s) Annual Amount
billion dollars
Urban rail infrastructure/construction 2001–10 292011–15 37
Passenger intercity rail infrastructure 2009 44
Rolling stock purchases 2009–10 22(intercity rail and urban metro systems)* 2011–15 24
Note: Chinese currency investment figures are converted to dollars at the rate 6.83 RMB = 1 U.S. dollar.* Unclear whether light rail systems are included.Source: See Endnote 24 for this section.
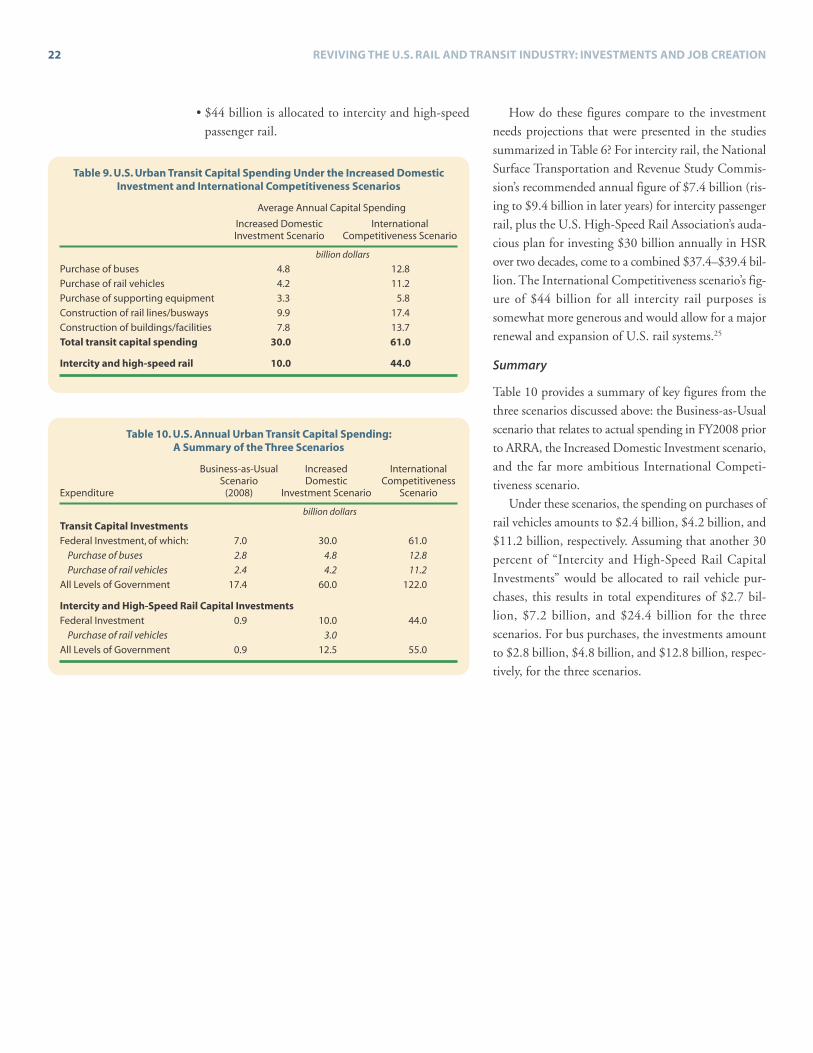
• $44 billion is allocated to intercity and high-speedpassenger rail.
How do these figures compare to the investmentneeds projections that were presented in the studiessummarized in Table 6? For intercity rail, the NationalSurface Transportation and Revenue Study Commis-sion’s recommended annual figure of $7.4 billion (ris-ing to $9.4 billion in later years) for intercity passengerrail, plus the U.S. High-Speed Rail Association’s auda-cious plan for investing $30 billion annually in HSRover two decades, come to a combined $37.4–$39.4 bil-lion. The International Competitiveness scenario’s fig-ure of $44 billion for all intercity rail purposes issomewhat more generous and would allow for a majorrenewal and expansion of U.S. rail systems.25
Summary
Table 10 provides a summary of key figures from thethree scenarios discussed above: the Business-as-Usualscenario that relates to actual spending in FY2008 priorto ARRA, the Increased Domestic Investment scenario,and the far more ambitious International Competi-tiveness scenario.
Under these scenarios, the spending on purchases ofrail vehicles amounts to $2.4 billion, $4.2 billion, and$11.2 billion, respectively. Assuming that another 30percent of “Intercity and High-Speed Rail CapitalInvestments” would be allocated to rail vehicle pur-chases, this results in total expenditures of $2.7 bil-lion, $7.2 billion, and $24.4 billion for the threescenarios. For bus purchases, the investments amountto $2.8 billion, $4.8 billion, and $12.8 billion, respec-tively, for the three scenarios.
22 REVIVING THE U.S. RAIL AND TRANSIT INDUSTRY: INVESTMENTS AND JOB CREATION
Table 9. U.S. Urban Transit Capital Spending Under the Increased DomesticInvestment and International Competitiveness Scenarios
Average Annual Capital Spending
Increased Domestic InternationalInvestment Scenario Competitiveness Scenario
billion dollars
Purchase of buses 4.8 12.8Purchase of rail vehicles 4.2 11.2Purchase of supporting equipment 3.3 5.8Construction of rail lines/busways 9.9 17.4Construction of buildings/facilities 7.8 13.7Total transit capital spending 30.0 61.0
Intercity and high-speed rail 10.0 44.0
Table 10. U.S. Annual Urban Transit Capital Spending:A Summary of the Three Scenarios
Business-as-Usual Increased InternationalScenario Domestic Competitiveness
Expenditure (2008) Investment Scenario Scenario
billion dollars
Transit Capital InvestmentsFederal Investment, of which: 7.0 30.0 61.0
Purchase of buses 2.8 4.8 12.8Purchase of rail vehicles 2.4 4.2 11.2
All Levels of Government 17.4 60.0 122.0
Intercity and High-Speed Rail Capital InvestmentsFederal Investment 0.9 10.0 44.0
Purchase of rail vehicles 3.0All Levels of Government 0.9 12.5 55.0

What impacts would significant increases in U.S. railand transit manufacturing have on job creation and thewider economy? In this section, input-output analysisis used to estimate the employment impact of increasedrail and bus production under the three scenarios pre-sented above.1 In addition, the analysis considers theemployment impacts of manufacturing a larger shareof the inputs to these industries within the UnitedStates than is currently the case.
The economic and labor-market impacts of anindustry often go well beyond their direct effects on out-put, earnings, and employment in the region, state, orlocal economy in which they are located. Industries,especially those that export their goods or services out-side of their home state, can generate important mul-tiplier effects on the rest of the state economy. Theseeffects can include indirect effects on other state indus-tries as an exporting firm buys inputs from other statefirms, as well as the induced * effects on other industriesfrom the local spending of workers and owners in theexporting industries. Knowledge of the magnitude ofthe multiplier effects of individual industries allows usto evaluate their overall contributions to the state andnational economy.
Potential Employment Impactsof Increased U.S. Passenger RailcarManufacturing
A substantial increase in U.S. investment in new pas-senger rail vehicles would primarily affect the railroadrolling stock manufacturing industry (NAICS 3365).Table 11 illustrates the direct and indirect impacts† onindustry employment under the three investment sce-narios described above, using two different estimates ofemployment.2 The estimate “with current domesticcontent” does not count the jobs used to make inputsthat are imported into the United States. The estimate“with full domestic content,” in contrast, shows the
jobs that would be needed to produce all inputs domes-tically in the United States.
Under the Business-as-Usual scenario of $2.7 billionin expenditures, the “current domestic content” estimateyields 21,098 jobs. A slight majority (56 percent) of thejobs are created directly in the railroad rolling stockindustry, and another 9,217 are indirect jobs in otherindustries. About 70 percent of all jobs created by thisinvestment would be in manufacturing.
At the two higher levels of investment, the employ-ment estimates increase substantially. The Increased
23Scenarios for U.S. Rail and Transit Employment
Table 11. Direct and Indirect Job Creation in U.S. Railcar ManufacturingUnder the Three Investment Scenarios
IncreasedBusiness- Domestic Internationalas-Usual Investment Competitiveness
Employment Scenario Scenario ScenarioMultiplier ($2.7 billion) ($7.2 billion) ($24.4 billion)
number of jobs
Employment with Current Domestic Content*Total Direct and Indirect Jobs 7.814 21,098 56,260 190,660
Direct jobs 4.400 11,880 31,681 107,362Indirect jobs 3.814 9,217 24,580 83,298
Employment with Full Domestic Content*Total Direct and Indirect Jobs 9.233 24,930 66,481 225,296
Direct jobs 4.438 11,982 31,951 108,278Indirect jobs 4.795 12,949 34,530 117,017
Net Gain from Full Domestic ContentTotal Direct and Indirect Jobs 3,832 10,221 34,636
Direct jobs 102 270 916Indirect jobs 3,732 9,950 33,719
* In current dollars.Source: See Endnote 2 for this section.
Scenarios for U.S. Rail and Transit Employment
* Induced jobs are those created elsewhere in the economy asincomes earned by employees in transit equipment manufacturingand in the transit sector are spent on goods and services.† Since the U.S. railcar production industry is fairly geographicallydispersed, this analysis uses U.S. Bureau of Labor Statistics (BLS)national multipliers; however, these multipliers allow for estimationonly of direct and indirect employment, not induced jobs. (For moreon the methodology used in this study, see Appendix on page 33.)

Domestic Investment scenario would support nearly56,260 jobs, and the International Competitivenessscenario would support more than 190,600 jobs. Theseestimates would increase even further if the industrywere 100-percent domestically produced. Almost all ofthe additional jobs gained under a 100-percent domes-tic production scenario would be in firms that supplythe railroad rolling stock manufacturing industry. Underthe two higher investment scenarios, the United Stateswould gain an additional 10,221 and 34,636 jobs,respectively, if all inputs were domestically produced.
The U.S. Bureau of Labor Statistics (BLS) providesan industry-by-industry breakdown of the indirect jobsthat would be created from increased sales in the rail-road rolling stock manufacturing industry. Based onthese data, Table 12 illustrates the 10 manufacturingindustries that would gain the largest number of jobsas a result of increased U.S. expenditures on railcars.3
These 10 industries account for 68 percent of the totaldirect and indirect jobs supported by each of the threeinvestment scenarios. Other non-manufacturing indus-tries and firms that would gain a substantive share ofindirect jobs created are wholesale trade, employmentservices firms, and professional and technical (engi-neering, law, and consulting) firms.
Since BLS data do not provide estimates for inducedjob creation, the figures in Table 12 understate thetotal economic benefit and job creation impact from
increased purchases of rail vehicles. The underestima-tion can be very substantial. Economic models sug-gest that the industry’s effect on induced job creationis about 60 percent larger than the combined effect ondirect and indirect job creation.* Thus, the totalemployment impact—direct, indirect, and induced—per year of investment would range from 33,757 jobsat current levels of spending (the Business-as-Usualscenario), to 90,016 jobs under the Increased Domes-tic Investment scenario, to a high of 305,056 jobsunder the International Competitiveness scenario.
Where would the workers in the U.S. railroad rollingstock manufacturing industry be located? Currently,the distribution of workers varies widely by geographicdivision. Due to high levels of employment in New Yorkand Pennsylvania, the Mid-Atlantic region had thehighest number of workers in 2006–08, followed by theEast North Central (or industrial Midwest), West SouthCentral, and South Atlantic divisions.4 (See Table 13.)
Potential Employment Impacts ofIncreased U.S. Bus Manufacturing
The analysis of employment in U.S. bus manufacturingrequires a slightly different approach than that for rail-car manufacturing because the bus industry is concen-trated in five states rather than being more geographicallydispersed. The U.S. Bureau of Economic Analysis (BEA)produces economic multipliers for output, employ-ment, earnings, and value added for various industriesusing a Regional Input-Output Modeling System.5 TheBEA produces only state multipliers; however, unlike theBLS multipliers, it allows for estimation of induced aswell as direct and indirect employment.†
This analysis focuses on the states in which the fiveU.S. bus manufacturers are located because BEA datado not capture out-of-state suppliers of components.Excluding these suppliers results in artificially low esti-mates of the employment impact from increased ordersof new buses. This shortcoming can be addressed byusing a BLS employment requirements matrix to con-duct a national simulation of the direct and indirect jobs
24 REVIVING THE U.S. RAIL AND TRANSIT INDUSTRY: INVESTMENTS AND JOB CREATION
Table 12. The 10 Manufacturing Subsectors that Would Gain the Most Jobsfrom Increased U.S. Railcar Purchases, Under the Three Investment Scenarios
Business- Increased InternationalManufacturing as-Usual Domestic CompetitivenessIndustry Scenario Investment Scenario Scenario
number of jobs
Railroad rolling stock (direct jobs) 11,880 31,681 107,362Architectural and structural metals 835 2,225 7,542Electrical equipment 462 1,232 4,176Machine shops; turned product;
and screw, nut, and bolt 252 671 2,274Aerospace product and parts 183 489 1,656Spring and wire product 146 389 1,320Motor vehicle parts 145 386 1,308Foundries 144 384 1,300Forging and stamping 138 368 1,246Iron and steel mills and ferroalloy 121 323 1,096
Top 10 Manufacturing Industries 14,306 38,148 129,279All Manufacturing Industries 21,098 56,260 190,660
Source: See Endnote 3 for this section.
* This induced effect estimate is conservative since it is confined tothose effects within the state. Spillover effects on other states areexcluded. Since multipliers are greater for the nation than for anyindividual state, the induced effect nationally would likely be greater.† The BEA’s economic model provides six types of multipliers: finaldemand multipliers for output, employment, earnings, and valueadded and direct effect multipliers for employment and earnings.

created under the three investment scenarios. The BLSmatrix provides more detail on the industries that willgain the highest shares of indirect jobs.
Based on the BEA tables, we allocated funding to theindustry subsections that are most directly related to themanufacturing of buses and component parts.* First,expenditures were allocated for each of the five busmanufacturers as well as the engine manufacturer Cum-mins, according to their current shares of production.(See Table 14.) (The cost of a bus engine is about 10percent of the selling price, between $40,000 and$50,000, so 10 percent of the expenditures are allocateddirectly to Cummins.†) The Increased Domestic Invest-ment scenario would lead to approximately a 70-per-cent increase in the value of orders received by eachcompany and state. The International Competitive-ness scenario would produce a nearly fivefold increasein annual bus expenditures from the current level.
Next, the BEA multipliers were applied to identifythe employment impact of increased spending on newbuses. The multipliers estimate the total number ofjobs created in each state as a result of a $1 millionincrease in sales in the heavy truck manufacturingindustry. The current analysis uses two different mul-tipliers: the “final-demand multiplier,” which includesthe direct, indirect, and induced employment effects ofeach $1 million increase in sales (or output), and the“direct-effect multiplier,” which estimates the numberof indirect and induced job created per direct job in agiven industry.‡
The final-demand multiplier ranges from lows of 6.7in New York to a high of 13.2 in North Carolina. Afinal-demand multiplier of 13.2 means that about 13jobs will be created in North Carolina from a $1 mil-lion dollar increase in sales in that state’s motor vehi-
cle parts manufacturing industry. The direct-effect mul-tiplier ranges from a low of 2.6 in New York to a highof 5.4 in Alabama. This means that 5.4 jobs are createdin Alabama’s economy for every one job created in theheavy truck manufacturing industry.76
The values of the multipliers vary across statesdepending on the relative intensity of the use of in-stateversus out-of-state suppliers and the level of wages paidto employees in the state. For example, if New York’sheavy truck manufacturing industry uses a lot of sup-pliers from other states, then the in-state indirect andinduced job creation effect will be smaller than in states
25Scenarios for U.S. Rail and Transit Employment
Table 14. Estimated Distribution of Expenditures Across the Five U.S. BusManufacturers and Cummins, Under the Three Investment Scenarios
Business- Increased Internationalas-Usual Domestic CompetitivenessScenario Investment Scenario Scenario
Company, State ($2.8 billion) ($4.8 billion) ($12.8 billion)
million dollars
New Flyer, MN 1,075 1,843 4,915Gillig, CA 767 1,315 3,507Orion, NY 515 883 2,355Nova, NY 263 451 1,203NABI, AL 179 307 819Cummins, Inc., NC 280 480 1,280Total 2,800 4,800 12,800
Table 13. Employment in the U.S. Railroad Rolling Stock ManufacturingIndustry, by Geographic Division, 2006–08
Geographic Division* States Employment
Middle Atlantic NY, NJ, PA 10,350East North Central IL, IN, MI, WI, OH 6,812West North Central IA, KS, MN, MO, NE, ND, SD 2,091South Atlantic DE, FL, GA, MD, NC, SC, VA, WV 3,348East South Central AL, KY, MS,TN 1,513West South Central AR, LA,TX, OK 5,671Mountain AZ, ID, CO, MT, NV, NM, UT, WY 1,333Pacific CA, WA, OR, AK, HI 1,576New England ME, VT, NH, MA, CT, RI —†
U.S. Total 32,722
* Based on U.S Census Bureau geographic divisions† Less than 30 adults were employed in this industry in New England.The total at the bottom of the tableincludes some New England workers.Source: See Endnote 4 for this section.
* Three U.S. industries contain firms that are engaged in either theassembly of buses and/or the making of components for bus man-ufacturers: Heavy Duty Truck Manufacturing (NAICS 336120);Motor Vehicle Body Manufacturing (NAICS 336211); and MotorVehicle Parts Manufacturing (NAICS 3363). Since the originatingorder for a bus would typically go to a firm classified in NAICS336120, this analysis focuses on this industry. The one exception isengine maker Cummins, which is the only supplier of this impor-tant and costly input; thus, the engine component of the bus orderis treated as a final order and is captured in the multipliers forNAICS 3363.† Since the BEA multipliers exclude out-of-state and out-of-regionpurchases, this analysis treats the purchase of bus engines separatelyand estimates the multiplier effect of these orders in North Carolina.The full value of the orders will still goes to the original equipmentmanufacturers.
‡ The final-demand employment and direct-effect employment mul-tipliers, respectively, for each state are: Alabama, 11.7, 5.4; California,6.8, 3.5; Minnesota, 8.1, 2.9, New York, 6.7, 2.6; North Carolina13.2, 3.5. The multipliers for the first four states are based on theheavy truck manufacturing industry. The multipliers for North Car-olina are for the motor vehicle parts manufacturing industry.
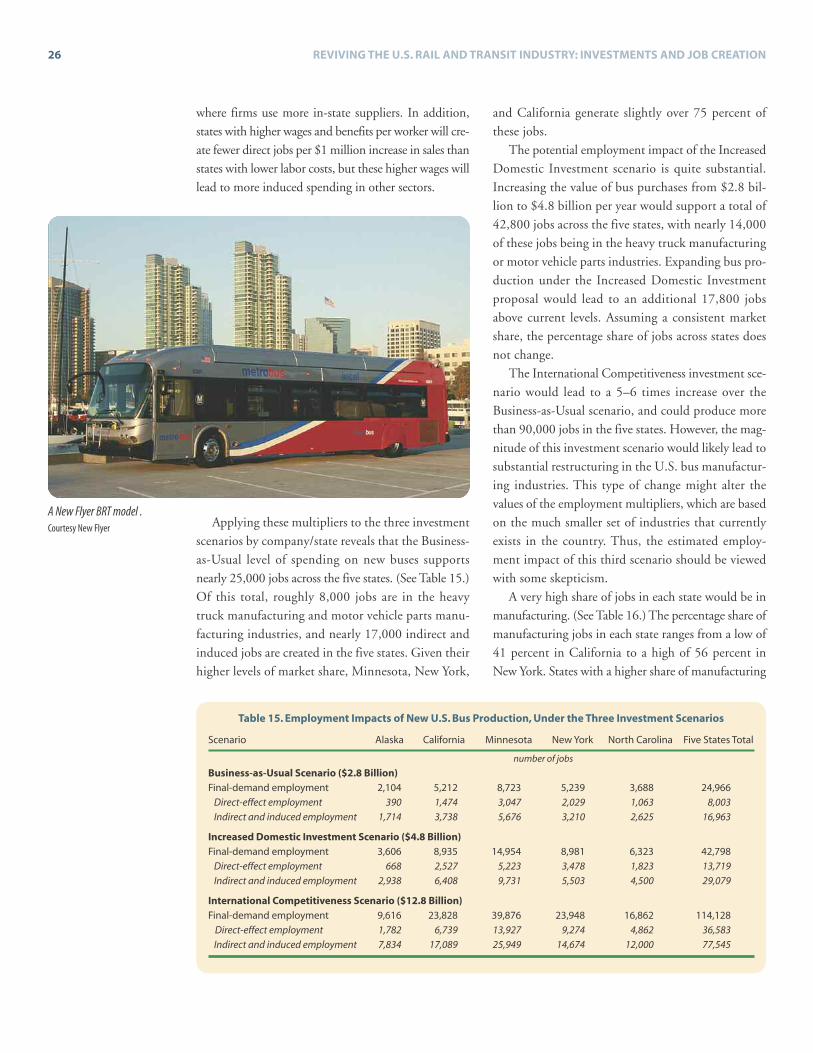
where firms use more in-state suppliers. In addition,states with higher wages and benefits per worker will cre-ate fewer direct jobs per $1 million increase in sales thanstates with lower labor costs, but these higher wages willlead to more induced spending in other sectors.
Applying these multipliers to the three investmentscenarios by company/state reveals that the Business-as-Usual level of spending on new buses supportsnearly 25,000 jobs across the five states. (See Table 15.)Of this total, roughly 8,000 jobs are in the heavytruck manufacturing and motor vehicle parts manu-facturing industries, and nearly 17,000 indirect andinduced jobs are created in the five states. Given theirhigher levels of market share, Minnesota, New York,
and California generate slightly over 75 percent ofthese jobs.
The potential employment impact of the IncreasedDomestic Investment scenario is quite substantial.Increasing the value of bus purchases from $2.8 bil-lion to $4.8 billion per year would support a total of42,800 jobs across the five states, with nearly 14,000of these jobs being in the heavy truck manufacturingor motor vehicle parts industries. Expanding bus pro-duction under the Increased Domestic Investmentproposal would lead to an additional 17,800 jobsabove current levels. Assuming a consistent marketshare, the percentage share of jobs across states doesnot change.
The International Competitiveness investment sce-nario would lead to a 5–6 times increase over theBusiness-as-Usual scenario, and could produce morethan 90,000 jobs in the five states. However, the mag-nitude of this investment scenario would likely lead tosubstantial restructuring in the U.S. bus manufactur-ing industries. This type of change might alter thevalues of the employment multipliers, which are basedon the much smaller set of industries that currentlyexists in the country. Thus, the estimated employ-ment impact of this third scenario should be viewedwith some skepticism.
A very high share of jobs in each state would be inmanufacturing. (See Table 16.) The percentage share ofmanufacturing jobs in each state ranges from a low of41 percent in California to a high of 56 percent inNew York. States with a higher share of manufacturing
26 REVIVING THE U.S. RAIL AND TRANSIT INDUSTRY: INVESTMENTS AND JOB CREATION
Table 15. Employment Impacts of New U.S. Bus Production, Under the Three Investment Scenarios
Scenario Alaska California Minnesota New York North Carolina Five States Total
number of jobs
Business-as-Usual Scenario ($2.8 Billion)Final-demand employment 2,104 5,212 8,723 5,239 3,688 24,966
Direct-effect employment 390 1,474 3,047 2,029 1,063 8,003Indirect and induced employment 1,714 3,738 5,676 3,210 2,625 16,963
Increased Domestic Investment Scenario ($4.8 Billion)Final-demand employment 3,606 8,935 14,954 8,981 6,323 42,798
Direct-effect employment 668 2,527 5,223 3,478 1,823 13,719Indirect and induced employment 2,938 6,408 9,731 5,503 4,500 29,079
International Competitiveness Scenario ($12.8 Billion)Final-demand employment 9,616 23,828 39,876 23,948 16,862 114,128
Direct-effect employment 1,782 6,739 13,927 9,274 4,862 36,583Indirect and induced employment 7,834 17,089 25,949 14,674 12,000 77,545
A New Flyer BRT model .Courtesy New Flyer

jobs in motor vehicle-related industries have strongerin-state manufacturing bases that will supply the orig-inal equipment manufacturers.
So far, this analysis has focused on the employmentimpact in the five states with bus manufacturers, sincethe BEA provides only state multipliers. Using addi-tional data from the BLS, however, allows for furtherdetail on the potential for U.S. direct and indirectemployment—both to estimate employment in a sce-nario in which domestic manufacturers fully supplyall components, as well as to provide occupational dataon the types of jobs created. As noted earlier, the trade-off is that BEA multipliers allow for estimates of theinduced employment effect, but not at a national level,whereas the BLS multipliers allow for national esti-mates, but only for direct and indirect jobs.
The national employment estimates generatedfrom the BLS multipliers are considerably lower thanthe state-based estimates. (See Table 17.) This indi-cates that investments in bus manufacturing, whichsupport relatively higher-wage jobs, will generate sig-
nificant numbers of induced jobs.The BLS does not provide separate estimates for
the heavy truck versus auto and light truck industries.The employment multipliers used are thus for theentire U.S. Motor Vehicle Manufacturing industry
27Scenarios for U.S. Rail and Transit Employment
Table 16. Distribution of Employment Impacts, by Industry, Under the Three Investment Scenarios
Industry Alaska California Minnesota New York North Carolina Five States Total
percent
Manufacturing 46.2 41.4 48.9 55.9 43.6 47.7Retail trade 7.6 7.4 6.3 5.1 8.1 6.7Wholesale trade 6.8 7.5 6.4 5.7 4.5 6.2Health care and social assistance 6.4 5.6 6.2 5.6 6.6 6.0Administrative and waste management
services 5.3 5.7 4.1 4.0 5.8 4.8Food services and drinking places 4.7 4.3 3.7 3.0 4.8 3.9Professional, scientific, and technical
services 2.9 4.0 3.1 3.2 3.7 3.4Other services* 3.4 3.2 2.9 2.6 3.3 3.0Real estate and rental and leasing 2.5 3.4 2.8 2.5 3.2 2.9Management of companies and
enterprises 2.1 3.1 2.7 2.3 4.1 2.9Transportation and warehousing* 3.3 3.1 2.8 2.0 3.2 2.8Finance and insurance 2.5 3.1 3.0 2.5 2.5 2.8Information 1.1 2.2 1.7 1.4 1.3 1.6Arts, entertainment, and recreation 0.6 1.5 1.3 1.0 1.1 1.2Educational services 1.3 1.2 1.1 1.0 1.1 1.1Construction 1.0 0.8 0.6 0.5 0.9 0.7Accommodation 0.5 0.8 0.7 0.5 0.7 0.7Households 0.5 0.6 0.7 0.5 0.8 0.6Utilities* 0.7 0.5 0.5 0.5 0.4 0.5Agriculture, forestry, fishing, and
hunting 0.5 0.3 0.5 0.1 0.5 0.4Mining 0.1 0.1 0.0 0.0 0.0 0.0Total 100 100 100 100 100 100
* The industry used for North Carolina is Motor Vehicle Parts Manufacturing.
Table 17. Estimated Employment in Motor Vehicles Manufacturing Industries,with Current versus Fully Domestic Component Content,
Under the Three Investment Scenarios
IncreasedBusiness- Domestic Internationalas-Usual Investment Competitiveness
Employment Scenario Scenario ScenarioMultiplier ($2.8 billion) ($4.8 billion) ($12.8 billion)
number of jobs
Current Domestic Component ContentTotal direct and indirect jobs 4.8 13,465 23,082 61,553
Total direct jobs 0.8 2,357 4,041 10,777Total indirect jobs 11,107 19,041 50,776
Full Domestic ContentTotal direct and indirect jobs 7.8 21,922 37,581 100,216
Total direct jobs 0.9 2,431 4,167 11,111Total indirect jobs 19,492 33,414 89,104

(NAICS 3361).* The size of the total job multiplier† forthis industry, excluding imports, was 4.8, suggestingthat $1 million of output (in current dollars) would sup-port an average of 4.8 jobs across all industries in thecountry. If stronger domestic supply chains allowedthe bus industry to be 100-percent domestically sup-ported, the size of the total jobs multiplier increases to7.8. The size of the direct job multiplier in the motorvehicle manufacturing industry was only 0.9 and 0.8,including and excluding imports, respectively. As indi-cated in Table 17, 37,581 more jobs would be gener-ated under the Increased Domestic Investment scenario,
and 100,216 more jobs under the International Com-petitiveness scenario, if the industry were 100-percentdomestically supplied.
For the Increased Domestic Investment scenario, a100-percent domestically supplied industry would cre-ate nearly 14,500 more jobs (37 percent) nationally.Nearly all of them are indirect jobs in the supply chain.
The new jobs created from investments in motorvehicle manufacturing would be spread across manyindustries, as indicated in Table 18. The left columnprovides job estimates for the industry with currentsuppliers, and the right column shows what the jobs dis-tribution would be if the industry used 100-percentdomestic suppliers.
Characteristics ofWorkers in theMotor VehicleManufacturing and Railroad Rolling StockManufacturing Industries
An analysis of worker characteristics reveals thatboth the U.S. motor vehicle manufacturing and rail-road rolling stock manufacturing industries employgroups of workers that have not fared well in the U.Seconomy in recent years.8 Males, production workers,and workers without post-secondary degrees have losta disproportionate share of jobs during the recenteconomic recession.80 Creating well-paying jobs inthe two industries would help put these workers backin jobs.
Employment in both of these industries is heavilydominated by males. (See Table 19.) The male share of
28 REVIVING THE U.S. RAIL AND TRANSIT INDUSTRY: INVESTMENTS AND JOB CREATION
Table 18. Estimated Distribution of Jobs in Top 10 Industries Created from Investment in the U.S. MotorVehicles Manufacturing Industry, 2008
Industry Share of Jobs
percent
Current Domestic Component ContentMotor vehicle parts manufacturing 17.5
Motor vehicle manufacturing 10.4
Wholesale trade 6.5
Management of companies and enterprises 4.9
Machine shops; turned products; and screw,nut, and bolt manufacturing 3.1
Motor vehicle body and trailer manufacturing 2.4
Truck transportation 2.2
Foundries 2.1
Employment services 1.9
Services to buildings and dwellings 1.9
Total Top 10 Industries 52.9
Industry Share of Jobs
percent
Full Domestic ContentMotor vehicle manufacturing 17.5
Motor vehicle parts manufacturing 16.3
Wholesale trade 11.1
Management of companies and enterprises 4.6
Motor vehicle body and trailer manufacturing 4.1
Machine shops; turned product; and screw,nut, and bolt manufacturing 2.7
Truck transportation 2.0
Employment services 1.7
Plastics product manufacturing 1.6
Foundries 1.6
Total Top 10 Industries 63.4
Table 19. Number and Gender Distribution of Employment in U.S. RailroadRolling Stock, Motor Vehicle and Motor Equipment Manufacturing,
and All Industries, 2006–08
Railroad Motor Vehicle and Share ofRolling Stock Motor Equipment Employment
Manufacturing Share of Manufacturing Share of in All U.S.Category Jobs Employment Jobs Employment Industries
number of jobs percent number of jobs percent percent
All Employed 32,722 100.0 1,338,178 100.0 100.0Male 27,996 85.6 991,890 74.1 53.5Female 4,726 14.4 346,288 25.9 46.5
Source: See Endnote 6 for this section.
* The Heavy Truck Manufacturing industry (NAICS 336120) is asubset of the Motor Vehicle Manufacturing industry (NAICS 3361).This analysis uses NAICS 3361 because the BLS data are not avail-able for sub-industries within NAICS 3361.† The BLS total employment multipliers capture only direct andindirect effects, not induced effects.

employment—86 percent in railroad manufacturingand 74 percent in motor vehicle manufacturing—isconsiderably higher than in all U.S. industries combined(53.5 percent).
Workers in the two industries also have less educa-tion than U.S. workers as a whole. Both industriesemployed a much higher share of adults with only ahigh-school diploma or GED than the national aver-age. (See Table 20.) High-school graduates and GEDholders accounted for 39–40 percent of the employedin the two industries, compared to only 28 percent ofthe total employed nationwide. Adults with only ahigh-school education have fared very poorly in thelabor market over the past decade.
The median annual earnings of railroad rollingstock manufacturing workers exceeded the medianannual earnings of all U.S. workers by slightly morethan $9,215, or 28 percent. (See Table 21.) Medianannual earnings of motor vehicle manufacturingemployees exceeded those of all U.S. workers byapproximately $10,850, or 33 percent. These manu-facturing jobs provide good wages for workers with lessthan four-year college degrees.
29Scenarios for U.S. Rail and Transit Employment
Table 20. Share of Employment in U.S. Railroad Rolling Stock, Motor VehicleManufacturing, and All Industries, by Education Level, 2006–08
Railroad Motor Vehicle and DistributionRolling Stock Motor Equipment of Employed
Educational Attainment Manufacturing Manufacturing All U.S. Industries
share of employment (percent)
Below or through grade 12,No high-school diploma 13.1 10.2 11.4
High-school diploma/GED 40.1 38.9 27.6Some college 28.6 31.2 31.3Bachelor’s degree 13.4 13.6 19.1Master’s or higher degree 4.8 6.1 10.6
Source: See Endnote 6 for this section.
Table 21. Median Annual Earnings of Workers in U.S. Railroad Rolling Stock,Motor Vehicle Manufacturing, and All Industries, by Gender, 2006–08
Railroad Rolling Stock Motor Vehicle and MotorCategory Manufacturing Equipment Manufacturing All U.S. Industries
annual earnings (dollars)
All Employed 41,754 43,385 32,539Male 42,234 48,808 38,179Female 38,504 32,539 26,478
Source: See Endnote 6 for this section.

Any economic-impact analysis is based on a variety ofeconomic and political assumptions. In this report, forexample, the substantial increase in U.S. production ofpassenger rail cars and buses that is proposed in theIncreased Domestic Investment scenario requires thatmanufacturers have unutilized capacity to meet thishypothetical demand (or that new companies will becreated). Interviews with key manufacturers indicatethat several of them have been operating below fullcapacity, and that if demand increased, they could fillit. While calling back laid-off workers and increasinghours will help companies meet demand and boostworkforce earnings, it may also lower the true employ-ment impact estimated in this analysis.
With regard to bus manufacturing, another keyassumption of this analysis is that substantially increas-ing bus orders will not alter the current market sharesof the five U.S. manufacturers, which is unlikely to bethe case if the industry expands rapidly. The employ-ment impact across states will vary considerably depend-ing on which companies win contracts for new buses.Two of the companies, New Flyer and Orion, havevery substantial Canadian manufacturing operations. Ifthese companies manufacture bus parts and compo-nents in Canada rather than in the United States, thenthe true domestic employment impact could be over-stated. This concern could become greater if their U.S.facilities reach full capacity. However, the Buy Amer-ica provisions will prevent them from importing morethan 40 percent of the parts and components of thebuses purchased in the United States with federalmonies.
The analysis of job creation under full domesticcontent assumes that it is both feasible and desirable toincrease the domestic content for rail and buses farabove and beyond their current levels. Manufacturing
advocates support increasing the Buy America provisionto higher than 60 percent, and the Obama adminis-tration has announced support for enforcing domesticpurchasing preferences on high-speed rail projectsfunded with the initial $8 billion of HSR grants thatwere part of the economic stimulus package. The esti-mates provided in this report reveal that full domesticsourcing would dramatically increase employment.
Yet interviews with industry representatives suggestthat increasing the share of domestic sourcing maypresent practical challenges on the ground. Supplychains have been developed around the 60 percentrequirement, and, already, suppliers of some key com-ponents of transit vehicles have near-monopoly power.Transit vehicle producers fear that increasing the per-centage could also increase the cost of several key inputs.Moreover, the United States no longer produces somekey components, so waiting for U.S. manufacturers togear up would slow down infrastructure development.If the country is serious about achieving a goal of greaterdomestic content, it must be equally serious aboutdeveloping the necessary supply chain and ensuringmarkets for suppliers.
As noted in the Duke University report U.S. Man-ufacturing of Rail Vehicles for Intercity Passenger Rail andUrban Transit, the current U.S. rail market has notbeen large enough to support the comprehensive sup-plier industry needed to move to full domestic supply:
The U.S. value chain includes several gaps—specific manufacturing activities that are not typ-ically performed in the United States. These gapsvary among the six target rail types. For example,a high-speed rail component may currently bemanufactured exclusively overseas, while theequivalent component for regional rail is madedomestically by several firms. Depending on the
30 REVIVING THE U.S. RAIL AND TRANSIT INDUSTRY: INVESTMENTS AND JOB CREATION
Key Assumptions About the Investment Scenariosand RealizingTheir Employment Impact

rail category, activities often performed outsidethe United States may include propulsion sys-tems, fabricated trucks, electronic systems, anddoors. Often these gap categories require complexmachinery and special skills, so companies typ-ically invest in them only in overseas locationswhere there is a stronger market.1
In essence, there is a chicken-and-egg problem.Increased domestic content requires more completedomestic supply chains, but unless there is enlargeddemand it will be difficult to call forth the supply.Raising the Buy America provision to 100 percent pres-ents special challenges. U.S. manufacturers of systemsand component parts have established cost-efficientpartnerships with manufacturers and suppliers of sub-components in other regions of the world.2 In the busindustry, these out-of-country suppliers generally pro-vide lower-technology subcomponent parts such aswheels and fasteners that have less complex manufac-turing processes than parts manufactured in the UnitedStates. These parts are ubiquitous in the global mar-ketplace, so firms often source them from regions thathave less technologically advanced manufacturingindustries and the lowest production costs, while firmsin regions with more skilled and technologicallyadvanced manufacturing industries expand their capac-ity to produce components that have a higher value-added in the product stream.3
For example, in 2009, ArvinMeritor, a U.S. com-pany that is the sole supplier of transit bus and railaxle systems, divested its wheel business to Iochpe-Maxion, S.A., a Brazilian company that produceswheels, frames, and castings for commercial vehicles andrail cars.4 The wheels are made in China by Iochpe-Maxion’s wholly owned subsidiary, Maxion (Nantong)Wheels Co. Ltd.5 Divesting low-margin manufacturingactivities can help make U.S. firms stronger interna-
tional competitors, and, by increasing firms’ bottomlines, it can contribute to creating and retaining morehigher technology living-wage jobs in the United States.
Finally, some critics have contended that othercountries might retaliate by restricting U.S. imports,so industrial goals would need to be reconciled withtrade policy.6 In fact, many of the same countries thatobject to U.S. domestic content are far more strategicin developing their own industries. If there is to be alevel playing field in international trade and indus-trial policy, then more strategic coherence is requiredon the U.S. side.
31Key Assumptions About the Investment Scenarios and Realizing Their Employment Impact
This AC Transit bus in Oakland,California, was built by VanHool with a Cummins engine.Courtesy AC Transit

The bottom line is that the United States needs tofocus on high-end manufacturing. A strategy for doingso is to link manufacturing to other policy goals. Coun-tries in both Europe and Asia have successfully linkedthe development of state-of-the-art public transit sys-tems to manufacturing. These countries are now export-ing or producing technologically sophisticated transitvehicles around the world. It is time for the UnitedStates to become a producer, rather than a consumer,of transit vehicles. But no single industry will save U.S.manufacturing—the country needs a coherent indus-trial policy.
In reports such as this one, the authors are con-strained by the boundaries of current policy debate if
they expect to be taken seriously. As a result, eventhough the above analysis indicates that the level offunding proposed under the International Competi-tiveness scenario would most forcefully accelerate thedevelopment of a strong U.S. transit industry, theless-ambitious Increased Domestic Investment level isrecommended here—and even this is an aggressivefunding scenario given the current political climate.Nevertheless, the analysis in this report plainly suggeststhat if U.S. manufacturing is to experience a seriousrevival that produces more than fragmented show-case projects and scattered jobs, public policy needsto think much bigger and more boldly than it cur-rently does.
32 REVIVING THE U.S. RAIL AND TRANSIT INDUSTRY: INVESTMENTS AND JOB CREATION
Conclusion

Input-Output Models and the RIMSModels of the U.S. Bureau of EconomicAnalysisInput-output models provide a statistical depiction ofthe inter-industry linkages within a national or stateeconomy.1 The national or state economy is divided intoa set of industries. Each industry’s output is allocatedto either other industries in the state economy or to finalsales (consumption goods and services to households,capital goods purchases by industries, government pur-chases, or exports to other states/nations).* Linkages cre-ated by sales to other industries in the state are referredto as forward linkages. Purchases of each state industryfrom other industries in the state are referred to asbackward linkages.
The data on the gross outputs of industries andthese inter-industry linkages are used to calculate amatrix of input-output coefficients (or technical coef-ficients). This set of data on gross outputs, final demandsales, and technical coefficients is used with a set ofmatrix algebra calculations to calculate the direct andindirect output requirements from each industry of thestate to produce a dollar of final sales from each indus-try. By incorporating the economic links betweenhouseholds and each industry into the input-outputmodel, we can also calculate the induced effects of anexpansion of final sales from each industry.† Theseinduced effects are brought about by the spending ofworkers in the industry on the goods and services pro-duced by other industries across the state. For example,a production worker in a bus manufacturing firm useshis salary to buy locally produced goods and services.
During the 1970s, the U.S. Department of Com-merce’s Bureau of Economic Analysis (BEA) developeda statistical methodology, known as the Regional Indus-trial Multiplier System (RIMS), to estimate regionalInput-Output (I-O) multipliers. In the 1980s, the BEAenhanced this methodology, and it became known asthe Regional Input-Output Modeling System II (RIMSII). The multipliers for industries are based on a com-plex set of I-O tables originally developed by WassilyLeontief, a contribution for which he was awarded theNobel Prize in Economics in 1973. For each industry,the I-O table shows the value of the inputs it pur-chased from other industries, the outputs it sold toother industries, and final demand. In this analysis,we primarily rely on BEA multipliers at the state level.
Input-output studies are commonly used to assessthe economic impact of specific industries on regions,states, or the nation. These include studies on the eco-nomic impacts of hospitals, colleges, pharmaceuticals,aviation, sports teams, tourism, transportation, healthcare, biotechnology, and venture capital.2
Several types of multipliers can be generated by input-output models. The first category is Type I and Type IImultipliers. Type I multipliers capture only the direct andindirect effects of a change in final demand sales, earn-ings, or employment in a given industry. For example,a Type I final demand output multiplier would capturethe direct effect of an expansion in final demand sales ofindustry “i” plus all the indirect effects via the changesin the outputs of all other industries in the state broughtabout by industry i’s purchases from other industries.
As the bus manufacturing industry increases its salesto transit agencies in the state or to agencies in otherstates and countries,‡ the industry will directly pur-
33Appendix: Methodology for Employment Projections
Appendix: Methodology for Employment Projections
* Annual gross output is the value of all revenues received from salesof the product or services plus the change in inventories. Outputproduced but not sold is part of the gross output of the industry.† Households provide both labor and capital services (cash, bonds,stocks, land) to an industry for which they receive a stream ofincome, and they purchase goods and services from industries.
‡ In a state input-output model, sales to consumers within the stateare treated as consumption expenditures under the final demandmatrix, whereas sales to consumers in other states and countrieswould be classified as export sales under the final demand matrix.

chase inputs of goods and services from other stateindustries, including itself. These industries in turnwill buy goods and services from other state industriesto produce additional inputs, which will then initiateanother cycle of inter-industry spending of increas-ingly smaller sizes.* The combined effects of these sec-ond and third round and additional rounds of spendingare the indirect effects of the increase in final demandsales of industry i. The higher the purchases by indus-try i from other state industries (i.e., these inter-indus-try backward linkages), the higher will be the size ofthese indirect effects. The value of the Type I multiplierfor a given industry is calculated by dividing the sumof the direct and indirect effects by the direct effects.(See table here.)
Type II multipliers capture the direct, indirect, andinduced effects of an expansion in final sales, earnings,or employment in a given industry. The induced effectscapture the impacts of the spending of workers in theaffected industry. When an industry expands its out-puts, it will create a stream of wages and salaries for itsworkforce and a stream of profits/interest/rents for itsowners, who will spend a portion of their incomes ongoods and services and new housing produced by otherstate industries, thereby expanding output, earnings,and employment in these other state industries.
The higher the wages and salaries of workers in theindustry, the higher their degree of residency in thestate, the higher their propensity to consume locallyproduced goods and services, and the higher the geo-graphic concentration of owners in the state, the higherwill be the size of these induced effects. All of thesedevelopments will raise the induced effects from an
expansion of final demand sales and employment,thereby increasing the value of Type II multipliers. Thevalue of the Type II multiplier for a given industry iscalculated by dividing the sum of the direct, indirect,and induced effects by the direct effect. (See table.)The higher the indirect and induced effects, the higherthe value of the Type II multiplier.
A variety of economic multipliers can be producedthrough the application of input-output analysis, par-ticularly when the I-O analysis is supplemented byearnings and employment data by industry. Amongthe types of multipliers used in economic impact stud-ies at the national, state, and local level are output,earnings, income, and employment multipliers.
The BEA has provided values of state multipliers forthree bus manufacturing and bus component manu-facturing industries:• NAICS 336120: Heavy Duty Truck Manufacturing• NAICS 336211: Motor Vehicle Body Manufacturing• NAICS 3363: Motor Vehicle Parts Manufacturing
Estimating the Overall EmploymentImpacts of Changes in Employment in U.S.Motor Vehicles Manufacturing IndustriesUsing the U.S. Bureau of Labor Statistics’National Employment Matrix
In estimating its 10-year employment projections, theU.S. Bureau of Labor Statistics (BLS) makes manyassumptions regarding the economic performance of thenational economy and key demographic trends, includ-ing population and labor force growth. These assump-tions include projected trends in current and real grossdomestic product, personal income and its disposition,federal/state/local government receipts and expendi-tures, foreign trade, employment, hours of work, laborforce and labor force participation rate, productivity,costs, and prices.
To generate employment projections, BLS relies oninter-industry relationships data, also known as input-output data (the I-O matrix), to estimate final demandand value-added data and the employment multipli-ers. According to the BLS, “the input-output datashow the flow of commodities from productionthrough intermediate use by industries and purchasesby final users.”3 Using the I-O matrix, the BLS gen-erates an employment multipliers matrix for 202 X202 industries at the national level. These multipliers
34 REVIVING THE U.S. RAIL AND TRANSIT INDUSTRY: INVESTMENTS AND JOB CREATION
* In input-output models, the size of the direct and indirect require-ments from each industry to produce a dollar of gross output fromindustry i are estimated by inverting the [I – A] matrix of coeffi-cients where A is the technical coefficients matrix and I is the iden-tity matrix.
Formulas for the Two Types of Multipliers inInput-Output Analysis
Type I Multiplier = Direct + Indirect Effects
Direct Effects
Type II Multiplier = Direct + Indirect + Induced Effects
Direct Effects

are estimated in two different ways: including andexcluding imports.
The BEA multipliers in the previous sectionexcluded imports. Another key difference is that theBLS industries are more aggregated than the ones usedby the BEA. The BEA produces various multipliers for406 NAICS industries versus the 202 industries avail-
able from the BLS. As a result, our analysis is con-ducted for the motor vehicle manufacturing industry,which includes heavy truck and auto and light truckmanufacturing. A third distinction is that unlike theBEA multipliers, which include induced effect multi-pliers, the BLS does not produce employment multi-pliers that incorporate induced spending effects.
35Appendix: Methodology for Employment Projections
Linking U.S. Manufacturing and Transportation
1. U.S. Congress, Office of Technology Assessment, U.S Passen-ger Rail Technologies (Washington, DC: 1983), p. 7.
2. “Remarks of Senator Barack Obama: A Metropolitan Strategyfor America’s Future,” Speech at the U.S. Conference of May-ors (Miami, FL: 21 June 2008).
3. The Manufacturing Institute, The Facts about Modern Manu-facturing, 8th edition (Washington, DC: 2009).
4. Andrew Sum et al., The Deep Depression in Blue Collar LaborMarkets in the U.S. Their Implications for Future EconomicStimulus and Workforce Development Policies (Boston: North-eastern University Center for Labor Market Research, 2009).
5. See, for example: Gary P. Pisano and Willy C. Shih, “RestoringAmerican Competitiveness,” Harvard Business Review,July/August 2009; Richard McCormack, “The Plight of Amer-ican Manufacturing,” The American Prospect, December 2010;President’s Council of Advisors on Science and Technology,Sustaining the Nation’s Innovation Ecosystems: Report on Infor-mation Technology Manufacturing and Competitiveness (Wash-ington, DC: January 2004).
6. Joan Fitzgerald, “Losing Our Future,” The American Prospect,December 2009.
7. Joan Fitzgerald, Emerald Cities: Urban Sustainability and Eco-nomic Development (New York: Oxford University Press,2010).
U.S. Rail and Transit Today
1. U.S. Congress, Office of Technology Assessment, U.S Passen-ger Rail Technologies (Washington, DC: 1983), p. 7.
2. Jonathan Feldman, “From Mass Transit to New Manufactur-ing.” The American Prospect, March 2009.
3. Ibid.
4. Thomas O. Boucher, Stability of Public Financing and Re-industrialization in Rail Car Manufacture, Working Paper(New Brunswick, NJ: Rutgers University Department ofIndustrial and Systems Engineering, 2004), p. 3.
5. Marcy Lowe et al., U.S. Manufacture of Rail Vehicles for Inter-city Passenger Rail and Urban Transit (Durham, NC: DukeUniversity Center of Globalization, Governance & Competi-tiveness, 2010). Figure 1 from Railway Age Magazine datasetsfrom 2007–10, cited in Lowe et al., idem.
6. For details on rail supply chain firms, products, and locations,see Marcy Lowe, Bengu Aytekin and Gary Gereffi, PublicTransit Buses: A Green Choice Gets Greener (Durham, NC:Duke University Center of Globalization, Governance &Competitiveness, 2009).
7. Michael Renner and Gary Gardner, Global Competitiveness inthe Rail and Transit Industries (Washington, DC: WorldwatchInstitute, 2010).
8. Siemens Industry, Inc., “High Speed Rail Reference Projects,”www.usa.siemens.com/industry/us/hsr-portal/hsr-reference-projects.html, viewed 3 May 2010; RailEurope, “Spain – Routesand Trains,” www.raileurope.co.uk/default.aspx?tabid=1856,viewed 3 May 2010; “AVE High-Speed Rail Network, Spain,”www.railway-technology.com/projects/spain, viewed 3 May2010.
9. “AVE High-Speed Rail Network, Spain,” op. cit. note 8;“Speech by the President of the Government During the Pres-entation of the Extraordinary Infrastructure Plan” (Madrid: 7April 2010). Table 1 from the following sources: Renner andGardner, op. cit. note 7; “AVE High-Speed Rail Network,Spain,” op. cit. note 8; “China, 2012: China Building World’sLargest High-speed Rail Network,” Xinhua News Agency, 4March 2010; “High-speed Rail Network Set to Take GlobalLead,” China Daily, 8 January 2010; “13,000km by 2012:High-Speed Railway Outplaces Regional Air Services,” XinhuaNews Agency, 26 March 2010; U.S. Department of Transporta-tion (DOT), DOT Pocket Guide to Transportation 2010, Table1-1, at www.bts.gov/publications/pocket_guide_to_transportation/2010/html/table_01_01.html; ARRA funding fromDOT, “President Obama, Vice President Biden to Announce$8 Billion for High-Speed Rail Projects Across the Country,”press release (Washington, DC: 28 January 2010); DOT,American Recovery and Reinvestment Act of 2009: Agency WideRecovery Plan, 15 May 2009, at www.dot.gov/recovery/docs/090520dotarraplan.htm.
10.Yonah Freemark, “Putting the American Commitment toHigh-Speed Rail in Context,” TheTransportPolitic.com, 28July 2010.
11.Statistics from China Security Journal, cited in “China BuildingWorld’s Largest High-speed Rail Network,” Xinhua NewsAgency, 4 March 2010; “High-speed Rail Network Set to TakeGlobal Lead,” op. cit. note 9; Patil Reshma, “China Rail Racesas Economy Slows,” Hindustan Times, 19 January 2009.
12.U.S. Federal Highway Administration, TEA-21 – Transporta-tion Equity Act for the 21st Century, “Fact Sheet,” 14 Septem-ber 1998, at www.fhwa.dot.gov/tea21/factsheets/trcap.htm.
13.Keith Bradsher, “China Sees Growth Engine in a Web of FastTrains,” New York Times, 12 February 2010.
14.See Edward Bernton, “Retooling Detroit: Fixing a Failure ofFinance or Imagination?” TheGlobalist.com, 16 March 2009;“China’s Rail Development on Faster Track,” Xinhua NewsAgency, 26 December 2009.
15.Canadian Manufacturers & Exporters, Renewing Canada’sInfrastructure: An Opportunity to Invest in Our Future (Ottawa,ON: February 2008).
16.Table 2 compiled by authors from interviews with bus manu-facturers, publicly available corporate financial statements, andcompany websites.
36 REVIVING THE U.S. RAIL AND TRANSIT INDUSTRY: INVESTMENTS AND JOB CREATION
Endnotes

17.Lowe, Aytekin, and Gereffi, op. cit. note 6.
18. Ibid., p. 21.
19.GM divested Allison Transmissions to private equity firms TheCarlyle Group and Onex Corporation for a reported $5.6 bil-lion in a deal that closed in August 2007, per Adrienne Selko,“GM Sells Allison Transmission,” IndustryWeek, June 2007,and “GM Closes $5.6 Billion Sale of Allison Transmission,”Reuters, 7 August 2007.
20.Author interviews with bus manufacturers and major systemsmanufacturers, May and June 2010.
21.Figure 2 from U.S. Federal Transit Administration (FTA),National Transit Database, Historical Data Files, “TS3 – Usesof Capital Funds, Capital Expenditures Time-Series 1992–2008, www.ntdprogram.gov/ntdprogram/data.htm, viewed 6June 2010.
22.FTA, 2010 National State of Good Repair Assessment (Washing-ton, DC: 2010), Exhibit 1-4, at www.fta.dot.gov/documents/National_SGR_Study_072010%282%29.pdf.
23. Ibid, p. 19.
24.Author interviews with bus manufacturers, May and June2010.
Scenarios for U.S. Rail and Transit Investment
1. Figure 3 from Congressional Budget Office, Trends in PublicSpending on Transportation and Water Infrastructure, 1956 to2004 (Washington, DC: August 2007). For spending figuresto 2006, see data tables at www.cbo.gov/ftpdocs/85xx/doc8517/SupplementalTables.xls.
2. U.S. PIRG Education Fund, The Right Track: Building a 21stCentury High-Speed Rail System for America (Washington, DC:9 February 2010), pp. 6–7. A different source estimates thatthe total construction cost of the interstate highway system,through 1995, was $58.5 billion in 1957 dollars, which trans-lates into $358 billion in 2008 dollars. See Wendell Cox andJean Love, 40 Years of the U.S. Interstate Highway System: AnAnalysis, prepared for the American Highway Users Alliance(Washington, DC: June 1996).
3. Table 3 from the following: Cambridge Systematics, Inc.,“State and National Public Transportation Needs Analysis,”prepared for American Public Transportation Association(APTA) and American Association of State Highway andTransportation Officials (AASHTO) (Bethesda, MD: 9 Sep-tember 2008), p. 18; APTA, 2010 Public Transportation FactBook (Washington, DC: April 2010), Table 20, and AppendixA: Historical Tables, Tables 35–37.
4. AASHTO, Passenger Rail Needs in the United States. Fundingand Finance through 2015 (Washington, DC, May 2008), pp.2, 6–7.
5. National Association of Railroad Passengers, “Federal Fundingfor Amtrak Capital Investment,” www.narprail.org/cms/index.php/main/printable/cap, viewed 27 January 2010. Figure 4from Amtrak Government Affairs, March 2010, e-mail com-munication with Scott Leonard, 2 July 2010.
6. Amtrak Government Affairs, February 2010, e-mail communi-cation with Scott Leonard, 21 July 2010.
7. In 2000, the breakdown was 56 percent, 33 percent, and 11percent, respectively. See APTA, op. cit. note 3, Table 36.“Other” category includes furniture, equipment that is not anintegral part of buildings and structures, shelters, signs, andpassenger amenities (e.g., benches) not in passenger stations.Table 4 derived from data in idem, Tables 16 and 20.
8. Ibid.
9. See Michael Renner and Gary Gardner, Global Competitivenessin the Rail and Transit Industries (Washington, DC: World-watch Institute, 2010).
10.U.S. House of Representatives, Committee on Transportationand Infrastructure, “Hearing on ‘Recovery Act: ProgressReport for Infrastructure Investments’” (Washington, DC: 26July 2010), p. 3.
11.Federal Transit Administration (FTA), “ARRA Transit Pro-grams,” www.fta.dot.gov/index_9440_9917.html.
12.U.S. House of Representatives, Committee on Transportationand Infrastructure, op. cit. note 10, p. 4.
13.Federal Railway Administration (FRA), “Rail ProgramsFunded under the American Recovery and Reinvestment Act(ARRA) of 2009 Public Law 111-5” (Washington, DC: 13March 2009); Amtrak reconditioning from U.S. House ofRepresentatives, Committee on Transportation and Infrastruc-ture, op. cit. note 10, p. 5.
14.Table 5 from Ibid.
15.FRA, “Budget Estimates Fiscal Year 2011,” www.dot.gov/bud-get/2011/budgetestimates/fra.pdf; see also earlier budget docu-ments. Jason Plautz, “Transportation: House Plan Would CutHigh-speed Rail Funding, Make Room for Livability,” E&ENews, 2 July 2010.
16. “Senate Committee Ups Amtrak Appropriation, Cuts High-Speed Rail Funding,” ProgressiveRailroading.com, 23 July2010.
17.U.S. PIRG Education Fund, op. cit. note 2, p. 17.
18.Table 6 based on the following sources: Reconnect America,“Jumpstarting the Transit Space Race,” press release (Oakland,CA: 15 October 2008); Transportation for Tomorrow: Report ofthe National Surface Transportation Policy and Revenue StudyCommission (Washington, DC: December 2007), pp. 40-10 to4-11, 4-20 to 4-21; National Surface Transportation Infra-structure Financing Commission, Paying Our Way: A NewFramework for Transportation Finance (Washington, DC: Feb-ruary 2009), p. 53; Cambridge Systematics, Inc., op. cit. note3, p. 13; FTA, 2010 National State of Good Repair Assessment(Washington, DC: 2010), pp. 3, 7, 20; FRA, Rail Moderniza-tion Study. Report to Congress (Washington, DC: April 2009),pp. 1–2; National Railroad Passenger Corporation (Amtrak),FY2010-2014 Five Year Financial Plan (Washington, DC: 23September 2009), p. 25; Amtrak, Amtrak Fleet Strategy. Build-ing a Sustainable Fleet for the Future of America’s Intercity andHigh-Speed Passenger Railroad (Washington, DC: February2010), pp. 5, 30–31; Angela Greiling Keane, “Amtrak Plans$11 Billion of Train Equipment Purchases,” Business Week, 4February 2010; AASHTO, Passenger Rail Needs in the UnitedStates. Funding and Finance through 2015 (Washington, DC:May 2008), p. 13; Report of the Committee on Commerce, Sci-ence and Transportation on S.294, Passenger Rail Investment andImprovement Act of 2007, Senate Report 110-67 (Washington,DC: 22 May 2007), p. 4.
19.Cambridge Systematics, Inc., op. cit. note 3.
20.Passenger Rail Working Group, Vision for the Future: U.S.Intercity Passenger Rail Network through 2050, prepared forCommissioner Frank Busalacchi, National Surface Transporta-tion Policy and Revenue Study Commission (Washington,DC: December 2007).
21.The 80:20 split slightly increases the state share noted in a2002 report that put annual federal funding for Amtrak at
37Endnotes
$1.3 billion and state contributions at $223 million—equiva-lent to about 15 percent of federal funds, per AASHTO,Standing Committee on Rail Transportation, Intercity Passen-ger Rail Transportation 2002, Corridor Profiles (Washington,DC: 2002), pp. 62–148.
22.Renner and Gardner, op. cit. note 9.
23.Yonah Freemark, “High-Speed Rail in China,” TheTransport-Politic.com, 12 January 2009.
24.Table 8 compiled from a broad variety of sources, includingmost prominently: Research in China, China Railway Equip-ment Industry Report, 2009; “Chinese Urban Rail TransitMileage Will Reach 1,500 Kilometers by the End of 2010,” 13December 2009, at www.prlog.org/10450309-chinese-urban-rail-transit-mileage-will-reach-1500-kilometers-by-the-end-of-2010.html; “High-speed Railway Accounts for Over Half ofChina’s Railway Investment,” People’s Daily Online, 27 April2010; Ken Ho, “All Aboard the China Express,” 16 March2010.
25. “Kunz Urges US to Build High-Speed Network,” InternationalRailway Journal, www.railjournal.com.
Scenarios for U.S. Rail and Transit Employment
1. For more on the methodology used in this section, see theAppendix on page 33.
2. Employment multipliers in Table 11 from U.S. Bureau ofLabor Statistics (BLS). For an explanation of the types ofestablishments included in this industry code, see U.S. CensusBureau, “2007 NAICS Definitions: 336510 Railroad RollingStock Manufacturing,” www.census.gov/naics/2007/def/ND336510.HTM.
3. Table 12 based on data from BLS, ibid.
4. Table 13 is an author calculation based on data from AmericanCommunity Surveys (ACS), public use files, 2006–08. TheACS survey is a national household survey that has been con-ducted annually by the U.S. Census Bureau since 2000. Thenational ACS surveys in 2005, 2006, and 2007 combinedyielded questionnaires from nearly 9 million households acrossthe country. The survey collects information on the demo-graphic and socioeconomic characteristics of household mem-bers, labor force status at the time of the survey, and labormarket experiences in the prior calendar year, including weeksand hours of employment, annual earnings, industry ofemployment, occupation, and personal and household income.
5. See U.S. Bureau of Economic Analysis (BEA), “RegionalInput-Output Modeling System (RIMS II),” www.bea.gov/regional/rims/index.cfm.
6. Ibid.
7. Estimates of the number and characteristics of personsemployed in railroad rolling stock and motor vehicle manufac-turing in the United States are based on the findings of theACS for calendar years 2006, 2007, and 2008.
8. For a review of the impacts of the Great Recession on blue-col-lar workers, see Andrew Sum, Ishwar Khatiwada, and JosephMcLaughlin, “The Great Recession of 2008-2009 and theAccompanying Blue Collar Depression: They Can’t Make ItHere Anymore,” Challenge, July/August 2010.
Key Assumptions About the Investment Scenarios andRealizing Their Employment Impact
1. Marcy Lowe et al., U.S. Manufacture of Rail Vehicles for Inter-city Passenger Rail and Urban Transit (Durham, NC: DukeUniversity Center of Globalization, Governance & Competi-tiveness, 2010).
2. Corroborated by a major supplier of U.S. transit bus parts, pera personal interview of 24 May 2010.
3. C.A. Hidalgo and R. Hausmann, “The Building Blocks ofEconomic Complexity,” Proceedings of the National Academy ofSciences, vol. 106, no. 26 (2009), pp. 10570–75; C.A.Hidalgo, The Dynamics of Economic Complexity and the Prod-uct Space over a 42 Year Period, Working Paper (Cambridge,MA: Center for International Development, Kennedy Schoolof Government, Harvard University: 2010).
4. ArvinMeritor, Inc., Annual Report (Troy, MI: 11 December2009).
5. Iochpe-Maxion, S.A. Web site, http://iochpe.mediagroup.com.br/eng/institucional/index.asp; Maxion Nangton Wheels Co.Ltd. Web site, www.maxionwheels.com.cn/web/en/about.php.
6. See, for example, Mark Reutter, “Is 100% American Contentthe Best Route for High-Speed Rail?” ProgressiveFix.com, 14June 2010.
Appendix: Methodology for Employment Projections
1. For an introduction to input-output analysis and its applica-tions to state and regional economies, see M. Javin Emersonand F. Charles Lamphere, Urban and Regional Economics:Structure and Change (Boston: Allyn and Bacon, Inc., 1975),Walter Isand et al., Methods of Interregional and RegionalAnalysis (Brookfield, VT: Ashgate Publishing, 1998), andWassily Leontief, Input-Output Economics, 2nd Ed. (New York:Oxford University Press, 1986).
2. See Ernst and Young Economics Consulting and QuantitativeAnalysis, The Economic Contributions of the BiotechnologyIndustry to the U.S. Economy, Prepared for the BiotechnologyIndustry Organization (Washington, DC: February 2000);The Campbell-Hill Aviation Group, Inc., Commercial Aviationand the American Economy, Prepared for the Air TransportAssociation of America (Washington, DC: March 2006);Global Insight Inc., Venture Impact: The Economic Importanceof Venture Capital Backed Companies to the U.S. Economy, Pre-pared for National Venture Capital Association (Arlington,VA: 2007); American Hospital Association, Beyond HealthCare: The Economic Contribution of Hospitals (Chicago, IL:2006); Capital District Regional Planning Commission, Eco-nomic Impact of Skidmore College on Saratoga County (Albany,NY: April 2007); The Boston Consulting Group, MassBiotech2010: Achieving Global Leadership in the Life-Sciences Economy,Prepared for Massachusetts Biotechnology Council (Boston:2002); Tim Lynch, Florida High Speed Ground TransportationEconomic Benefit and Cost Impact Restudy & Public Transporta-tion Financing and Subsidies by Mode in the United States (Tal-lahassee, FL: Econometrics Consultants, Inc., August 2002).
3. U.S. Bureau of Labor Statistics, Employment Projections: 2008–2018 (Washington, DC: December 2009).
38 REVIVING THE U.S. RAIL AND TRANSIT INDUSTRY: INVESTMENTS AND JOB CREATION
Streetcar in Portland, Oregon.TFoxFoto