australian unconventional oil & gas - empire energy
TRANSCRIPT

Australian Unconventional Oil & Gas
Time to Ride the Wave September 2013

Australian Unconventional Oil & Gas September 2013
Contents
Summary 1
Huge Potential Shale Gas Resources 6
Lessons from the US Shale Gas Industry 8
Australia’s Shale Geology 12
Domestic Gas Prices 17
Shale Gas Development Challenges 22
Consolidation 24
Valuation 25
Companies 34
Company Analyses 35
Beach Energy 36Senex Energy 62Drillsearch Energy 82Cooper Energy 100Strike Energy 120Armour Energy 134Buru Energy 154New Standard Energy 170
Other Australian Shale Gas Companies 185
Blue Energy 186Central Petroleum 187Empire Energy Group 188Empire Oil & Gas 189Falcon Oil & Gas 190Icon Energy 191Lakes Oil NL 192Linc Energy 193Norwest Energy 194PetroFrontier Corp 195Santos Ltd 196Tamboran Resources 197
Appendix 1 — Queensland LNG Projects 198
Appendix 2 — Australian Acquisitions, Mergers and Farm-in Valuations 205
Appendix 3 — Australian Unconventional Wells 211
Appendix 4 — A Brief History of the US Unconventional Gas and Liquids Industry 214
All prices in this document are as of 28 August 2013
Stuart Amor +44 (0)20 3440 6826 [email protected]
Emily Ashford +44 (0)20 3440 6821 [email protected]

Australian Unconventional Oil & Gas September 2013 1
Summary
We believe that the US shale gas revolution is about to hit Australia’s shores. In this report we initiate on seven stocks (with one previously covered stock) that we think are well placed to ride this approaching wave. The eight stocks covered in this report are either leading Australia’s shale/tight gas appraisal projects or have share prices that have significant leverage to shale/tight gas success. We also find that our BUY/SPECULATIVE BUY recommendations on six of these companies can be attributed to two other main themes:
Beach Energy and Drillsearch Energy — An underappreciation of the value of current Cooper Basin conventional gas reserves and resources. Historically, East Coast gas has been sold for prices well below A$5/GJ. We forecast that East Coast gas prices will rise to LNG net-back levels of ~A$8/GJ as the three Gladstone LNG projects come on-stream over the next couple of years. Current Cooper Basin conventional gas is at the high end of the East Coast’s gas supply curve, making its value very sensitive to gas prices. We believe that the prices of both Beach and Drillsearch are yet to reflect this uplift.
Armour Energy, Buru Energy, Strike Energy and New Standard Energy — A large valuation discount for pure exploration companies. Over the last two years the share prices of all petroleum exploration companies that we cover have seen widening discounts to their bottom-up risked net asset value. This is because equity markets have shunned risk, particularly funding risk. We believe markets and risk aversion are cyclical and that this funding risk discount is likely to diminish on a 1-2 year timescale.
Table 1: Australian E&P Companies — Ratings and Fair Values
Rating Fair Value (A$) Share Pri (A$) Mkt Cap (A$m)
Beach Buy 2.07 1.35 1,714
Senex Hold 0.73 0.72 822
Drillsearch Buy 1.81 1.34 572
Cooper Hold 0.45 0.45 148
Strike Spec Buy 0.123 0.098 69
Armour Spec Buy 0.74 0.35 105
Buru Spec Buy 2.04 1.67 492
New Standard Spec Buy 0.31 0.145 44
Source: RFC Ambrian estimates
We believe that Australia’s shale/tight gas production should take off over the next few years. We outline the reasons for this below.
Serious money is being invested in shale/tight gas resource appraisal in Australia’s onshore basins. A couple of hundred million dollars has already been spent and several hundred more are planned.
Major oil companies are starting to invest. Witness the Cooper and Canning basin farm-ins by Chevron, QGC (BG), ConocoPhillips and Mitsubishi over the last few years.
Australia’s gas prices are at, or will approach over the next few years, LNG net-back levels, which should kick start shale/tight gas projects.
Each of Australia’s three gas markets has LNG plants with spare plots for future LNG trains that could use substantial (multi-Tcf) shale/tight gas reserves should they become available.
Time to ride the wave

Australian Unconventional Oil & Gas September 2013 2
The potential size of Australia’s shale gas resources is truly enormous, albeit highly uncertain. A 2013 US Energy Information Administration (EIA) sponsored report of world shale oil/gas assessed that the risked, technically recoverable shale resources from just six of Australia’s basins are 437Tcf of gas and 17.5Bbbl of oil. AWT International recently estimated that the best estimate recoverable prospective gas resources from 16 basins are ~1,400Tcf of gas. To put this into perspective, proved conventional gas reserves were 132.8Tcf of gas at the end of 2012 according to BP’s statistical review.
US shale gas production averaged 28.6Bcfpd in 2012, up from just 1.23Bcfpd a decade before. In 2012 shale gas accounted for around 40% of US gas consumption. However, the success of the US shale industry has not been repeated outside North America. We took a long hard look at the development of the US shale gas and tight gas industry (see Appendix 4 for a brief history of this) to identify factors that allowed the industry to thrive. We believe that several factors were important in generating the right conditions to allow US shale gas production to flourish. These were:
suitable shale geology;
relatively high gas prices to kick start the industry;
a competitive oil and gas services market to help drive down costs;
relatively extensive petroleum infrastructure; and
a favourable regulatory and tax environment.
We have then assessed how Australia’s nascent shale/tight gas industry stacks up against these factors. Our conclusion is that Australian shale gas production is likely to grow fast over the next few years should the shale geology prove amenable. Gas prices are either at or are heading towards LNG net-back levels, which we believe should be sufficient to kick start the commercial production of shale gas. While Australia’s petroleum services market and infrastructure are not as developed as in the US, the huge scale of the potential shale gas prize should see these obstacles overcome. Some potential shale gas basins do have substantial gas infrastructure. We see the oil and gas industry regulatory and tax environment in Australia as relatively benign.
While many of Australia’s potential shale gas basins lack significant pipeline and processing infrastructure, this is not true of the Cooper Basin (or the Perth Basin). The Cooper Basin has produced over 6Tcf of gas since 1969 and it already has two large processing plants and trunk pipeline connections to major East Coast demand centres. In our view, this gives shale/tight gas projects in this basin a significant advantage over similar projects in other basins, as it should allow the quick tie-in and commercialisation of small pilot projects. It is no surprise that the majority of shale/tight gas wells to date have been drilled here.
In our view, the biggest uncertainty surrounds the nature of Australia’s shale geology in each basin and whether the gas-saturated shales present will allow commercial well flow rates and Estimated Ultimate Recoveries (EURs). The uncertainty is high as the US experience has shown that shale gas well performance is highly variable (even within the same shale gas play sweet spot) and not enough wells have been drilled in potential Australian shale plays to be able to estimate average EURs with any certainty. This is starting to change.
In the Nappamerri Trough in the Cooper Basin, Beach and joint-venture partner Chevron have drilled 12 vertical unconventional targeted wells and one horizontal well in PEL 218 and ATP 855P, targeting both a shale play and a basin-centred tight gas play.
Australia’s shale gas prize is huge
Factors that allowed the US shale gas industry to thrive…
… are mostly present in Australia
Current gas infrastructure gives the Cooper Basin an advantage
The greatest uncertainty is whether Australian shales can be completed to give commercial well flow rates and EURs
The number of Australian shale/tight gas wells flow tested is about to rise dramatically
Australian Unconventional Oil & Gas September 2013 3
They are in the process of hydro-fracturing and flow testing each well to judge how different well designs and completions perform. Five of these wells have been fracture stimulated to date and we know the (promising) results from four of these. Next door in ATP 940P, Drillsearch, and joint-venture partner QGC (BG) plan to start a four-well unconventional campaign at the end of this year. Senex and the Santos-operated SACB JV are both proceeding with multi-well unconventional appraisal campaigns. Santos has even tied in its unconventional Moomba-191 well to the nearby gathering pipelines and has been producing (limited quantities of) shale gas since October last year. Senex has flowed gas from a deep coal seam in PEL 90.
Shale and tight gas wells are not confined to the Cooper Basin. In the South Nicholson Basin, Queensland, Armour has drilled a lateral well in the Lawn Hill shale and plans to perform an eight-stage hydraulic stimulation treatment, followed by a flow test, in the next couple of months. Norwest Energy has already performed a promising multi-stage hydro-fracture and flow test of its Arrowsmith-2 well in the Perth Basin. In the Canning Basin, Buru Energy plans to hydro-fracture and flow test five already-drilled Laurel Formation tight gas wells by the end of 2014.
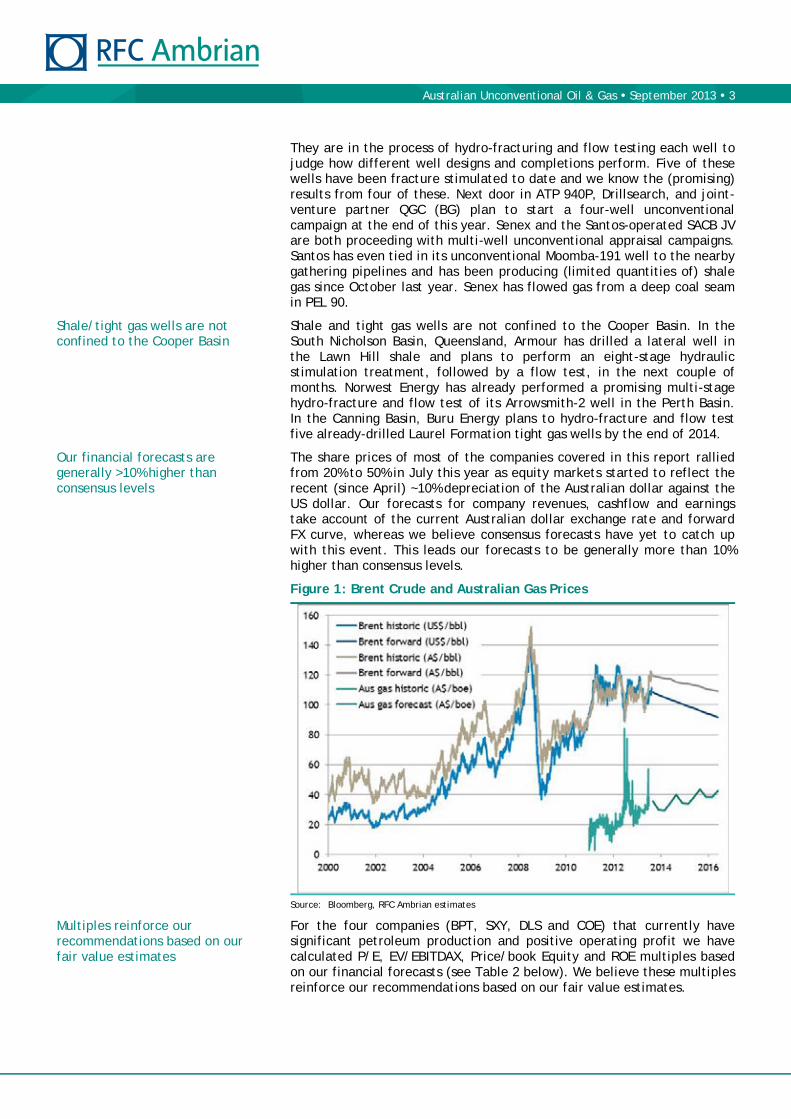
The share prices of most of the companies covered in this report rallied from 20% to 50% in July this year as equity markets started to reflect the recent (since April) ~10% depreciation of the Australian dollar against the US dollar. Our forecasts for company revenues, cashflow and earnings take account of the current Australian dollar exchange rate and forward FX curve, whereas we believe consensus forecasts have yet to catch up with this event. This leads our forecasts to be generally more than 10% higher than consensus levels.
Figure 1: Brent Crude and Australian Gas Prices
Source: Bloomberg, RFC Ambrian estimates
For the four companies (BPT, SXY, DLS and COE) that currently have significant petroleum production and positive operating profit we have calculated P/E, EV/EBITDAX, Price/book Equity and ROE multiples based on our financial forecasts (see Table 2 below). We believe these multiples reinforce our recommendations based on our fair value estimates.
Shale/tight gas wells are not confined to the Cooper Basin
Our financial forecasts are generally >10% higher than consensus levels
Multiples reinforce our recommendations based on our fair value estimates
Australian Unconventional Oil & Gas September 2013 4
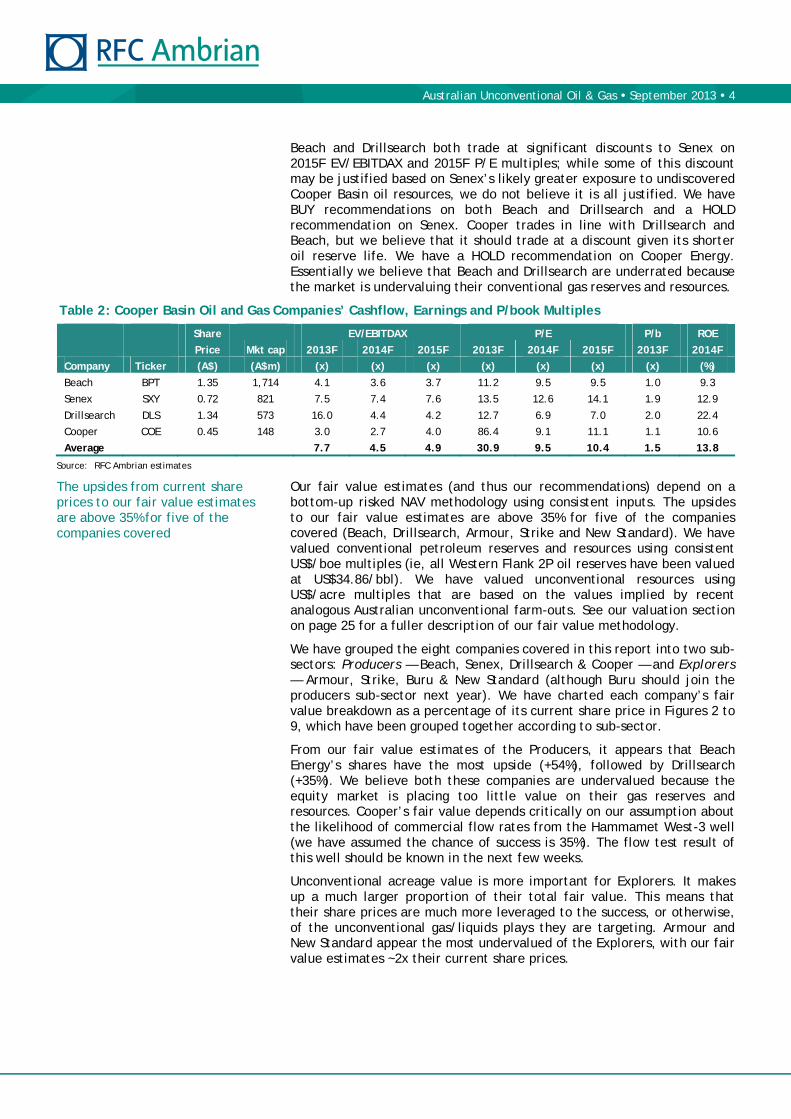
Beach and Drillsearch both trade at significant discounts to Senex on 2015F EV/EBITDAX and 2015F P/E multiples; while some of this discount may be justified based on Senex’s likely greater exposure to undiscovered Cooper Basin oil resources, we do not believe it is all justified. We have BUY recommendations on both Beach and Drillsearch and a HOLD recommendation on Senex. Cooper trades in line with Drillsearch and Beach, but we believe that it should trade at a discount given its shorter oil reserve life. We have a HOLD recommendation on Cooper Energy. Essentially we believe that Beach and Drillsearch are underrated because the market is undervaluing their conventional gas reserves and resources.
Table 2: Cooper Basin Oil and Gas Companies’ Cashflow, Earnings and P/book Multiples
Share EV/EBITDAX P/E P/b ROE
Price Mkt cap 2013F 2014F 2015F 2013F 2014F 2015F 2013F 2014F
Company Ticker (A$) (A$m) (x) (x) (x) (x) (x) (x) (x) (%)
Beach BPT 1.35 1,714 4.1 3.6 3.7 11.2 9.5 9.5 1.0 9.3
Senex SXY 0.72 821 7.5 7.4 7.6 13.5 12.6 14.1 1.9 12.9
Drillsearch DLS 1.34 573 16.0 4.4 4.2 12.7 6.9 7.0 2.0 22.4
Cooper COE 0.45 148 3.0 2.7 4.0 86.4 9.1 11.1 1.1 10.6
Average 7.7 4.5 4.9 30.9 9.5 10.4 1.5 13.8
Source: RFC Ambrian estimates
Our fair value estimates (and thus our recommendations) depend on a bottom-up risked NAV methodology using consistent inputs. The upsides to our fair value estimates are above 35% for five of the companies covered (Beach, Drillsearch, Armour, Strike and New Standard). We have valued conventional petroleum reserves and resources using consistent US$/boe multiples (ie, all Western Flank 2P oil reserves have been valued at US$34.86/bbl). We have valued unconventional resources using US$/acre multiples that are based on the values implied by recent analogous Australian unconventional farm-outs. See our valuation section on page 25 for a fuller description of our fair value methodology.
We have grouped the eight companies covered in this report into two sub-sectors: Producers — Beach, Senex, Drillsearch & Cooper — and Explorers — Armour, Strike, Buru & New Standard (although Buru should join the producers sub-sector next year). We have charted each company’s fair value breakdown as a percentage of its current share price in Figures 2 to 9, which have been grouped together according to sub-sector.
From our fair value estimates of the Producers, it appears that Beach Energy’s shares have the most upside (+54%), followed by Drillsearch (+35%). We believe both these companies are undervalued because the equity market is placing too little value on their gas reserves and resources. Cooper’s fair value depends critically on our assumption about the likelihood of commercial flow rates from the Hammamet West-3 well (we have assumed the chance of success is 35%). The flow test result of this well should be known in the next few weeks.
Unconventional acreage value is more important for Explorers. It makes up a much larger proportion of their total fair value. This means that their share prices are much more leveraged to the success, or otherwise, of the unconventional gas/liquids plays they are targeting. Armour and New Standard appear the most undervalued of the Explorers, with our fair value estimates ~2x their current share prices.
The upsides from current share prices to our fair value estimates are above 35% for five of the companies covered

Australian Unconventional Oil & Gas September 2013 5
Figure 2: Beach Energy NAV Breakdown Figure 3: Senex Energy NAV Breakdown
Source: RFC Ambrian estimates Source: RFC Ambrian estimates
Figure 4: Drillsearch Energy NAV Breakdown Figure 5: Cooper Energy NAV Breakdown
Source: RFC Ambrian estimates Source: RFC Ambrian estimates
Figure 6: Strike Energy NAV Breakdown Figure 7: Armour Energy NAV Breakdown
Source: RFC Ambrian estimates Source: RFC Ambrian estimates
Figure 8: Buru Energy NAV Breakdown Figure 9: New Standard Energy NAV Breakdown
Source: RFC Ambrian estimates Source: RFC Ambrian estimates

Australian Unconventional Oil & Gas September 2013 6
Huge Potential Shale Gas Resources
The potential size of Australia’s shale gas resources is truly enormous, if highly uncertain. A 2013 EIA-sponsored report1 of world shale oil/gas assessed that the risked, technically recoverable shale resources from just six of Australia’s basins (Beetaloo, Canning, Cooper, Georgina, Maryborough and Perth) are 437Tcf of gas and 17.5Bbbl of oil. A recent Australian study by AWT International2 estimated that the best estimate recoverable prospective gas resources from 16 basins are ~1,400Tcf of gas.
By way of comparison, Australia had 2012 demonstrated conventional resources (roughly equivalent to proven + probable) of 173Tcf of gas, according to Geoscience Australia. Proved conventional gas reserves were 132.8Tcf of gas at the end of 2012 according to BP’s statistical review. EnergyQuest estimates that Australian proven plus probable coal seam gas (CSG) reserves were 42,777PJ (~40.3Tcf) in May 2013 (of which proven CSG reserves were ~7.0Tcf). Given the paucity of data for many Australian basins, the uncertainty over the in-place and recoverable shale petroleum resources is large. This can be seen in the different basin resources estimates below.
Table 3: Australian Shale Oil and Gas Prospective Resources by Basin
Basin
Play
Gas Prod Type
ACOLA/AWT Intl Report2 EIA/ARI Report1
Area (MM
acres)
Best estimate recoverable gas resource
(Tcf)
Recoverable resource/
acre (MMcf/acre)
Technically recoverable gas resource
(Tcf)
Technically recoverable oil resource
(Bbbl)
Technically recoverable
resource (Bboe)
Amadeus Horn Valley Dry 1.80 16 8.9
Beetaloo Kyalla Dry 0.22 3 13.5 44 4.7 12.0
Velkerri Dry 1.51 16 10.6
Bonaparte Milligans Dry 0.68 6 8.8
Bowen Black Alley Dry 12.66 97 7.7
Canning Goldwyer Wet 36.40 409 11.2 235 9.8 49.0
Dry 34.43 387 11.2
Laurel Wet 11.93 106 8.9
Dry 7.09 63 8.9
Carnarvon Byro Group Dry 1.52 9 5.9
Clarence-Morton
Koukandowie Dry 1.09 11 10.1
Raceview Dry 1.09 10 9.2
Cooper REM sequence Wet 0.89 14 15.7 93 1.5 17.0
Dry 2.25 35 15.6
Eromanga Toolebec Dry 23.05 82 3.6
Georgina Arthur Creek Dry 3.57 50 14.0 13 1.0 3.2
Gunnedah Watermark Dry 2.13 13 6.1
Maryborough Cherwell Dry 0.81 7 8.7 19 0.0 3.2
McArthur Barney Creek Wet 0.71 7 9.9
Dry 0.04 0.4 11.3
Otway Eumeralla Dry 1.02 9 8.9
Pedirka Purni Dry 7.25 43 5.9
Perth Kockatea Wet 1.44 7 4.9 8 0.5 1.8
Dry 3.49 16 4.6
Carynginia Dry 25 0.0 4.2
Total/avg 157.06 1,416 9.0 437 17.5 90.3
Source: AWT International, Advanced Resources International, RFC Ambrian estimates
1 EIA/ARI — World Shale Gas and Shale Oil Resource Assessment, May 2013 2 ACOLA/AWT Intl — Shale Gas Prospectivity Potential, January 2013
Australia’s shale gas resources are large, but their economic development is highly uncertain

Australian Unconventional Oil & Gas September 2013 7
Figure 10: Australian Unconventional Oil and Gas Resources: Potential Basins
Source: Geoscience Australia, RFC Ambrian estimates
Australia already has large unconventional coal seam gas (CSG) reserves in Queensland, but the vast majority of these are earmarked for three export LNG plants currently under construction on Curtis Island, near Gladstone (see Appendix 1). Perhaps more interesting from an investor’s viewpoint, we believe several mid-cap/junior oil and gas companies are on the cusp of proving up significant shale/tight gas resources in various basins across the country.
That there is significant shale gas-in-place in many of Australia’s basins is clear, what remains to be determined is what proportion (if any) can be economically brought to market.
In the next section we look at what factors were important in generating the right conditions that allowed US shale gas/liquid production to flourish. In the sections following that we assess how Australia rates on these factors.

Australian Unconventional Oil & Gas September 2013 8
Lessons from the US Shale Gas Industry
The development of an extensive shale gas industry in the US was a long process, beginning in the early 19th Century. It was dependent on ‘good rocks’, high initial gas prices, accommodating regulatory and fiscal regimes, competitive oil and gas services markets and a series of technological advancements to progress it to the situation we see today (see Appendix 4 for a description of the US shale gas industry). It is noticeable that despite the substantial growth in North American (largely US) shale gas production since 2005-06, no other continent (or country) has seen significant shale gas production to date. We believe that several factors were important in generating the right conditions to allow US shale gas production to flourish. These were:
Suitable shale geology:
Relatively (for shale) concentrated gas/liquid shale reservoirs, from 75-175Bcf/square mile, or from 0.3-1.0Bcf/square mile-foot.
Relatively high (for shale) gas-filled porosity, from 2% to 8%.
High Total Organic Carbon (TOC), ideally from 2% to 7%.
Appropriate shale reservoir thermal maturity. Vitrinite reflectance from 0.5% to 3.0%.
Over-pressured shale reservoirs, which help overcome the low permeability of shale and drive production rates, from 0.4-1.0 psi/foot.
Brittle shale reservoirs (low clay content, certainly <50%) that allow effective hydro-fracturing.
Reasonably thick shale packages (from 50 to 300 feet).
Relatively high gas prices to kick-start the industry.
A competitive oil and gas services market to help drive down costs during the development phase of the play.
Relatively extensive road, gas/liquid pipeline, power and processing infrastructure covering most of the main shale play regions, allowing rapid and cheap commercialisation of early production.
A favourable regulatory (property rights of land owners) and tax environment.
Shale (and tight) gas/liquid plays require suitable geology to support commercial production. Gas or liquids need to be concentrated within the shale (so that each well bore, and associated hydro-fracture system, can access a large resource base). The shale should be moderately-to-highly over-pressured as the additional pressure helps overcome the low shale permeability and drive commercial production rates. Indeed, we think that finding over-pressured shale reservoirs at reasonably shallow depth (keeping the well cost low) is an important determinant of shale gas production economics.
Natural fracturing can help overcome the low permeability of shale. Even with natural fractures, hydro-fracturing (fraccing) is normally employed to create a larger fracture network and this is only effective if the shale is brittle and contains little faulting. Finally, shale packages should be 50-300 feet thick ideally. The fracture network will not reach the outer extremities of the reservoir packages that are much larger than this. Shale packages that are much thinner may not contain enough recoverable gas/liquids.
Suitable shale geology

Australian Unconventional Oil & Gas September 2013 9
Figure 11: Marcellus Shale Drill Core
Source: Marcellus shale drill core from West Virginia, 3.5 inches in diameter, containing a natural
calcite-filled vertical fracture. Photograph by Daniel Soeder, USGS
The only sure way to know if the geology of a play is suitable for commercial shale gas/liquid production is to have drilled and completed several wells and to have measured their production over many months so that a reasonably accurate assessment of the average Estimated Ultimate Recovery (EUR) can be made. The data from several wells is needed because in any shale play well performance variability is high. Often the top decile well EURs are 10x better than the bottom decile well EURs, even from wells within the play’s sweet-spot. Many months of data are required to define the production decline curve (and hence EUR) accurately. However, such a commercial assessment cannot be performed when the shale play is first being explored and appraised given the lack of data.
In practice, the industry makes an initial assessment of the commerciality of a play based on the initial production rates of the first few wells (using them to estimate EURs by assuming similar decline rates to analogous shale plays). As a shale play is developed, the additional production and cost data (from more wells and longer production history from the early wells) is used to update and refine the economics of the play. As long as the economics remain positive, the play may continue to be developed.
The key technological breakthroughs that have allowed the commercial production of US shale gas occurred in 1998 (with the use of water-based hydro-fracture fluid) and 2003 (when slick-water hydro-fracturing was combined with horizontal drilling). However, US shale gas production only took off in 2005 as it was only then that the US domestic gas price was high enough to justify commercial development. The average Henry Hub price was US$8.83/Mcf in 2005, and peaked at over US$14/Mcf in September.
The only sure way to know if the geology of a certain play is suitable is to have drilled and completed several wells and to have measured their production over many months
The industry makes an initial assessment of the commerciality of a play based on the initial production rates of the first few wells
High US domestic gas prices helped kick-start US shale gas production

Australian Unconventional Oil & Gas September 2013 10
Figure 12: US Shale Gas Production by Play and Domestic Gas Price
Source: US Energy Information Administration, Bloomberg
We believe that a competitive oil and gas services market has been important in maintaining US shale gas production growth in the face of declining domestic gas prices. Shale well drilling and completion costs outside North America are currently 2.0-2.5x those found in the US. We believe this is largely because many US shale plays have entered the development stage when repeated drilling and completion of hundreds of wells lets companies learn how to become much more efficient. Outside North America, shale plays are still in their exploration/appraisal phase and the few wells that have been drilled have not benefited from such a learning curve.
We believe that the US well cost decline has been steep because many small companies have tried different ways to become more efficient, learning from each other. Drilling costs in particular have gone down a steep curve. For example, Southwestern Energy has reported that the average number of days to drill Fayetteville Shale wells decreased from 17.5 days in 2007 to 6.7 in 2012 despite the average lateral length increasing from 2,667 feet to 4,833 feet. As the ‘US Shale Gale’ pushed domestic gas prices lower, companies switched their capex to liquid-rich plays. For example, gas production from the Marcellus and Eagle Ford shale plays has continued to grow over the last few years (see Figure 12 above). We believe drilling and completion efficiency improvements have also helped US shale gas production to continue to grow despite declining domestic gas prices.
US drilling and completion costs are much lower than those outside North America
Drilling in particular has gone up a steep learning curve

Australian Unconventional Oil & Gas September 2013 11
Figure 13: US Oil and Gas Pipelines
Source: EIA
The US shale gas/liquid industry has benefited from significant oil and gas infrastructure previously built to service the country’s conventional oil/gas production. Many of the successful US shale plays produce gas/liquids from shales that were the source rock for conventional reservoirs above them. The road, pipeline, power and processing infrastructure that was built to service the older conventional petroleum reservoirs has been used by the shale gas/liquid companies to deliver their products to market. This infrastructure has allowed operators to get early gas/liquid production to market relatively cheaply, and has lowered the entry barrier for junior oil and gas companies. The junior oil and gas companies have not had to own a huge resource base that would justify the building of major new infrastructure.
In the US, landowners possess the rights to the resources beneath their land and are entitled to royalties. US onshore royalty rates are between 12.5% and 30.0%. Thus, landowners have benefited significantly from shale gas/liquid production from wells on their property. We believe this has heavily tempered local opposition to the industry. While these royalty rates are relatively high, other US fiscal terms for onshore gas/liquid production are generally benign. Federal corporate income tax (35%) is the main tax, although individual states impose their own taxes too.
Already built infrastructure has helped the US shale gas industry
Landowners possess the rights to the resources beneath their land

Australian Unconventional Oil & Gas September 2013 12
Australia’s Shale Geology
It is still too early to tell for sure if Australia’s geology will allow commercial shale gas production. A number of companies have significant exploration and appraisal programmes in place that will provide strong indications as to whether a particular shale play could be commercialised in the next few years. Hard relevant data on many of the potential Australian shale gas/liquid basins is scarce. For some basins even basic data, such as the shale Total Organic Content (TOC), is unknown. Below we have tabulated the relevant shale data for selected Australian shale and tight gas plays. We have also included data for several well-known North American shale and tight gas plays to allow for comparisons to be made.
Table 4: Summary of Attributes of Australian and North American Plays
Basin
Play
Gas-in- place conc
(Bcf/mi2)
Liquids-in- place conc (MMbbl/mi2)
Avg TOC (%)
Vitrinite
reflectance (Ro)
Reservoir pressure (psi/ft)
Clay
content (%)
Avg net shale
thickness (ft)
Aerial extent (million acres)
Avg
depth (ft)
Australian plays
Amadeus Horn Valley 4.5 1.0-1.8 Normal Low 100 1.8 650-11800
Beetaloo Kyalla 37-50 36 2.5 1.15-1.6 Moderate over-pressure Low 130 0.2 3300-6000
Velkerri 30-42 22 4.0 1.15-1.6 Moderate over-pressure Low 100 1.5 2000-5500
Bonaparte Milligans 1.8 0.8-1.8 Unknown Low 120 0.7 1300-9800
Bowen Black Alley 4.0 1.2-1.8 Moderate over-pressure Low 165 12.7 3200-10000
Canning Goldwyer 67-110 51 3.0 1.15-1.4 Normal Low 250 70.8 8800-13500
Laurel 1.5 0.8-2.0 Moderate over-pressure Low 100 19.0 2625-14750
Carnarvon Byro Group 4.0 1.2-2.0 Unknown Low 100 1.5 490-6000
Clarence-Morton Koukandowie 3.0 1.2-1.6 Normal Low 165 1.1 650-4000
Raceview 3.0 1.2-1.6 Normal Low 260 1.1 4000-7800
Cooper-Eromanga
Nappamerri REM 88-100 37 2.6 2.0-4.0 Moderate to high over-pressure (0.7)
Low (20) 300 2.6 8000-10000
Patchawarra REM
16-19 14 2.6 1.0-2.0 Normal Low (20) 60 0.8 9000-10500
Tenappara REM 22 2.6 0.7-1.0 Normal Low (20) 135 0.1 5500
Eromanga Toolabec 2.0 0.6-0.8 Low Very low 50 23.0 300-3000
Georgina Arthur Creek 17.5-29 23 3.0-5.5 0.85-1.5 Normal Low 70 3.6 1150-8200
Gunnedah Watermark 5.0 1.2-1.6 Normal Low 65 2.1 1650-3000
Maryborough Cherwell 111 2.0 1.5 Moderate over-pressure Low 250 0.8 5000-15000 8000-17000
McArthur Barney Creek 2.0 0.4-1.4 Moderate over-pressure Low 130 0.7 1300-8500
Otway Eumeralla 1.0 1.2-2.3 Moderate over-pressure Low 400 1.0 2600-8500
Pedirka Purni 4.0 1.2-1.8 Moderate over-pressure Low 150 7.3 2600-8500
Perth Kockatea 59 25 5.6 1.15 Normal Low 160 4.9
Carynginia 94 4.0 1.4 Normal Low 250
South Nicholson Lawn Hill 8.0 0.8-2.0 Normal Low 75 1.4 985-6230
North American plays
Appalachian Marcellus 80-120 5.3-7.8 1.6 Normal to moderate over-pressure (0.46-0.52)*
Low (10-35)
125 60.7 6750
Haynesville Haynesville 120-200 3.0-5.0 1.72-2.6 High over-pressure (0.85-0.95) Low (27) 250 3.7 12000
Maverick & East Texas
Eagle Ford Dry Gas
100 4.3 0.9-1.2 Normal to high over-pressure (0.6-0.8)
Very low (8)
200 0.1 7000
Eagle Ford Wet Gas
80-90 4.3 0.9-1.2 Normal to high over-pressure (0.6-0.8)
Low 200 0.6 7000
Eagle Ford Oil 30-50 4.3 0.9-1.2 Normal to high over-pressure (0.6-0.8)
Low 200 1.4 7000
Arkoma Fayetteville 30-60 4.0-9.6 1.2-3.0 Normal to moderate over-pressure (0.42)
110 5.8 4000
Fort Worth Barnett 150-200 4.5 1.2 Normal to moderate over-pressure (0.42-0.526)
Low (27) 300 4.1 7500
Anadarko, Ardmore, Arkoma & Chautauqua
Woodford 60-120 4.0-6.5 0.5-2.5 Normal to moderate over-pressure(0.48)
200 3.0 5000-9500
Green River Pinedale 80-140 0.7-1.0 High over-pressure (0.9) Very low 0.2 10400
Western Canada Sedimentary
Montney 138-175 0.5-4.0 1.2-1.4 Moderate to high over-pressure (0.57-0.75)
Very low (5-15)
150 0.7 5500-13000
*Large areas of play under-pressured; Source: AWT International, Oil & Gas Journal, DOE, SPE, MBA Petroleum Consultants, USGS, Canada National Energy Board, RFC Ambrian estimates

Australian Unconventional Oil & Gas September 2013 13
Over-pressured shales develop during the generation of natural gas. Due to low shale permeability, much of the gas cannot escape and builds in the pore space, increasing the internal pressure of the rock. Artificial fractures tend to propagate further in high-pressure shales. Over-pressure also leads to high initial production rates and high decline rates (for a given EUR), with concomitant cashflow benefits. Over-pressure further enables faster geochemical metamorphism, enhancing the generation and maturity of hydrocarbons. However, too high a pressure can make drilling dangerous/expensive and can cause over-maturation of methane gas to carbon dioxide.
We believe that the optimum reservoir is moderately-to-highly over-pressured (from 0.4psi/ft to 1.0psi/ft), a characteristic shared by almost all of the North American plays examined. Of the Australian plays, the Nappamerri Trough of the Cooper-Eromanga Basin has the highest measured over-pressure (at 0.7psi/ft). The Toolabec has low pressure due to its relatively shallow depth.
Figure 14: Reservoir Pressure
Source: RFC Ambrian estimates
Potential shales must have been buried to a depth where they have become mature for oil and gas. If a shale has been subsequently uplifted, eroding the overburden, to leave the shale at a shallower depth, this causes the shale to become over-pressured and locates the shale at a shallower depth for drilling. This is the case in the McArthur Basin. All else being equal, the shallower a shale play, the cheaper the drilling costs. Deeper shales can be in or past the maturity window (such as the Nappamerri Trough in the Cooper Basin, where CO2 levels are material).
It should be noted that the depth ranges for the Australian plays are generally wide, and not all of the shale formations area will have been buried to an appropriate depth. With exploration being undertaken in the majority of these basins, the areas with appropriately buried shale will become delineated over time.
Low Normal Moderate HighOptimum
Horn ValleyKyalla
VelkerriBlack AlleyGoldwyer
LaurelKoukandowie
RaceviewNappamerri REM
Patchawarra REMTenappara REM
ToolabecArthur Creek
WatermarkCherwell
Barney CreekEumeralla
PurniKockatea
CarynginiaLawn HillMarcellus
HaynesvilleEagle Ford Dry GasEagle Ford Wet Gas
Eagle Ford OilFayetteville
BarnettWoodford
PinedaleMontney
Reservoir Pressure
Over-pressure
Shale depth

Australian Unconventional Oil & Gas September 2013 14
Figure 15: Depth Ranges (ft)
Source: RFC Ambrian
Total Organic Carbon (TOC) is a measure of the organic richness of sedimentary rocks. In shale gas plays, the shale is both the source rock and reservoir. For shale gas, TOCs should ideally be between 2.0% by weight (wt%) and 7.0wt%. A value of approximately 0.5wt% is considered the minimum for an effective conventional source rock.
Figure 16: Average TOC (wt%)
Source: RFC Ambrian
Total Organic Carbon

Australian Unconventional Oil & Gas September 2013 15
Gas reservoirs store gas within the rock pores and adsorbed onto organic matter. The amount adsorbed depends on the amount of organic matter within the rock and the pressure. More gas can be stored through adsorption in shales with higher TOCs, all else being equal. However, if a shale has a very high TOC, this might be because the organic matter has not been converted to petroleum hydrocarbons (ie, it has not been buried to an appropriate depth).
Many of the North American plays have TOC values that exceed the ideal range, whilst most Australian plays fall comfortably within the optimum range. There are a few that have very low average TOC (Laurel, Milligans and Eumeralla), but we believe these plays are tight gas plays (ie, the reservoir is not the same as the source rock). The Lawn Hill Formation is a clear outlier in Australia, with an average TOC of 8wt%.
Vitrinite reflectance is the most common approach for the determination of thermal maturity. Reflectance values should be between 0.5 and 3.0%, with the optimum value above 1%. The oil generation window correlates with reflectance values of 0.5-1.1%. The gas generation window is associated with values of 1.0-3.0%. The graph below shows that the average vitrinite reflectance values for most of the plays fall into the optimum range of 1.0-3.0%. Most of the Australian plays lie at the lower end of this range. The REM of the Nappamerri Trough, in the Cooper-Eromanga Basin, has the highest range, more comparable with the prolific shales of the Haynesville, Fayetteville and Woodford. Several Australian plays fall short of this optimum range, including the Toolabec and Tenappara.
Figure 17: Vitrinite Reflectance (%)
Source: RFC Ambrian
Like the Eagle Ford Shale play, many Australian shales are likely to have areas that exhibit different maturation windows (volatile oil, gas condensate and dry gas). Thus, different areas within large basins may have different concentrations of hydrocarbon products. Over the page we show the gas/liquid-in-place concentrations of different basin areas. Again, whilst most of the Australian plays fall into the lower part of the range, several are comparable with the North American plays; notably, the Goldwyer appears to be very similar to both the Marcellus and Woodford shales.
Thermal maturity
Gas-in-place concentration

Australian Unconventional Oil & Gas September 2013 16
Figure 18: Gas-in-place Concentration (Bcf/mi2)
Source: RFC Ambrian
For the more liquid plays, we believe concentrations above 20MMbbl/mi2 have the potential to be commercial. The Goldwyer and Kyalla plays are the only ones that have the same range as the Eagle Ford Oil play, with Goldwyer actually exceeding it. Note that these are in-place volumes, based on limited data, and not an indication of potentially recoverable volumes as recovery factors may vary.
Figure 19: Liquids-in-place Concentration (MMbbl/mi2)
Source: RFC Ambrian
Encouragingly all the Australian plays showed very low to low clay contents, in line with the North American plays. Shales with low clay content and high quartz and/or silica contents tend to be more brittle, and respond more favourably to hydraulic stimulation.
So, does Australia have suitable shale geology? The analysis above clearly shows that many of the key parameters are met in several Australian plays. However, to determine if this suitable geology can be made commercial, significantly more drilling, hydro-fracturing and flow testing activity will need to occur. Several wells will have to be drilled and completed, and their production measured over many months to determine a reasonably accurate assessment of the average Estimated Ultimate Recovery.
It is important to note that not all areas of a play are created equal. Across a single play (or sub-area) there can be significant variations in parameters, such as over-pressure, depth, TOC content, clay content, thermal maturity and shale thickness. Plays often have sweet-spots and productivity rates and economic returns can vary significantly from one location to another. Shale gas development success is dependent on aligning wells and their fracture networks for maximum exposure to these zones. Over the past few years several Australian shale wells have been drilled and a few have had multiple-stage hydraulic-fracture treatments and tests. One well, Moomba-191, has been put on production by Santos. The results of these wells are summarised in Appendix 3.
Liquids-in-place concentration
Clay content
The key parameters are met in several Australian plays, but significant drilling is required to determine commerciality accurately

Australian Unconventional Oil & Gas September 2013 17
Domestic Gas Prices
Australia has three separate unconnected gas markets: the East Coast market, the Northern market and the Western market. The Western gas market already has Liquid Natural Gas (LNG) gas net-back pricing due to currently producing LNG export projects (NWS and Pluto). The Northern gas market is short of gas and has LNG net-back pricing as well. There are three LNG projects under construction near Gladstone that are already ramping up their unconventional Coal Seam Gas (CSG) production capacity. As these LNG projects come on stream we think that the East Coast gas market will also move to LNG net-back prices. We believe LNG net-back pricing should encourage shale and/or tight gas pilot studies in a number of Australia’s basins over the coming years.
Figure 20: Australian Oil and Gas Markets and Infrastructure
Source: Engineering Energy: Unconventional Gas Production - A study of shale gas in Australia, ACOLA
East Coast Gas Market
There are three sanctioned CSG to LNG projects on Curtis Island in Queensland currently under construction: Gladstone LNG (GLNG), Queensland Company LNG (QCLNG) and Australia Pacific LNG (APLNG) (see Appendix 1). The first train (QCLNG) is due on stream in 2H14, while production from the sixth train (APLNG) is planned to start in 2H15. CSG production in Queensland is about to ramp up dramatically to support the six trains of LNG liquefaction capacity currently being built on Curtis Island as part of these projects. The drilling of the 4,000+ CSG wells required for all six trains is already well under way. For all six trains to run at full capacity, we estimate that they will require an extra 1,500PJ (1,4315Bcf of gas) pa. Total Australian East Coast gas production from all sources was just 720PJ (680Bcf of gas) in 2012 (according to EnergyQuest).
CSG production in Queensland is about to ramp up dramatically, but may not keep up with demand from new LNG projects

Australian Unconventional Oil & Gas September 2013 18
We believe, as do many industry participants, that the ramp of CSG production from 2015 to 2017 is unlikely to match the very rapid increase in LNG capacity demand, causing Australian East Coast gas market prices to move to LNG net-back pricing (and perhaps to spike higher). In 2012 over 100PJ of the East Coast domestic gas market supply (out of ~720PJ in total) came from Queensland CSG operations owned by the LNG joint venture companies. As the LNG projects come on-stream we expect part of this gas to be diverted from the domestic market towards the LNG operations for which they were initially intended. Furthermore, in order to secure enough resources for its project, GLNG has contracted to buy 750PJ over 15 years starting in 2014 from Santos’ gas portfolio (mostly Cooper Basin reserves). GLNG has also contracted 365PJ over ten years starting in 2015 from Origin’s East Coast gas portfolio. These contracts will restrict the supply of gas to the domestic market.
Figure 21: Australian East Coast Domestic Gas Market Supply by Basin and Total Domestic Demand
Source: EnergyQuest
Above we show EnergyQuest’s East Coast domestic gas supply and demand forecasts. It is forecasting a domestic gas supply shortfall of 60-90PJ pa in 2015/16 despite forecasting 15-20% lower domestic gas demand (resulting from its forecast of a significant domestic gas price increase — see Figure 21 above).
Historically most Australian East Coast gas has been sold on long-term contracts, many with prices well below A$5/GJ. However, many of these domestic contracts are due to expire over the next few years. EnergyQuest estimates that over half of today’s contracts by volume will have expired by 2019. Recently signed new contracts have significantly higher gas price provisions than the older contracts. The contracts for Origin’s sale of 365PJ gas (May 2012) to GLNG and Beach’s sale of 139-173PJ of gas to Origin (April 2013) have provisions that link the gas price to oil prices. We believe that at today’s oil prices these provisions would result in a gas price of ~A$8/GJ. The average East Coast Domestic Market 2012 gas price was just over A$5/GJ.

Australian Unconventional Oil & Gas September 2013 19
Figure 22: Domestic Gas Supply Contract Volumes
Source: EnergyQuest
Although most Australian East Coast gas is currently being sold on long-term contracts with prices below A$5/GJ, we believe average domestic prices are likely to increase dramatically over the next few years as current contracts expire and are replaced with new contracts that contain oil-linked gas prices reflecting LNG net-back parity rates. We are not alone in this belief. Below we show EnergyQuest’s gas price forecast for the East Coast’s main demand centres. Brisbane prices are likely to rise the most due to its proximity to Curtis Island (where all the LNG projects are based) and the pipeline infrastructure constraints.
Figure 23: East Coast Gas Prices — Main Demand Centres
Note: Prices are in constant 2013 A$ and are based on an oil price of US$95/bbl; Source: EnergyQuest
We believe this likely 2015/16 rise in East Coast gas prices could transform the economics of shale and/or tight gas in the region and kick-start their development. Once a particular play moves into a development phase, we would expect the drilling and well completion costs to fall towards (if not ever reaching) US levels, leading to lower shale/tight gas breakeven prices.
The likely 2015-16 rise in East Coast gas prices could kick-start shale/tight gas development in the region

Australian Unconventional Oil & Gas September 2013 20
We estimate that QCLNG and APLNG own enough gas resources for their two trains of LNG, while GLNG is still short equity gas resources even after contracting for additional gas from others (Santos, APLNG and Origin). We believe that extra (third and fourth) trains for each of these three LNG projects could struggle to source new gas given the recent lack of significant new low-cost CSG discoveries. One likely option would be for Arrow Energy (Shell) to cancel its own separate LNG project on Curtis Island and supply its two trains worth of gas resources to one of the current projects (likely to be APLNG or GLNG, in our view). This would still leave the current projects about four trains short of the gas resources required for full capacity (3 x 4 trains), and all the scale economies available to them. We think that shale/tight gas resources will likely fill this gap in time should their cost of development fall enough to make them economic at LNG net-back prices.
Western Gas Market
Due to the already operating LNG projects (North West Shelf and Pluto) in Australia’s Western Market, gas prices there are already set based on LNG net-back pricing. Indeed, ACIL Talisman estimated that in 2011 unconstrained demand far outstripped supply (see Figure 24 for its 2011 supply and demand forecasts). Given that the main gas fields connected to the North West Shelf LNG project are likely to enter their decline phase from 2014/15 onwards, we believe this situation is unlikely to change in the foreseeable future, even with new domestic gas becoming available from new LNG projects (Gorgon and Wheatstone).
Figure 24: Western Market Domestic Gas Supply and Demand
Source: ACIL Talisman: Energy Futures for Western Australia — September 2011
In September 2011 ACIL Talisman prepared a report on the Western Australia Gas Market (Energy Futures for Western Australia) for the Office of Energy. In this report it forecast the Western Australian gas market prices under various scenarios (See Figure 25 overleaf). Under the ‘current policies scenario’ the Western Gas Market price is forecast to range from ~A$10/GJ to ~A$12/GJ. The gas price is forecast to remain above A$8/GJ in all three scenarios.
Shale/tight gas resources could be used to supply the third and fourth LNG trains of current projects
The Western Domestic Gas Market unconstrained demand far outstrips its supply

Australian Unconventional Oil & Gas September 2013 21
Figure 25: Western Market Gas Prices
Source: ACIL Talisman; Energy Futures for Western Australia – Sept 2011
The West Australian (WA) State Government clearly recognises that increased domestic gas supplies are required to stop energy prices becoming a limiting factor for economic growth in the state, and is actively encouraging unconventional gas production from the Canning Basin. Indeed, the WA Parliament has just voted through a bill to give Buru Energy better long-term tenure over the company’s most prospective acreage in return for prioritising a domestic gas project and pipeline (see page 160). Should Canning Basin unconventional wells flow gas and/or liquids at typical commercial rates, we think these resources are likely to be developed. We believe this because the potential size of the resource base is enormous and should easily outweigh the difficulties of developing a project in such a remote location.
Northern Gas Market
We believe the Northern Domestic Gas Market is also short of supply and that prices there already reflect LNG net-back parity. In February 2012 ACIL Talisman forecast flat Northern Territory gas prices of A$11/GJ from 2012 to 2030. That this market is short of gas has been highlighted by the difficulty Rio Tinto has had getting gas for its Gove Bauxite refinery, even when threatening its closure.
This market has one operating LNG project (Darwin LNG, which is supplied by the Bayu-Undan gas field in the Timor Sea), and one under construction (Ichthys LNG, which will be supplied by the Ichthys field in the Browse Basin). Both LNG projects have room to expand their currently sanctioned liquefaction capacity, though not the resources.
Several prospective unconventional gas and/or liquid basins (Amadeus, Ngalia, Georgina, Beetaloo, McArthur and South Nicholson) could be connected to this market should resource size, well flow rates and well EURs justify their commercialisation.
The Northern Domestic Gas Market is also short of supply

Australian Unconventional Oil & Gas September 2013 22
Shale Gas Development Challenges
Australia’s nascent shale gas/liquid industry faces many challenges, even should the shales prove amenable to commercial production. The Australian oil and gas services market is much smaller and less competitive than the US market. Australia’s onshore oil and gas infrastructure is much less developed than that of the US, with many of Australia’s potential shale gas/liquid basins being very remote. However, we believe that it should be easier for companies to maintain a social licence to operate in the remote shale gas/liquid basins than it has been for the Queensland/New South Wales coal seam gas companies. On the positive side, fiscal terms in Australia are relatively benign. We think that, given the potential size of Australia’s shale resources, none of these challenges are insurmountable. However, they will likely make Australian shale gas/liquids development significantly slower than that of the US.
Australia’s Oil and Gas Services Market
The US oil services market is both much bigger and much more competitive than the Australian market. Current drilling and completion costs for similar wells are substantially higher (2.0-2.5x) in Australia as a result. Should pilot shale gas/liquid projects move into development we would expect their drilling and completion costs to come down towards US levels, although they will likely always be higher than equivalent US costs given Australia’s generally higher wages.
Santos estimates the total Australian rig fleet at approximately 50. There were just 11 active onshore oil and gas rotary rigs in Australia in June 2013 according to Baker Hughes; it counted 1,681 active onshore oil and gas rotary rigs in the US in the same month. Over three quarters of the US rotary rigs were drilling directional or horizontal wells, and of the 1,078 rigs drilling horizontal wells 77% were classified as oil; seven of Australia’s eleven active onshore rotary rigs were classified as oil. We believe that only a few of Australia’s current rigs are capable of drilling the deep, long horizontal wells that are being proposed in some basins.
When we visited Beach’s Marble-1 well in the Cooper Basin in May, which was in the process of being hydro-fractured, we were told each fracture stage was costing ~US$0.5m. This is 2.5x what we believe the equivalent cost of treatment is in the US. There are only two hydro-fracture spreads, capable of >80bbl min, in Australia. Both are owned by Haliburton, and until this year they were not fully utilised. By way of contrast, we believe that the North American market has over 100 such hydro-fracture spreads. We have been told by some junior E&P companies that other hydro-fracture service companies are considering moving additional spreads to Australia.
Australia’s Oil and Gas Infrastructure
The density of oil and gas infrastructure in the US is more than 10x greater than that in Australia according to Santos. The land mass of the US is just 27% bigger than Australia, but the US has significantly more oil and gas infrastructure. Australia’s land mass is 7.7m km2 while the US has 9.8m km2 within its borders: however, Australia has just 1,200 oil and gas wells and 25 oil and gas processing plants. The US has 37,000 oil and gas wells and 600 oil and gas processing plants. Furthermore, Australia has just 20,000km of petroleum pipelines while the US has 350,000km.
The US oil services market is bigger and more competitive than the Australian market
Australia has less oil and gas infrastructure than the US

Australian Unconventional Oil & Gas September 2013 23
Compare Figure 20 (which shows Australia’s pipeline system) on page 17 with Figure 13 on page 11 (which shows the US’s pipeline system) to see the difference this makes. Ready access to oil and gas infrastructure enables the sale of relatively small gas/liquid volumes produced by exploration/appraisal wells or pilot projects, providing operators with some early cashflow.
Road access is also problematic for many of Australia’s more remote basins, and building new roads capable of carrying drilling rigs can be expensive. Drilling rigs often use diesel generators for power, and this is much more expensive than if they were connected directly to the electricity grid.
We believe that the advantages of being close to the current processing and pipeline infrastructure will mean that the Cooper Basin is the one most likely to see pilot unconventional projects developed over the next several months. Indeed, gas production from the SACB JV’s unconventional Moomba-191 well has already been hooked up to local infrastructure and is being sold. Should exploration/appraisal wells in other basins demonstrate likely commercial viability, these basins could also see pilot projects launched. Early liquid production would be trucked to market, while early gas production could be delivered to nearby mines by new low-pressure pipelines or by compressed natural gas (CNG) trucks.
Australian Oil and Gas Fiscal Terms
Australian fiscal terms are benign, in our view. Royalty rates are generally lower than those in the US. Onshore oil and gas producers pay a state royalty that generally ranges from 10-12.5% of the wellhead price. They also pay Native Title holders a royalty that is generally between 1-3%. US onshore royalty rates are between 12.5% and 30% of the wellhead price and we believe average is ~18%. Corporate income tax is 30% in Australia and 35% in the US.
The Petroleum Resource Rent Tax (PRRT) is an Australian federal tax that has applied to onshore petroleum projects since July 2012. It applies to the taxable profit generated from a project’s upstream activities. PRRT applies at the rate of 40%. Different types of excess deductible expenditure (starting base, exploration, general project, etc) are allowed to be compounded at various rates (from the nominal inflation rate to the long bond rate +15%), and then carried forward (called ‘augmented expenditure’). State royalties are creditable against the liabilities of PRRT projects. Most of the companies we spoke to do not expect to pay PRRT for the foreseeable future due to substantial ‘augmented expenditure’.
Maintaining a Social Licence to Operate
Maintaining a social licence to operate will be critical for any Australian shale gas/liquid industry. Unlike in the US, Australian landowners do not receive petroleum royalties, but are paid for any disturbance to their normal activities through Land Access Agreements. These payments are generally not as large as US royalty payments. We think this makes maintaining a social licence to operate more difficult in Australia. Certainly the New South Wales coal seam gas producers have struggled to maintain a social licence in recent years as some of their tenements cover high-value farmland and are close to population centres. The remoteness (low population density) and land use (grazing rather than cropping farmland) of many of the potential shale gas/liquid basins should help in maintaining a social licence.
Australian fiscal terms are benign
The remoteness and land use of many of the potential shale gas/liquid basins should help in maintaining a social licence.

Australian Unconventional Oil & Gas September 2013 24
Consolidation
We believe that over the last few months, since Chevron farmed into Beach’s interests in PEL 218 and ATP 855P, the share prices of all the oil and gas companies with Cooper Basin exposure have benefited somewhat from consolidation speculation. Certainly, over the last few years, several of the companies covered in this report have grown partly through acquisition (see Appendix 2 for a description of these transactions and the multiples paid). Beach has been the most active, but Drillsearch, Senex and Cooper have all also made acquisitions. We believe Beach will play a key role in any further sector consolidation. Beach currently owns a 9.5% stake in Cooper Energy and in July 2013 Beach acquired a 4.9% stake in Drillsearch. Back in 2009, Beach unsuccessfully bid for Drillsearch. We believe that significant value can still be released from further consolidation, although — as in most corporate acquisitions — it is likely to be the target shareholders rather than acquirer shareholders that see most of the benefit. We think further consolidation amongst the companies with Cooper Basin acreage is likely.
The junior/mid-tier oil and gas industry generally benefits from scale economies. The most important scale economy is that a company’s general and administrative (G&A) expense does not grow proportionately with its production level. Table 5 below shows the revenue and G&A for five of the main Cooper Basin oil and gas companies over the six months to December 2012. It can be clearly seen that G&A as a percentage of sales falls with higher production/sales; G&A ate up 27% of Cooper Energy’s revenues during this period. We don’t criticise the level of G&A, it is just a reflection of the size of the company. If one discounts a perpetual A$10m annualised saving in G&A (all the companies in Table 5 have annualised G&A in >A$10m) by 10%, that equates to A$100m worth of value.
Table 5: Cooper Basin Oil and Gas Companies — Six-month Revenue and G&A to end December 2012
Revenue (A$m) G&A (A$m) G&A/Revenue (%)
Santos (STO)1 1,499.0 54.0 3.6
Beach (BPT)1 292.2 15.3 5.2
Senex (SXY) 77.3 12.5 16.2
Drillsearch (DLS) 25.4 6.5 25.6
Cooper (COE) 23.4 6.3 26.9 1STO and BPT sales adjusted for third-party purchases; Source: Company data, RFC Ambrian estimates
For exploration companies without significant revenues or operating profit, the effect of G&A on their value is even higher. For the 4 explorers covered in this report (Armour, Buru, New Standard & Strike) our estimate of the capitalised cost of G&A as a percentage of their market cap ranges from 27% to 160% (average 84%). For the 4 producers covered in this report (Beach, Cooper, Drillsearch and Senex) our estimate of the capitalised cost of G&A as a percentage of their market cap ranges from 22% to 113% (average 48%).
We believe further consolidation amongst the companies with Cooper Basin acreage is likely
The oil and gas industry generally benefits from scale economies

Australian Unconventional Oil & Gas September 2013 25
Valuation
We believe the best way to value Australian junior/mid-cap oil and gas companies is to use a bottom-up net asset value (NAV) methodology, using consistent inputs. We use such a process to estimate the current fair value of a stock and explain our methodology below. The valuation of junior/mid-cap oil and gas companies with exposure to unconventional plays is hard because unconventional play data is scarce and uncertainties are large. We find that companies with current oil and production have the majority of their value in their proven and probable petroleum reserves rather than their unconventional resources. We consider that, based on their current fair values and risk reward profiles, all the companies covered in this report, except Senex, Cooper and Buru, are good candidates to be included in a portfolio of Australian companies exposed to unconventional oil and gas.
Peer valuation multiples are difficult to apply to all companies given that pure explorers do not currently have positive revenues, operating cashflow and earnings, and that they report risked resources in an inconsistent manner (and in many cases not at all, or only for some of their licences). Not all acreage is equally valuable, so peer metrics based on this need to be used carefully.
Bottom-up Risked NAV Methodology
We estimate the value of:
Cooper Basin conventional petroleum net 2P reserves, based on DCF modelling of their cashflows, which is then risked.
Cooper Basin conventional petroleum net 2C contingent resources, based on DCF modelling of their development, which is then risked.
Other identified conventional net 2P reserves and 2P resources in the company’s portfolio based on an estimated value/boe, which is then risked.
Conventional exploration prospects that are due to be drilled as part of the company’s work FY14 exploration programme, based on DCF modelling of their development, which is then risked.
Unconventional shale/tight gas/liquid resources in the company’s portfolio based on relevant value/acre farm-in multiples.
Other value adjustments:
We add 30 June 2013 net cash/(subtract net debt).
We subtract our estimate of FY14 conventional petroleum exploration cost.
We add the value of any future carry and payments associated with partially completed farm-ins.
We subtract the capitalised general & administrative (G&A) expense, based on their reported 1HFY3 G&A expense.
We add the funds raised from any in-the-money options.
Thus, for partially completed farm-ins, we assume the farm-in is completed and net resources/acreage reflects this, but add the value of future farm-in carry and payments in other value adjustments.
Summary

Australian Unconventional Oil & Gas September 2013 26
Risked DCF-based NAV/boe Estimates
We have estimated the net present value per barrel of oil equivalent (NAV/boe) for Cooper Basin oil, wet gas and dry gas reserves and resources, based on our understanding of their finding and development costs, operating costs and fiscal terms. See Table 6 for the key price, cost and tax assumptions of our models.
For proven and probable oil/gas liquid reserves we have used forward curve Brent prices until 2016, and flat US$90/bbl from 2017 onwards. For proven and probable gas reserves we have used US3.00/Mcf for 2014, rising steadily to an appropriate real Cooper Basin wellhead LNG net-back gas price (US$4.50/Mcf) in 2017.
For contingent and prospective resources we use a flat real oil price of US$90/bbl (roughly equivalent to the three-year forward Brent price) and an appropriate long run real Cooper Basin wellhead net-back gas price (US$4.50/Mcf).
We have estimated the appropriate real Cooper Basin gas wellhead net-back price by estimating the Asian delivered LNG CIF price, which we’ve based on 15% of our Brent oil price forecast. Thus, for our flat real US$90/bbl oil price we are assuming the delivered LNG CIF price is a flat real US$13.50/Mcf. From this we have subtracted our estimate of the transport and liquefaction cost (US$5.50/Mcf) to get a Gladstone gas price of US$8/Mcf. We further subtract pipeline transport costs (US$1.50/Mcf) and gas processing costs (US$2.00/Mcf) to arrive at a Cooper Basin wellhead net-back price of US$4.50/Mcf.
We have assumed oil finding costs of US$4/bbl and wet gas/dry gas finding costs of US$6/boe (US$1/Mcfe), reflecting the lower well cost of shallower oil wells and the high success rates when drilling on 3D seismic. This is in line with various management discussions we have had. We have assumed development costs of US$9/boe (US$1.5/Mcfe) for oil, wet gas and dry gas reserves. For oil fields we have used operating costs of US$5/bbl and oil transportation costs of US$15/bbl. For wet gas fields we have used operating costs of US$3.0/boe (US$0.50/Mcfe) and gas liquid transportation costs of US$15/boe. For dry gas fields we have used operating costs of US$1.8/boe (US$0.30/Mcf).
Our models assume a 10% royalty rate and use Australia’s 30% corporate profit tax rate. We have also conservatively assumed that each oil, wet gas and dry gas project pays Petroleum Resource Rent Tax (PRRT) at 40% based on the individual project revenues, exploration, development and other costs. We have also estimated the NPV of petroleum reserves assuming no PRRT is paid. We find that PRRT only substantially affects the value of the highly profitable Cooper Basin oil reserves. Only Cooper Energy paid PRRT in 1HFY13, as other companies had significant augmented expenditure.
Our models use an effective nominal 10% discount rate (our models run in real terms and use a real 7.5% discount rate). To estimate the value of developed 2P reserves, we have calculated the NPV/boe of reserves using a discounted cashflow model of a representative field after the finding and development capital has been spent. To estimate the value of 2C contingent resources (and undeveloped 2P reserves) we have discounted the cashflows of a typical field after the finding costs have been spent, but before the development costs. We have discounted the cashflows of a typical field, including the finding and development costs, to estimate the value of prospective resources.
DCF modelling of conventional reserves and resources
Price assumptions
Finding, developing and operating costs
Tax assumptions
Discount rate

Australian Unconventional Oil & Gas September 2013 27
Table 6: NAV/boe of Different Types of Petroleum Reserves/Resources
Oil Wet Gas Dry Gas
Price assumptions
2014F Brent oil price (US$/bbl) 105.00 105.00 N/A
Long-term Brent oil price (US$/bbl) 90.00 90.00 N/A
2014F wellhead gas price (US$/Mcf) N/A 3.00 3.00
Long-term wellhead gas price (US$/Mcf) N/A 4.50 4.50
Costs
Finding cost (US$/boe) 4.00 6.00 6.00
Development cost (US$/boe) 9.00 9.00 9.00
Operating cost (US$/boe) 5.00 3.00 1.80
Liquid transport cost (US$/bbl) 15.00 15.00 N/A
Taxes
Royalty (%) 10 10 10
PRRT rate (%) 40 40 40
Income tax rate (%) 30 30 30
Valuation
Developed reserves NPV/boe (US$/boe) 37.76 19.74 14.31
Contingent resources NPV/boe (US$/boe) 23.27 10.37 6.73
Contingent resources IRR (%) 160% 58% 40%
Source: RFC Ambrian estimates
We believe that the Cooper Basin Western Flank oil fairway offers companies some of the best returns in the industry worldwide. Assuming 80% of 2P oil reserves are developed (Beach reported 81% of June 2013 2P oil reserves were developed), we estimate the value of Cooper Basin developed 2P oil reserves at US$34.86/bbl. This is in line with the value Senex will receive for the March 2013 sale of its 15% interest in the Cuisinier oil field (PL 303) and ATP 752. The combined 2P reserves of these interests are 0.6MMbbl according to Senex, which agreed to sell them for US$20m (or US$33.33/bbl). We estimate the value of Cooper Basin developed 2P oil reserves at US$37.76/bbl (US$46.11/bbl if no PRRT is to be paid). We estimate the value of Cooper Basin 2C contingent oil resources (and undeveloped 2P reserves) at US$23.27/bbl (and that the development of these reserves/resources has an IRR of 160%). We estimate the value of Cooper Basin prospective oil resources at US$16.54/bbl (and that the exploration and development of these resources has an IRR of 60%).
We believe that the returns available to companies with wet gas resources and reserves in the Cooper Basin are also impressive; in our view they are under-appreciated by the market. Assuming 45% of 2P wet gas reserves are developed (Beach reported 46% of gas and NGL 2P reserves were developed), we estimate the value of Cooper Basin 2P wet reserves at US$14.58/boe.
We believe our wet gas reserve and resource valuations are in line with the recent wet gas deal between Drillsearch and Santos. In July 2013 Santos agreed to farm in to Drillsearch’s PEL 106A and PEL 513. Santos agreed to fund a work programme valued by Drillsearch to be worth between A$100-120m for a 60% interest in the two licences. Drillsearch estimates that these two licences hold combined undeveloped wet gas 2P reserves of 11.16MMboe (before the Santos deal these reserves were classified as 2C contingent resources), and have best estimate unconventional prospective gas resources of 7Tcf. Assuming no value for the unconventional prospective gas resources, and ignoring any conventional wet gas exploration upside, this transaction values the reserves (previously resources) at US$15-18/boe.
We estimate the value of Cooper Basin 2P oil reserves at US$34.86/bbl
We estimate the value of Cooper Basin 2P wet gas reserves at US$14.58/boe

Australian Unconventional Oil & Gas September 2013 28
We estimate the value of Cooper Basin developed 2P wet gas reserves at US$19.74/boe (US$21.47/boe if no PRRT is to be paid). We estimate the value of Cooper Basin 2C contingent wet gas resources (and undeveloped 2P reserves) at US$10.37/boe (and that the development of these resources has an IRR of 58%). We value Cooper Basin prospective wet gas resources at US$3.58/boe (and estimate that the exploration and development of these resources has an IRR of 17%).
We believe the value of Cooper Basin dry gas reserves and resources is also higher than many appreciate due to our forecast of higher wellhead prices. Assuming 45% of 2P dry gas reserves are developed (Beach reported 46% of gas and NGL 2P reserves were developed), we estimate the value of Cooper Basin 2P dry gas reserves at US$10.14/boe.
We estimate the value of Cooper Basin developed 2P dry gas reserves at US$14.31/boe (US$14.31/boe if no PRRT is to be paid). We estimate the value of Cooper Basin 2C contingent dry gas resources (and undeveloped 2P reserves) at US$6.76/boe (and that the development of these resources has an IRR of 40%). We estimate the value of Cooper Basin prospective dry gas resources at US$0.44/boe (and that the exploration and development of these resources has an IRR of 9%).
We have risked the NAV of proven and probable reserves and 2C contingent resources by our estimate of the probability that the reserves/resources are developed (Pd), taking into account the value of the project, its resilience to changing commodity prices and the dependence on infrastructure that may be owned by others. For the work programmes, we have risked the potential development NAV using our estimate of the geological chance of successfully discovering commercial hydrocarbons (Pg) and our estimate of the probability that the field is developed (Pd) using the same criteria as above.
Unconventional Acreage/Resource Valuation
We believe the best metrics to use to value early stage unconventional resources are EV/acre and EV/2C contingent petroleum resources. These metrics use the only drivers of value that are generally known and available, and even 2C contingent petroleum resources are only available for small areas of a few Australian shale plays. EV/resources might be a better metric than EV/acre if the data were more widely available as it accounts for regional variations in recoverable reserves. We only say ‘might’, however, as unrisked 2C contingent resource estimates are based on many judgement calls and are therefore much more open to manipulation than the number of acres in a permit.
Despite its drawbacks, EV/acre is the most commonly quoted metric within the industry for exploration acreage due to its ease of calculation and widely available inputs. We have used comparable Australian US$/acre farm-in multiples to value selected licences/areas where unconventional exploration has taken place. Over the last few years there have been many farm-outs of Australian permit acreage that contain prospective unconventional (and, in some cases, conventional) petroleum resources (see Table 7).
The weighted average valuation of the permits for the 20 farm-outs that we have identified above is ~US$23/acre. If we exclude the three highly valued outliers (Chevron’s and QGC’s Cooper Basin Nappamerri Trough farm-ins and Bharat Petroleum’s Perth Basin EP 413 farm-in), the weighted average valuation is ~US$16/acre. In Appendix 2 we go through our understanding of the individual farm-in terms and estimate the effective value of services given for the licence interest received.
We estimate the value of Cooper Basin 2P dry gas reserves at US$10.14/boe
We have risked the NAV of reserves and resources

Australian Unconventional Oil & Gas September 2013 29
Table 7: Valuation of Recent Australian Farm-in Deals
Date
Farmor
Farminee
Basin
Net farm-in acres (m)
Transaction value
(US$m)
Value per acre
(US$/acre)
Jun-10 Buru Mitsubishi Corp Canning 8.649 132.5 15
Sep-10 Norwest Bharat Petr Perth 0.080 1.8 23
Oct-10 Norwest Bharat Petr Perth 0.035 9.1 260
Dec-10 Exoma CNOOC Galilee 3.316 45.5 14
Dec-10 Cooper Energy Beach Energy Otway 0.069 2.6 38
Feb-11 Falcon O&G Hess Corp Beetaloo 3.892 92.5 24
Mar-11 New Standard Green Rock Canning 0.157 4.1 26
Jun-11 Icon Energy Beach Energy Cooper 0.165 4.7 28
Jul-11 Drillsearch BG Cooper 0.300 77.5 258
Sep-11 New Standard ConocoPhillips Canning 8.896 109.5 12
Oct-11 Territory O&G Beach Energy Bonaparte 2.530 39 15
Jun-12 PetroFrontier Statoil Georgina 8.016 173.0 22
Oct-12 Central Petr Santos Amadeus 13.090 150.0 11
Nov-12 Central Petr Total Georgina 4.080 70.0 17
Dec-12 Tamboran Res Santos Beetaloo/ McArthur 4.650 74.9 16
Feb-13 ConocoPhillips PetroChina Canning 3.440 110.0 32
May-13 Buru Mitsubishi Corp Canning 1.005 15.0 15
May-13 Buru Rey Resources Canning 0.402 6.0 15
May-13 Beach Chevron Cooper 0.387 349.0 902
Jun-13 PetroFrontier Statoil Georgina 10.032 180.0 18
Aug-13 Ambassador Outback Energy Cooper 0.415 45.0 108
Total/Weighted average 73.050 1,691.7 23
Source: Company data, RFC Ambrian estimates
Other Value Adjustments
We add the 30 June 2013 net cash/subtract the net debt in our NAV calculation. Having added the risked value of discovered reserves/resources from a company’s FY14 conventional exploration programme, we subtract the cash exploration expenditure (ie, we do not subtract free-carried exploration work). We add the value of future work programme carry and payments from partially completed farm-outs. We also subtract the capitalised value of 1H13 G&A expenditure. We estimate this value by annualising the 1H13 G&A expenditure and dividing the result by 10%. As we value the shares on a fully diluted basis, we estimate the cash that will be received on the exercising of any in-the-money options (whether or not they expire by end-2013).
Results
In Figures 26 to 33 overleaf below we have graphed the breakdown of our current fair value estimates as a percentage of each company’s current share price. ‘Oil’ is our estimate of the value of the company’s current 2P oil reserves and 2C contingent oil resources. ‘Gas reserves’ is our estimate of the value of the company’s current 2P dry and wet gas reserves and 2C contingent dry and wet gas resources. ‘Expl’ is our estimate of the added value of the company’s FY14 work programme. ‘Uncon’ is our estimate of the value of the company’s unconventional licences. ‘G&A’ is our estimate of the capitalised general and administrative expense. Cash is the last reported net cash figure for the company. The sum of the above components gives our company fair value as a percentage of the current share price.

Australian Unconventional Oil & Gas September 2013 30
Figure 26: Beach Energy NAV Breakdown Figure 27: Senex Energy NAV Breakdown
Source: RFC Ambrian estimates Source: RFC Ambrian estimates
Figure 28: Drillsearch Energy NAV Breakdown Figure 29: Cooper Energy NAV Breakdown
Source: RFC Ambrian estimates Source: RFC Ambrian estimates
Figure 30: Strike Energy NAV Breakdown Figure 31: Armour Energy NAV Breakdown
Source: RFC Ambrian estimates Source: RFC Ambrian estimates
Figure 32: Buru Energy NAV Breakdown Figure 33: New Standard Energy NAV Breakdown
Source: RFC Ambrian estimates Source: RFC Ambrian estimates

Australian Unconventional Oil & Gas September 2013 31
Peer Multiples
Financial Metrics
Peer valuation multiples are difficult to apply given that half of the companies in this report do not currently have positive revenues, operating cashflow and earnings, and that they report net reserves and risked resources in an inconsistent manner. Furthermore, gas is not as valuable as oil and even per barrel oil valuations for different fields vary. Not all acreage is equally valuable, so peer metrics based on this must be carefully assessed.
Figure 34: Brent and Australian Gas Prices Figure 35: Company Production Profiles
Source: Bloomberg, RFC Ambrian estimates Source: Company data, RFC Ambrian estimates
The key input drivers for our financial forecasts are given in each company section later in this report. Above we show our standard oil and gas price forecasts and our forecast of each company’s quarterly production. The Australian gas price we track and forecast is the Sydney ex ante Short-term Trading Market (STTM) gas price as calculated by AEMO. We believe that a rise in East Coast gas prices can already be seen in the historic data, although currently only a small proportion of gas sold in Sydney is at this price. Our models run on A$-denominated forward Brent prices calculated using the forward US$ Brent and forward A$/US$ FX curves. The significant recent depreciation in the Australian dollar against the US dollar (and further depreciation in the FX forward curve) offsets the US$ decline in Brent forward prices. Our forecasts of company revenues, cashflow and earnings take account of the significant recent depreciation in the Australian dollar against the US dollar, whereas we believe consensus forecasts have yet to catch up with this event. This leads our forecasts to being generally more than 10% higher than consensus levels (see each company valuation section for the exact comparison).
Table 8: Cooper Basin Oil and Gas Companies’ Cashflow, Earnings and P/book Multiples
Share EV/EBITDAX P/E P/b ROE
Price Mkt cap 2013F 2014F 2015F 2013F 2014F 2015F 2013F 2014F
Company Ticker (A$) (A$m) (x) (x) (x) (x) (x) (x) (x) (%)
Beach BPT 1.35 1,714 4.1 3.6 3.7 11.2 9.5 9.5 1.0 9.3
Senex SXY 0.72 821 7.5 7.4 7.6 13.5 12.6 14.1 1.9 12.9
Drillsearch DLS 1.34 573 16.0 4.4 4.2 12.7 6.9 7.0 2.0 22.4
Cooper COE 0.45 148 3.0 2.7 4.0 86.4 9.1 11.1 1.1 10.6
Average 7.7 4.5 4.9 30.9 9.5 10.4 1.5 13.8
Source: RFC Ambrian estimates

Australian Unconventional Oil & Gas September 2013 32
For the four companies (BPT, SXY, DLS and COE) that currently have significant petroleum production and positive operating profit we have calculated P/E, EV/EBITDAX, Price/book Equity and ROE multiples based on our financial forecasts (see Table 8). We believe these multiples reinforce our recommendations based on our fair value estimates. Beach and Drillsearch both trade at significant discounts to Senex on 2015F EV/EBITDAX and 2015F P/E multiples. While some of this may be justified based on Senex’s likely greater exposure to undiscovered Cooper Basin oil resources, we do not believe it is all justified. We have BUY recommendations on both Beach and Drillsearch and a HOLD recommendation on Senex. Cooper trades in line with Drillsearch and Beach, but we believe that it should trade at a discount given its shorter oil reserve life. We have a HOLD recommendation on Cooper Energy. Essentially we believe that Beach and Drillsearch are undervalued as the market is undervaluing their conventional gas reserves and resources.
Resource and Acreage Metrics
We are not fans of valuing oil and gas companies on resource and acreage metrics. Nonetheless, we believe the market does take account of these metrics and in some cases mis-values companies based on them. We give our estimate of each company’s and peer group’s EV/net 2P reserves + 2C contingent resources and EV/net licence area in Table 9 overleaf.
The range of EV/acre multiples in Table 9 is wide — from New Standard’s US$0.45/acre to Santos’ US$188.75/acre. Producers generally have much higher EV/acre multiples than Explorers, reflecting the much higher value of acreage with developed producing reserves. The average EV/acre multiple of the Explorers is US$11.88/acre, ~30% less than the average (excluding the Chevron and QGC Nappamerri Trough farm-ins) Australian farm-in multiple of US$16/acre. This, we believe, reflects the premium that industry will pay over the equity market valuation of shale/tight gas acreage.
The range of EV/2P reserves + 2C contingent resources multiples in Table 9 is also wide — from Falcon Oil & Gas’ US$0.03/boe to Armour’s US$55.80/boe. We believe differences in these multiples reflect inconsistent reporting of 2C contingent resources between companies. Contingent resources are resources that are potentially recoverable, but not yet considered mature enough for commercial development due to technological or business hurdles. The chances of successfully clearing these hurdles can vary widely.

Australian Unconventional Oil & Gas September 2013 33
Table 9: Australian Oil and Gas Company Resource and Acreage Multiples
Company Cur
Share price (lc)
Mkt cap (US$m)
Net debt/ (cash) (US$m)
EV (US$m)
Net tenement
area (MM acres)
2P reserves +2C resources
(MMboe) EV/Acre (US$m)
EV/2P +2C reserves & resources (US$/boe)
Producers covered
Beach A$ 1.35 1,532 (191) 1,341 12.58 541.6 106.62 2.48
Senex A¢ 72.0 735 (132) 603 14.97 403.7 40.25 1.49
Drillsearch A$ 1.34 511 89 600 5.53 49.9 108.52 12.01
Cooper A¢ 45.0 132 (61) 71 3.34 8.1 21.41 8.82
Explorers covered
Buru A$ 1.67 440 (72) 368 14.57 8.0 25.24 46.26
Armour A¢ 35.0 94 (33) 61 33.35 1.1 1.83 55.80
Strike A¢ 9.8 62 (7) 55 3.72 0.8 14.71 64.47
New Standard A¢ 14.5 40 (37) 2 5.56 2.0 0.45 1.23
Other peers
Santos A$ 14.55 12,604 1,389 13,992 74.13 3,371.0 188.75 4.15
Linc Energy A$ 1.52 705 144 849 17.69 168.2 48.00 5.05
Falcon O&G A¢ 18.0 157 6 163 14.75 6,157.7 11.05 0.03
Central Petroleum A¢ 10.0 138 (11) 127 40.80 6.9 3.12 18.47
Blue Energy A¢ 9.4 96 (20) 76 28.51 149.6 2.68 0.51
Icon Energy A¢ 15.0 72 (5) 66 3.57 40.2 18.56 1.65
Empire O&G A¢ 1.4 79 (4) 75 10.00 7.0 7.48 10.75
Norwest A¢ 3.2 28 (2) 26 0.62 58.9 41.72 0.44
Empire Energy A¢ 8.8 24 43 67 14.86 16.4 4.49 4.07
Lakes Oil A¢ 0.3 19 (2) 18 1.38 0 12.70 N/M
PetroFrontier C¢ 21.0 16 (53) (37) 12.54 0 N/M N/M
Source: Bloomberg, RFC Ambrian

Australian Unconventional Oil & Gas September 2013 34
Companies
The following section is made up of eight company reports, seven of which are coverage initiations. These include one corporate client.
The section after this, Other Australian Shale Gas Companies, provides information on a further twelve companies.

Australian Unconventional Oil & Gas September 2013 35
Company Analyses
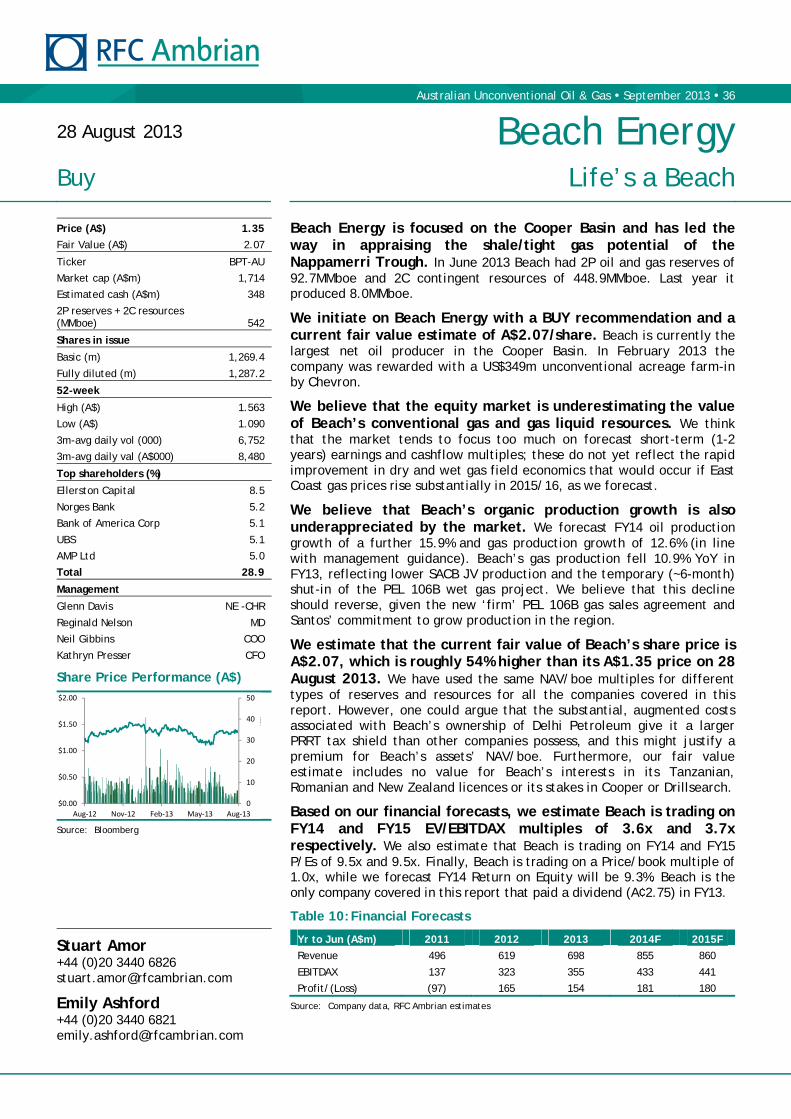
Australian Unconventional Oil & Gas September 2013 36
Beach Energy is focused on the Cooper Basin and has led the way in appraising the shale/tight gas potential of the Nappamerri Trough. In June 2013 Beach had 2P oil and gas reserves of 92.7MMboe and 2C contingent resources of 448.9MMboe. Last year it produced 8.0MMboe.
We initiate on Beach Energy with a BUY recommendation and a current fair value estimate of A$2.07/share. Beach is currently the largest net oil producer in the Cooper Basin. In February 2013 the company was rewarded with a US$349m unconventional acreage farm-in by Chevron.
We believe that the equity market is underestimating the value of Beach’s conventional gas and gas liquid resources. We think that the market tends to focus too much on forecast short-term (1-2 years) earnings and cashflow multiples; these do not yet reflect the rapid improvement in dry and wet gas field economics that would occur if East Coast gas prices rise substantially in 2015/16, as we forecast.
We believe that Beach’s organic production growth is also underappreciated by the market. We forecast FY14 oil production growth of a further 15.9% and gas production growth of 12.6% (in line with management guidance). Beach’s gas production fell 10.9% YoY in FY13, reflecting lower SACB JV production and the temporary (~6-month) shut-in of the PEL 106B wet gas project. We believe that this decline should reverse, given the new ‘firm’ PEL 106B gas sales agreement and Santos’ commitment to grow production in the region.
We estimate that the current fair value of Beach’s share price is A$2.07, which is roughly 54% higher than its A$1.35 price on 28 August 2013. We have used the same NAV/boe multiples for different types of reserves and resources for all the companies covered in this report. However, one could argue that the substantial, augmented costs associated with Beach’s ownership of Delhi Petroleum give it a larger PRRT tax shield than other companies possess, and this might justify a premium for Beach’s assets’ NAV/boe. Furthermore, our fair value estimate includes no value for Beach’s interests in its Tanzanian, Romanian and New Zealand licences or its stakes in Cooper or Drillsearch.
Based on our financial forecasts, we estimate Beach is trading on FY14 and FY15 EV/EBITDAX multiples of 3.6x and 3.7x respectively. We also estimate that Beach is trading on FY14 and FY15 P/Es of 9.5x and 9.5x. Finally, Beach is trading on a Price/book multiple of 1.0x, while we forecast FY14 Return on Equity will be 9.3%. Beach is the only company covered in this report that paid a dividend (A¢2.75) in FY13.
Table 10: Financial Forecasts
Yr to Jun (A$m) 2011 2012 2013 2014F 2015F
Revenue 496 619 698 855 860
EBITDAX 137 323 355 433 441
Profit/(Loss) (97) 165 154 181 180
Source: Company data, RFC Ambrian estimates
28 August 2013 Beach Energy
Buy Life’s a Beach
Stuart Amor +44 (0)20 3440 6826 [email protected]
Emily Ashford +44 (0)20 3440 6821 [email protected]
Price (A$) 1.35
Fair Value (A$) 2.07
Ticker BPT-AU
Market cap (A$m) 1,714
Estimated cash (A$m) 348
2P reserves + 2C resources (MMboe) 542
Shares in issue
Basic (m) 1,269.4
Fully diluted (m) 1,287.2
52-week
High (A$) 1.563
Low (A$) 1.090
3m-avg daily vol (000) 6,752
3m-avg daily val (A$000) 8,480
Top shareholders (%)
Ellerston Capital 8.5
Norges Bank 5.2
Bank of America Corp 5.1
UBS 5.1
AMP Ltd 5.0
Total 28.9
Management
Glenn Davis NE -CHR
Reginald Nelson MD
Neil Gibbins COO
Kathryn Presser CFO
Share Price Performance (A$)
Source: Bloomberg
0
10
20
30
40
50
$0.00
$0.50
$1.00
$1.50
$2.00
Aug‐12 Nov‐12 Feb‐13 May‐13 Aug‐13
illi

Australian Unconventional Oil & Gas September 2013 37
Investment Summary
We are initiating on Beach Energy with a BUY recommendation and a current fair value estimate of A$2.07/share. Beach management has created value by developing its high-margin Cooper Basin Western Flank oil reserves and using some of the proceeds to take forward successfully its unconventional gas exploration. We believe that the equity market is underestimating the value of Beach’s conventional gas and gas liquid resources and underappreciates Beach’s likely production growth.
We believe that the equity market is underestimating the value of Beach’s conventional gas and gas liquid resources, especially given that Chevron’s farm-in to Beach’s main unconventional acreage has put a clear benchmark value on these assets. We think that the market tends to focus too much on forecast short-term (1-2 years) earnings and cashflow multiples; these do not yet reflect the rapid improvement in dry and wet gas field economics that would occur if East Coast gas prices rise substantially in 2015/16, as we forecast.
We believe that Beach’s organic production growth is also underappreciated by the market. In FY13, total petroleum production was 8.0MMboe, up just 6.6% on the previous year, but this hides diverging trends between Beach’s oil and gas production. Oil production was 3.7MMboe, up 34.3% on the previous year, as the company benefited from new pipeline connections between Western Flank oil production sites and Moomba. We forecast FY14 oil production growth of a further 23.4% (Beach only has to maintain its June quarter 2013 production rate to achieve this).
Beach’s gas production fell 10.9% YoY in FY13, reflecting lower SACB JV production and the temporary (6-month) shut-in of the PEL 106B wet gas project. We believe that this decline is about to be reversed. The SACB JV operator, Santos, appears determined to increase SACB JV gas production by 30% from today’s level by 2015. It is putting its money where its mouth is: the JV is planning to spend ~A$800m on Cooper Basin infrastructure from 2013 to 2017. Furthermore, it is planning increase the number of wells drilled annually from 25 in 2012 to over 70 in 2014 and 2015. Given the new firm gas sales agreement with the SACB JV, any future PEL 106B wet gas project shut-ins should be significantly shorter than last year.
Figure 36: Beach Energy Petroleum Quarterly Production
Source: Company data, RFC Ambrian estimates
We initiate with a BUY recommendation
We believe that the equity market is underestimating the value of Beach’s conventional gas and gas liquid resources
We believe that Beach’s organic production growth is underappreciated by the market
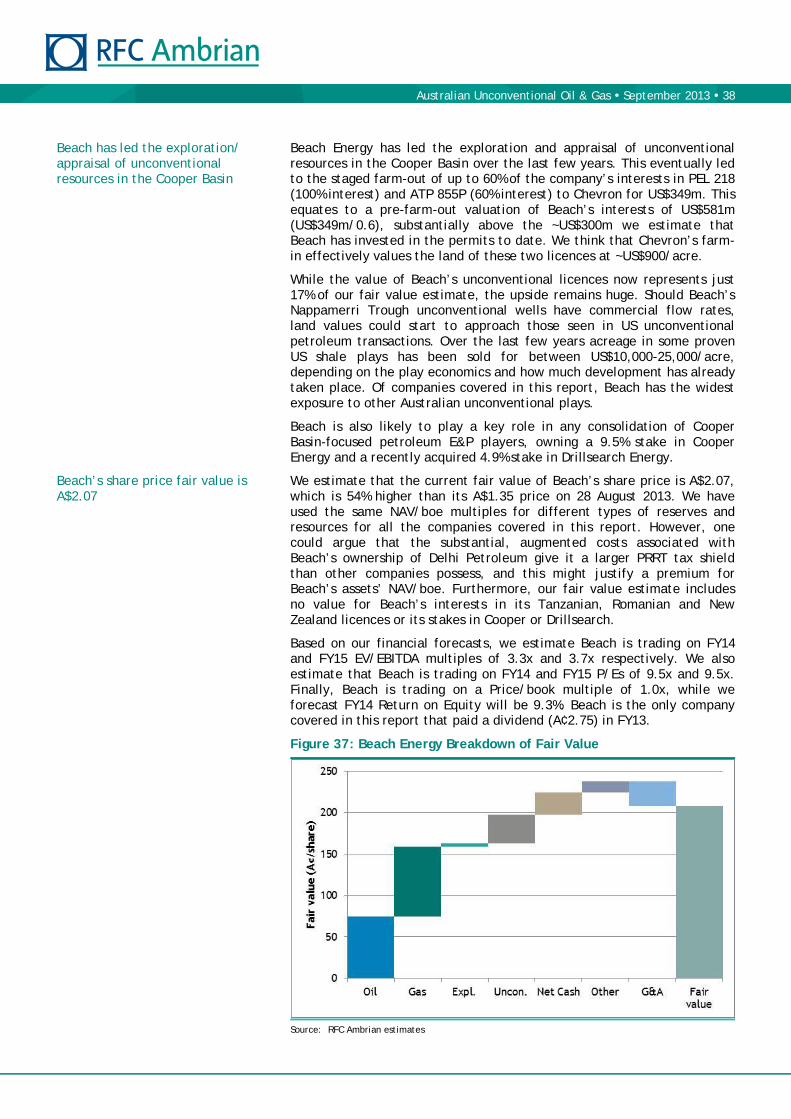
Australian Unconventional Oil & Gas September 2013 38
Beach Energy has led the exploration and appraisal of unconventional resources in the Cooper Basin over the last few years. This eventually led to the staged farm-out of up to 60% of the company’s interests in PEL 218 (100% interest) and ATP 855P (60% interest) to Chevron for US$349m. This equates to a pre-farm-out valuation of Beach’s interests of US$581m (US$349m/0.6), substantially above the ~US$300m we estimate that Beach has invested in the permits to date. We think that Chevron’s farm-in effectively values the land of these two licences at ~US$900/acre.
While the value of Beach’s unconventional licences now represents just 17% of our fair value estimate, the upside remains huge. Should Beach’s Nappamerri Trough unconventional wells have commercial flow rates, land values could start to approach those seen in US unconventional petroleum transactions. Over the last few years acreage in some proven US shale plays has been sold for between US$10,000-25,000/acre, depending on the play economics and how much development has already taken place. Of companies covered in this report, Beach has the widest exposure to other Australian unconventional plays.
Beach is also likely to play a key role in any consolidation of Cooper Basin-focused petroleum E&P players, owning a 9.5% stake in Cooper Energy and a recently acquired 4.9% stake in Drillsearch Energy.
We estimate that the current fair value of Beach’s share price is A$2.07, which is 54% higher than its A$1.35 price on 28 August 2013. We have used the same NAV/boe multiples for different types of reserves and resources for all the companies covered in this report. However, one could argue that the substantial, augmented costs associated with Beach’s ownership of Delhi Petroleum give it a larger PRRT tax shield than other companies possess, and this might justify a premium for Beach’s assets’ NAV/boe. Furthermore, our fair value estimate includes no value for Beach’s interests in its Tanzanian, Romanian and New Zealand licences or its stakes in Cooper or Drillsearch.
Based on our financial forecasts, we estimate Beach is trading on FY14 and FY15 EV/EBITDA multiples of 3.3x and 3.7x respectively. We also estimate that Beach is trading on FY14 and FY15 P/Es of 9.5x and 9.5x. Finally, Beach is trading on a Price/book multiple of 1.0x, while we forecast FY14 Return on Equity will be 9.3%. Beach is the only company covered in this report that paid a dividend (A¢2.75) in FY13.
Figure 37: Beach Energy Breakdown of Fair Value
Source: RFC Ambrian estimates
Beach has led the exploration/ appraisal of unconventional resources in the Cooper Basin
Beach’s share price fair value is A$2.07

Australian Unconventional Oil & Gas September 2013 39
Risks
Beach Energy is subject to the usual risks that a mid-cap upstream petroleum exploration and production company faces. These include: geological/technical, political/regulatory, commercial, operational, capital access, weather related and environmental.
A key risk that is more specific to Cooper Basin oil producers is that they may not be able to replace or grow their Cooper Basin 2P oil reserves over time. While the economics of Western Flank oil are great, this is partly due to the aquifer-supported accelerated production profile of new discoveries. The vast majority of recoverable oil reserves are produced in the first five or six years; this leads to low reserve lives. Indeed, Beach’s Cooper Basin oil assets only have a 6-year reserve life based on FY13 production and 2P reserves (8 years based on 2P reserves + 2C contingent resources).
Beach is planning a A$85-100m FY14 conventional petroleum exploration programme, and some of the planned exploration wells might not be successful. Even in the Cooper Basin where success rates, while drilling on 3D seismic, are around 48%, the failure of an individual exploration well is more likely than success.
The Cooper Basin is prone to flooding. In 2010 the biggest flood in 30 years prevented exploration and development activity in much of the basin for several months. At the time, production from many Western Flank oil fields, such as Chiton in PEL 91, was trucked to Moomba, and this was not possible over the unsealed roads in the region. The recent installation of pipelines from the Bauer, Growler and Snatcher fields to Moomba should allow production to continue from these and other connected fields even if flooding recurs. Nonetheless, any recurrence could severely affect Beach’s other activity in the region.
Unconventional petroleum production is yet to be proved commercial in Australia. Should petroleum prices and flow rates from unconventional wells not be sufficient to give an economic return on the investment, Australia’s unconventional resources will not be developed.
Management
Mr Davis joined Beach in July 2007 as a Non-executive Director, and was appointed Deputy Chairman in June 2009. He has expertise and experience in the execution of large legal and commercial transactions and corporate activity as a solicitor and partner of DMAW Lawyers, which he founded. He is also director of the ASX-listed companies Monax Mining (since 2004) and Marmota Energy (since 2006).
Mr Nelson brings considerable technical expertise and knowledge of the petroleum industry to the Board. He joined Beach in 1992 as an Executive Director, was appointed Chief Executive Officer in 1995 and Managing Director in 2002. He has a career spanning over four decades as an exploration geophysicist in the minerals and petroleum industries. He was Chairman of the Australian Petroleum Production and Exploration Association (APPEA) from 2004 to 2006.
Glenn Davis — Non-executive Chairman
Reginald Nelson — Managing Director

Australian Unconventional Oil & Gas September 2013 40
Operations
Beach holds more than 300 exploration and production tenements in Australia, the US, Egypt, Tanzania, Romania, and New Zealand, with both prospective conventional and unconventional hydrocarbons. In June 2013, Beach had 2P reserves of 92.7MMboe and 2C contingent resources of 448.9MMboe. The company had 17.9MMbbl of developed 2P oil reserves (and 4.1MMbbl undeveloped). It also had 32.4MMboe of developed 2P gas and gas liquid reserves (and 38.3MMboe undeveloped). The company’s main focus remains the Cooper Basin, Australia, as can be seen from its production and June 2013 petroleum reserves and contingent resources in Tables 11 and 12 below. The potential for Cooper Basin unconventional gas to be a game-changer for Beach is obvious, as 2C contingent unconventional resources made up around 60% of the company’s total 2P reserves + 2C contingent resources. Beach has interests in several concessions that are targeting East African rift plays: Gulf of Suez, Mesaha and Lake Tanganyika.
Table 11: FY12 and FY13 Production
Product
Net production FY12
Net production FY13
Growth (%)
Cooper Basin (CB) Oil (MMbbl) 2.751 3.616 31.4
Egypt Oil 0.020 0.131 555.0
US Oil 0.019 0.010 -47.4
Total Oil 2.791 3.758 34.6
CB Sales Gas and Ethane (PJ) 23.0 20.5 -10.9
CB LPG (000t) 48.1 43.8 -8.9
CB Condensate (MMbbl) 0.349 0.348 -0.3
Total Oil and Gas (MMboe) 7.503 7.996 6.6
Source: Beach Energy
Table 12: June 2013 Reserves and Resources
2P reserves 2C contingent resources
Location
Oil
(MMboe)
Gas Liquids (MMBoe)
Gas
(MMboe)
Oil
(MMboe)
Gas Liquids (MMboe)
Gas
(MMboe)
Cooper Basin: Conventional
21.2 11.5 59.2 7.0 17.1 78.6
Cooper Basin: Unconventional
- - - - - 318.9
Other 0.8 - - 10.1 3.1 14.1
Total 22.0 11.5 59.2 17.1 20.2 411.6
Source: Beach Energy, RFC Ambrian estimates
Conventional
Cooper-Eromanga Basin — Australia
The Cooper-Eromanga Basin spans the north-eastern part of South Australia and the south-western part of Queensland. The Cooper Basin is entirely covered by the Mesozoic Eromanga Basin. The first gas discovery in the Cooper Basin was made in 1963, and the first oil in 1970. The Eromanga Basin is composed of early Jurassic to late Cretaceous sediments, overlying the older Cooper Basin unconformably. This unconformity provides a migration pathway for Permian-sourced hydrocarbons to reach overlying reservoirs. The first Eromanga Basin oil discoveries were made in 1987, and since then exploration has encountered oil and gas accumulations from the Permian through to the Cretaceous.

Australian Unconventional Oil & Gas September 2013 41
SACB JV (20.21%) & SWQ JV (20-40%) Permits
Beach participates in two joint ventures, split by state into the South Australia Cooper Basin Joint Venture (SACB JV) and the South West Queensland Joint Venture (SWQ JV). Beach acquired its interest in these joint ventures when it bought Delhi Petroleum in 2006. Delhi Petroleum has a royalty agreement with Exxon, which was renegotiated last year. The renegotiated royalty takes the form of an annual payment to Exxon of a percentage of the net cashflow (before corporate tax) of Delhi’s Cooper-Eromanga Basin business, subject to a minimum payment of US$40m over the first five years. The renegotiated royalty agreement will expire on 31 December 2030.
Beach owns a 20.21% interest in the SACB JV and between 20-40% interests in the various licences covered by the SWQ JV (an average ~23.2%). Both JVs are operated by Santos. They cover 20 exploration licences and 282 production licences (see Figure 38). In total the licences cover around 26,800km2 and contain 190 producing gas fields and 115 producing oil fields. The JVs also own the main Cooper Basin petroleum infrastructure, including: the Moomba and Ballera processing and storage facilities, 5,600km of gathering systems, 65 satellite compressors, the Ballera-Moomba raw gas pipeline (180km), the Moomba-Port Bonython oil pipeline (659km) and the Port Bonython and Jackson oil facilities.
Figure 38: Cooper Basin SACB JV and SWQ JV Licences
Source: Beach Energy
The JVs produce sales gas, ethane, NGLs and crude oil. Production by the JVs fell steadily from its peak level of 160Mboepd in 2000 to 70Mboepd in 2010. In 2011 the decline was arrested by an infill drilling programme: the JVs produced 11,600bpd of oil, 3,860bpd of condensate, 5,470bpd of LPG and 242MMcfpd of gas in the March 2013 quarter, according to APPEA. Santos’s infill drilling programme includes plans to drill 600 new wells from ~100 pads connected by 300km of new gathering pipeline over the next 15 years. Santos is targeting an increase in gas production of 30% by 2015. To achieve this it plans to drill 40 infill wells in 2013 and 70 in 2014 (up from 27 wells in 2012 and 17 in 2011).

Australian Unconventional Oil & Gas September 2013 42
Figure 39: SACB JV and SWQ JV Production
Source: APPEA, RFC Ambrian estimates
Western Flank — Operated Permits
Beach operates 20 oil fields on the Western Flank of Cooper-Eromanga, where the Eromanga sandstone reservoirs are well positioned to receive oil and gas charge from the deeper Cooper Basin source rocks. The high-margin oil production in PEL 91 and PEL 92 generates strong cashflow, and we believe that significant exploration upside still exists in these licences. In PEL 106B and PEL 107 wet gas discoveries have been made and put on-stream. Investment has been made in infrastructure, including new oil pipelines to link the Cooper Basin Western Flank oil acreage to Moomba. Beach operated Cooper Basin permits produced 8,630bpd of oil in the March 2013 quarter, according to APPEA.
PEL 91 (Beach: 40% & operator, Drillsearch: 60%)
PEL 91 covers 1,972km2 of the south-western flank of the Patchawarra Trough. Beach farmed into the licence in December 2002, and became operator. The Modiolus 3D seismic survey in the south-west corner of PEL 91 identified new drilling targets, with the first commercial oil discovery on the permit, Chiton-1, testing over 2,400bpd. This well started producing in February 2010. However, it was heavily affected by the Cooper Creek flooding and was shut in from May 2011 to January 2012. The recently-constructed Bauer-Lycium 10Mbpd pipeline allowed PEL 91 to produce a gross ~7.6Mbpd in 4Q13.
Bauer-1 was drilled in summer 2011 had free flow at 15,000bpd during an 80 minute flow test, before being put on production at an initial rate of 800bopd via a trucking operation. A further nine development wells have been drilled in the Bauer field. Management expects that the further development and appraisal work on the field should result in an increase in ultimate recovery for the field to around 10MMbbl (gross), approximately 5MMbbl above the June 2012 booking.
PEL 91 is well covered by 3D seismic. In January 2012 two 3D surveys were completed: the 320km2 Aquillus and 151km2 Limbatus. More recently, the multi-permit Irus survey, with 196km2 within PEL 91, was finished. The acquisition of the 485km2 Caseolus 3D seismic survey has just finished and is currently being processed.
Over the last 12 months Beach has drilled six exploration wells in PEL 91 and made five discoveries (Pennington-1, Bauer North-1, Kalladeina-2, Sceale-1 & Congony-1). The successful exploration wells have been cased and suspended as future producers. Only the Smoky-1 well in the far north-east of the permit was plugged and abandoned. The Pennington prospect is estimated to have gross mean recoverable oil of >2MMbbl.
‐
20
40
60
80
100
120
140
1976 1978 1980 1982 1984 1986 1988 1990 1992 1994 1996 1998 2000 2002 2004 2006 2008 2010 2012
Production (Mboep
d)
CrudeCondensateLPGSales gas
Figure 40: Bauer Oil Field, PEL 91
Source: Beach Energy
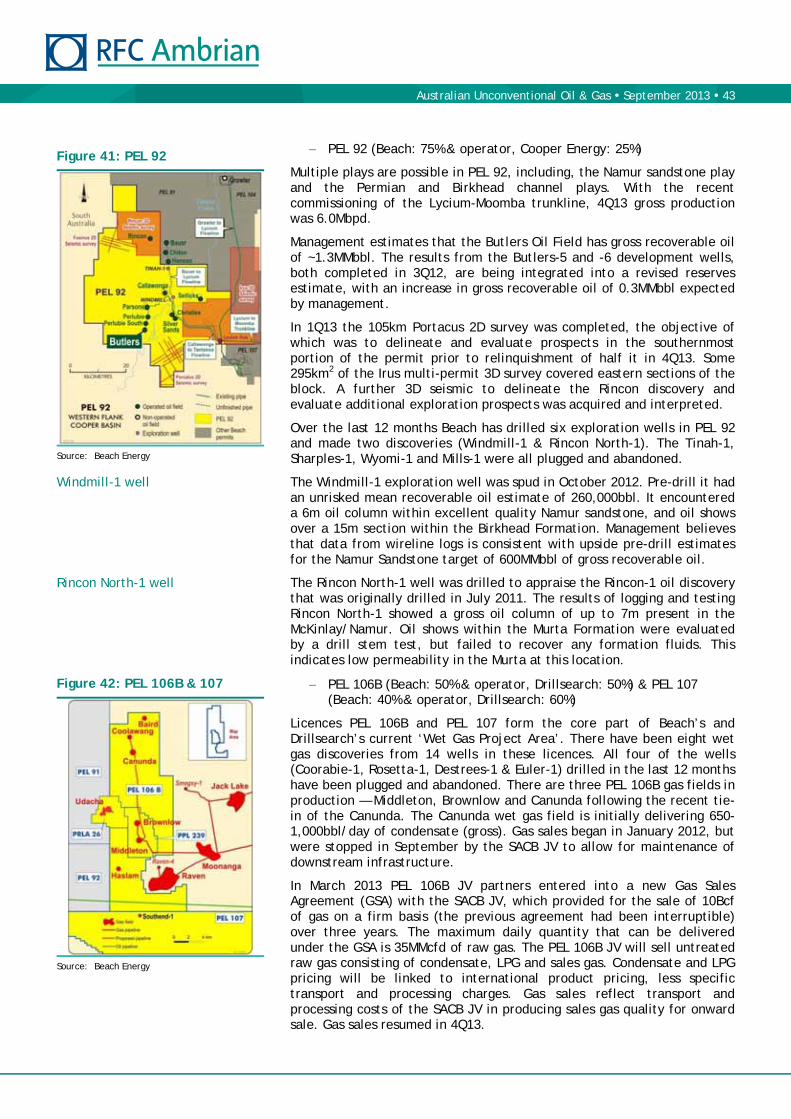
Australian Unconventional Oil & Gas September 2013 43
PEL 92 (Beach: 75% & operator, Cooper Energy: 25%)
Multiple plays are possible in PEL 92, including, the Namur sandstone play and the Permian and Birkhead channel plays. With the recent commissioning of the Lycium-Moomba trunkline, 4Q13 gross production was 6.0Mbpd.
Management estimates that the Butlers Oil Field has gross recoverable oil of ~1.3MMbbl. The results from the Butlers-5 and -6 development wells, both completed in 3Q12, are being integrated into a revised reserves estimate, with an increase in gross recoverable oil of 0.3MMbbl expected by management.
In 1Q13 the 105km Portacus 2D survey was completed, the objective of which was to delineate and evaluate prospects in the southernmost portion of the permit prior to relinquishment of half it in 4Q13. Some 295km2 of the Irus multi-permit 3D survey covered eastern sections of the block. A further 3D seismic to delineate the Rincon discovery and evaluate additional exploration prospects was acquired and interpreted.
Over the last 12 months Beach has drilled six exploration wells in PEL 92 and made two discoveries (Windmill-1 & Rincon North-1). The Tinah-1, Sharples-1, Wyomi-1 and Mills-1 were all plugged and abandoned.
The Windmill-1 exploration well was spud in October 2012. Pre-drill it had an unrisked mean recoverable oil estimate of 260,000bbl. It encountered a 6m oil column within excellent quality Namur sandstone, and oil shows over a 15m section within the Birkhead Formation. Management believes that data from wireline logs is consistent with upside pre-drill estimates for the Namur Sandstone target of 600MMbbl of gross recoverable oil.
The Rincon North-1 well was drilled to appraise the Rincon-1 oil discovery that was originally drilled in July 2011. The results of logging and testing Rincon North-1 showed a gross oil column of up to 7m present in the McKinlay/Namur. Oil shows within the Murta Formation were evaluated by a drill stem test, but failed to recover any formation fluids. This indicates low permeability in the Murta at this location.
PEL 106B (Beach: 50% & operator, Drillsearch: 50%) & PEL 107 (Beach: 40% & operator, Drillsearch: 60%)
Licences PEL 106B and PEL 107 form the core part of Beach’s and Drillsearch’s current ‘Wet Gas Project Area’. There have been eight wet gas discoveries from 14 wells in these licences. All four of the wells (Coorabie-1, Rosetta-1, Destrees-1 & Euler-1) drilled in the last 12 months have been plugged and abandoned. There are three PEL 106B gas fields in production — Middleton, Brownlow and Canunda following the recent tie-in of the Canunda. The Canunda wet gas field is initially delivering 650-1,000bbl/day of condensate (gross). Gas sales began in January 2012, but were stopped in September by the SACB JV to allow for maintenance of downstream infrastructure.
In March 2013 PEL 106B JV partners entered into a new Gas Sales Agreement (GSA) with the SACB JV, which provided for the sale of 10Bcf of gas on a firm basis (the previous agreement had been interruptible) over three years. The maximum daily quantity that can be delivered under the GSA is 35MMcfd of raw gas. The PEL 106B JV will sell untreated raw gas consisting of condensate, LPG and sales gas. Condensate and LPG pricing will be linked to international product pricing, less specific transport and processing charges. Gas sales reflect transport and processing costs of the SACB JV in producing sales gas quality for onward sale. Gas sales resumed in 4Q13.
Figure 41: PEL 92
Source: Beach Energy
Windmill-1 well
Rincon North-1 well
Figure 42: PEL 106B & 107
Source: Beach Energy
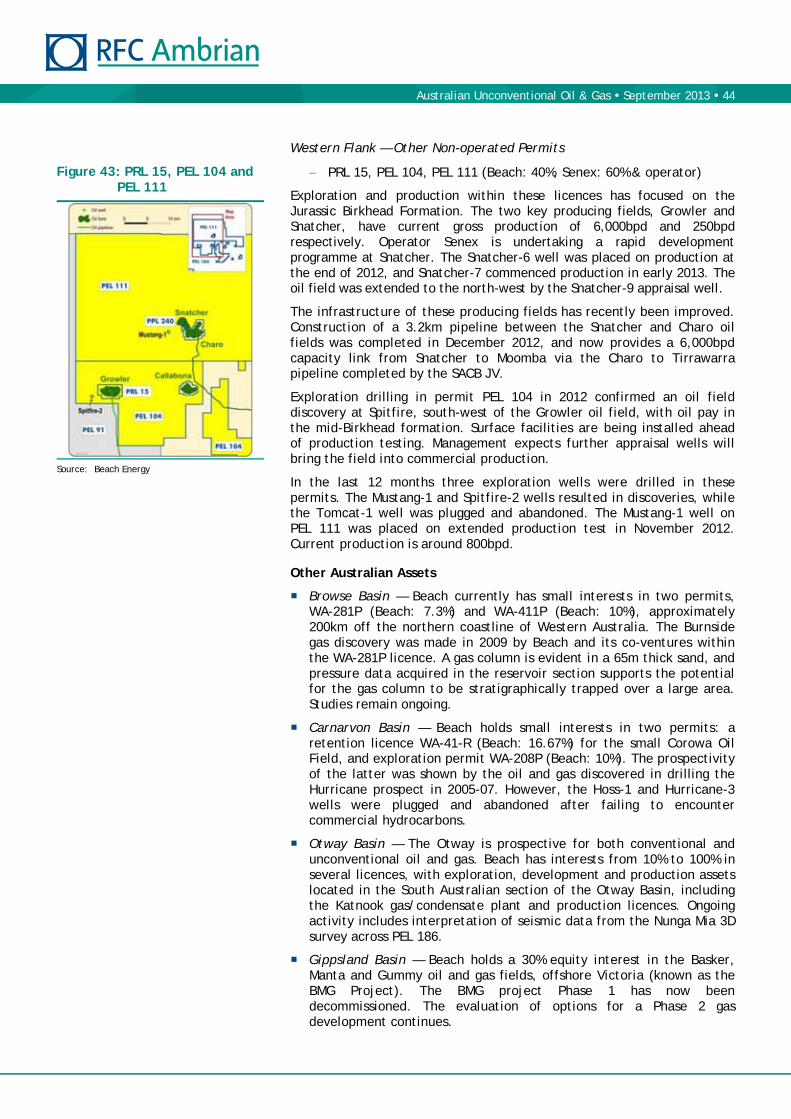
Australian Unconventional Oil & Gas September 2013 44
Western Flank — Other Non-operated Permits
PRL 15, PEL 104, PEL 111 (Beach: 40%, Senex: 60% & operator)
Exploration and production within these licences has focused on the Jurassic Birkhead Formation. The two key producing fields, Growler and Snatcher, have current gross production of 6,000bpd and 250bpd respectively. Operator Senex is undertaking a rapid development programme at Snatcher. The Snatcher-6 well was placed on production at the end of 2012, and Snatcher-7 commenced production in early 2013. The oil field was extended to the north-west by the Snatcher-9 appraisal well.
The infrastructure of these producing fields has recently been improved. Construction of a 3.2km pipeline between the Snatcher and Charo oil fields was completed in December 2012, and now provides a 6,000bpd capacity link from Snatcher to Moomba via the Charo to Tirrawarra pipeline completed by the SACB JV.
Exploration drilling in permit PEL 104 in 2012 confirmed an oil field discovery at Spitfire, south-west of the Growler oil field, with oil pay in the mid-Birkhead formation. Surface facilities are being installed ahead of production testing. Management expects further appraisal wells will bring the field into commercial production.
In the last 12 months three exploration wells were drilled in these permits. The Mustang-1 and Spitfire-2 wells resulted in discoveries, while the Tomcat-1 well was plugged and abandoned. The Mustang-1 well on PEL 111 was placed on extended production test in November 2012. Current production is around 800bpd.
Other Australian Assets
Browse Basin — Beach currently has small interests in two permits, WA-281P (Beach: 7.3%) and WA-411P (Beach: 10%), approximately 200km off the northern coastline of Western Australia. The Burnside gas discovery was made in 2009 by Beach and its co-ventures within the WA-281P licence. A gas column is evident in a 65m thick sand, and pressure data acquired in the reservoir section supports the potential for the gas column to be stratigraphically trapped over a large area. Studies remain ongoing.
Carnarvon Basin — Beach holds small interests in two permits: a retention licence WA-41-R (Beach: 16.67%) for the small Corowa Oil Field, and exploration permit WA-208P (Beach: 10%). The prospectivity of the latter was shown by the oil and gas discovered in drilling the Hurricane prospect in 2005-07. However, the Hoss-1 and Hurricane-3 wells were plugged and abandoned after failing to encounter commercial hydrocarbons.
Otway Basin — The Otway is prospective for both conventional and unconventional oil and gas. Beach has interests from 10% to 100% in several licences, with exploration, development and production assets located in the South Australian section of the Otway Basin, including the Katnook gas/condensate plant and production licences. Ongoing activity includes interpretation of seismic data from the Nunga Mia 3D survey across PEL 186.
Gippsland Basin — Beach holds a 30% equity interest in the Basker, Manta and Gummy oil and gas fields, offshore Victoria (known as the BMG Project). The BMG project Phase 1 has now been decommissioned. The evaluation of options for a Phase 2 gas development continues.
Figure 43: PRL 15, PEL 104 and PEL 111
Source: Beach Energy
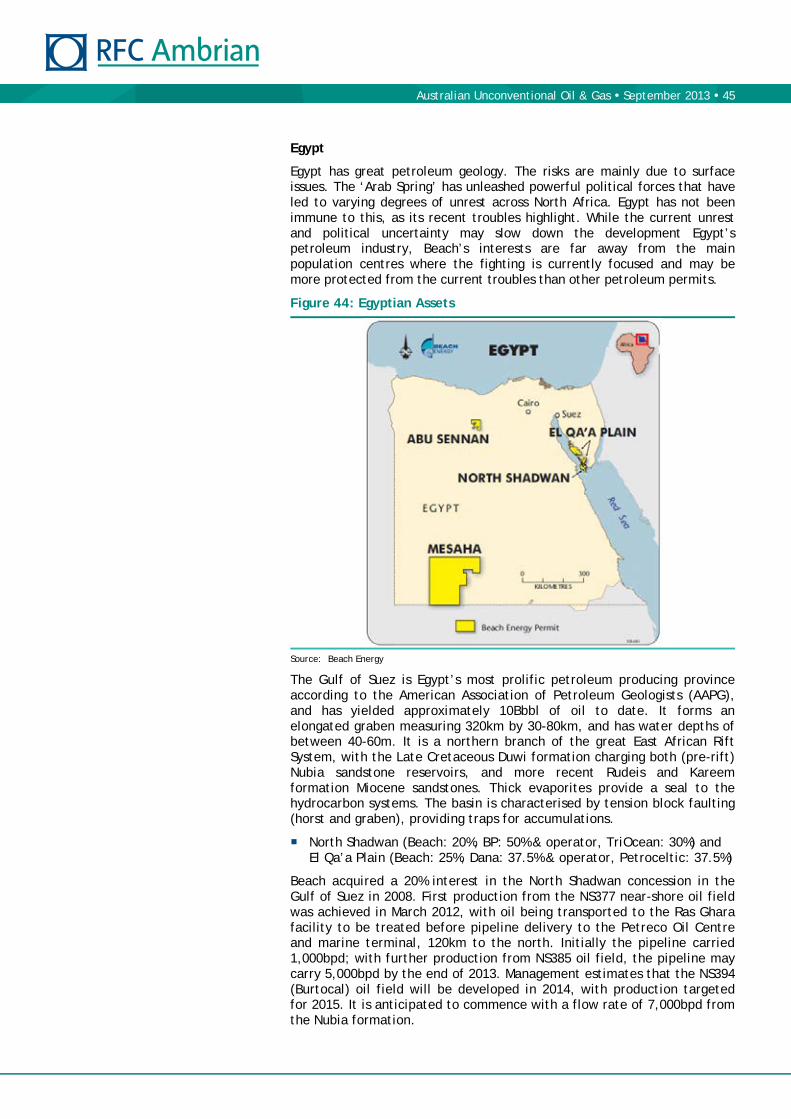
Australian Unconventional Oil & Gas September 2013 45
Egypt
Egypt has great petroleum geology. The risks are mainly due to surface issues. The ‘Arab Spring’ has unleashed powerful political forces that have led to varying degrees of unrest across North Africa. Egypt has not been immune to this, as its recent troubles highlight. While the current unrest and political uncertainty may slow down the development Egypt’s petroleum industry, Beach’s interests are far away from the main population centres where the fighting is currently focused and may be more protected from the current troubles than other petroleum permits.
Figure 44: Egyptian Assets
Source: Beach Energy
The Gulf of Suez is Egypt’s most prolific petroleum producing province according to the American Association of Petroleum Geologists (AAPG), and has yielded approximately 10Bbbl of oil to date. It forms an elongated graben measuring 320km by 30-80km, and has water depths of between 40-60m. It is a northern branch of the great East African Rift System, with the Late Cretaceous Duwi formation charging both (pre-rift) Nubia sandstone reservoirs, and more recent Rudeis and Kareem formation Miocene sandstones. Thick evaporites provide a seal to the hydrocarbon systems. The basin is characterised by tension block faulting (horst and graben), providing traps for accumulations.
North Shadwan (Beach: 20%, BP: 50% & operator, TriOcean: 30%) and El Qa’a Plain (Beach: 25%, Dana: 37.5% & operator, Petroceltic: 37.5%)
Beach acquired a 20% interest in the North Shadwan concession in the Gulf of Suez in 2008. First production from the NS377 near-shore oil field was achieved in March 2012, with oil being transported to the Ras Ghara facility to be treated before pipeline delivery to the Petreco Oil Centre and marine terminal, 120km to the north. Initially the pipeline carried 1,000bpd; with further production from NS385 oil field, the pipeline may carry 5,000bpd by the end of 2013. Management estimates that the NS394 (Burtocal) oil field will be developed in 2014, with production targeted for 2015. It is anticipated to commence with a flow rate of 7,000bpd from the Nubia formation.

Australian Unconventional Oil & Gas September 2013 46
The Joint Study Group was notified of its successful bid for the El Qa’a plain block in the EGPC 2011 international bid round. The block covers an area of 1,823 km2 and is located onshore on the eastern side of the Gulf of Suez, which includes the coastal boundary of North Shadwan.
Figure 45: North Shadwan Figure 46: Abu Sennan
Source: Beach Energy Source: Beach Energy
Abu Sennan (Beach: 22%, Kuwait Energy: 50% & operator, Dover Investments: 30%)
In August 2010 Beach acquired a 22% interest in the Abu Sennan concession within the prolific Abu Gharadig Basin in the Western Desert. The Western Desert has hydrocarbon reserves trapped in four-way dip closures, or small fault-controlled structures with low vertical relief. Mesozoic sediments are derived from a fluvial system that flowed northwards to a shallow marine sea, giving rise to deltas and shallow marine deposition. Most proven hydrocarbons are within the Cretaceous Bahariya and Late Cretaceous Abu Roash formations.
A six-well exploration programme was drilled in 2H11/1H12, delivering four discoveries that flowed oil, gas and condensate at a combined gross rate of ~12,000boepd. The GPZZ-4, Al Ahmadi-1, El Salymiya-1 and Al Jahraa-1 discoveries were all close to existing infrastructure, enabling them to be brought on stream quickly. In August 2012 commercial production commenced, with a total production flow rate of 2,200boepd across the four wells. The ASA-1X-ST2 exploration well reached the Kharita Formation in early 2013, with the zones of interest currently being evaluated. The ASC-1X exploration well was plugged and abandoned, while the ASB-1X exploration well is currently being drilled. This year the Al Ahmadi-2X and El Salymiya-2 appraisal wells successfully encountered oil. The El Salmiya-2 well flowed oil at a rate of 3,530bpd and 4.7MMcfd of gas. The operator estimated gross 2P reserves of 18.5MMbbl of oil and 142Bcf of gas in the Kharita Formation only.
Mesaha (Beach: 15%, Kuwait Energy: 50% & operator, Dover Investments: 30%)
In 2008 Beach acquired a 15% interest in the Mesaha concession. This licence covers 42,700km2, the largest in Egypt, in the south-west of the country. The Mesaha-1 wildcat exploration well was the first well to be drilled in the Mesaha graben. It tested the stratigraphic section on the flank of a structure identified from recent 2D seismic data. However, it was plugged and abandoned in February 2013 after failing to find hydrocarbons.

Australian Unconventional Oil & Gas September 2013 47
Tanzania
Beach won the 7,200km2 Lake Tanganyika South Block in 2008, and signed a production sharing agreement with Tanzania Petroleum Development Corporation in June 2010. Beach holds a 100% interest (and is operator) in the block, which covers the southern portion of the Tanzanian side of the lake, within the western arm of the East African Rift System. The Miocene to recent rifting event created all the major lakes within East Africa, and has created numerous play types in the basin, including large rotated fault blocks, horst structures and down-thrown closures against the major basin bounding faults.
Historic 2D seismic and work from the 1980s suggests a sufficient thickness of inter-layered sands and shales present for hydrocarbon generation, with natural oil seeps on the lake indicating a working petroleum system. Airborne gravity and high-resolution aeromagnetic data was acquired in 2010. An additional 2,080km of 2D seismic was completed on the lake in August 2012, and is currently being processed.
Given the 2007 discovery of oil by Tullow by Lake Albert in Uganda, and the more recent Lockichar Basin oil discoveries in Kenya, we believe that Beach’s Tanzanian acreage, although at an early stage of exploration, is one of the most exciting conventional oil permits that Beach possesses.
Figure 47: Lake Tanganyika South Block Figure 48: 2D Seismic Line Distribution
Source: Beach Energy Source: Beach Energy
Prospectivity of the block has been enhanced by large oil discoveries at Lake Albert to the north in Uganda and in Kenya

Australian Unconventional Oil & Gas September 2013 48
Romania
In 2012 Beach farmed into a 30% interest in the 1,000km2 Est Cobalcescu concession in the Black Sea. The other licence partners are Petroceltic (40% and operator) and Petromar Resources (30%). The licence lies in water depths of less than 100m, with proven hydrocarbon plays nearby. Exxon-Mobil announced a 3Tcf discovery on adjacent acreage at Domino-1 in March 2012, and the Olimpiskiyi (30MMboe) and Lebada (270MMboe) oil and gas fields lie to the east.
Under the terms of the farm-in Beach will carry Petroceltic’s capital requirements, capped at US$4.8m for the forward work programme, as well as its own interest, at a total net cost to Beach in 2012 of US$8.4m. During 2012 the entire permit was covered by 3D seismic. Prospect selection is ongoing ahead of exploration, drilling planned for the September quarter of 2013.
New Zealand
Beach entered New Zealand in 2005, with interests in two offshore exploration permits. PEP 52717 in the Canterbury Basin off the east coast of the South Island will have a short programme of seismic reprocessing, geological review and prospect generation. PEP 52181 contains the Kaheru prospect in the southern Taranaki Basin, North Island. The proposed well location is in shallow water, 12km offshore. It is to the east of the producing Kupe gas and oil field, and management expects it to be drilled in late 2013.
Figure 49: Est Cobalcescu
Source: Beach Energy
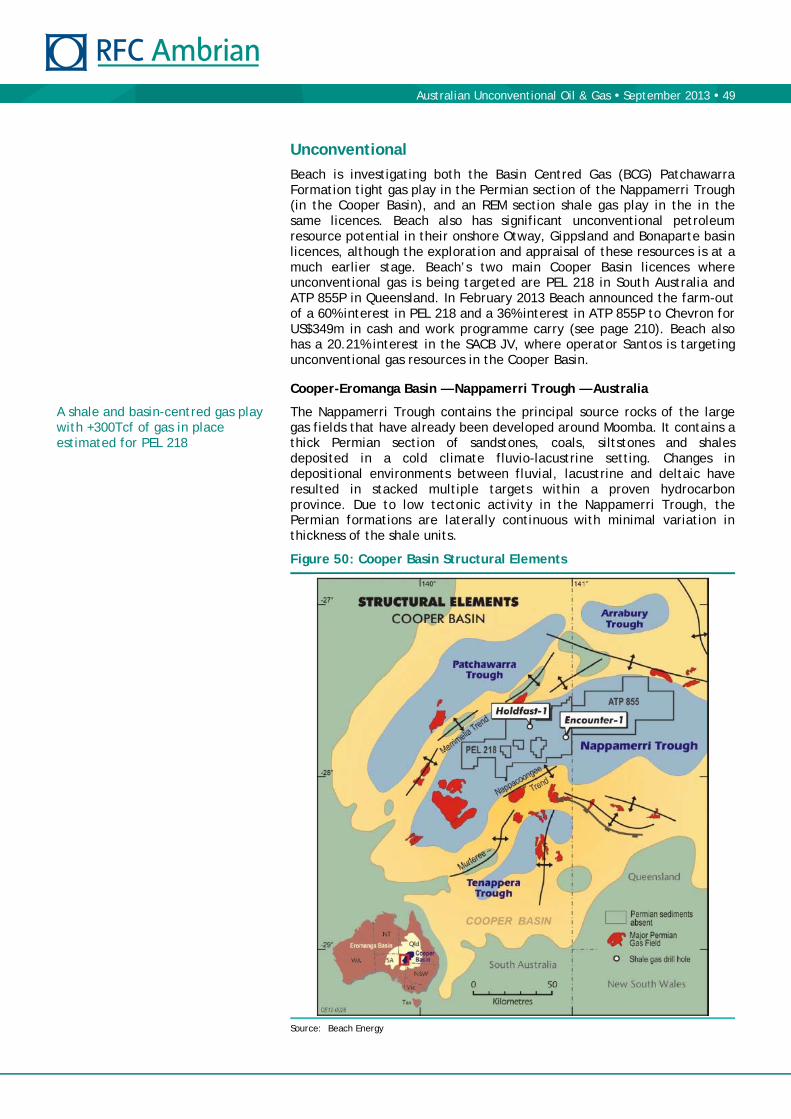
Australian Unconventional Oil & Gas September 2013 49
Unconventional
Beach is investigating both the Basin Centred Gas (BCG) Patchawarra Formation tight gas play in the Permian section of the Nappamerri Trough (in the Cooper Basin), and an REM section shale gas play in the in the same licences. Beach also has significant unconventional petroleum resource potential in their onshore Otway, Gippsland and Bonaparte basin licences, although the exploration and appraisal of these resources is at a much earlier stage. Beach’s two main Cooper Basin licences where unconventional gas is being targeted are PEL 218 in South Australia and ATP 855P in Queensland. In February 2013 Beach announced the farm-out of a 60% interest in PEL 218 and a 36% interest in ATP 855P to Chevron for US$349m in cash and work programme carry (see page 210). Beach also has a 20.21% interest in the SACB JV, where operator Santos is targeting unconventional gas resources in the Cooper Basin.
Cooper-Eromanga Basin — Nappamerri Trough — Australia
The Nappamerri Trough contains the principal source rocks of the large gas fields that have already been developed around Moomba. It contains a thick Permian section of sandstones, coals, siltstones and shales deposited in a cold climate fluvio-lacustrine setting. Changes in depositional environments between fluvial, lacustrine and deltaic have resulted in stacked multiple targets within a proven hydrocarbon province. Due to low tectonic activity in the Nappamerri Trough, the Permian formations are laterally continuous with minimal variation in thickness of the shale units.
Figure 50: Cooper Basin Structural Elements
Source: Beach Energy
A shale and basin-centred gas play with +300Tcf of gas in place estimated for PEL 218

Australian Unconventional Oil & Gas September 2013 50
Initial Cooper Basin shale gas studies were focused on the Permian Roseneath Shale, Epsilon Formation and Murteree Shale (REM section). Further studies have also assessed whether a basin-centred gas play existed in the low permeability sands within the Toolachee and Patchawarra formations. The REM section extends over an area of several thousand kilometres, and has high organic content, thermal maturity, and over pressurisation. The REM package’s main relevant characteristics are:
Total Organic Carbon (TOC) within the Roseneath and Murteree Shale generally ranges from 2-4%, and up to 7% TOC within the Epsilon Formation. Cuttings showed that good quality Type II kerogens dominate. This is unusual as the successful US shale gas plays involve marine rather than lacustrine shales.
The prospective REM section has a vitrinite reflectance of 2-4%, with the exact level of thermal maturity depending on location within the trough. The high maturity is believed to be due to radioactive granites in the basement rocks producing a large heat flow. With this level of maturity, the Permian sequence is expected to be within the dry gas window, and gas recoveries from drill stem tests (DST) have contained significant percentages (8% to 24%, average 15%) of carbon dioxide.
Drill stem tests and mud weights indicate that the Epsilon and Patchawarra formations are over-pressured and that the over-pressure is confined to the Nappamerri Trough. The regional pressure gradient is 0.43 psi/ft, while the pressure gradient in Nappamerri Trough, based on DST information over the Epsilon and Patchawarra formations, is about 0.72 psi/ft.
The mineralogy of the Roseneath and Murteree shales is consistent with the successful Barnett and Haynesville Shale plays, with high quartz and feldspar content (~50%). This should be beneficial for effective hydraulic fracturing and could lead to good well productivity. The presence of 30% siderite in the shales of the REM also increases the brittleness. As is expected from the section maturity, illite is the dominant clay type (20%), although there is also some kaolinite. Importantly, no swelling clays, which impede effective hydro-fracturing, have been found to date
Beach-operated Permits (PEL 218 and ATP 855P)
Beach estimates that PEL 218 has unconventional gas-in-place in excess of 300Tcf. Beach has drilled 12 vertical wells and 1 horizontal shale gas well in PEL 218 and ATP 855P. The drilling component of Stage 1 with Chevron in PEL 218 is almost complete, with one further horizontal well to be drilled (Boston-3). Five of these wells have been fracture stimulated to date.
In 2011/12 Beach drilled and completed its first two shale gas wells. The Encounter-1 and Holdfast-1 were vertical wells, drilled to assess the potential shale play REM section through coring, logging, fracture stimulation and flow testing. The Moonta-1 well followed and was designed to investigate the potential BCG tight gas Patchawarra play. Following the success of these three wells, Beach has drilled a further nine vertical wells and one horizontal well, and is in the process of hydro-fracturing and testing them. The results of this programme are summarised below.

Australian Unconventional Oil & Gas September 2013 51
Figure 51: Beach’s Unconventional Cooper Basin Wells
Source: Beach Energy
Australian Unconventional Oil & Gas September 2013 52
In July 2011 the Holdfast-1 well underwent seven fracture stimulation stages across ~350m of the Roseneath Shale, Epsilon Formation, Murteree Shale and Patchawarra Formation. The maximum flow rate from the well was ~2MMcfpd of gas, through a 32/64 choke.
The Encounter-1 well was drilled to a vertical depth of 3,620m. It initially had just one fracture stimulation stage in the Patchawarra Formation. Initial production from this one stage was ~0.75MMcfpd of gas. In July 2012 a second phase of fracture stimulation resulted in five further stages being completed over 250m of the REM section. This delivered a peak gas flow of 1.3MMcfpd, which, when combined with the first phase fracture stimulation in the Patchawarra Formation, delivered a peak total flow for the well of up to 2.1MMcfpd.
This was followed by the drilling of the Moonta-1 well, which was designed to test the basin-centred gas (BCG) tight gas play and was drilled to 3,810m. This well was fracture stimulated over ten zones — nine in the Patchawarra Formation and one in the Murteree Shale. Moonta-1 delivered an initial gas flow rate of 2.6MMcfpd in January 2013, although Beach management believes that not all of the fracture zones are making a material contribution. The shallower Permian targets within Moonta-1 (the Toolachee, Daralingie, Roseneath and Epsilon formations) were not fracture stimulated and Beach is assessing whether to stimulate these zones later in 2013.
In October 2012 Beach finished drilling the Halifax-1 well (in ATP 855P) to a total depth of 4,266m. It had a thicker REM section (460m) than prior Beach-operated wells in the Nappamerri Trough. The Patchawarra Formation was greater than 490m thick.
The well underwent 14 fracture stimulation stages across the whole of the gas-saturated Permian target zone, including seven stages in the Toolachee, Daralingie, Roseneath, Epsilon, Murteree formations and seven stages in the Patchawarra Formation. It had a peak gas flow rate of 4.2MMcfpd; however, due to a faulty temperature gauge the maximum recommended temperature for the wellhead was exceeded. The faulty temperature gauge was discovered prior to the shut-in of the well due to rain, at which point the well was flowing at 3.5MMcfpd. After the well was re-opened it flowed briefly at 4.5MMcfpd, and was choked back to 2.0MMcfpd to maintain temperatures within the desired operating conditions. The last reported flow rate was 0.9MMcfpd in June 2013.
The Streaky-1 vertical was designed to test the BCG tight gas play further. It was drilled to 3,821m in the Tirrawarra Sandstone. A nine-stage fracture stimulation programme has been completed on the well, with eight stages in the deeper Patchawarra and one in the shallower Murteree Shale. The post-fracture stimulation clean out of Streaky-1 was delayed initially because down-hole equipment became stuck, and Beach had to await the arrival of specialised fishing equipment. Mechanical issues were then experienced with the coiled tubing operations required to prepare the Streaky-1 well for flow testing. Flow testing is now due to start in September/October.
Holdfast-1 well
Encounter-1 well
Moonta-1 well
Halifax-1 well
Streaky-1 well

Australian Unconventional Oil & Gas September 2013 53
Figure 52: Halifax-1 Fracture Stimulation Figure 53: Halifax-1 Schematic
Source: Icon Energy Source: Icon Energy
The Boston-1, Nepean-1 and Dashwood-1 wells have been drilled to 3,755m, 3,527m and 4,021m respectively. They are all planned to have multiple fracture stimulation stages in the REM section and the Patchawarra and Toolachee formations. The wells have been logged, cased and suspended, awaiting fracture stimulation. Two further ATP 855P vertical unconventional wells have also been drilled (Hervey-1 and Keppel-1).
The Boston-2 vertical well, located 320m south-east of the Boston-1 well, was drilled to a total depth of 3,803m. Wireline logging was undertaken to evaluate the depths, thickness and gas saturation of the target zones within the well. Boston-2 will initially be used for recording down-hole micro-seismic observations during the Boston-1 fracture stimulation.
The Marble-1 well was spud in September 2012 and was drilled to 3,962m. Its primary targets are the REM section and tight gas in the Patchawarra Formation. The well was planned to have three Epsilon, one Murteree and nine Patchawarra fracture stimulation stages. When we visited the site in May the well was in the middle of its 12-stage fracture stimulation programme, undergoing coiled tubing operations. There were 16 pumping trucks on site, each with 2,000hp. The whole fracture spread had a maximum treating pressure of 13,300psi and was capable of pumping at a rate of 80bbl/minute (double the rate used at Holdfast-1 and Encounter-1). Each stimulation stage was planned to use 8,000bbl of fluid (1.3ML) and 170,000lb of proppant. The fracture stimulation programme has finished. We expect the results of a flow test to be announced in the next quarter.
Beach’s first horizontal fracture stimulated well, Holdfast-2, was spud in December 2012, 1km north of Holdfast-1. It has been drilled horizontally for ~0.6km through the Murteree Shale, ~3km deep. Management initially planned a 15-stage fracture stimulation for this well. However, as the horizontal section is shorter than initially planned, we believe an 8 to 12-stage fracture stimulation will be performed later this year.
Boston-3 is the second horizontal well in the programme. It is planned that the well will be drilled later this year.
Boston-1, Nepean-1, Dashwood-1, Hervey-1 and Keppel-1 wells
Boston-2 well
Marble-1 well
Holdfast-2 well
Boston-3 well

Australian Unconventional Oil & Gas September 2013 54
SACB JV and SWQ JV Permits
Beach also has exposure to unconventional resources within the SACB JV and SWQ JV permits, operated by Santos (see Figure 38, page 41 for map of these licences). Santos’ Cooper Basin unconventional focus is on the SACB JV acreage and Beach owns a 20.21% interest in this JV. Santos plans for the JV to spend US$200m over three years (2012-14) to evaluate optimal well and fracture designs, with the aim of converting resources into reserves and establishing material production by 2015. Santos’ programme comprises drilling three horizontal and a further four vertical wells, together with multiple in-wellbore projects.
DeGoyler and McNaughton assessed that Santos had Cooper Basin net contingent 2C unconventional resources of 2.3Tcf in 2011. The commissioning of the Moomba-191 well (which was only 350m from a pipeline) in September 2012 allowed Santos to book the first Australian 2P shale gas reserves at the end of 2012.
Figure 54: Santos SACB JV Unconventional Work Programme and Well Locations
Source: Santos

Australian Unconventional Oil & Gas September 2013 55
Santos started its SACB JV exploration and appraisal of the REM section in 2006, with the gathering of dedicated shale core from Moomba-175 well. A further shale-targeted core and log evaluation of the Moomba-185 well was completed in 2011. The Moomba-191 well was drilled and completed at the end of 2011/beginning of 2012. Santos is planning a pilot production project around the Gaschnitz-1 well in 2014/15. The pilot concept involves drilling three appraisal wells and nine development pilot wells. Subject to realising commercial flow rates from exploration and pilot wells, Santos hopes to start development of the SACB JV unconventional resources in 2016.
The Moomba-191 well was drilled to 3,000m during the 4Q11. The well had three large hydro-fracture stages across the REM section of the well in 2Q12. The initial flow rate was >3MMcfpd, while the first month average flow rate was 2.7MMcfpd. The production logging showed that the majority of the gas flow was from the Murteree Shale. Santos estimated that the EUR (2P reserves) of this well were 3Bcf in November 2012.
According to Santos, with estimated well and connection costs of A$10m for vertical wells optimised for production and estimated recovery per well of 3-6Bcf, Moomba-191 type wells are economic with a A$6/GJ gas price. We think that the horizontal wells will provide a great opportunity for significantly better economics than that.
The Gaschnitz-1, Roswell-1, Moomba-192 (Aurora-1), and Van der Waals-1 wells have all been drilled and are awaiting batched hydro-fracture (planned for 2H13). The Gaschnitz-1 well was drilled to a total depth of some 4,000m and will test the basin-centred gas accumulation and shale gas resources within this region of the Nappamerri Trough. The planned production pilot project is around this well, and Santos plans to shoot 3D seismic over the project area in late 2013. The Roswell-1 will test the gas potential of the Patchawarra Formation deep coals and the REM interval. The well will also be used for micro-seismic monitoring of the fracture stimulation programme in the yet to be drilled Roswell-2 horizontal well, which will target the Roseneath Shale.
Santos plans to drill two further vertical wells this year to test for sweet spots within the BCG tight gas play: Langmuir-1 and Fortuna-1.
Santos also plans to drill three horizontal wells over the next 18 months to test the effectiveness of differing well/fracture stimulation designs: Roswell-2, Moomba-193H (Aurora-2) and Fortuna-2. The Roswell-2 well is planned to have a 300m lateral length through the Roseneath Shale and five fracture stages. The Moomba-193H well is planned to have a 915m lateral length through the Murteree Shale and ten fracture stages. The Fortuna-2 well is planned to have a 1,520m lateral length through the Murteree Shale and 15-20 fracture stages. All three wells will utilise micro-seismic fracture diagnostics in surrounding vertical wells to help assess the fracture stimulated volume of rock.
Moomba-191 well
Gaschnitz-1, Roswell-1, Moomba-192 and Van der Waals-1 wells
Langmuir-1 and Fortuna-1 vertical wells
Roswell-2, Moomba-193H and Fortuna-2 horizontal wells

Australian Unconventional Oil & Gas September 2013 56
Australia — Other Permits/Basins
Cooper Basin PEL 94 (Beach Energy 50% and operator, Strike: 35%, Senex Energy: 15%)
The licence covers 1,804km2. PEL 94 was originally granted in November 2001 to Beach Petroleum and Magellan Petroleum. The Davenport-1 well was drilled to test the deep coal seam gas potential of the Permian interval within the Milpera Trough in April 2012. It reached a total depth of 2,102m and 110m of net coal was encountered, including one seam 45m thick in the Patchawarra Formation. It also intersected the Roseneath, Epsilon and Murteree (REM) formations. Elevated gas shows were recorded across all the target formations. Cores were successfully recovered from the Patchawarra in a sidetrack operation and the well was cased and suspended for further testing.
Cooper Basin PEL 95 (Beach Energy 50% and operator, Strike: 50%)
This licence covers 2,581km2. It was originally granted to Beach Petroleum and Magellan Petroleum in October 2001. The Marsden-1 well was spud in February 2012 as an unconventional evaluation well to test the potential of the Toolachee, REM and Patchawarra formations in the Battunga Trough. A total depth of 2,625m was achieved in early April. The well encountered 804m of Permian section, including thick shales, coals and sands. Mudlogs recorded the presence of natural gas liquids up to pentane (C5). The presence of these indicates that the source rocks are in the wet gas window at the Marsden-1 well location. The Toolachee and Murteree formations were successfully cored, but deteriorating borehole conditions prevented cores being recovered from the Patchawarra Formation. Logs are consistent with results from Senex Energy’s Vintage Crop-1 and Sasanof-1 wells in PEL 516 to the north. The well was cased and suspended pending further testing.
Otway Basin
In addition to conventional gas, condensate and oil, Otway is prospective for tight gas. Beach has a 50% interest and operatorship in PEP 168, and 66.7% and operatorship of PEL 186. Beach farmed into a 35% interest in PEL 495 by paying 70% of the cost of the Sawpit-2 well. This well was drilled to a total depth of 2,585m. Mud-gas shows (C1-C4) were observed in the Casterton Shale. Also, three conventional cores, totalling 54m, were recovered from shales in the Sawpit and Casterton formations.
Bonaparte Basin
This basin is underexplored as it was generally not thought to be hugely prospective for conventional oil and gas fields. This has resulted in a lack of quality modern seismic. However, Beach has identified both conventional and deep unconventional targets. Management points to a working petroleum system, as identified by shows in a few wells, oil staining in mineral cores and oil seeps at the surface. The Weaber gas field is adjacent to Beach’s acreage. The company is looking to undertake an aeromagnetic and gravity survey in 2013.
Figure 55: Otway, Gippsland, and Bonaparte Basin Licences
Source: Beach Energy
Cooper Basin PEL 94
Cooper Basin PEL 95

Australian Unconventional Oil & Gas September 2013 57
Valuation
We estimate that the current fair value of Beach’s share price is A$2.07/share, which is roughly 54% higher than its A$1.35 price on 28 August 2013. We outline our key assumptions behind this NAV-based fair value estimate below.
Based on our financial forecasts we estimate Beach is trading on FY14 and FY15 EV/EBITDA multiples of 3.6x and 3.7x respectively. We also estimate that Beach is trading on FY14 and FY15 P/E multiples of 9.5x and 9.5x respectively. Finally, Beach is trading on Price/book multiple of 1.0x, while we forecast FY14 Return on Equity will be 9.3%.
Key NAV Assumptions
For Our Current Fair Value Estimate
We have used Beach’s 2P reserves and 2C contingent resources as at 30 June 2013. We have subtracted 0.2MMbbl of 2P oil reserves to reflect the announced sale of its joint venture assets in the Williston Basin, USA. We have added the US$14.5m proceeds from this to Beach’s net cash position.
We have estimated Beach’s wet gas reserves and resources (on a boe basis) by multiplying its gas liquid levels by 3x (ie, we have assumed that the gas makes up 67% of total reserves/resources on a boe basis).
We have assumed that the remainder of Beach’s gas reserves/resources are dry gas.
We have used our standard US$/boe NAV estimates for Cooper Basin oil, wet gas and dry gas reserves and resources.
We have, arbitrarily, used US$10/boe US and Egyptian 2P oil reserves, and US$5/boe other 2C contingent resources.
In line with Beach’s guidance, we have assumed a FY14 conventional petroleum work programme costing A$100m.
We have assumed that Chevron farms in for the full 60% of Beach’s interest in PEL 218 and ATP 855P. We have valued Beach’s remaining 40% interest at the same valuation as Chevron paid (US$349m x 0.4/0.6 = US$233m). Future cash payments by Chevron and work programme carry value for Stage 2 of the farm-in are worth US$159m (ie, we have assumed Beach has already received ~US$190m from Chevron for Stage 1 prior to 30 June 2013 and that this is part of its cash balance at this date).
We have valued Beach’s unconventional Cooper Basin interests in the SACB JV, the SWQ JV, PEL 94 and PEL 95 licences by multiplying Beach’s net acreage by a US$100/acre multiple. We have valued Beach’s unconventional Otway, Gippsland and Bonaparte basin interests at our estimate of Beach’s costs incurred to date.
Beach had cash of A$348m at 30 June 2013.
We estimated the value of Beach’s G&A expense by annualising the addition of its 1H13 employee benefits expense (A$11.2m) and other expenses (US$4.1m), and putting the result over our real 7.5% discount rate (roughly equivalent to a nominal 10% discount rate).
Other assumptions can be seen in Table 13.

Australian Unconventional Oil & Gas September 2013 58
Table 13: Beach Energy Estimated Net Asset Value per Share
Net Oil and Gas NPV
Unrisked NPV Pg Pd
Risked NPV
Risked NPV
Reserves/Resources (MMboe) (US$/boe) (US$m) (%) (%) (US$m) (A¢/share)
Cooper Basin Oil
Oil 2P reserves 21.2 34.86 739 100% 100% 739 60.3
Oil 2C resources 7.0 23.27 163 100% 90% 147 12.0
Total CB Oil Business 28.2 902 886 72.2
Cooper Basin Wet Gas
Wet Gas 2P reserves 34.5 14.58 503 100% 80% 403 32.8
Wet Gas 2C resources 34.5 10.37 358 100% 50% 179 14.6
Total CB Wet Gas Business 69.0 861 581 47.4
Cooper Basin Dry Gas
Gas 2P reserves 36.2 10.14 367 100% 70% 257 21.0
Gas 2C resources 61.2 6.73 412 100% 50% 206 16.8
Total CB Dry Gas Business 97.4 779 463 37.8
International & other Australian
Egypt & US 2P Oil reserves 0.6 10.00 6 100% 80% 5 0.4
Other 2C resources 10.2 5.00 51 100% 30% 15 1.2
Total Other reserves and resources 10.8 20 1.6
Total Above 205.4 2,542 1,950 159.1
FY14 Work Programme
Western Flank Oil exploration 10.0 23.27 233 50% 90% 105 8.5
Wet Gas exploration 8.0 10.37 83 50% 50% 21 1.7
Dry Gas exploration 2.0 6.73 13 50% 50% 3 0.3
Other exploration 20.0 5.00 100 15% 80% 12 1.0
Work Programme 40.0 429 141 11.5
Unconventional Business
PEL 218 & ATP 855P 233 19.0
SACB JV & SWQ JV licences 139 11.3
PEL 94 and PEL 95 54 4.4
Otway, Gippsland & Bonaparte basins 4 0.3
Total Above 245.4 2,971 2,521 205.6
Other Value adjustments
Net cash/(debt) at June 2013 326 26.6
FY14 exploration expenditure (100) (8.2)
Chevron future carry and payments 159 13.0
Capitalised G&A cost (368) (30.0)
Options 3 0.3
Beach Total fully diluted NAV 2,542 207.3
Current issued shares 1,269.4
Options 17.8
Convertible bond shares 75.0
Current fully diluted shares 1,362.2
Source: Company data, RFC Ambrian estimates

Australian Unconventional Oil & Gas September 2013 59
Forecast Financial Multiples
Our revenue, EBITDA and net profit forecasts are higher than current Bloomberg consensus estimates. We believe that this is largely because the recent fall in US$/A$ is not yet fully incorporated in consensus estimates. Based on our forecast prices and production, we estimate that Beach will generate FY14 and FY15 revenues of A$855m and A$860m respectively (consensus is for A$814m and A$799m respectively). We forecast A$413m EBITDA in FY14 and A$421m EBITDA in FY15 (consensus is A$405m and A$365m). We forecast FY14 net profit of A$180m vs. the Bloomberg consensus forecast of A$179m.
We believe the market looks at 1-2-year forward cashflow and earnings multiples, and that based on these Beach appears undervalued relative to its peers. We estimate that Beach is currently trading on FY14 and FY15 EV/EBITDAX multiples of 3.6x and 3.7x respectively. We estimate that Beach is currently trading on FY14 and FY15 P/E multiples of 9.5x and 9.5x respectively. These levels are in line with the relevant multiples of Drillsearch and Cooper, but below those of Senex.
Beach is trading on a Price/book equity multiple of 1.0x which seems fair given that we forecast an FY14 ROE of 9.3%.
Table 14: Beach Valuation Multiples
28/8/2013 2013 2014F 2015F
Market Cap and EV
Share Price (A$) 1.35
Shares (m) 1,269
Market Cap (A$m) 1,714 1,714 1,714 1,714
Avg net debt/(cash) (A$m) (246) (170) (74)
Enterprise value (A$m) 1,467 1,544 1,640
Cashflow and Profit
EBITDAX (A$m) 355 433 441
Net Profit (A$m) 154 181 180
Valuation Multiples
EV/EBITDAX (x) 4.1 3.6 3.7
P/E (x) 11.2 9.5 9.5
P/BV (x) 1.0 0.9 0.8
ROE 8.6% 9.3% 8.5%
Source: Company data, RFC Ambrian estimates

Australian Unconventional Oil & Gas September 2013 60
Table 15: Beach Key Model Drivers
2010 2011 2012 2013 2014F 2015F
Production
Oil production (Mbbl) 2,600 2,116 2,791 3,748 4,344 4,180
Gas production (PJ) 23.1 21.9 23.0 20.5 23.1 25.1
Gas liquid production (Mboe) 850 810 877 822 935 1,017
Total production (Mboe) 7,300 6,576 7,501 7,987 9,126 9,377
Growth -10% 14% 6% 14% 3%
Prices
Brent oil Price (US$/bbl) 75.24 96.73 112.08 108.78 104.62 98.48
Sydney Gas Price (A$/GJ) 3.19 3.77 5.20 6.00 7.00
Costs
Operating costs (A$/boe) 30.38 32.78 27.41 28.75 28.18 28.18
DD&A (A$/boe) 15.64 15.47 14.49 15.84 15.84 15.84
G&A (A$m) 19 21 25 30 30 30
Capex (A$m) 97 161 262 457 460 460
Effective P&L tax rate 4% 20% 13% 28% 30% 30%
Source: Company data, RFC Ambrian estimates
Table 16: Beach Income Statement
(A$m) 2010 2011 2012 2013 2014F 2015F
Sales 487 496 619 698 855 860
Cost of sales (415) (419) (421) (467) (536) (538)
Gross profit 73 77 197 231 319 322
Net other revenue 60 28 46 32 0 0
Net other expenses (99) (229) (49) (41) (50) (50)
EBIT 35 (124) 195 222 269 272
Interest (0) 3 (7) (8) (11) (15)
EBT 34 (121) 188 214 258 257
Tax (1) 24 (24) (60) (78) (77)
Minorities 0 1 1 0 0 0
Net Profit 33 (97) 165 154 181 180
Source: Company data, RFC Ambrian estimates
Table 17: RFC Ambrian Forecasts vs. Consensus Estimates
2013A 2014F 2015F
Revenue
RFC Ambrian forecast (A$m) 698 855 860
Bloomberg consensus (A$m) 814 799
RFC Ambrian/Consensus (%) 105% 108%
EBITDA
RFC Ambrian forecast (A$m) 348 413 421
Bloomberg consensus (A$m) 405 365
RFC Ambrian/Consensus (%) 102% 116%
Net Profit
RFC Ambrian forecast (A$m) 154 181 180
Bloomberg consensus (A$m) 179 159
RFC Ambrian/Consensus (%) 101% 113%
Source: Bloomberg, RFC Ambrian

Australian Unconventional Oil & Gas September 2013 61
Table 18: Beach Balance Sheet
(A$m) 2010 2011 2012 2013 2014F 2015F
Cash 170 173 379 348 232 155
Receivables 116 54 115 169 207 208
Inventory 91 67 64 76 94 94
Other 19 14 7 6 6 6
Total current assets 396 309 565 599 539 464
PP&E 367 319 337 383
Developed assets 574 536 599 714
Exploration assets 269 365 554 579
PP&E, Expl & Dev 1,210 1,219 1,489 1,677 1,972 2,264
Other 71 60 94 129 129 129
Total non-cur assets 1,281 1,279 1,584 1,805 2,101 2,392
Total assets 1,677 1,588 2,148 2,405 2,640 2,856
Trade payables 94 122 121 127 146 146
Short-term debt 0 0 0 0 0 0
Deferred tax 6 0 0 29 29 29
Other 7 16 6 9 9 9
Total cur liabilities 106 138 128 165 184 185
Long-term debt 0 0 113 120 120 120
Deferred tax 119 105 179 208 259 311
Other 80 72 117 129 129 129
Minorities 1 6 0 0 0 0
Equity 1,370 1,267 1,612 1,783 1,947 2,111
Total non-cur liabs 1,571 1,449 2,021 2,239 2,456 2,671
Total liabilities 1,677 1,588 2,148 2,405 2,640 2,856
Source: Company data, RFC Ambrian estimates
Table 19: Beach Cashflow Statement
(A$m) 2010 2011 2012 2013 2014F 2015F
Net profit 33 (97) 165 154 181 180
Depreciation 182 261 129 133 165 169
Working capital (51) 114 (59) (60) (37) (1)
Other (36) (93) (16) 38 52 51
Operating cashflow 128 185 218 264 361 399
Capex (147) (269) (399) (320) (460) (460)
Other 61 98 62 37 0 0
Investing cashflows (86) (171) (338) (282) (460) (460)
Debt 0 0 145 0 0 0
Equity 19 5 189 0 0 0
Dividends (27) (12) (11) (16) (16) (16)
Other (1) (2) 1 4 0 0
Financing cashflow (9) (10) 325 (12) (16) (16)
Cash at beginning 136 170 173 379 348 232
Net change 34 3 205 (31) (115) (77)
Cash at end 170 173 379 348 232 155
Source: Company data, RFC Ambrian estimates

Australian Unconventional Oil & Gas September 2013 62
Senex Energy has interests in 65 permits (a 72,301km2 net acreage), including 14 operated oil fields. Senex had 2P oil reserves of 10.8MMbbl at the end of June 2013. Its acreage also includes Cooper Basin gas resources and unconventional coal seam gas in the Surat Basin, Queensland.
We initiate on Senex Energy with a HOLD recommendation and a current fair value estimate of A$0.73/share. Senex management has done a good job putting together a significant position in the Cooper Basin Western Flank oil fairway. The company has grown fast both organically and by acquisition (it acquired Stuart Petroleum in 2011). It has just embarked on a 30-well oil exploration and appraisal programme in the Cooper Basin. However, we believe its historic growth and future prospects are already incorporated in its share price. Its fast growth and greater production focus on oil — rather than gas — has allowed the company to trade at substantial cashflow and earnings premiums to other Cooper Basin-focused E&P companies (eg, Beach Energy, Drillsearch Energy and Cooper Energy). Over recent months media speculation about Senex being a potential acquisition target may also have boosted its price relative to other E&P companies.
We estimate that the current fair value of Senex is A$0.73/share, which is roughly in line with its A$0.72 price. We calculate that its current 2P oil reserves make up only A$0.34 of the stock’s fair value.
We estimate that Senex is currently trading on FY14 and FY15 EV/EBITDAX multiples of 7.4x and 7.6x respectively. These levels are 2x higher than the relevant multiples of Beach and Drillsearch. While some premium might be justified given Senex’s larger running room within its acreage to make further Western Flank oil discoveries, we believe the current premium is too high. This is not because we believe Senex is overvalued, but rather because Beach and Drillsearch are undervalued.
Table 20: Financial Forecasts
Yr to Jun (A$m) 2011 2012 2013 2014F 2015F
Revenue 13.2 70.4 147.9 181.6 187.6
EBITDAX 0.4 25.3 92.4 96.5 100.0
Profit/(Loss) (3.5) 8.9 61.0 65.4 58.1
Source: Company data, RFC Ambrian estimates
28 August 2013 Senex Energy
Hold Sensible Value
Stuart Amor +44 (0)20 3440 6826 [email protected]
Emily Ashford +44 (0)20 3440 6821 [email protected]
Price (A$) 0.72
Fair Value (A$) 0.73
Ticker SXY-AU
Market cap (A$m) 821.7
Estimated cash (A$m) 126.8
2P reserves + 2C resources (MMboe) 404
Shares in issue
Basic (m) 1,140.8
Fully diluted (m) 1,157.4
52-week
High (A$) 0.850
Low (A$) 0.475
3m-avg daily vol (000) 4,101
3m-avg daily val (A$000) 2,582
Top shareholders (%)
Sentient Executive 16.2
Australian Foundation Inv 4.1
Elphinstone Holdings Pty 2.9
Robert Bryan 2.8
Bow Energy 1.4
Total 27.4
Management
Denis Patten NE-CHR
Ian Davies MD & CEO
Andrew Price CFO
James Crowley GM Expl
Share Price Performance (A$)
Source: Bloomberg, Company reports
0
5
10
15
20
25
$0.00
$0.20
$0.40
$0.60
$0.80
$1.00
Aug‐12 Nov‐12 Feb‐13 May‐13 Aug‐13
Millions

Australian Unconventional Oil & Gas September 2013 63
Investment Summary
We are initiating on Senex Energy with a HOLD recommendation and a current fair value estimate of A$0.73/share. Senex management has done a good job putting together a significant position in the Cooper Basin Western Flank oil fairway. The company has grown fast, both organically and by acquisition. The company has just announced a 15-year tenure retention deal with the South Australian Government. So, why do we have a HOLD rating? It is just a valuation call. Senex’s fast growth and greater production focus on oil — rather than gas — has allowed it to trade at substantial cashflow and earnings premiums to other Cooper Basin-focused E&P companies (eg, Beach Energy, Drillsearch Energy and Cooper Energy). Over recent months media speculation about Senex being a potential acquisition target may also have boosted its price relative to other companies.
Senex has interests in 65 permits (a 72,301km2 net acreage), including 14 operated oil fields. Senex is targeting three main conventional and unconventional petroleum plays: oil production on the Western Flank of the Cooper-Eromanga Basin; conventional and unconventional wet gas/dry gas in both the southern and northern Cooper Basin; and coal seam gas in the Surat Basin, Queensland. Senex had 2P oil reserves of 10.8MMbbl at the end of June 2013. In our view, Senex’s extensive acreage across the Cooper Basin Western Flank gives it more potential upside from undiscovered oil fields than any of Beach, Drillsearch or Cooper. However, we believe this potential is already incorporated into its share price.
While Senex’s oil production grew from 0.6MMbbl in FY12 to 1.2MMbbl in FY13, the quarterly oil production profile shows that this was due to very rapid growth to a temporary peak level in September 2012, followed by three quarters of small production declines. The company has just embarked on a 30-well oil exploration and appraisal programme in the Cooper Basin and we have forecast growth to resume again next year. Our forecast production profile results in FY14 production of 1.46MMbbl (within management’s guidance of 1.4-1.6MMbbl). We have not included any gas and gas liquid production, because without an appropriate farm-out we believe there will not be significant production from the contingent resources of the Hornet gas field by mid-2015.
Figure 56: Senex Petroleum Production Profile
Source: Company data, RFC Ambrian estimates
Good company, shame about the valuation
Senex has a net acreage 72,301km2
A great growth story
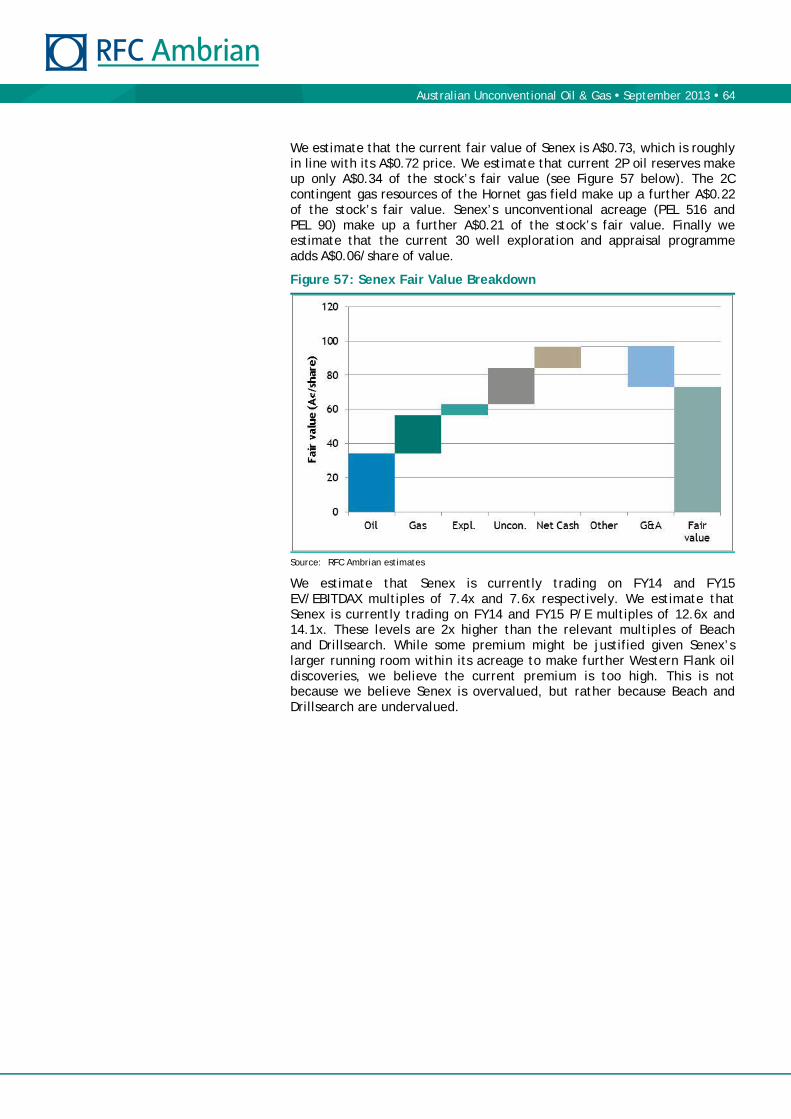
Australian Unconventional Oil & Gas September 2013 64
We estimate that the current fair value of Senex is A$0.73, which is roughly in line with its A$0.72 price. We estimate that current 2P oil reserves make up only A$0.34 of the stock’s fair value (see Figure 57 below). The 2C contingent gas resources of the Hornet gas field make up a further A$0.22 of the stock’s fair value. Senex’s unconventional acreage (PEL 516 and PEL 90) make up a further A$0.21 of the stock’s fair value. Finally we estimate that the current 30 well exploration and appraisal programme adds A$0.06/share of value.
Figure 57: Senex Fair Value Breakdown
Source: RFC Ambrian estimates
We estimate that Senex is currently trading on FY14 and FY15 EV/EBITDAX multiples of 7.4x and 7.6x respectively. We estimate that Senex is currently trading on FY14 and FY15 P/E multiples of 12.6x and 14.1x. These levels are 2x higher than the relevant multiples of Beach and Drillsearch. While some premium might be justified given Senex’s larger running room within its acreage to make further Western Flank oil discoveries, we believe the current premium is too high. This is not because we believe Senex is overvalued, but rather because Beach and Drillsearch are undervalued.

Australian Unconventional Oil & Gas September 2013 65
Risks
A key risk to our HOLD recommendation for Senex is that media and analyst speculation that the company is an acquisition target turns out to be true. Should another company bid for Senex, the bid may push the share price higher. Longer term, Senex could generate substantial value from developing its Hornet tight gas field or its other Cooper Basin unconventional resources should the geology and economics of extraction allow.
Senex is subject to the usual risks that an upstream petroleum exploration and production company faces. These include: geological/technical, political/regulatory, commercial, operational, capital access and environmental.
Senex, like other Cooper Basin oil producers, may not be able to replace or grow its Cooper Basin 2P oil reserves over time. While the economics of Western Flank oil are great, this is partly due to the aquifer-supported accelerated production profile of new discoveries. The vast majority of recoverable oil reserves are produced in the first five or six years. This generally leads to low reserve lives: Senex’s Cooper Basin oil assets have an 8.5 year reserve life based on FY13 production and its current 2P reserves.
The Cooper Basin is prone to flooding. In 2010 the biggest flood in 30 years prevented exploration and development activity in much of the basin for several months. Production from many Western Flank oil fields, was trucked to Moomba, and this was not possible over the unsealed roads in the region. The installation of pipelines connecting the Growler and Snatcher fields to Moomba should allow production to continue from these and other connected fields, even if flooding recurs. Nonetheless, a recurrence could severely affect Senex’s other activity in the region.
Unconventional petroleum production is yet to be proved commercial in Australia. Should petroleum prices and flow rates from unconventional wells not be sufficient to give an economic return on the investment, Australia’s unconventional resources will not be developed.
Management
Mr Patten was appointed Chairman of Senex in March 2008. He has more than forty years’ experience in the energy and resource industries, both in Australia and internationally. He has held senior executive positions with ASEA Australia, CMPS&F Pty, PT CMP Indonesia and a number of major Australian onshore oil and gas drilling companies. He was the founding director of Queensland Gas Company, retiring from the board in 2007.
Mr Davies joined Senex as Managing Director in mid-2010, bringing a proven track record in delivering rapid business growth. He joined Senex from QGC, where he was Chief Financial Officer from 2007. Previously Mr Davies was an investment banker in Melbourne with Austock Corporate Finance, and with Barclays Capital. He began his career in the Energy and Mining Division of PricewaterhouseCoopers in Brisbane.
Denis Patten — Non-executive Chairman
Ian Davies — Managing Director

Australian Unconventional Oil & Gas September 2013 66
Operations
Senex has interests in 65 permits (a 72,301km2 net acreage), including 14 operated oil fields. Senex is targeting three main conventional and unconventional petroleum plays:
oil production on the Western Flank and Southern region of the Cooper-Eromanga Basin;
conventional and unconventional wet gas/dry gas in both the southern and northern Cooper Basin; and
unconventional coal seam gas in the Surat Basin, Queensland.
The Cooper-Eromanga Basin spans the north-eastern region of South Australia, and the south-western region of Queensland. The Cooper Basin is entirely covered by the Mesozoic Eromanga Basin. It is one of a number of remnant late Carboniferous to early Permian depocentres that lay in the interior of the Gondwana Supercontinent. The first gas discovery was made in the Cooper Basin in 1963, and the first oil in 1970. The Eromanga Basin is composed of early Jurassic to late Cretaceous sediments, overlying the older Cooper Basin unconformably. This unconformity provides a migration pathway for Permian-sourced hydrocarbons to reach overlying reservoirs. First oil discoveries were made in 1987, and since then exploration has encountered oil and gas accumulations from the Permian through to the Cretaceous.
Figure 58: Senex Licences
Source: Senex

Australian Unconventional Oil & Gas September 2013 67
Senex production has increased dramatically over the last few years. It produced 1.244MMbbl in FY13, up 107% from the 0.600MMbbl it produced in FY12. The rise was due to a dramatic increase in Western Flank oil production that benefited from new pipelines connecting the Growler and Snatcher oil fields to infrastructure connected to Moomba. Management guidance is that oil production will be between 1.4-1.6MMbbl in FY14.
Table 21: Senex Production
Net Production FY12
Net Production FY13
Growth (%)
Oil (Mbbl) 600 1,244 107
Source: Senex Energy
Senex had net proven and probable (2P) oil reserves of 10.8MMbbl at the end of June 2013. Subsequent to this reporting date, Senex announced that it had agreed to sell its 15% interest in the Cuisinier oil field (PL 303) and ATP 725P for A$20m. These interests represented 0.6MMbbl of 2P oil reserves. Senex also announced that it had booked 835Bcf of 2C contingent gas resources for the Hornet field (PEL 115 and PEL 516). Senex management believes that the gas accumulation intersected by the Hornet-1, Kingston Rule-1 and other nearby wells has characteristics similar to many existing Santos-operated fields, that produce conventional gas from the Patchawarra Formation.
Table 22: Senex Net Conventional Reserves and Contingent Resources (30 June 2013)
Business segment
2P reserves (MMboe)
2C contingent
resources (MMboe)
2P reserves + 2C contingent
resources (MMboe)
Cooper Basin Oil* 10.8 0.0 10.8
Hornet gas field 0.0 139.0 139.0
Total* 10.8 139.0 149.8
*Includes 0.6MMbbl of Cuisinier oil field and ATP 752 2P reserves. Subsequent to 30 June Senex announced that it had agreed to sell these reserves; Source: Senex
Senex updated its net 2P coal seam gas (CSG) reserves on 25 February 2013 to 156.6PJ (it also said that it had net 2C contingent CSG resources of 240.5PJ). These reserves and resources are independently estimated by MHA Petroleum Consultants. Senex’s management also believes that it has >100Tcf of unconventional shale gas and tight gas in place. At the end of June 2013 Senex booked 1.1Tcf (186MMboe) of unconventional 2C contingent gas resources around its Sasanof-1 (PEL 516) and Paning-1/Paning-2 (PEL 90) wells.
Tenure Retention Deal with South Australian Government
In August 2013 Senex announced that it and the South Australian Government had agreed a 15-year petroleum retention licence scheme to enable more efficient exploration and appraisal across Senex’s operated oil permits in the South Australian Cooper-Eromanga Basin. The agreement covers 9,753km2 of Senex-operated oil exploration permits in the basin, including the prolific Western Flank Oil Fairway (see Figure 59 overleaf for a map of the covered permits). The deal envisages a 15-year scheme, with an initial five-year term and provision for two further five-year terms.
The agreement allows Senex to convert petroleum exploration licences (PELs) to more secure petroleum retention licences (PRLs). It replaces tenure-specific expenditure obligations with a portfolio-wide oil exploration and appraisal expenditure target enabling efficient and targeted investment.
Conventional reserves and resources
Unconventional reserves and resources
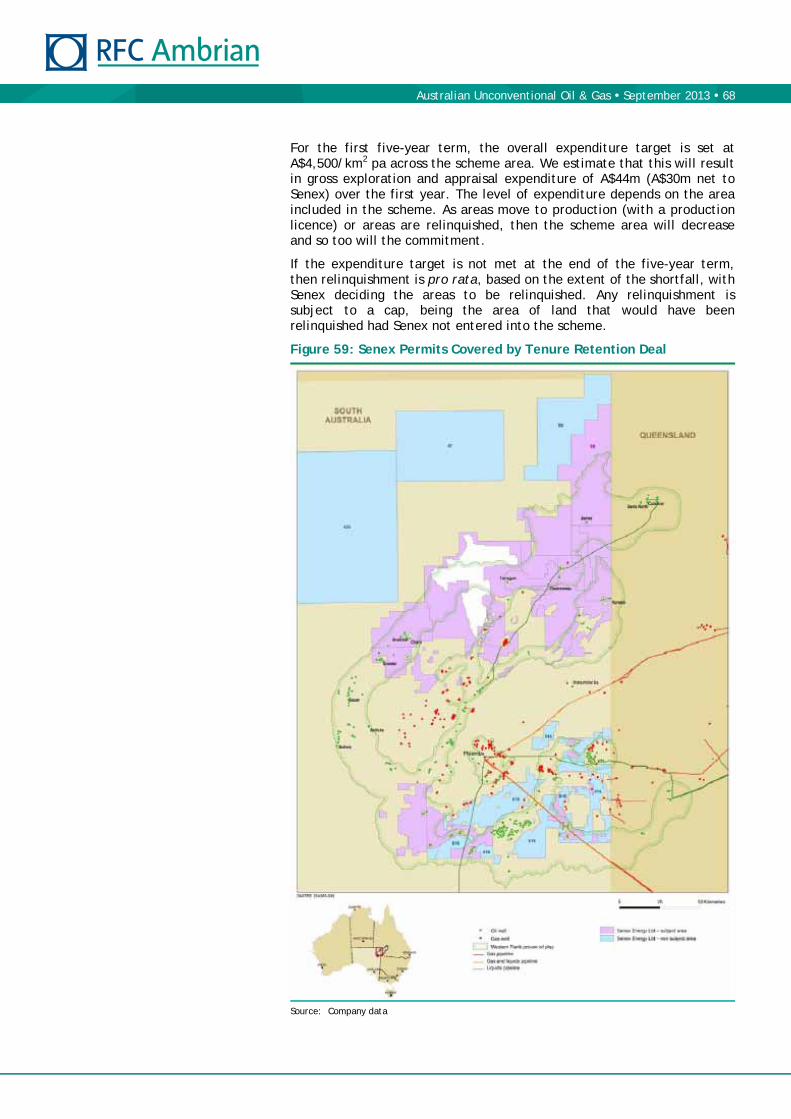
Australian Unconventional Oil & Gas September 2013 68
For the first five-year term, the overall expenditure target is set at A$4,500/km2 pa across the scheme area. We estimate that this will result in gross exploration and appraisal expenditure of A$44m (A$30m net to Senex) over the first year. The level of expenditure depends on the area included in the scheme. As areas move to production (with a production licence) or areas are relinquished, then the scheme area will decrease and so too will the commitment.
If the expenditure target is not met at the end of the five-year term, then relinquishment is pro rata, based on the extent of the shortfall, with Senex deciding the areas to be relinquished. Any relinquishment is subject to a cap, being the area of land that would have been relinquished had Senex not entered into the scheme.
Figure 59: Senex Permits Covered by Tenure Retention Deal
Source: Company data

Australian Unconventional Oil & Gas September 2013 69
Conventional — Oil
Senex has interests in 6,100km2 of licences covering the Western Flank oil fairway (see Figure 60 below for a map). According to its March 2013 presentation, its average interest in these licences is 60% and it has operatorship of all the South Australian licences, where management see significant further potential (and has recently drilled two successful appraisal wells: Worrior-8 and Burrruna-2). We believe there is plenty of scope for Senex to grow its West Flank oil production given this large net acreage position and the low level of exploration in the region to date. In the mature US Permian basin there are around 69 wells per 100km2; in the Cooper Basin there are just 2 wells per 100km2. In order to further its exploration of the Western Flank, Senex has recently completed two 3D seismic surveys (Cordillo and Lignum) and is the process of acquiring the 1,037km2 Dundinna survey.
Mollichuta 3D seismic survey — Data capture was completed in 2009. The survey covers 275km2 of the Western Oil Flank PEL 104 permit and was used to identify targets just north of Senex’s Growler field that were drilled in 2011/12.
Cordillo 3D seismic survey — Data capture was completed in early October 2012 and data processing continues. The survey covers 790km2 of the company’s northern Cooper Basin permits and is expected to identify the next generation of oil and gas targets in this region.
Lignum 3D seismic survey — This survey has just been completed. It covers an area of 305km2 within PEL 104 and PEL 111 and is close to the Growler and Snatcher oil fields.
Dundinna 3D seismic survey — Senex and its joint venture partners are in the process of acquiring an extensive 3D seismic survey of the northern Cooper Basin. The Dundinna survey will cover 1,037km2 of the Western Flank fairway to identify oil and gas prospects. The location of these 3D seismic surveys is shown in Figure 60 below.
Figure 60: Senex Oil Fields and Proposed 3D Seismic Surveys
Source: Senex
We believe there is plenty of scope for Senex to grow its West Flank oil production

Australian Unconventional Oil & Gas September 2013 70
Figure 61: Senex Oil Fields
Source: Senex Energy
High-margin Oil Production
Senex generates all of its current operating cashflow from its Cooper Basin high-margin oil business. With exploration well success rates approaching 50% following modern 3D seismic acquisition and analysis, and with wells costing just US$2.0-2.5m, finding and development (F&D) costs are low. Senex management estimates that F&D costs are just A$7-9/bbl. The 1HFY13 oil business gross profit was A$54/bbl. This was comprised of revenue of A$109/bbl, operating costs of A$41/bbl and depreciation of A$14/bbl. The operating cost comprises A$10/bbl field costs and ex field costs (royalty, oil processing, transportation, wharfage and marketing) of A$31/bbl. We estimate that the oil business gross profit margin will be A$5/bbl higher going forward now the pipelines connecting the Growler and Snatcher oil fields to infrastructure connected to Moomba have been completed, reducing the transportation cost. We briefly describe Senex’s two main producing oil fields — Growler and Snatcher — below.
Australian Unconventional Oil & Gas September 2013 71
Growler Oil Field (60% & operator)
The Growler field is a Birkhead channel play that was discovered in 2006. A six-month 100-200bpd extended production test started in March 2008. In February 2010 production was temporarily halted for around six months due to unusually difficult floods that denied road tanker access to the oil field. Senex has since built a pipeline from the Growler field to Moomba via Lycium. Senex has continued to invest in the upgrade of existing facilities and field infrastructure to support production growth, including the construction of a new 6,000bpd production facility. Growler had an end of year run rate in excess of 3,500bbl/day (gross).
Snatcher Oil Field (60% & operator)
The Snatcher oil field was discovered in August 2009 and production started soon after this. Production was halted in February 2010 due to the unusually high floods, but resumed again in May 2012. Senex has since connected the Snatcher field to Moomba by building a pipeline to the Charo and helping fund a pipeline from there to the Tirrawarra oil field, which is itself connected to Moomba. Over the years Senex has continued to develop the Snatcher field. The Snatcher-6 well was placed on production at the end of 2012, and Snatcher-7 commenced production in early 2013. In November 2012 the Snatcher oil field was extended to the north-west by the Snatcher-9 appraisal well, which has just come on production. The Snatcher oil field is currently producing at a rate in excess of 1,000bbl/day (gross).
Other Production
Senex got some southern Cooper Basin oil production when it acquired Stuart Petroleum in 2011. Senex-operated oil fields that were acquired include Worrior, Harpoono, Padulla, Acrasia, Ventura, Mirage and Vintage Crop. These fields produce at a combined rate of around 1,000bbl/day.
Appraisal and Development Prospects
In November 2012 the Spitfire-2 well confirmed the discovery of a new oil field up-dip of the Spitfire-1 well and 2km west of the Growler oil field. Analysis of wireline logs confirmed that the well had intersected 6.5m of net oil pay in the mid-Birkhead Formation. It has been cased and suspended as a future oil producer. Surface facilities and appraisal wells are planned that will bring the field into commercial production.
The Mustang-1 well, around 2km west of the Snatcher oil field on PEL 111, had 4m of net oil pay and was placed on extended production test in November 2012. It produced almost 2,500bpd on this test.
In May 2011 oil was observed during the drilling of the unconventional exploration well Vintage Crop-1, in PEL 516. On test, the well flowed at a rate of over 300bpd.
The Cuisinier oil field (PL 303) is located in the Santos-operated ATP 752P (Senex: 15%). Senex recently agreed to sell its 15% interest in these licences. Appraisal of the field has delineated a significant oil accumulation, with 2C contingent resources of 10MMbbl. The future work programme includes drilling of at least four additional wells, and the construction of a Cuisinier to Cook pipeline for transportation and processing at the nearby Cook facility. Wells have been shut in pending the award of a production licence.
Spitfire-2 well
Mustang-1 well
Vintage Crop-1 well
Cuisinier oil field

Australian Unconventional Oil & Gas September 2013 72
Conventional — Tight Gas
In May 2013 Senex announced that it had identified a new ‘conventional’ stratigraphically trapped (as opposed to basin-centred) tight gas field — the Hornet gas field — in PEL 115 and PEL 516. In July 2013 it booked 835Bcf of 2C contingent resources for the field. Senex is now seeking a partner for the Hornet gas field to share risk, aid with funding and to provide marketing and technical expertise. The obvious candidate would be Santos, in our view.
In May 2013 Senex announced that production logging data obtained from the Kingston Rule-1 and Hornet-1 wells had confirmed the existence of a tight gas reservoir at an average depth of 2,500m in the Mettika Embayment, in the southern Cooper Basin. Also, 37 other wells have been drilled by the SACB JV within the Hornet gas field resource area, providing good sub-surface control. Management believes that the gas accumulation intersected by these wells has characteristics similar to many existing Santos-operated fields that produce conventional gas from the Patchawarra Formation. The Hornet gas field is defined within a stratigraphic trap, as shown below.
The next step is to optimise well design to achieve commercial flow rates. The SACB JV regularly uses small ‘pinpoint’ hydro-fractures to aid production from its Cooper Basin conventional (tight) gas fields. Given the flow test results of the Hornet-1 and Kingston Rule-1 wells, it seems likely to us that the Hornet gas field wells will need substantial hydro-fracture procedures to produce at commercial rates.
Figure 62: Hornet Gas Field
Source: Senex Energy
Senex is seeking a partner to share risk, aid with funding and to provide technical/marketing expertise
Hornet gas field: a tight gas reservoir
Commercial flow rates still need to be proven

Australian Unconventional Oil & Gas September 2013 73
Unconventional — Shale/Tight Gas
Senex management is working towards developing a large-scale, cost-competitive gas resource in the Cooper Basin. Senex made a large addition to its portfolio of unconventional gas acreage when it acquired Stuart Petroleum in 2011. It has subsequently increased this through a series of farm-ins and now holds approximately 1.2m acres. The main focus of its unconventional exploration programme has been the 2,500km2 PEL 516 permit (Senex: 100%) in the southern Cooper Basin. Senex has designed its unconventional well programme so that a single well can test both conventional and unconventional targets (Vintage Crop-1, Hornet-1 and Kingston Rule-1).
Figure 63: Senex’s Southern Unconventional Acreage
Source: Senex Energy
The stratigraphy of this acreage includes the Roseneath and Murteree shales. It also includes the Epsilon, Toolachee and Patchawarra tight sands and Toolachee and Patchawarra deep coal sequences. In the shales, tight sands and coals of the Allunga Trough and Mettika Embayment, MHA Petroleum Consultants has estimated that there is more than 100Tcf of gas-in-place within just PEL 516. Senex’s unconventional wells have produced liquid-rich gas rather than the dry gas found by Beach in the central Nappamerri Trough. Senex’s unconventional gas is liquids-rich because the REM, Toolachee and Patchawarra formations in PEL 516 have not been buried as deeply as they are in the central Nappamerri Trough.
Cooper Basin Unconventional Wells
Unconventional exploration by Senex began in May 2011, shortly after acquiring PEL 516, when it drilled and cored the Vintage Crop-1 well to a depth of 3,000m. Senex recorded continuous gas readings from the Roseneath and Murteree shales and the Toolachee and Patchawarra Formation coals, as well as the presence of liquids. Thicknesses in these target sections totalled over 200m. The well also discovered a conventional oil field in the McKinlay Member.
Geology
Vintage Crop-1 well

Australian Unconventional Oil & Gas September 2013 74
The Sasanof-1 well was drilled and cored in early 2012, with significant gas shows evident across the Epsilon and Patchawarra tight sands reservoirs of the Permian section. Senex subsequently conducted a hydraulic-fracture stimulation programme on the well, which yielded a peak liquids-rich gas flow rate of 178,000cfpd in July 2012.
The Kingston Rule-1 well, on the western flank of the Mettika Embayment in PEL 115, was completed in late 2012. It is 15km south east of Skipton-1 and 6km north-west of Talaq-1. The well was drilled to a total depth of 2,872m and intersected a total of 53m of net gas pay, with 9m of pay in the Epsilon Formation and 44m of pay in the Patchawarra Formation tight gas sands. The well also intersected 150m of Murteree and Roseneath shales. Mud logs confirmed the presence of liquids-rich hydrocarbons throughout the Permian section. In March 2013 Senex completed a five-stage fracture stimulation programme in the Patchawarra tight gas sands and one stage of fracture stimulation of the Epsilon Formation (tight sands). Gas flow rates of 1.4MMcfpd were achieved.
The Hornet-1 well, in PEL 115, was initially drilled in 2004 and flowed gas from the un-stimulated Epsilon and Patchawarra formations. In March 2013 the well underwent a six-zone fracture stimulation from 2,484-2,678m in the Patchawarra Formation. The amount of proppant placed in each stage varied from 30,000lb to 90,000lb. It flowed gas to the surface, after clean-up, at a stabilised rate of 2.2MMcfpd.
After the Talaq-1 well Senex drilled and cored the Skipton-1 well in PEL 516. It intersected more than 75m of net gas pay in the Patchawarra Formation and 164m of gas-charged Roseneath and Murteree shales. It had oil and gas shows throughout the Permian section, which demonstrated the liquids-rich nature of the gas resources. Regional mapping indicates the trough surrounding Skipton-1 covers an area greater than 200km2 (or more than 49,000 acres). Senex has completed a planned a seven-stage fracture stimulation programme in the Patchawarra tight gas sands and one stage of fracture stimulation of the Murteree Shale. However, a mechanical failure delayed production testing and the well was subsequently suspended.
The Paning-2 well in the northern Cooper Basin permit PEL 90 (100% Senex) was drilled to a total depth of 3,144m in February 2013. It drilled into a 9,000 acre structure and intersected 47m of net gas pay in Permian tight sands and 70m of net gas pay in the deep coals of the Patchawarra Trough. Senex estimates potential gas in place of 2.1Tcf in the deep coals, with additional material gas volumes in the tight Permian sands. Two fracture stimulations were completed in each of the Epsilon and Patchawarra formations and a single 63,000lb proppant fracture stimulation was completed in a 28m thick Toolachee coal seam. Testing of the Toolachee coal delivered peak flows of up to 90,000cfpd. The Epsilon and Patchawarra formations were water wet at this location
The Talaq-1 well was drilled and cored 70km north-east of Sasanof-1 to a depth of 2,879m. High gas readings during drilling and the presence of fluorescence demonstrated the liquids-rich nature of the hydrocarbons. Analysis of the cores suggests that this 7m thick coal seam has a gas content of >20m3/t. The coal package is laterally extensive across more than 20,000 acres of Senex’s southern Cooper Basin permits. Unfortunately, we have been told by management that borehole instability may now prevent the planned single-stage hydro-fracture of a Patchwarra coal seam.
Sasanof-1 well
Kingston Rule-1 well
Hornet-1 well
Skipton-1 well
Paning-2 well
Talaq-1 well
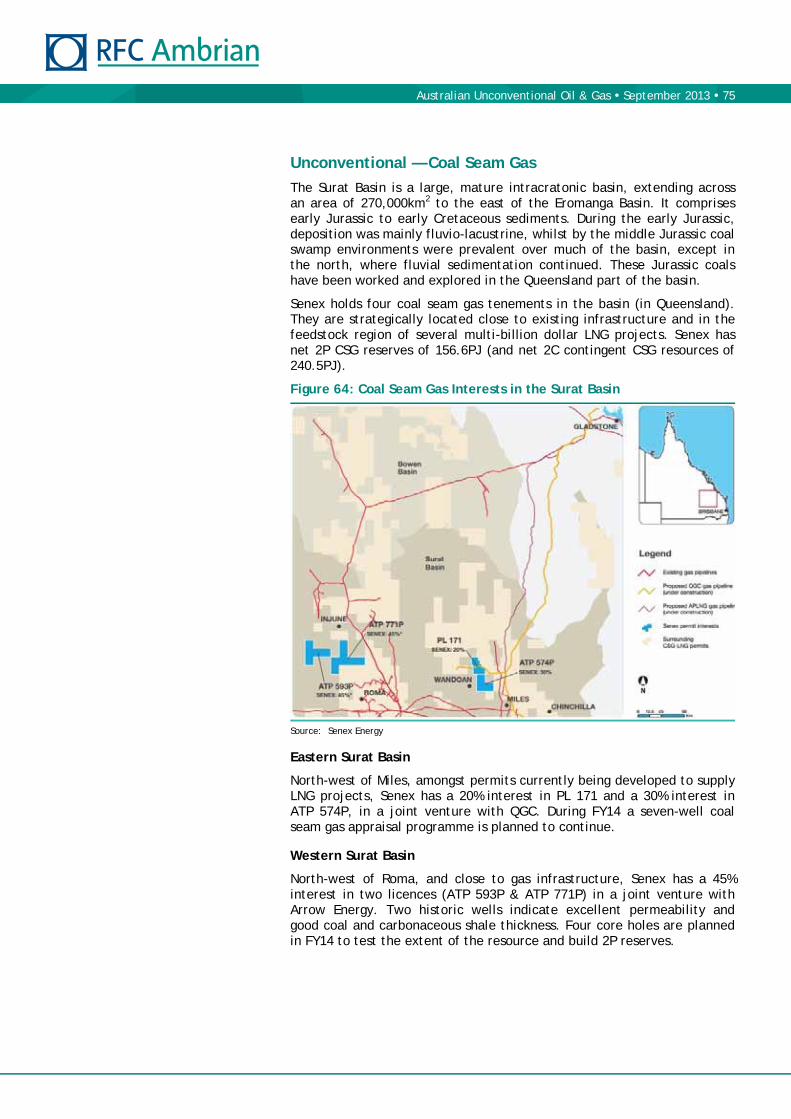
Australian Unconventional Oil & Gas September 2013 75
Unconventional — Coal Seam Gas
The Surat Basin is a large, mature intracratonic basin, extending across an area of 270,000km2 to the east of the Eromanga Basin. It comprises early Jurassic to early Cretaceous sediments. During the early Jurassic, deposition was mainly fluvio-lacustrine, whilst by the middle Jurassic coal swamp environments were prevalent over much of the basin, except in the north, where fluvial sedimentation continued. These Jurassic coals have been worked and explored in the Queensland part of the basin.
Senex holds four coal seam gas tenements in the basin (in Queensland). They are strategically located close to existing infrastructure and in the feedstock region of several multi-billion dollar LNG projects. Senex has net 2P CSG reserves of 156.6PJ (and net 2C contingent CSG resources of 240.5PJ).
Figure 64: Coal Seam Gas Interests in the Surat Basin
Source: Senex Energy
Eastern Surat Basin
North-west of Miles, amongst permits currently being developed to supply LNG projects, Senex has a 20% interest in PL 171 and a 30% interest in ATP 574P, in a joint venture with QGC. During FY14 a seven-well coal seam gas appraisal programme is planned to continue.
Western Surat Basin
North-west of Roma, and close to gas infrastructure, Senex has a 45% interest in two licences (ATP 593P & ATP 771P) in a joint venture with Arrow Energy. Two historic wells indicate excellent permeability and good coal and carbonaceous shale thickness. Four core holes are planned in FY14 to test the extent of the resource and build 2P reserves.

Australian Unconventional Oil & Gas September 2013 76
Valuation
We estimate that the current fair value of Senex’s share price is A$0.73/share, which is in line with its A$0.72price on 28 August 2013. We outline our key assumptions behind this NAV-based fair value estimate below.
Based on our financial forecasts, we estimate that Senex is trading on FY14 and FY15 EV/EBITDA multiples of 7.4x and 7.6x respectively. We also estimate that Senex is trading on FY14 and FY15 P/E multiples of 12.6x and 14.1x. Finally, Senex is trading on Price/book multiple of 1.9x, while we forecast FY14 Return on Equity will be 12.9%.
Key NAV Assumptions
For Our Current Fair Value Estimate
We have used Senex’s 2P reserves and 2C contingent resources as at 30 June 2013 as our base level. We have lowered Senex’s reported 2P oil reserves by 0.6MMbbl to account for the announced sale of its 15% interest in the Cuisinier oil field (PL 303) and ATP 752.
We have used our standard US$/boe NAV estimates for Cooper Basin oil, wet gas and dry gas reserves and resources.
We have heavily risked the chance of development (Pd = 25%) of Senex’s Hornet tight gas field reserves (139MMboe) to reflect the yet unproven commerciality of wells and the likely substantial (for a company of Senex’s size) capex required to bring such a field into development.
In line with Senex’s guidance of A$120-140m exploration and development capex, we have assumed a FY14 conventional petroleum exploration work programme costing A$50m.
We have valued Senex’s interest in PEL 516 (which includes the Sasanof-1 and Skipton-1 wells) and PEL 90 (which includes the Paning-1 and Paning-2 wells) using a US$100/acre multiple. This multiple reflects the early stage of unconventional gas/liquid appraisal and limited flow rates to date.
We have valued Senex’s Queensland CSG licence interests by multiplying its 2P reserves (156.6 PJ) by a US$0.9/2P PJ reserves multiple. The US$/reserve multiple is the weighted average multiple of the seven Australian CSG transactions that have been announced and completed since the beginning of 2011.
Senex had cash of A$127m at 30 June 2013 and no debt. We have increased Senex’s cash by A$20m to reflect the announced sale of its interests in the Cuisinier oil field (PL 303) and ATP 752.
We estimated the value of Senex’s G&A expense by annualising its 1H13 G&A expense (A$12.5m) less JV technical service fees (A$2.2m) and dividing the result by our real 7.5% discount rate (roughly equivalent to a nominal 10% discount rate).
Other assumptions can be seen in Table 23.

Australian Unconventional Oil & Gas September 2013 77
Table 23: Senex Estimated Net Asset Value per Share
Net Oil and Gas NPV
Unrisked NPV Pg Pd
Risked NPV
Risked NPV
Reserves/Resources (MMboe) (US$/boe) (US$m) (%) (%) (US$m) (A¢/share)
Cooper Basin
Oil Business
Oil 2P reserves 10.2 34.86 356 100% 100% 356 34.1
Oil 2C resources - 23.27 - 100% 90% - 0.0
Total Oil Business 10.2 356 356 34.1
Gas Business
Gas 2P reserves - 10.14 - 100% 90% - 0.0
Hornet tight gas field 2C resources 139.0 6.73 936 100% 25% 234 22.5
Total Gas Business 139.0 936 234 22.5
Total Above 149.2 1,291 590 56.6
FY14 Work Programme
Oil exploration 11.2 23.27 260 50% 90% 117 11.2
Work Programme 11.2 260 117 11.2
Unconventional Business
PEL 516 & PEL 90 77 7.4
Queensland CSG 141 13.5
Total Above 160.4 1,552 925 88.8
Other Value adjustments
Net cash/(debt) Jun 2013 132 12.7
FY14 Exploration expenditure (50) (4.8)
Capitalised G&A cost (247) (23.7)
Options 3 0.3
Senex Total fully diluted NAV 763 73.3
Current issued shares 1,140.8
Options 16.6
Current fully diluted shares 1,157.4
Source: Company data, RFC Ambrian estimates

Australian Unconventional Oil & Gas September 2013 78
Forecast Financial Multiples
Our revenue, EBITDA and net profit forecasts are higher than current Bloomberg consensus estimates. We believe this is largely due to the recent fall in US$/A$ not yet fully being incorporated into consensus estimates. Based on our forecast prices and production, we estimate that Senex will generate FY14 and FY15 revenues of A$182m and A$188m respectively (consensus of A$160 and A$139m respectively). We forecast A$88.5m EBITDA in FY14 and A$92.0m EBITDA in FY15 (consensus is A$103.3m and A$75.8m). We forecast FY14 net profit of A$65.4m vs. the Bloomberg consensus forecast of A$50.6m.
We believe the market looks at 1-2 year forward cashflow and earnings multiples, and that based on these Senex appears fairly valued. We estimate that Senex is currently trading on FY14 and FY15 EV/EBITDAX multiples of 7.4x and 7.6x respectively. We estimate that Senex is currently trading on FY14 and FY15 P/E multiples of 12.6x and 14.1x. These levels are roughly 2x the relevant multiples of Beach and Drillsearch.
Senex is trading on a Price/book equity multiple of 1.9x, which seems fair given that we forecast an FY14 ROE of 12.9%.
Table 24: Senex Valuation Multiples
28/8/2013 2013 2014F 2015F
Market Cap and EV
Share Price (A$) 0.72
Shares (m) 1,141
Market Cap (A$m) 821 821 821 821
Avg net debt/(cash) (A$m) (125) (106) (62)
Enterprise value (A$m) 696 715 759
Cashflow and Profit
EBITDAX (A$m) 25.3 92.4 96.5 100.0
Net Profit (A$m) 8.9 61.0 65.4 58.1
Valuation Multiples
EV/EBITDAX (x) 7.5 7.4 7.6
P/E (x) 13.5 12.6 14.1
P/b (x) 1.9 1.6 1.5
ROE 13.9% 12.9% 10.3%
Source: Company data, RFC Ambrian estimates

Australian Unconventional Oil & Gas September 2013 79
Table 25: Senex Key Model Drivers
2010 2011 2012 2013 2014F 2015F
Production
Oil production (Mbbl) 143 82 600 1,244 1,494 1,708
Gas production (PJ) 0 0 0 0 0 0
Gas liquid production (Mboe) 0 0 0 0 0 0
Total Production (Mboe) 143 82 600 1,244 1,494 1,708
Growth -42% 629% 107% 20% 14%
Prices
Brent oil Price (US$/bbl) 75.24 96.73 112.08 108.78 104.62 98.48
Sydney Gas Price (A$/GJ) 3.19 3.77 5.20 6.00 7.00
Costs
Operating costs (A$/boe) 30.58 68.40 47.60 42.50 40.00 40.00
DD&A (A$/boe) 7.49 23.96 20.36 15.00 15.00 15.00
G&A (A$m) 4.9 3.1 8.1 14.9 25.0 25.0
Capex (A$m) 13.1 24.3 13.3 64.7 138.1 140.0
Effective P&L tax rate 4% 77% 16% 15% 20% 20%
Source: Company data, RFC Ambrian estimates
Table 26: Senex Income Statement
(A$m) 2010 2011 2012 2013 2014 F 2015 F
Sales 13.2 13.2 70.4 147.9 181.6 187.6
Cost of sales (5.4) (7.7) (39.4) (67.3) (78.2) (84.2)
Gross profit 7.8 5.5 31.0 80.5 103.4 103.3
Net other revenue 0.2 3.5 0.1 21.7 0.0 0.0
Net other expenses (5.4) (24.2) (20.1) (39.4) (30.7) (30.7)
EBIT 2.6 (15.2) 11.0 62.8 72.6 72.6
Interest 0.0 (0.3) (0.4) (1.4) 0.0 0.0
EBT 2.6 (15.5) 10.5 61.4 72.6 72.6
Tax (0.1) 12.0 (1.7) (0.4) (7.3) (14.5)
Minorities 0.1 0.0 0.0 0.0 0.0 0.0
Net Profit 2.6 (3.5) 8.9 61.0 65.4 58.1
Source: Company data, RFC Ambrian estimates
Table 27: RFC Ambrian Forecasts vs. Consensus Estimates
2013 actual 2014F 2015F
Revenue
RFC Ambrian forecast (A$m) 147.9 181.6 187.6
Bloomberg consensus (A$m) 160.4 138.9
RFC Ambrian/Consensus (%) 113% 135%
EBITDA
RFC Ambrian forecast (A$m) 79.5 88.5 92.0
Bloomberg consensus (A$m) 103.3 75.8
RFC Ambrian/Consensus (%) 86% 121%
Net Profit
RFC Ambrian forecast (A$m) 61.0 65.4 58.1
Bloomberg consensus (A$m) 50.6 44.9
RFC Ambrian/Consensus (%) 129% 129%
Source: Bloomberg, RFC Ambrian

Australian Unconventional Oil & Gas September 2013 80
Table 28: Senex Balance Sheet
(A$m) 2010 2011 2012 2013 2014F 2015F
Cash 16.8 42.3 124.0 126.8 85.7 139.0
Receivables 3.0 7.8 21.6 56.1 61.4 55.8
Inventory 0.0 0.0 1.5 5.0 9.9 15.4
Other 20.4 0.0 2.2 0.0 0.0 0.0
Total current assets 40.2 50.1 149.3 187.9 157.0 210.2
PP&E 0.0 3.1 25.5 41.6
Developed assets 27.6 81.3 93.4 100.2
Exploration assets 1.0 38.3 74.3 166.1
PP&E, Expl & Dev 28.6 122.7 193.2 307.9 418.5 527.4
Other 5.2 0.8 3.9 3.0 3.0 3.0
Total non-cur assets 33.8 123.5 197.1 310.9 421.5 530.4
Total assets 74.0 173.6 346.4 498.9 578.5 740.5
Trade payables 3.1 8.4 27.8 31.7 31.5 28.2
Short-term debt 0.0 0.0 0.0 0.0 0.0 0.0
Deferred tax 0.0 0.0 0.0 0.0 0.0 0.0
Other 0.2 0.4 0.5 0.7 0.7 0.7
Total cur liabilities 3.3 8.9 28.3 32.4 32.2 28.9
Long-term debt 0.0 0.0 0.0 0.0 0.0 100.0
Deferred tax 0.0 0.0 0.0 0.0 14.5 21.8
Other 2.1 7.4 18.2 26.4 26.4 26.4
Minorities 0.0 0.0 0.0 0.0 0.0 0.0
Equity 68.6 157.3 299.9 440.1 505.4 563.5
Total non-cur liabs 70.7 164.7 318.1 466.4 546.3 711.7
Total liabilities 74.0 173.6 346.4 498.9 578.5 740.5
Source: Company data, RFC Ambrian estimates
Table 29: Senex Cashflow Statement
(A$m) 2010 2011 2012 2013 2014F 2015F
Net profit 2.6 (3.5) 8.9 61.0 65.4 58.1
Depreciation 1.1 2.0 11.8 31.2 29.5 31.1
Working capital 0.3 0.6 4.0 (34.1) (10.5) (3.1)
Other 0.7 (8.1) (10.1) (2.4) 14.5 7.3
Operating cashflow 4.7 (9.0) 14.6 55.7 98.9 93.3
Capex (17.7) (12.2) (61.3) (138.1) (140.0) (140.0)
Other (25.1) 29.4 (4.0) 7.4 0.0 0.0
Investing cashflows (42.8) 17.3 (65.3) (130.7) (140.0) (140.0)
Debt 0.0 (8.0) 0.0 0.0 0.0 100.0
Equity 37.9 26.0 135.9 77.6 0.0 0.0
Dividends 0.0 0.0 0.0 0.0 0.0 0.0
Other (1.2) (0.8) (4.3) 0.2 0.0 0.0
Financing cashflow 36.8 17.3 131.5 77.9 0.0 100.0
Cash at beginning 18.3 16.8 42.3 124.0 126.8 85.7
Net change (1.5) 25.5 81.7 2.8 (41.1) 53.3
Cash at end 16.8 42.3 124.0 126.8 85.7 139.0
Source: Company data, RFC Ambrian estimates

Australian Unconventional Oil & Gas September 2013 81
This page is left blank intentionally

Australian Unconventional Oil & Gas September 2013 82
Drillsearch Energy is purely focused on the Cooper Basin, Australia. After its recent deals with Santos, we estimate Drillsearch has 2P oil reserves of 9.6MMbbl and 2P wet gas reserves of 20.4MMboe, which underpin our forecast production growth to 2.9MMboe in FY15 from 1.1MMboe in FY13.
We initiate on Drillsearch Energy with a BUY recommendation and a current fair value estimate of A$1.81/share. Over the last few years Drillsearch’s management has created value through acquiring and developing the Cooper Basin wet gas resources that others have shunned. The dramatic growth in the company’s high margin Western Flank oil production has also helped. Management also successfully farmed out its Nappamerri Trough unconventional acreage early on to QGC (BG).
We think that the equity market is underestimating the value of Drillsearch’s conventional gas and gas liquid reserves and resources. The market tends to focus too much on forecast short-term (1-2 years) earnings and cashflow multiples, which do not yet reflect the rapid improvement in dry and wet gas field economics that would occur if East Coast gas prices rise substantially in 2015/16, as we forecast.
Drillsearch has managed phenomenal production growth over the last year. FY13 total petroleum production was 1.065MMboe, up 174% on the previous year. Oil production was 0.775MMbbl, an eightfold increase on the previous year as the company benefited from new pipeline connections between Western Flank oil production sites and Moomba. We forecast FY14 oil production growth of a further 108%. Drillsearch would increase its oil production by 120% if it just maintained its June quarter 2013 production rate for FY14.
Drillsearch’s FY13 gas production fell 11% YoY, reflecting the temporary (about six months) shut-in of the PEL 106B wet gas project. However, we believe this decline should turn to strong growth going forward; the prior sales contract was interruptible. PEL 106B partners now have a new firm gas sales agreement with the SACB JV that should mean any project shut-ins should be significantly shorter than last year.
Based on our financial forecasts we estimate Drillsearch is trading on FY14 and FY15 EV/EBITDA multiples of 4.4x and 4.2x respectively. Given the quality of the management and company assets, this looks cheap to us.
Table 30: Financial Forecasts
Yr to Jun (A$m) 2011 2012 2013 2014F 2015F
Revenue 14.4 22.4 102.2 228.0 247.7
EBITDAX 0.3 10.3 37.6 155.5 160.6
Profit/(Loss) (5.5) 10.0 45.1 83.0 82.2
Source: Company data, RFC Ambrian
28 August 2013 Drillsearch Energy
Buy Growth and Value Found
Stuart Amor +44 (0)20 3440 6826 [email protected]
Emily Ashford +44 (0)20 3440 6821 [email protected]
Price (A$) 1.34
Fair Value (A$) 1.81
Ticker DLS-AU
Market cap (A$m) 571.1
Estimated cash (A$m) 36.1
2P reserves + 2C resources (MMboe) 49.9
Shares in issue
Basic (m) 427.8
Fully diluted (m) 443.3
52-week
High (A$) 1.715
Low (A$) 0.91
3m-avg daily vol (000) 2,290
3m-avg daily val (A$000) 2,723
Top shareholders (%)
National Australia Bank 8.6
QGC Pty Ltd 8.5
Beach Energy 4.9
Wilson HTM Investment Gp 3.7
Uob-Kay Hian Pte Ltd 3.4
Total 29.1
Management
Jim McKerlie CHR
Brad Lingo MD
Ian Bucknell CFO
John Whaley COO
David Evans CTO
Share Price Performance (A$)
Source: Bloomberg
0
5
10
15
20
25
30
35
40
$0.00
$0.50
$1.00
$1.50
$2.00
Aug‐12 Nov‐12 Feb‐13 May‐13 Aug‐13
Millions
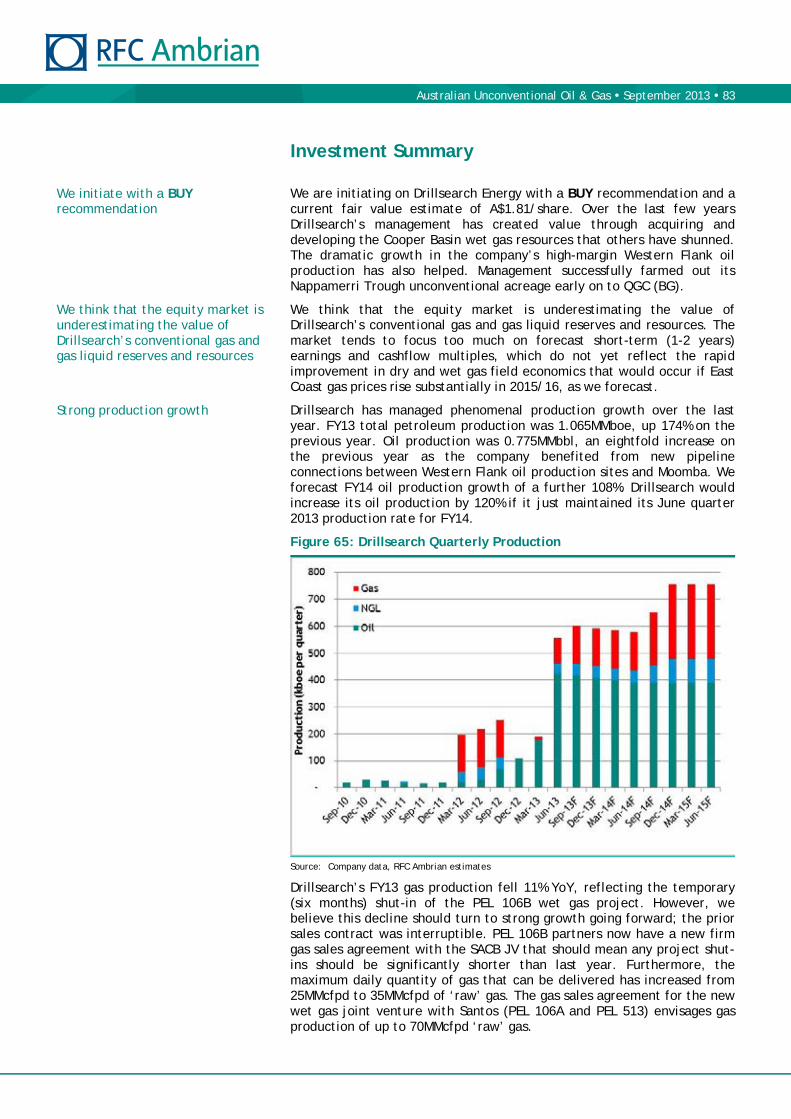
Australian Unconventional Oil & Gas September 2013 83
Investment Summary
We are initiating on Drillsearch Energy with a BUY recommendation and a current fair value estimate of A$1.81/share. Over the last few years Drillsearch’s management has created value through acquiring and developing the Cooper Basin wet gas resources that others have shunned. The dramatic growth in the company’s high-margin Western Flank oil production has also helped. Management successfully farmed out its Nappamerri Trough unconventional acreage early on to QGC (BG).
We think that the equity market is underestimating the value of Drillsearch’s conventional gas and gas liquid reserves and resources. The market tends to focus too much on forecast short-term (1-2 years) earnings and cashflow multiples, which do not yet reflect the rapid improvement in dry and wet gas field economics that would occur if East Coast gas prices rise substantially in 2015/16, as we forecast.
Drillsearch has managed phenomenal production growth over the last year. FY13 total petroleum production was 1.065MMboe, up 174% on the previous year. Oil production was 0.775MMbbl, an eightfold increase on the previous year as the company benefited from new pipeline connections between Western Flank oil production sites and Moomba. We forecast FY14 oil production growth of a further 108%. Drillsearch would increase its oil production by 120% if it just maintained its June quarter 2013 production rate for FY14.
Figure 65: Drillsearch Quarterly Production
Source: Company data, RFC Ambrian estimates
Drillsearch’s FY13 gas production fell 11% YoY, reflecting the temporary (six months) shut-in of the PEL 106B wet gas project. However, we believe this decline should turn to strong growth going forward; the prior sales contract was interruptible. PEL 106B partners now have a new firm gas sales agreement with the SACB JV that should mean any project shut-ins should be significantly shorter than last year. Furthermore, the maximum daily quantity of gas that can be delivered has increased from 25MMcfpd to 35MMcfpd of ‘raw’ gas. The gas sales agreement for the new wet gas joint venture with Santos (PEL 106A and PEL 513) envisages gas production of up to 70MMcfpd ‘raw’ gas.
We initiate with a BUY recommendation
We think that the equity market is underestimating the value of Drillsearch’s conventional gas and gas liquid reserves and resources
Strong production growth

Australian Unconventional Oil & Gas September 2013 84
While the value of Drillsearch’s unconventional licences now represent just 21% of our fair value estimate, the upside remains huge. Should Drillsearch’s Nappamerri Trough unconventional wells have commercial flow rates, land values could rise from the US$900/acre we have used in this report to approach those seen in US unconventional petroleum transactions. Over the last few years acreage in some proven US shale plays has been sold for between US$10,000-25,000/acre, depending on the play economics and how much development has already taken place.
We estimate that the current fair value of Drillsearch’s share price is A$1.81, which is roughly 35% higher than its A$1.34 price on 28 August 2013. We estimate that conventional oil reserves and contingent resources are worth roughly A¢69/share, while the conventional gas & NGL reserves and contingent resources are worth A¢63/share. Its unconventional acreage is worth A¢39/share. We also estimate that the remaining value of the carry by QGC and Santos is roughly offset by Drillsearch’s capitalised G&A cost.
Figure 66: Drillsearch Fair Value Breakdown
Source: RFC Ambrian estimates
Based on our financial forecasts we estimate Drillsearch is trading on FY14 and FY15 EV/EBITDA multiples of 4.4x and 4.2x respectively. We also estimate that Drillsearch is trading on FY14 and FY15 P/E multiples of 6.9x and 7.0x. Finally, Drillsearch is trading on a Price/book multiple of 2.0x, while we forecast FY14 Return on Equity will be 22.4%.
Unconventional upside remains huge
Fair value
Multiple valuation

Australian Unconventional Oil & Gas September 2013 85
Risks
Drillsearch is subject to the usual risks that an upstream petroleum exploration and production company faces. These include: geological/ technical, political/regulatory, commercial, operational, capital access, weather related and environmental.
A key risk that is more specific to Cooper Basin oil producers is that they may not be able to replace or grow their Cooper Basin 2P oil reserves over time. While the economics of Western Flank oil are great, this is partly due to the aquifer-supported accelerated production profile of new discoveries. The vast majority of recoverable oil reserves are produced in the first five or six years. This leads to low reserve lives. Indeed, Drillsearch’s Cooper Basin oil assets only have a 9 year reserve life based on FY13 production and its 2P reserves (10 years based on 2P reserves + 2C contingent resources).
Drillsearch is planning an A$90-110m FY14 capital expenditure programme. We estimate that A$50-70m of this will be spent on exploration, and some/many of the planned exploration wells might not be successful. Even in the Cooper Basin where success rates while drilling on 3D seismic are around 48%, the failure of an individual exploration well is still more likely than success.
The Cooper Basin is prone to flooding. In 2010 the biggest flood in 30 years prevented exploration and development activity in much of the basin for several months. Production from many Western Flank oil fields, such as Chiton in PEL 91, was trucked to Moomba, and this was not possible over the unsealed roads in the region. The recent installation of pipelines from the Bauer field to Moomba should allow production to continue from this and other connected fields, even if flooding recurs. Nonetheless, a recurrence could severely affect Drillsearch’s other activity in the region.
Unconventional petroleum production is yet to be proved commercial in Australia. Should petroleum prices and flow rates from unconventional wells not be sufficient to give an economic return on the investment, Australia’s unconventional resources will not be developed.
Management
Mr McKerlie was appointed Chairman of Drillsearch in August 2008. He has extensive corporate experience as both Director and Chairman of private and public companies. He is a Chartered Accountant and business consultant, with a career of consulting to small and large companies on growth strategies, as a Managing Partner at KPMG and Partner in Charge at Deloitte.
Mr Lingo has over 25 years of oil and gas experience, from frontier exploration offshore West Africa to the commercialisation of major gas projects in Australia. He has experience in all stages of the oil and gas business, from project development, M&A, to financing and equity capital raisings for listed and private companies. He was appointed to the Board in May 2009, and became Managing Director in June 2009.
Jim McKerlie — Chairman
Brad Lingo — Managing Director

Australian Unconventional Oil & Gas September 2013 86
Operations
Drillsearch is focused solely on the Cooper-Eromanga Basin. It has three business units:
Oil business — Oil exploration and production on the Western Flank, Inland-Cook and Eastern Margin Oil fairways.
Wet gas business — Development of a conventional wet gas business in its Western and Northern Wet Gas project areas and in its licences that cover parts of the conventional gas fairway.
Unconventional business — Appraisal and development of its Central and Western unconventional resources.
Figure 67: Drillsearch Licences and Different Play Fairways
Source: Drillsearch
We believe that new technology has given the Cooper Basin a second lease of life, and advancements in drilling, completion and seismic technology have only been lightly used so far. Recent exploration success rates on the Western Flank following the acquisition of 3D seismic have been high, at ~48%. Conventional drill costs are generally low (A$2.0-2.5m per well) as the basin is onshore and the scale of petroleum activity in the basin ensures relatively easy access to equipment and infrastructure.
Drillsearch has a three-pronged strategy in the Cooper Basin
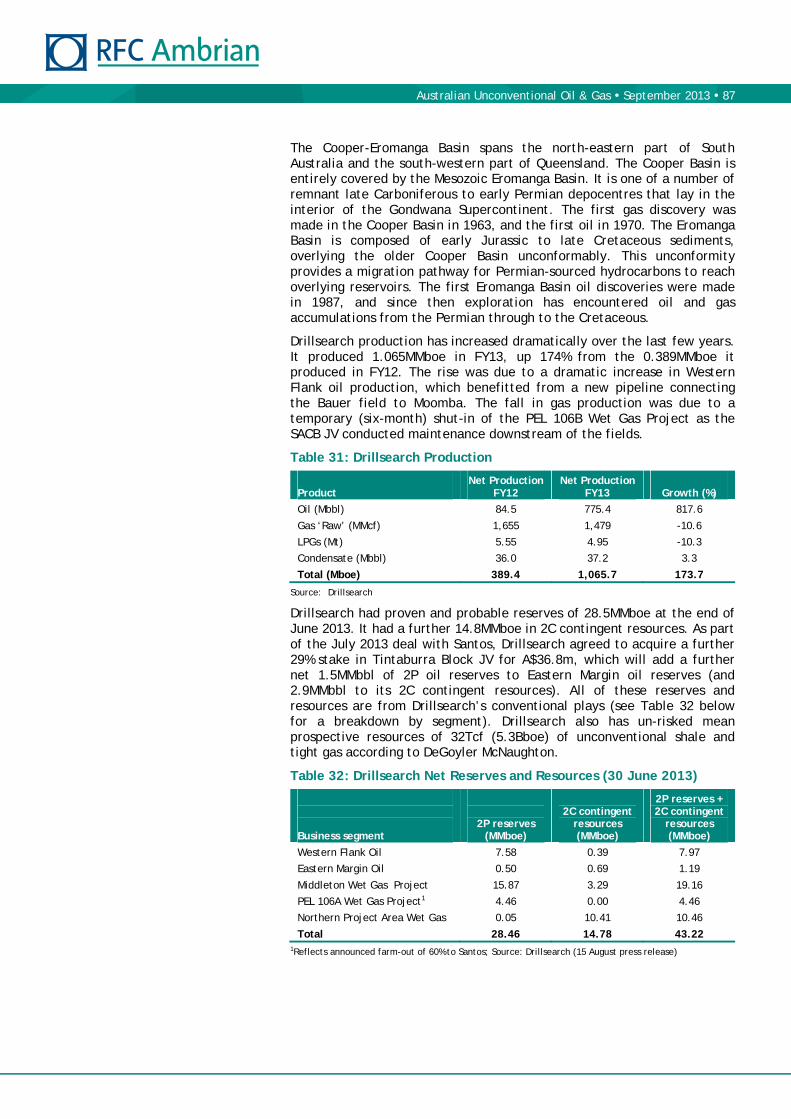
Australian Unconventional Oil & Gas September 2013 87
The Cooper-Eromanga Basin spans the north-eastern part of South Australia and the south-western part of Queensland. The Cooper Basin is entirely covered by the Mesozoic Eromanga Basin. It is one of a number of remnant late Carboniferous to early Permian depocentres that lay in the interior of the Gondwana Supercontinent. The first gas discovery was made in the Cooper Basin in 1963, and the first oil in 1970. The Eromanga Basin is composed of early Jurassic to late Cretaceous sediments, overlying the older Cooper Basin unconformably. This unconformity provides a migration pathway for Permian-sourced hydrocarbons to reach overlying reservoirs. The first Eromanga Basin oil discoveries were made in 1987, and since then exploration has encountered oil and gas accumulations from the Permian through to the Cretaceous.
Drillsearch production has increased dramatically over the last few years. It produced 1.065MMboe in FY13, up 174% from the 0.389MMboe it produced in FY12. The rise was due to a dramatic increase in Western Flank oil production, which benefitted from a new pipeline connecting the Bauer field to Moomba. The fall in gas production was due to a temporary (six-month) shut-in of the PEL 106B Wet Gas Project as the SACB JV conducted maintenance downstream of the fields.
Table 31: Drillsearch Production
Product
Net Production FY12
Net Production FY13
Growth (%)
Oil (Mbbl) 84.5 775.4 817.6
Gas ‘Raw’ (MMcf) 1,655 1,479 -10.6
LPGs (Mt) 5.55 4.95 -10.3
Condensate (Mbbl) 36.0 37.2 3.3
Total (Mboe) 389.4 1,065.7 173.7
Source: Drillsearch
Drillsearch had proven and probable reserves of 28.5MMboe at the end of June 2013. It had a further 14.8MMboe in 2C contingent resources. As part of the July 2013 deal with Santos, Drillsearch agreed to acquire a further 29% stake in Tintaburra Block JV for A$36.8m, which will add a further net 1.5MMbbl of 2P oil reserves to Eastern Margin oil reserves (and 2.9MMbbl to its 2C contingent resources). All of these reserves and resources are from Drillsearch’s conventional plays (see Table 32 below for a breakdown by segment). Drillsearch also has un-risked mean prospective resources of 32Tcf (5.3Bboe) of unconventional shale and tight gas according to DeGoyler McNaughton.
Table 32: Drillsearch Net Reserves and Resources (30 June 2013)
Business segment
2P reserves (MMboe)
2C contingent
resources (MMboe)
2P reserves + 2C contingent
resources (MMboe)
Western Flank Oil 7.58 0.39 7.97
Eastern Margin Oil 0.50 0.69 1.19
Middleton Wet Gas Project 15.87 3.29 19.16
PEL 106A Wet Gas Project1 4.46 0.00 4.46
Northern Project Area Wet Gas 0.05 10.41 10.46
Total 28.46 14.78 43.22 1Reflects announced farm-out of 60% to Santos; Source: Drillsearch (15 August press release)

Australian Unconventional Oil & Gas September 2013 88
Conventional — Oil
Drillsearch has licences covering three oil fairways in the Cooper Basin, which it has named the Western Flank Oil Fairway, the Inland-Cook Oil Fairway and the Eastern Margin Oil Fairway.
Western Flank Oil Fairway
PEL 91 (Drillsearch: 60%, Beach: 40% & operator)
PEL 91 covers 1,972km2 of the south-western flank of the Patchawarra Trough. Beach farmed into the licence in December 2002 and became operator, but Drillsearch has retained a 60% interest. There have been several oil discoveries, with the Bauer field the most important.
The Modiolus 3D seismic survey in the south-west corner of PEL 91 identified new drilling targets, with the first commercial oil discovery on the permit, Chiton-1, testing over 2,400bpd. This well started producing in February 2010. However, it was heavily affected by the Cooper Creek flooding and was shut in from May 2011 to January 2012. The recently-constructed Bauer-Lycium 10Mbpd pipeline allowed PEL 91 to produce a gross 7.6Mbpd in 4QFY13.
Figure 68: PEL 91
Source: Drillsearch
Bauer-1, drilled in the summer of 2011, had free flow at 15,000bpd during an 80-minute flow test, before being put on production at an initial rate of 800bopd via a trucking operation. A further nine development wells have been drilled in the Bauer field. Management expects that the further development and appraisal work on the field should result in an increase in ultimate recovery for the field to around 10MMbbl (gross).
Bauer oil field

Australian Unconventional Oil & Gas September 2013 89
PEL 91 is well covered by 3D seismic. In January 2012 two 3D surveys were completed: the 320km2 Aquillus and 151km2 Limbatus. More recently, the multi-permit Irus survey, with 196km2 within PEL 91, was finished. The acquisition of the 485km2 Caseolus 3D seismic survey has just finished and is currently being processed.
Over the last 12 months Drillsearch has drilled six exploration wells in PEL 91 and made five discoveries (Pennington-1, Bauer North-1, Kalladeina-2, Sceale-1 & Congony-1). The successful exploration wells have been cased and suspended as future producers. Only the Smoky-1 well in the far north-east of the permit was plugged and abandoned.
The Pennington-1 exploration well recently made an oil discovery 9km east of the Bauer oil field, following analysis of the Aquillus seismic. The well encountered a gross oil column of 5m in the McKinlay Sandstone, a net oil column of 8m in the Namur Sandstone and 6m in the mid-Namur Sandstone. Beach estimates that the Pennington prospect has recoverable resources in excess of 2MMbbl of oil.
PEL 182 and PEL 100
Drillsearch acquired two additional material positions in the Western Flank Oil Fairway with the 4Q12 completion of the Acer Energy acquisition: a 40% interest in PEL 182 and a 25.835% interest in PEL 100, both operated by Senex Energy. In July 2013, Drillsearch agreed to sell its interest in PEL 100 to Santos for A$15m as part of a series of deals.
Inland-Cook Oil Fairway
Drillsearch has five contiguous blocks between the Inland Oil Field in the north and the Cook and Cuisinier oil fields to the south. These are ATP 539P, 657P, 920P, 549P and 924P. The fairway straddles a large structural SW-NE ridge, which forms the western margin of the Windorah Trough hydrocarbon source kitchen, covering an area of just over 10,000km2. The area is lightly explored, with limited 2D seismic coverage, although most wells drilled in the area have had significant oil shows. Drillsearch hopes to demonstrate similar play types to the successful Western Flank Oil Fairway play types. The Inland-Cook Fairway contains many of the same formations that have proved successful on the Western Flank, notably the Birkhead, Hutton and Murta sandstones. In 2012 Drillsearch acquired the Kaden 600km2 3D seismic survey over licences ATP 539P and ATP 549P.
From the Kaden 3D seismic, the company identified a number of prospects and commenced a two-well exploration programme in January 2013. The Triclops-1 and Tibor-1 wells, in ATP 539P, were drilled to 1,926m and 1,723m respectively. Both wells had oil shows, but were plugged and abandoned.
Pennington-1 well

Australian Unconventional Oil & Gas September 2013 90
Conventional — Wet Gas
Drillsearch’s current producing Wet Gas Project Area is in PEL 106B. It also has a wet gas focused JV with Beach in PEL 107. In the last few years there have been eight wet gas discoveries from fourteen wells in these licences, and there are three gas fields in production (Middleton, Brownlow and Canunda). Drillsearch’s Northern Wet Gas Project Area comprises the PEL 101, PEL 103, PEL 103A, PRL 14, PRL 17 and PRL 18 licences. These licences were acquired when Drillsearch bought Acer in 2012.
Figure 69: Western Wet Gas Assets Figure 70: Northern Wet Gas Assets
Source: Drillsearch Source: Drillsearch
PEL 106B (Beach: 50% & operator, Drillsearch: 50%) & PEL 107 (Beach: 40% & operator, Drillsearch: 60%)
In 2012, Beach, as operator, brought on stream the Wet Gas Pilot Project (the Brownlow and Middleton fields and associated infrastructure). The project included the installation of surface production facilities at the Middleton and Brownlow discoveries, and connection into the raw gas pipeline gathering system at the Moonanga Gas Field, 10km east of Middleton. Its key objective was to test the wet gas deliverability, economics and commercial challenges of developing wet gas discoveries in the area.
When on stream the Middleton and Brownlow fields can produce 25MMcfpd of raw gas, with a condensate & LPG/gas ratio of 40-50boe/Mcf. Recently, the tie in of the Canunda Wet Gas Field was completed, and it is initially delivering 650-1,000bbl/day of condensate (gross). Gas sales began in January 2012, but stopped in October 2012 under the interruptible gas sales agreement with the SACB JV due to constraints in the gas gathering system downstream of the Middleton Gas Plant.

Australian Unconventional Oil & Gas September 2013 91
In March 2013 PEL 106B JV partners entered into a new Gas Sales Agreement (GSA) with the SACB JV, which provided for the sale of 10Bcf of gas on a firm basis (the previous agreement had been interruptible) over three years. The maximum daily quantity that can be delivered under the GSA is 35MMcfd of raw gas. The PEL 106B Joint Venture will sell untreated raw gas consisting of condensate, LPG and sales gas. Condensate and LPG pricing will be linked to international product pricing, less specific transport and processing charges. Gas sales reflect transport and processing costs of the SACB JV in producing sales gas quality for onward sale. Gas sales resumed in 4Q13.
All four of the wells (Coorabie-1, Rosetta-1, Destrees-1 & Euler-1) drilled in PEL 106B over the last 12 months have been plugged and abandoned
PEL 106A & PEL 513 (DLS farming down to 40%, STO farming into 60%)
In July 2013 Drillsearch announced that it would farm down 60% interests in PEL 106A and PEL 513 to Santos, for carry on a ~A$100m - A$120m work programme. PEL 106A and PEL 513 contain conventional 2C contingent wet gas resources of approximately 62Bcf (gross) over six discoveries, and conventional wet gas best estimate prospective resources of over 100Bcf (gross). Additionally, Drillsearch entered into a firm gas sales agreement covering expected production from PEL 106A and PEL 513 through 2025. Under the GSA, initial gas sales by Drillsearch are targeted to be up to a maximum daily quantity of 70MMcfpd raw gas.
A three-well exploration programme in PEL 106A in the June 2013 quarter resulted in one discovery (Narrabeen-1), and another well (Moruya-1) cased and suspended for further evaluation. The identification of further conventional wet gas targets and the delineation of the wet gas resource will be advanced by the Munathiri 3D seismic survey, which was just completed over PEL 513.
PEL 101 (Drillsearch: 60% & operator, Mid Continent: 40%), PEL 103 (Drillsearch: 100%) & PEL 103A (Drillsearch: 75% & operator, Avery Resources: 25%)
One of the primary drivers of the Acer acquisition was the attractiveness of Acer’s wet gas assets, including the existing wet gas discoveries in PEL 101 and PEL 103. Drillsearch has also had wet gas commercialisation discussions with SACB JV operator Santos, with a view to extending current wet gas terms to the existing Acer wet gas discoveries in PEL 103 at Yarrow (PRL 17), Flax (PRL 14) and Juniper (PRL 18) and in PEL 101 at Ginko and Crocus. Production from these existing undeveloped wet gas discoveries depends on suitable commercial arrangements being agreed with the SACB JV.
The 478km2 Coolabah 3D seismic survey, which covers all of PEL 101, is complete and is being processed. The South Flax-1 exploration well has just spud.
Australian Unconventional Oil & Gas September 2013 92
Unconventional
Drillsearch is targeting two types of unconventional plays in the Nappamerri Trough: the REM section shale gas play and a Permian section basin-centred tight gas play. Drillsearch’s main Cooper Basin licence where unconventional gas is being targeted is ATP 940P in Queensland. In July 2011 Drillsearch announced the farm-out of a 60% interest in ATP 940P to QGC (a BG subsidiary). BG committed to a five-year, A$130m, three-stage exploration and pilot production appraisal programme (with QGC to fund A$90m of the first A$100m). Also, potential unconventional tight oil and deep CSG discoveries were made by the Baird-1 well in PEL 106B. These other unconventional plays could extend into the nearby PEL 106A and PEL 513 permits.
At the end of 2012 DeGoyler McNaughton provided an independent assessment of Drillsearch’s unconventional assets, excluding any unconventional resources in its recently-acquired Acer licences. It estimated that the Drillsearch licences (excluding the recently-acquired Acer acreage) have mean unrisked prospective recoverable:
shale gas resources of 24Tcf;
tight gas resources of 8Tcf; and
deep CSG resources of 17Tcf.
Cooper-Eromanga Basin — Nappamerri Trough
The Nappamerri Trough contains the principal source rocks of the large gas fields that have already been developed around Moomba. It contains a thick Permian section of sandstones, coals, siltstones and shales, deposited in a cold climate fluvio-lacustrine setting. Changes in depositional environments between fluvial, lacustrine and deltaic have resulted in stacked multiple targets within a proven hydrocarbon province. Due to low tectonic activity in the Nappamerri Trough, the Permian formations are laterally continuous within minimal variation in the thickness of the shale units.
Initial Cooper Basin shale gas studies focused on the Permian Roseneath Shale, Epsilon Formation and Murteree Shale (REM section). Further studies have also assessed whether a basin-centred gas play existed in the low permeability sands within the Toolachee and Patchawarra formations. The REM section extends over an area of several thousand kilometres, and has high organic content, thermal maturity and over-pressurisation. The REM package’s main relevant characteristics are:
Total Organic Carbon (TOC) within the Roseneath and Murteree Shale generally ranges from 2-4%, and up to 7% TOC within the Epsilon Formation. Cuttings showed that good quality Type II kerogens dominate. This is unusual as the successful US shale gas plays involve marine rather than lacustrine shales.
The prospective REM section has a vitrinite reflectance of 2-4%, with the exact level of thermal maturity depending on location within the trough. The high maturity is believed to be due to radioactive granites in the basement rocks producing a large heat flow. With this level of maturity, the Permian sequence is expected to be within the dry gas window, and gas recoveries from drill stem tests (DST) have contained significant percentages (8% to 24%, average 15%) of carbon dioxide.

Australian Unconventional Oil & Gas September 2013 93
DSTs and mud weights indicate that the Epsilon and Patchawarra formations are over-pressured and that the over-pressure is confined to the Nappamerri Trough. The regional pressure gradient is 0.43 psi/ft, while the gradient in the Nappamerri Trough, based on DST information over the Epsilon and Patchawarra formations, is about 0.72 psi/ft.
The mineralogy of the Roseneath and Murteree shales is consistent with the successful Barnett and Haynesville Shale plays, with high quartz and feldspar content (50%). This should be beneficial for effective hydraulic fracturing and could lead to good well productivity. The presence of ~30% siderite in the shales of the REM also increases the brittleness. As is expected from the section maturity, illite is the dominant clay type (20%), although there is also some kaolinite. Importantly, no swelling clays, which impede effective hydro-fracturing, have been found to date.
Central Cooper Shale Gas and Tight Gas
Drillsearch and strategic partner BG are targeting the same type of unconventional plays in ATP 940P as Beach Energy and Chevron are targeting in PEL 218 and ATP 855P. Over the last couple of years Beach has seen considerable unconventional exploration success, targeting the REM Shale and basin-centred tight gas resources in the adjacent permits. See page 52 for a description of the results of the Holdfast-1, Encounter-1, Moonta-1, Streaky-1 and Halifax-1 wells. Beach’s Encounter-1 well is less than 20km from Drillsearch’s proposed Anakin-1 well.
Figure 71: Drillsearch ATP 940P Licence
Source: Drillsearch

Australian Unconventional Oil & Gas September 2013 94
Under the terms of the ATP 940P farm-in agreement BG subsidiary QGC will earn its 60% interest in three stages. QGC has committed to a five-year, three-stage work programme costing US$130m. Drillsearch contributes just 10% of each stage up to a spending cap within each. The total of the individual spending caps is US$100m. Drillsearch will pay 40% of all costs above the spending caps and will retain operatorship through the exploration and pilot production appraisal phase.
Stage 1 was planned to cost US$25m at the time of the farm-in. It included 1,000km of 2D seismic reprocessing, a high-resolution gravity and aeromagnetic survey, and a ~1,100km2 high-resolution 3D seismic survey. BG/Drillsearch completed the 1,050km2 3D Winnie seismic acquisition over ATP 940P in December 2012, thus completing Stage 1. Interpretation of the Winnie 3D seismic survey led to the identification of the first four well sites (Charal-1, Anakin-1, Padme-1 & Amidala-1).
Stage 2 is about to commence and was planned to cost US$33m. This stage includes two vertical exploration wells with full coring, fracture stimulation and flow tests. Drillsearch and QGC have agreed on well locations. The wells, Charal-1 and Anakin-1, have been based on 3D seismic to target multi-layered tight gas Patchawarra Sandstone and REM Shale gas. The first well, Charal-1, is due to spud in December quarter 2013.
Stage 3 is dependent on the results from Stage 2. Four appraisal production wells are planned, two vertical and two horizontal. All the wells will be fracture stimulated and put on pilot production. Stage 3 was estimated to cost US$72m at the time of the farm-in.
Western Cooper Deep Coal Seam Gas
Drillsearch’s Western Wet Gas permits (PEL 106A, 106B, 107 and 513) cover an extensive contiguous area of over 2,000km2 in the western part of the Cooper-Eromanga Basin. As part of the wet gas exploration drilling campaign, the PEL 106B Joint Venture conducted a coring programme of the Admella-1, Coolawang-1 and Haslam-1 wells, targeting potential unconventional reservoir sequences in the deep coal seams of the Permian Patchawarra Formation in addition to the conventional wet gas play. Also, unconventional tight oil and deep CSG discoveries were made by the Baird-1 well in the same licence.
Acer Tight Oil Play
With the completion of the Acer Energy acquisition, Drillsearch formally took over operatorship of the Flax and Juniper wet gas and tight oil fields in PEL 101, 103 & 103A and associated PRLs. While the company’s focus in these licences will be the appraisal, development and commercialisation of the large pool of wet gas in the existing discoveries, both the Flax and Juniper discoveries contain large in-place tight oil accumulations. Acer’s historical focus for each of these fields had been formulating a development drilling and well stimulation approach necessary to unlock these tight oil resources. As part of its unconventional business, Drillsearch will continue the appraisal and evaluation.

Australian Unconventional Oil & Gas September 2013 95
Valuation
We estimate that the current fair value of Drillsearch’s share price is A$1.81/share, which is 35% higher than its A$1.34 price on 28 August 2013. We outline our key assumptions behind this NAV-based fair value estimate below.
Based on our financial forecasts we estimate Drillsearch is trading on FY14 and FY15 EV/EBITDA multiples of 4.4x and 4.2x respectively. We also estimate that Drillsearch is trading on FY14 and FY15 P/E multiples of 6.9x and 7.0x. Finally, Drillsearch is trading on a Price/book multiple of 2.0x, while we forecast FY14 Return on Equity will be 22.4%.
Key NAV Assumptions
For Our Current Fair Value Estimate
We have used Drillsearch’s 2P reserves and 2C contingent resources as at June 2013. In July 2013 Drillsearch announced a number of deals with Santos. We have taken account of these and have increased Drillsearch’s Eastern Margin oil 2P reserves (by 1.5MMbbl) and 2C resources (by 2.9MMbbl).
We have used our standard US$/boe NAV estimates for Western Flank oil and Cooper Basin wet gas reserves and resources.
We have assumed that the Eastern Margin Oil (Tintaburra Blocks) reserves and resources are worth just a third of the value of those of Western Flank oil due to the higher average field depletion and resulting higher operating cost. Our NAV/boe assumptions value the Tintaburra oil reserves and resources in the Santos deal at US$37.8m. Drillsearch agreed to pay A$36.8m.
We have risked the chance of development (Pd) of PEL 106A and PEL 513 2C wet gas reserves/resources at 80%, reflecting the vital Cooper Basin infrastructure controlled by new partner (and operator) Santos.
In line with Drillsearch’s guidance, we have assumed a FY14 conventional petroleum exploration work programme costing A$65m.
We have assumed QGC (BG) farms in for its full 60% of ATP 940P and have valued Drillsearch’s remaining 40% stake at US$900/acre (ie, we have used Chevron’s recent Nappamerri Trough (PEL 218 & ATP 855P) farm-in multiple). The geology is similar in these adjacent licences.
Drillsearch had cash of A$36.1m and A$10m of debt at 30 June 2013. Given that our fair value estimate is above the strike price (A$1.66/share) of Drillsearch’s A$125m convertible bond, we have assumed equity conversion and adjusted the number of diluted shares upward accordingly.
We estimate the value of the remaining QGC ATP 940P carry is US$55m. We estimate the net value of the July 2013 Santos transactions at A$78m (A$100m of wet gas business carry plus A$15m sale of PEL 100 less the A$36.8m cost of 29% of the Tintaburra Blocks).
We estimated the value of Drillsearch’s G&A expense by annualising the 1H13 G&A expense (A$6.4m) and dividing by our real 7.5% discount rate (roughly equivalent to a nominal 10% discount rate).
Other assumptions can be seen in Table 33.
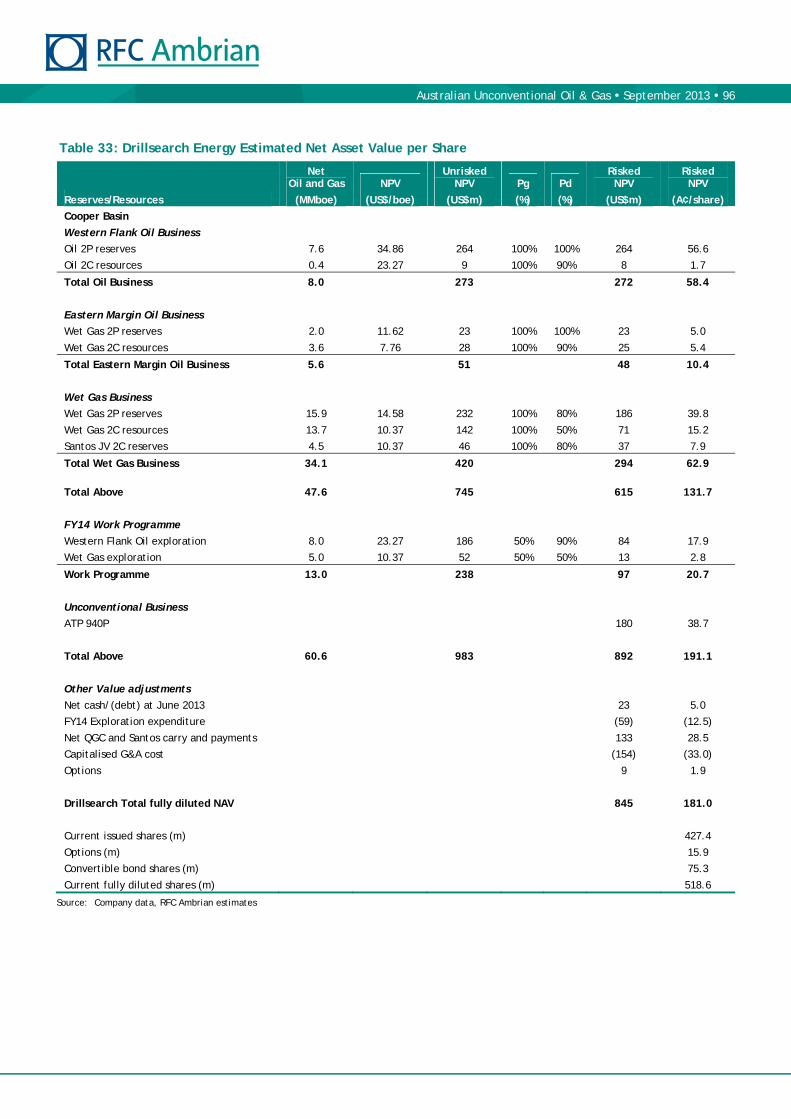
Australian Unconventional Oil & Gas September 2013 96
Table 33: Drillsearch Energy Estimated Net Asset Value per Share
Net Oil and Gas NPV
Unrisked NPV Pg Pd
Risked NPV
Risked NPV
Reserves/Resources (MMboe) (US$/boe) (US$m) (%) (%) (US$m) (A¢/share)
Cooper Basin
Western Flank Oil Business
Oil 2P reserves 7.6 34.86 264 100% 100% 264 56.6
Oil 2C resources 0.4 23.27 9 100% 90% 8 1.7
Total Oil Business 8.0 273 272 58.4
Eastern Margin Oil Business
Wet Gas 2P reserves 2.0 11.62 23 100% 100% 23 5.0
Wet Gas 2C resources 3.6 7.76 28 100% 90% 25 5.4
Total Eastern Margin Oil Business 5.6 51 48 10.4
Wet Gas Business
Wet Gas 2P reserves 15.9 14.58 232 100% 80% 186 39.8
Wet Gas 2C resources 13.7 10.37 142 100% 50% 71 15.2
Santos JV 2C reserves 4.5 10.37 46 100% 80% 37 7.9
Total Wet Gas Business 34.1 420 294 62.9
Total Above 47.6 745 615 131.7
FY14 Work Programme
Western Flank Oil exploration 8.0 23.27 186 50% 90% 84 17.9
Wet Gas exploration 5.0 10.37 52 50% 50% 13 2.8
Work Programme 13.0 238 97 20.7
Unconventional Business
ATP 940P 180 38.7
Total Above 60.6 983 892 191.1
Other Value adjustments
Net cash/(debt) at June 2013 23 5.0
FY14 Exploration expenditure (59) (12.5)
Net QGC and Santos carry and payments 133 28.5
Capitalised G&A cost (154) (33.0)
Options 9 1.9
Drillsearch Total fully diluted NAV 845 181.0
Current issued shares (m) 427.4
Options (m) 15.9
Convertible bond shares (m) 75.3
Current fully diluted shares (m) 518.6
Source: Company data, RFC Ambrian estimates

Australian Unconventional Oil & Gas September 2013 97
Forecast Financial Multiples
Our revenue, EBITDA and net profit forecasts are in line with or slightly lower than current Bloomberg consensus estimates. Based on our forecast prices and production, we estimate that Drillsearch will generate FY14 and FY15 revenues of A$228m and A$248m respectively (consensus is for A$239and A$255m). We forecast A$151m EBITDA in FY14 and A$156m EBITDA in FY15 (consensus is A$152m and A$166m). We forecast FY14 net profit of A$83m, vs. the Bloomberg consensus forecast of A$81m.
We believe the market looks at 1-2-year forward cashflow and earnings multiples, and that based on these Drillsearch appears undervalued relative to its peers. We estimate that Drillsearch is currently trading on FY14 and FY15 EV/EBITDAX multiples of 4.4x and 4.2x respectively. We estimate that Drillsearch is currently trading on FY14 and FY15 P/E multiples of 6.9x and 7.0x respectively. These levels are in line with the relevant multiples of Beach and Cooper, but below those of Senex.
Drillsearch is trading on a Price/book equity multiple of 2.0x, which seems fair given that we forecast an FY14 ROE of 22.4%.
Table 34: Drillsearch Valuation Multiples
28/8/2013 2013 2014F 2015F
Market Cap and EV
Share Price (A$) 1.34
Shares (m) 427
Market Cap (A$m) 573 573 573 573
Avg net debt/(cash) (A$m) 29 109 103
Enterprise value (A$m) 602 682 676
Cashflow and Profit
EBITDAX (A$m) 38 156 161
Net Profit (A$m) 45 83 82
Valuation Multiples
EV/EBITDAX (x) 16.0 4.4 4.2
P/E (x) 12.7 6.9 7.0
P/BV (x) 2.0 1.5 1.3
ROE 15.7% 22.4% 18.2%
Source: Company data, RFC Ambrian estimates

Australian Unconventional Oil & Gas September 2013 98
Table 35: Drillsearch Key Model Drivers
2010 2011 2012 2013 2014F 2015F
Production
Oil production (Mbbl) 159 91 85 775 1,612 1,564
Gas production (PJ) 0 0 1,655 1,479 3,402 6,192
Gas liquid production (Mboe) 0 6 88 82 176 321
Total Production (Mboe) 159 98 448 1,104 2,356 2,917
Growth -18% -39% 359% 146% 113% 24%
Prices
Brent oil Price (US$/bbl) 75.24 96.73 112.08 108.78 104.62 98.48
Sydney Gas Price (A$/GJ) 3.19 3.77 5.20 6.00 7.00
Costs
Operating costs (A$/boe) 33.24 51.85 18.02 28.12 25.00 25.00
DD&A (A$/boe) 17.48 39.28 13.59 10.43 11.00 11.00
G&A (A$m) 2.6 4.3 5.7 15.6 15.6 15.6
Capex (A$m) 12.6 14.8 43.2 142.8 100.0 100.0
Effective P&L tax rate 0% 7% -187% -153% 30% 30%
Source: Company data, RFC Ambrian estimates
Table 36: Drillsearch Income Statement
(A$m) 2010 2011 2012 2013 2014F 2015F
Sales 6.1 14.4 22.4 102.2 228.0 247.7
Cost of sales (7.8) (11.8) (14.3) (43.3) (84.8) (105.0)
Gross profit (1.7) 2.6 8.1 58.9 143.2 142.7
Net other revenue 0.3 2.6 2.8 2.5 2.0 1.4
Net other expenses (22.9) (11.5) (7.1) (37.5) (20.6) (20.6)
EBIT (24.3) (6.3) 3.8 23.9 124.6 123.5
Interest (0.4) 0.2 (0.3) (6.1) (6.1) (6.1)
EBT (24.8) (6.1) 3.5 17.8 118.5 117.4
Tax 0.0 0.4 6.5 27.3 (35.6) (35.2)
Minorities (0.2) 0.1 0.0 0.0 0.0 0.0
Net Profit (24.9) (5.5) 10.0 45.1 83.0 82.2
Source: Company data, RFC Ambrian estimates
Table 37: RFC Ambrian Forecasts vs. Consensus Estimates
2013 Actual 2014F 2015F
Revenue
RFC Ambrian forecast (A$m) 102.2 228.0 247.7
Bloomberg consensus (A$m) 238.9 255.4
RFC Ambrian/Consensus (%) 95% 97%
EBITDA
RFC Ambrian forecast (A$m) 35.4 150.5 155.6
Bloomberg consensus (A$m) 152.1 165.6
RFC Ambrian/Consensus (%) 99% 94%
Net Profit
RFC Ambrian forecast (A$m) 45.1 83.0 82.2
Bloomberg consensus (A$m) 80.9 90.5
RFC Ambrian/Consensus (%) 103% 91%
Source: Bloomberg, RFC Ambrian

Australian Unconventional Oil & Gas September 2013 99
Table 38: Drillsearch Balance Sheet
(A$m) 2010 2011 2012 2013 2014F 2015F
Cash 4.4 50.3 45.6 36.1 25.7 49.1
Receivables 2.0 1.0 3.7 51.3 75.0 81.4
Inventory 3.7 1.5 0.8 1.7 6.2 6.8
Other 10.7 2.5 22.0 1.3 1.3 1.3
Total current assets 20.8 55.3 72.0 90.4 108.2 138.6
PP&E 0.2 0.6 1.0 3.7
Developed assets 26.3 41.8 54.8 108.6
Exploration assets 29.0 18.8 23.1 217.9
PP&E, Expl & Dev 55.5 61.1 78.9 330.2 399.3 462.2
Other 0.2 1.3 12.6 64.6 64.6 64.6
Total non-cur assets 55.7 62.4 91.5 394.8 463.9 526.8
Total assets 76.4 117.7 163.5 485.2 572.1 665.3
Trade payables 1.0 4.1 12.0 42.5 46.5 57.5
Short-term debt 0.0 0.0 0.0 10.0 10.0 10.0
Deferred tax 3.4 0.0 0.0 0.0 0.0 0.0
Other 3.0 0.2 7.0 1.6 1.6 1.6
Total cur liabilities 7.4 4.3 19.0 54.1 58.1 69.1
Long-term debt 0.0 0.0 0.0 130.4 130.4 130.4
Deferred tax 0.0 0.0 0.0 0.0 0.0 0.0
Other 3.3 3.4 2.5 14.1 14.1 14.1
Minorities 2.1 0.0 0.0 0.0 0.0 0.0
Equity 63.6 110.0 142.0 286.6 369.6 451.7
Total non-cur liabs 69.0 113.4 144.5 431.1 514.0 596.2
Total liabilities 76.4 117.7 163.5 485.2 572.1 665.3
Source: Company data, RFC Ambrian estimates
Table 39: Drillsearch Cashflow Statement
(A$m) 2010 2011 2012 2013 2014F 2015F
Net profit (24.9) (5.5) 10.0 45.1 83.0 82.2
Depreciation 17.8 6.6 6.5 13.7 30.9 37.1
Working capital (0.0) 6.3 6.0 (18.1) (24.2) 4.1
Other 3.6 (2.2) (12.4) (21.4) 0.0 0.0
Operating cashflow (3.6) 5.2 10.0 19.2 89.7 123.3
Capex (12.8) (12.9) (37.5) (142.8) (100.0) (100.0)
Other 0.2 5.7 2.4 (114.4) 0.0 0.0
Investing cashflows (12.6) (7.2) (35.0) (257.3) (100.0) (100.0)
Debt 0.0 0.0 0.0 129.1 0.0 0.0
Equity 15.0 49.6 20.5 99.0 0.0 0.0
Dividends 0.0 0.0 0.0 0.0 0.0 0.0
Other (1.0) (3.2) (0.0) 0.4 0.0 0.0
Financing cashflow 13.9 46.3 20.4 228.5 0.0 0.0
Cash at beginning 8.1 6.5 50.3 45.6 36.1 25.7
Net change (1.6) 43.7 (4.6) (9.6) (10.3) 23.3
Cash at end 6.5 50.3 45.6 36.1 25.7 49.1
Source: Company data, RFC Ambrian estimates
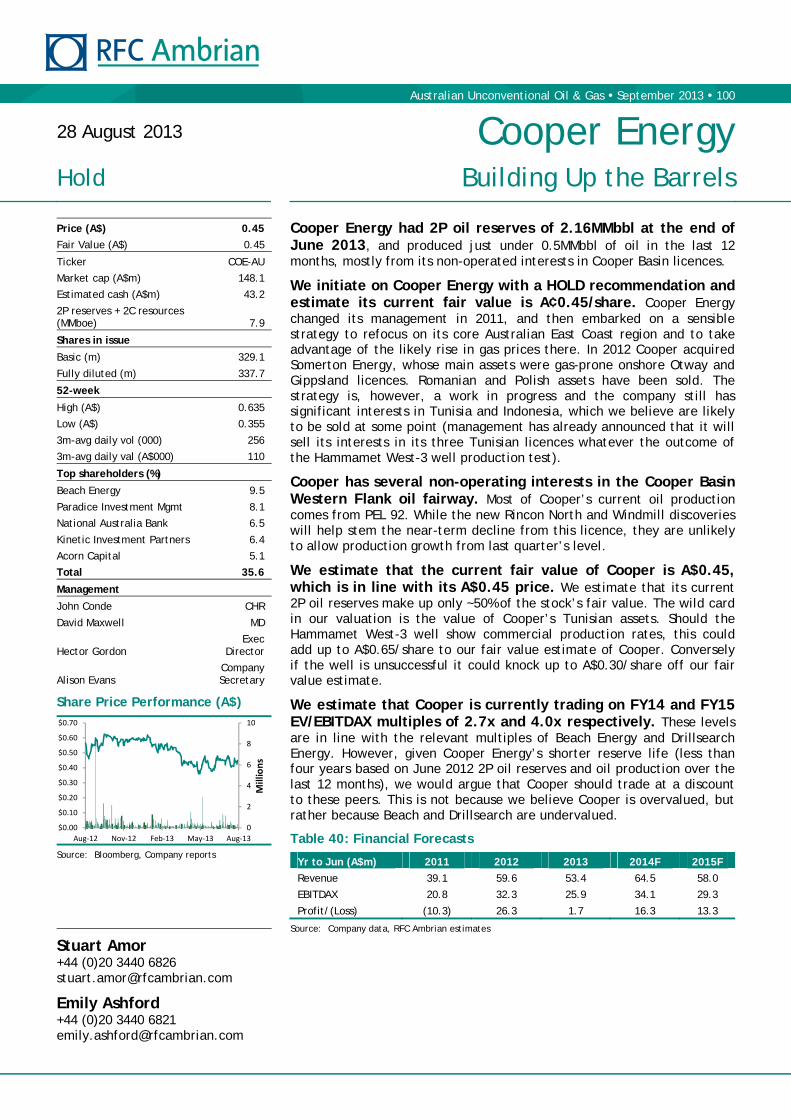
Australian Unconventional Oil & Gas September 2013 100
Cooper Energy had 2P oil reserves of 2.16MMbbl at the end of June 2013, and produced just under 0.5MMbbl of oil in the last 12 months, mostly from its non-operated interests in Cooper Basin licences.
We initiate on Cooper Energy with a HOLD recommendation and estimate its current fair value is A¢0.45/share. Cooper Energy changed its management in 2011, and then embarked on a sensible strategy to refocus on its core Australian East Coast region and to take advantage of the likely rise in gas prices there. In 2012 Cooper acquired Somerton Energy, whose main assets were gas-prone onshore Otway and Gippsland licences. Romanian and Polish assets have been sold. The strategy is, however, a work in progress and the company still has significant interests in Tunisia and Indonesia, which we believe are likely to be sold at some point (management has already announced that it will sell its interests in its three Tunisian licences whatever the outcome of the Hammamet West-3 well production test).
Cooper has several non-operating interests in the Cooper Basin Western Flank oil fairway. Most of Cooper’s current oil production comes from PEL 92. While the new Rincon North and Windmill discoveries will help stem the near-term decline from this licence, they are unlikely to allow production growth from last quarter’s level.
We estimate that the current fair value of Cooper is A$0.45, which is in line with its A$0.45 price. We estimate that its current 2P oil reserves make up only ~50% of the stock’s fair value. The wild card in our valuation is the value of Cooper’s Tunisian assets. Should the Hammamet West-3 well show commercial production rates, this could add up to A$0.65/share to our fair value estimate of Cooper. Conversely if the well is unsuccessful it could knock up to A$0.30/share off our fair value estimate.
We estimate that Cooper is currently trading on FY14 and FY15 EV/EBITDAX multiples of 2.7x and 4.0x respectively. These levels are in line with the relevant multiples of Beach Energy and Drillsearch Energy. However, given Cooper Energy’s shorter reserve life (less than four years based on June 2012 2P oil reserves and oil production over the last 12 months), we would argue that Cooper should trade at a discount to these peers. This is not because we believe Cooper is overvalued, but rather because Beach and Drillsearch are undervalued.
Table 40: Financial Forecasts
Yr to Jun (A$m) 2011 2012 2013 2014F 2015F
Revenue 39.1 59.6 53.4 64.5 58.0
EBITDAX 20.8 32.3 25.9 34.1 29.3
Profit/(Loss) (10.3) 26.3 1.7 16.3 13.3
Source: Company data, RFC Ambrian estimates
28 August 2013 Cooper Energy
Hold Building Up the Barrels
Stuart Amor +44 (0)20 3440 6826 [email protected]
Emily Ashford +44 (0)20 3440 6821 [email protected]
Price (A$) 0.45
Fair Value (A$) 0.45
Ticker COE-AU
Market cap (A$m) 148.1
Estimated cash (A$m) 43.2
2P reserves + 2C resources (MMboe) 7.9
Shares in issue
Basic (m) 329.1
Fully diluted (m) 337.7
52-week
High (A$) 0.635
Low (A$) 0.355
3m-avg daily vol (000) 256
3m-avg daily val (A$000) 110
Top shareholders (%)
Beach Energy 9.5
Paradice Investment Mgmt 8.1
National Australia Bank 6.5
Kinetic Investment Partners 6.4
Acorn Capital 5.1
Total 35.6
Management
John Conde CHR
David Maxwell MD
Hector Gordon Exec
Director
Alison Evans Company Secretary
Share Price Performance (A$)
Source: Bloomberg, Company reports
0
2
4
6
8
10
$0.00
$0.10
$0.20
$0.30
$0.40
$0.50
$0.60
$0.70
Aug‐12 Nov‐12 Feb‐13 May‐13 Aug‐13
Millions

Australian Unconventional Oil & Gas September 2013 101
Investment Case
We are initiating on Cooper Energy with a HOLD recommendation and estimate its current fair value is A¢45/share. We like management’s strategy of refocusing on potential gas licences on Australia’s East Coast. Should the Hammamet West-3 well show commercial production rates, this could add A$0.65/share to our fair value estimate of Cooper. Conversely if the well is unsuccessful it could knock A$0.30/share off our fair value estimate.
Cooper Energy changed its Managing Director (MD) in October 2011. David Maxwell, the new MD, has embarked on a sensible strategy of refocusing Cooper on its core Australian East Coast region and to take advantage of the likely rise in gas prices there. In 2012 Cooper acquired Somerton Energy, whose main assets were gas-prone onshore Otway and Gippsland licences. The Romanian and Polish assets have been sold and G&A expenditure fell by A$1.5m last year. The strategy is however, a work in progress and the company still has significant interests in Tunisia and Indonesia, which we believe are likely to be sold at some point (management has already announced that it will sell its interests in its three Tunisian licences whatever the outcome of the Hammamet West-3 well production test).
Cooper has several non-operating interests in the Cooper Basin Western Flank oil fairway. These provided the revenue and cashflow that allowed previous management to go exploring around the world. Most of Cooper’s current oil production comes from PEL 92. While the new Rincon North and Windmill discoveries will help stem the near-term decline from this licence, they are unlikely to allow significant production growth from last quarter’s level. Cooper had 2P oil reserves of 2.16MMbbl at June 2013, giving the company a reserve life of less than four years based on the last 12 months of production.
Cooper produced 0.489MMbbl of oil in FY13, down 5.4% YoY. Despite forecasting declining quarterly production from June quarter 2013 levels, we forecast FY14 annual oil production growth of 10% due to the base effect. We forecast FY15 production to decline 8%. Longer-term drilling on the (currently being shot) Dundinna 3D seismic could allow Cooper to stabilise its Western Flank oil production at ~0.5MMbbl pa.
Figure 72: Cooper Energy Quarterly Oil Production
Source: Company data, RFC Ambrian estimates
We initiate with a HOLD recommendation
New management has embarked on a sensible strategy to refocus the company
Most of Cooper’s current oil production comes from PEL 92
We forecast FY14 annual oil production growth of 10% due to the base effect

Australian Unconventional Oil & Gas September 2013 102
We estimate that the current fair value of Cooper is A$0.45, which is the same as its A$0.45 price on 28 August 2013. We estimate that its current 2P oil reserves make up only ~50% of the stock’s fair value.
The wild card in our valuation is the value of Cooper’s Tunisian assets. Should the Hammamet West-3 well show commercial production rates, this could add up to A$0.65/share to our fair value estimate of Cooper. Conversely if the well is unsuccessful it could knock up to A$0.30/share off our fair value estimate.
The Hammamet West-3 well is testing a 101MMbbl prospect, and Cooper has a 30% interest in the licence. Should the Hammamet West-3 well show commercial production rates, the oil field could be worth around US$273m to Cooper (using an arbitrary US$10/bbl valuation metric and assuming a 90% chance of development). We have put the current commercial chance of success of the Hammamet West prospect at 35%, thus valuing the prospect at A$0.35/share.
Figure 73: Cooper Energy Fair Value Breakdown
Source: RFC Ambrian estimates
We estimate that Cooper is currently trading on FY14 and FY15 EV/EBITDAX multiples of 2.7x and 4.0x respectively, and that it is currently trading on FY14 and FY15 P/E multiples of 9.1x and 11.1x. These levels are in line with the relevant multiples of Beach and Drillsearch; however, given Cooper Energy’s shorter reserve life (less than four years based on June 2012 2P oil reserves and oil production over the last 12 months), we would argue Cooper should trade at a discount to these peers. This is not because we believe Cooper is overvalued, but rather because Beach and Drillsearch are undervalued.
Fair value
Multiple valuation

Australian Unconventional Oil & Gas September 2013 103
Risks
Cooper Energy is subject to the usual risks that an upstream petroleum exploration and production company faces. These include: geological/technical, political/regulatory, commercial, operational, capital access and environmental. In particular, Cooper’s valuation is highly sensitive to the result of the Hammamet West-3 appraisal well.
Cooper is planning a A$38m FY14 exploration programme, and some of the planned exploration wells might not be successful. Even in the Cooper Basin where success rates, while drilling on 3D seismic, are around 48%, the failure of an individual exploration well is more likely than success.
Cooper, like other Cooper Basin oil producers, may not be able to replace or grow its Cooper Basin 2P oil reserves over time. While the economics of Western Flank oil are great, this is partly due to the aquifer-supported accelerated production profile of new discoveries. The vast majority of recoverable oil reserves are produced in the first five or six years. This generally leads to low reserve lives. Cooper Energy’s Australian oil assets have a <4 year reserve life based on FY13 production and its June 2013 2P reserves.
The Cooper Basin is prone to flooding. In 2010 the biggest flood in 30 years prevented exploration and development activity in much of the basin for several months. Production from many Western Flank oil fields, was trucked to Moomba, and this was not possible over the unsealed roads in the region. Most of PEL 92 oil fields are now connected to Moomba by pipeline and thus their production may be more ‘flood-proof’. Nonetheless, a recurrence could severely affect Cooper’s other activity in the region.
Unconventional petroleum production is yet to be proved commercial in Australia. Should petroleum prices and flow rates from unconventional wells not be sufficient to give an economic return on the investment, Australia’s unconventional resources will not be developed.
Management
Mr Conde was appointed Chairman in February 2013 following the standing down of Mr Laurie Shervington, who served as Chairman from November 2004. Mr Conde has more than 25 years’ experience as Chairman and Non-executive Director in Australian resource and energy companies. He has held positions with companies from BHP Billiton, Whitehaven Coal, Dexus Property Group to BUPA Australia.
Mr Conde was made an Officer of the Order of Australia in 2004 for his services to business and commerce, particularly in the field of electricity generation and commerce.
Mr Maxwell has more than 25 years’ experience in senior executive roles with companies such as BG Group, Woodside Petroleum and Santos. He led BG Group’s entry into Australia, its involvement in the alliance with Queensland Gas Company and its subsequent takeover by BG Group. As Senior Vice President at QGC, he was responsible for all commercial, exploration, business development, strategy and marketing activities. At Woodside he was a director of gas and marketing and a member of Woodside’s executive committee.
Mr Maxwell was a recipient of the Australian Gas Association Silver Flame Award for his contribution to the gas industry.
John C Conde — Chairman
David Maxwell — Managing Director
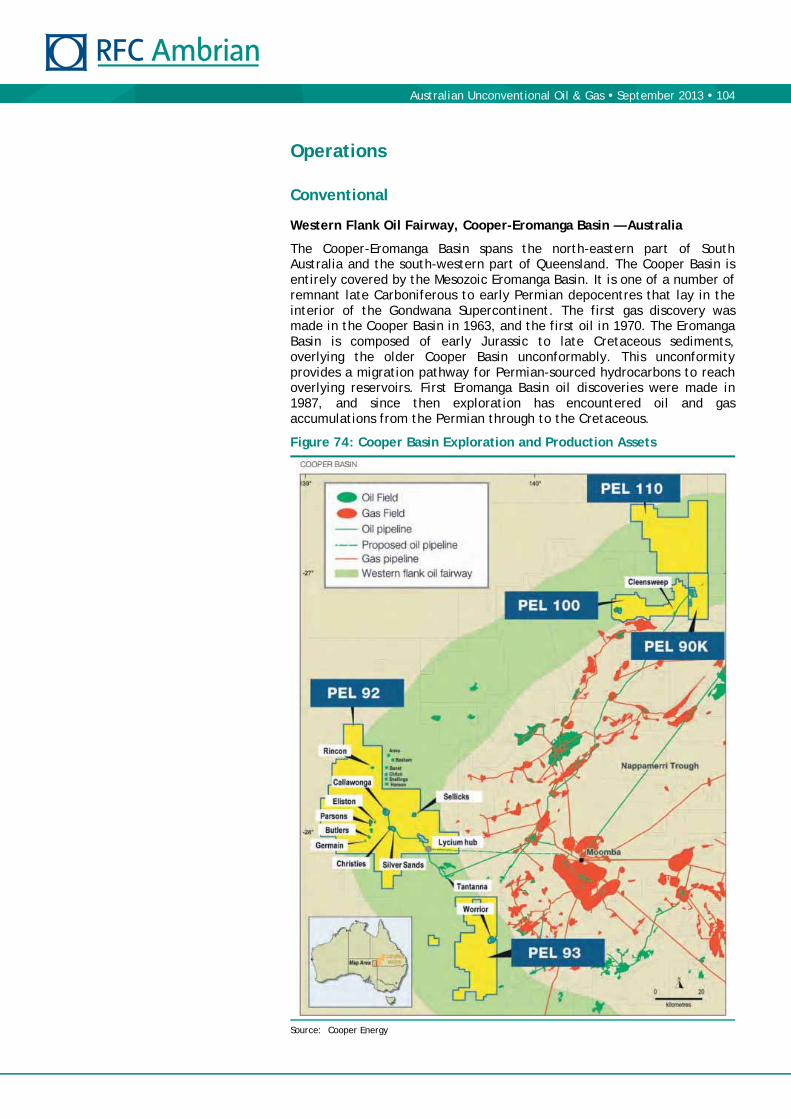
Australian Unconventional Oil & Gas September 2013 104
Operations
Conventional
Western Flank Oil Fairway, Cooper-Eromanga Basin — Australia
The Cooper-Eromanga Basin spans the north-eastern part of South Australia and the south-western part of Queensland. The Cooper Basin is entirely covered by the Mesozoic Eromanga Basin. It is one of a number of remnant late Carboniferous to early Permian depocentres that lay in the interior of the Gondwana Supercontinent. The first gas discovery was made in the Cooper Basin in 1963, and the first oil in 1970. The Eromanga Basin is composed of early Jurassic to late Cretaceous sediments, overlying the older Cooper Basin unconformably. This unconformity provides a migration pathway for Permian-sourced hydrocarbons to reach overlying reservoirs. First Eromanga Basin oil discoveries were made in 1987, and since then exploration has encountered oil and gas accumulations from the Permian through to the Cretaceous.
Figure 74: Cooper Basin Exploration and Production Assets
Source: Cooper Energy
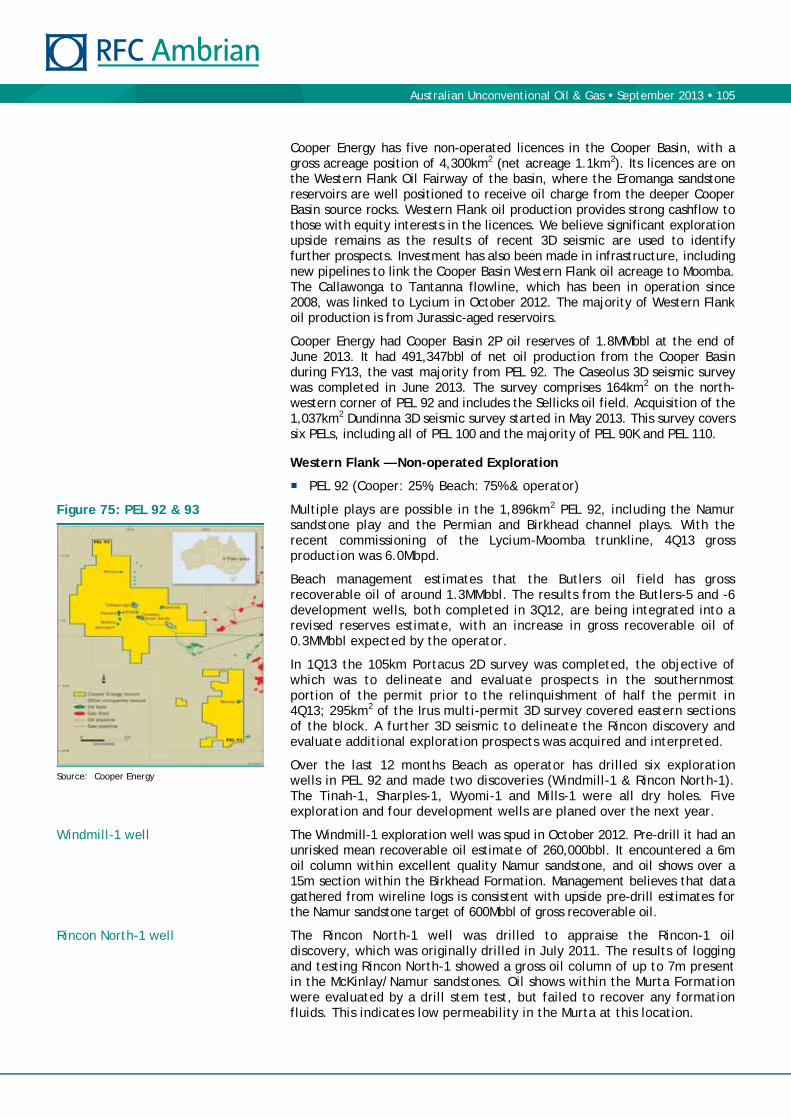
Australian Unconventional Oil & Gas September 2013 105
Cooper Energy has five non-operated licences in the Cooper Basin, with a gross acreage position of 4,300km2 (net acreage 1.1km2). Its licences are on the Western Flank Oil Fairway of the basin, where the Eromanga sandstone reservoirs are well positioned to receive oil charge from the deeper Cooper Basin source rocks. Western Flank oil production provides strong cashflow to those with equity interests in the licences. We believe significant exploration upside remains as the results of recent 3D seismic are used to identify further prospects. Investment has also been made in infrastructure, including new pipelines to link the Cooper Basin Western Flank oil acreage to Moomba. The Callawonga to Tantanna flowline, which has been in operation since 2008, was linked to Lycium in October 2012. The majority of Western Flank oil production is from Jurassic-aged reservoirs.
Cooper Energy had Cooper Basin 2P oil reserves of 1.8MMbbl at the end of June 2013. It had 491,347bbl of net oil production from the Cooper Basin during FY13, the vast majority from PEL 92. The Caseolus 3D seismic survey was completed in June 2013. The survey comprises 164km2 on the north-western corner of PEL 92 and includes the Sellicks oil field. Acquisition of the 1,037km2 Dundinna 3D seismic survey started in May 2013. This survey covers six PELs, including all of PEL 100 and the majority of PEL 90K and PEL 110.
Western Flank — Non-operated Exploration
PEL 92 (Cooper: 25%, Beach: 75% & operator)
Multiple plays are possible in the 1,896km2 PEL 92, including the Namur sandstone play and the Permian and Birkhead channel plays. With the recent commissioning of the Lycium-Moomba trunkline, 4Q13 gross production was 6.0Mbpd.
Beach management estimates that the Butlers oil field has gross recoverable oil of around 1.3MMbbl. The results from the Butlers-5 and -6 development wells, both completed in 3Q12, are being integrated into a revised reserves estimate, with an increase in gross recoverable oil of 0.3MMbbl expected by the operator.
In 1Q13 the 105km Portacus 2D survey was completed, the objective of which was to delineate and evaluate prospects in the southernmost portion of the permit prior to the relinquishment of half the permit in 4Q13; 295km2 of the Irus multi-permit 3D survey covered eastern sections of the block. A further 3D seismic to delineate the Rincon discovery and evaluate additional exploration prospects was acquired and interpreted.
Over the last 12 months Beach as operator has drilled six exploration wells in PEL 92 and made two discoveries (Windmill-1 & Rincon North-1). The Tinah-1, Sharples-1, Wyomi-1 and Mills-1 were all dry holes. Five exploration and four development wells are planed over the next year.
The Windmill-1 exploration well was spud in October 2012. Pre-drill it had an unrisked mean recoverable oil estimate of 260,000bbl. It encountered a 6m oil column within excellent quality Namur sandstone, and oil shows over a 15m section within the Birkhead Formation. Management believes that data gathered from wireline logs is consistent with upside pre-drill estimates for the Namur sandstone target of 600Mbbl of gross recoverable oil.
The Rincon North-1 well was drilled to appraise the Rincon-1 oil discovery, which was originally drilled in July 2011. The results of logging and testing Rincon North-1 showed a gross oil column of up to 7m present in the McKinlay/Namur sandstones. Oil shows within the Murta Formation were evaluated by a drill stem test, but failed to recover any formation fluids. This indicates low permeability in the Murta at this location.
Figure 75: PEL 92 & 93
Source: Cooper Energy
Windmill-1 well
Rincon North-1 well

Australian Unconventional Oil & Gas September 2013 106
PEL 93 (Cooper: 30%, Senex: 70% & operator)
PEL 93 is a 622km2 licence that lies to the south-west of Moomba. Cooper Energy acquired its interest in 2001. It surrounds the Worrior oil field, discovered by the Worrior-1 well in late 2003. Since then there have been several exploration wells targeting the McKinlay and Birkhead formations that are productive at Worrior, including Patron-1 and Rainbird-1 (both spud in 2007, but which discovered no commercial hydrocarbons so were plugged and abandoned).
PEL 100 (Cooper: 19.2%, Senex: 55% & operator, Drillsearch: 25.8%)
Cooper Energy farmed in to PEL 100 in March 2003. PEL 100 is 110km north of the Moomba facilities, 3km to the south of the Telopea oil field, and 296km2 in area. There have been seven exploration wells on the permit (Acacia Grove-1, Angelica-1, Apachire-1, Hamlyn-1, Fairbridge-1, Strickland Bay-1 and Cleansweep-1) with hydrocarbon shows and oil recoveries, but no commercial discoveries. However, the targets were relatively poorly defined on a modestly-spaced 2D seismic grid, and 3D seismic may allow future success.
PEL 110 (Cooper: 20%, Senex: 60% & operator, Orca: 20%)
Cooper Energy farmed in to PEL 110 in March 2003. PEL 110 is a 727.5km2 exploration licence, lying on the up-dip edge, north of the previously discovered Kilearny and Telopea oil and gas fields, and to the west of the James oil field. The main reservoirs are Jurassic and Permian, with the Jurassic Birkhead and Hutton becoming a reservoir/source focus. The JV has identified seven leads and prospects, with individual P50 undiscovered recoverable oil estimates ranging from 0.6-3.8MMbbl at the Birkhead/Hutton formation level. Orca (formerly Monitor Energy) farmed into the licence in 2011 and will earn 20% equity by paying 40% of the costs of one exploration well.
PEL 90K (Cooper: 25%, Senex: 75% & operator)
PEL 90K covers 145km2. Cooper Energy farmed into 25% of Stuart Petroleum’s PEL 90 Kiwi in late 2003. It met 50% of the cost of the Maribu seismic survey, and 60% of the dry hole cost of drilling a well (Kiwi-1 made a gas discovery, flowing 9.6MMcfpd from the Callamurra Formation).
Gippsland Basin
In September 2012 Cooper Energy acquired a further interest in Bass Strait Oil, increasing its interest to 19.9%. The key Bass Strait Oil assets include undeveloped gas resources and other, mainly offshore, opportunities in the Gippsland Basin. In July 2013 Cooper agreed to farm in to Bass Strait Oil permits VIC/P41 and VIC/P68, offshore Gippsland Basin. The permits contain a number of sizeable prospects located close to existing gas and oil supply infrastructure.
Under the terms of the agreements, Cooper Energy will acquire a 25.8% participating interest in VIC/P41 and an option to acquire a 50% participating interest in VIC/P68 by funding the reprocessing and merging of multiple 3D seismic datasets and QI/AVO1 analyses. The reprocessing and analysis is anticipated to cost approximately A$1m.

Australian Unconventional Oil & Gas September 2013 107
Tunisia
Cooper Energy first entered offshore Tunisia in 2005. Now it has interests in three contiguous exploration permits covering a gross 12,644km2 (net 5,871km2). The licences are in the Gulf of Hammamet in the Mediterranean Sea. They surround existing production and undeveloped oil and gas fields, and contain many prospects and leads. 2C contingent resources are 5.74MMbbl, excluding Hammamet West. Cooper has announced that it is looking to divest its Tunisian interests as part of its strategy to refocus on eastern Australia.
Figure 76: Tunisian Licences
Source: Cooper Energy
The licences are within the Pelagian Basin, which spans Tunisia, western Libya, Italy and Malta. The Middle Miocene Birsa sandstones are the most productive proven reservoirs in the Gulf of Hammamet. They have porosities ranging from 20-35%, and permeability in the order of 100-1000+mD. The fractured carbonates of the Late Cretaceous Abiod Formation form a deeper reservoir. Reservoirs have often formed multiple stacked targets in structural traps.
Bargou Exploration Permit (Cooper: 30% & operator, Dragon Oil: 55%, Jacka Resources: 15%)
The 4,616km2 permit is in water depths of 50-100m. It contains 600MMbbl of gross unrisked mean prospective resources (RPS Energy). The producing ENI Maamoura oil field development is 12km to the south. In the north of the permit is the Hammamet West oil field, which covers 205km2, in 50-60m water depths, around 12km from the coast. 3D seismic was acquired in 2009-10 across this field.
Cooper Energy acquired a 100% interest in the permit in 2005. In September 2010 Cooper farmed out a 15% interest to Jacka Resources, in return for a proportion of back costs and paying a promote on drilling and testing of the Menzel Horr-1 and Hammamet West-3 wells (the total value of the transaction was estimated by management to be US$12m). In October 2011 Cooper farmed out a further 55% to Dragon Oil (Holdings) in return for 75% of the cost to drill the Hammamet West-3 well, to a cost cap of US$26.6m. If well costs exceed this amount they will be shared amongst the joint-venture partners pro rata. If the Hammamet West-3 well is successful, and the JV proceeds with development of the field, Dragon Oil will assume operatorship, and will carry Cooper Energy in an amount equal to approximately US$5m, to cover pro rata back costs.
Figure 77: Stratigraphy
Source: Cooper Energy

Australian Unconventional Oil & Gas September 2013 108
The Hammamet West oil field is 80km to the south-east of Tunis, and 15km from the coast of Cap Bon. It was discovered by the Hammamet West-1 exploration well, drilled in 1967, and encountered 7m of oil in the Birsa sandstone and 30m of hydrocarbons in the Ain Grab/Fortuna formations. Over three decades later in 1990, a second well, Hammamet West-2, was drilled 1.8km to the south-west. It found three zones of movable oil over a 192m section in the deeper Abiod Formation. Two drill stem tests (DST) on the Abiod recovered oil with specific gravities of 33° and 27° API. Hammamet West is covered by 205km2 of high resolution 3D seismic, which was acquired in 2009-10. Cooper’s analysis of this survey indicated a 2C contingent resource of 101MMbbl in the Abiod Formation reservoir, with a further 10MMbbl in the shallower Birsa reservoir.
Figure 78: Hammamet West Geological Cross Section
Source: Cooper Energy
The main objective is to drill and test a highly deviated wellbore through the naturally fractured Abiod Formation reservoir to confirm oil productivity. Cooper has suggested that should the Hammamet West-3 well prove successful the field could be developed using an unmanned offshore platform.
The Hammamet West-3 well was spud in 50m of water on 4 April 2013. The drilling to 3,443m measured depth was completed in July and testing of the 432m lateral section started on 5 August 2013. Prior to commencing the main flow period, coiled tubing operations were conducted in preparation for the introduction of acid into the wellbore. On 7 August the coiled tubing became stuck inside the production tubing due to an accumulation of loss circulation material produced from the Abiod Formation. Operations to free the obstruction have been unsuccessful to date.
It is intended to remove the coiled tubing so that testing operations may resume. Specialised cutting equipment has been mobilised to the rig to assist removal of the coiled tubing from the well bore. It is expected that, depending on the results of the cutting operations, testing operations should recommence at the beginning of September.
Hammamet West oil field
Hammamet West-3 well

Australian Unconventional Oil & Gas September 2013 109
Nabeul Exploration Permit (Cooper: 85% & operator, Dyas BV: 15%)
The most easterly of Cooper’s Tunisian licences is the Nabeul exploration permit, awarded on 24 January 2008. It covers 3,352km2 and water depth is moderate at 270-300m. The primary objective is the Birsa sandstone, at approximately 1,200-1,600m depth. Cooper shot 600km2 of 3D seismic in 2011. It showed numerous targets, with management estimating 50-100MMbbl of recoverable oil.
Figure 79: Nabeul Permit
Source: Cooper Energy
Hammamet Exploration Permit (Cooper: 35%, Chinook Energy: 35% & operatorship, DNO Tunisia: 30%)
This 4,676km2 licence was initially awarded in September 2005. Cooper Energy farmed into the licence in late 2007. In 2007 the joint venture acquired 409km2 of 3D seismic over the Tazerka field and Fuchsia prospect, and 211km of 2D seismic. The Tazerka Field was abandoned in 1998 after producing 21.6MMbbl from the Birsa reservoirs.
The Fuchsia-1 well was spud in May 2010, targeting the Birsa Formation. It found a 16m gas column in the Birsa sandstones, with porosity of 30% and gas saturation of 85-90%. This was considered sub-economic and it was plugged and abandoned. Completion of the well fulfilled Cooper’s farm-in obligations. In 2011, 300km2 of 3D seismic was acquired over the Tazerka oil field (again) and the Kasserine prospect, which is on trend with the Oudna and Birsa fields.
Fuchsia-1

Australian Unconventional Oil & Gas September 2013 110
Indonesia
Cooper Energy has interest in three concessions in South Sumatra, Indonesia. One is in production, Sukananti (2P reserves of 0.35MMbbl), while the other two are exploration licences: Sumbagsel and Merangin III.
Figure 80: Sumbagsel PSC and Sukananti KSO
Source: Cooper Energy
Sukananti KSO (Cooper: 55% & operator, Mega Adhyaksa Pratama: 45%)
Cooper Energy acquired its interest in this field in 2010 from Pertamina, the National Oil Company of Indonesia. This licence covers 18.25km2. It is producing from the Talang Akar Miocene formation. The fields were producing ~50bpd of gross oil when Cooper acquired the licence. Cooper states that current gross production is ~200bpd of oil in its June 2013 quarterly activity report. The increase is due to the commencement of production from the Tangai-1 well in June after a successful workover. Storage limitations at the location mean that a stabilised production rate from the field is yet to be established.
Recent 3D seismic has provided enhanced structural and stratigraphic resolution over the block, and has identified three drilling opportunities. Future work in FY14 includes one exploration well and up to two development wells.
Sumbagsel PSC (Cooper: 100%)
A six-year exploration licence for this 1,753km2 permit was awarded in March 2011. It contains many shallow oil targets (1-5MMbbl). 2D seismic is to be acquired in late 2013, with a plan to drill one exploration well in 2014. A farm-out process is in progress.
Merangin III PSC (Cooper 100%)
A six-year exploration licence for this 1,488km2 permit was awarded in March 2013. In the first three years Cooper is committed to acquiring seismic and drilling one well at an estimated US$9.7m total cost. A farm-out process is in progress.

Australian Unconventional Oil & Gas September 2013 111
Unconventional
Otway Basin — Australia
Cooper increased its footprint in the Otway Basin dramatically, from one to six licences, following the acquisition of Somerton Energy in June 2012. Its licences now cover a gross 5,924km2 (net 2443km2). The basin is proven for conventional plays.
Figure 81: Otway Basin Licences
Source: Cooper Energy
The Otway Basin covers an area of 150,000km2, 80% of which lies offshore. Onshore it spreads across both Southern Australia and Victoria. In August 2012 the Victorian Government issued a moratorium on fracture stimulation, which has postponed the exploration and exploitation of unconventional resources that would require this technique.
Table 41: Otway Basin Licences
Licence COE interest State Area Awarded
PEL 495 65% South Australia 793km2 Mar 2009
PEL 186 33% South Australia 709km2 Jan 2005
PEL 150 20% Victoria 794km2 Under application
PEP151 75% Victoria 859km2 May 2002
PEP168 50% Victoria 795km2 Jun 2007
PEP171 25% Victoria 1,974km2 Under application
Total 5,924km2
Source: Cooper Energy
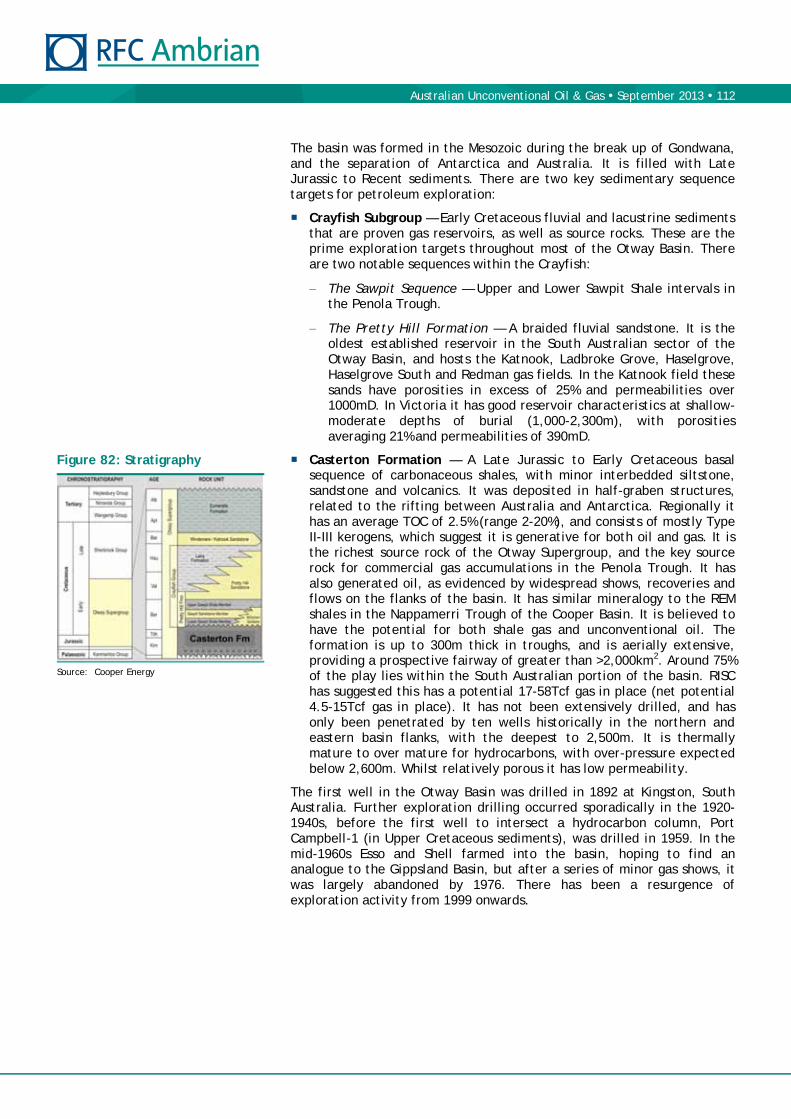
Australian Unconventional Oil & Gas September 2013 112
The basin was formed in the Mesozoic during the break up of Gondwana, and the separation of Antarctica and Australia. It is filled with Late Jurassic to Recent sediments. There are two key sedimentary sequence targets for petroleum exploration:
Crayfish Subgroup — Early Cretaceous fluvial and lacustrine sediments that are proven gas reservoirs, as well as source rocks. These are the prime exploration targets throughout most of the Otway Basin. There are two notable sequences within the Crayfish:
The Sawpit Sequence — Upper and Lower Sawpit Shale intervals in the Penola Trough.
The Pretty Hill Formation — A braided fluvial sandstone. It is the oldest established reservoir in the South Australian sector of the Otway Basin, and hosts the Katnook, Ladbroke Grove, Haselgrove, Haselgrove South and Redman gas fields. In the Katnook field these sands have porosities in excess of 25% and permeabilities over 1000mD. In Victoria it has good reservoir characteristics at shallow-moderate depths of burial (1,000-2,300m), with porosities averaging 21% and permeabilities of 390mD.
Casterton Formation — A Late Jurassic to Early Cretaceous basal sequence of carbonaceous shales, with minor interbedded siltstone, sandstone and volcanics. It was deposited in half-graben structures, related to the rifting between Australia and Antarctica. Regionally it has an average TOC of 2.5% (range 2-20%), and consists of mostly Type II-III kerogens, which suggest it is generative for both oil and gas. It is the richest source rock of the Otway Supergroup, and the key source rock for commercial gas accumulations in the Penola Trough. It has also generated oil, as evidenced by widespread shows, recoveries and flows on the flanks of the basin. It has similar mineralogy to the REM shales in the Nappamerri Trough of the Cooper Basin. It is believed to have the potential for both shale gas and unconventional oil. The formation is up to 300m thick in troughs, and is aerially extensive, providing a prospective fairway of greater than >2,000km2. Around 75% of the play lies within the South Australian portion of the basin. RISC has suggested this has a potential 17-58Tcf gas in place (net potential 4.5-15Tcf gas in place). It has not been extensively drilled, and has only been penetrated by ten wells historically in the northern and eastern basin flanks, with the deepest to 2,500m. It is thermally mature to over mature for hydrocarbons, with over-pressure expected below 2,600m. Whilst relatively porous it has low permeability.
The first well in the Otway Basin was drilled in 1892 at Kingston, South Australia. Further exploration drilling occurred sporadically in the 1920-1940s, before the first well to intersect a hydrocarbon column, Port Campbell-1 (in Upper Cretaceous sediments), was drilled in 1959. In the mid-1960s Esso and Shell farmed into the basin, hoping to find an analogue to the Gippsland Basin, but after a series of minor gas shows, it was largely abandoned by 1976. There has been a resurgence of exploration activity from 1999 onwards.
Figure 82: Stratigraphy
Source: Cooper Energy
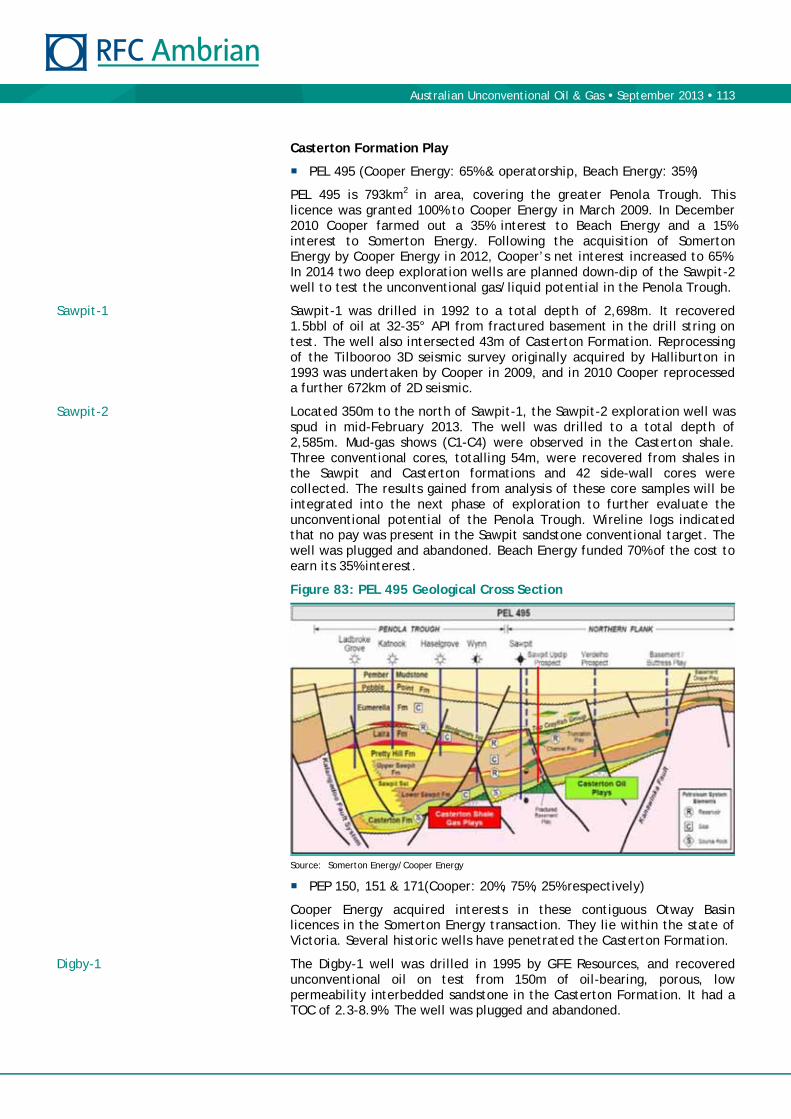
Australian Unconventional Oil & Gas September 2013 113
Casterton Formation Play
PEL 495 (Cooper Energy: 65% & operatorship, Beach Energy: 35%)
PEL 495 is 793km2 in area, covering the greater Penola Trough. This licence was granted 100% to Cooper Energy in March 2009. In December 2010 Cooper farmed out a 35% interest to Beach Energy and a 15% interest to Somerton Energy. Following the acquisition of Somerton Energy by Cooper Energy in 2012, Cooper’s net interest increased to 65%. In 2014 two deep exploration wells are planned down-dip of the Sawpit-2 well to test the unconventional gas/liquid potential in the Penola Trough.
Sawpit-1 was drilled in 1992 to a total depth of 2,698m. It recovered 1.5bbl of oil at 32-35° API from fractured basement in the drill string on test. The well also intersected 43m of Casterton Formation. Reprocessing of the Tilbooroo 3D seismic survey originally acquired by Halliburton in 1993 was undertaken by Cooper in 2009, and in 2010 Cooper reprocessed a further 672km of 2D seismic.
Located 350m to the north of Sawpit-1, the Sawpit-2 exploration well was spud in mid-February 2013. The well was drilled to a total depth of 2,585m. Mud-gas shows (C1-C4) were observed in the Casterton shale. Three conventional cores, totalling 54m, were recovered from shales in the Sawpit and Casterton formations and 42 side-wall cores were collected. The results gained from analysis of these core samples will be integrated into the next phase of exploration to further evaluate the unconventional potential of the Penola Trough. Wireline logs indicated that no pay was present in the Sawpit sandstone conventional target. The well was plugged and abandoned. Beach Energy funded 70% of the cost to earn its 35% interest.
Figure 83: PEL 495 Geological Cross Section
Source: Somerton Energy/Cooper Energy
PEP 150, 151 & 171(Cooper: 20%, 75%, 25% respectively)
Cooper Energy acquired interests in these contiguous Otway Basin licences in the Somerton Energy transaction. They lie within the state of Victoria. Several historic wells have penetrated the Casterton Formation.
The Digby-1 well was drilled in 1995 by GFE Resources, and recovered unconventional oil on test from 150m of oil-bearing, porous, low permeability interbedded sandstone in the Casterton Formation. It had a TOC of 2.3-8.9%. The well was plugged and abandoned.
Sawpit-1
Sawpit-2
Digby-1

Australian Unconventional Oil & Gas September 2013 114
The Gordon-1 well (1997) penetrated 243m of the Casterton, which was found to be a very good shale rock, with TOC of up to 7.7%.
Gippsland Basin — Australia
As part of the acquisition of Somerton Energy, Cooper Energy acquired the right to farm in to a 16.7% interest in PRL 2 (gross area 747km2), onshore Gippsland. In 2010 Somerton acquired the right to a 5% interest in PRL 2 from Lakes Oil by funding 33.3% of the cost to fracture stimulate and test the Wombat-2 and Boundary Creek-2 wells. Somerton also acquired the option to earn a further 11.7% interest (to bring its total interest to 16.7%) by contributing a further A$13.3m (bringing total expenditure to A$16.7 million) to further appraisal and development of the Wombat field.
The Gippsland Basin is a Late Jurassic to Cenozoic, east-west trending basin on the south-east margin of Victoria’s continental shelf. Covering about 46,000km2, about two-thirds of the basin lies offshore in shallow water of less than 200m. Hydrocarbons are predominantly sourced from the Upper Cretaceous to Early Tertiary Latrobe Group, which is Type II-III kerogen, organic-rich, coastal plain shales and coal.
Table 42: Gippsland Basin Licence
Licence COE interest Partners State Area Awarded
PRL 2 16.7% Lakes Oil Victoria 747km2 Feb 2007
Source: Cooper Energy
PRL 2 is considered prospective for unconventional gas. Gaffney, Cline and Associates have estimated 1.68Tcf of contingent resource within the Strzelecki Group in PRL 2. However, in August 2012 the Victorian Government issued a moratorium on fracture stimulation, which has postponed the proposed fracture stimulation of the Wombat-4 and Boundary Creek-2 wells.
Cooper Basin — Australia
Cooper Energy’s Cooper-Eromanga Basin licences are likely prospective for unconventional hydrocarbons as well as conventional hydrocarbons. Within the licences, we believe there are a series of tight Permian sands (the Epsilon and Patchawarra formations) and deeper Toolachee coals that might yield commercial unconventional gas.
Gordon-1

Australian Unconventional Oil & Gas September 2013 115
Valuation
We estimate that the current fair value of Cooper’s share price is A$0.45/share, which is the same as its price on 28 August 2013. We outline our key assumptions behind this NAV-based fair value estimate below.
Based on our financial forecasts we estimate Cooper is trading on FY14 and FY15 EV/EBITDA multiples of 2.7x and 4.0x respectively. We also estimate that Cooper is trading on FY14 and FY15 P/E multiples of 9.1x and 11.1x. Cooper is trading on Price/book multiple of 1.1x, while we forecast FY14 Return on Equity will be 10.6%.
Key NAV Assumptions
For Our Current Fair Value Estimate
We have used Cooper’s reported 2P reserves and 2C contingent resources as at 30 June 2013.
We have used our standard US$/boe NAV estimates for Cooper Basin oil, wet gas and dry gas reserves and resources.
We have, arbitrarily, used US$20/bbl for Indonesian 2P oil reserves, and US$10/bbl for Tunisian 2C contingent resources.
We have put the commercial chance of success (Pd) of the Hammamet West and other Tunisian prospects at 35%.
We have assumed a FY14 conventional petroleum exploration work programme costing A$27m, in line with management guidance.
We have valued Cooper’s interest in PEL 495 using a US$38/acre multiple. When it was announced that Beach would farm in to the licence in 2010 this was the effective multiple.
Cooper had cash and available for sale financial assets of A$68.1m at 30 June 2013, and no debt.
We estimated the value of Cooper’s G&A expense by annualising its 1H13 G&A expense (A$6.0m) and dividing the result by our real 7.5% discount rate (roughly equivalent to a nominal 10% discount rate).
Other assumptions can be seen in Table 43.

Australian Unconventional Oil & Gas September 2013 116
Table 43: Cooper Energy Estimated Net Asset Value per Share
Net Oil and Gas NPV
Unrisked NPV Pg Pd
Risked NPV
Risked NPV
Reserves/Resources (MMboe) (US$/boe) (US$m) (%) (%) (US$m) (A¢/share)
Cooper Basin Oil Business
Oil 2P reserves 1.8 34.86 63 100% 100% 63 20.8
Oil 2C resources - 23.27 - 100% 90% - 0.0
Total Cooper Basin Oil Business 1.8 63 63 20.8
International business
Tunisia – Hammamet West 30.3 10.00 303 100% 35% 106 34.9
Tunisia – Other 2C resources 5.7 10.00 57 100% 35% 20 6.6
Indonesia – 2P reserves 0.4 20.00 7 100% 90% 6 2.1
Total International Business 36.4 132 43.6
Total Above 38.2 63 196 64.3
FY14 Work Programme
Cooper Basin Oil exploration 4.0 23.27 93 50% 90% 42 13.8
Work Programme 4.0 93 42 13.8
Total Above 42.2 156 237 78.1
Unconventional Business
PEL 495 5 1.6
Total Above 242 79.7
Other Value adjustments
Net cash/(debt) Jun 2013 61 20.2
Bass Straight Oil investment 1 0.3
FY14 Exploration expenditure (24) (8.0)
Capitalised G&A cost (144) (47.3)
Options - 0.0
Cooper Total fully diluted NAV 137 44.9
Current issued shares 329.1
Options 8.6
Current fully diluted shares 337.7
Source: Company data, RFC Ambrian estimates

Australian Unconventional Oil & Gas September 2013 117
Forecast Financial Multiples
Our revenue, EBITDA and net profit forecasts are higher than current Bloomberg consensus estimates. We believe this is largely because the recent fall in the US$/A$ is not yet incorporated in consensus estimates. Based on our forecast prices and production we estimate that Cooper will generate FY14 and FY15 revenues of A$64.5m and A$58.0m respectively (consensus of A$61.8 and A$52.6m respectively). We forecast A$30.3m EBITDA in FY14 and A$25.5m EBITDA in FY15 (consensus: A$32.0m and A$23.3m). We forecast FY14 net profit of A$16.3m vs. the Bloomberg consensus forecast of A$14.3m.
We believe the market looks at 1-2 year forward cashflow and earnings multiples, and that based on these Cooper appears fairly valued relative to its peers. We estimate that Cooper is currently trading on FY14 and FY15 EV/EBITDAX multiples of 2.7x and 4.0x respectively, while we estimate that Cooper is currently trading on FY14 and FY15 P/E multiples of 9.1x and 11.1x. These levels are in line with the relevant multiples of Beach and Drillsearch
Cooper is trading on a Price/book equity multiple of 1.1x, which seems fair given that we forecast an FY14 ROE of 10.6%.
Table 44: Cooper Valuation Multiples
28/8/2013 2013 2014F 2015F
Market Cap and EV
Share Price (A$) 0.45
Shares (m) 329
Market Cap (A$m) 148 148 148 148
Avg net debt/ (cash) (A$m) (71) (56) (31)
Enterprise value (A$m) 77 92 117
Cashflow and Profit
EBITDAX (A$m) 25.9 34.1 29.3
Net Profit (A$m) 1.7 16.3 13.3
Valuation Multiples
EV/EBITDAX (x) 3.0 2.7 4.0
P/E (x) 86.4 9.1 11.1
P/b (x) 1.1 1.0 0.9
ROE 1.2% 10.6% 8.0%
Source: Company data, RFC Ambrian estimates

Australian Unconventional Oil & Gas September 2013 118
Table 45: Cooper Key Model Drivers
2010 2011 2012 2013 2014F 2015F
Production
Oil production (Mbbl) 465 399 517 489 540 500
Gas production (PJ) 0 0 0 0 0 0
Gas liquid production (Mboe) 0 0 0 0 0 0
Total Production (Mboe) 465 399 517 489 540 500
Growth -14% 30% -5% 10% -7%
Prices
Brent Oil Price (US$/bbl) 75.24 96.73 112.08 108.78 104.62 98.48
Sydney Gas Price (A$/GJ) 3.19 3.77 5.20 6.00 7.00
Costs
Operating costs (A$/boe) 17.83 20.39 25.35 25.99 25.00 25.00
DD&A (A$/boe) 10.32 10.59 18.41 12.80 13.00 13.00
G&A (A$m) 6.1 9.8 13.5 12.0 12.0 12.0
Capex (A$m) 24.3 29.6 36.4 21.7 50.0 50.0
Effective P&L tax rate 83% -89% -25% 91% 30% 30%
Source: Company data, RFC Ambrian estimates
Table 46: Cooper Income Statement
(A$m) 2010 2011 2012 2013 2014F 2015F
Sales 40.0 39.1 59.6 53.4 64.5 58.0
Cost of sales (17.2) (16.2) (27.7) (23.5) (26.7) (24.5)
Gross profit 22.9 22.9 31.9 29.9 37.8 33.5
Net other revenue 4.3 5.1 4.7 2.3 1.7 1.8
Net other expenses (19.9) (33.5) (15.6) (13.9) (16.2) (16.2)
EBIT 7.2 (5.5) 21.0 18.3 23.3 19.0
Interest 0.0 0.0 0.0 0.0 0.0 0.0
EBT 7.2 (5.5) 21.0 18.3 23.3 19.0
Tax (6.0) (4.9) 5.3 (16.6) (7.0) (5.7)
Minorities 0.0 0.0 0.0 0.0 0.0 0.0
Net Profit 1.2 (10.3) 26.3 1.7 16.3 13.3
Source: Company data, RFC Ambrian estimates
Table 47: RFC Ambrian Forecasts vs. Consensus Estimates
2013 Actual 2014F 2015F
Revenue
RFC Ambrian forecast (A$m) 53.4 64.5 58.0
Bloomberg consensus (A$m) 61.8 52.6
RFC Ambrian/Consensus (%) 104% 110%
EBITDA
RFC Ambrian forecast (A$m) 24.4 30.3 25.5
Bloomberg consensus (A$m) 32.0 23.3
RFC Ambrian/Consensus (%) 95% 110%
Net Profit
RFC Ambrian forecast (A$m) 1.7 16.3 13.3
Bloomberg consensus (A$m) 14.3 8.2
RFC Ambrian/Consensus (%) 114% 161%
Source: Bloomberg, RFC Ambrian

Australian Unconventional Oil & Gas September 2013 119
Table 48: Cooper Balance Sheet
(A$m) 2010 2011 2012 2013 2014F 2015F
Cash 92.5 71.0 59.0 43.2 44.1 18.4
Receivables 9.0 16.1 12.0 19.5 14.1 12.7
Inventory 0.0 0.3 0.2 1.0 1.8 1.6
Other 0.1 0.1 0.2 23.8 23.8 23.8
Total current assets 101.6 87.4 71.4 87.4 83.8 56.6
PP&E 0.0 0.0 0.0 0.0
Developed assets 15.2 17.8 19.2 18.9
Exploration assets 19.6 21.3 42.5 30.8
PP&E, Expl & Dev 34.8 39.1 61.7 49.7 88.9 128.6
Other 0.0 1.4 27.9 24.9 4.8 4.8
Total non-cur assets 34.8 40.5 89.6 74.7 93.7 133.4
Total assets 136.4 127.9 161.0 162.1 177.5 189.9
Trade payables 6.0 7.8 12.3 11.8 11.0 10.1
Short-term debt 0.0 0.0 0.0 0.0 0.0 0.0
Deferred tax 0.2 0.0 3.7 0.0 0.0 0.0
Other 0.0 0.0 0.0 0.6 0.6 0.6
Total cur liabilities 6.2 7.9 16.0 12.4 11.5 10.7
Long-term debt 0.0 0.0 0.0 0.0 0.0 0.0
Deferred tax 4.4 3.8 4.2 9.1 9.1 9.1
Other 0.7 1.4 3.9 3.3 3.3 3.3
Minorities 0.0 0.0 0.0 0.0 0.0 0.0
Equity 125.1 114.9 136.9 137.2 153.5 166.8
Total non-cur liabs 130.2 120.1 145.0 149.6 166.0 179.3
Total liabilities 136.4 127.9 161.0 162.1 177.5 189.9
Source: Company data, RFC Ambrian estimates
Table 49: Cooper Cashflow Statement
(A$m) 2010 2011 2012 2013 2014F 2015F
Net profit 1.2 (10.3) 26.3 1.7 16.3 13.3
Depreciation 5.0 4.3 9.7 7.6 10.8 10.3
Working capital 3.8 (5.5) 8.7 (8.7) 3.6 0.7
Other 11.2 22.4 (5.6) 1.2 0.0 0.0
Operating cashflow 21.2 10.9 39.1 12.5 30.8 24.3
Capital expenditure (22.3) (28.0) (29.7) (21.7) (50.0) (50.0)
Other 0.0 (1.6) (21.4) (6.8) 20.2 0.0
Investing cashflows (22.3) (29.6) (51.0) (28.5) (29.8) (50.0)
Debt 0.0 0.0 0.0 0.0 0.0 0.0
Equity 0.0 0.0 0.0 (0.1) 0.0 0.0
Dividends 0.0 0.0 0.0 0.0 0.0 0.0
Other 0.2 (2.8) 0.0 0.3 0.0 0.0
Financing cashflow 0.2 (2.8) 0.0 0.2 0.0 0.0
Cash at beginning 93.4 92.5 71.0 59.0 43.2 44.1
Net change (1.0) (21.5) (12.0) (15.9) 1.0 (25.7)
Cash at end 92.5 71.0 59.0 43.2 44.1 18.4
Source: Company data, RFC Ambrian estimates

Australian Unconventional Oil & Gas September 2013 120
Strike Energy provides exposure to two unproven unconventional plays: a deep coal seam gas play in the Cooper Basin, Australia, and a north-easterly extension of the proven Eagle Ford Shale play in the US.
We initiate on Strike Energy with a SPECULATIVE BUY rating and a A¢12.3/share current fair value estimate. Strike has 1.5m gross unconventional acres (0.9m net acres) in the Southern Cooper Basin (PELs 94, 95 & 96), and 41,080 gross Eagle Ford acres (10,843 net) in the Lavaca and Fayette counties, Texas. Should either play prove successful, a substantial re-rating of the stock is likely. We believe that Strike’s main strengths are currently being overlooked by the market. These include:
Access to up to A$52.5m in funds for the evaluation and development of its PEL 96 deep coal seam gas resources. Strike has a binding term sheet with Orica; as Strike achieves certain appraisal and development milestones, Orica can elect to make up to A$52.5m in gas pre-payments for the supply of up to 150PJ of gas over 20 years.
A huge potential deep coal seam resource base (best estimate prospective gas resources of 10.8Tcf) should a well design be found that can overcome the expected low permeability of the coal and allow its economic production.
Several recent successful (24-hour initial production rates >1,000boepd) Eagle Ford Shale wells by other operators less than 20 miles to the south–west of Strike’s Eagle Ford acreage.
After a recent equity capital raising, Strike has a fully funded drilling and completion programme for its share of two wells within its current Eagle Ford Shale acreage.
Strike Energy’s share price roughly halved from October 2012 to January 2013 as the market was unimpressed by the sub-commercial flow rate of the Bigham-1H well. We believe this sell off was overdone. Management believes the disappointing flow test result was due to the well being completed in the wrong zone (Upper Eagle Ford shale). A second well (Wolters-1H) has been drilled in the Lower Eagle Ford shale; this well will be completed and flow tested in the next couple of months.
We estimate that the current fair value of Strike’s share price is A¢12.3/share, which is roughly 25% higher than its A¢9.8 price on 28 August 2013.
28 August 2013 Strike Energy
Speculative Buy Hitting it Out of the Park?
Stuart Amor +44 (0)20 3440 6826 [email protected]
Emily Ashford +44 (0)20 3440 6821 [email protected]
Price (A¢) 9.8
Fair Value (A¢) 12.3
Ticker STX-AU
Market cap (A$m) 69.0
Estimated cash (A$m) 8.0
2P reserves + 2C resources (MMboe) 1
Shares in issue
Basic (m) 704.5
Fully diluted (m) 725.7
52-week
High (A¢) 25.0
Low (A¢) 6.6
3m-avg daily vol (000) 857
3m-avg daily val (A$000) 86
Top shareholders (%)
Mark Carnegie 9.2
Apostle Asset Mgmt 8.0
Timothy Goyder 4.4
Timothy Clifton 2.8
Nestor Investment Mgmt 1.6
Total 26.0
Management
Timothy Clifton CHR
David Wrench MD
Ben Thomas Pres – US business
Chris Thompson GM – Cooper
Basin
Share Price Performance (A$)
Source: Bloomberg, Company reports
0
12
3
4
56
7
8
910
$0.00
$0.05
$0.10
$0.15
$0.20
$0.25
$0.30
Aug‐12 Nov‐12 Feb‐13 May‐13 Aug‐13
Millions

Australian Unconventional Oil & Gas September 2013 121
Investment Case
We are initiating on Strike Energy with a SPECULATIVE BUY rating and estimate its current fair value is A¢12.3/share. Strike Energy provides exposure to two unproven unconventional plays: a deep coal seam gas play in the Cooper Basin, Australia, and a north-easterly extension of the proven Eagle Ford Shale play in the US. Should either of these plays prove commercial, we believe the stock should re-rate substantially upwards. Strike has recently obtained access to A$52.5m of funds for the evaluation and development of its South Australian deep coal seam gas play through a deal with Orica. It is also fully funded for its share of two Eagle Ford exploration wells. Strike trades on an EV/acre multiple of just US$14/acre. The weighted average EV/acre multiple that was paid by the industry in 20 Australian unconventional petroleum farm-ins over the last two years was US$23/acre.
In July 2013 Strike signed a binding term sheet with Orica for the supply of up to 150PJ of gas over 20 years. To secure its gas off-take Orica can elect to make up to A$52.5m in gas pre-payments, as Strike achieves certain appraisal and development milestones within PEL 96.
Strike has a huge potential deep coal seam resource base (best estimate prospective gas resources of 10.8Tcf) should a well design be found that can overcome the low permeability of the coal and allow its economic production. Like other Cooper Basin unconventional gas projects, Strike’s deep coal seam project could benefit from nearby infrastructure (it has a gas pipeline passing through PEL 96). The coal seams that it is targeting in the Weena Trough lie 1.5-2.0km below the surface and are much shallower than the 3.0-4.0km deep REM Shale packages Beach Energy and Drillsearch Energy are targeting in Nappamerri Trough. All else being equal, the deeper the target, the more expensive the well. Also, carbon dioxide in nearby gas fields ranges from 5-10% (much lower than in the centre of the Nappamerri Trough due to the shallower burial depth of the coal seams).
Strike Energy’s share price roughly halved from October 2012 to January 2013 as the market was unimpressed by the sub-commercial flow rate of the Bigham-1H well. Management believes that the low flow rate can be attributed to the well being completed in the Upper Eagle Ford shale, which it believes is less prolific than the Lower Eagle Ford shale. It has drilled a second well (Wolters-1H) in the Lower Eagle Ford Shale and expects this to have a significantly better initial production rate. The Wolters-1H well was drilled to total depth of 5,648m on 1 August 2013. Approximately 5,500 feet of lateral was successfully drilled in the Lower Eagle Ford shale. The well has been completed for production, with a multi-stage fracture stimulation programme planned to commence in early September, with flow back and production testing to follow. Should this well have a 24-hour initial production rate of >1,000boepd, we would substantially revise upward our valuation of Strike’s Eagle Ford acreage from our current US$3,000/acre estimate towards the US$20,000/acre recently paid by Penn Virginia to Magnum Hunter for proven commercial Eagle Ford acreage, just to the south-west of Strike’s acreage.
We estimate that the current fair value of Strike’s share price is A¢12.3/share, which is roughly 25% higher than its A¢9.8 price on 28 August 2013. The high exposure Strike has to its two unconventional petroleum plays is clear from the breakdown of our fair value estimate in Figure 84 overleaf below. Should either play prove successful a substantial re-rating of the stock is likely.
We initiate with a SPECULATIVE BUY rating
Orica to provide A$52.5m in gas pre-payments
Huge potential deep coal seam resource base if a well design can be found to allow its economic production
Management expects its second Eagle Ford well (Wolters-1H) to have a significantly better initial production rate than its first (Bigham-1)
Fair value

Australian Unconventional Oil & Gas September 2013 122
Figure 84: Strike Energy Fair Value Breakdown
Source: RFC Ambrian estimates
Risks
Strike Energy is subject to the usual risks that a junior upstream petroleum exploration and production company faces. These include: geological/technical, political/regulatory, commercial, operational, capital access, weather related and environmental.
The economics of unconventional Cooper Basin deep coal seam gas and liquid rich gas production within Strike’s Eagle Ford acreage production is yet to be proved to be commercial. Should petroleum prices and flow rates from unconventional wells not be sufficient to give an economic return on the investment, these unconventional resources will not be developed.
Strike’s recent presentations show that the Permian coal seams it is targeting are buried between 1,500m and 2,500m below the surface. To make this play work we think Strike will need to find sufficiently thick coal seams at the shallow end of this range with high enough permeability to allow for commercial production rates and EURs. The floor for coal seam gas production is generally considered to be around 2,000m due to cleat closure and permeability reduction at depths lower than this.
However, both the Moomba-77 and Paning-2 wells have flowed Cooper Basin deep coal seam gas. In 2007, the Moomba-77 well flowed 100,000cfpd of gas from a fracture stimulated 10m thick Patchawarra coal seam at a depth of 2,900m. This year Senex stimulated and tested a 28m thick Toolachee coal in its Paning-2 well. A short-term production test delivered peak flows of up to 90,000cfpd. We doubt whether these are commercial flow rates given the likely well cost, but it is early days and well design improvements may yet make Cooper Basin deep coal seam gas commercial.
The Cooper Basin is prone to flooding. In 2010 the biggest flood in 30 years prevented exploration and development activity in much of the basin for several months.
Australian Unconventional Oil & Gas September 2013 123
Management
Mr Clifton has more than 40 years’ experience as a geologist and company director. He was appointed to the Board in August 2008, and appointed Chairman in August 2010. Prior to this he was Managing Director, then Chairman, of Uranium Equities, Corporate Adviser and Project Executive of Abra Mining, and Managing Director of Perilya.
Mr Wrench was appointed to the Board in October 1998, and assumed the role of Managing Director in October 2011. He has worked in Australia and North America with Macquarie Bank, Credit Suisse and Chase Manhattan, gaining commercial experience in precious and base metals and energy markets. He was co-founder and Director of coal seam gas company CH4 Gas, and has been a director of a number of private resource companies.
Tim Clifton — Non-executive Chairman
David Wrench — Managing Director

Australian Unconventional Oil & Gas September 2013 124
Operations
Strike has assembled a portfolio of permits covering both conventional and unconventional prospects in Australia and the US. We consider that Strike’s main value lies in its unconventional Cooper Basin and Eagle Ford assets. It has 1.55m gross unconventional acres (0.91m net acres) in the Southern Cooper Basin (PEL 94, 95 & 96). In the Eagle Ford Shale it has 41,080 gross acres (10,843 net), which management believes are within the gas condensate window.
Unconventional
Cooper-Eromanga Basin — Australia
Figure 85: Strike Unconventional Licences — PEL 94, 95 & 96
Source: Strike Energy
Strike is targeting deep coal seam gas potential in permits PEL 94, 95 and 96 on the south-western flank of the Cooper Basin. Management considers that approximately 75% of the estimated 14Tcf of mean prospective unconventional gas resource in this area is associated with coal. The flank of the Cooper Basin is less thermally mature than the centre of the basin; Strike management thinks that any gas is likely to contain significantly less CO2 than gas from the centre of the basin. Three unconventional evaluation wells — Forge-1, Marsden-1 and Davenport-1 — have been drilled. The results of the Marsden-1 and Davenport-1 logs and cores led management to estimate the prospective resources of the three licences to be as given below.
Strike is targeting deep coal seam gas potential
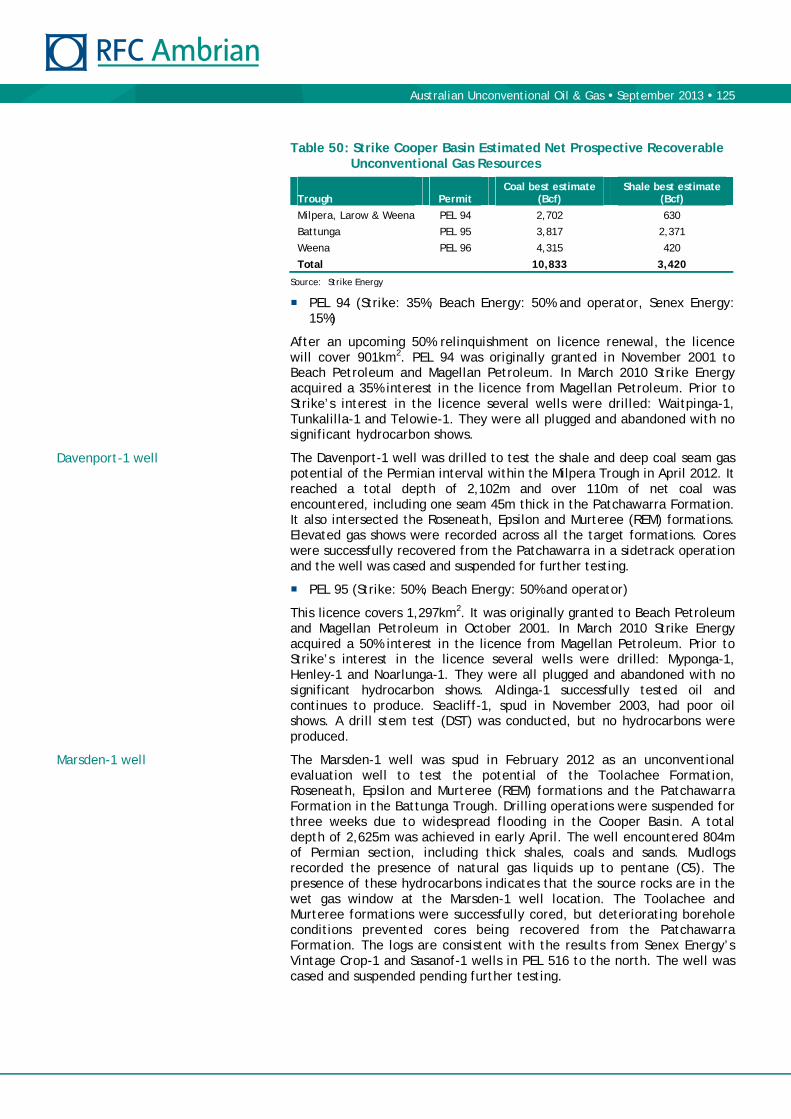
Australian Unconventional Oil & Gas September 2013 125
Table 50: Strike Cooper Basin Estimated Net Prospective Recoverable Unconventional Gas Resources
Trough
Permit
Coal best estimate (Bcf)
Shale best estimate (Bcf)
Milpera, Larow & Weena PEL 94 2,702 630
Battunga PEL 95 3,817 2,371
Weena PEL 96 4,315 420
Total 10,833 3,420
Source: Strike Energy
PEL 94 (Strike: 35%, Beach Energy: 50% and operator, Senex Energy: 15%)
After an upcoming 50% relinquishment on licence renewal, the licence will cover 901km2. PEL 94 was originally granted in November 2001 to Beach Petroleum and Magellan Petroleum. In March 2010 Strike Energy acquired a 35% interest in the licence from Magellan Petroleum. Prior to Strike’s interest in the licence several wells were drilled: Waitpinga-1, Tunkalilla-1 and Telowie-1. They were all plugged and abandoned with no significant hydrocarbon shows.
The Davenport-1 well was drilled to test the shale and deep coal seam gas potential of the Permian interval within the Milpera Trough in April 2012. It reached a total depth of 2,102m and over 110m of net coal was encountered, including one seam 45m thick in the Patchawarra Formation. It also intersected the Roseneath, Epsilon and Murteree (REM) formations. Elevated gas shows were recorded across all the target formations. Cores were successfully recovered from the Patchawarra in a sidetrack operation and the well was cased and suspended for further testing.
PEL 95 (Strike: 50%, Beach Energy: 50% and operator)
This licence covers 1,297km2. It was originally granted to Beach Petroleum and Magellan Petroleum in October 2001. In March 2010 Strike Energy acquired a 50% interest in the licence from Magellan Petroleum. Prior to Strike’s interest in the licence several wells were drilled: Myponga-1, Henley-1 and Noarlunga-1. They were all plugged and abandoned with no significant hydrocarbon shows. Aldinga-1 successfully tested oil and continues to produce. Seacliff-1, spud in November 2003, had poor oil shows. A drill stem test (DST) was conducted, but no hydrocarbons were produced.
The Marsden-1 well was spud in February 2012 as an unconventional evaluation well to test the potential of the Toolachee Formation, Roseneath, Epsilon and Murteree (REM) formations and the Patchawarra Formation in the Battunga Trough. Drilling operations were suspended for three weeks due to widespread flooding in the Cooper Basin. A total depth of 2,625m was achieved in early April. The well encountered 804m of Permian section, including thick shales, coals and sands. Mudlogs recorded the presence of natural gas liquids up to pentane (C5). The presence of these hydrocarbons indicates that the source rocks are in the wet gas window at the Marsden-1 well location. The Toolachee and Murteree formations were successfully cored, but deteriorating borehole conditions prevented cores being recovered from the Patchawarra Formation. The logs are consistent with the results from Senex Energy’s Vintage Crop-1 and Sasanof-1 wells in PEL 516 to the north. The well was cased and suspended pending further testing.
Davenport-1 well
Marsden-1 well
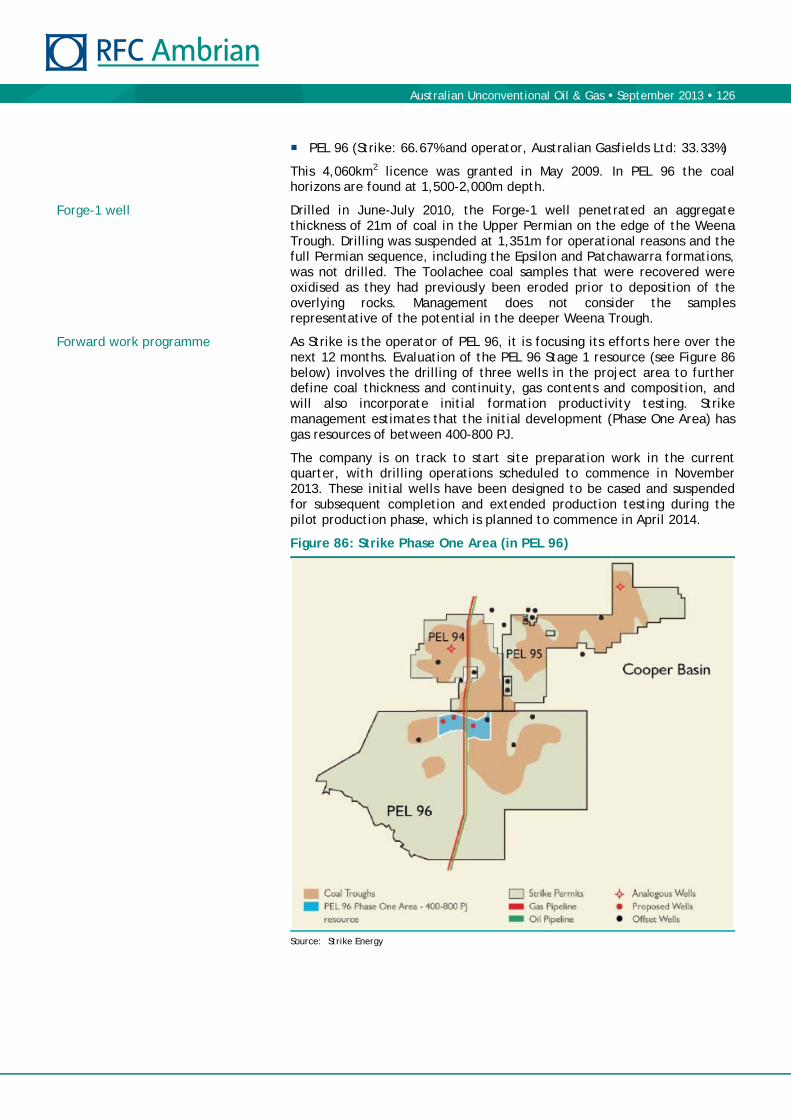
Australian Unconventional Oil & Gas September 2013 126
PEL 96 (Strike: 66.67% and operator, Australian Gasfields Ltd: 33.33%)
This 4,060km2 licence was granted in May 2009. In PEL 96 the coal horizons are found at 1,500-2,000m depth.
Drilled in June-July 2010, the Forge-1 well penetrated an aggregate thickness of 21m of coal in the Upper Permian on the edge of the Weena Trough. Drilling was suspended at 1,351m for operational reasons and the full Permian sequence, including the Epsilon and Patchawarra formations, was not drilled. The Toolachee coal samples that were recovered were oxidised as they had previously been eroded prior to deposition of the overlying rocks. Management does not consider the samples representative of the potential in the deeper Weena Trough.
As Strike is the operator of PEL 96, it is focusing its efforts here over the next 12 months. Evaluation of the PEL 96 Stage 1 resource (see Figure 86 below) involves the drilling of three wells in the project area to further define coal thickness and continuity, gas contents and composition, and will also incorporate initial formation productivity testing. Strike management estimates that the initial development (Phase One Area) has gas resources of between 400-800 PJ.
The company is on track to start site preparation work in the current quarter, with drilling operations scheduled to commence in November 2013. These initial wells have been designed to be cased and suspended for subsequent completion and extended production testing during the pilot production phase, which is planned to commence in April 2014.
Figure 86: Strike Phase One Area (in PEL 96)
Source: Strike Energy
Forge-1 well
Forward work programme

Australian Unconventional Oil & Gas September 2013 127
Eagle Ford Shale — Texas
Figure 87: Strike Eagle Ford Acreage and the Main Play Fairway
Source: EIA, RFC Ambrian estimates
Strike has a 27.5% interest in the Eagle Landing Joint Venture, which had leases of 41,080 gross acres (10,843 acres net to Strike) on 5 July 2013. Based on a 120 acre well spacing, Strike has over 340 potential Eagle Ford Shale well sites (94 net). Strike’s acreage is in the Fayette and Lavaca counties and covers both the volatile oil and the wet gas window in a north easterly extension to the current main play fairway.
The Eagle Ford Shale is one of the best known unconventional oil and gas plays in the US. It is characterised by three distinct fairways: oil/volatile oil, gas-condensate and dry gas. The best economics have generally been obtained from wells in the wet gas window because the pressure from the gas component has driven high production rates (and EURs) of the much more valuable liquids. The extension of the main play fairway into Strike’s acreage is not yet proven, but the fairway is gradually being extended north-east by other operators (such as Sabine Oil and Gas, Sanchez Energy and Pen Virginia Corp).
In April 2013 Sabine Oil and Gas acquired 5,000 net acres in what it has named the Shiner area, Lavaca County, for US$15m (US$3,000/acre). It has drilled three wells in north-east Lavaca County (see Figure 88 overleaf): Sustr-1H, Berckenhoff-1H and Olsovsky-1H. The IP30 rates of these wells were 864boepd, 396boepd and 305boepd. The company estimates that the Sustr-1H well has an EUR of around 500Mboe and a 40% IRR (based on US$90/bbl oil and US$4/Mcf gas prices).
According to a June 2013 presentation, Sanchez Energy believes its wells in the Marquis area should have 24-hour IP rates ranging from 1,000-1,200boed, which reflects EURs ranging from 450-550Mboe and IRRs of between 30-52% (using a US$90/bbl oil price).
Eagle Landing Joint Venture
Sabine Oil and Gas
Sanchez Energy

Australian Unconventional Oil & Gas September 2013 128
Figure 88: Recent Drilling Results of Nearby Wells
Source: Company data
In April 2013 Penn Virginia Corp (PVA) acquired 37,900 gross acres (19,200 net) acres from Magnum Hunter Resources for US$400m (US$20,800/ acre). The acreage was highly contiguous, mostly in Gonzales County, and had 46 gross (22 net) producing wells. Estimated net oil and gas production for the acquired assets was approximately 3,200boepd during February 2013. Proved reserves were 12.0MMboe, 96% of which were crude oil and natural gas liquids (NGLs). PVA now has 80,200 gross acres (54,200 net) in the Gonzales and Lavaca counties. The average 24-hour IP rate for the last 15 wells is 1,399boepd (the average IP30 rate for the last 11 wells is 830boepd). The company estimates that wells in Gonzales County have a ≥400Mboe EUR type curve, while wells in Lavaca County have a ≥500Mboe EUR type curve.
Strike’s first production well in the Eagle Ford Shale was spud in mid-June 2012. It reached a total depth of 5,400m in early August, and included a 1,570m (5,150 feet) lateral section in the Upper Eagle Ford Formation. A 20-stage fracture stimulation programme commenced in late September and was completed over a two week period. Flow back operations started in October, and the well was brought on production in late October, with first oil and gas sales in November and December respectively. Following clean out and workover operations in January 2013, the well was producing 200bpd, and 300Mcf of natural gas through a 14/64” choke.
Penn Virginia Corp
Bigham-1H well

Australian Unconventional Oil & Gas September 2013 129
Table 51: Bingham-1H Average Daily Production Rates
Days Oil (bbl/d) Gas (Mcfd) Boe
30 157 395 223
60 180 399 246
90 183 393 249
Source: Strike Energy
The performance of the Bingham-1H well is obviously disappointing. Sanchez Energy’s Sustr-1H well is just 10 miles south-west of Bingham-1H, but had an IP30 of 864boepd. Management attributes the difference in performance to where each well was completed within the Eagle Ford shale. Most offset wells are completed within the lower portion of the shale, whereas Bingham-1H was completed in the upper portion.
A second production well (Wolters-1H) was drilled to a total depth of 5,648m on 1 August 2013. Approximately 1,675m (5,500 feet) of lateral was successfully drilled in the Lower Eagle Ford shale. The well has been completed for production with a multi-stage fracture stimulation programme planned to commence in early September, with flow back and production testing to follow. A third well is planned for later in the year.
Permian Basin — Texas
Although the MB Clearfork Project is mainly targeting a conventional play, Strike believes that the Lower Clearfork Shale has significant potential. The MB Clearfork Project’s Lower Clearfork Shale has been independently estimated to contain original oil in place (OOIP) of 1.35Bbbl (over 330MMbbl net to Strike). The MB Clearfork Unit-16 well described previously also intersected 169m of the Lower Clearfork Formation, with 98m of gross shale.
Conventional
Cooper-Eromanga Basin — Australia
On tenements PEL 71, PEL 515 and PEL 575 Strike plans to focus on proving an extension to the conventional Western Flank-style Jurassic and Cretaceous oil fairway, although unconventional plays will also be investigated. These blocks are a fair distance from the current main proven Western Flank oil fairway blocks (PEL 91, 92, 104 & 111) and they are further from the basin centre. These blocks were awarded in November 2012. Strike also holds a minor interest in ATP 549P C (Cypress Block) in the central Cooper Basin, Queensland, but there has only been limited activity on this block to date (two wells with gas shows).
Forward work programme

Australian Unconventional Oil & Gas September 2013 130
Figure 89: Strike Cooper-Eromanga Basin Permits
Source: Strike Energy
Table 52: Conventional Cooper Basin Permits
Permit State Strike
interest Operator Gross area
(km2) Date
awarded
PEL 71 SA 75% Strike 6,135 Nov 2012
PEL 515 SA 100% Strike 3,038 Nov 2012
PEL 575 SA 100% Strike 3,804 Nov 2012
ATP – 549P C QLD 5% Australian Gasfields 140 N/A
Source: Strike Energy
Strike applied for PEL 71 to follow up the oil shows in Mulapula-1, which was drilled in 1986 and recovered oil on test from the Namur Formation. Management plans to reprocess vintage seismic and acquire additional seismic data to evaluate a number of leads on the block. Initial evaluation of PEL 575 will focus on an unexplored graben structure within the block. Management believes PEL 515 North holds substantial potential given its proximity to the western flank of the Cooper Basin. Strike has identified several prospects/leads and plans a 3D survey in 2014 that it hopes will raise these to drillable status.
Carnarvon Basin — Australia
WA-460-P is located approximately 70km west of North West Cape. It consists of a single block covering approximately 80km2, with water depths of around 1,400m. The block is bisected by a deep canyon where water depths rise to 2,500m. The permit is covered by a sparse 2D seismic grid, shot in 1996, 1998 and 2001. WA-460-P is the adjoining permit to WA-384-P, where Shell just plugged and abandoned the Palta-1 well after it failed to find commercial hydrocarbons.
Strike Energy had high working interests in four other exploration permits, covering a gross 2,300km2 of the Carnarvon Basin (1,200km2 net to Strike). A proposed April 2013 sale of Strike Energy Western Australia for A$3.5m to Torrens Energy fell through in May 2013. Strike Energy Western Australia holds 61.54% of EP 110, 44.50% of EP 325, 61.54% of EP 424 and 19.94% of WA-261-P.
WA-460-P (Strike: 33.3%, WHL Energy: 33.3%, Cottesloe Oil & Gas: 33.3%)
Strike Energy Western Australia
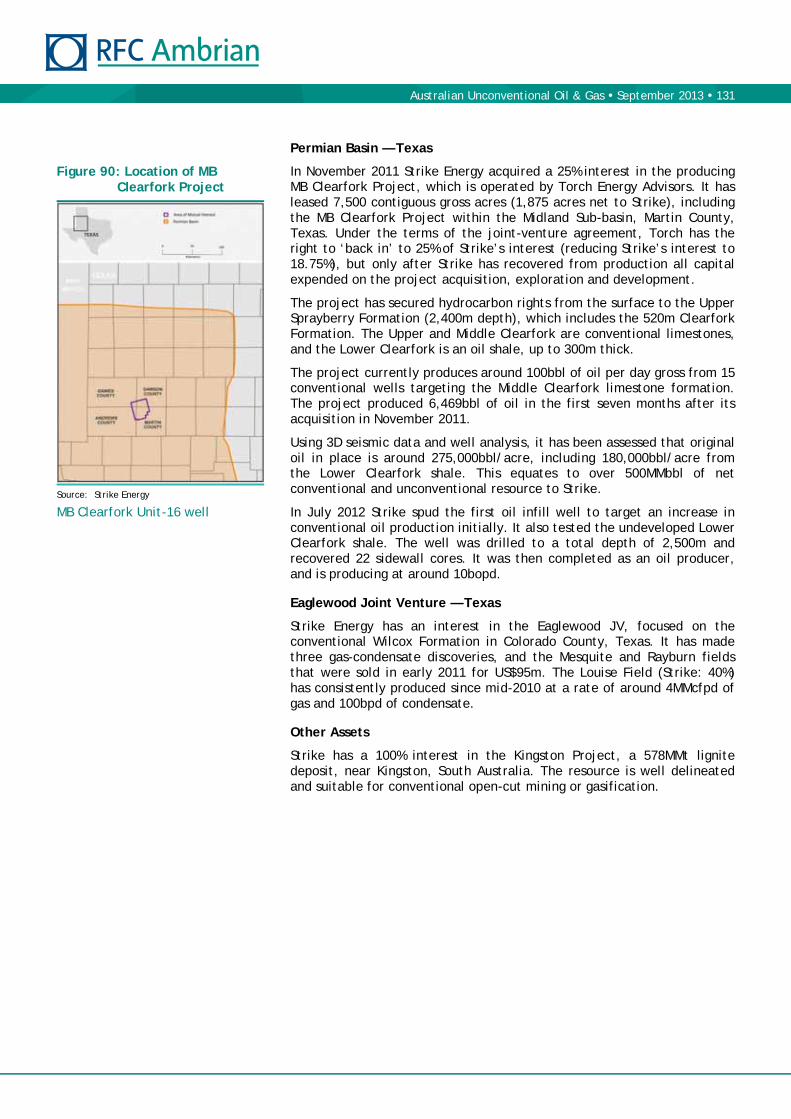
Australian Unconventional Oil & Gas September 2013 131
Permian Basin — Texas
In November 2011 Strike Energy acquired a 25% interest in the producing MB Clearfork Project, which is operated by Torch Energy Advisors. It has leased 7,500 contiguous gross acres (1,875 acres net to Strike), including the MB Clearfork Project within the Midland Sub-basin, Martin County, Texas. Under the terms of the joint-venture agreement, Torch has the right to ‘back in’ to 25% of Strike’s interest (reducing Strike’s interest to 18.75%), but only after Strike has recovered from production all capital expended on the project acquisition, exploration and development.
The project has secured hydrocarbon rights from the surface to the Upper Sprayberry Formation (2,400m depth), which includes the 520m Clearfork Formation. The Upper and Middle Clearfork are conventional limestones, and the Lower Clearfork is an oil shale, up to 300m thick.
The project currently produces around 100bbl of oil per day gross from 15 conventional wells targeting the Middle Clearfork limestone formation. The project produced 6,469bbl of oil in the first seven months after its acquisition in November 2011.
Using 3D seismic data and well analysis, it has been assessed that original oil in place is around 275,000bbl/acre, including 180,000bbl/acre from the Lower Clearfork shale. This equates to over 500MMbbl of net conventional and unconventional resource to Strike.
In July 2012 Strike spud the first oil infill well to target an increase in conventional oil production initially. It also tested the undeveloped Lower Clearfork shale. The well was drilled to a total depth of 2,500m and recovered 22 sidewall cores. It was then completed as an oil producer, and is producing at around 10bopd.
Eaglewood Joint Venture — Texas
Strike Energy has an interest in the Eaglewood JV, focused on the conventional Wilcox Formation in Colorado County, Texas. It has made three gas-condensate discoveries, and the Mesquite and Rayburn fields that were sold in early 2011 for US$95m. The Louise Field (Strike: 40%) has consistently produced since mid-2010 at a rate of around 4MMcfpd of gas and 100bpd of condensate.
Other Assets
Strike has a 100% interest in the Kingston Project, a 578MMt lignite deposit, near Kingston, South Australia. The resource is well delineated and suitable for conventional open-cut mining or gasification.
Figure 90: Location of MB Clearfork Project
Source: Strike Energy
MB Clearfork Unit-16 well

Australian Unconventional Oil & Gas September 2013 132
Valuation
We estimate that the current fair value of Strike’s share price is A¢12.3, which is 25% above its A¢9.8 price on 28 August 2013. We outline our key assumptions behind this NAV-based fair value estimate below.
Key NAV Assumptions
For Our Current Fair Value Estimate
We have valued Strike’s producing US conventional assets by multiplying its June 2012 2P net oil/wet gas reserves (net of royalty interest) by US$15/bbl.
Strike’s exploration and appraisal expenditure over the next 12 months focuses on its unconventional petroleum plays, so we have not assumed value, or cost, for a FY14 conventional petroleum work programme.
We have valued Strike’s interests in PEL 94, 95 and 96 by multiplying its 0.9m net acres by a US$100/acre multiple. This multiple reflects the early stage of the appraisal programme. Should the flow tests on Strike’s three PEL 96 appraisal wells planned for next year show highly commercial flow rates/EURs, we would increase this multiple dramatically.
We have valued Strike’s net Eagle Ford acreage using a US$3,000/acre multiple. We used US$3,000/acre as this was the implied price paid by Sabine Oil and Gas for 5,000 net acres in Lavaca County in April 2013. Should the Wolters-1H well show 24-hour initial flow rates of >1,000boepd we would increase this multiple towards the US$20,000/acre paid by PenVirginia for Magnum Hunter’s Gonzales County Eagle Ford acreage.
Strike had cash of A$1.4m and loans of A$2.6m at 30 June 2013. We have added the A$9.2m proceeds from the August 2013 share placing and increased the number of its shares accordingly.
We estimated the value of Strike’s G&A expense by annualising the addition of its 1H13 G&A expense (A$2.5m), and putting the result over our real 7.5% discount rate (roughly equivalent to a nominal 10% discount rate).
Other assumptions can be seen in Table 53.

Australian Unconventional Oil & Gas September 2013 133
Table 53: Strike Energy Estimated Net Asset Value per Share
Net Oil and Gas NPV
Unrisked NPV Pg Pd
Risked NPV
Risked NPV
Reserves/Resources (MMboe) (US$/boe) (US$m) (%) (%) (US$m) (A¢/share)
Producing US Assets
Oil/ Wet Gas 2P reserves 0.9 15.0 13 100% 100% 13 2.0
Total Oil/Wet Gas Reserves 0.9 13 13 2.0
Unconventional Business
PEL 94, 95 & 96 91 13.9
Eagle Ford 32 4.9
Total Above 135 20.7
Other Value adjustments
Net cash June 2013 + July placement 7 1.1
Capitalised G&A cost (62) (9.6)
Options - 0.0
Strike Total fully diluted NAV 80 12.3
Current issued shares 707.5
Options 18.2
Current fully diluted 725.7
Source: Company data, RFC Ambrian estimates
Acreage and Resource Multiples
Our fair value would place Strike on an EV/acre multiple of US$19/acre. Management has assessed that PEL 94, 95 and 96 have net best estimate (P50) prospective resources of 10.8Tcf of gas (roughly 1.8Bboe) in the deep coal seams across the permits. Our fair value estimate would place Strike on an EV/prospective resource multiple of US$0.04/boe based on this assessment.

Australian Unconventional Oil & Gas September 2013 134
Armour Energy is an unconventional petroleum exploration company whose main assets are its north Australian permits, covering 33m acres. Unrisked mean prospective resources in just three of the tenements were independently assessed in March 2012 to be 41Tcf of gas and 2.2Bbbl of condensate.
We are increasing our Armour Energy fair value estimate slightly to A$0.74/share from A$0.67/share. We maintain our SPECULATIVE BUY recommendation.
We believe Armour’s valuation is compelling. Given Armour’s huge acreage and prospective resource base (and that it has discovered conventional gas in the Glyde Sub-basin and confirmed the presence of tight gas at Cow Lagoon and shale gas within the Lawn Hill Shale), we believe that it is being severely undervalued by the market. It is currently trading on an EV/acre multiple of US$1.83/acre. Twenty industry farm-ins over the last three years had a weighted average EV/acre valuation multiple of ~US$23/acre.
Armour’s multiple strengths seem to be being overlooked by the market. These include:
A dynamic Board and management team, with a strong track record of developing resource companies from scratch into large take-out targets (eg, Arrow Energy & Bow Energy).
Resource upside from appraisal of the 16 permits other than the three currently independently assessed tenements.
Armour has signed a Heads of Agreement (HOA) with APA Group to work together to facilitate the transportation of gas from Armour’s northern Australian gas projects to various markets in Mount Isa, Sydney and Queensland.
Isa Superbasin and McArthur Basin drilling and completion costs should be substantially cheaper than those of the Cooper Basin due to shallower target formations that will require lower fracture pressures.
The multi-stage hydro-fracturing and flow testing of the Egilabria-2 lateral well could provide the catalyst for a substantial stock re-rating. This lateral well is designed to test whether the Lawn Hill Shale can generate ‘commercial’ gas flow rates in ATP 1087P. The well has already been drilled and is awaiting completion, with flow test results expected in the next couple of months.
Our target price is estimated by multiplying Armour’s net acreage (where it has independently assessed prospective resources) by a US$100/acre multiple. Should the Egilabria-2 DW1 lateral well demonstrate clearly commercial flow rates, we would increase this multiple significantly towards that paid by Chevron in its recent Cooper Basin farm-in (US$900/acre). At US$900/acre, Armour’s ATP 1087P Lawn Hill Shale acreage would be worth US$1.5bn (or A$5.66/share).
28 August 2013 Armour Energy
Speculative Buy A Protective Investment
RFC Ambrian acts as Agency Broker to this company
Stuart Amor +44 (0)20 3440 6826 [email protected]
Emily Ashford +44 (0)20 3440 6821 [email protected]
Price (A$) 0.35
Fair Value (A$) 0.74
Ticker AJQ-AU
Market cap (A$m) 105.0
Estimated cash (A$m) 37.1
2P reserves + 2C resources (MMboe) 1.1
Shares in issue
Basic (m) 300.0
Fully diluted (m) 300.8
52-week
High (A$) 0.400
Low (A$) 0.185
3m-avg daily vol (000) 483
3m-avg daily val (A$000) 137
Top shareholders (%)
DGR Global 25.0
JP Morgan 12.7
Oz Management 11.7
Philip McNamara 1.2
Nicholas Mather 0.9
Total 51.5
Management
Nicholas Mather E CHR
Robbert de Weijer CEO
Ray Johnson GM E&P
Luke Titus Chief Geo
Share Price Performance (A$)
Source: Bloomberg
0
1
2
3
4
$0.00
$0.10
$0.20
$0.30
$0.40
$0.50
Aug‐12 Nov‐12 Feb‐13 May‐13 Aug‐13
Millions
Australian Unconventional Oil & Gas September 2013 135
Investment Case
We maintain Armour Energy as a SPECULATIVE BUY and are increasing our fair value estimate slightly to A$0.74/share. We believe Armour Energy is significantly undervalued despite its potential huge resource base. In March 2012 MBA Petroleum Consultants estimated that just three of the permits contained unrisked mean prospective resources of 41Tcf of gas and 2.2Bbbl of condensate. Armour has booked 6Bcf of 2C contingent conventional gas resources for its 2012 Glyde-1 discovery. In April 2013 DeGolyer and MacNaughton estimated that 23 similar conventional gas prospects in the Batten Trough in the McArthur Basin had 264.4Bcf (or 322PJ) of unrisked mean prospective resources in Coxco Dolomite reservoirs. Armour has also booked 100Bcf of mean prospective tight gas resources at Cow Lagoon in EP 176. Regardless of all the above potential, the company trades on an EV/acre multiple of just US$1.83/acre. This makes it by far the cheapest stock among its peers. The weighted average EV/acre multiple that was paid by industry in 20 Australian unconventional petroleum farm-ins over the last two years was US$23/acre.
An important catalyst in the next few weeks to months should be the results of the flow testing of the multi-stage, hydro-fractured Egilabria-2 DW1 lateral well. The Egilabria-2 vertical well was drilled in ATP 1087P, Queensland, to test the potential of the Lawn Hill Shale at this location. It spud in May 2013 and reached a total depth of 1,900m in July. While in the Lawn Shale the well was shut-in for an hour to test for gas build up, resulting in a gas flare that burned approximately 3-4m long for around a minute. Armour also experienced significant gas influx at 1,098m and 1,519m while tripping in and out of the drill hole. In July 2013 the Egilabria-2 DW1 lateral well was side-tracked from the Egilabria-2 vertical well at 1,300m to target the 137m thick Lawn Hill Shale Formation. It has been drilled to give a 568m lateral section. Haliburton Energy has been contracted to perform an eight-stage hydraulic fracture stimulation (planned for the beginning of September). Flow back and testing are planned to occur in September/October. The flow rate from this well should give a good indication of the viability of commercial production from shale gas targets in the South Nicholson Basin and Isa Superbasin.
For junior oil companies, we believe that a strong, experienced, dynamic and well-motivated Board and management team is at least as important as the assets the company owns. Strong managements can overcome many challenges that would beat weaker ones. Experienced and dynamic management will adjust the focus of the company to better capture the changing opportunities available over time. We see these traits in the track records of both the Executive Chairman (Nicholas Mather) and Chief Executive Officer (Robbert de Weijer).
Nicholas Mather was a founder/co-founder of three energy companies that were taken out at substantial premiums to their IPO prices: Arrow Energy, Bow Energy and Waratah Coal. We believe that many of the challenges these companies faced (proving up a potentially large unconventional resource base and planning/developing channels to get the resource to market profitably) are similar to those that Armour faces. Robbert de Weijer was previously the Chief Operating Officer of Arrow Energy Ltd, a coal seam gas company acquired by Shell in 2010. Whilst at Arrow Mr de Weijer was instrumental in the company achieving substantial reserve upgrades and increasing gas production. Mr de Weijer’s most recent role was as CEO (Australia) for Dart Energy Ltd, an unconventional gas exploration and production company.
We believe Armour Energy is significantly undervalued
Flow testing the Egilabria-2 well could provide a significant catalyst for the stock
Armour has a strong, experienced, dynamic and well-motivated Board and management team

Australian Unconventional Oil & Gas September 2013 136
Armour used its early-mover advantage to secure 100% ownership of a large contiguous tenement area in Northern Territory (NT) and Queensland (QLD) at low cost, by obtaining exploration permits long before any petroleum resources were proved to be commercial. Figure 91 shows that practically all NT exploration permits are now under application, so any company wishing to gain exposure to petroleum plays in the region will now have to farm in. Armour has also farmed into two Victorian permits. These should provide it with some diversification benefits, including the ability to create year-round newsflow (the weather in NT and QLD will likely only allow drilling for half the year).
Figure 91: Northern Territory Granted and Application Petroleum Exploration Permits in 2009 and 2012
Source: Falcon Oil & Gas, RFC Ambrian estimates
In June 2013 Armour signed a Heads of Agreement (HOA) with APA Group to work together to facilitate the ultimate transportation of up to 330PJ of gas pa from Armour’s northern Australian gas projects to various markets in Mount Isa, Sydney and Queensland. Pipeline construction by APA would be conditional on a number of key milestones being met by both Armour and APA, including certification by Armour of sufficient gas resources, completion of conditional gas sales contracts and securing production licences and project development funding.
The next step is to add value to its acreage through appraisal and exploration. Management now aims to increase the value of its acreage by proving up the resource base. Flow testing of the Egilabria-2 DW1 lateral well is an important part of this process. Once value has been added to its acreage, Armour management may farm out some of its interest in it for the carry of future exploration, appraisal and development costs. Management has historically designed smart work programmes that combined the exploration for conventional petroleum fields with the exploration and appraisal of the unconventional resources, and we expect this to continue.
Armour has successfully implemented the first part of its smart strategy
Heads of Agreement (HOA) signed to facilitate the transportation of gas from Armour’s northern Australian gas projects to various markets in Mt Isa, Sydney and Queensland
The next step is to add value to its acreage through appraisal/exploration

Australian Unconventional Oil & Gas September 2013 137
We believe there remains huge resource upside to be reported in Armour’s acreage; it has only had the resources of three of its 19 permits independently assessed. Armour’s prospective resources could increase substantially as other permits are explored and appraised in more detail.
We estimate that Armour’s unconventional drilling costs are likely to be US$3-4m less than peer group operators in the Cooper Basin Nappamerri Trough (ie, US$5-6m/horizontal fractured well in the Batten Trough and South Nicholson Basin vs. US$8-10m/well in the Nappamerri Trough). This is because the Barney Creek and Lawn Hill formations that Armour is targeting are only 1.5-2.5km deep rather than the 3-4km deep REM shales in the Cooper Basin Nappamerri Trough. Batten Trough and South Nicholson Basin carbon dioxide gas removal costs are also likely to be lower than those of Cooper Basin shale gas. The carbon dioxide content of the Barney Creek and Lawn Hill shales gases are negligible, based on drilling results to date. Cooper Basin shale gas is more mature and has carbon dioxide levels that range from 10-30% (average 15%).
Armour Energy’s permits are located within areas that are not prime cropping land, and are primarily used for livestock grazing. The company’s NT and QLD exploration permits are located within a low population density area, implying that drilling and testing activities should have a minimal impact on regional population centres.
We estimate the fair value of Armour’s shares at A¢74.1. In our view, the vast majority of Armour’s value is due to its unconventional acreage. We have valued Armour’s South Nicholson Basin acreage by multiplying the 1.7m acres that MBA Consultants assessed were prospective in ATP 1087 by a US$100/acre multiple. This multiple reflects the early stage of the appraisal programme. Should the Egilabria-2 DW1 lateral well demonstrate clearly commercial flow rates, we would increase this multiple significantly towards that paid by Chevron in its recent Cooper Basin farm-in (US$900/acre). At US$900/acre, Armour’s ATP 1087P Lawn Hill shale acreage would be worth US$1.5bn (or A$5.66/share).
Figure 92: Armour Energy Fair Value Breakdown
Source: RFC Ambrian estimates
We believe there is further resource upside to be reported by Armour
Armour’s Batten Trough drilling costs are likely to be substantially lower than those of the Cooper Basin
Armour Energy’s main permits are located within areas that are primarily used for livestock grazing
Fair value breakdown

Australian Unconventional Oil & Gas September 2013 138
Risks
Armour Energy is subject to the usual risks that a junior upstream petroleum exploration and production company faces. These include: geological/technical, political/regulatory, commercial, operational, capital access, weather related and environmental.
A key risk that is more specific to Armour is that it may not be able to discover sufficient commercial gas reserves to justify building pipelines to major markets, potentially leaving the gas stranded. However, should Armour discover only relatively small amounts of conventional gas, we believe these could be successfully marketed to local mines. Armour is planning a three-well FY14 Glyde Sub-basin conventional gas exploration programme, and some of the planned exploration wells might not be successful.
Unconventional petroleum production is yet to be proved commercial in Australia. Should petroleum prices and flow rates from unconventional wells not be sufficient to give an economic return on the investment, Australia’s unconventional resources will not be developed.
In August 2012 the Victorian Government issued a moratorium on fracture stimulation; this has delayed the exploration and exploitation of unconventional resources that would require this technique. Armour’s direct interests in Victorian licences (and its investment in Lakes Oil and its option over PRL 2) are affected by this ban. We believe that Gippsland Basin tight gas resources are substantial and could be highly profitable over the coming years as East Coast gas prices rise. For this to happen, the moratorium on fracture stimulation will need to be lifted.
Management
Mr Mather has been involved in the junior resource sector for 30 years. He is Managing Director and co-founder of DGR Global, and was co-founder of Arrow Energy, where he served as Executive Director until 2004. He was also founder and Chairman of Waratah Coal until December 2008. He was co-founder and Non-executive Director of Bow Energy until its takeover by Arrow Energy in January 2012 for A$550m.
Mr de Weijer is an international oil and gas executive experienced in high volume field operations at both exploration and development stages. Mr de Weijer’s early career was with Shell International and culminated in him managing Shell’s North Sea assets. He was previously the Chief Operating Officer of Arrow Energy Ltd, a coal seam gas company acquired by Shell in 2010. Whilst at Arrow Mr de Weijer was instrumental in the company achieving substantial reserves upgrades and increasing gas production. Mr de Weijer’s most recent role was as CEO (Australia) for Dart Energy Ltd, an unconventional gas exploration and production company. Robbert joined Armour Energy as CEO in July 2013 to drive the company’s project and corporate development initiatives.
Nicholas Mather — Executive Chairman
Robbert de Weijer — Chief Executive Officer

Australian Unconventional Oil & Gas September 2013 139
Operations
Armour has large acreage (a net 33.35m acres) in three Australian states: Northern Territory, Queensland and Victoria. We believe its acreage combines both high-impact potential conventional and unconventional oil and gas opportunities.
Figure 93: Armour Energy Assets in Australia
Source: Armour Energy
Northern Territory and Queensland
Armour’s Northern Territory and Queensland acreage is contiguous, covering 133,288km2 across multiple sedimentary basins. Armour’s acreage is roughly twice the size of the Barnett Shale in Texas, US. In the Northern Territory Armour has been granted four tenements, EP 171 and EP 176 (granted June 2011), EP 174 and EP 190 (granted November 2012), and has thirteen permits under application, pending grant. In Queensland it has been granted ATP 1087 and is the preferred tenderer on ATP 1107.
In March 2012 MBA Petroleum Consultants estimated that three of these tenements (EP 171, EP 176 and ATP 1087P) had combined unrisked mean prospective unconventional resources of 41Tcf of gas and 2.2Bbbl of liquids. Since then Armour management has identified further substantial possible unconventional resources in the Riversleigh Formation in ATP 1087.
In April 2013 DeGolyer and MacNaughton estimated that 23 conventional gas prospects in the Batten Trough, McArthur Basin, had 264.4Bcf (or 322PJ) of unrisked mean prospective resources in Coxco Dolomite reservoirs. It also estimated that conventional gas 2C contingent resources from the Glyde-1 target area were 6.0Bcf (or 7.4PJ) of gas. Armour management believes that there are additional conventional oil and gas resources in ATP 1087.

Australian Unconventional Oil & Gas September 2013 140
Northern Territory —Southern McArthur Basin Geology
The McArthur Basin covers 180,000km2 and overlies the eastern edge of the north Australian Craton. It is divided both tectonically and geographically into southern and northern basins, bisected by the Urapunga Fault Zone. The most northerly of Armour’s permits, EP 171, 173, 176, 190 & 193, lie in the southern McArthur Basin. This Sub-basin contains approximately 12km of middle Proterozoic flat-lying to gently folded sediments. These were deposited in shallow to deep water environments, dominated by the north-trending half grabens of the Batten Fault Zone.
This area contains a very thick sequence of carbonaceous siltstone, known as the Barney Creek Formation. We believe this formation is likely to be the main hydrocarbon source rock, seal and shale play in the basin. It is a marine source rock and has an average TOC of ~2% and Type I kerogens. MBA Consultants believes that it is dry gas mature and wet gas mature within much of the Batten Trough. It may even be early oil mature at or close to the surface in some areas. The Barney Creek Formation is regionally extensive and up to 400m thick. There could be other potential source rocks in the Lynott and Reward formations.
Figure 94: Overview of the McArthur Basin Figure 95: Cross Section of the Batten Trough
Source: Armour Energy Source: Armour Energy
Armour considers the most prospective conventional reservoir within EP 171 and 176 to be the Coxco Dolomite due to the likelihood of secondary vuggy porosity development and brecciation. The permeability in the Coxco Dolomite is potentially formed by brecciation and fracturing along faults. Adjacent to the margin of the Batten Fault Zone is the Glyde Sub-basin, which is a fault-bounded depocentre. It is in the Coxco Dolomite within this sub-basin where Armour made its conventional Glyde-1 ST1 lateral well gas discovery in August 2012. Management considers the trapping mechanism to be analogous to the Trenton-Black River Formation trapping found at the Albion-Scipio Field in the Michigan Basin, US. Cores from this well and Amoco’s GR9 well show the brecciation (see Figure 96). Another potential conventional objective is the Reward Dolomite Formation.

Australian Unconventional Oil & Gas September 2013 141
Figure 96: GR-9 and Glyde-1 ST1 Coxco Dolomite Cores
Source: Armour Energy
Queensland —Georgina and South Nicholson Basins’ Geology
Armour’s ATP 1087 tenement covers parts of the Georgina and South Nicholson basins. The Georgina Basin is a 330,000k2 intracratonic sedimentary basin. It unconformably overlies the McArthur and South Nicholson basins and the Lawn Hill Platform. The South Nicholson Basin unconformably overlies the Lawn Hill Platform. The Northern Lawn Hill Platform comprises an area of approximately 16,000km2. Thick packages of Proterozoic strata outcrop in the region, although large areas are covered by younger strata. Armour considers potential shale gas source rock/reservoirs within these basins to be:
Shale within the Lawn Hill Formation
Riversleigh shale/siltstone sequences
In particular, Armour has identified potential shale gas plays in the Wide and Lawn supersequences of the Lawn Hill Formation, and within the River Supersequence of the Riversleigh Sandstone, both members of the McNamara Group. These are aerially extensive, thick (250m) and range in depth from 300m to over 1,900m. They both contain some sections with TOC (2.5-7.0%) sufficient for valid source rock potential. They have a range of porosity of 7-11%, and MBA Consultants estimates that they have reached a level of thermal maturity for dry gas generation.

Australian Unconventional Oil & Gas September 2013 142
Figure 97: McArthur Basin and South Nicholson Basin Stratigraphy
Source: Armour Energy
Victoria
In Victoria Armour owns 18.6% of the share capital of Lakes Oil on a fully diluted basis, farmed into both PEP 169 and PEP 166, and has an option to buy interests in PRL 2.
PEP 166 covers 1,751km2 of the Onshore Gippsland Basin, where in addition to its stake in Lakes, Armour holds a 25% interest earned by funding the Holdgate-1 well. It has a right to earn up to 51% by drilling an additional well, or alternatively expending A$4.75m on exploration. The main targets are the extensive gas resource in the Strzelecki Group and oil in the Rintoul Creek Sandstone.
PRL 2 is in the Onshore Gippsland Basin. Armour has bought an option to acquire 50% of Lakes Oil’s interest in the Trifon and Gangell block in PRL 2 and a 25% interest in the balance of PRL 2 for a total of A$30m. PRL 2 is considered prospective for unconventional gas. Gaffney, Cline and Associates have estimated 1.68Tcf of contingent resource within the Strzelecki Group in PRL 2.
Armour has a 51% interest in PEP 169, which covers 1,133km2 in the Otway Basin. PEP 169 hosts the 2012 Moreys-1 gas and condensate discovery and the Otway-1 target.
PEP 166
PRL 2
PEP 169

Australian Unconventional Oil & Gas September 2013 143
Figure 98: Map of PEP 166 and PRL 2
Source: Lakes Oil
The Gippsland and Otway Basin Geology
The Gippsland Basin is a late Jurassic to Cenozoic, east-west trending basin on the south-east margin of Victoria’s continental shelf. Covering about 46,000km2, about two-thirds of the basin lies offshore in shallow water of less than 200m. Hydrocarbons are predominantly sourced from the Upper Cretaceous to Early Tertiary Latrobe Group, which is Type II-III kerogen, organic-rich, coastal plain shales and coal. Sediment thickness reaches over 7.5km.
Rifting began in the Early Cretaceous, in association with the continental break up of Gondwana, resulting in a system of grabens and half-grabens. Compressional tectonism from the Late Eocene caused a series of anticlines, which have trapped oil and gas accumulations. The basin is also considered highly prospective for onshore unconventional gas. The Strzelecki Group sediments within the onshore and offshore Gippsland Basin have the potential to generate significant quantities of dry gas. The Strzelecki Group appears to have broadly similar source rock quality to its temporal equivalent, the proven gas-generating Eumeralla Formation in the Otway Basin. Gas held in onshore fields, such as Wombat, was likely generated from the Strzelecki Group.
The Gippsland is one of the most prolific and mature hydrocarbon provinces. The first big Australian oil discovery was credited to the onshore Gippsland Basin in 1924, when a water well, Lake Bunga-1, encountered a 15m oil column. More than 90% of current production is associated with the Gippsland Basin Joint Venture, a 50/50 JV between BHP and ExxonMobil Australia. Hydrocarbons are produced from a series of fields, including Barracouta, Snapper and Marlin, and brought through a network of pipelines to the onshore processing facilities near Longford.
The Otway Basin covers an area of 150,000km2, 80% of which lies offshore. Onshore it spreads across both South Australia and Victoria. The basin was formed in the Mesozoic during the break up of Gondwana, and the separation of Antarctica and Australia. It is filled with Late Jurassic to Recent sediments. There are two key sedimentary sequence targets for petroleum exploration: the Crayfish Sub-group and Casterton Formation.
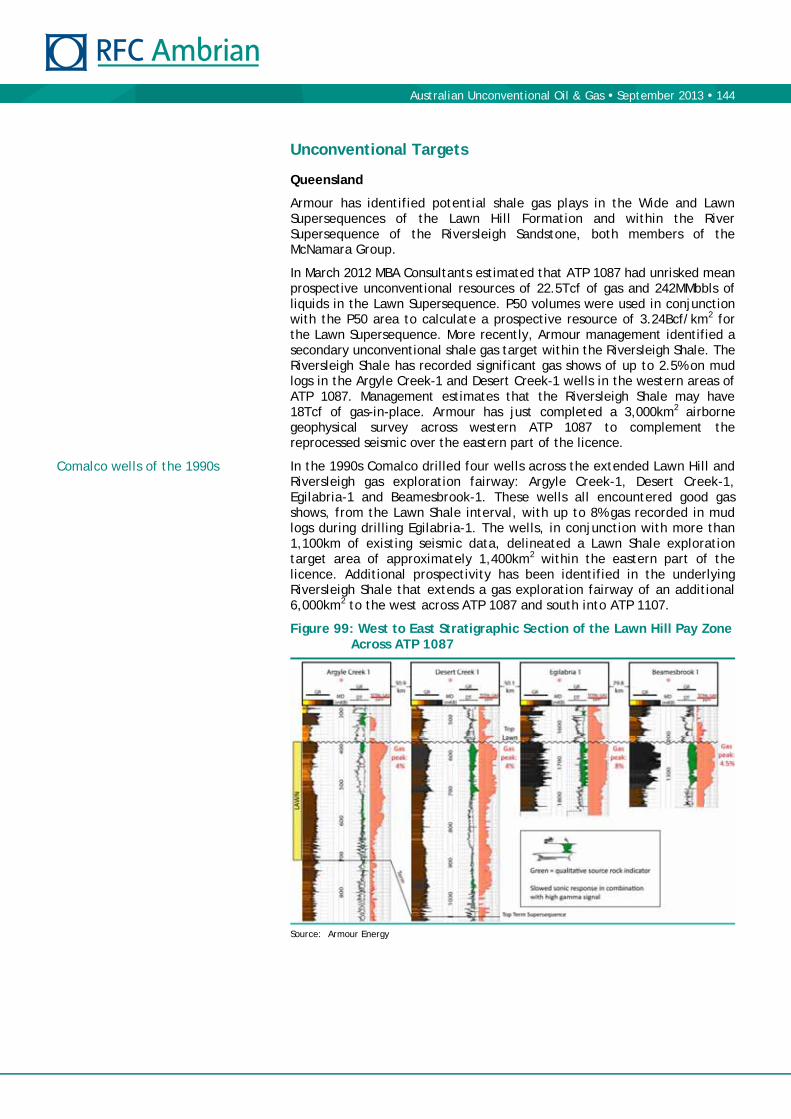
Australian Unconventional Oil & Gas September 2013 144
Unconventional Targets
Queensland
Armour has identified potential shale gas plays in the Wide and Lawn Supersequences of the Lawn Hill Formation and within the River Supersequence of the Riversleigh Sandstone, both members of the McNamara Group.
In March 2012 MBA Consultants estimated that ATP 1087 had unrisked mean prospective unconventional resources of 22.5Tcf of gas and 242MMbbls of liquids in the Lawn Supersequence. P50 volumes were used in conjunction with the P50 area to calculate a prospective resource of 3.24Bcf/km2 for the Lawn Supersequence. More recently, Armour management identified a secondary unconventional shale gas target within the Riversleigh Shale. The Riversleigh Shale has recorded significant gas shows of up to 2.5% on mud logs in the Argyle Creek-1 and Desert Creek-1 wells in the western areas of ATP 1087. Management estimates that the Riversleigh Shale may have 18Tcf of gas-in-place. Armour has just completed a 3,000km2 airborne geophysical survey across western ATP 1087 to complement the reprocessed seismic over the eastern part of the licence.
In the 1990s Comalco drilled four wells across the extended Lawn Hill and Riversleigh gas exploration fairway: Argyle Creek-1, Desert Creek-1, Egilabria-1 and Beamesbrook-1. These wells all encountered good gas shows, from the Lawn Shale interval, with up to 8% gas recorded in mud logs during drilling Egilabria-1. The wells, in conjunction with more than 1,100km of existing seismic data, delineated a Lawn Shale exploration target area of approximately 1,400km2 within the eastern part of the licence. Additional prospectivity has been identified in the underlying Riversleigh Shale that extends a gas exploration fairway of an additional 6,000km2 to the west across ATP 1087 and south into ATP 1107.
Figure 99: West to East Stratigraphic Section of the Lawn Hill Pay Zone Across ATP 1087
Source: Armour Energy
Comalco wells of the 1990s

Australian Unconventional Oil & Gas September 2013 145
ATP 1087 (Armour: 100%)
Armour was granted this permit in December 2012. It has already undertaken a reprocessing of a majority of the 1,100km vintage seismic lines and re-analysed the Comalco well log data. The Egilabria-2 vertical well was the first well of the 2013 drilling campaign. It is located in the eastern area of ATP 1087, near the historic Egilabria-1 well drilled by Comalco in 1992. It spud in May 2013 and reached a total depth of 1,900m in July. While in the Lawn Hill Shale the well was shut-in for an hour to test for gas build up, resulting in a gas flare that burned approximately 3-4m long for around a minute. Armour also experienced significant gas influx at 1,098m and 1,519m while tripping in and out of the drill hole.
In July 2013 the Egilabria-2 DW1 lateral well was side-tracked from the Egilabria-2 vertical well at 1,300m to target the 137m thick Lawn Hill Shale Formation. It was drilled to give a 568m lateral section. Haliburton Energy has then been contracted to perform an eight-stage hydraulic fracture stimulation (planned for the beginning of September). Flow back and testing are planned to occur in September/October. The flow rate from this well should give a good indication of the viability of commercial production from shale gas targets in the South Nicholson and Isa super-basins. After this Armour plans to drill the Egilabria-4, to test the aerial extent of the play. The Egilabria-4 well will drill into the Riversleigh Shale, and also test a potential conventional pinch-out oil and gas play at the base of the Mesozoic Carpentaria Basin.
Northern Territory
The Barney Creek Formation is the primary target for a shale gas play in the southern McArthur Basin. It is regionally extensive, thick, with an average 2% TOC concentration and oil-prone organic matter type. The shale is finely interbedded, with high dolomitic and silt components, providing favourable conditions for large volumes of gas to be held in pore spaces. The rocks are also likely to be well suited to fracture stimulation. In March 2012 MBA Consultants estimated that this shale gas play in EP 171 and EP 176 had unrisked mean prospective resources of 18.6Tcf of gas and 1,962MMbbl of associated liquids.
Table 54: Shale Gas Prospective Resources within Barney Creek Shale Gas Play, EP 171, EP 176, Northern Territory
Area Gas mean volume (Tcf) Condensate mean volume (MMbbl)
EP171 – dry gas 0.1 2
EP171 – wet gas 11.1 1,257
EP176 – dry gas 1.2 14
EP176 – wet gas 6.1 690
Total 18.6 1,962
Source: MBA Consultants 2012
In June 2012 Armour drilled the Cow Lagoon-1 well. Its location was identified based on surface mapping and seismic interpretation of the 2002 seismic line 02GA-BT1. The well was designed primarily to test the gas potential of the Coxco Dolomite and (secondarily) the shale gas potential of the Barney Creek Formation. The Cow Lagoon-1 well demonstrated a large potential unconventional gas resource in the greater Cow Lagoon area. Significant gas shows while drilling the Lynott Formation and Reward Dolomite showed that source rock is not an issue at this location, and that valid hydrocarbon traps were present. The results of the analysis of the cores and cuttings taken during drilling should shed further light on why the gas was tight. Management estimates that the Greater Cow Lagoon structure holds an unrisked mean prospective resource of ~100Bcf of gas in the Lynott and Reward Formations.
Egilabria-2 vertical well
Egilabria-2 DW1 lateral well
Cow Lagoon-1

Australian Unconventional Oil & Gas September 2013 146
In early January 2013 a 1,642km2 gravity gradiometer, magnetic and digital terrain survey was shot over selected parts of the Glyde and Myrtle Sub-basins within permits EPs 171, 176 and 190. The survey aimed to identify sub-surface structures similar to the Glyde-1 ST1 discovery. These surveys, when combined with surface mapping, have allowed Armour to high grade targets for further investigation with 2D seismic and drilling. Armour has recently completed a 3,000km2 airborne survey over the western portion ATP 1087 in North Queensland to delineate multiple play types, including conventional, Lawn Hill Shale and Riversleigh Shale targets.
Figure 100: Glyde and Myrtle Basins: Structural Map and Airborne Gravity and Magnetic Survey Results
Source: Armour Energy
EP 171 (Armour: 100%)
This permit was granted in June 2011 for a five-year term. It covers 3,473km2 in the McArthur Basin. Armour has drilled two vertical wells and one lateral well so far on this permit, and each vertical well was designed to test both conventional and unconventional targets.
The Glyde-1 well was spud on 27 July 2012. The well location was 300m west of the 1979 mineral well GR9, which flowed gas for six months before being shut in. It was drilled to a total depth of 698m. It intersected a continuous vertical section of 132m of highly carbonaceous, gas-charged Barney Creek Shale, before intersecting the Coxco Dolomite. Unlike Kilgour North-1, no water was encountered during the drilling. During logging numerous open natural fractures were observed on resistivity imaging tools.
To assess how the natural fracturing in the Coxco Dolomite and Barney Creek Shale Formation could be potentially utilised to provide commercial production from lateral wells, a highly deviated lateral well was drilled. The Glyde-1 ST1 lateral well commenced from a vertical depth of 280m, and was deviated through a 250m vertical radius to a near horizontal inclination, from where it passed the GR9 well. It was terminated at a measured depth of 840m, with the well oriented close to a horizontal trajectory at a vertical depth of some 500m.
Figure 101: Glyde-1 ST1 Lateral Well Flare
Source: Armour Energy
Glyde-1 and Glyde-1 ST1 wells

Australian Unconventional Oil & Gas September 2013 147
The Glyde-1 ST1 well encountered gas-bearing formations from 648-810m measured depth. Flow testing confirmed a rate of 3.33MMcfd equivalent, at 125psi pressure after ten minutes on a 64/64 inch choke. Analysis of the drilling and flow testing data, along with mineral hole data collected by Amoco during the late 1970s to early 1980s, indicated that the Glyde-1 ST1 lateral well penetrated part of a covered fault-bounded structural high. A resource estimate of the Glyde-1 lateral well was completed to analyse the contingent gas resource potential of the Coxco Formation at this location. In April 2013 DeGolyer and MacNaughton estimated that conventional gas 2C contingent resources from the Glyde-1 target area were 6.0Bcf (or 7.4PJ).
Spud on 23 June 2012, Kilgour North-1 was drilled to 1,046m, with two water-bearing zones intersected in the Lynott and Reward formations at 350m and 750m depth. The well was logged and cased to reduce water inflow, which was compromising the air drilling operations. Drilling recommenced to 1,142m, where another water inflow zone was intersected. Drilling was suspended on 17 July, with the well available for re-entry as required. The well did encounter gas and oil shows, indicating primary charge of these reservoirs. However, it appears that subsequent water inflows have flushed out and oxidised the hydrocarbons in most of the intervals (although some remained charged with methane).
EP 176 (Armour: 100%)
This permit was granted in June 2011 for a five-year term. It covers 8,032km2. The permit area includes the McArthur River zinc mine. The Batten Trough is the principal geologic structure in this permit.
The Cow Lagoon-1 well was identified based on surface mapping and seismic interpretation of the 2002 seismic line 02GA-BT1. It spud on 9 May 2012, and was drilled to 1,804m. The Barney Creek Formation was encountered at 1,245m, and a 65m shale section in the formation was penetrated. It discovered gas flows and shows in the Lynott and Reward formations between 295-1,560m on the Cow Lagoon West Anticline. There are further four-way dip closed leads nearby at Cow Lagoon East and Cow Lagoon West, Dunganminnie East and Dunganminnie West.
EP 174 & EP 190 (Armour: 100%)
Armour was granted these licences in December 2012. Armour has already undertaken sub-surface studies, and an airborne gravity gradiometer and magnetics survey to identify potential structures similar to the Glyde-1 discovery.
Three new conventional prospects — Catfish Hole, Lamont Pass and Matheson Creek — have been added to the target list.
The Catfish Hole anticline covers 11km2, and was penetrated by the Amoco 82-6 wellbore to 300m. Oil was discovered in the Stretton Sandstone and Yalco Formations.
The 11km2 double-plunging Lamont Pass anticline has never been tested. Both structures are close to the Emu Fault, where the Barney Creek Shale can be greater than 900m thick, and on-trend with the Greater Coxco Field.
The Matheson Creek prospect is unexplored. It is on the eastern side of the Emu Fault, where the Barney Creek Shale has not been tested. This overturned double-plunging anticline covers 15km2, adjacent to the major Calvert Hills Fault. It is expected to have a similar stratigraphic section to Cow Lagoon-1.
Kilgour North-1 well
Cow Lagoon-1
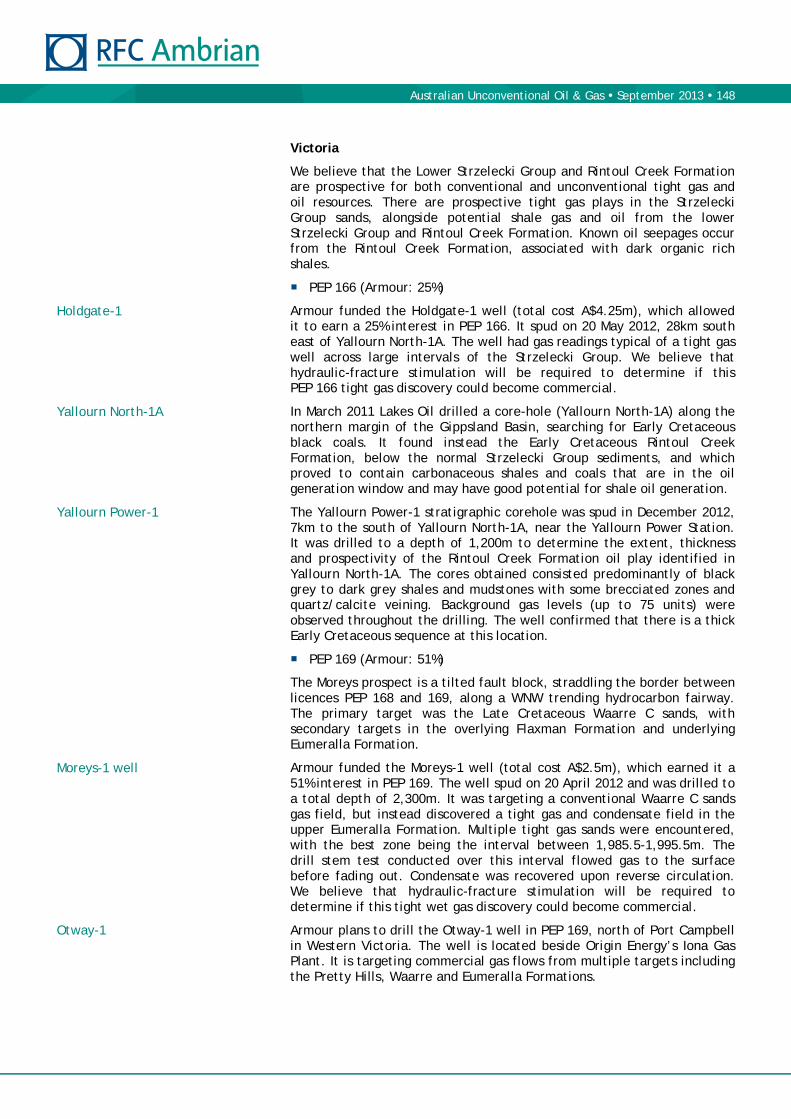
Australian Unconventional Oil & Gas September 2013 148
Victoria
We believe that the Lower Strzelecki Group and Rintoul Creek Formation are prospective for both conventional and unconventional tight gas and oil resources. There are prospective tight gas plays in the Strzelecki Group sands, alongside potential shale gas and oil from the lower Strzelecki Group and Rintoul Creek Formation. Known oil seepages occur from the Rintoul Creek Formation, associated with dark organic rich shales.
PEP 166 (Armour: 25%)
Armour funded the Holdgate-1 well (total cost A$4.25m), which allowed it to earn a 25% interest in PEP 166. It spud on 20 May 2012, 28km south east of Yallourn North-1A. The well had gas readings typical of a tight gas well across large intervals of the Strzelecki Group. We believe that hydraulic-fracture stimulation will be required to determine if this PEP 166 tight gas discovery could become commercial.
In March 2011 Lakes Oil drilled a core-hole (Yallourn North-1A) along the northern margin of the Gippsland Basin, searching for Early Cretaceous black coals. It found instead the Early Cretaceous Rintoul Creek Formation, below the normal Strzelecki Group sediments, and which proved to contain carbonaceous shales and coals that are in the oil generation window and may have good potential for shale oil generation.
The Yallourn Power-1 stratigraphic corehole was spud in December 2012, 7km to the south of Yallourn North-1A, near the Yallourn Power Station. It was drilled to a depth of 1,200m to determine the extent, thickness and prospectivity of the Rintoul Creek Formation oil play identified in Yallourn North-1A. The cores obtained consisted predominantly of black grey to dark grey shales and mudstones with some brecciated zones and quartz/calcite veining. Background gas levels (up to 75 units) were observed throughout the drilling. The well confirmed that there is a thick Early Cretaceous sequence at this location.
PEP 169 (Armour: 51%)
The Moreys prospect is a tilted fault block, straddling the border between licences PEP 168 and 169, along a WNW trending hydrocarbon fairway. The primary target was the Late Cretaceous Waarre C sands, with secondary targets in the overlying Flaxman Formation and underlying Eumeralla Formation.
Armour funded the Moreys-1 well (total cost A$2.5m), which earned it a 51% interest in PEP 169. The well spud on 20 April 2012 and was drilled to a total depth of 2,300m. It was targeting a conventional Waarre C sands gas field, but instead discovered a tight gas and condensate field in the upper Eumeralla Formation. Multiple tight gas sands were encountered, with the best zone being the interval between 1,985.5-1,995.5m. The drill stem test conducted over this interval flowed gas to the surface before fading out. Condensate was recovered upon reverse circulation. We believe that hydraulic-fracture stimulation will be required to determine if this tight wet gas discovery could become commercial.
Armour plans to drill the Otway-1 well in PEP 169, north of Port Campbell in Western Victoria. The well is located beside Origin Energy’s Iona Gas Plant. It is targeting commercial gas flows from multiple targets including the Pretty Hills, Waarre and Eumeralla Formations.
Holdgate-1
Yallourn North-1A
Yallourn Power-1
Moreys-1 well
Otway-1

Australian Unconventional Oil & Gas September 2013 149
PRL 2 (Armour: option over 50% of Lakes Oil interest in the block)
We believe there is significant upside potential from the development of unconventional tight gas reservoirs in the Strzelecki Group in PRL 2. It is considered prospective for unconventional gas. In 2008 Gaffney, Cline and Associates estimated that 2C contingent recoverable resources of the Wombat and Greater Trifon fields are 683Bcf of gas.
Originally drilled and fracture stimulated in 2004, the Wombat-2 well flowed at a sustainable rate of 680Mcfpd. In 2009 Lakes Oil re-entered the well and performed a larger fracture stimulation using 155,000lb of proppant (the original stimulation used 74,000lb proppant). The well then had an initial flow rate of 4.3MMcfd. This flow rate decreased and stabilised at 1.3MMcfd flowing through a ½” choke.
The Wombat-3 well was drilled and fracture stimulated in 2005. As well as discovering tight gas, oil was found; it flowed from a natural fracture at 2,106m, which Lakes Oil management believes to be sourced from the from the deeper Rintoul Creek Formation. Eight barrels of 39° API were recovered.
Drilled in 2009, the Wombat-4 well was declared a tight gas discovery, with 27 potential tight gas zones identified over a 1,400-2,500m section of the Strzelecki Group. The next step in PRL 2’s work programme is planned to be the re-entering, hydraulic-fracturing and flow testing of this well once the moratorium on hydraulic-fracturing is lifted by the Victorian State Government.
The Boundary Creek-2 well was drilled on the Longford Dome to a total depth of 2,341m in October 2005. Continuous gas readings were recorded throughout the Strzelecki Group from 227-2,341m. The plan is to re-enter, to perform a hydraulic-fracture and to flow test this well once the moratorium on hydraulic-fracturing is lifted in Victoria.
Conventional Targets
Northern Territory
A joint venture between Amoco Minerals and Kennecott Exploration drilled nine shallow wells (200-1,000m deep) in the Glyde region in 1979. Mineral well GR9 had live oil and flared for six months at an estimated rate of 300Mcfd before being shut in. It was this result that led Armour to drill its Glyde-1 ST1 well in August 2012.
We believe that the Glyde-1 ST1 lateral well gas discovery shows that Armour has a working petroleum system (source rock, reservoir, trap and seal, timing and migration) in the Glyde Sub-basin. Armour management believes that the Barney Creek Formation acted as both a source rock and seal to the adjacent (below) Coxco Dolomite reservoir. The Glyde-1 ST1 lateral well had an initial flow rate of 3.3MMcfpd of gas.
Each well in Armour’s 2012 drilling programme was designed to test both conventional and unconventional targets. With the 2012 conventional gas discovery within the Coxco Dolomite of the Glyde Sub-basin, Armour’s 2013 Northern Territory work programme is focusing on discovering and proving up a substantial conventional gas resource. The targets for the Coxco Dolomite in EPs 171, 176 and 190 within the Batten Trough are located in the Glyde Sub-basin, the Myrtle Sub-basin to the south of the McArthur River Mine, and to the north in the Caranbirini area. These targets are based on further surface geological studies and the extensive geophysical survey (5,000km2 of aero-magnetics and gravity data), indicating targets with the same geophysical and geological characteristics as the gas accumulation discovered by Armour in the Glyde-1 ST1 well.
Wombat-2 well
Wombat-3
Wombat-4 well
Boundary Creek-2
The Glyde-1 ST1 lateral well showed there is a working petroleum system in the Glyde Sub-basin

Australian Unconventional Oil & Gas September 2013 150
In April 2013 DeGolyer and MacNaughton estimated that 23 conventional gas prospects in the Batten Trough, McArthur Basin, had 264.4Bcf (or 322PJ) of unrisked mean prospective resources in Coxco Dolomite reservoirs. It also estimated that conventional gas 2C contingent resources from the Glyde-1 target area were 6.0Bcf (or 7.4PJ).
Armour plans to drill three conventional wells in the Glyde and Myrtle sub-basins by the end of this year (Matheson Creek-1, Lamont Pass-1 and Glyde Central-1) to further prove up its conventional gas reserves.
Figure 102: Conventional Targets in Northern Territory Licences
Source: Armour Energy
DeGolyer and MacNaughton estimated 23 conventional gas prospects had 264.4Bcf of unrisked mean prospective gas resources
Work programme

Australian Unconventional Oil & Gas September 2013 151
Queensland
Armour management believes that ATP 1087 has significant conventional oil and gas potential. It has identified several types of potential plays. There is potential for conventional accumulations along the western part of the basin, within sandstone and conglomerate reservoirs of the Wide Supersequence. Hydrocarbon charge would come from the McNamara Group. Conventional plays include structural and stratigraphic traps, along the flanks of the basin, as sands pinch out on to the Murphy Inlier. It points to a similar play type in the Cooper Basin, where the oil fairways are around the edge of the basin. It believes that both Mesozoic and Proterozoic anticlinal oil/gas plays are possible. It also considers Proterozoic buried topography oil/gas plays are possible.
Management’s preliminary estimate of the potential size of the conventional resource base in ATP 1087 is 137MMbbl of oil and 1.8Tcf of gas. We think that only the drilling of several of these conventional leads will allow a proper determination of this permit’s conventional prospectivity. However, given the different play types, it should be possible to drill wells that pass through stacked conventional targets and that can also test the unconventional targets in this permit.
Figure 103: Interpreted Seismic Line 89BN-6 with Play Types
Source: Armour Energy

Australian Unconventional Oil & Gas September 2013 152
Valuation
We estimate that the current fair value of Armour’s share price is A$0.74/share, which is 112% above its A$0.35 price on 28 August 2013. We outline our key assumptions behind this NAV-based fair value estimate below.
Key NAV Assumptions
For Our Current Fair Value Estimate
We have used Armour’s discovered net 2C contingent gas resources of 6Bcf (1MMboe) in its Glyde gas field.
We have used a US$8.64/boe NAV estimate for Glyde Basin 2C contingent gas resources. This is based on our model that assumes:
flat well netback gas prices of US$5/GJ (US$30/boe);
finding costs of US$3/boe and development costs of US$5/boe;
operating costs of US$1.8/boe; and
a 10% state royalty rate.
We have assumed a FY14 conventional gas work programme costing A$6m (three wells), as per Armour management guidance.
We have valued Armour’s South Nicholson Basin acreage by multiplying the 1.7m acres that MBA Consultants assessed were prospective in ATP 1087 by a US$100/acre multiple. This multiple reflects the early stage of the appraisal programme. Should Armour’s Egilabria-2 DW1 flow tests, planned in the next month or so, show highly commercial flow rates/EURs, we would increase this multiple dramatically.
We have valued Armour’s McArthur Basin interest by multiplying the 1.0m acres that MBA Consultants assessed were prospective by a US$40/acre multiple. This multiple reflects the early stage of the appraisal programme.
We have conservatively given no value to the other ~30m net acres that Armour has rights over.
Armour had cash of A$37.1m at 30 June 2013.
We estimated the value of Armour’s G&A expense by annualising the addition of its 1H13 G&A expense (US$2.0m), and putting the result over our real 7.5% discount rate (roughly equivalent to a nominal 10% discount rate).
Other assumptions can be seen in Table 55.

Australian Unconventional Oil & Gas September 2013 153
Table 55: Armour Energy Estimated Net Asset Value per Share
Net Oil and Gas NPV
Unrisked NPV Pg Pd
Risked NPV
Risked NPV
Reserves/Resources (MMboe) (US$/boe) (US$m) (%) (%) (US$m) (A¢/share)
Glyde Sub-basin
Gas 2P reserves - 14.29 - 100% 100% - 0.0
Gas 2C resources 1.0 8.64 9 100% 50% 4 1.6
Total Gas 1.0 9 4 1.6
FY14 Work Programme
Glyde Basin gas exploration 5.3 8.64 46 30% 50% 7 2.6
Work Programme 5.3 46 7 2.6
Total Above 6.3 55 11 4.2
Unconventional Business
South Nicholson Basin 172 63.4
McArthur Basin 38 14.1
Total Above 221 81.7
Other Value adjustments
Jun13 net cash 33 12.3
FY14 Exploration expenditure (6) (2.2)
Capitalised G&A cost (48) (17.7)
Options - 0.0
Armour Total fully diluted NAV 201 74.1
Current issued shares 300.0
Options 0.8
Current fully diluted shares 300.8
Source: Company data, RFC Ambrian estimates
Acreage and Resource Multiples
Our fair value would place Armour on an EV/acre multiple of US$5/acre. In 2012 MBA Consultants assessed that Armour had net best estimate (P50) prospective resources of 41Tcf of gas and 2.2Bbbl of liquids (roughly 9Bboe in total) in the Barney Creek and Lawn Hill shales across three of its permits. Our fair value estimate would place Armour on an EV/prospective resource multiple of US$0.02/boe based on this assessment.

Australian Unconventional Oil & Gas September 2013 154
Buru Energy has a net 64,000km2 (15.8m acres) licence position across the north of the Canning Superbasin. Buru has identified three main play types within its acreage: conventional oil fields like the Ungani oil field, Laurel Formation tight gas and Goldwyer Formation shale oil and gas.
We are initiating on Buru Energy with a SPECULATIVE BUY recommendation, and a fair value estimate of A$2.04/share.
Buru has formed a 50/50 partnership with Mitsubishi Corporation to explore and develop petroleum in the north of the Canning Superbasin. The JV partners discovered the ~10MMbbl Ungani oil field in 2011, and plan to move it to full development over the next 12-18 months. During 2014 they also plan to drill up to four oil exploration wells targeting lookalike prospects. In 2011 RISC estimated that Buru had best net prospective resources of 47Tcf of tight gas and 1,177MMbbl of condensate in the Laurel Formation. Five hydro-fracture completions and flow tests on already-drilled Laurel Formation wells are planned in 2014.
Following a recent secondary market equity raising, we believe that Buru is now fully funded through to December 2014, at which point cashflow from its Ungani oil field production should make the company less dependent on the capital markets.
We estimate the fair value of Buru’s shares at A¢204.4. In our view, the vast majority of Buru’s value is due to its unconventional acreage. In this we are probably different from the equity market, given the market’s initial euphoric reaction to the Ungani oil discovery. We believe that the equity market is giving more value than us to undiscovered oil resources along the Ungani Trend and less value to the unconventional Laurel Formation wet gas resources.
We have valued Buru’s Laurel Formation acreage by multiplying Buru’s interest in the 4.3m acres that RISC consultants assessed were prospective by a US$100/acre multiple. This multiple reflects the early stage of the appraisal programme. Should the planned five hydro-fractured Laurel Formation wells demonstrate clearly commercial flow rates, we would increase this multiple significantly towards that paid by Chevron in its recent Cooper Basin farm-in (US$900/acre). At US$900/acre, Buru’s Laurel Formation acreage would be worth US$1.9bn (or A$7.16/share).
28 August 2013 Buru Energy
Speculative Buy Canny in Canning
Stuart Amor +44 (0)20 3440 6826 [email protected]
Emily Ashford +44 (0)20 3440 6821 [email protected]
Price (A$) 1.67
Fair Value (A$) 2.04
Ticker BRU-AU
Market cap (A$m) 491.7
Estimated cash (A$m) 80.4
2P reserves + 2C resources (MMboe) 8.0
Shares in issue
Basic (m) 295.3
Fully diluted (m) 297.8
52-week
High (A$) 3.29
Low (A$) 1.18
3m-avg daily vol (000) 1,102
3m-avg daily val (A$000) 1,721
Top shareholders (%)
Eric Streitberg 9.7
Birkdale Enterprises 7.6
Macquarie Group 7.1
New Standard Energy 3.4
Flexiplan Mgmt 2.8
Total 30.6
Management
Graham Riley CHR
Eric Streitberg Ex DIR
Keiran Wulff MD
Share Price Performance (A$)
Source: Bloomberg
0
2
4
6
8
10
12
14
$0.00
$0.50
$1.00
$1.50
$2.00
$2.50
$3.00
$3.50
Aug‐12 Nov‐12 Feb‐13 May‐13 Aug‐13
Millions

Australian Unconventional Oil & Gas September 2013 155
Investment Case
We are initiating on Buru Energy with a SPECULATIVE BUY recommendation and a fair value estimate of A$2.04/share. Over the last few years management has done a great job exploring and appraising its vast acreage position in the Canning Superbasin, discovering the Ungani oil field and identifying substantial unconventional basin-centred wet gas resources in the Laurel Formation. After recently ensuring over A$100m of funding from various sources, including a A$35m secondary share placement, the company can now fund its share of the Ungani oil field development and the next steps in the Laurel Formation wet gas accumulation appraisal.
Buru has a net licence position of ~64,000km2 (15.8m acres) across the north of the Canning Superbasin. Buru has identified three main play types within its acreage: conventional oil fields, Laurel Formation basin-centred tight gas and Goldwyer Formation shale oil and gas. Buru has formed a 50/50 partnership with Mitsubishi Corporation to explore and develop petroleum in the region. The JV partners discovered the ~10MMbbl Ungani oil field in 2011, and plan to move it to full development over the next 12-18 months. During 2014 they also plan to drill up to four oil exploration wells targeting lookalike prospects. In 2011 RISC estimated that Buru had net best estimate prospective resources of 47Tcf of tight gas and 1,177MMbbl of condensate in the Laurel Formation. Five hydro-fracture completions and flow tests on already-drilled Laurel Formation wells are planned in 2014.
We believe that Buru is now fully funded through to December 2014, at which point cash flow from its Ungani oil field production should make the company less dependent on the capital markets for future funding. In August 2013 Buru raised A$35m from institutional investors, got Mitsubishi to agree to provide A$27.5m to go towards Buru’s share of the Ungani oil field development, got Alcoa to agree to release A$20m from escrow to be used for the Laurel wet gas appraisal and appointed NAB Bank to arrange a Reserve Base Borrowing Facility of up to A$40m. In a presentation to accompany the equity raising, Buru provided the sources and uses of funds table below (Table 56), which does not include any cashflows from Ungani oil field production.
Table 56: Buru Sources and Uses of Funds to December 2014
A$m
Sources of Funding to December 2014
Cash on hand at 31 July 2013 44.0
Mitsubishi Ungani Oil Field Development funding 27.5
Alcoa Laurel Wet Gas Appraisal funding 20.0
Reserve Base Loan Facility 30.0
Secondary Equity Placement 35.0
Total Sources of Funds 156.5
Uses of Funds to December 2014
Ungani Oil Field Development 46.0
Laurel Wet Gas Appraisal programme 27.0
Ungani Trend Oil Exploration 42.0
G&A, Corporate 16.0
Working capital and cash 25.5
Total Uses of Funds 156.5
Source: Company estimates
Focused on the north of the Canning Superbasin
Targeting conventional oil fields, Laurel Formation tight gas and Goldwyer Formation shale oil and gas
Fully funded through to December 2014

Australian Unconventional Oil & Gas September 2013 156
Buru Energy’s permits are located within areas that are not prime cropping land, and are primarily used for livestock grazing. The company’s Western Australian exploration permits are located within a low population density area, implying that drilling and testing activities should have a minimal impact on regional population centres.
We estimate the fair value of Buru’s shares at A¢204.4. In our view, the vast majority of Buru’s value is due to its unconventional acreage. In this we are probably different from the equity market, given its initial euphoric reaction to the Ungani oil discovery. We believe that the equity market is giving more value than us to undiscovered oil resources along the Ungani Trend and less value to the unconventional Laurel Formation wet gas resources.
Figure 104: Buru Energy Fair Value Breakdown
Source: RFC Ambrian estimates
We have valued Buru’s Laurel Formation acreage by multiplying Buru’s interest in the 4.3m acres that RISC consultants assessed were prospective by a US$100/acre multiple. This multiple reflects the early stage of the appraisal programme. Should the planned five hydro-fractured Laurel Formation wells demonstrate clearly commercial flow rates, we would increase this multiple significantly towards that paid by Chevron in its recent Cooper Basin farm-in (US$900/acre). At US$900/acre, Buru’s Laurel Formation acreage would be worth US$1.9bn (or A$7.16/share).
Buru’s main permits are located within areas that are primarily used for livestock grazing
Fair value breakdown
Laurel Formation potential value
Australian Unconventional Oil & Gas September 2013 157
Risks
Buru Energy is subject to the usual risks that a junior upstream petroleum exploration and production company faces. These include: geological/technical, political/regulatory, commercial, operational, capital access, weather related and environmental.
Buru is planning a A$42m four-well exploration programme to December 2014, and some/all of the planned exploration wells might not be successful. It is too early to tell what the exploration well success rate might be onshore along the Ungani Trend in the Canning Superbasin, but a 100% success rate seems unlikely.
The Canning Superbasin is prone to tropical storms from November to May each year. Moving rigs is often not possible over the unsealed roads in the region during this season. Thus, Buru’s newsflow could dry up for several months a year.
Unconventional petroleum production is yet to be proved commercial in Australia. Should petroleum prices and flow rates from unconventional wells not be sufficient to give an economic return on the investment, Australia’s unconventional resources will not be developed. A key risk that is more specific to Buru is that it may not be able to discover sufficient commercial gas reserves to justify building pipelines to major markets in Western Australia, potentially leaving the gas stranded.
Management
Mr Streitberg has over 38 years’ experience in petroleum geology and geophysics and the management of petroleum exploration and production companies. He was Managing Director of ARC Energy for ten years and CEO and Managing Director of Discovery Petroleum NL for seven years (both ASX-listed companies he founded and developed into significant oil and gas production companies prior to their acquisition by AWE Limited and Premier Oil respectively). He was also a founding Non-executive Director of Adelphi Energy Ltd, an early participant in the Eagle Ford unconventional gas and oil play in Texas. He has previously worked in South America, Canada, Libya, the UK, the US and Australia with BP and Occidental Petroleum in a variety of technical and managerial roles. Eric is currently a member and former Chairman of the APPEA Council, Australia’s peak oil and gas representative body. He is a Fellow of the Australian Institute of Mining and Metallurgy and the Australian Institute of Company Directors. He is a member of the Society of Exploration Geophysicists and the Petroleum Exploration Society of Australia. He is also a member and Certified Petroleum Geologist of the American Association of Petroleum Geologists, Chairman of the APPEA Exploration Committee and former Chairman of the Western Australian Marine Parks and Reserves Authority.
Dr Wulff was appointed to the Board in late 2012. He has a PhD in petroleum geology and has worked in the oil and gas industry for over 25 years. He spent 17 years with Oil Search and was intimately involved in the development of that company from an exploration company to a major oil and gas production company. During that time Dr Wulff contributed to all aspects of Oil Search’s development in roles including Exploration Manager, Group Chief Operating Officer and Head of the Middle East business unit.
Mr Eric Streitberg — Executive Director
Dr Keiran Wulff — Managing Director

Australian Unconventional Oil & Gas September 2013 158
Operations
Buru has a continuous basin-wide net licence position of ~64,000km2 (15.8m acres) across the north of the Canning Superbasin. It has high permit equities and operatorship in many of the key licences. Buru has identified three main play types within its acreage:
conventional oil fields like the Ungani oil discovery;
Laurel Formation tight gas — unconventional tight basin-centred gas accumulations (BCGA) like both the Yulleroo tight wet gas and Valhalla tight wet gas accumulations; and
Goldwyer Formation unconventional shale oil and gas.
Of these the conventional oil play along the Ungani Trend and the Laurel Formation, BCGA are Buru’s main priorities in the upcoming work programme.
Buru has formed a partnership with Mitsubishi Corp (MC) to explore for petroleum. In June 2010 Buru farmed out 50% of most of its exploration permits in the Canning Basin to MC. MC is carrying up to A$102.4m of Buru’s exploration costs in the permits (A$40m of which was to be spent on unconventional exploration) and carrying up to A$50m of Buru’s infrastructure development costs. MC also earned the right to acquire 50% of Buru’s production permits at a price set by an independent expert. The farm-in has completed and MC owns 50% of these licences. In August 2013 Buru and MC agreed to replace MC’s obligation to pay A$50m of Buru’s infrastructure development costs with A$27.5m of current funding to allow Buru to fund its share of Ungani oil field development costs.
Figure 105: Buru Licences with Play Fairways/Provinces
Source: Buru Energy
Mitsubishi Corp Partnership

Australian Unconventional Oil & Gas September 2013 159
The Canning Superbasin in the Kimberley region of central northern Western Australia, 2,300km north of Perth, is an Ordovician to Cretaceous pericratonic basin of around 640,000km2, of which 530,000km2 are onshore Western Australia. It has two major north-west-trending troughs with thick sequences of ancient rocks (Palaeozoic era, which are older than most conventional petroleum reservoirs that are found in Tertiary and Mesozoic eras).
The northern trough is divided into the Fitzroy Trough and Gregory Sub-basin, which are estimated to contain up to 10km of mainly Palaeozoic rocks. The Laurel Formation is a thick, regionally extensive package of Carboniferous sands, shales and limestones.
The southern trough includes the Kidson and Willara sub-basins. These are thinner, at approximately 4-5km thick, with predominantly Ordovician, Silurian and Permian age rocks, and extensive Mesozoic cover. The Ordovician Goldwyer Formation was deposited mainly in open marine to intertidal conditions. Highly fossiliferous, it varies from mudstone-dominated in basinal areas to limestone-dominated in some platform and terrace areas. The Goldwyer Formation averages about 400m thick, reaching a maximum thickness of 736m in the Willara-1 well in the Willara Sub-basin.
Buru’s assets cover a large area of the Canning Superbasin. This huge basin is under-explored and has just 0.05 wells per 100km2 (compared with the Cooper Basin’s 2.3 per 100km2 and the US Permian Basin with 69 per 100km2). Petroleum exploration began in the early 1920s, but only ~250 wells have been drilled and just 78,000km of 2D seismic has been shot. The Canning Basin is clearly prospective for petroleum, as the legacy Blina and Sundown oilfields, Ungani oil, Yulleroo tight wet gas and Valhalla tight wet gas discoveries prove.
Buru management considers the Fitzroy Trough to be the most prospective area of the basin within its licences due to its substantial sedimentary accumulation and proven petroleum systems. We believe that the flanks of the basin, having been buried less deeply, are more oil-prone than the central part of the basin, which is gas-prone. The Ungani conventional oil discovery was found on the flanks.
Figure 106: Canning Superbasin Cross Section with Oil and Gas Shows
Source: Buru Energy
Canning Superbasin
Fitzroy Trough and Gregory Sub-basin
Kidson and Willara sub-basins
This huge basin is underexplored

Australian Unconventional Oil & Gas September 2013 160
State Agreement
In November 2012 Buru and Mitsubishi entered into an agreement with the Western Australian State Government (‘State Agreement’) to provide long-term tenure over much of Buru’s more prospective acreage and facilitate the development of a domestic gas project and pipeline once sufficient gas reserves are identified. The State Agreement was granted in June 2013. The permits encompass much of the Valhalla and Yulleroo wet gas accumulations and the Ungani oil trend (see Figure 107 below). The State Agreement governs the exploration of the permits and associated development activities for at least 25 years, subject to certain rights of termination able to be exercised by the state, Buru and Mitsubishi.
The State Agreement provides for each of the permits covered by the agreement to be exempted until 31 January 2024 from the regulatory requirement to relinquish periodically 50% of the area of the permits, subject to meeting the exploration, appraisal and development obligations under the State Agreement. This provides Buru and Mitsubishi with a significant extension to the existing permit terms in which to explore, appraise and develop the resources in this area. Work programmes can be optimised by the flexibility given by the State Agreement to credit gas appraisal work on adjacent permits against ongoing statutory work commitments.
During the term of the State Agreement, Buru and Mitsubishi have committed to the continued exploration, appraisal and (if technically viable) development of the gas resources of the permits with the objective of delivering gas into the Western Australian domestic gas market. The State Agreement is targeting the delivery of at least 1,500PJ of gas into the domestic market over 25 years. Buru and Mitsubishi are required to submit a proposal for the development of a domestic gas project and pipeline by 30 June 2016. The State Agreement also provides a framework for the development of a future project to provide gas to an LNG facility in the Pilbara area once the domestic gas pipeline and project have been approved.
Figure 107: State Agreement Licences
Source: Buru Energy
The State Agreement was granted in June 2013
It provides for the permits to be exempted from the regulatory requirement to periodically relinquish 50% of the area of the permits, subject to meeting certain exploration, appraisal and development obligations

Australian Unconventional Oil & Gas September 2013 161
Gas Supply Agreement
Buru has a Gas Supply Agreement (GSA) with Alcoa to supply gas to Alcoa’s operations to the south of Perth. Buru has until 1 January 2015 (extendable by Alcoa to January 2018) to establish sufficient reserves to supply gas to Alcoa under the GSA. The GSA provides for Buru to deliver up to 500PJ of gas over 15 years to Alcoa. Pursuant to the GSA, Alcoa made a A$40m pre-payment to Buru’s predecessor ARC Energy for gas to be delivered, although A$20m was to be kept in escrow. In August 2013 Alcoa agreed to release A$20m from escrow (now at A$25m due to interest) to help fund Buru’s share of FY14 Laurel Formation appraisal costs. Should not enough gas be found, and the contract terminated, Buru must repay Alcoa in three equal annual payments.
Conventional
Ungani Field Petroleum Exploration and Production
The Ungani field was the first commercial oil discovery in the Canning Superbasin since the 1980s. The oil field was discovered in a dolomite reservoir in October 2011. Buru management believes the Ungani field contains 10MMbbl to 20MMbbl of oil. In December 2012 RISC assessed that the gross 2C contingent resources of the Ungani field was 9.9MMbbl of oil based on 2D seismic and flow test results. It assessed that there was a further ~6MMbbl of gross 2C contingent oil resources in the recently-discovered Ungani North field.
A 346km Yulleroo South 2D seismic survey was completed in September 2010. This survey firmed up existing prospects, and identified new leads and prospects, in the Jackaraoo and Ungani trends ahead of the 2011 drilling campaign, which led to the Ungani oil discovery. A large airborne gravity and magnetic survey was completed over the Ungani field and surrounding areas in December 2011. A 3D seismic survey to delineate the Ungani and Ungani North fields commenced in October 2012, but was quickly halted in response to reports of a possible Heritage site disturbance. Buru has just recommenced this survey, after reaching an agreement with the traditional owners covering future activities.
The Ungani-1 well was the third well in Buru’s 2011 exploration programme. The Ungani-1 well was side-tracked (Ungani-1ST1) after drilling problems were encountered. The wells are located in exploration permit EP 391. The Ungani-1ST1 well was drilled to a measured depth of 2,324m. The well was then flowed at varying choke sizes with a peak rate of 1,647bbl of fluid per day on a ½ inch choke with a flowing well head pressure of 18 psi. Analysis of the oil recovered from the Ungani-1ST1 confirmed that the Ungani crude is a light, sweet crude of 37° API.
The Ungani-2 well was the fourth well in the 2011 exploration programme. The well was drilled as a deviated well from the Ungani-1ST1 well pad to a target bottom-hole location some 500m from the Ungani-1ST1 bottom-hole location. Wireline logs and pressure testing established a definitive oil/free water contact that gives an oil column in the Ungani-1ST1 well of 56m and 53m in the Ungani-2 well, both in a well-developed vugular dolomite reservoir. In both wells the dolomite reservoir with oil shows is considerably thicker than the oil column, with some 137m of dolomite reservoir developed in Ungani-2. This thickness of the high-quality reservoir is very encouraging for the potential for increasing the amount of oil that may be present at higher elevations on the structure.
The GSA provides for Buru to deliver up to 500PJ of gas over 15 years to Alcoa
RISC estimates gross 2C contingent oil resources of 9.9MMbbl for the Ungani field
Ungani-1ST1 well
Ungani-2 well

Australian Unconventional Oil & Gas September 2013 162
First sales of Ungani oil from an extended production test occurred within nine months of the discovery. Combined flow rates of in excess of 3,000bpd were measured from the two wells on test. The small quantities of produced oil (300bpd to 500bpd) from the test were trucked and sold to the BP refinery at Kwinana, near Perth, where it was refined for domestic consumption in Western Australia. Buru recently terminated the extended production test, citing its high cost and saying further analysis would be unlikely to improve the reservoir understanding.
The field is now progressing towards full-scale commercial development, with full-scale production targeted for 2014. Buru is currently acquiring a 243km2 Ungani 3D seismic survey over the field. The forward plan is to first work over the Ungani-1 and Ungani-2 wells to isolate the underlying water zone from the oil zone, and flow dry oil in a further extended production test. With the arrival of a new (Huisman LOC 400) rig in December 2013, a further vertical appraisal well (Ungani-3) is planned to be drilled.
The results of the seismic, EPTs and appraisal wells will be used to finalise a development plan. We believe the plan is likely to include drilling two or three horizontal wells and a water injection well to maximise reservoir drainage and field economics. Full production will require the issue of a Production Licence by the Western Australian DMP. Once a licence has been issued, it is planned that production will initially be 3,000bpd of oil. Negotiations are underway to export oil through a northern port. Once the export facility is completed, production will be ramped up to the estimated maximum sustainable production rate of 5,000bpd.
Figure 108: Ungani Oilfield and Oil Trend
Source: Buru Energy
Ungani Oil Trend
We believe that the wider Ungani exploration trend should be able to deliver significant upside from identified leads and prospects. The immediate area of prospectivity is 120km long by 40km wide. In March 2012 a regional prospect review completed by Buru identified mean risked potential resources for the greater area in excess of 300MMbbl of oil (risked at 10%) across 20 leads and prospects.
Extended production test completed
Full-scale commercial development plans
Buru identified mean risked potential resources for the greater area in excess of 300MMbbl of oil

Australian Unconventional Oil & Gas September 2013 163
Located in permit EP 391, 6km to the north of the Ungani production facility, Ungani North-1 was the first exploration well to follow up on the Ungani oil discovery. Drilled on a large dip-closed structure, it was targeting oil in the Grant and Anderson formations, and conventional and unconventional gas in the Laurel Formation. The well was completed in December 2012.
The well showed similar geology to Ungani, but the section was thicker, with thicker sealing shale over the Ungani Dolomite and a 46m oil column at the top of a larger dolomite reservoir section than is present at Ungani. However, the reservoir did not have as well developed porosity, which could give lower flow rates. There were also several strong oil and gas shows in the Nullara Formation below the Ungani Dolomite, in a section that was not encountered in the basin before. This section appears gas-saturated, with strong indications of oil. If these zones flow at commercial rates, this will be a conventional gas discovery. This result has identified the potential for a new conventional gas play, which may be present as an exploration target for 100km along the southern margin of the basin.
In the next 12 months Buru, and JV partner Mitsubishi plan to shoot additional 2D seismic along the Ungani Trend once the 243km2 Ungani 3D seismic survey is completed. After this seismic has been shot and processed, they plan to drill up to four of the better prospects.
Blina and Sundown Oilfields
The company produces oil from the Blina and Sundown oil field complex, contained within production licences L6 & L8. These fields are in natural decline. The fields were shut in during the March 2013 quarter. Oil sales only averaged 39bpd for the previous quarter.
Pictor Oil and Gas Province
The original Pictor oil and gas find was made in 1982. Wells Pictor-1 and Pictor-2 encountered oil and gas accumulations in the Nita Formation, which lies unconformably above the Goldwyer Shale (from which the hydrocarbons were sourced).
The Pictor East-1 well was drilled in 2011, in exploration permit EP 431 (Buru: 50%, MC: 50%). It was drilled to follow up on the oil and gas accumulations identified in the Nita Formation, and to test the deeper Acacia Sandstone Formation. It encountered a significant hydrocarbon column of over 65m in the Nita Formation, with a net porous section of over 7m.
Ungani North-1 confirmed the geological model of the area
A deeper gas-saturated section has identified a new conventional gas play
Future exploration work programme
Pictor East-1 well

Australian Unconventional Oil & Gas September 2013 164
Unconventional — Laurel Formation
Basin-Centred Gas Accumulation
The Laurel Formation accumulation is a thick, regionally extensive package of sands, shales and limestones with gas saturations over intervals of up to 2,000m. Tight gas resources were identified by previous drilling in the basin, with the characteristics of an unconventional basin-centred gas accumulation (BCGA). The gas is sweet (no H2S), with low CO2 and high liquids content. Management believes that well logs, sidewall core samples and tight rock analysis support the interpretation of the presence of a continuous gas accumulation in the Fitzroy Trough. It points to the Canadian Montney and US Granite Wash tight gas plays as being the most appropriate analogues for the Laurel Formation tight gas play.
In 2011 RISC estimated that the gross area containing the Laurel accumulation BCGA on Buru’s permits was 17,373km2 (4.3m acres). It assessed that Buru had net best estimate (P50) prospective resources of 47Tcf of gas and 1,177MMbbl of condensate (not including hydrocarbon liquids (LPG)) in the Laurel Formation tight gas accumulation across the permits it then held.
Buru management believes that the proposed Great Northern pipeline is underpinned by the potential reserves of the Yulleroo field. The feasibility of extending the pipeline to the Valhalla area to fast track the commercialisation of this resource is also being evaluated.
Figure 109: Interpretation of Extent of Laurel Formation Accumulation
Source: Buru Energy
Valhalla Accumulation
The Valhalla accumulation is a large BCGA. Several wells have been drilled to define its extent. It potentially extends across exploration permits EP 371 and EP 428 and application areas L 10-7, L 10-8 and L 11-1. In May 2012 McDaniel and Associates independently verified gross mean prospective resources of more than 15Tcf of recoverable gas and 432MMbbl of recoverable liquids in these licences (ie, excluding the more recently acquired EP 457 & 458). On a risked basis the mean gross prospective resources are 6.5Tcf of gas and 187MMbbl of hydrocarbon liquids.
The Laurel Formation has the characteristics of an unconventional Basin-Centred Gas Accumulation

Australian Unconventional Oil & Gas September 2013 165
Figure 110: Valhalla Accumulation Wells
Source: Buru Energy
The Valhalla-1 well, in exploration permit EP 371, was drilled by ARC in 2007 and had numerous reported oil and gas shows. Paradise-1 is located in EP 428 on the boundary with EP 371. It was drilled in late 2010 to 1,700m, and was further deepened in 2012. Gas shows were encountered throughout the drilling of the target Laurel Formation. During preparations for abandonment live oil was recovered to surface before the well was suspended to allow for further testing and evaluation of the oil zone.
The Valhalla-2 well was drilled by Buru and Mitsubishi Corporation as part of their unconventional petroleum joint venture. Drilling of Valhalla-2 was completed in July 2011. During drilling gas influxes were continuously encountered in the Laurel Formation, from 2,300m to a total depth of 3,390m. The well confirmed that the structure contains a number of tight, and possibly conventional, gas reservoirs across a >1,300m section of gas-charged Laurel Formation. A possible new conventional play type was identified in the Laurel carbonates, with management interpreting a number of potentially productive conventional reservoir zones.
Valhalla North-1 in EP 371 (Buru: 50%, MC: 50%), was drilled off-structure from Valhalla-2 to confirm that the gas was part of a basin-centred wet gas accumulation.
The Asgard-1 well (EP 371, Buru: 50%, MC: 50%) was drilled 35km to the south-east of the Valhalla-1 well. It provided further confirmation of the extent of the BCGA, 35km along-strike from the Valhalla wells and the Ungani North-1 well. During drilling gas shows increasing with depth were encountered from the top of the Upper Laurel clastics, at 1,919m depth, to a total depth of 3,524m. These shows were similar to those encountered in Valhalla North-1, with similar gas wetness ratios and heavier hydrocarbon indications.
Over the next 12 months Buru and JV partner Mitsubishi plan to hydro-fracture various zones and flow test the already drilled Valhalla-2, Valhalla North-1 and Asgaard-1 wells.
Valhalla-1 and Paradise-1 wells
Valhalla-2 well
Valhalla North-1 well
Asgard-1 well
Future work programme

Australian Unconventional Oil & Gas September 2013 166
Yulleroo Field
We believe the Yulleroo field is also part of a broad BCGA. Four wells have identified a large, tight wet gas resource. In 2013 RISC estimated that Buru had net best estimate prospective resources in the Yulleroo region of 6.6Tcf of gas and 160MMbbl of condensate. Now the Yulleroo-4 well has been completed, the company is assessing how much of these prospective resources can be classified as contingent resources.
The Yulleroo wet gas accumulation was identified by the Yulleroo-1 well in 1967. This tested gas at low rates from a substantial gas column in the Laurel Formation. The Yulleroo-2 well was drilled in 2008 by ARC Energy, and recorded strong gas shows at the same stratigraphic levels. The Yulleroo-2 well was not tested by ARC Energy due to mechanical difficulties with the rig at the time of drilling. Buru performed a reservoir stimulation programme in 2010. Three zones at 3,100m, 2,980m and 2,850m were stimulated with slickwater hydro-fractures. The well flowed back gas and condensate at low rates, together with stimulation fluid. However, a stabilised flow rate was not established. The gas quality was good, with a significant liquid content (10% LPG) and contained negligible H2S and CO2.
The results of the Yulleroo-2 well stimulation gave Buru the confidence to shoot 3D seismic over the basin. The Yulleroo 185km2 3D seismic was shot in 2011 to better define the structure.
The results of the survey were used to site the Yulleroo-3 well (EP 391, Buru: 50%, MC: 50%). It was drilled in 2012 to determine the lateral extent, reservoir development and the hydrocarbon column. There were strong gas shows from 2,130m to the final total depth of 3,712m, including over a 1,000m of gas charge section above the previously interpreted top of the gas sands in Yulleroo-1. A package of sands with conventional reservoir properties was also identified at 3,200m. There was good stratigraphic correlation with the Laurel section in Yulleroo-1, 2km away. The gas wetness ratios and inferred pressure data were interpreted as being indicative of the accumulation being part of a broad BCGA, similar to Buru’s Valhalla gas accumulation.
Buru drilled the Yulleroo-4 well (EP 436, Buru: 50%, MC: 50%) to delineate the accumulation further. The well spud in January 2013. Gas shows were encountered over a total interval of 1,686m from the Lower Anderson Formation to a total depth of 3,846m in the Lower Laurel Formation. Several sands that were encountered will be evaluated by analysis of the well log and sidewall cores. No flow tests are planned.
Over the next 12 months Buru, and JV partner Mitsubishi plan to hydro-fracture various zones and flow test the already drilled Yulleroo-3 and Yulleroo-4 wells.
RISC gave best estimate prospective resources of 6.6Tcf net to Buru for the Yulleroo regional area in 2013
Yulleroo-1 and -2 wells
Yulleroo 3D seismic
Yulleroo-3 well
Figure 111: Drilling of Yulleroo-3
Source: Buru Energy
Yulleroo-4 well
Future work programme

Australian Unconventional Oil & Gas September 2013 167
Unconventional — Goldwyer Shale
The Goldwyer Shale is a rich regional source rock underlying much of the Canning Basin. In June 2013 Advanced Resources International (ARI) assessed the shale gas resources of the Goldwyer Shale3. It estimated that risked technically recoverable gas resources were 235Tcf and risked recoverable liquid resources were 9.75Bbbl. The Goldwyer Formation is thermally immature and oil-prone in most petroleum wells on the uplifted platforms and terraces, but likely mature in the adjacent deep troughs. It identified a prospective area in the Fitzroy Trough in the northern portion of the Canning Basin where the Goldwyer Formation source rocks are thick, deep and thermally mature. It thought an estimated 42,500 square miles1 may be prospective for shale gas development in the Fitzroy, Gregory and Kidson troughs.
The Middle Ordovician Goldwyer Formation conformably overlies the Lower Ordovician Willara Formation. The Goldwyer was deposited mainly in open marine to intertidal conditions. Highly fossiliferous, it varies from mudstone-dominated in basinal areas to limestone-dominated in some platform and terrace areas. The Goldwyer Formation averages about 400m thick. The reported maximum thickness is 736m in the Willara-1 well in the Willara Sub-basin.
The Goldwyer Formation is dominated by mudstone and carbonate, with ratios of these components varying widely across the basin. The colour ranges from grey-green to black, indicating anoxic conditions. Major carbonate build ups are present locally, but have low permeability due to secondary mineralisation. Kukersite is locally abundant in the Upper Goldwyer Formation, with lesser abundance in lower parts of the formation. Furthermore, the Goldwyer contains horizons with high concentrations of the marine algae Gloeocapsomorpha sp, which has excellent source rock potential.
Selected TOC in the Goldwyer Formation generally ranges from 1% to 5% (mean 3%), with some values in excess of 10%. The upper member of the Goldwyer is particularly rich, with TOC of 0.46% to 6.40%, nearly all of which originated from cyanobacteria. Rock-Eval pyrolysis indicates that source rocks from the Upper Goldwyer have the capacity to generate 12kg of hydrocarbons per tonne. Buru’s modelling indicates the section is oil to wet gas mature over Buru's acreage and dry gas mature in the central part of the Kidson Sub-basin, where the Goldwyer deepens to over 6km. It is buried too deeply in the Fitzroy Trough to be prospective. We believe the above lithology and thermal maturity mean that the Goldwyer Shale has strong similarities with the Utica in Ohio and the Marcellus in Pennsylvania.
The Cyrene-1 well (Buru & MC: 75%, Key Petroleum: 20% and operator, Indigo Oil: 5%) was drilled in EP 438 to test the conventional Cyrene structure and to evaluate the Goldwyer Shale. In March 2013 Buru announced that while the conventional structure had no flow from a DST, the Goldwyer Shale was encountered as prognosed and several cores were taken through the section. Strong indications of oil were noted in the Cyrene cores, consistent with Buru’s interpretation that the Goldwyer Shale is in the oil window at the Cyrene location.
3 Technically Recoverable Shale Oil and Shale Gas Resources: EIA, June 2013
The Goldwyer Shale is present over the majority of the Canning Basin
The Goldwyer Formation averages about 400m thick
The Goldwyer Formation is dominated by mudstone and carbonate
Total Organic Carbon in the Goldwyer Formation generally ranges from 1% to 5%
Cyrene-1 well
Australian Unconventional Oil & Gas September 2013 168
Valuation
We estimate that the current fair value of Buru’s share price is A$2.04, which is 23% above its A$1.67 price on 28 August 2013. We outline our key assumptions behind this NAV-based fair value estimate below.
Key NAV Assumptions
For Our Current Fair Value Estimate
We have assumed that Buru has net 2C contingent oil resources of 8MMbbl in its Ungani (gross 10MMbbl) and Ungani North (gross 6MMbbl) fields.
We have used a US$16.39/bbl NAV estimates for Ungani Trend 2C contingent oil resources. This is based on our model that assumes:
flat real Brent prices of US$90/bbl;
finding costs of US$3/bbl (Buru management estimates that A$20m was spent finding the 10MMbbl Ungani field);
development costs of US$10/bbl (management estimates it will cost ~A$92m to develop the 10MMbbl Ungani field);
a 10% state royalty rate, PRRT @ 40% and a corporation tax rate @ 30%;
transport costs of US$15/bbl; and
other operating costs of US$10/bbl;
We have assumed a FY14 conventional petroleum work programme costing A$42m, as per Buru management guidance in its August 2013 capital raising.
We have valued Buru’s Laurel Formation interest by multiplying the 4.3m acres that RISC consultants assessed were prospective by its 50% equity interest and a US$100/acre multiple. This multiple reflects the early stage of the appraisal programme. Should Buru’s five Laurel Formation flow tests planned for next year show highly commercial flow rates/EURs, we would increase this multiple dramatically.
We have valued the rest of Buru’s unconventional acreage at US$10/acre. This is roughly equivalent to the initial valuation placed on the whole of Buru’s acreage by Mitsubishi when it farmed in.
We have added A$27.5m of carry by Mitsubishi. In August 2013 Mitsubishi agreed to fund A$27.5m worth of Buru’s share of Ungani oil field development costs. In return Mitsubishi was relieved of an earlier (farm-in) commitment to fund A$50m worth of infrastructure.
Buru had cash of A$45.4m at 30 June 2013. We have added the A$35m proceeds from the August 2013 institutional share placing and increased the number of its shares accordingly.
We estimated the value of Buru’s G&A expense by annualising the addition of its 1H13 G&A expense (US$5.0m), and putting the result over our real 7.5% discount rate (roughly equivalent to a nominal 10% discount rate).
Other assumptions can be seen in Table 57.

Australian Unconventional Oil & Gas September 2013 169
Table 57: Buru Energy Estimated Net Asset Value per Share
Net Oil and Gas NPV
Unrisked NPV Pg Pd
Risked NPV
Risked NPV
Reserves/Resources (MMboe) (US$/boe) (US$m) (%) (%) (US$m) (A¢/share)
Ungani Oil Trend
Oil 2P reserves 0.0 27.61 - 100% 100% - 0.0
Oil 2C resources 8.0 16.39 131 100% 90% 118 44.0
Total Oil Business 8.0 131 118 44.0
FY14 Work Programme
Ungani Oil Trend exploration 20.0 16.39 328 25% 90% 74 27.5
Work Programme 20.0 328 74 27.5
Total Above 28.0 459 192 71.5
Unconventional Business
Laurel Formation 215 80.2
Other Canning Basin acreage 205 76.4
Total Above 611 228.1
Other Value adjustments
Jun13 net cash + Aug13 share placement 73 27.0
FY14 Exploration expenditure (42) (15.7)
Mitsubishi future carry 25 9.2
Capitalised G&A cost (121) (44.8)
Options 1 0.4
Buru Total fully diluted NAV 548 204.4
Current issued shares 293.5
Options 2.5
Current fully diluted shares 295.9
Source: Company data, RFC Ambrian estimates
Acreage and Resource Multiples
Our fair value would place Buru on an EV/acre multiple of US$32/acre. Buru was assessed by RISC consultants to have net best estimate (P50) prospective resources of 47Tcf of gas and 1.2Bbbl of condensate (roughly 9.0Bboe in total) in the Laurel Formation tight gas accumulation across the permits it held in 2011. Our fair value estimate would place Buru on an EV/prospective resource multiple of US$0.06/boe based on this assessment.
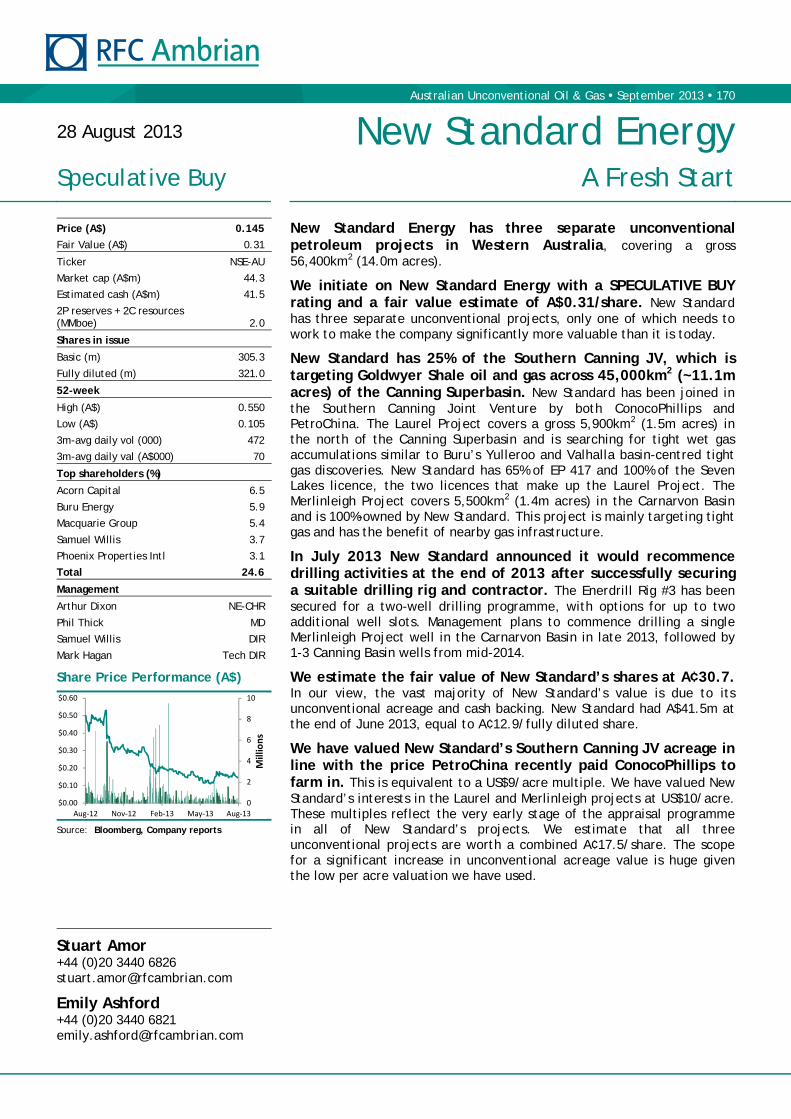
Australian Unconventional Oil & Gas September 2013 170
New Standard Energy has three separate unconventional petroleum projects in Western Australia, covering a gross 56,400km2 (14.0m acres).
We initiate on New Standard Energy with a SPECULATIVE BUY rating and a fair value estimate of A$0.31/share. New Standard has three separate unconventional projects, only one of which needs to work to make the company significantly more valuable than it is today.
New Standard has 25% of the Southern Canning JV, which is targeting Goldwyer Shale oil and gas across 45,000km2 (~11.1m acres) of the Canning Superbasin. New Standard has been joined in the Southern Canning Joint Venture by both ConocoPhillips and PetroChina. The Laurel Project covers a gross 5,900km2 (1.5m acres) in the north of the Canning Superbasin and is searching for tight wet gas accumulations similar to Buru’s Yulleroo and Valhalla basin-centred tight gas discoveries. New Standard has 65% of EP 417 and 100% of the Seven Lakes licence, the two licences that make up the Laurel Project. The Merlinleigh Project covers 5,500km2 (1.4m acres) in the Carnarvon Basin and is 100%-owned by New Standard. This project is mainly targeting tight gas and has the benefit of nearby gas infrastructure.
In July 2013 New Standard announced it would recommence drilling activities at the end of 2013 after successfully securing a suitable drilling rig and contractor. The Enerdrill Rig #3 has been secured for a two-well drilling programme, with options for up to two additional well slots. Management plans to commence drilling a single Merlinleigh Project well in the Carnarvon Basin in late 2013, followed by 1-3 Canning Basin wells from mid-2014.
We estimate the fair value of New Standard’s shares at A¢30.7. In our view, the vast majority of New Standard’s value is due to its unconventional acreage and cash backing. New Standard had A$41.5m at the end of June 2013, equal to A¢12.9/fully diluted share.
We have valued New Standard’s Southern Canning JV acreage in line with the price PetroChina recently paid ConocoPhillips to farm in. This is equivalent to a US$9/acre multiple. We have valued New Standard’s interests in the Laurel and Merlinleigh projects at US$10/acre. These multiples reflect the very early stage of the appraisal programme in all of New Standard’s projects. We estimate that all three unconventional projects are worth a combined A¢17.5/share. The scope for a significant increase in unconventional acreage value is huge given the low per acre valuation we have used.
28 August 2013 New Standard Energy
Speculative Buy A Fresh Start
Stuart Amor +44 (0)20 3440 6826 [email protected]
Emily Ashford +44 (0)20 3440 6821 [email protected]
Price (A$) 0.145
Fair Value (A$) 0.31
Ticker NSE-AU
Market cap (A$m) 44.3
Estimated cash (A$m) 41.5
2P reserves + 2C resources (MMboe) 2.0
Shares in issue
Basic (m) 305.3
Fully diluted (m) 321.0
52-week
High (A$) 0.550
Low (A$) 0.105
3m-avg daily vol (000) 472
3m-avg daily val (A$000) 70
Top shareholders (%)
Acorn Capital 6.5
Buru Energy 5.9
Macquarie Group 5.4
Samuel Willis 3.7
Phoenix Properties Intl 3.1
Total 24.6
Management
Arthur Dixon NE-CHR
Phil Thick MD
Samuel Willis DIR
Mark Hagan Tech DIR
Share Price Performance (A$)
Source: Bloomberg, Company reports
0
2
4
6
8
10
$0.00
$0.10
$0.20
$0.30
$0.40
$0.50
$0.60
Aug‐12 Nov‐12 Feb‐13 May‐13 Aug‐13
Millions

Australian Unconventional Oil & Gas September 2013 171
Investment Case
We are initiating on New Standard Energy with a SPECULATIVE BUY rating and a current fair value estimate of A$0.31/share. New Standard has three separate unconventional projects, only one of which needs to work to make the company significantly more valuable than it is today.
New Standard has 25% of the Southern Canning JV that is targeting Goldwyer Shale oil and gas across 45,000km2 (11.1m acres) of the Canning Superbasin. New Standard has been joined in the Southern Canning Joint Venture by both ConocoPhillips and PetroChina. The Laurel Project covers a gross 5,900km2 (1.5m acres) in the north of the Canning Superbasin and is searching for tight wet gas accumulations similar to Buru’s Yulleroo and Valhalla basin-centred tight gas discoveries. New Standard has 65% of EP 417 and 100% of the Seven Lakes licence, the two licences that make up the Laurel Project. The Merlinleigh Project covers 5,500km2 (1.4m acres) in the Carnarvon Basin and is 100%-owned by New Standard. This project is mainly targeting tight gas and has the benefit of nearby gas infrastructure.
We believe that New Standard is emerging from 12-18 months of operational difficulties that have seen its share price crushed. The shares are down ~80% from their March 2012 high. The difficulties started when the first Southern Canning JV well (Nicolay-1) ran well over budget (in the first phase of the Southern Canning JV farm-out, New Standard is liable for 100% of well costs over a certain cap) and found that the Goldwyer Shale TOC was low (<1%) at this location. This was compounded when New Standard let go of its drilling contractor whilst drilling the second well due to reliability, competence and safety concerns.
In March 2013 New Standard brought in a new Managing Director, Phil Thick, who we believe has the operational background to ensure the difficulties encountered over the last 12-18 months do not recur. He was previously at Shell for 20 years, and held roles in senior operations positions, covering logistics, transport terminals, engineering, contract negotiations and joint-venture partnerships.
In July 2013 New Standard announced that it would recommence drilling activities at the end of 2013, after successfully securing a suitable drilling rig and contractor. The Enerdrill Rig #3 has been secured for a two-well drilling programme with options for up to two additional well slots. Management plans to commence drilling a single Merlinleigh Project well in the Carnarvon Basin in late 2013, followed by 1 to 3 Canning Basin wells from mid-2014.
We estimate the fair value of New Standard’s shares at A¢30.7. In our view, the vast majority of New Standard’s value is due to its unconventional acreage and cash backing. New standard had A$41.5m at the end of June 2013, equal to A¢12.9/fully diluted share.
We have valued New Standard’s Southern Canning JV acreage in line with the price PetroChina recently paid ConocoPhillips to farm in. This is equivalent to a US$9/acre multiple. We have valued New Standard’s interests in the Laurel and Merlinleigh projects at US$10/acre. These multiples reflect the very early stage of the appraisal programme in all of New Standard’s projects. We estimate that all three unconventional projects are worth a combined A¢17.5/share. The scope for a significant increase in unconventional acreage value is huge given the low per acre valuation we have used.
We initiate with a SPECULATIVE BUY rating
Three main projects
Emerging from 12-18 months of operational difficulties
New Managing Director
Drilling to restart at the end of 2013
Fair value breakdown

Australian Unconventional Oil & Gas September 2013 172
Figure 112: New Standard Fair Value Breakdown
Source: RFC Ambrian estimates
Risks
New Standard Energy is subject to the usual risks that a junior upstream petroleum exploration and production company faces. These include: geological/technical, political/regulatory, commercial, operational, capital access, weather related and environmental.
The Canning Superbasin is prone to tropical storms from November to May each year. Moving rigs is often not possible over the unsealed roads in the region during this season. Thus, New Standard’s newsflow could dry up for several months a year.
Unconventional petroleum production is yet to be proved commercial in Australia. Should petroleum prices and flow rates from unconventional wells not be sufficient to give an economic return on the investment, Australia’s unconventional resources will not be developed. A key risk that is more specific to New Standard is that it may not be able to discover sufficient commercial gas reserves to justify building pipelines to major markets in Western Australia, potentially leaving the gas stranded.
Management
Mr Dixon has been Non-executive Chairman of the Board since May 2011. He is a 40-year oil and gas veteran with Shell, and has worked for more than 20 years in the LNG business. He has served on the boards of Australia LNG Ship Operating Company, Brunei LNG, Brunei Shell Tankers and Shell International Gas. He has considerable experience of working with joint-venture partners. He is also Chairman of the Australian Centre for Natural Gas Management.
Mr Thick was promoted to Managing Director of New Standard in March 2013, having joined the Board in mid-2012. Mr Thick is a Civil Engineer, who commenced his career in Perth with Alcoa before joining Shell in 1986. He worked for 20 years with Shell in the downstream business, both in Australia and overseas. He was one of four directors of Shell Australia, and held roles in senior operations positions, covering logistics, transport terminals, engineering, contract negotiations and joint-venture partnerships. After leaving Shell in 2006 he joined a number of boards, including one of Australia’s largest petrochemical businesses — Coogee — where he later became CEO.
Arthur Dixon — Non-executive Chairman
Phil Thick — Managing Director

Australian Unconventional Oil & Gas September 2013 173
Operations
New Standard has 14m gross acres across Western Australia. Its licences cover three main projects: the Southern Canning Joint Venture (previously known as the Goldwyer Project) in the Canning Superbasin, the Laurel Project (also in the Canning Superbasin) and the Merlinleigh Project in the Carnarvon Basin. New Standard also has a small interest in producing conventional assets in Colorado County, US, which provide a limited amount of revenue.
Figure 113: NSE’s Assets in Western Australia
Source: New Standard Energy
Unconventional
Canning Superbasin — Australia
New Standard has a gross licence position of 53,900km2 across the southern part of the Canning Superbasin. It has permit equities ranging from 25% to 65%, and operatorship in many of the key licences. Its acreage is divided into two main play types:
Goldwyer Formation unconventional shale oil and gas; and
Laurel Formation tight gas — an unconventional tight Basin-centred Gas Accumulation (BCGA) like both the Yulleroo tight wet gas and Valhalla tight wet gas accumulations.
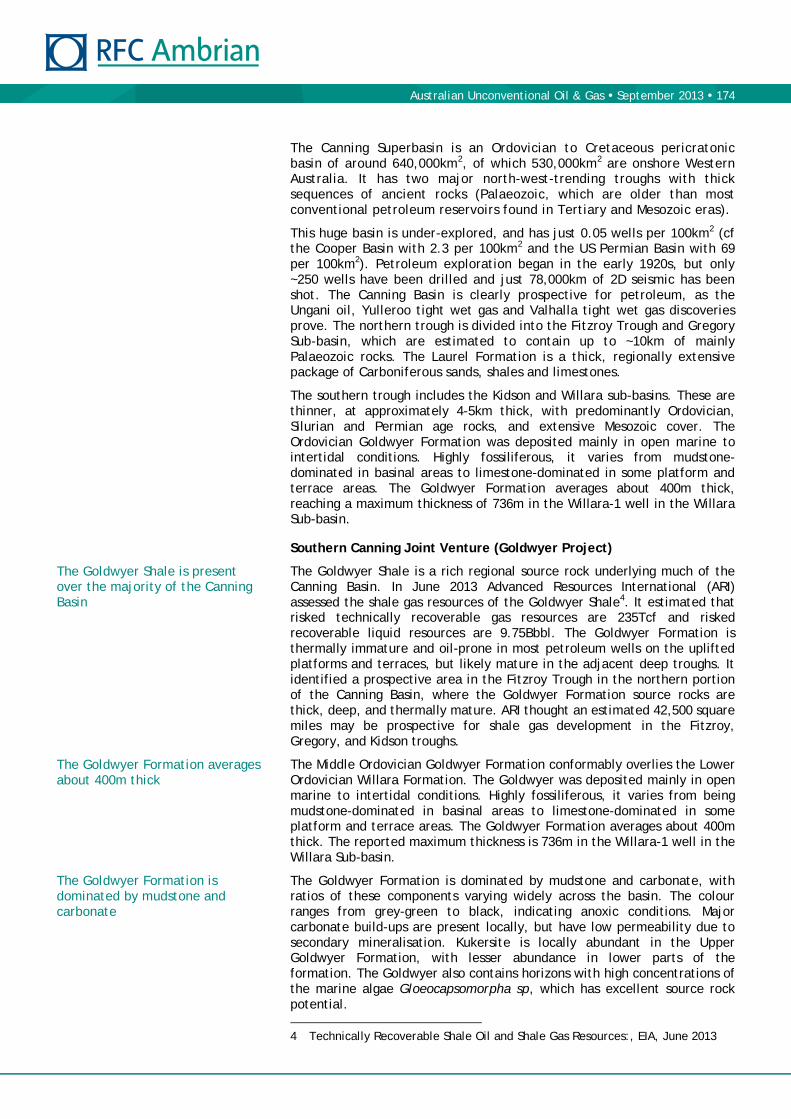
Australian Unconventional Oil & Gas September 2013 174
The Canning Superbasin is an Ordovician to Cretaceous pericratonic basin of around 640,000km2, of which 530,000km2 are onshore Western Australia. It has two major north-west-trending troughs with thick sequences of ancient rocks (Palaeozoic, which are older than most conventional petroleum reservoirs found in Tertiary and Mesozoic eras).
This huge basin is under-explored, and has just 0.05 wells per 100km2 (cf the Cooper Basin with 2.3 per 100km2 and the US Permian Basin with 69 per 100km2). Petroleum exploration began in the early 1920s, but only ~250 wells have been drilled and just 78,000km of 2D seismic has been shot. The Canning Basin is clearly prospective for petroleum, as the Ungani oil, Yulleroo tight wet gas and Valhalla tight wet gas discoveries prove. The northern trough is divided into the Fitzroy Trough and Gregory Sub-basin, which are estimated to contain up to ~10km of mainly Palaeozoic rocks. The Laurel Formation is a thick, regionally extensive package of Carboniferous sands, shales and limestones.
The southern trough includes the Kidson and Willara sub-basins. These are thinner, at approximately 4-5km thick, with predominantly Ordovician, Silurian and Permian age rocks, and extensive Mesozoic cover. The Ordovician Goldwyer Formation was deposited mainly in open marine to intertidal conditions. Highly fossiliferous, it varies from mudstone-dominated in basinal areas to limestone-dominated in some platform and terrace areas. The Goldwyer Formation averages about 400m thick, reaching a maximum thickness of 736m in the Willara-1 well in the Willara Sub-basin.
Southern Canning Joint Venture (Goldwyer Project)
The Goldwyer Shale is a rich regional source rock underlying much of the Canning Basin. In June 2013 Advanced Resources International (ARI) assessed the shale gas resources of the Goldwyer Shale4. It estimated that risked technically recoverable gas resources are 235Tcf and risked recoverable liquid resources are 9.75Bbbl. The Goldwyer Formation is thermally immature and oil-prone in most petroleum wells on the uplifted platforms and terraces, but likely mature in the adjacent deep troughs. It identified a prospective area in the Fitzroy Trough in the northern portion of the Canning Basin, where the Goldwyer Formation source rocks are thick, deep, and thermally mature. ARI thought an estimated 42,500 square miles may be prospective for shale gas development in the Fitzroy, Gregory, and Kidson troughs.
The Middle Ordovician Goldwyer Formation conformably overlies the Lower Ordovician Willara Formation. The Goldwyer was deposited mainly in open marine to intertidal conditions. Highly fossiliferous, it varies from being mudstone-dominated in basinal areas to limestone-dominated in some platform and terrace areas. The Goldwyer Formation averages about 400m thick. The reported maximum thickness is 736m in the Willara-1 well in the Willara Sub-basin.
The Goldwyer Formation is dominated by mudstone and carbonate, with ratios of these components varying widely across the basin. The colour ranges from grey-green to black, indicating anoxic conditions. Major carbonate build-ups are present locally, but have low permeability due to secondary mineralisation. Kukersite is locally abundant in the Upper Goldwyer Formation, with lesser abundance in lower parts of the formation. The Goldwyer also contains horizons with high concentrations of the marine algae Gloeocapsomorpha sp, which has excellent source rock potential. 4 Technically Recoverable Shale Oil and Shale Gas Resources:, EIA, June 2013
The Goldwyer Shale is present over the majority of the Canning Basin
The Goldwyer Formation averages about 400m thick
The Goldwyer Formation is dominated by mudstone and carbonate
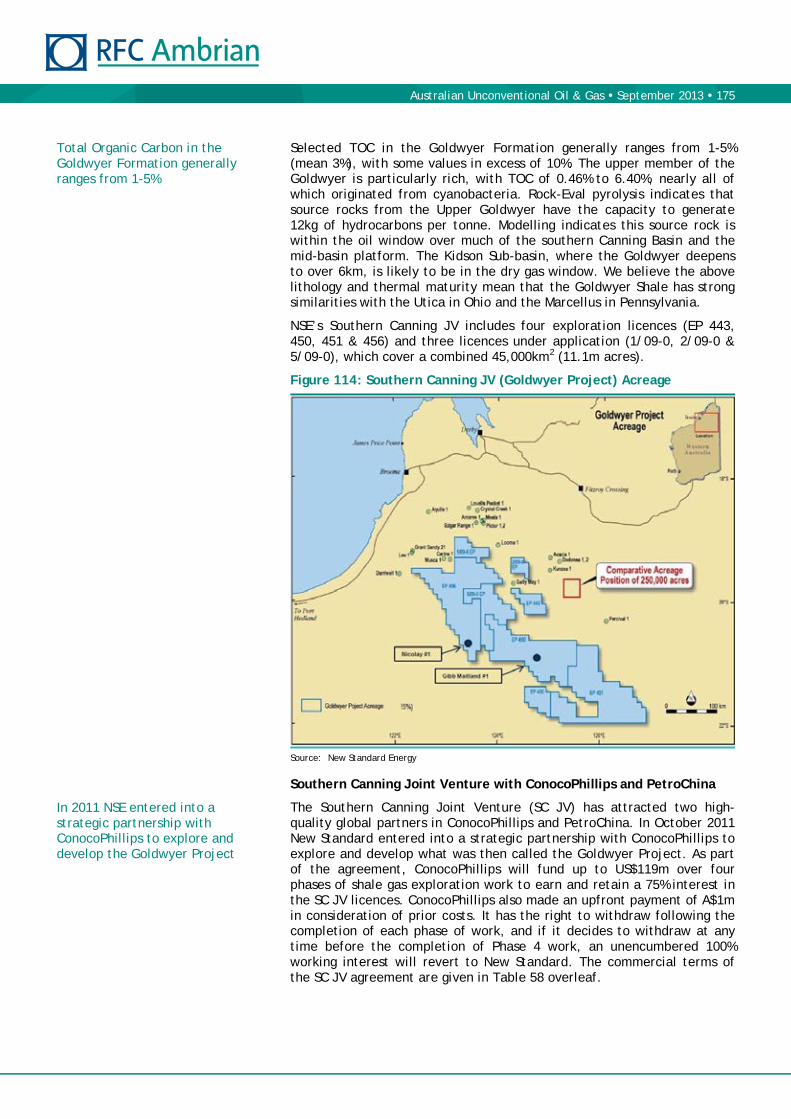
Australian Unconventional Oil & Gas September 2013 175
Selected TOC in the Goldwyer Formation generally ranges from 1-5% (mean 3%), with some values in excess of 10%. The upper member of the Goldwyer is particularly rich, with TOC of 0.46% to 6.40%, nearly all of which originated from cyanobacteria. Rock-Eval pyrolysis indicates that source rocks from the Upper Goldwyer have the capacity to generate 12kg of hydrocarbons per tonne. Modelling indicates this source rock is within the oil window over much of the southern Canning Basin and the mid-basin platform. The Kidson Sub-basin, where the Goldwyer deepens to over 6km, is likely to be in the dry gas window. We believe the above lithology and thermal maturity mean that the Goldwyer Shale has strong similarities with the Utica in Ohio and the Marcellus in Pennsylvania.
NSE’s Southern Canning JV includes four exploration licences (EP 443, 450, 451 & 456) and three licences under application (1/09-0, 2/09-0 & 5/09-0), which cover a combined 45,000km2 (11.1m acres).
Figure 114: Southern Canning JV (Goldwyer Project) Acreage
Source: New Standard Energy
Southern Canning Joint Venture with ConocoPhillips and PetroChina
The Southern Canning Joint Venture (SC JV) has attracted two high-quality global partners in ConocoPhillips and PetroChina. In October 2011 New Standard entered into a strategic partnership with ConocoPhillips to explore and develop what was then called the Goldwyer Project. As part of the agreement, ConocoPhillips will fund up to US$119m over four phases of shale gas exploration work to earn and retain a 75% interest in the SC JV licences. ConocoPhillips also made an upfront payment of A$1m in consideration of prior costs. It has the right to withdraw following the completion of each phase of work, and if it decides to withdraw at any time before the completion of Phase 4 work, an unencumbered 100% working interest will revert to New Standard. The commercial terms of the SC JV agreement are given in Table 58 overleaf.
Total Organic Carbon in the Goldwyer Formation generally ranges from 1-5%
In 2011 NSE entered into a strategic partnership with ConocoPhillips to explore and develop the Goldwyer Project

Australian Unconventional Oil & Gas September 2013 176
In February 2013 PetroChina entered the agreement by purchasing a 29% interest in the joint venture from ConocoPhillips for an upfront fee of approximately US$29m as part of a larger global arrangement that also involved shale gas in the Sichuan Basin in China, and a stake in Conoco’s Browse Project.
Table 58: Commercial Terms and Original Timeline of the SC JV Agreement
Phase 1 Phase 2 Phase 3 Phase 4
Working interest NSE 25% (operator) COP 46%
PetroChina 29%
NSE 25% (operator) COP 46%
PetroChina 29%
NSE 25% (operator) COP 46%
PetroChina 29%
NSE 25% (operator) COP 46%
PetroChina 29%
Indicative timing 2012 2013 2014 2015
Work programme Drilling 3 vertical wells, coring and logging.
Completing detailed core lab analysis.
Undertaking formation evaluation tests on each
well.
Drilling, logging, coring, stimulating and testing 1
horizontal well; or
drilling 2 additional vertical wells and
completing detailed core lab analysis; or
alternative exploration activities of equal or
greater value.
Drilling, logging, coring, stimulating and testing 1
horizontal well; or
drilling 2 additional vertical wells and
completing detailed core lab analysis; or
alternative exploration activities of equal or
greater value.
COP is to fund 100% of the cost of a pilot
development programme; being the drilling, logging,
coring, stimulating and flow testing of 2
additional horizontal wells.
Expenditure cap US$39m (US$13m per well)
US$20m US$20m US$40m
Excess expenditure NSE 100% (drilling) NSE 25% (other)
NSE 25% NSE 25% NSE 25%
Source: New Standard
Phase 1 of the SC JV Project is already running well behind schedule. Under the original plan, three wells were due to be drilled, cored and logged in 2012. However, only one well has been drilled, cored and logged to date. This is partly because the first well (Nicolay-1) was only spud in August 2012. Problems with drilling the second well (Gibb Maitland-1) have also led to significant delays. Indeed, NSE, as operator of the SC JV, terminated the JV drilling contract in February 2013 over safety concerns, and is currently looking for a new rig/contractor to complete the Phase 1 drilling programme.
The Nicolay-1 well, on licence EP 456, was spud in August 2012 as the first well in the Phase 1 programme. It was the first modern exploration well drilled to depth in the southern Kidson Sub-basin. Its primary target was to gather data for the Goldwyer Formation, with a programme of mud logging, coring and electric wireline logs. Secondary targets were the overlying Bongabinni and Nita formations. It was drilled to a total depth of 3,564m.
Mudlogs and wireline log analysis showed potential hydrocarbon indicators over intervals of greater than 350m. There were elevated gas readings of between 2.0-4.6% total gas through gassy sections of the Goldwyer Formation. Elevated gas readings were also present in the underlying Willara Formation limestones and shales, with a maximum total gas of 6%. Thermal maturity and well temperature data results suggest the Goldwyer Formation has reached the late-oil window to the wet-gas window at the Nicolay-1 well location. However, TOC measurements were lower than anticipated; final TOC content data of up to 0.8% was recorded for the Goldwyer Shale at this location, whilst the shales and shaley limestones of the Willara Formation recorded TOC values of up to 1%. These shales have clearly generated gas, but the TOC values are lower than typical producing shale gas reservoirs in the US. The preliminary wireline log analysis indicates that a potential gas in place (GIP) of 18Bcf/km2 can be attributed to the Goldwyer Formation at the Nicolay-1 well location, although we think the gas is unlikely to be able to be produced at commercial rates at this location.
In February 2013 PetroChina also entered the agreement
Nicolay-1 well

Australian Unconventional Oil & Gas September 2013 177
The second well in Phase 1, Gibb Maitland-1 was spud in December 2012 on licence EP 450. The well is located on the northern slope in the central part of the Kidson Sub-basin. It is down-dip from shallower historic wells with oil shows, such as Acacia-1, Sally May-1 and Percival-1, and up-dip from deeper wells with dry gas, such as Kidson-1 and Patience-2. NSE’s geological models suggest the depositional environment is likely to be more favourable, with the potential to host richer TOC levels than the Nicolay-1 well location. The northern Kidson Sub-basin is interpreted to have evolved from a more restricted marine environment than the western margin of the Kidson Sub-basin.
Figure 115: Cross Section of the Kidson Trough with Well Locations and Expected Hydrocarbon Migrations
Source: New Standard Energy
The well was drilled to 2,894m before complications arose. The drill pipe and bottom-hole assembly became stuck in the well bore during operations to pull out of the hole to change the drill bit. Despite this, elevated background gas was encountered at depth (below 2,700m), including a wet gas signature. The significance of these hydrocarbons could not be confirmed due to the drilling problems experienced prior to electric wireline data being acquired. A sidetrack operation was planned to commence from a depth of 900m in order to get around the equipment stuck in the wellbore, but reliability, competence and safety problems with the rig resulted in the drilling contract being terminated.
The third well in the Phase 1 programme was initially planned to be the Blatchford-1 well, located in the eastern flank of the Kidson Sub-basin. This location is now under review as part of a major rework of previous data and seismic and the data gained from the previous two wells. Thus, the final third well location is yet to be determined.
Gibb Maitland-1 well
Third well

Australian Unconventional Oil & Gas September 2013 178
Laurel Project
Figure 116: Laurel Project Licence Location
Source: New Standard Energy
NSE’s Laurel Project comprises two licences that are located south-east of the Fitzroy Crossing, on the same trend as Buru’s Valhalla and Yulleroo BCGAs. Having bought Green Rock’s farm-in interest back, NSE now has a 65% interest in EP 417 (covering 3,150km2) and a 100% interest in the Seven Lakes acreage (STP-SPA-0017 covering 2,750km2). Management estimates that gas in place (GIP) in the Laurel Formation on these licences could range from 50-150Tcf. Within EP 417 it has identified two BCGA prospects (Lawford Creek and Spinifex), which each have GIP of between 0.6–1.2Tcf.
The Laurel Formation accumulation is a thick, regionally extensive package of sands, shales and limestones with gas saturations over intervals of up to 2,000m. Buru has identified significant gas resources, with the characteristics of an unconventional Basin-centred Gas Accumulation (BCGA) at Valhalla and Yulleroo. The gas found by Buru to the north-west is sweet, with low CO2 content, no H2S and high liquids content.
Laurel Project Joint Venture with Buru Energy
In August 2008 Buru Energy farmed into a 35% interest in EP 417, leaving New Standard with a 65% operated interest in the licence. In March 2011 Green Rock agreed to farm in to a 15% interest in EP 417 by paying NSE A$750,000 in back costs and contributing 27.5% of the costs of drilling, coring, hydraulic stimulation, flow testing and planned completion of the Lawford-1 well. Green Rock also committed to fund 22.5% of the costs of a second well to earn an additional 5%. However, in March 2013 Green Rock relinquished its rights in EP 417 and the Seven Lakes acreage to New Standard for A$1.65m.
Management estimates that GIP could range from 50–150Tcf
The Laurel Formation has the characteristics of an unconventional Basin-centred Gas Accumulation
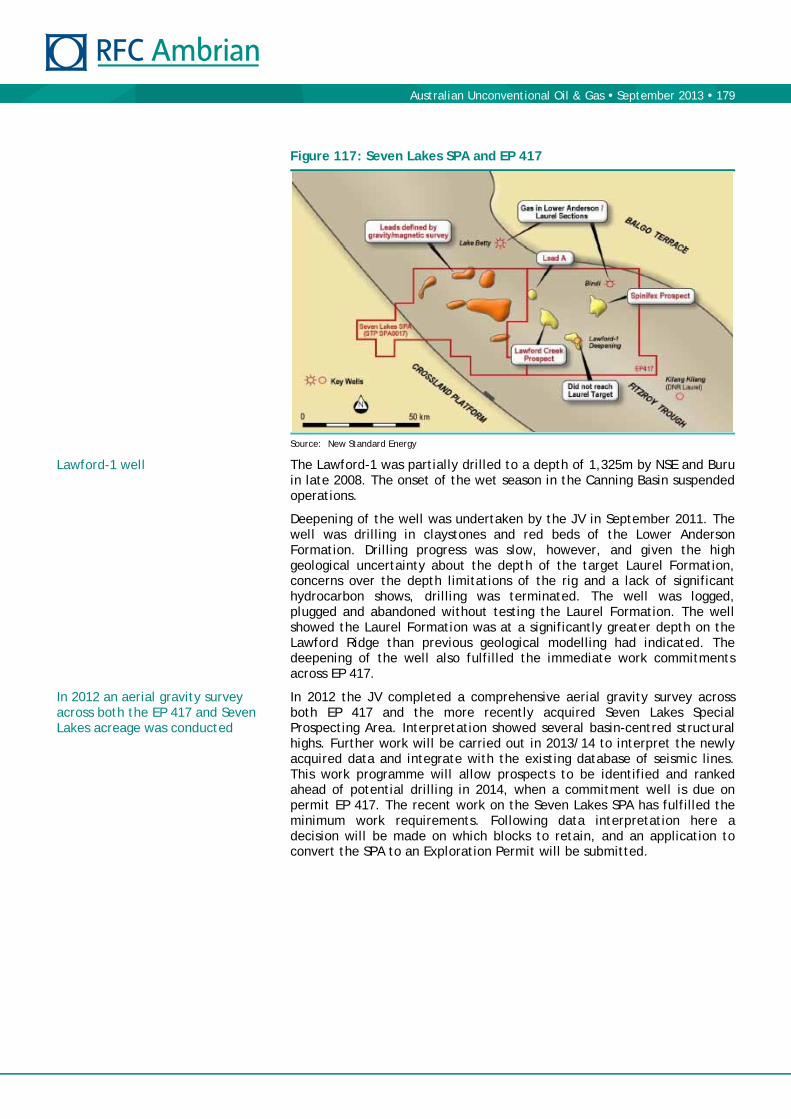
Australian Unconventional Oil & Gas September 2013 179
Figure 117: Seven Lakes SPA and EP 417
Source: New Standard Energy
The Lawford-1 was partially drilled to a depth of 1,325m by NSE and Buru in late 2008. The onset of the wet season in the Canning Basin suspended operations.
Deepening of the well was undertaken by the JV in September 2011. The well was drilling in claystones and red beds of the Lower Anderson Formation. Drilling progress was slow, however, and given the high geological uncertainty about the depth of the target Laurel Formation, concerns over the depth limitations of the rig and a lack of significant hydrocarbon shows, drilling was terminated. The well was logged, plugged and abandoned without testing the Laurel Formation. The well showed the Laurel Formation was at a significantly greater depth on the Lawford Ridge than previous geological modelling had indicated. The deepening of the well also fulfilled the immediate work commitments across EP 417.
In 2012 the JV completed a comprehensive aerial gravity survey across both EP 417 and the more recently acquired Seven Lakes Special Prospecting Area. Interpretation showed several basin-centred structural highs. Further work will be carried out in 2013/14 to interpret the newly acquired data and integrate with the existing database of seismic lines. This work programme will allow prospects to be identified and ranked ahead of potential drilling in 2014, when a commitment well is due on permit EP 417. The recent work on the Seven Lakes SPA has fulfilled the minimum work requirements. Following data interpretation here a decision will be made on which blocks to retain, and an application to convert the SPA to an Exploration Permit will be submitted.
Lawford-1 well
In 2012 an aerial gravity survey across both the EP 417 and Seven Lakes acreage was conducted

Australian Unconventional Oil & Gas September 2013 180
Carnarvon Basin — Australia
The Carnarvon Basin is an epicratonic, faulted and folded basin on the north-west coast of Western Australia. Onshore it covers around 115,000km2 and offshore 535,000km2, and is divided into the North and South Basins. The Northern Basin comprises up to 15km of largely Mesozoic sediment, while the Southern Basin contains up to 7km of Palaeozoic sediment.
With around 75 wells drilled onshore to date (including the 1950s stratigraphic tests), the onshore well density is just 0.07 per 100km2. This compares with 0.05 wells per 100km2 in the Canning Basin, 2.3 per 100km2 in the Cooper Basin and 69 per 100km2 in the US Permian Basin.
New Standard’s acreage is in the Merlinleigh Sub-basin on the margin of the southern Carnarvon Basin. It is an elongated half-graben, 100km by 250km, with a steep, faulted western margin, and a dip slope eastern margin. It contains up to 8km of predominantly Permo-Carboniferous sediments, with a thin Mesozoic covering, which thickens to the north and west. Faults generally trend north and north-westerly.
There are Early Permian organic rich shales of the Byro and Wooramel groups, which have good source potential, and are mature for oil and gas generation across most of the basin:
The Byro Group marine shale contains several thick, rich sub-intervals of black shales that are mature for hydrocarbon generation. Two — the Bulgadoo and Coyrie formations — are good candidates for shale gas production. TOC averages 4%, but individual samples have recorded TOC up to 19%.
The Wooramel Group has prospective source rocks interbedded with potential reservoir sandstones. The average TOC is 4%, ranging up to 16%.
The Merlinleigh Sub-basin is a frontier area for petroleum exploration. Drilled in 1966-67, the Kennedy Range-1 well tested the deeper basinal centre. It was drilled to 2,227m, and penetrated all units in the Kennedy, Byro and Wooramel groups. It encountered gas shows throughout tight sands and a thick shale sequence, but was deemed uncommercial. It is possible the well was drilled in a fault zone where diagenesis from circulating fluids degraded the regionally good reservoir quality.
During the 1980s Esso recorded over 2,000km of 2D seismic data. It also drilled two stratigraphic wells — Burna-1 and Quail-1 — in 1982-84, but both were dry, reportedly due to a lack of seal.
Merlinleigh Project
New Standard secured the Merlinleigh Project in the onshore Carnarvon Basin in Western Australia in 2010. It has a 100% interest in two licences in the Merlinleigh Sub-basin (Blocks EP 481 & 482), with a gross acreage of 5,500km2. They are adjacent to the Dampier to Bunbury Natural Gas Pipeline, which supplies gas to industrial, mining and domestic customers in Western Australia. The targets are primarily gas, but evidence for liquids potential also exists. We believe that the licences contain good potential for both unconventional tight gas resources and unconventional shale gas resources. Where the purported sandstone reservoirs are not tight, conventional gas fields may exist. In March 2013 an independent scoping study estimated that there is 23Tcf shale gas in place in mature shales over an area of 770km2. Figure 119 overleaf shows the major focus area for potential shale gas and BCGA resources in orange, and the four main conventional and/or tight gas reservoir targets in red.
Figure 118: Stratigraphy
Source: New Standard Energy
A 2013 independent scoping study estimated that there is 23Tcf shale gas in place
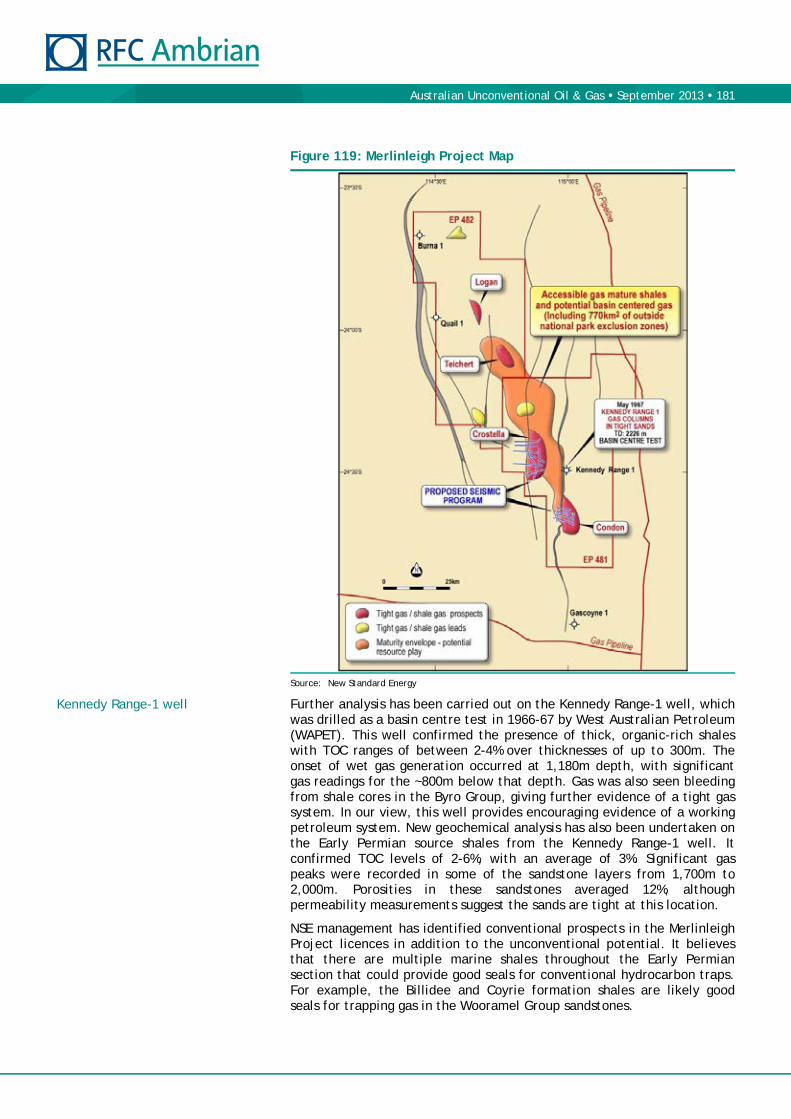
Australian Unconventional Oil & Gas September 2013 181
Figure 119: Merlinleigh Project Map
Source: New Standard Energy
Further analysis has been carried out on the Kennedy Range-1 well, which was drilled as a basin centre test in 1966-67 by West Australian Petroleum (WAPET). This well confirmed the presence of thick, organic-rich shales with TOC ranges of between 2-4% over thicknesses of up to 300m. The onset of wet gas generation occurred at 1,180m depth, with significant gas readings for the ~800m below that depth. Gas was also seen bleeding from shale cores in the Byro Group, giving further evidence of a tight gas system. In our view, this well provides encouraging evidence of a working petroleum system. New geochemical analysis has also been undertaken on the Early Permian source shales from the Kennedy Range-1 well. It confirmed TOC levels of 2-6%, with an average of 3%. Significant gas peaks were recorded in some of the sandstone layers from 1,700m to 2,000m. Porosities in these sandstones averaged 12%, although permeability measurements suggest the sands are tight at this location.
NSE management has identified conventional prospects in the Merlinleigh Project licences in addition to the unconventional potential. It believes that there are multiple marine shales throughout the Early Permian section that could provide good seals for conventional hydrocarbon traps. For example, the Billidee and Coyrie formation shales are likely good seals for trapping gas in the Wooramel Group sandstones.
Kennedy Range-1 well

Australian Unconventional Oil & Gas September 2013 182
Potential hydrocarbon trapping structures are present, including tilted fault blocks and inversion anticlines. The two highest ranked prospects are Condon and Crostella. They have potential gas in place estimates of up to 530Bcf and 470Bcf respectively (internal company estimates).
Figure 120: Condon Prospect Figure 121: Crostella Prospect
Source: New Standard Energy Source: New Standard Energy
New Standard plan to spud the Condon-1 well in the upcoming December quarter, and have already contracted a rig. This location is close to the historic Kennedy Range-1 well, which New Standard has analysed in great detail (see above). It is planned that this vertical exploration well will be drilled to about 2,200m. Subject to the results of this well New Standard will likely carry out further seismic. They are chasing multiple targets to test the conventional Permian sands as well as gather data for the broader tight gas and shale gas plays.
US — Colorado County
New Standard has several non-operating stakes in small US projects, which management has now deemed non-core to its business. Its main US asset is a 32.5% working interest in the Colorado County Project, onshore Texas. This provides regular, but minor, cashflow. The initial drilling campaign in 2010 and 2011 had positive results, and four wells are currently in production (Heintschel-1, Heintschel-2, D Truchard-1 and Joann-1). In November 2011 independent consultants DeGoyler and McNaughton confirmed New Standard’s proven and probable reserves as detailed below.
Table 59: Heinstchel Field 2P Reserves
Gross Net to NSE (net royalty interest)
Wet gas
(Bcf)
Condensate
(MMbo)
Dry sales gas (Bcf)
Natural gas liquids
(MMbo)
Condensate
(MMbo)
Total proved 14.35 0.39 3.26 0.16 0.10
Total probable 19.35 0.57 4.39 0.22 0.15
Total 2P reserves 33.70 0.96 7.65 0.38 0.25
Source: New Standard Energy, DeGoyler & McNaughton
New Standard also has a 36% working interest in the Wharton County Project, onshore Texas.
France — Elixir Petroleum
In July 2013 New Standard increased its stake in Elixir Petroleum from 13.7% to 28.2%, following the underwriting of a rights issue to raise A$1.8m. Elixir owns 100% of the Moselle Project in the Paris Basin of France, which, at 5,360km2 in area (1.3m acres), is the largest single exploration block in onshore France.

Australian Unconventional Oil & Gas September 2013 183
Valuation
We estimate that the current fair value of New Standard’s share price is A¢30.7/share, which is 112% above its A¢14.5 price on 28 August 2013. We outline our key assumptions behind this NAV-based fair value estimate below.
Key NAV Assumptions
For Our Current Fair Value Estimate
We have valued New Standard’s 25% interest in the Southern Canning JV, using the value implied by the price (US$29m) PetroChina paid to farm in to a 29% interest in February 2013. This equates to a valuation of just US$9/acre.
We have valued the rest of New Standard’s unconventional acreage (including the Merlinleigh and Laurel projects) at US$10/acre. This is less than the US$13/acre valuation placed on the Southern Canning JV acreage by ConocoPhillips’ farm-in, but slightly more than the US$9/acre valuation placed on the Southern Canning JV acreage by PetroChina’s farm-in.
We have added US$68m of carry by ConocoPhillips. We have arrived at this figure by adding the carry available for the third (Blatchford-1) well of Phase 1 (US$13m) to combined carry of Phases 2, 3 and 4 (US$80m) and subtracting our estimate of New Standard’s share of the cost overrun involved in finishing and evaluating the partially drilled Gibb Maitland-1 well and drilling the Blatchford-1 well (US$25m).
We have conservatively given New Standard no value for its international assets.
New Standard had cash of A$41.5m at 30 June 2013.
We estimated the value of New Standard’s G&A expense by annualising the addition of its 1H13 G&A expense (US$2.8m), and putting the result over our real 7.5% discount rate (roughly equivalent to a nominal 10% discount rate).
Other assumptions can be seen in Table 60.
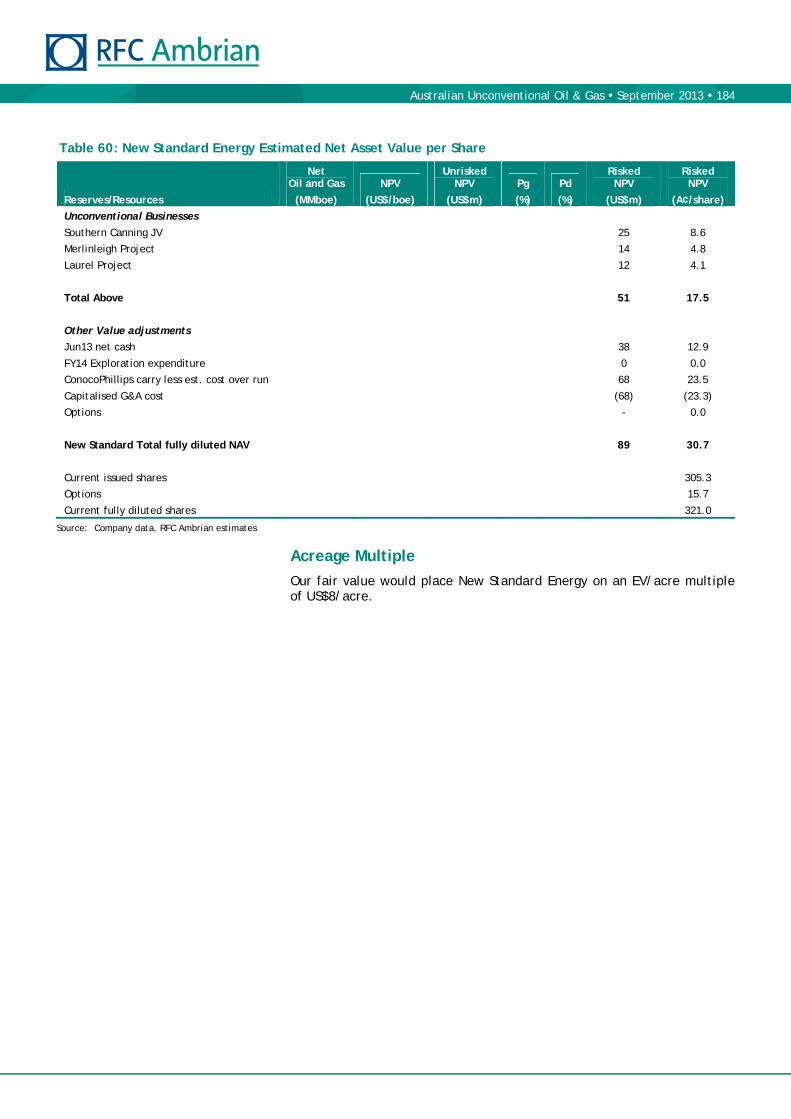
Australian Unconventional Oil & Gas September 2013 184
Table 60: New Standard Energy Estimated Net Asset Value per Share
Net Oil and Gas NPV
Unrisked NPV Pg Pd
Risked NPV
Risked NPV
Reserves/Resources (MMboe) (US$/boe) (US$m) (%) (%) (US$m) (A¢/share)
Unconventional Businesses
Southern Canning JV 25 8.6
Merlinleigh Project 14 4.8
Laurel Project 12 4.1
Total Above 51 17.5
Other Value adjustments
Jun13 net cash 38 12.9
FY14 Exploration expenditure 0 0.0
ConocoPhillips carry less est. cost over run 68 23.5
Capitalised G&A cost (68) (23.3)
Options - 0.0
New Standard Total fully diluted NAV 89 30.7
Current issued shares 305.3
Options 15.7
Current fully diluted shares 321.0
Source: Company data, RFC Ambrian estimates
Acreage Multiple
Our fair value would place New Standard Energy on an EV/acre multiple of US$8/acre.
Australian Unconventional Oil & Gas September 2013 185
Other Australian Shale Gas Companies

Australian Unconventional Oil & Gas September 2013 186
Blue Energy (BUL) was listed on the ASX in 2006, and holds net interests in around 110,000km2 of exploration acreage across nine different producing and prospective basins in Queensland and the Northern Territory, Australia. Alongside CSG and shale acreage, BUL has four conventional permits covering 5,357km2 in the NW-boundary of the Cooper-Eromanga Basin in Queensland, awaiting the issuance of Environmental Permits.
Unconventional Assets
Queensland, Australia. BUL has 100% interest in all its acreage in Queensland, covering approximately 55,000km2. NSAI has estimated 50PJ of 2P reserves and 820PJ of 2C contingent resources.
BUL has eight operated coal seam gas assets in the Bowen, Galilee and Surat basins. BUL’s southern permits in the Surat Basin are targeting domestic gas requirements. The permits (ATP 813P & -814P) are expected to deliver larger quantities of gas reserves, potentially suited to the supply of export LNG projects in Gladstone. KOGAS (a South Korean state-run utility) has indicated an interest to invest in the development of ATP 814P, and BUL sees significant future investment in the permit with links to the export LNG market through KOGAS’ investment in the Santos-led GLNG project. The development of coal projects within the Galilee Basin will require significant amounts of energy, and BUL’s permits could meet this demand.
BUL also has shale oil and gas assets in the Southern Georgina, Maryborough and Carpentaria basins. The location and prospectivity of the Maryborough Basin has the potential to supply both domestic gas requirements as well as LNG export projects. The Georgina Basin acreage covers 21,300km2, with oil potential in adjacent permits being confirmed by Central Petroleum and Ryder Scott.
Northern Territory, Australia. In August 2013 BUL farmed into nine large oil and gas exploration blocks held by Australian Oil & Gas, covering 111,900km2, in the Wiso Basin, Northern Territory. BUL will make a cash payment to cover back costs, and fund a three-stage work programme to earn a 50% interest. Exploration will target Cambrian shales, which are shallow and expected to be in the liquids maturation window.
Key Management
Executive Chairman — John Ellice-Flint — Mr Ellice-Flint became Chairman in June 2013. He has 40 years’ experience in the petroleum industry, including eight years as MD of Santos (2000-08), during which time the market cap increased from A$2bn to A$11bn. He worked for 26 years at Unocal Corp in 14 countries, including as VP of the Indonesia business from 1994-96, VP of Corporate Strategic Planning & Economics from 1996-97, and Senior VP Global Exploration & Technology from 1997-2000.
Chief Executive Officer & Managing Director — John Phillips — Mr Phillips joined as COO in May 2009, and was promoted to CEO in April 2010. He has 26 years’ experience in the oil and gas industry, with both conventional O&G and CSG experience. He has worked with Delhi Petroleum, Esso, Conoco, Petroz and Novus, and was COO of Sunshine Gas.
28 August 2013 Blue Energy
Emily Ashford +44 (0)20 3440 6821 [email protected]
Price (A¢) 9.4
Ticker BUL-AU
Market cap (A$m) 107.3
Estimated cash (A$m) 16.9
2P reserves + 2C resources (MMboe) 149.6
Shares in issue
Basic (m) 1,141.0
52-week
High (A¢) 10.0
Low (A¢) 2.6
3m-avg daily vol (000) 2,269
3m-avg daily val (A$000) 165
Top shareholders (%)
ANZ Bank 10.0
Stanwell Corporation 7.7
KOGAS Australia Pty Ltd 5.5
Paradice Invt Mgmt 5.1
John Ellice Flint 4.6
Total 32.8
Management
John Ellice-Flint CHR
John Phillips CEO & MD
Share Price Performance (A$)
Source: Bloomberg, Company reports
0
10
20
30
40
50
60
70
$0.00
$0.02
$0.04
$0.06
$0.08
$0.10
$0.12
Aug‐12 Nov‐12 Feb‐13 May‐13 Aug‐13
illi

Australian Unconventional Oil & Gas September 2013 187
Central Petroleum (CTP) holds a massive net 40.8m acres of onshore petroleum permits covering the Amadeus, Southern Georgina, Pedirka and Wiso basins in Central Australia, with both unconventional and conventional potential (post recent farm-outs to Santos (STO) and Total). The company has just raised A$10m through a secondary share placement, which it will use to develop the Surprise oil field, which has 1.1MMbbl of 2P reserves and 2C contingent resources of 5.8MMbbl.
Unconventional Assets
Amadeus & Pedirka Basins, Australia. There are a range of conventional and unconventional exploration plays in the immediate vicinity of the Surprise oil field in the Northern Territory. In October 2012 STO farmed into both the Amadeus and Pedirka basins, where unconventional (and conventional) resource prospectivity had been demonstrated. STO will spend up to A$150m to earn a 70% interest in 19.8m acres (excluding the Surprise discovery), with the work programme due to commence in 2H13. The Horn Valley Siltstone is the main unconventional reservoir target. It is the regional oil source for discovered fields in the north-western Amadeus Basin, and has significant shale oil/gas potential. Further work is required to delineate the resource potential.
South Georgina Basin, Australia. Total farmed into 6m acres of Central’s Georgina Basin acreage in November 2012, with Total funding 80% of exploration and development over three stages to a maximum of US$190m, earning a 68% interest. In April 2011 DSWPET analysed the unconventional potential of the Arthur Creek Formation in this acreage and concluded that there are mean prospective recoverable resources of 5Bbbl of oil and 33Tcf of gas in CTP’s Southern Georgina Basin permits.
Key Management
Acting Non-executive Chairman — Andrew Whittle — Mr Whittle has over 42 years of technical and managerial experience in the exploration and production industry. He spent 21 years with affiliates of Exxon Corp in Australia, Singapore, Malaysia, Canada and the US, finally in the position of Geological Manager of Esso Australia. Thereafter he was Exploration Manager for five years with GFE Resources. He has over 15 years’ experience through PetroVal Australasia Pty Ltd, of which he is a founding Director, and his private consulting company Sheristowe of preparing independent technical reports, valuations and evaluating exploration and production assets. He was appointed Director of Bass Strait Oil in 2011 and Bumi Armada in mid-2011.
Managing Director — Richard Cottee — Mr Cottee began his career in the resources sector in 1980 as a Business Development Manager for Itochu Australia. He joined Santos in 1982 as Senior Marketing Officer for LPG & Condensates, then oversaw commercial aspects of the Jackson Oilfield discovery. He has been a Senior Associate of Allens and Mallesons. He joined Cyprus Amax Minerals Group in 1992, and then CS Energy in 1998. In 2001 he became Managing Director of NRG Ltd for UK and Scandinavia before joining QGC as Managing Director in 2002.
28 August 2013 Central Petroleum
Emily Ashford +44 (0)20 3440 6821 [email protected]
Price (A¢) 10.0
Ticker CTP-AU
Market cap (A$m) 154.6
Estimated cash (A$m) 1.3
2P reserves + 2C resources (MMboe) 6.9
Shares in issue
Basic (m) 1,546.1
52-week
High (A¢) 20.0
Low (A¢) 6.5
3m-avg daily vol (000) 4,343
3m-avg daily val (A$000) 418
Top shareholders (%)
William Schoch 3.6
Marford Group Pty Ltd 1.0
Brighten Intl Pty 0.9
Mark Shawcross 0.9
Franze Holdings Pty Ltd 0.7
Total 7.00
Management
Andrew Whittle CHR
Richard Cottee MD
Share Price Performance (A$)
Source: Bloomberg, Company reports
0
10
20
30
40
50
60
70
$0.00
$0.05
$0.10
$0.15
$0.20
$0.25
Aug‐12 Nov‐12 Feb‐13 May‐13 Aug‐13
illi
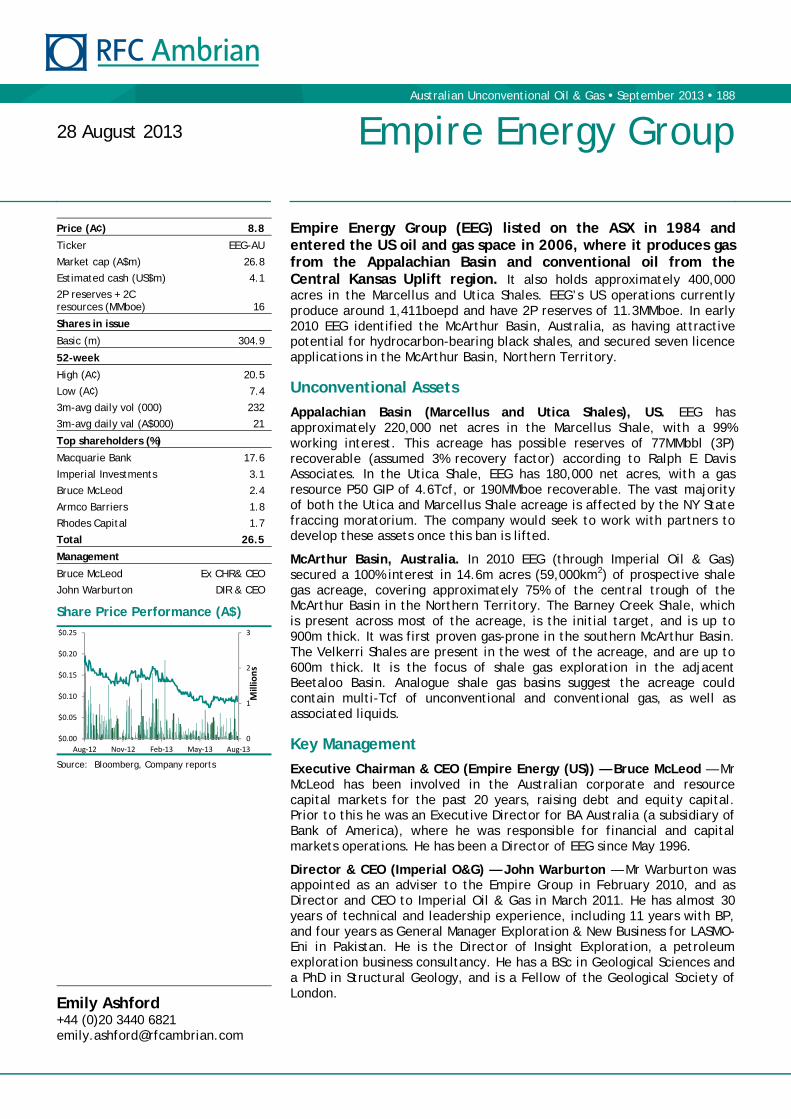
Australian Unconventional Oil & Gas September 2013 188
Empire Energy Group (EEG) listed on the ASX in 1984 and entered the US oil and gas space in 2006, where it produces gas from the Appalachian Basin and conventional oil from the Central Kansas Uplift region. It also holds approximately 400,000 acres in the Marcellus and Utica Shales. EEG’s US operations currently produce around 1,411boepd and have 2P reserves of 11.3MMboe. In early 2010 EEG identified the McArthur Basin, Australia, as having attractive potential for hydrocarbon-bearing black shales, and secured seven licence applications in the McArthur Basin, Northern Territory.
Unconventional Assets
Appalachian Basin (Marcellus and Utica Shales), US. EEG has approximately 220,000 net acres in the Marcellus Shale, with a 99% working interest. This acreage has possible reserves of 77MMbbl (3P) recoverable (assumed 3% recovery factor) according to Ralph E Davis Associates. In the Utica Shale, EEG has 180,000 net acres, with a gas resource P50 GIP of 4.6Tcf, or 190MMboe recoverable. The vast majority of both the Utica and Marcellus Shale acreage is affected by the NY State fraccing moratorium. The company would seek to work with partners to develop these assets once this ban is lifted.
McArthur Basin, Australia. In 2010 EEG (through Imperial Oil & Gas) secured a 100% interest in 14.6m acres (59,000km2) of prospective shale gas acreage, covering approximately 75% of the central trough of the McArthur Basin in the Northern Territory. The Barney Creek Shale, which is present across most of the acreage, is the initial target, and is up to 900m thick. It was first proven gas-prone in the southern McArthur Basin. The Velkerri Shales are present in the west of the acreage, and are up to 600m thick. It is the focus of shale gas exploration in the adjacent Beetaloo Basin. Analogue shale gas basins suggest the acreage could contain multi-Tcf of unconventional and conventional gas, as well as associated liquids.
Key Management
Executive Chairman & CEO (Empire Energy (US)) — Bruce McLeod — Mr McLeod has been involved in the Australian corporate and resource capital markets for the past 20 years, raising debt and equity capital. Prior to this he was an Executive Director for BA Australia (a subsidiary of Bank of America), where he was responsible for financial and capital markets operations. He has been a Director of EEG since May 1996.
Director & CEO (Imperial O&G) — John Warburton — Mr Warburton was appointed as an adviser to the Empire Group in February 2010, and as Director and CEO to Imperial Oil & Gas in March 2011. He has almost 30 years of technical and leadership experience, including 11 years with BP, and four years as General Manager Exploration & New Business for LASMO-Eni in Pakistan. He is the Director of Insight Exploration, a petroleum exploration business consultancy. He has a BSc in Geological Sciences and a PhD in Structural Geology, and is a Fellow of the Geological Society of London.
28 August 2013 Empire Energy Group
Emily Ashford +44 (0)20 3440 6821 [email protected]
Price (A¢) 8.8
Ticker EEG-AU
Market cap (A$m) 26.8
Estimated cash (US$m) 4.1
2P reserves + 2C resources (MMboe) 16
Shares in issue
Basic (m) 304.9
52-week
High (A¢) 20.5
Low (A¢) 7.4
3m-avg daily vol (000) 232
3m-avg daily val (A$000) 21
Top shareholders (%)
Macquarie Bank 17.6
Imperial Investments 3.1
Bruce McLeod 2.4
Armco Barriers 1.8
Rhodes Capital 1.7
Total 26.5
Management
Bruce McLeod Ex CHR& CEO
John Warburton DIR & CEO
Share Price Performance (A$)
Source: Bloomberg, Company reports
0
1
2
3
$0.00
$0.05
$0.10
$0.15
$0.20
$0.25
Aug‐12 Nov‐12 Feb‐13 May‐13 Aug‐13
Millions

Australian Unconventional Oil & Gas September 2013 189
Empire (EGO) is the largest acreage holder in the onshore Perth Basin, with 11 Petroleum Exploration Permits and two Production Licence Applications, as well as 13 PEL and one PPL in the Carnarvon Basin, totalling around 10m acres under tenure. A study by RPS has endorsed the prospectivity of the Perth Basin permits for unconventional oil and gas. Following EGO’s discovery of the Gingin West-1 and Red Gully-1 conventional gas/condensate accumulations (EGO: 76.39%) in the Perth Basin, it commissioned the Red Gully gas and condensate processing facility. EGO and the EP 389JV have a forward gas sales agreement with Alcoa for 15PJ of gas, which provided A$25m of funding towards construction. Restricted production has begun.
Unconventional Assets
Perth Basin, Australia. EGO’s permits cover a gross area of 3.6m acres. Studies over EP 454, EP 440, EP 368 and EP 426 by RPS Energy in May 2013 estimated in-place potential of 14Bbbl of oil and over 92Tcf of gas within various reservoirs, such as in interbedded shale/tight sands in the Lower Cattamarra Coal Measures. There is also unconventional potential in the Kockatea Shale, which is thermally mature on the downthrown side of the Allanooka Fault. Unconventional gas has been recognised in the deeper Permian objectives following Norwest Energy’s Arrowsmith-2 well. There is the opportunity to test unconventional targets whilst drilling conventional prospects. Following the acquisition and interpretation of the Wannamal 3D heli-seismic survey (commenced April 2013), EGO plans to drill the Wannamal and Gingin Deep prospects, and test the Lower Cattamarra unconventional potential.
Carnarvon Basin, Australia. EGO has an extensive land position of over 3.4m gross acres in the Carnarvon Basin. Unconventional opportunities are present in the Late Devonian Gneudna Formation and Jurassic shales of the Dingo Claystone. EGO has commissioned RPS to evaluate the potential, with results expected in 3Q13. EGO has a farm-in agreement with UIL Energy covering EP 359. UIL will earn a 50% interest by drilling one well to 2,500m, and an additional 25% on unconventional rights by drilling a second.
Key Management
Managing Director — Craig Marshall — Mr Marshall is a geologist with 30 years of technical and managerial experience in the petroleum and mining industry in Australia, the UK and South East Asia. He was previously Chairman of two public companies and the Managing Director of petroleum exploration company Anzoil. Since 1995 Craig has undertaken the development of EGO, and its Perth, Canning and Carnarvon basin assets.
Executive Director — Bevan Warris — Mr Warris is a petroleum geologist with 46 years’ technical and managerial experience in the petroleum exploration industry. He has been Executive Director of EGO since 2003. He has been director of West Oil and SOCDET Management, manager of the Sydney Oil Company Drilling and Exploration Trust, general manager of Barrack Energy, and Chief Executive and Managing Director of Pancontinental Petroleum.
28 August 2013 Empire Oil & Gas
Emily Ashford +44 (0)20 3440 6821 [email protected]
Price (A¢) 1.4
Ticker EGO-AU
Market cap (A$m) 88.1
Estimated cash (A$m) 9.22
2P reserves + 2C resources (MMboe) 7
Shares in issue
Basic (m) 6,294.3
52-week
High (A¢) 1.7
Low (A¢) 1.1
3m-avg daily vol (000) 14,017
3m-avg daily val (A$000) 184
Top shareholders (%)
ERM Power Ltd 6.3
Hancock Prospecting Pty 1.0
Bevan Warris 0.9
PF&JA Vincent 0.5
Sunset Power Hldngs Pty 0.5
Total 9.2
Management
Craig Marshall MD
Bevan Warris Ex DIR
Share Price Performance (A$)
Source: Bloomberg, Company reports
0
20
40
60
80
100
120
140
$0.00
$0.01
$0.01
$0.02
$0.02
Aug‐12 Nov‐12 Feb‐13 May‐13 Aug‐13
Millions
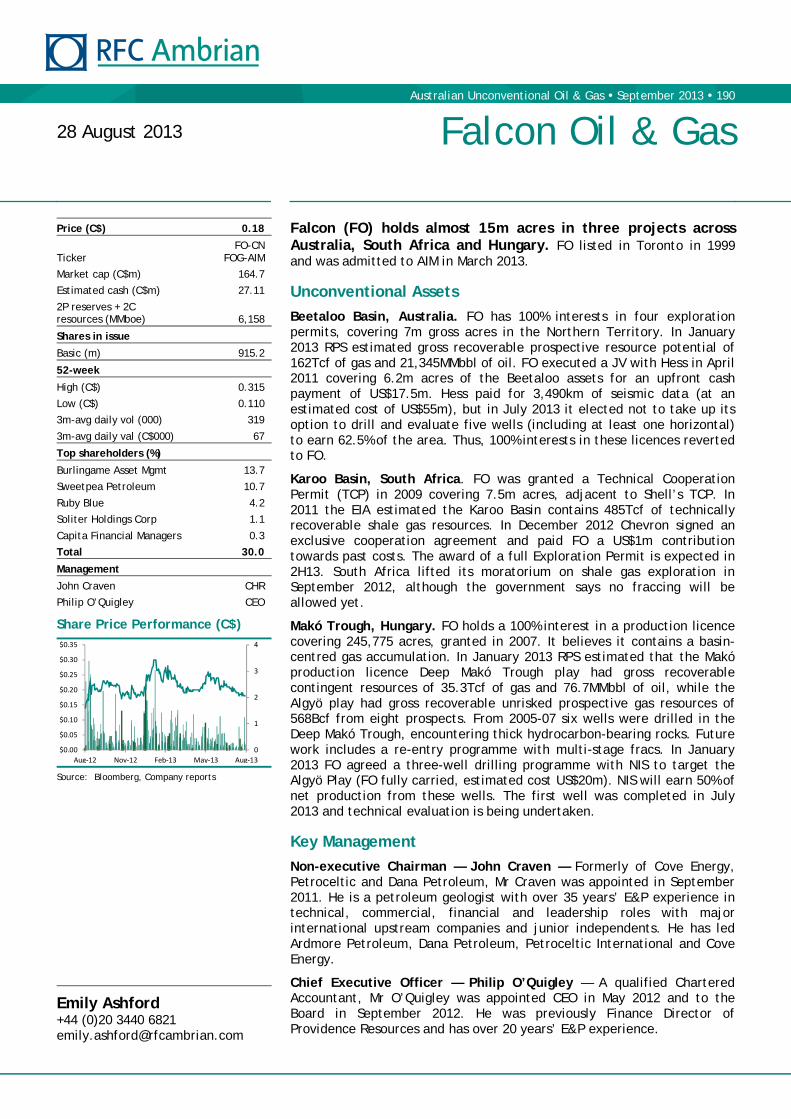
Australian Unconventional Oil & Gas September 2013 190
Falcon (FO) holds almost 15m acres in three projects across Australia, South Africa and Hungary. FO listed in Toronto in 1999 and was admitted to AIM in March 2013.
Unconventional Assets
Beetaloo Basin, Australia. FO has 100% interests in four exploration permits, covering 7m gross acres in the Northern Territory. In January 2013 RPS estimated gross recoverable prospective resource potential of 162Tcf of gas and 21,345MMbbl of oil. FO executed a JV with Hess in April 2011 covering 6.2m acres of the Beetaloo assets for an upfront cash payment of US$17.5m. Hess paid for 3,490km of seismic data (at an estimated cost of US$55m), but in July 2013 it elected not to take up its option to drill and evaluate five wells (including at least one horizontal) to earn 62.5% of the area. Thus, 100% interests in these licences reverted to FO.
Karoo Basin, South Africa. FO was granted a Technical Cooperation Permit (TCP) in 2009 covering 7.5m acres, adjacent to Shell’s TCP. In 2011 the EIA estimated the Karoo Basin contains 485Tcf of technically recoverable shale gas resources. In December 2012 Chevron signed an exclusive cooperation agreement and paid FO a US$1m contribution towards past costs. The award of a full Exploration Permit is expected in 2H13. South Africa lifted its moratorium on shale gas exploration in September 2012, although the government says no fraccing will be allowed yet.
Makó Trough, Hungary. FO holds a 100% interest in a production licence covering 245,775 acres, granted in 2007. It believes it contains a basin-centred gas accumulation. In January 2013 RPS estimated that the Makó production licence Deep Makó Trough play had gross recoverable contingent resources of 35.3Tcf of gas and 76.7MMbbl of oil, while the Algyö play had gross recoverable unrisked prospective gas resources of 568Bcf from eight prospects. From 2005-07 six wells were drilled in the Deep Makó Trough, encountering thick hydrocarbon-bearing rocks. Future work includes a re-entry programme with multi-stage fracs. In January 2013 FO agreed a three-well drilling programme with NIS to target the Algyö Play (FO fully carried, estimated cost US$20m). NIS will earn 50% of net production from these wells. The first well was completed in July 2013 and technical evaluation is being undertaken.
Key Management
Non-executive Chairman — John Craven — Formerly of Cove Energy, Petroceltic and Dana Petroleum, Mr Craven was appointed in September 2011. He is a petroleum geologist with over 35 years’ E&P experience in technical, commercial, financial and leadership roles with major international upstream companies and junior independents. He has led Ardmore Petroleum, Dana Petroleum, Petroceltic International and Cove Energy.
Chief Executive Officer — Philip O’Quigley — A qualified Chartered Accountant, Mr O’Quigley was appointed CEO in May 2012 and to the Board in September 2012. He was previously Finance Director of Providence Resources and has over 20 years’ E&P experience.
28 August 2013 Falcon Oil & Gas
Emily Ashford +44 (0)20 3440 6821 [email protected]
Price (C$) 0.18
Ticker FO-CN
FOG-AIM
Market cap (C$m) 164.7
Estimated cash (C$m) 27.11
2P reserves + 2C resources (MMboe) 6,158
Shares in issue
Basic (m) 915.2
52-week
High (C$) 0.315
Low (C$) 0.110
3m-avg daily vol (000) 319
3m-avg daily val (C$000) 67
Top shareholders (%)
Burlingame Asset Mgmt 13.7
Sweetpea Petroleum 10.7
Ruby Blue 4.2
Soliter Holdings Corp 1.1
Capita Financial Managers 0.3
Total 30.0
Management
John Craven CHR
Philip O’Quigley CEO
Share Price Performance (C$)
Source: Bloomberg, Company reports
0
1
2
3
4
$0.00
$0.05
$0.10
$0.15
$0.20
$0.25
$0.30
$0.35
Aug‐12 Nov‐12 Feb‐13 May‐13 Aug‐13

Australian Unconventional Oil & Gas September 2013 191
Icon Energy (ICN) has a portfolio of acreage covering approximately 14,450km2 (net) in the Cooper-Eromanga, Surat and Gippsland basins in Australia. In the Cooper-Eromanga Basin, ICN has partnered with Beach Energy and Chevron Australia.
Unconventional Assets
Cooper-Eromanga Basin, Australia. ICN has a 35.1% interest in ATP 855P (Beach Energy: 46.9% & operator, Chevron: 18%), which contains the Halifax-1 well. It was drilled in October 2012 to a total depth of 4,266m and found a 460m REM section. It flowed at a peak rate of 4.2MMcfpd, the highest rate so far for a shale gas well in the Cooper Basin. The Gallus seismic survey was completed early in 2013 and is being processed. ICN also has a 33% interest in the post-Permian section of neighbouring PEL 218. In late February 2013 Chevron Australia farmed into Beach Energy’s interest in ATP 855P. The joint venture has just drilled its second vertical unconventional well (Hervey-1) is currently drilling two further similar wells (Geoffrey-1 and Keppel-1). In August 2013 the 2C gross contingent resources around the Halifax-1 well were independently evaluated at 629Bcf (220.8Bcf net to ICN).
Surat Basin, Australia. In ATP 626P North Maroon DW-1 was drilled in November 2011, but was plugged and abandoned. ICN then drilled two coal seam gas wells — Eolus-1 and Windom-1 — in May 2012 as part of a farm-in agreement. Eolus-1 had encouraging results and was cased and suspended. A feasibility study was conducted for ATP 626P in December 2012 to review the gas potential for both conventional and unconventional (coal seam and shale) gas. The results of historic wells and 2D seismic data were compiled. Icon and its joint-venture partner Goondi Energy are now planning a development plan for the tenement.
Gippsland Basin, Australia. ICN’s two-well exploration programme of Dragon-1 and Tiger West-1 in PEP 170, Victoria, has been deferred until the Victorian Government lifts its moratorium on hydraulic fracturing. These wells have the potential to address more than 1Tcf of gas–in-place.
Key Management
Non-executive Chairman — Stephen Barry — Mr Barry has been a Director of ICN since 1993. He was appointed Chairman of the Board in December 2008. He is a practising solicitor, with experience in joint-venture and farm-in agreements, commercial law and corporate litigation.
Managing Director — Raymond James — Mr James founded ICN in 1993. He worked with Chevron in Perth and Houston from 1969-74, and Gulf Oil from 1974-80. He was Managing Director of Australian Hydrocarbons from 1980-81 and Omega Oil from 1987-91.
28 August 2013 Icon Energy
Emily Ashford +44 (0)20 3440 6821 [email protected]
Price (A¢) 15.0
Ticker ICN-AU
Market cap (A$m) 80.0
Estimated cash (A$m) 21.84
2P reserves + 2C resources (MMboe) 40.2
Shares in issue
Basic (m) 533.4
52-week
High (A¢) 30.0
Low (A¢) 12.5
3m-avg daily vol (000) 342
3m-avg daily val (A$000) 50
Top shareholders (%)
Raymond James 4.0
Howard Lu 3.0
Taiwan Fructose Co Ltd 1.7
Dianne Baldwin 1.3
Timothy Kennedy 0.9
Total 10.9
Management
Stephen Barry CHR
Raymond James MD
Share Price Performance (A$)
Source: Bloomberg, Company reports
0
1
2
3
4
5
6
7
8
$0.00
$0.05
$0.10
$0.15
$0.20
$0.25
$0.30
Aug‐12 Nov‐12 Feb‐13 May‐13 Aug‐13
Millions

Australian Unconventional Oil & Gas September 2013 192
Melbourne-based Lakes Oil (LKO) is the oldest Australian oil and gas explorer still operating in the country. It owns a package of onshore Otway and Gippsland basin tight gas assets. The government of Victoria has imposed a fraccing moratorium that has hindered the appraisal of LKO’s Victorian assets. LKO entered into a strategic joint venture with Armour Energy (AJQ) in December 2011, where AJQ could earn 51% interests in PEP 166 & PEP 169, and an option to acquire 50% of LKO’s interest in PR L2 in exchange for conducting exploration activities. AJQ increased its stake in LKO in February 2013 to around 18.6% after subscribing to convertible notes. In January 2013 Gina Rinehart invested U$4.25m in LKO by purchasing unsecured notes.
Unconventional Assets
Gippsland Basin, Australia. There have been three wells drilled on the Baragwanath Anticline in the Gippsland Basin. In PEP 166 the Holdgate-1 well was drilled in 2Q12 and showed numerous occurrences of tight gas in the Strzelecki section. The long planned fraccing of the Wombat-4 and Boundary Creek-2 wells, in PRL 2, has had to be put on hold due to the fraccing moratorium. Evaluation of drilling and logging results of previous wells indicates the Strzelecki Group contains a number of potential tight gas zones.
In 2011 Gaffney, Cline & Associates (GC&A) conducted an independent assessment of the prospective tight gas resources in the Baragwanath Anticline across PRL 2 and PEP 166. The combined P50 prospective gas-in-place resource of the Greater Baragwanath Anticline was given as approximately 2.3Tcf. In 2012 GC&A estimated 1.7Tcf (P50) of gas-initially-in-place in the Wombat and Trifon fields.
Otway Basin, Australia. In PEP 169 (LKO: 49%) AJQ drilled Moreys-1 to earn its 51% interest in the permit in 2Q12. It is considered a tight gas and condensate discovery due to indications of tight gas during drilling and the recovery of hydrocarbons during drill stem testing in the Eumeralla Formation. A further well, Otway-1 is planned up-dip from the Iona-gas field.
Key Management
Executive Chairman — Robert Annells — Mr Annells has over 40 years’ experience in the securities industry and is a qualified accountant. He has served on the Board since 1984. He is also Chairman of Greenearth Energy, and is Director of Rum Jungle Resources. He has also served on the board of Minotaur Exploration (serving as Chairman from 2005-10) and was Chairman of Xtract Energy. He is a former member of the Australian Stock Exchange.
28 August 2013 Lakes Oil NL
Emily Ashford +44 (0)20 3440 6821 [email protected]
Price (A¢) 0.3
Ticker LKO-AU
Market cap (A$m) 21.6
Estimated cash (A$m) 7.46
2P reserves + 2C resources (MMboe) -
Shares in issue
Basic (m) 7,208.9
52-week
High (A¢) 0.9
Low (A¢) 0.2
3m-avg daily vol (000) 4,892
3m-avg daily val (A$000) 21
Top shareholders (%)
Armour Energy 12.5
Robert Annells 1.4
Peter Lawrence 0.6
Barney Berold 0.4
T O’Brien 0.3
Total 15.2
Management
Robert Annells CHR
Share Price Performance (A$)
Source: Bloomberg, Company reports
0
50
100
150
200
250
$0.00
$0.00
$0.00
$0.01
$0.01
$0.01
Aug‐12 Nov‐12 Feb‐13 May‐13 Aug‐13
Millions
Australian Unconventional Oil & Gas September 2013 193
Linc Energy (LNC) has both conventional and unconventional oil and gas production. Over the last few years it has acquired substantial oil and gas assets onshore in the US. Linc had proven oil reserves of 13MMbbl and 2P oil reserves of 168MMbbl at the end of FY12 (most of the probable reserves were in Umiat, Alaska). In FY12 US oil and gas sales made up US$55m of total sales of US$57m. Production from these assets was 4,605bpd of oil in the March quarter 2013. Its main unconventional assets are in situ underground coal gasification projects. Management has also identified a potential multi-billion barrel shale oil play in the Arckaringa Basin, South Australia.
Unconventional Assets
Global Underground Coal Gasification (UCG). LNC is a world-leader in UCG, and is the only company to have produced electricity, diesel and jet fuel from UCG syngas. It operates the only UCG to GTL facility in the world, at Chinchilla, Australia, and the only UCG to power facility in Uzbekistan. It also has a series of JV arrangements and strategic licence agreements covering geographies such as north-east Russia, sub-Saharan Africa and the Ukraine.
Arckaringa Basin, Australia. LNC holds a 100% interest in seven licences and one application covering approximately 16m contiguous acres in the largely unexplored Arckaringa Basin. In January 2013 independent prospective resource reports by DeGolyer & MacNaughton (D&M) and Gustavson Associates confirmed the significant shale oil potential of the basin. Gustavson estimated unrisked unconventional prospective resources of 233Bboe and D&M 103Bboe. The Stuart Range Formation and underlying Boorthanna and pre-Permian formations are rich in kerogen that may form the basis of a new liquids-rich shale play. LNC is in the process of farming-down its interest in these assets.
Key Management
Non-executive Chairman — Ken Dark — Mr Dark was appointed to the Board in October 2004, and was appointed Acting Non-executive Chairman in 2011. He began his career in industrial and electrical engineering, specialising in aluminium smelting. He established his own business in the fuel industry. His current business includes the operation of a small independent chain of service stations in the Hunter valley.
Chief Executive Officer & Managing Director — Peter Bond — Mr Bond was appointed to the Board in October 2004. He has a successful track record in the coal and mining industries in Australia and overseas. He has experience in the design, installation, commissioning and operation of complex processing plants and projects. Peter is also LNC’s major shareholder, owning ~40% of ordinary shares.
28 August 2013 Linc Energy
Emily Ashford +44 (0)20 3440 6821 [email protected]
Price (A$) 1.52
Ticker LNC-AU
Market cap (A$m) 788.4
Estimated cash (A$m) 123.08
2P reserves + 2C resources (MMboe) 168
Shares in issue
Basic (m) 518.7
52-week
High (A$) 3.05
Low (A$) 0.52
3m-avg daily vol (000) 7,308
3m-avg daily val (A$000) 10,107
Top shareholders (%)
Peter Bond 39.1
Credit Suisse Group 9.8
UBS 5.2
Macquarie Group 5.0
Marubeni Coal Pty Ltd 1.4
Total 60.5
Management
Ken Dark CHR
Peter Bond CEO & MD
Share Price Performance (A$)
Source: Bloomberg, Company reports
0
5
10
15
20
25
30
35
40
$0.00
$0.50
$1.00
$1.50
$2.00
$2.50
$3.00
$3.50
Aug‐12 Nov‐12 Feb‐13 May‐13 Aug‐13
Millions

Australian Unconventional Oil & Gas September 2013 194
Norwest (NWE) has licences in the northern Perth Basin, with a gross acreage position of 5,020km2 (2,225km2 net), and licences in the south coast of the UK, in the Wessex Basin, covering 560km2 gross (268km2 net). It also has interests in conventionally producing fields, including in L14 the Jingemia oil field and a 1.25% overriding royalty interest in the Puffin Field in the Timor Sea (suspended since August 2011). An independent review by DeGolyer & MacNaughton (D&M) in August 2013 of the EP 413 permit and Arrowsmith-2 discovery validated its resource potential and the prospectivity of the deep unconventional gas fairway.
Unconventional Assets
Northern Perth Basin, Australia. In EP 413 (NWE: 27.945% & operatorship), the Arrowsmith-2 well was NWE’s first dedicated shale gas/liquids well. It was drilled between May and June 2011, and a five-stage frac was completed in July to September 2012. Gas flowed to surface from all horizons, and oil from the top zone without the need for artificial support. In August 2013 D&M estimated that EP 413 has gross 2C contingent resources of 316Bcf gas and 1.4MMbbl oil around the Arrowsmith-2 well, and gross best estimate prospective recoverable resources of 2.6Tcf gas, 9MMbbl oil and 2.1MMbbl condensate. Further work includes 3D seismic to map HCSS closure more accurately and the base of the Kockatea to help the planning of future horizontal wells. In SPA0013 airborne gravity gradiometry and magnetic data shows potential for shallow and deep shale gas as well as conventional hydrocarbon traps.
Wessex Basin, UK. Onshore, NWE is assessing both shale gas and oil potential. It is reinterpreting Razorback, and a decision will be made whether to drill the well in 2H13. Offshore it is reprocessing 2D and 3D seismic data, and planning a new 2D survey. The offshore prospects are adjacent to the huge 500MMbbl Wytch Farm Field and are considered the same play type. In total, NWE believes its 11 prospects in the UK have P50 unrisked recoverable resources of 151MMbbl.
Key Management
Non-executive Chairman — Michael Fry — Mr Fry became a Director of NWE in June 2009 and Chairman in September 2009. He has extensive experience in the capital markets and corporate treasury, specialising in risk management. He is also Non-executive Chairman of Red Fork Energy, Challenger Energy and Killara Resources.
Chief Executive Officer — Peter Munachen — Mr Munachen became a Director of NWE in November 2003, and CEO in December 2008. He has over 35 years’ corporate and administration experience in hydrocarbon and mineral resource companies. He is a Chartered Accountant, and also Director of East African Resources.
28 August 2013 Norwest Energy
Emily Ashford +44 (0)20 3440 6821 [email protected]
Price (A¢) 3.2
Ticker NWE-AU
Market cap (A$m) 31.2
Estimated cash (A$m) 2.67
2P reserves + 2C resources (MMboe) 59
Shares in issue
Basic (m) 974.3
52-week
High (A¢) 8.6
Low (A¢) 1.8
3m-avg daily vol (000) 1,773
3m-avg daily val (A$000) 50
Top shareholders (%)
Sundowner Intl Ltd 3.4
Peter Lawson Munachen 0.9
Michael John Fry 0.6
Henry David Kennedy 0.5
Hilmed Pty Ltd 0.4
Total 5.8
Management
Michael Fry CHR
Peter Munachen CEO
Share Price Performance (A$)
Source: Bloomberg, Company reports
0
5
10
15
20
25
$0.00
$0.02
$0.04
$0.06
$0.08
$0.10
Aug‐12 Nov‐12 Feb‐13 May‐13 Aug‐13
Millions

Australian Unconventional Oil & Gas September 2013 195
In January 2012 PetroFrontier (PFC) entered into a farm-in agreement with Statoil for permits EP 103, 104, 127, 128, 213 and 252, covering 13.5m acres in the South Georgina Basin, Northern Territory. The farm-in terms were amended in July 2013 after PetroFrontier struggled to raise the capital it required for the initial agreement.
Unconventional Assets
Southern Georgina Basin, Australia. PFC has a 14.1m gross acreage position in the basin, with an average working interest of 87% (pre-JV). In 2010 Ryder Scott evaluated the Lower Arthur Creek in the basin to have best estimate unconventional, unrisked prospective oil resources of 26.4Bbbl. PFC believes the basin is geologically analogous to the Eagle Ford and Horn River shale plays in the US. It has Cambrian source rocks, the Lower Arthur Creek Formation, with an average TOC of >5% and Type-II kerogen. The acreage also has conventional carbonate zones. Three horizontal exploration wells — MacIntyre-2H, Owen-3H and Baldwin-2Hst1 — have been drilled to date. A mechanical casing failure occurred during the frac of the Baldwin-2Hst1 well. The MacIntyre-2H well had a nine-stage hydraulic frac, but encountered high levels of biogenic hydrogen sulphide during flow back, causing the test to be suspended. The Owen-3H well had a ten-stage hydraulic frac, but did not recover any hydrocarbons. Under the terms of the amended farm-in agreement of June 2013, exploration activities will be funded by Statoil, over three phases to the end of 2016, in return for 80% of PFC’s working interest.
In November 2010 Ryder Scott assessed the resource potential of the oil-rich shale zone as 26.4Bbbl unrisked, undiscovered (recoverable), and the conventional carbonate zones as 1.1Bbbl unrisked, undiscovered prospective (recoverable).
Key Management
Chairman — Robert Iverach — Robert Iverach, QC has been the Chairman and a Director of PFC since its inception. He is also the Chairman of Rodinia Oil Corp, Director of Veresen, and Counsel with the law firm Burstall Winger. He practised with, and was a founding partner of, the tax law firm Felesky Flynn for 25 years before retiring in 2005.
President, Chief Executive Officer and Director — Paul Bennett — Mr Bennett has been the CEO and a Director of PFC since its formation in February 2009. He became President in October 2011. He has 40 years’ experience in geoscience, mining and oil and gas exploration, development and production. He has held senior positions with ExxonMobil, supervising teams in the Gulf of Mexico, North Sea, Western Canada, Newfoundland and Nova Scotia.
28 August 2013 PetroFrontier Corp
Emily Ashford +44 (0)20 3440 6821 [email protected]
Price (C$) 0.21
Ticker PFC-CN
Market cap (C$m) 16.7
Estimated cash (C$m) 8.02
2P reserves + 2C resources (MMboe) -
Shares in issue
Basic (m) 79.4
52-week
High (C$) 0.820
Low (C$) 0.085
3m-avg daily vol (000) 327
3m-avg daily val (C$000) 80
Top shareholders (%)
Heritage Oil 20.0
Odin Capital 2.7
James William Buckee 1.6
Al Kroontje 1.2
Allianz Asset Mgmt 1.0
Total 26.5
Management
Robert Iverach CHR
Paul Bennett PRS, CEO & DIR
Share Price Performance (C$)
Source: Bloomberg, Company reports
0
5
10
15
20
25
$0.00
$0.20
$0.40
$0.60
$0.80
$1.00
Aug‐12 Nov‐12 Feb‐13 May‐13 Aug‐13

Australian Unconventional Oil & Gas September 2013 196
Santos (STO) is Australia’s largest onshore upstream oil and gas company, with total acreage of approximately 300,000km2. At the end of 2012 its 2P oil and gas reserves were 1,406MMboe, and its 2C contingent resources were 1,965MMboe. It expects to produce 52-55MMboe in CY13. STO made the Cooper Basin’s first significant gas discovery in 1963 and still dominates oil and gas production there. Santos also has a 30% stake in the Gladstone LNG project (GLNG — see Appendix 1) in Queensland, which in turn has 5,376PJ of 2P coal seam gas reserves.
Unconventional Assets
Cooper-Eromanga Basin, Australia. STO operates and has the largest interests in the two main Cooper Basin joint ventures. The South Australia Cooper Basin JV (STO: 66.6%, Beach: 20.21%, Origin Energy: 13.19%) is appraising two significant unconventional gas plays: the Moomba REM Shale gas play and the Nappamerri Trough basin-centred gas play. Santos booked YE12 2P unconventional gas reserves of 3Bcf from the Moomba-191 well. D&M assessed that STO had Cooper Basin net unconventional best estimate prospective resources of 33Tcf in 2008, and 2C contingent resources of 2,345PJ in 2011. The South West Queensland Join Venture (STO: 66.06%, Beach: 23.20%, Origin Energy: 16.74%) licences may also have unconventional resources. STO controls the main infrastructure in the Cooper Basin, including compression, pipelines and processing capacity of 550TJ/day (at Moomba and Ballera).
Amadeus and Pedirka Basins, Australia. STO is in the process of farming into Central Petroleum’s interests in 13 permits, covering over 75,000km2 in the Amadeus and Pedirka basins. Santos can earn up to 70% by funding A$90m of exploration work.
Beetaloo and McArthur Basins, Australia. STO is in the process of farming into Tamboran Resources’ interests in four permits covering approximately 25,000km2 of the Beetaloo and McArthur basins. Santos can earn up to 75% by funding A$71m of exploration work. A seismic programme in EP 161 is scheduled for 3Q13.
Key Management
Chairman — Kenneth Borda — Mr Borda was appointed Chairman in May 2013, having been a Non-executive Director since February 2007. He has been a Board member of Fullerton Funds Management since 2007, and Director of the Asian Advisory Board of Aviva since 2009. He was Chairman of Leighton Contractors from 2011-12, and was a director of Talent2 Intl from 2008 to 2012. He spent 17 years with Deutsche Bank, as CEO of MENA, CEO Australia and New Zealand and Director of Deutsche Bank Malaysia.
CEO and Managing Director — David Knox — Having first joined STO in September 2007, Mr Knox was appointed CEO in July 2008. He has 30 years’ experience in the oil and gas industry, with several senior positions with BP in Australia, the UK and Pakistan, including MD for BP Developments in Australasia from 2003-07. He also held management and engineering roles with ARCO and Shell. He is the Chairman of the Australian Petroleum Production and Exploration Association (APPEA).
28 August 2013 Santos Ltd
Emily Ashford +44 (0)20 3440 6821 [email protected]
Price (A$) 14.55
Ticker STO-AU
Market cap (A$m) 14,096.7
Estimated cash (A$m) 1,631
2P reserves + 2C resources (MMboe) 3,371
Shares in issue
Basic (m) 968.8
52-week
High (A$) 14.83
Low (A$) 10.37
3m-avg daily vol (000) 3,891
3m-avg daily val (A$000) 52,424
Top shareholders (%)
EM Industries Inc 2.9
Vanguard 1.7
MLC Investments 1.0
Blackrock 1.0
AMP Life Ltd 0.9
Total 7.5
Management
Kenneth Borda CHR
David Knox CEO & MD
Share Price Performance (A$)
Source: Bloomberg, Company reports
0
2
4
6
8
10
12
$0.00
$2.00
$4.00
$6.00
$8.00
$10.00
$12.00
$14.00
$16.00
Aug‐12 Nov‐12 Feb‐13 May‐13 Aug‐13
Millions

Australian Unconventional Oil & Gas September 2013 197
Formed in 2009, Tamboran is a privately-held company, primarily focused on shale gas in onshore basins. It has operations covering around 110,000km2 in Australia, Ireland, Northern Ireland and Botswana. As part of its farm-in agreement, Santos acquired a 14% stake in Tamboran in December 2012 for A$10m. At the time this valued Tamboran’s acreage at just A$2.83/acre.
Unconventional Assets
Australia. Tamboran has permits covering 25,500km2 of the Beetaloo & McArthur basins. The Beetaloo site is located adjacent to the Falcon Oil & Gas acreage (formerly in a JV with Hess). The key formations are the Barney Creek, Lynott & Yalco, Velkerri and the Kyalla Shale source rocks. Tamboran believes that the Beetaloo has the potential for gas-in-place of 7-18Tcf. Tamboran also has permits covering 14,500km2 and 15,400km2 of the Ngalia and Pedirka basins. There is stacked potential in the Poolawanna Sands, Peera Peera Shale and unconventional Walkandi Formation structures. Tamboran believes that the Ngalia and Pedirka acreages have gas-in-place potential ranges of 30-100Tcf and 7-25Tcf respectively.
Ireland/Northern Ireland. Tamboran has acreage in Ireland and Northern Ireland in the Northwest Carboniferous Basin, totalling 1,620km2. The Bundoran Shale and Dowra Sandstone are gas exploration targets. Historically the tight sandstones above the Bundoran have been exploration targets. The Bundoran has an average thickness of 475m, is at a depth of about 1,000m, and is considered mature for dry natural gas. Tamboran has announced that initial studies have confirmed a substantial shale gas field, and MHA consultants have assessed it to contain best estimate recoverable prospective shale gas resources of 3.0Tcf.
Gemsbok Basin, Botswana. Tamboran has 53,400km2 in the Gemsbok Basin. There are some hydrocarbon indications from the Permian lower Karoo Super Group, including the Friable Black Shale, which has high TOC values. Tamboran believes that gas-in-place may range from 35-150Tcf.
Key Management
Executive Chairman — Patrick Elliott — Mr Elliot is also Chairman of Meerkat Energy. His previous posts include Group Economist for Consolidated Goldfields, Executive Director for Bancorp Holdings and Morgan Grenfell, and Managing Director for Natcorp Holdings and Carrington Equity. He was Director of Eastern Star from 2001-05, responsible for structuring and raising pre-IPO seed capital. From 2000-08 he was Director of Sapex, involved in oil and gas exploration in the Arckaringa Basin, South Australia.
Deputy Chairman — Richard Lane — Mr Lane has a BSc and MSc in Geology from the University of Houston. He is also President, CEO, Founder and Chairman of Vitruvian Exploration, involved in unconventional oil and gas projects in the US. From 1992-2008 he worked for Southwestern Energy Company, as President of SEECO (a subsidiary), Vice President of its production company, and Vice President of Exploration.
28 August 2013 Tamboran Resources
Not listed
Emily Ashford +44 (0)20 3440 6821 [email protected]
Management
Patrick Elliott CHR
Richard Lane Dep CHR

Australian Unconventional Oil & Gas September 2013 198
Appendix 1 — Queensland LNG Projects
There are four multi-billion dollar gas export projects under construction, or in the planning phase, on Curtis Island near Gladstone, a port city in Queensland, north-eastern Australia. At the time of publishing, according to EnergyQuest, QCLNG is 65% complete, GLNG 60% complete and APLNG 45% complete, and all are on time and on budget, with drilling on schedule for Train 1 for each project. Arrow Energy is in discussions with APLNG about APLNG expansion.
Figure 122: Curtis Island LNG Projects
Source: Google Earth, RFC Ambrian
Table 61: Australian CSG Reserves (PJ) by LNG Project (at August 2013)
Project 1P 2P 3P 2C 2P+2C
GLNG 1,797 5,376 6,823 1,638 7,014
QCLNG 3,047 10,518 11,397 4,508 15,026
APLNG 1,527 13,349 16,110 3,644 16,993
Arrow LNG 551 8,251 12,792 2,521 10,772
Source: EnergyQuest
Gladstone LNG (GLNG)
GLNG is a joint venture between Santos, Petronas, Total and KOGAS. Petronas is Malaysia’s national oil and gas company, and the second largest LNG exporter in the world, whilst KOGAS is a South Korean state-run utility, and the world’s largest buyer.
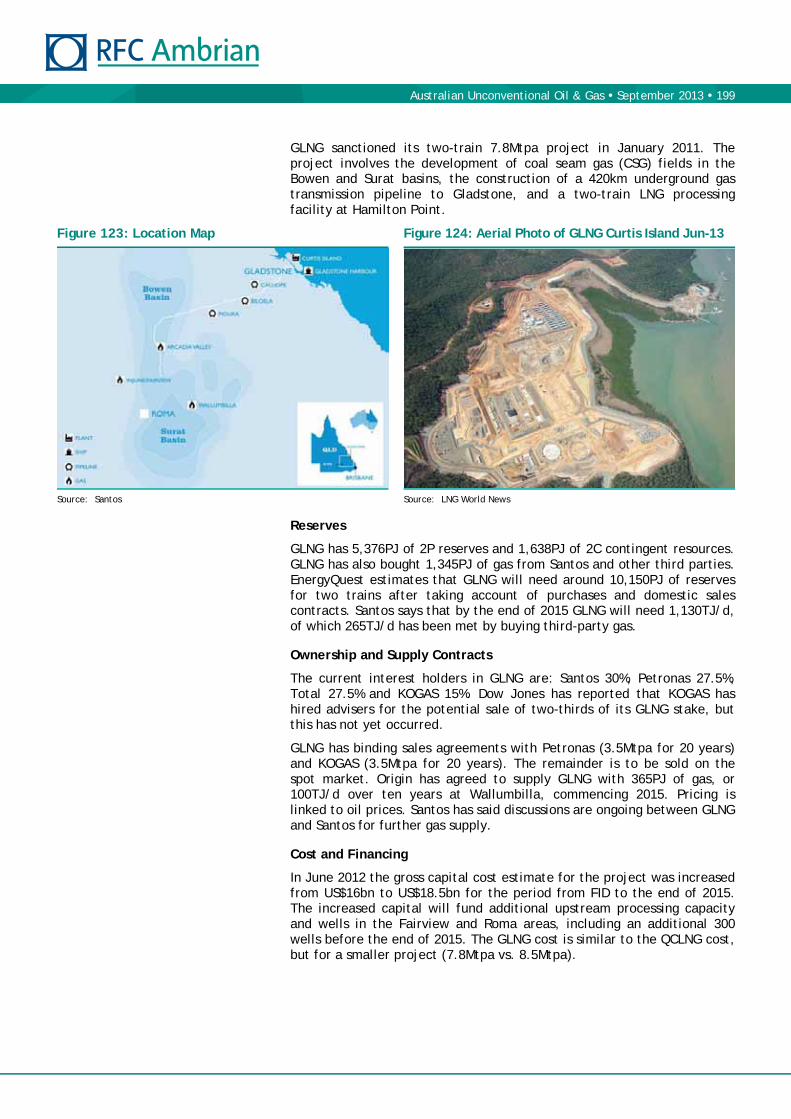
Australian Unconventional Oil & Gas September 2013 199
GLNG sanctioned its two-train 7.8Mtpa project in January 2011. The project involves the development of coal seam gas (CSG) fields in the Bowen and Surat basins, the construction of a 420km underground gas transmission pipeline to Gladstone, and a two-train LNG processing facility at Hamilton Point.
Figure 123: Location Map Figure 124: Aerial Photo of GLNG Curtis Island Jun-13
Source: Santos Source: LNG World News
Reserves
GLNG has 5,376PJ of 2P reserves and 1,638PJ of 2C contingent resources. GLNG has also bought 1,345PJ of gas from Santos and other third parties. EnergyQuest estimates that GLNG will need around 10,150PJ of reserves for two trains after taking account of purchases and domestic sales contracts. Santos says that by the end of 2015 GLNG will need 1,130TJ/d, of which 265TJ/d has been met by buying third-party gas.
Ownership and Supply Contracts
The current interest holders in GLNG are: Santos 30%, Petronas 27.5%, Total 27.5% and KOGAS 15%. Dow Jones has reported that KOGAS has hired advisers for the potential sale of two-thirds of its GLNG stake, but this has not yet occurred.
GLNG has binding sales agreements with Petronas (3.5Mtpa for 20 years) and KOGAS (3.5Mtpa for 20 years). The remainder is to be sold on the spot market. Origin has agreed to supply GLNG with 365PJ of gas, or 100TJ/d over ten years at Wallumbilla, commencing 2015. Pricing is linked to oil prices. Santos has said discussions are ongoing between GLNG and Santos for further gas supply.
Cost and Financing
In June 2012 the gross capital cost estimate for the project was increased from US$16bn to US$18.5bn for the period from FID to the end of 2015. The increased capital will fund additional upstream processing capacity and wells in the Fairview and Roma areas, including an additional 300 wells before the end of 2015. The GLNG cost is similar to the QCLNG cost, but for a smaller project (7.8Mtpa vs. 8.5Mtpa).

Australian Unconventional Oil & Gas September 2013 200
Last Reported Status
Santos has said that the project remains on track to deliver first LNG in 2015. GLNG has been under construction for 30 months out of its total planned construction time of 54 months, and progressed 10% in the last quarter. It is 55% through its construction time and 60% complete.
On Curtis Island, construction of the two trains and supporting infrastructure is ongoing. The first mechanical equipment at the Train 1 site was installed at the end of 2012. First gas through the new upstream facilities is targeted for 4Q13, pipeline completion for 2Q14 and first commissioning gas to Train 1 mid-2014. Production from this train is expected to ramp up over 3-6 months. First LNG from Train 2 is expected 6-9 months after Train 1 and to ramp up over 2-3 years. All 420km of pipe for the gas transmission pipeline has been delivered, but construction is behind QCLNG and APLNG, with 84% of the mainland pipeline right-of-way cleared and graded, 75% of pipe joints strung and 67% of total pipeline length welded out. At the LNG plant site, progress has continued to plan, with the successful raising of the first LNG tank roof. Twenty five of the 82 Train 1 modules have been received.
Queensland Curtis LNG (QCLNG)
The QCLNG project is led by BG Group; the final investment decision was made in 4Q10. The project involves expanding coal seam gas production in the Surat Basin, building a 540km buried natural gas pipeline network linking the gas fields to Gladstone, and the construction of a natural gas liquefaction plant on Curtis Island, where the gas will be converted to LNG for export at an expected initial production rate of 8.5Mtpa. The project continues to be on track for first LNG in 2H14.
Figure 125: Location Map Figure 126: Aerial Photo of QCLNG, Curtis Island
Source: QGC Source: BG Group
Reserves
QGC says it has gross resources (3P plus 2C) of 15Tcf to supply both the LNG plant and domestic contracts. In a strategy presentation, BG quoted 29Tcf of gross total resources. EnergyQuest estimates that QGC needs 12,500PJ for its two trains plus domestic commitments. It has 10,518PJ of 2P gas reserves and 4,508PJ of 2C contingent gas resources. EnergyQuest estimates production to be 33% of capacity, and capacity is estimated to be 33% of gas required for first LNG.
Australian Unconventional Oil & Gas September 2013 201
Ownership and Supply Contracts
In May 2013 BG Group confirmed an agreement to sell an additional 40% interest in the first production facility to CNOOC for US$1.93bn, giving it a half-share in the plant. CNOOC will reimburse BG for its share of project capex incurred from 1 January 2012. BG will supply CNOOC with 5Mtpa of LNG for 20 years, beginning in 2015, sourced from BG’s global LNG portfolio. The price will be set using a formula of 25% Henry Hub-linked vs. 75% oil-linked.
CNOOC will also acquire 40% equity in Train 1 (an equity increase from 10% to 50%), a 20% equity interest (from 5% to 25%) in the reserves and resources of some BG Group tenements in the Walloons Fairway region and a 25% working interest in some Bowen Basin upstream tenements.
BG’s total committed LNG sales to China will be 8.6Mtpa, making BG the largest supplier of LNG to China. BG has a 20-year sales agreement with Tokyo Gas for the supply 1.2Mtpa of LNG from 2015, and a 21-year agreement with Chubu Electric to supply approximately 0.4Mtpa from 2014. These contracts are in addition to contracts to supply Chile (1.7Mtpa) and Singapore (3.0Mtpa).
Cost and Financing
The gross budget is approximately US$21.7bn. Following first LNG, BG expects the project to require a further US$10bn for ongoing gas field development. BG is also seeing a significant reduction in cost pressures as local contractors have less mining work. Upstream opex is expected to be US$11/boe and LNG plant opex US$150m pa. At an oil price of US$90/bbl, and at plateau production, BG expects gross revenues of more than US$5bn pa (FOB). BG initially expected to be able to achieve its corporate targets with just two trains, plus US LNG; however, it has recently begun discussing a third train, albeit in a further 3-4 years, with a prior 2-3 year exploration programme. The QCLNG cost is similar to the GLNG cost, but for a larger project (8.5Mtpa vs. 7.8Mtpa).
Last Reported Status
BG has said the QCLNG project remains on track for first LNG in 2014, and to reach 8Mtpa of sales by 2016. QCLNG has been under construction for 32 months out of its total planned construction time of 50 months, and has seen average progress of around 6% per quarter. It is 64% through its construction time, and 65% complete.
The gas collection header system and pipeline is due for completion in 3Q13. The 340km export pipeline to Curtis Island is due for completion in 4Q13, and the welding for the pipeline is complete. Commissioning of the plant is due to start at the end of 2013. All 80 modules for Train 1 and the common facilities were delivered in April. The roof has been installed on the second LNG tank. QGC has said that it needs to have around 1,750 producing coal seam gas wells by the end of 2013, and over 2,000 by the end of 2014.

Australian Unconventional Oil & Gas September 2013 202
Australia Pacific LNG (APLNG)
APLNG is a joint venture between Origin Energy, ConocoPhillips and Sinopec. The project will take gas from the coal seam gas fields in the Surat and Bowen basins, Queensland, via a pipeline to the LNG facility in Gladstone.
APLNG took its final investment decision for the first 4.5Mtpa train in July 2011, underpinned by an agreement with Sinopec for the supply of 4.3Mtpa of LNG for 20 years from 2015. APLNG took FID on the second train on 4 July 2012. The first two trains will have a processing capacity of up to 9Mtpa. APLNG has been in discussions with Arrow Energy about expanding APLNG for some months now. It is likely that any decision by Arrow will be taken after it has received its environmental approvals.
Figure 127: APLNG Tenure in the Surat and Bowen Basins (at 30 June 2012)
Figure 128: Artist’s Impression of APLNG Plant
Source: Origin Energy Source: APLNG
Reserves
APLNG has 13,349PJ of 2P gas reserves and 3,644PJ of 2C contingent gas resources. Origin Energy has said that APLNG needs around 18,000PJ to cover 10,000PJ for two LNG trains, 1,000PJ contracted to Origin, 2,000PJ of domestic gas contracts, 640PJ contracted to QGC plus approximately 4,360PJ for ramp and tail gas. EnergyQuest estimates that APLNG needs around 14,900PJ of reserves and 2,180TJ/d for two trains and to meet its domestic gas commitments (assuming 15% of feed gas is needed for fuel, and tail gas represents 10% of reserves required). Origin expects the Phase 1 coal seam gas wells to produce 1,200TJ/d on average.
Ownership and Supply Contracts
In August 2011 Sinopec acquired 15% interest in APLNG for US$1.5bn, reducing ConocoPhillips and Origin Energy’s interests to 42.5% each. In January 2012 APLNG and Sinopec signed an agreement for the supply of 7.6Mtpa LNG through to 2035. Sinopec also increased its interest from 15% to 25% for a consideration of US$1.1bn. ConocoPhillips and Origin’s interests were reduced to 37.5%. In June 2012 APLNG signed a 20-year LNG off-take agreement with Kansai Electric for approximately 1Mtpa, with deliveries scheduled to commence in mid-2016.

Australian Unconventional Oil & Gas September 2013 203
Cost and Financing
The most recent estimated project cost for APLNG was A$24.7bn (announced by Origin in February 2013), a 7% increase on the original A$23bn FID announcement. This increase was attributed to increased gathering costs for Train 2 gas, adjustments to CSG water management in line with changes in government policy, and an increased project contingency allowance of A$700m. APLNG has signed agreements for a US$8.5bn project finance facility to provide funding for the downstream part of the project. Origin has also issued €500m of medium-term notes to fund its cash contribution.
Last Reported Status
First LNG is planned for mid-2015 and we believe APLNG has more slack in its timetable than the other two sanctioned Gladstone LNG projects. APLNG has been under construction for 24 months out of its total planned construction time of 48 months, and progressed 9% in the last quarter. It is 50% through its construction time and 45% complete. APLNG’s LNG development drilling is ramping up. In 2012 APLNG said that it needs to drill 1,100 operated wells (30 per month) to deliver first gas for two trains (Phase 1). The main transmission pipeline was 73% complete at the end of June 2013.
On Curtis Island, the Material Offloading Facility was completed in December 2012, and regulatory approvals have been received for its operation. Further plant milestones are: LNG cold box delivery mid-2013, LNG modules mid-2013, pre-commissioning late-2014 and Train 1 ready for its first LNG shipment mid-2015. Installation of compressors and storage tanks at the LNG plant are on the critical path for the project. The roof was raised on the first LNG tank in mid-June, and the roof on the second tank is now in place too. Origin has reported that Train 1 is on track to be completed on or ahead of schedule. All Train 1 modules are due to be delivered to Curtis Island by the end of 2013. The Train 1 gas processing plants should be completed by late 2014. In February ConocoPhillips Chairman and CEO said that it expected Train 1 to start up in late 2014 and Train 2 in 4Q15.
Arrow LNG
Arrow LNG is owned by Royal Dutch Shell and PetroChina in a 50:50 joint venture partnership. The project is significantly less advanced than the other three on Curtis Island, and Shell has slowed the pace on FID for Arrow LNG, citing Australian cost pressures. A decision on development of the Arrow Project has now been pushed back to the end of 2013. We think that it is unlikely that Arrow LNG, in its current proposed form, will go ahead. We believe a smarter strategy would be to merge the project with one of the other Curtis Island developments. According to EnergyQuest, Arrow Energy has been in discussion with APLNG about a potential expansion of APLNG, with Arrow gas being used to supply Trains 3 and 4.
Australian Unconventional Oil & Gas September 2013 204
The planned project consists of six interdependent projects, to produce gas for the domestic and export LNG markets:
Arrow Surat Coal Seam Gas Project.
Arrow Surat Pipeline — A 470km pipeline to take gas from near Kogan in the Surat Basin to Gladstone. This has environmental approval.
Arrow Bowen Pipeline — A 475km high-pressure gas pipeline and associated lateral pipelines to deliver CSG from Arrow’s tenements in the Bowen Basin to Gladstone. This has environmental approval. These two pipelines will be combined into one line and routed via a tunnel to Curtis Island.
Arrow Surat Header Pipeline — A 106km high-pressure gas pipeline to deliver gas from the southern part of the project development area to the Arrow Surat Pipeline.
Arrow LNG Plant — Four trains to be developed in two stages, with ultimate capacity of up to 18Mtpa.
Bowen Gas Project — To expand Arrow’s CSG development in the Bowen Basin.

Australian Unconventional Oil & Gas September 2013 205
Appendix 2 — Australian Acquisitions, Mergers and Farm-in Valuations
Over the last few years there have been several onshore petroleum company mergers and acquisitions and many farm-outs of Australian permit acreage that contain prospective unconventional (and in some cases conventional) petroleum resources. Below we have summarised selected historic mergers and acquisitions that have affected companies covered by this report.
Table 62: Valuation of Recent Australian Onshore Acquisitions and Mergers
Date
Acquirer
Target
Main basin(s)
Net target acres acquired
(m)
Transaction value
(US$m)
Value per acre
(US$/acre)
Nov-10 Beach Impress Cooper 0.5 72 145
Feb-11 Senex Stuart Petroleum Cooper 1.4 78 56
Nov-11 Beach Adelaide Cooper, Otway 1.4 95 68
Apr-12 Cooper Somerton Otway, Gippsland 0.6 33 55
Oct-12 Drillsearch Acer Cooper, Bass 5.3 120 23
Source: Company data, RFC Ambrian estimates
In May 2009 Beach Energy made a hostile ~A$50m bid for Drillsearch that was ultimately unsuccessful. The all share offer represented a 21% premium to Drillsearch’s pre-bid closing price. At the close of the bid in August 2009, Beach had acquired ~22% of Drillsearch’s shares, which have subsequently been sold. We believe that the main driving force behind Beach’s bid was its desire to consolidate its interest in the Cooper Basin Western Flank Oil licence PEL 91.
In November 2010 Beach announced a friendly A$73m merger with Impress Energy (ITC). Beach initially offered A¢8.25/ITC share, a 21% premium to the pre-bid closing price. Senex then increased its ~10% stake to ~20%. However, Beach cemented the deal when it upped the bid to A¢8.5/share and bought Senex’s ~20% stake. ITC’s assets were primarily focused on the Cooper Basin, where it had a 40% non-operated interest in four exploration permits, one petroleum retention licence and two production licences. The main permits covered ~2,000km2 (0.5m acres) of Western Flank oil fairway that were operated by Senex. They hosted the Growler, Mirage and Ventura producing oil fields, and the Wirraway, Warhawk, Tigercat and Snatcher oil discoveries. ITC produced a net 96,000bbl of oil in FY10, generating sales of A$7.9m.
In February 2011 Senex announced a friendly merger with Stuart Petroleum (STU). Senex offered 2.5 Senex shares for each Stuart Petroleum share, valuing STU at A$78m. The offer represented a 62% premium to the pre-bid closing prices of both companies and was completed in mid-2011. Stuart had interests in acreage consisting of six exploration and ten production Cooper Basin licences covering an area of approximately 5,700km2 (1.4m acres). STU produced a net 193,000bbl of oil in FY10 from seven Cooper Basin oil fields, generating sales of A$25.2m. At the end of 2010 STU had 2.2MMbbl of 2P oil reserves. We believe that although the value of Senex’s offer was underpinned by STU’s cash and oil assets, Senex management was interested in the unconventional shale gas potential of Stuart’s 100%-owned PEL 516.
Beach Energy — Drillsearch Energy
Beach Energy — Impress Energy
Senex Energy — Stuart Petroleum

Australian Unconventional Oil & Gas September 2013 206
In November 2011 Beach Energy made an ultimately successful A$94m bid for Adelaide Energy (ADE). The A¢20.0/share bid was a 43% premium to ADE’s pre-bid closing price. ADE had more than a dozen licences covering 5,645km2 (1.4m acres) in parts of the Cooper, Otway, Maryborough and Surat basins. In FY11 ADE had sales of over A$4m from the sale of gas and condensate from its Katnook Gas Plant in the Otway Basin. However, we believe Beach’s bid was due to its desire to consolidate its interest in two key Nappamerri Trough unconventional licences. ADE held 122,000 unconventional Cooper Basin net acres through a 10% interest in the Permian section of PEL 218 (and 20% in the post Permian section) and a 20% stake in ATP 855P.
Cooper announced a recommended plan to merge with Somerton Energy (SNE) in April 2012. The cash and shares offer valued SNE at A$32m, a 56% premium to the pre-bid closing value of the shares. Somerton owned interests in six exploration licences and one petroleum retention licence in the Otway and Gippsland basins, covering a net 2,500km2 (0.6m acres). We believe that Cooper management bought Somerton for its exposure to unconventional shale/tight gas that could be easily sold into Australia’s East Coast gas market. In particular, Cooper wanted to increase its interest in Otway Basin PEL 495 (Cooper already owned 50% and Somerton owned 15%), with its unconventional Casterton Formation gas/liquid potential in the Penola Trough.
In October 2012 Drillsearch Energy made a successful A$118m bid for Acer Energy (ACN). The A¢28.5/share bid was a 46% premium to ACN’s pre-bid closing price. ACN had a 21,400km2 (5.3m acres) net acreage position in the Cooper-Eromanga, Darling and Bass basins. We believe that, although the offer price was largely underpinned by the value of ACN’s cash and Cooper Basin oil licences, the attraction to Drillsearch was the undervalued potential of the wet gas discoveries (Yarrow, Ginko and Crocus) in ACN’s northern Cooper Basin tenements. At the time of the bid ACN had 14.6MMboe of 2C contingent gas and NGL resources (and just 1.1MMbbl of 2C contingent oil resources) according to a 4 October 2012 Drillsearch presentation.
Beach Energy — Adelaide Energy
Cooper Energy — Somerton Energy
Drillsearch Energy — Acer Energy

Australian Unconventional Oil & Gas September 2013 207
Below we have summarised 20 recent, Australian, unconventional farm-ins. The weighted average valuation of the permits below is around US$23/acre. If we exclude the three highly valued outliers (two in the Nappamerri Trough in the Cooper Basin, and the third, EP 413, in the Perth Basin), the weighted average valuation is around US$16/acre. Below in Table 63 we go through our understanding of the individual farm-in terms and estimate the effective value of services given for the licence interest received. This value is often very different from the headline investment highlighted in company press releases.
Table 63: Valuation of Recent Australian Farm-in Deals
Date
Farmor
Farminee
Basin
Net farm-in acres (m)
Transaction value
(US$m)
Value per acre
(US$/acre)
Jun-10 Buru Mitsubishi Corp Canning 8.649 132.5 15
Sep-10 Norwest Bharat Petr Perth 0.080 1.8 23
Oct-10 Norwest Bharat Petr Perth 0.035 9.1 260
Dec-10 Exoma CNOOC Galilee 3.316 45.5 14
Dec-10 Cooper Energy Beach Energy Otway 0.069 2.6 38
Feb-11 Falcon O&G Hess Corp Beetaloo 3.892 92.5 24
Mar-11 New Standard Green Rock Canning 0.157 4.1 26
Jun-11 Icon Energy Beach Energy Cooper 0.165 4.7 28
Jul-11 Drillsearch BG Cooper 0.300 77.5 258
Sep-11 New Standard ConocoPhillips Canning 8.896 109.5 12
Oct-11 Territory O&G Beach Energy Bonaparte 2.530 39 15
Jun-12 PetroFrontier Statoil Georgina 8.016 173.0 22
Oct-12 Central Petr Santos Amadeus 13.090 150.0 11
Nov-12 Central Petr Total Georgina 4.080 70.0 17
Dec-12 Tamboran Res Santos Beetaloo/McArthur 4.650 74.9 16
Feb-13 ConocoPhillips PetroChina Canning 3.440 110.0 32
May-13 Buru Mitsubishi Corp Canning 1.005 15.0 15
May-13 Buru Rey Resources Canning 0.402 6.0 15
May-13 Beach Chevron Cooper 0.387 349.0 902
Jun-13 PetroFrontier Statoil Georgina 10.032 180.0 18
Aug-13 Ambassador Outback Energy Cooper 0.415 45.0 108
Total/Weighted average 73.050 1,691.7 23
Source: Company data, RFC Ambrian estimates
In June 2010 Buru Energy farmed out 50% of nearly all its exploration permits in the Canning Basin to Mitsubishi Corp. Mitsubishi could earn the right to acquire these 50% interests by carrying up to A$102.4m of Buru’s exploration costs in the permits (A$40m of which is to be spent on unconventional exploration) and carrying up to A$50m of Buru’s infrastructure development costs. Mitsubishi also gained the right to acquire 50% of Buru’s production permits at a price set by an independent expert. At the time Buru’s permits covered a total of 75,000km2 (18.5m acres).
In September 2010 Norwest Energy farmed out 50% of TP 15 and 27.803% of EP 413 to Bharat PetroResources in the Perth Basin. Bharat paid A$0.5m of past costs and up to A$4.5m (estimated total cost A$7.5m) of the drilling, completion and testing costs of the Red Hill South well for its interest in TP 15. Thus, we estimate the effective cost of this 50% interest was A$2.0m. Norwest estimated that TP 15 had gross conventional prospective recoverable resources of 111Mbbl at the time of the farm-out. However, the Red Hill South well was a dry hole. Bharat paid A$10m in cash for 28.303% of EP 413 (gross area of 125,600 acres), which the company believes has good unconventional prospectivity.
Buru Energy — Mitsubishi Corp
Norwest Energy — Bharat PetroResources

Australian Unconventional Oil & Gas September 2013 208
In December 2010 Exoma Energy farmed out 50% of its five Galilee Basin permits (ATP 991, 996, 999, 1005 & 1008) to CNOOC. CNOOC could earn a 50% interest in the permits by carrying up to A$50m of Exoma’s coal seam gas and shale gas exploration costs in these permits. CNOOC was also given options over new shares that were equivalent to 19.9% of the equity (with a strike price set at A¢31.5 — the then recent market high). This option was not exercised. The five permits cover a total of 26,840km2 (6.6m acres). Given CNOOC’s extensive other interests in Australian coal seam gas, we believe this resource, rather than shale gas, was the main reason CNOOC made its investment.
In December 2010 Cooper Energy farmed out a 35% interest in PEL 495, Otway Basin, to Beach Energy. Beach agreed to pay A$0.22m cash, back costs of A$0.22m and fund 70% of the Sawpit-2 well. Cooper estimated the value of the farm-in at the time to be A$2.6m.
In February 2011 Falcon Oil & Gas farmed out 62.5% of most of three Beetaloo Basin permits (EP 76, 98 & 117) to Hess Corporation. Hess earned its interest by paying US$17.5m in cash, carrying Falcon in the acquisition and processing of up to US$40m of seismic data across the permits and paying for a five-well work programme (we estimate each well might cost US$7m). Thus, we estimate the total cost for Hess’ interest is US$92.5m. Hess also paid US$2.5m for 10m warrants, exercisable at the then market price into the same number of Falcon shares. The agreement area covers a total of 25,200km2 (6.2m acres). In July 2013 Hess pulled out of the project after completing the seismic, but before it had to commit to the five-well drilling programme.
In March 2011 New Standard Energy (NSE) farmed out 20% of EP 417 (Canning Basin) to Green Rock Energy. Green Rock could earn the first 15% by paying NSE A$0.75m in cash and funding 27.5% of the final drilling, completion and testing of the Lawford-1 well up to a cap of A$4m. Green Rock could earn a further 5% by funding 22.5% of the drilling, completion and testing of a second well up to a cap of A$10m.
In July 2011 Icon Energy farmed out 40% of ATP 855P (Cooper Basin) to Beach Energy. Beach will earn this interest by funding Icon’s share of the drilling of an unconventional fracture stimulated well with an estimated gross cost of A$16m, with the exception of a A$1.75m contribution by Icon. We estimate that this means Beach effectively paid A$4.65m for its 40% interest. ATP 855P covers 1,670km2 (0.4m acres).
In July 2011 Drillsearch (DLS) formed a joint venture with QGC (BG subsidiary) in which QGC acquired a 60% interest in ATP 940P in the Cooper Basin. QGC paid DLS A$2.5m for back costs and committed to fund A$90m of the first A$100m of the planned exploration, appraisal and pilot production programme. From this, we estimate that QGC is spending A$77.5m to acquire its 60% interest (DLS’s A$10m x 60%/40% = A$15m as QGC’s post-farm-out proportionate share of costs. A$90m less A$15m plus A$2.5m = QGC’s cost to buy 60% interest). QGC also committed to spend A$130m over five years on exploration, appraisal and a pilot production programme, although all spending above the first A$100m is funded on a 60/40 QGC/DLS basis. QGC was also issued DLS share options equivalent to 9.9% of the company with a strike price of A¢62 (the then market price). The options were exercised in February 2013. ATP 940P covers 2,000km2 (0.5m acres).
Exoma Energy — CNOOC
Cooper Energy — Beach Energy
Falcon Oil & Gas — Hess Corporation
New Standard Energy — Green Rock Energy
Icon Energy — Beach Energy
Drillsearch — QGC (BG subsidiary)
Australian Unconventional Oil & Gas September 2013 209
In September 2011 New Standard Energy (NSE) farmed out a 75% interest in the Goldwyer Project (Canning Basin) to ConocoPhillips (COP). COP paid NSE A$1m upfront and will spend US$109.5m in four phases, funding 100% of project exploration, appraisal and development (up to certain caps for each phase). In the first phase COP will pay for the drilling, completion and testing of three vertical wells, up to a cap for each activity. Drilling costs beyond the cap will be borne 100% by NSE, while completion and testing costs beyond the cap will be borne 50/50 by NSE and COP. The drilling cost caps were set between US$7.0-8.5m depending on the well depth. Unfortunately for NSE, it appears that the wells will cost around US$20m each due to the remoteness of the locations (due to having to build roads and airstrips). Subsequent exploration activities will depend on the results of these tests. Any costs beyond the three-stage caps are split 25% NSE and 75% COP. In the final stage COP will spend US$40m on a pilot production scheme. The Goldwyer Project covers 48,000km2 (11.9m acres).
In October 2011 Territory Oil & Gas farmed out to Beach Energy up to 90% of two onshore Bonaparte Basin permits, Northern Territory. Beach agreed to fund a three-phase work programme in EP 128 and EP(A) 138 in exchange for up to 90% interests in them. The farm-in expenditure is capped at A$13m per 25% interest earned in each phase. Beach has an option to earn an additional 5% interest in each phase by funding beyond the cap should Territory not wish to contribute its share.
In June 2012 PetroFrontier (PF) farmed out to Statoil a 65% interest in its four granted permits (EP 103, 104, 127 & 128) and two permit applications (EP 213 & 252) in the South Georgina Basin. Statoil agreed to acquire its interest over four phases at the end of which it would have contributed US$210m of the proposed US$230m exploration, appraisal and development costs. During Phase 1 Statoil would contribute 50% of US$50m exploration costs and at the end of the phase would have had the option to buy a 25% interest in the permits for US$25m. PF struggled to raise the US$25m capital it needed for Phase 1 and was forced to renegotiate the deal. Unrisked prospective recoverable (P50) resources on the four granted permits were estimated to be 27.5Bbbl by Ryder Scott in November 2010. These permits covered 13.5m acres of land.
In October 2012 Central Petroleum (CTP) farmed out 70% of 13 permits and application areas in the Amadeus and Pedirka basins to Santos (STO). Santos agreed to spend up to A$150m on exploration to earn its interest in three stages: A$30m in the first stage, A$60m in the second and A$60m in the third to earn up to 70% in the areas, which cover over 75,000km2 (18.7m acres).
In November 2012, Central Petroleum (CTP) farmed out 68% of four permits in the Southern Georgina Basin to French major Total (TOT). Total agreed to fund 80% of US$190m worth of exploration and appraisal costs in three stages over four years. From this, we estimate that TOT is spending US$22.8m to acquire its 68% interest ((80%-68%) x US$190m) in the permits which cover nearly 24,000km2 (6.0m acres).
In December 2012 Tamboran Resources farmed out 75% of four permits and application areas in the Beetaloo and McArthur basins to Santos (STO). In the first stage, Santos agreed to spend A$41m on exploration to earn a 50% interest in the permits. Santos will then have the option to spend a further A$30m to earn another 25% interest in the areas, which cover nearly 25,000km2 (6.2m acres). Santos also agreed to acquire a 14% interest in Tamboran for A$10m.
In February 2013 ConocoPhillips (COP) farmed out a 29% interest in the Goldwyer Project (Canning Basin) to PetroChina. The price paid by PetroChina values the project at US$100m, according to New Standard Energy. This equates to PetroChina paying COP ~US$29m for its interest. The Goldwyer Project covers 48,000km2 (11.9m acres).
New Standard Energy — ConocoPhillips
Territory Oil & Gas — Beach Energy
PetroFrontier — Statoil
Central Petroleum — Santos Ltd
Central Petroleum — Total
Tamboran Resources — Santos Ltd
ConocoPhillips — PetroChina

Australian Unconventional Oil & Gas September 2013 210
In March 2013 Buru sold 37.5% and 15% stakes in the Fitzroy blocks to Mitsubishi Corp and Rey Resources respectively. Mitsubishi paid A$15.042m for its stake, while Rey paid A$6.016m. The Fitzroy blocks include permits EP 457 and EP 458 and cover around 11,000km2 (2.7m acres).
In February 2013 Beach Energy (BPT) farmed out 60% of its working interests in PEL 218 and ATP 855 (Nappamerri Trough) to Chevron for a multi-stage payment of US$359m. In Stage 1 Chevron will make a cash payment of US$36m and carry US$95m of exploration and appraisal work for a 30% interest in PEL 218 and will acquire an 18% interest in ATP 855 for US$59m. In Stage 2 Chevron will make a cash payment of US$41m and carry US$47m of exploration and appraisal work for a further 30% interest in PEL 218 and will acquire another 18% interest in ATP 855 for US$36m. Should Chevron want to proceed post-Stage 2, it has agreed to a US$35m commitment bonus payment. A put option was also granted by Beach to Icon, exercisable by Icon up to 30 June 2013, for Beach to acquire 4.9% of ATP 855 from Icon on payment by Beach of US$18m. PEL 218 covers 1,604km2 (0.4m acres), while ATP 855 covers 1,679km2 (0.4m acres).
PetroFrontier struggled to raise the initial US$25m of funds it needed for Phase 1 of its June 2012 Georgina Basin farm-out and had to renegotiate the terms. In June 2013 PetroFrontier announced that it had signed an amended farm-in agreement with Statoil. Under the terms of this new agreement Statoil will contribute US$160m over three phases to earn 80% of PetroFrontier’s working interest in the four granted and two application permits. PetroFrontier had 100% working interests in two granted permits (EP 103 & 104) and two permit applications (EP 213 and 252). It had a 75% working interest in EPs 127 and 128.
Statoil will spend the next US$50m on exploration and assume operatorship on 1 September 2013. At the end of this phase, Statoil will have the option to continue to the next phase. If Statoil elects not to continue, it must return to PetroFrontier 50% of its former working interests in the permits. Upon proceeding to the next phase, Statoil will spend the next US$30m on exploration. At the end of this phase, Statoil will have the option to continue to the final phase. If Statoil elects not to continue to Phase 3, then it must return to PetroFrontier 25% of its former working interests in the permits. Upon proceeding to the final phase, Statoil will spend the next US$80m on exploration. At the end of Phase 3, Statoil will own 80% and PetroFrontier will own 20% of PetroFrontier’s former working interests in the permits. Unrisked prospective recoverable (P50) resources on the four granted permits were estimated to be 26.4Bbbl by Ryder Scott in November 2010. PetroFrontier had 12.5m net acres of land in these permits prior to the farm-out.
In August 2013 Ambassador Oil & Gas announced that it had signed a binding Heads of Agreement with Outback Energy to farm out 70% of PEL 570 in the northern Cooper Basin. To earn this interest Outback Energy agreed to carry Ambassador through up to A$50m of exploration work to satisfy the work commitments for PEL 570’s first five-year term (500km2 of 3D seismic and three wells). The farm-out will be conditional on Outback subscribing for Ambassador shares. Ambassador management believes that PEL 570 has 13Tcf of coal seam gas in place, over 8Tcf of tight gas in place and 1.5Tcf of shale gas in place.
Buru Energy — Mitsubishi Corp/Rey Resources
Beach Energy — Chevron
PetroFrontier — Statoil
Ambassador Oil & Gas — Outback Energy Hunter Pty
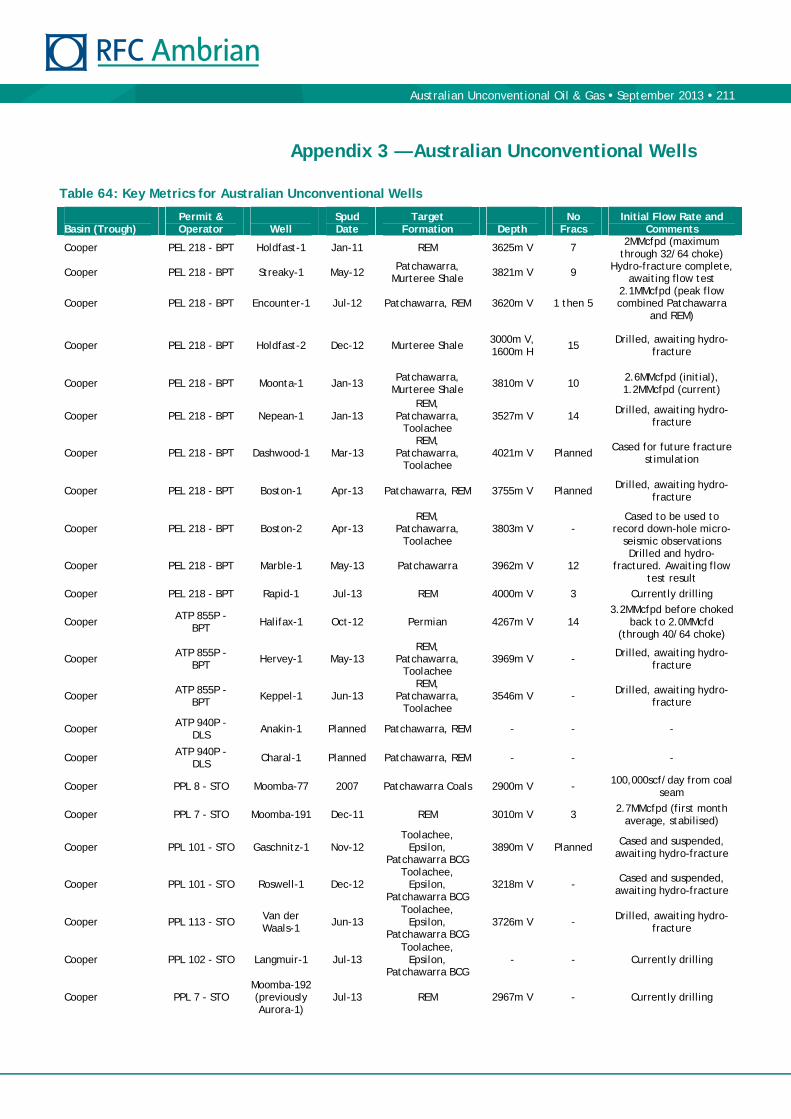
Australian Unconventional Oil & Gas September 2013 211
Appendix 3 — Australian Unconventional Wells
Table 64: Key Metrics for Australian Unconventional Wells
Basin (Trough)
Permit & Operator
Well
Spud Date
Target Formation
Depth
No Fracs
Initial Flow Rate and Comments
Cooper PEL 218 - BPT Holdfast-1 Jan-11 REM 3625m V 7 2MMcfpd (maximum
through 32/64 choke)
Cooper PEL 218 - BPT Streaky-1 May-12 Patchawarra,
Murteree Shale 3821m V 9 Hydro-fracture complete,
awaiting flow test
Cooper PEL 218 - BPT Encounter-1 Jul-12 Patchawarra, REM 3620m V 1 then 5 2.1MMcfpd (peak flow combined Patchawarra
and REM)
Cooper PEL 218 - BPT Holdfast-2 Dec-12 Murteree Shale 3000m V, 1600m H
15 Drilled, awaiting hydro-
fracture
Cooper PEL 218 - BPT Moonta-1 Jan-13 Patchawarra,
Murteree Shale 3810m V 10
2.6MMcfpd (initial), 1.2MMcfpd (current)
Cooper PEL 218 - BPT Nepean-1 Jan-13 REM,
Patchawarra, Toolachee
3527m V 14 Drilled, awaiting hydro-
fracture
Cooper PEL 218 - BPT Dashwood-1 Mar-13 REM,
Patchawarra, Toolachee
4021m V Planned Cased for future fracture
stimulation
Cooper PEL 218 - BPT Boston-1 Apr-13 Patchawarra, REM 3755m V Planned Drilled, awaiting hydro-
fracture
Cooper PEL 218 - BPT Boston-2 Apr-13 REM,
Patchawarra, Toolachee
3803m V - Cased to be used to
record down-hole micro-seismic observations
Cooper PEL 218 - BPT Marble-1 May-13 Patchawarra 3962m V 12 Drilled and hydro-
fractured. Awaiting flow test result
Cooper PEL 218 - BPT Rapid-1 Jul-13 REM 4000m V 3 Currently drilling
Cooper ATP 855P -
BPT Halifax-1 Oct-12 Permian 4267m V 14
3.2MMcfpd before choked back to 2.0MMcfd
(through 40/64 choke)
Cooper ATP 855P -
BPT Hervey-1 May-13
REM, Patchawarra,
Toolachee 3969m V -
Drilled, awaiting hydro-fracture
Cooper ATP 855P - BPT
Keppel-1 Jun-13 REM,
Patchawarra, Toolachee
3546m V - Drilled, awaiting hydro-fracture
Cooper ATP 940P -
DLS Anakin-1 Planned Patchawarra, REM - - -
Cooper ATP 940P - DLS
Charal-1 Planned Patchawarra, REM - - -
Cooper PPL 8 - STO Moomba-77 2007 Patchawarra Coals 2900m V - 100,000scf/day from coal
seam
Cooper PPL 7 - STO Moomba-191 Dec-11 REM 3010m V 3 2.7MMcfpd (first month
average, stabilised)
Cooper PPL 101 - STO Gaschnitz-1 Nov-12 Toolachee,
Epsilon, Patchawarra BCG
3890m V Planned Cased and suspended,
awaiting hydro-fracture
Cooper PPL 101 - STO Roswell-1 Dec-12 Toolachee,
Epsilon, Patchawarra BCG
3218m V - Cased and suspended,
awaiting hydro-fracture
Cooper PPL 113 - STO Van der Waals-1
Jun-13 Toolachee,
Epsilon, Patchawarra BCG
3726m V - Drilled, awaiting hydro-
fracture
Cooper PPL 102 - STO Langmuir-1 Jul-13 Toolachee,
Epsilon, Patchawarra BCG
- - Currently drilling
Cooper PPL 7 - STO Moomba-192 (previously Aurora-1)
Jul-13 REM 2967m V - Currently drilling

Australian Unconventional Oil & Gas September 2013 212
Basin (Trough)
Permit & Operator
Well
Spud Date
Target Formation
Depth
No Fracs
Initial Flow Rate and Comments
Cooper SACB JV - STO Fortuna-2 Planned Murteree Shale 1520m H 15-20 -
Cooper SACB JV -STO Roswell-2 Planned Roseneath Shale 300m H 5 -
Cooper PPL 7 - STO Fortuna-1 Planned - - 15-20 -
Cooper SACB JV - STO Moomba-
193H/Aurora-2
Planned 2H13
Murteree Shale 915m H 10 -
Cooper PEL 516 - SXY Vintage Crop-1 May-11
Roseneath, Murteree, Toolachee,
Patchawarra
3000m V - Drilled and discovered a conventional oil field,
awaiting hydro-fracture
Cooper PEL 516 - SXY Sasanof-1 Jan-12 Epsilon, Patchawarra
3102m V -
178,000cfpd (peak liquids-rich gas flow rate). Liquids volume 10-
20bbl/MMcf
Cooper PEL 516 - SXY Talaq-1 Apr-12 Toolachee Coals 2879m V 1 planned
Drilled, awaiting hydro-fracture
Cooper PEL 516 - SXY Skipton-1 Aug-12 Patchawarra, REM 3000m V 8
planned Hydro-fractured, awaiting
flow test result
Cooper PEL 90 - SXY Paning-2 Feb-13 Patchawarra, Toolachee
3144m V 5 90,000cfpd (initial) from Toolachee coals
Cooper PEL 115 - SXY Hornet-1 2004 & early 2013
Patchawarra 2727m V 6 Flowed gas to the surface
>2MMcfpd
Cooper PEL 115 - SXY Kingston Rule-1
Late 2012
Patchawarra, REM 2872m V 5 1.2MMcfpd (peak, liquids rich gas). Liquids volume
15-20bbl/MMcf
McArthur EP 171 - AJQ Glyde-1 &
ST1
Jun-12 & Aug-
12
Barney Creek, Coxco Dolomite
698m V, 840m H
- 3.3MMcfpd (initial) on a
64/64 choke
McArthur EP 176 - AJQ Cow Lagoon-1
May-12 Barney Creek, Coxco Dolomite
1804m V - Gas flows and shows
McArthur EP171 - AJQ Kilgour North-1 Jun-12
Barney Creek, Coxco Dolomite 1046m V - P&A
South Nicholson ATP 1087 - AJQ
Egilabria-2 & DWI
May-13 Lawn Hill Shale 1900m V, 600m H
- Drilled, awaiting hydro-fracture
Gippsland PEP 166 - LKO Holdgate-1 May-12 Strzelecki Gp 2752m V - Gas readings across large
intervals
Otway PEP 169 - LKO Moreys-1 Apr-12 Waarre, Flaxman,
Eumeralla 2000m V - Tight wet gas discovery requires fraccing to be
commercial
Otway PEP 169 - LKO Otway-1 Planned Waarre, Flaxman, Eumeralla
- - -
Otway PEL 495 - COE Sawpit-2 Feb-13 Crayfish Gp, Casterton
2558m V - P&A
Canning EP 391 - BRU Yulleroo-2 Jan-08 Laurel 3500m V 3 No stabilised flow rate
Canning EP 371 - BRU Valhalla-2 Jul-11 Laurel 3390m V - Awaiting hydro-fracture
Canning EP 431 - BRU Pictor East-1 Aug-11 Nita, Acacia 1706m V - Plugged back
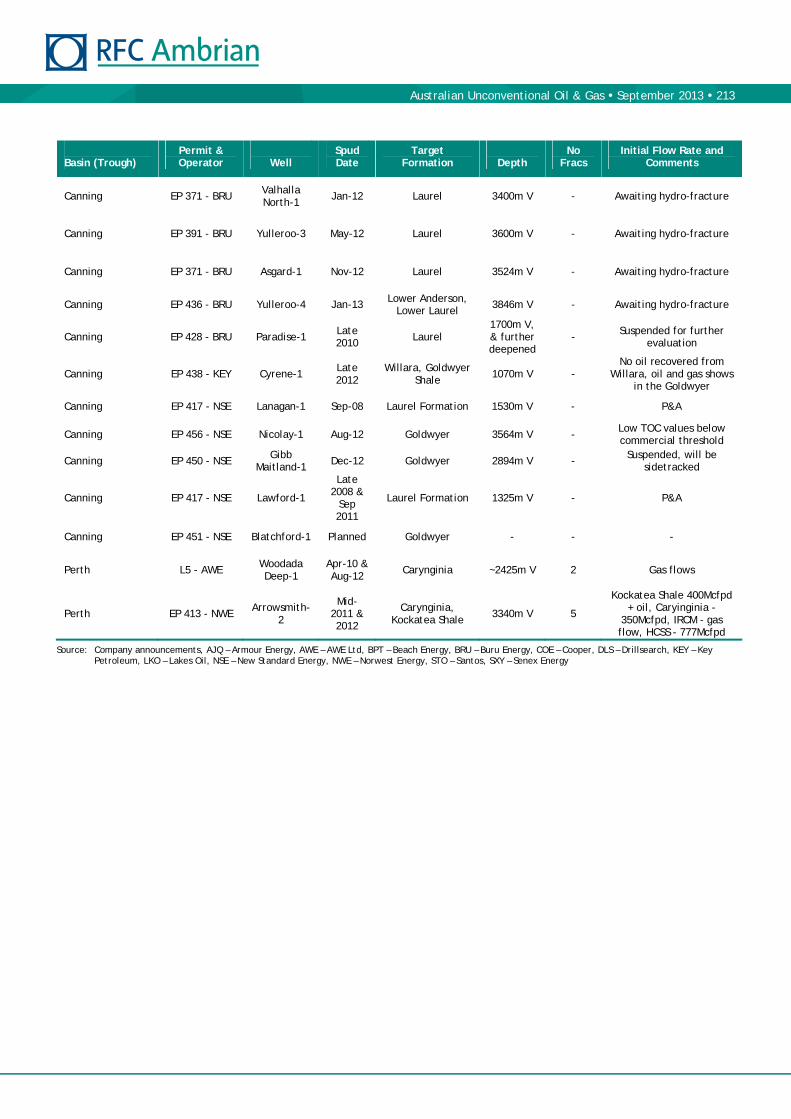
Australian Unconventional Oil & Gas September 2013 213
Basin (Trough)
Permit & Operator
Well
Spud Date
Target Formation
Depth
No Fracs
Initial Flow Rate and Comments
Canning EP 371 - BRU Valhalla North-1
Jan-12 Laurel 3400m V - Awaiting hydro-fracture
Canning EP 391 - BRU Yulleroo-3 May-12 Laurel 3600m V - Awaiting hydro-fracture
Canning EP 371 - BRU Asgard-1 Nov-12 Laurel 3524m V - Awaiting hydro-fracture
Canning EP 436 - BRU Yulleroo-4 Jan-13 Lower Anderson, Lower Laurel
3846m V - Awaiting hydro-fracture
Canning EP 428 - BRU Paradise-1 Late 2010 Laurel
1700m V, & further deepened
- Suspended for further
evaluation
Canning EP 438 - KEY Cyrene-1 Late 2012
Willara, Goldwyer Shale
1070m V - No oil recovered from
Willara, oil and gas shows in the Goldwyer
Canning EP 417 - NSE Lanagan-1 Sep-08 Laurel Formation 1530m V - P&A
Canning EP 456 - NSE Nicolay-1 Aug-12 Goldwyer 3564m V - Low TOC values below commercial threshold
Canning EP 450 - NSE Gibb
Maitland-1 Dec-12 Goldwyer 2894m V - Suspended, will be
sidetracked
Canning EP 417 - NSE Lawford-1
Late 2008 &
Sep 2011
Laurel Formation 1325m V - P&A
Canning EP 451 - NSE Blatchford-1 Planned Goldwyer - - -
Perth L5 - AWE Woodada Deep-1
Apr-10 & Aug-12
Carynginia ~2425m V 2 Gas flows
Perth EP 413 - NWE Arrowsmith-
2
Mid-2011 & 2012
Carynginia, Kockatea Shale
3340m V 5
Kockatea Shale 400Mcfpd + oil, Caryinginia -
350Mcfpd, IRCM - gas flow, HCSS - 777Mcfpd
Source: Company announcements, AJQ – Armour Energy, AWE – AWE Ltd, BPT – Beach Energy, BRU – Buru Energy, COE – Cooper, DLS – Drillsearch, KEY – Key Petroleum, LKO – Lakes Oil, NSE – New Standard Energy, NWE – Norwest Energy, STO – Santos, SXY – Senex Energy
Australian Unconventional Oil & Gas September 2013 214
Appendix 4 — A Brief History of the US Unconventional Gas and Liquids Industry
In 2010 the US surpassed Russia as the largest natural gas producer in the world, with shale gas accounting for 23% of US natural gas production. Projections for future volumes are being continually revised upwards, with plans now to add export capabilities. The key technological advancements have occurred in horizontal well drilling and reservoir stimulation (through hydro-fracturing), which have had game-changing effects on well economics.
The use of horizontal drilling in conjunction with hydraulic fracturing has greatly expanded the ability of producers to recover natural gas and oil profitably from low-permeability geologic plays once thought uneconomical. These technologies reduced the per unit capital and production costs of process intensive unconventional gas operations. These technologies are not new, but have been developed and improved upon over several decades. We detail below the key technical advancements and economic environment that have allowed the substantial gas resources held in these tight rocks to be unlocked.
First Commercial Shale Gas Production
The first commercial shale gas well in the US was drilled in Fredonia, New York, in 1825. Dug by William Hart, regarded as the ‘father of natural gas’ in America, it produced gas from Devonian organic-rich shale. After noticing gas seeping out of the black shale in stream beds, he dug a well to obtain a larger flow to the surface. He built pipelines from wood coated with tar-soaked rags, and then from lead and tin. Expanding on his work, the first US natural gas company, Fredonia Gas Light Company, was formed, using the gas to light the streets and many buildings in Fredonia. This shale well and development was nearly 40 years before the breakthrough oil discovery wells in Titusville, Pennsylvania.
Going Sideways
Well productivity can be increased by drilling the well laterally within the reservoir, thus maximising the contact area between the well bore and the reservoir. The progress towards horizontal drilling began with slanted directional wells in the 1930s. One of the most notable critical technological advancements required for directional drilling was the development of down-hole rotary drilling motors, which began in the 1970s, encouraged by federal initiatives. It took until the early 1980s before the practical application of horizontal drilling to oil production began. By this time the invention of other necessary supporting equipment, materials and technology brought horizontal drilling within the realm of commercial viability.
In 1986, as part of a federal effort, the Department of Energy sponsored the drilling of a 2,000ft horizontal well in the Devonian shales of Wayne County, West Virginia. While this well demonstrated that long horizontal wells could be drilled in shale formations, its design was still not commercially viable at the time. The final breakthroughs would come in the Barnett shale in north-east Texas. Here, Mitchell Energy was experimenting with different fracture stimulation techniques.
The rise in production has been underpinned by technological advancements in hydraulic fracture stimulation and horizontal drilling
Natural gas was first extracted nearly 35 years before oil in the US
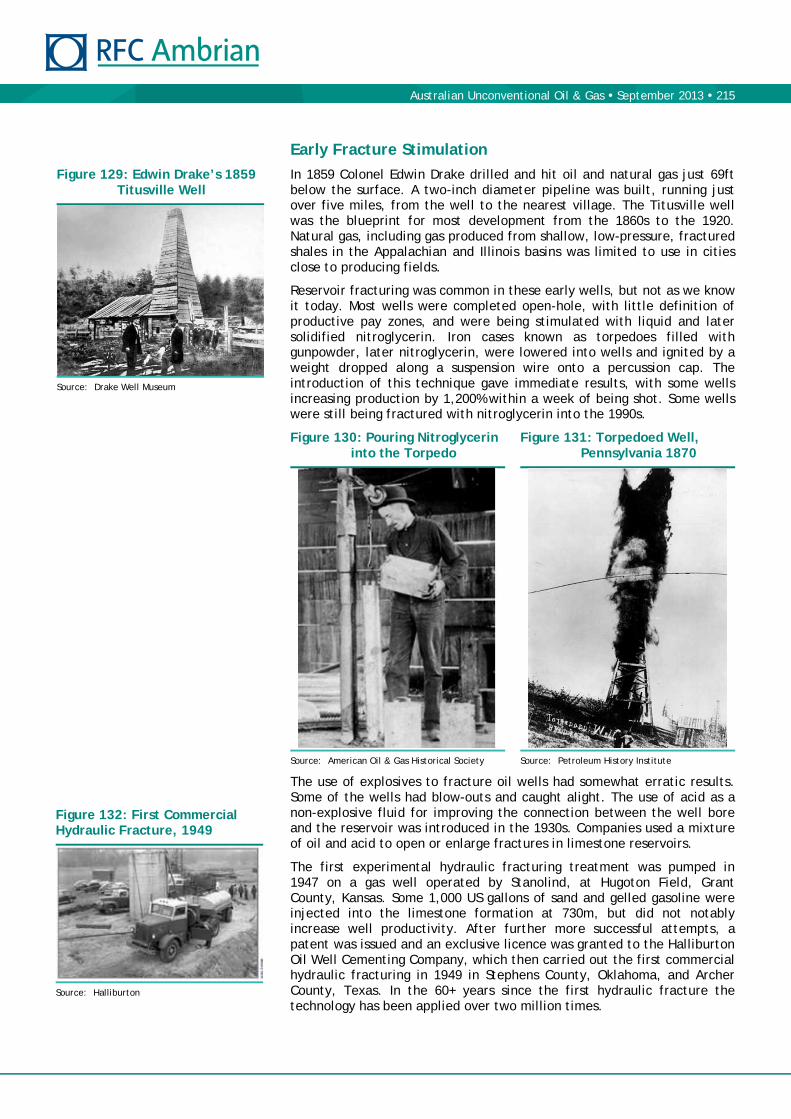
Australian Unconventional Oil & Gas September 2013 215
Early Fracture Stimulation
In 1859 Colonel Edwin Drake drilled and hit oil and natural gas just 69ft below the surface. A two-inch diameter pipeline was built, running just over five miles, from the well to the nearest village. The Titusville well was the blueprint for most development from the 1860s to the 1920. Natural gas, including gas produced from shallow, low-pressure, fractured shales in the Appalachian and Illinois basins was limited to use in cities close to producing fields.
Reservoir fracturing was common in these early wells, but not as we know it today. Most wells were completed open-hole, with little definition of productive pay zones, and were being stimulated with liquid and later solidified nitroglycerin. Iron cases known as torpedoes filled with gunpowder, later nitroglycerin, were lowered into wells and ignited by a weight dropped along a suspension wire onto a percussion cap. The introduction of this technique gave immediate results, with some wells increasing production by 1,200% within a week of being shot. Some wells were still being fractured with nitroglycerin into the 1990s.
Figure 130: Pouring Nitroglycerin into the Torpedo
Figure 131: Torpedoed Well, Pennsylvania 1870
Source: American Oil & Gas Historical Society Source: Petroleum History Institute
The use of explosives to fracture oil wells had somewhat erratic results. Some of the wells had blow-outs and caught alight. The use of acid as a non-explosive fluid for improving the connection between the well bore and the reservoir was introduced in the 1930s. Companies used a mixture of oil and acid to open or enlarge fractures in limestone reservoirs.
The first experimental hydraulic fracturing treatment was pumped in 1947 on a gas well operated by Stanolind, at Hugoton Field, Grant County, Kansas. Some 1,000 US gallons of sand and gelled gasoline were injected into the limestone formation at 730m, but did not notably increase well productivity. After further more successful attempts, a patent was issued and an exclusive licence was granted to the Halliburton Oil Well Cementing Company, which then carried out the first commercial hydraulic fracturing in 1949 in Stephens County, Oklahoma, and Archer County, Texas. In the 60+ years since the first hydraulic fracture the technology has been applied over two million times.
Figure 129: Edwin Drake’s 1859 Titusville Well
Source: Drake Well Museum
Figure 132: First Commercial Hydraulic Fracture, 1949
Source: Halliburton
Australian Unconventional Oil & Gas September 2013 216
Government Tax Breaks
In the mid-1970s concerns arose about the future of existing US gas supplies. Conventional gas reserves were falling as exploration additions failed to keep up with production. Economic production from the massive but low permeability ‘tight’ gas reservoirs was not possible given the gas prices and technology then available. This prompted federally-sponsored research to improve extraction techniques from ‘unconventional’ tight gas and shale reservoirs. The objectives were to increase per well gas recovery efficiency, and lower unit development costs. Although the R&D budget was almost immediately cut by the new Reagan administration, in 1980 the Department of Energy’s (DOE) Eastern Gas Shales Project did evaluate the gas potential of the extensive Devonian and Carboniferous shales within the Appalachian, Illinois and Michigan basins in the eastern US. In 1977 the DOE successfully demonstrated increased flow and recovery rates from hydraulic fracturing in tight sandstone and shale formations. The first successful multi-fracture horizontal well was drilled by a joint DOE-private venture in Wayne County, West Virginia, and the first massive hydraulic gel frac took place in 1986, in Texas.
The 1978 Natural Gas Policy Act (NGPA) deregulated the wellhead sales price of natural gas from Devonian-age gas shales and coal seams. Tight gas became eligible for the highest ceiling price within the NGPA regulated categories. In 1980 the Crude Oil Windfall Profit Tax Act provided tax credits that were worth ~US$0.50/Mcf for tight gas production. The tax credit provided for coal bed methane production was roughly twice as large at ~US$1.00/Mcf. These were significant incentives given that average annual gas prices at the time varied from roughly US$1.50/Mcf to US$2.50/Mcf.
Industry responded strongly to these incentives. The production of ‘legally eligible’ tight gas grew from 0.24Tcf in 1980 to 1.18Tcf in 1986. We believe overall production from geologically-defined tight gas was considerably higher as numerous low permeability areas remained unapproved and ineligible for the tax credit. Drilling for shale gas increased substantially in the Appalachian Basin. Drilling also boomed in the Michigan Basin, averaging over 1,200 wells per year in the last six years of tax credits. However, shale gas and coal bed methane production were still economically challenged (even with the higher tax credit for coal bed methane). In 1992, when the tax credit was abolished, the US EIA estimated that tight gas, shale gas and coal bed methane production was 2.15Tcf, 0.17Tcf and 0.56Tcf respectively.
We believe that while the federal R&D programmes made improvements to tight gas and shale gas drilling and completion techniques, it was the tax credit incentives that really kick started the commercial production of US tight gas reservoirs. By the time the tax incentives ended in 1992, the resulting infrastructure, critical mass, expertise and lower costs (from going up a steep learning curve) were in place for US tight gas production to continue unaided economically. After a brief lull when the tax credits ended, tight gas well completions rebounded to 3,000 wells pa. Shale gas well drilling averaged approximately 900 wells pa for the six years following the expiration of the tax credits. This is only somewhat less than the 1,200 wells pa seen during the prior six years.
Faced with declining reserves the government sponsored R&D and offered tax credits for unconventional resources…
… which led to a boom in US tight gas production in the 1980s
In 1980 the Crude Oil Windfall Profit Tax Act provided tax credits that were worth ~US$0.50/Mcf for tight gas production
Industry responded strongly to these incentives
The tax credit incentives kick started the commercial production of US tight gas

Australian Unconventional Oil & Gas September 2013 217
Privately-funded Research Improves Fracturing Efficiency
In 1980 it was well known that deeply buried shales, such as the Barnett in Texas, contained gas resources, but extraction of the gas using the technology of the day was not economic. It was at this time that George Mitchell (CEO and founder of Mitchell Energy) challenged his team to produce gas economically from the Barnett Shale. Mitchell Energy tweaked its fracturing technique for shale, going through much frustration, for 17 years. It tried various chemicals, gels and fracture juice recipes.
By the mid-1990s, money at Mitchell Energy was tight. Each well cost upwards of a million dollars to drill and fracture. One worker suggested a budget fracture of mostly water instead of an expensive gel-based fluid. That was against conventional wisdom. Water tends to swell rock, shrinking the valuable fractures. Mitchell Energy gave it a shot anyway. It turned out that water not only saved money, but improved gas yields too. Thus, the modern fracturing technique, known as ‘slickwater fracturing’ was developed in 1997. Slickwater is water with a limited amount of sand, friction reducers and other chemical additives to improve the efficiency of hydraulic fracturing. It works well in shale gas reservoirs because its low viscosity allows the fracturing fluid to leak out slowly from the main hydraulic fracture into many small, naturally-occurring fractures in the shale, opening them up.
Combining Horizontal Drilling and Hydraulic Fracturing
Building on improvements in drilling technology from tight gas developments, Mitchell Energy started commercial production from the Barnett Shale in 1998 using slickwater fracturing of both horizontal and vertical wells. In 2002 the company was bought by Devon Energy for US$3.5bn. As more horizontal wells were drilled, their cost fell relative to the cost of vertical wells. This led to horizontal wells having superior economics, which in turn led to a rapid shift from vertical wells to horizontal wells. In 2004, 490 of the 920 wells in the Barnett Play were vertical; by 2008, as many as 2,600 of the 2,710 wells drilled were horizontal.
Figure 133: US Unconventional Gas Production
Source: US EIA
Mitchell Energy tweaked its fracturing technique for 17 years
Mitchell Energy developed ‘slickwater fracturing’ in 1997
The combination of horizontal drilling and hydraulic fracturing finally cracked the code of the Barnett Shale…
… and bringing together two technologies led to large-scale commercialisation of US shale gas resources in the 2000s

Australian Unconventional Oil & Gas September 2013 218
North American Shale Gas Drilling Today
Over the last decade improved drilling rig performance, larger fracture designs, longer lateral sections and more fracture stages per well have continued to lower unit costs. Continuing improvements to well pad design, water management, infrastructure planning and micro-seismic fracture monitoring have also helped drive down costs.
Wells have become more specialised in design and construction, and are now drilled with highly automated rigs. Drilling times per foot of well have decreased dramatically as crews have gone up a steep learning curve. Multiple horizontal wells are now routinely drilled from the same pad, reducing infrastructure costs, land use, permitting and environmental impact. Microseismic monitoring allows for the real time mapping and visualisations of fracture propagation. This provides information on the fracture volume and azimuth, which allows the planning of optimal well spacing and infill drilling programmes.
At its analyst investor day in 2012, Devon Energy showed how improvements in drilling practice, drilling multiple wells from one pad and improved equipment reliability had dramatically improved efficiency at its Barnett Shale operations. Despite increasing the lateral length of the horizontal section from 2,087ft in 2004 to 4,067ft in 2011, the number of days from spud to rig release fell from 33 to just 12.
As the horizontal sections of wells have lengthened, more complex, multi-stage hydraulic fracturing has developed. A modern day frac spread can consist of 20+ trucks delivering over 50,000 hydraulic horse power. They can pump up to 50m gallons of fluid and proppant at a rate of greater than 100bbl per minute.
Figure 134: A Modern Frac Spread
Source: Halliburton
Increased efficiency and technological innovation are driving down costs
Wells are becoming more specialised, with rapidly decreasing drill times and many wells being drilled from one pad

Australian Unconventional Oil & Gas September 2013 219
High Gas Prices Helped Dramatic Expansion
As of September 2012, US shale gas production contributed about 35% of total US dry production. From 1995-2005, increased tight gas, shale gas and coal seam gas production largely offset the decline in US conventional gas production. Since 2005 shale gas production has more than offset the further decline in US domestic conventional gas production. This has turned the relatively tight US gas markets of 2005 into a buyer’s market today. The average Henry Hub price was US$8.83/Mcf in 2005, but it was just US$2.73/Mcf in 2012.
Figure 135: US Gas Production by Type and the Real Domestic Gas Price
Source: US Energy Information Administration – Annual Energy Outlook 2013 Early Release, World Bank
Shale gas production growth since 2005 has been dramatic. The 2005-12 compound annual growth rate was approximately 41%. Natural gas production from shale wells and coal bed wells was approximately equal in 2007, but by 2012 the shale gas component was almost 5x greater. Indeed, coal seam gas production has seen a slight decline since 2008. We believe this CSG production decline has been caused by the lower domestic US gas prices from 2008, which has severely hurt CSG economics. Shale gas production has been less affected by the fall in the gas price as production has shifted from dry gas plays to liquid-rich plays, where much of the revenue stream is tied to oil prices. Oil prices have rebounded strongly from their lows in 2008-09, unlike domestic US gas prices. CSG production by its very nature yields no liquids. US tight gas production has also declined slightly from its 2009 levels for similar reasons.
The shift from dry gas shale plays to liquids-rich shale gas plays and shale oil plays is reflected in the US rotary rig count. In Figure 136 we have plotted the number of US rigs by type of well they drilled (oil or gas as defined by the operator when they applied for the permit). The effect of ‘cracking the code’ to commercialise shale gas resources can be seen in the dramatic increase in number and proportion of US rigs employed drilling gas wells from 2002-08. The 2008-09 global financial crisis hit both the number of US onshore rigs drilling for gas and the number drilling for oil.
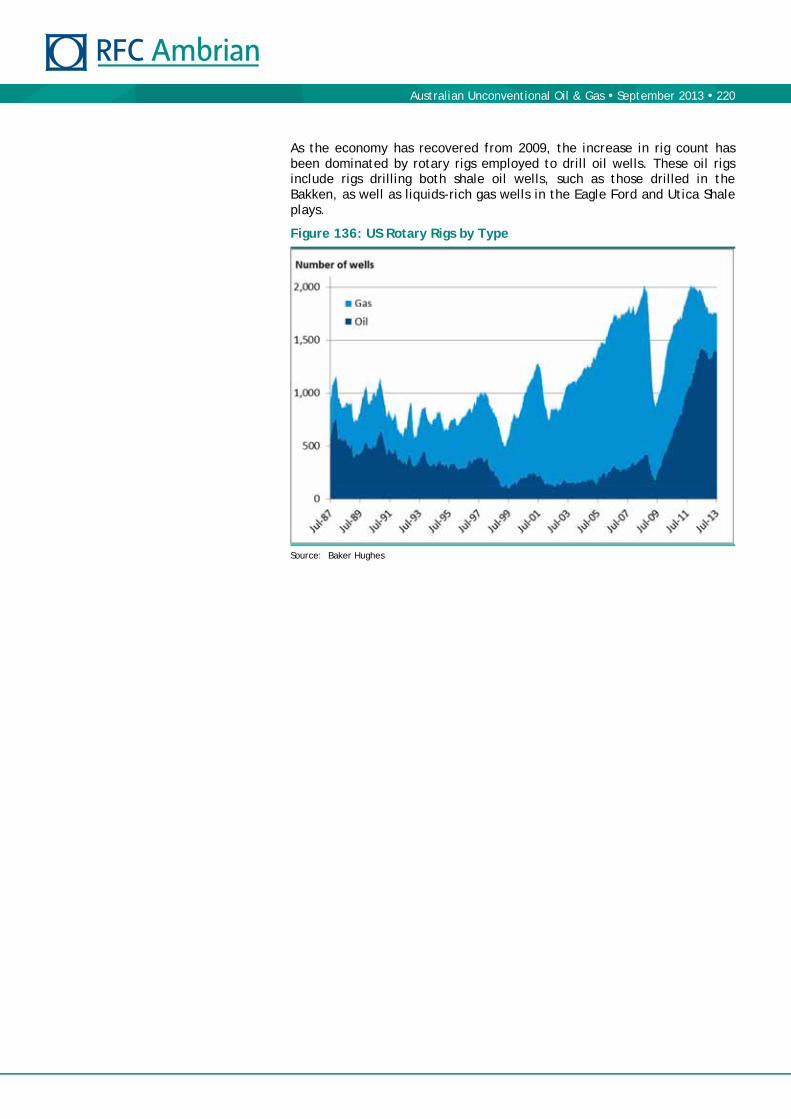
Australian Unconventional Oil & Gas September 2013 220
As the economy has recovered from 2009, the increase in rig count has been dominated by rotary rigs employed to drill oil wells. These oil rigs include rigs drilling both shale oil wells, such as those drilled in the Bakken, as well as liquids-rich gas wells in the Eagle Ford and Utica Shale plays.
Figure 136: US Rotary Rigs by Type
Source: Baker Hughes

Australian Unconventional Oil & Gas September 2013 221
Figure 137: Major Shale Plays of the Lower 48 States
Source: US Energy Information Administration (EIA)
Figure 138: Major Tight Gas Plays of the Lower 48 States
Source: US Energy Information Administration (EIA)

Australian Unconventional Oil & Gas September 2013 222
Research Team
Metals & Mining
Duncan Hughes, Head of Research +61 8 9480 2518 [email protected]
Craig Foggo +44 (0)20 3440 6822 [email protected]
Oil & Gas
Stuart Amor, Head of Oil & Gas Research +44 (0)20 3440 6826 [email protected]
Emily Ashford +44 (0)20 3440 6821 [email protected]
Corporate Broking
Jonathan Williams +44 (0)20 3440 6817 [email protected]
Kim Eckhof +44 (0)20 3440 6815 [email protected]
Alexandra Galin +61 2 9250 0039 [email protected]
RFC Ambrian Limited is authorised and regulated by the Financial Conduct Authority for the conduct of Investment Business in the UK and is a Member of the LondonStock Exchange.
RFC Ambrian Limited is registered in England and Wales no. 4236075. Registered office – Level 5, Condor House, 10 St Paul’s Churchyard, London EC4M 8AL. Phone+44 (0)20 3440 6800 Fax: +44 (0)20 3440 6801 E-mail: [email protected]
For the purposes of the regulatory requirements in relation to the management of Conflicts of Interest, RFC Ambrian publishes this document as non-independentresearch which is a Marketing Communication under the Financial Conduct Authority’s Conduct of Business rules. It has not been prepared in accordance with theregulatory rules relating to independent research, nor is it subject to the prohibition on dealing ahead of the dissemination of investment research. Please refer tothe Compliance Department for a summary of our conflicts of Interest Policy and Procedures.
The information and opinions in this report were prepared by RFC Ambrian Limited "RFC Ambrian". It has been approved for publication and distribution in the UK byRFC Ambrian which is regulated by the Financial Conduct Authority for the conduct of Investment Business in the UK and is a member of the London Stock Exchange.
The information and opinions contained herein have been obtained from public sources and are believed by RFC Ambrian to be reliable, but we make norepresentation as to the accuracy or completeness of such information.
The analyst principally responsible for the preparation of this report receives compensation that is based upon, among other factors, RFC Ambrian’s overallinvestment banking revenue. However, such analysts have not received, and will not receive, compensation that is directly based upon one or more specificinvestment banking activities or transactions.
Opinions, estimates and projections in this report constitute the current judgement of the author as of the date of this report. They do not necessarily reflect theopinions of RFC Ambrian and are subject to change without notice. RFC Ambrian has no obligation to update, modify or amend this report or to otherwise notify thereader thereof in the event that any matter stated herein, or any opinion, projection, forecast or estimate set forth herein, changes or subsequently becomesinaccurate, or if research on the subject company is withdrawn. Prices and availability of financial instruments are also subject to change without notice. This reportis provided for informational purposes only. It is not to be construed as an offer to buy or sell or a solicitation of an offer to buy or sell any financial instruments or toparticipate in any particular trading strategy in any jurisdiction.
RFC Ambrian may engage in securities transactions in a manner inconsistent with this report, and with respect to the securities covered by this report, may buy fromand sell to customers on either an agency, a principal investment, or market making basis. Disclosures of conflicts of interest, if any, are disclosed at the beginning ofthis report, or are available from the Compliance Officer. On the date of this report RFC Ambrian, persons connected with it and their respective directors may have along or short position in any of the investments mentioned in this report and may purchase and/or sell the investments at any time in the open market as an agent.Additionally, RFC Ambrian within the previous twelve months may have acted as an investment banker or may have provided significant advice or investment servicesto the companies or in relation to the investment(s) mentioned in this report.
When we comment on AIM and other junior market listed shares, customers should be aware that because the rules for these markets are less demanding than forthose of the Official List of the London Stock Exchange the risks are higher.
The report is confidential and is submitted to selected recipients only. It may not be reproduced in whole or in part to any other person. RFC Ambrian and /or personsconnected with it may effect or have effected transactions in the investments referred to in the material contained in this report.
This report is prepared for professional clients and is not intended for retail clients in the UK as defined by the Financial Conduct Authority rules and should not be passed on to such persons. Any U.S. person receiving this report and wishing to effect a transaction in any security discussed herein, must do so through a U.S. registered broker dealer.
RFC Ambrian Limited London
Level 5, Condor House 10 St Paul’s Churchyard London EC4M 8AL UK
Telephone +44 (0)20 3440 6800 Fax +44 (0)20 3440 6801
Sydney
Level 14 19-31 Pitt Street Sydney NSW 2000 Australia
Telephone +61 2 9250 0000 Fax +61 2 9250 0001
Perth
Level 15, QV1 Building 250 St Georges Terrace Perth WA 6000 Australia
Telephone +61 8 9480 2500 Fax +61 8 9480 2511
[email protected] www.rfcambrian.com