australian horticulture in the global...
TRANSCRIPT
AUSTRALIAN HORTICULTURE
IN THE GLOBAL
ENVIRONMENT
© ABARE, Horticultural Research and Development Corporation andAustralian Horticultural Corporation 2000
This work is copyright. The Copyright Act 1968 permits fair dealing forstudy, research, news reporting, criticism or review. Selected passages, tablesor diagrams may be reproduced for such purposes provided acknowledg-ment of the source is included. Major extracts or the entire document maynot be reproduced by any process without the written permission of theExecutive Director, ABARE, or the Managing Director of the HRDC or AHC.
ISBN 0 642 76406 9
Australian Bureau of Agricultural and Resource EconomicsGPO Box 1563 Canberra 2601
Telephone +61 2 6272 2000 Facsimile +61 2 6272 2001Internet www.abareconomics.com
ABARE is a professionally independent government economic researchagency.
Horticultural Research and Development CorporationLevel 6, 7 Merriwa Street, Gordon 2072
Telephone +61 2 9418 2200 Facsimile +61 2 9418 1352Internet www.horticulture.com.au
HRDC is a national organisation that manages, coordinates and invests inresearch and development which advances Australian horticulture.
Australian Horticultural CorporationLevel 11, 51 Druitt Street, Sydney 2000
Telephone: +61 2 9264 9966 Facsimile +61 2 8267 4199Internet www.horticulture.com.au
AHC provides innovative marketing solutions and support programs to theAustralian horticulture industry.
The views expressed and conclusions reached in this report are those ofABARE. The HRDC or AHC shall not be responsible in any way whatso-ever to any person who relies in whole or in part on the contents of this report.
ABARE project 1749 HRDC project AH99001
Foreword
This report is part of a project titled ‘Australian horticulture in the next WTOround’. An initiative of the Horticultural Market Access Committee andmanaged by the Australian Horticultural Corporation (AHC) and theHorticultural Research and Development Corporation (HRDC), funding forthe project was provided by the AusHort R&D Committee of the HRDC.
The report is divided into three parts. The first part provides an overview ofAustralian horticultural production and summarises the key issues associ-ated with market access for trade negotiation. The second part provides casestudy analysis of trade policy for selected major markets. Part three detailsa number of Australian horticultural industries and provides an effectivereference of over twenty fresh and manufactured fruit and vegetable prod-ucts.
The World Trade Organisation negotiations in Seattle last year provided anopportunity to progress market access and domestic support issues arisingfrom the Uruguay Round in 1994. The results of the analysis reported in thisstudy formed an important part of the briefing provided to Australian nego-tiators in their pursuit of horticultural trade prospects. A range of trade poli-cies restrict access to many important Australian horticultural export markets.Key issues considered in this report are tariffs, sanitary and phytosanitarymeasures and international support arrangements.
This report also provides an effective industry resource, profiling a numberof industries and their related products. It complements the annual AustralianHorticultural Statistics Handbook by providing in-depth commentary ontopics such as major producing areas and production trends; domestic con-sumption; export trends and competition; state/regional export contributions;market access issues; and technical barriers to trade.
BRIAN S. FISHER MARK NAPPER
Executive Director Managing DirectorABARE Australian Horticultural Corporation
February 2000
iiiAustralian horticulture
Acknowledgments
The Agricultural Economics Section of the Industries Branch of ABAREwas commissioned by the project management committee to undertake thisreport. The research was undertaken by Roger Van Hilst, Catherine Rees andCharmayne O’Rourke and has benefited from the input of Vince O’Donnell,Neil Andrews and Ivan Roberts.
Considerable assistance was also provided by the project managementcommittee of Mark Napper and James Kellaway (Australian HorticulturalCorporation), Kim James (Horticultural Research and DevelopmentCorporation), Margaret Milgate (Queensland Fruit and Vegetable Growers),Bob Curren (Australian Citrus Growers) and Jon Durham (Australian Appleand Pears Growers Association).
The authors also acknowledge information provided by the AustralianQuarantine and Inspection Service; Department of Foreign Affairs and Trade;Agriculture, Fisheries and Forestry – Australia; and the many industries asso-ciated with the contents of this report.
iv Australian horticulture
Contents
Part 1: Australian horticulture and market access issues
Introduction 1Australian horticultural production 1Australian export trends and competition 1Australian support arrangements 3
Horticulture and multilateral trade negotiations 4Summary of issues 5Implications for Australian horticulture in the context ofnegotiations 8
Part 2: Trade policy analysis – case studies 10European Union 11United States 18Japan 22South Korea 25Indonesia 28China 30Chinese Taipei 32
Part 3: Industry profiles 35Almonds 36Apples and pears – fresh 40Avocados 48Canning fruit 52Cherries 56Chestnuts 60Citrus (fresh) and citrus juice 63Custard apples 71Cut flowers 74Macadamias 80
vAustralian horticulture
Mangos, melons, pawpaws and pineapples 85Potatoes 93Stonefruit – fresh 99Strawberries 104Tomatoes – fresh 108Tomatoes – processed 112Vegetables (excluding potatoes and tomatoes) 116
References 124
FiguresA Gross value of Australian agriculture 2B Gross value of Australian horticultural production, by sector,
1997-98 2C Gross value of Australian horticultural production, by state,
1997-98 2
vi Australian horticulture
Australian horticulture andmarket access issues
IntroductionHorticultural policy measures in countries that are of strategic importanceto Australian horticultural exporters and the future growth of the industryare discussed in this report. Industry profiles for key Australian horticulturesectors are also presented in part 3.
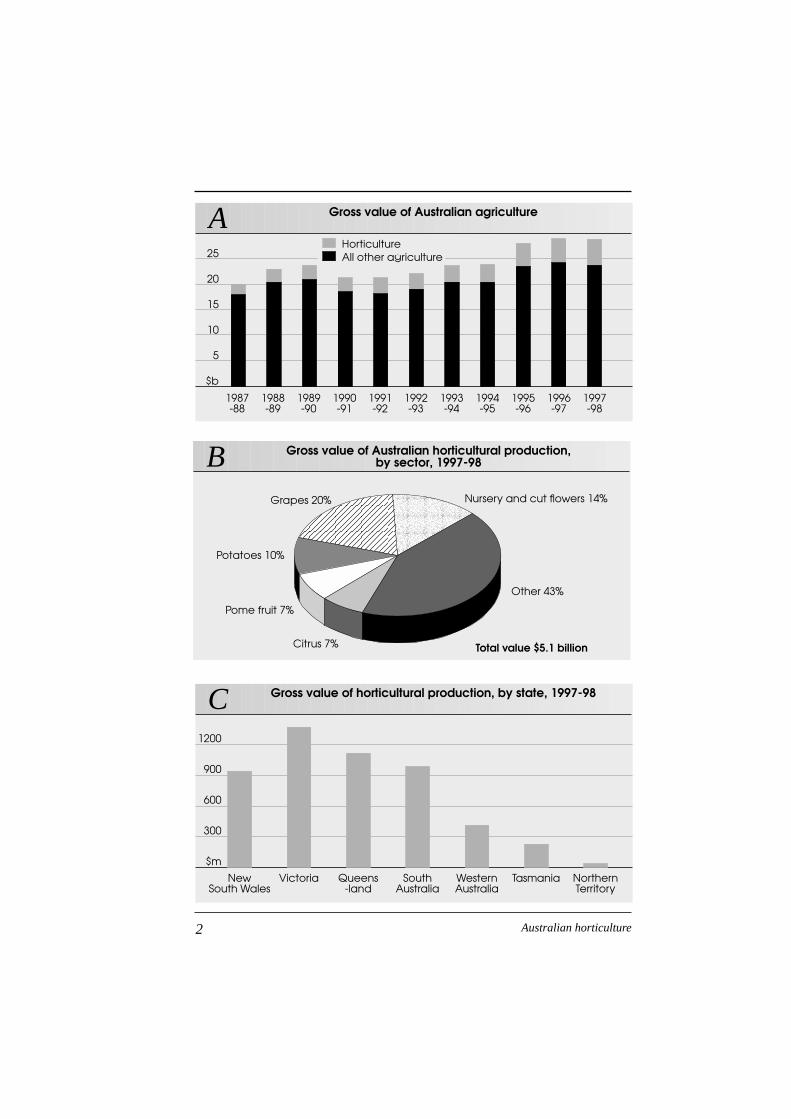
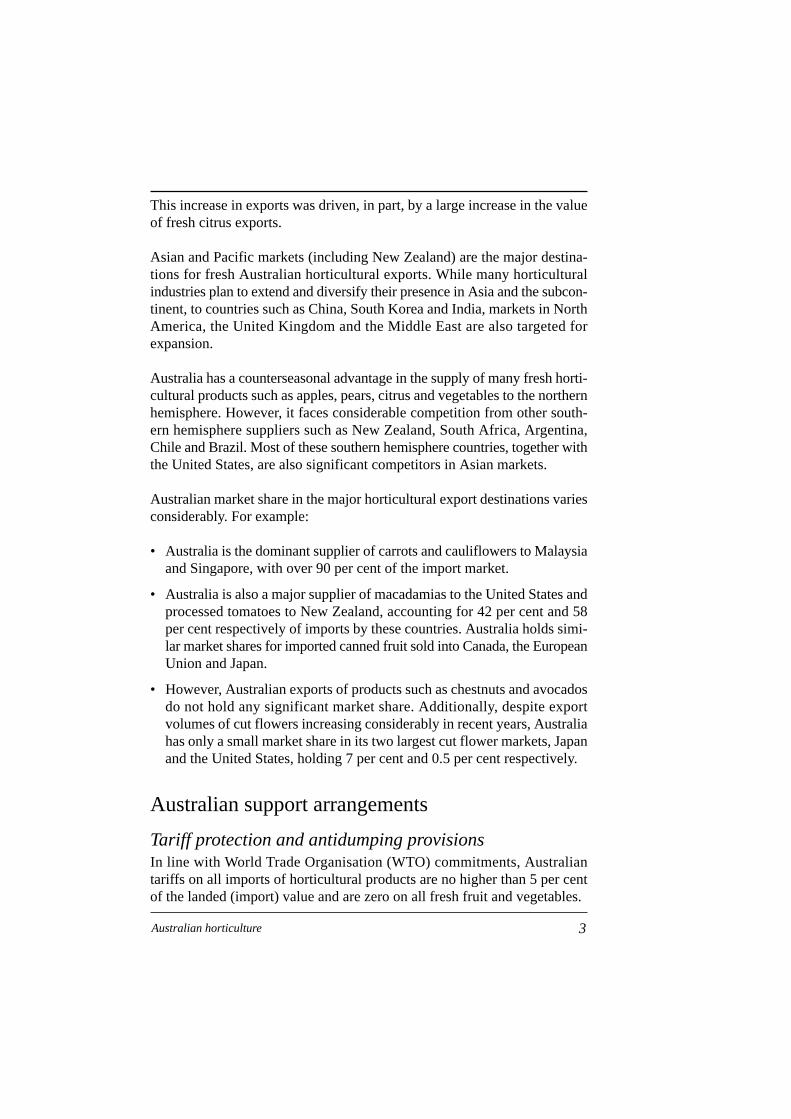
Australian horticultural productionBetween 1987-88 and 1997-98 the gross value of horticulture productionincreased by 142 per cent to around A$5.1 billion (however, this figureincludes nursery production, of A$695 million, which was not available in1987-88). Over the same period, the total value of Australian agricultureproduction increased by just over 40 per cent to around A$28 billion (figureA). Consequently, the gross value of Australian horticultural production asa proportion of total agricultural production increased steadily from around11 per cent to 16 per cent (ABS 1998, 1999).
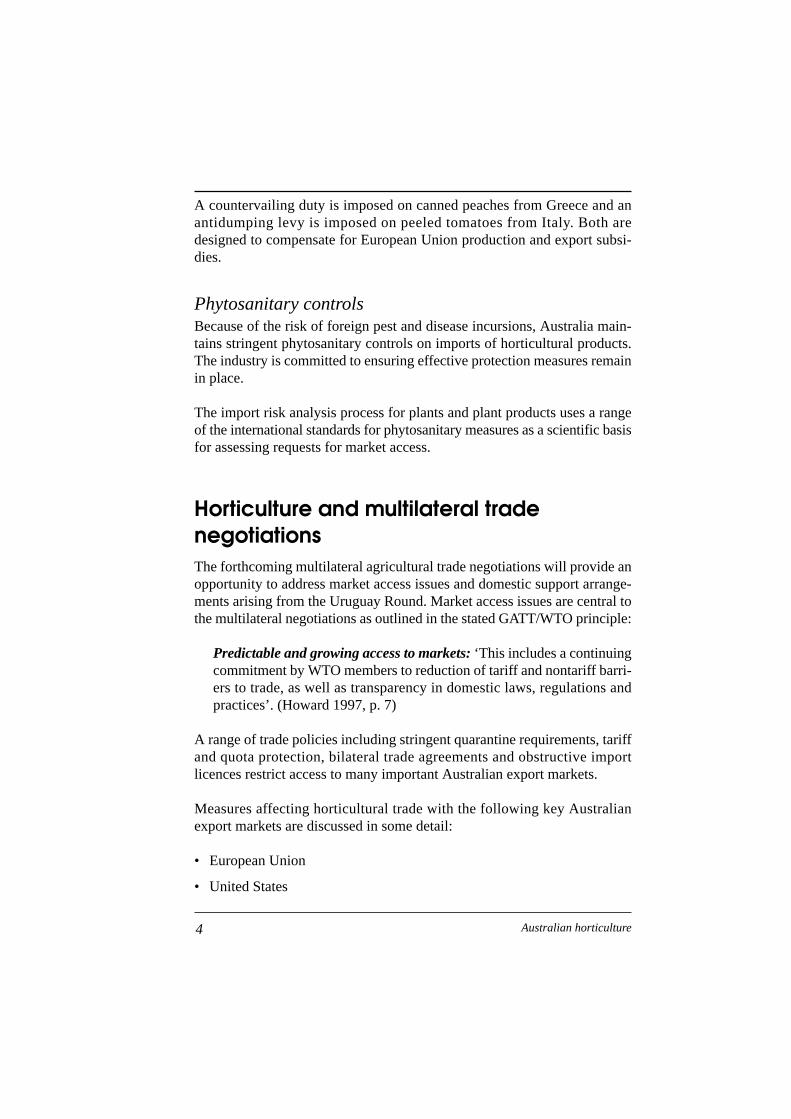
The major Australian horticulture sectors covered in this report, by value,are nursery and cut flowers, potatoes, pome fruits (apples and pears) andcitrus (figure B), which together accounted for 38 per cent of the value ofall horticultural production in 1997-98 (ABS 1999). While grapes are notincluded in this report, they alone accounted for 20 per cent of the value ofhorticulture production in 1997-98.
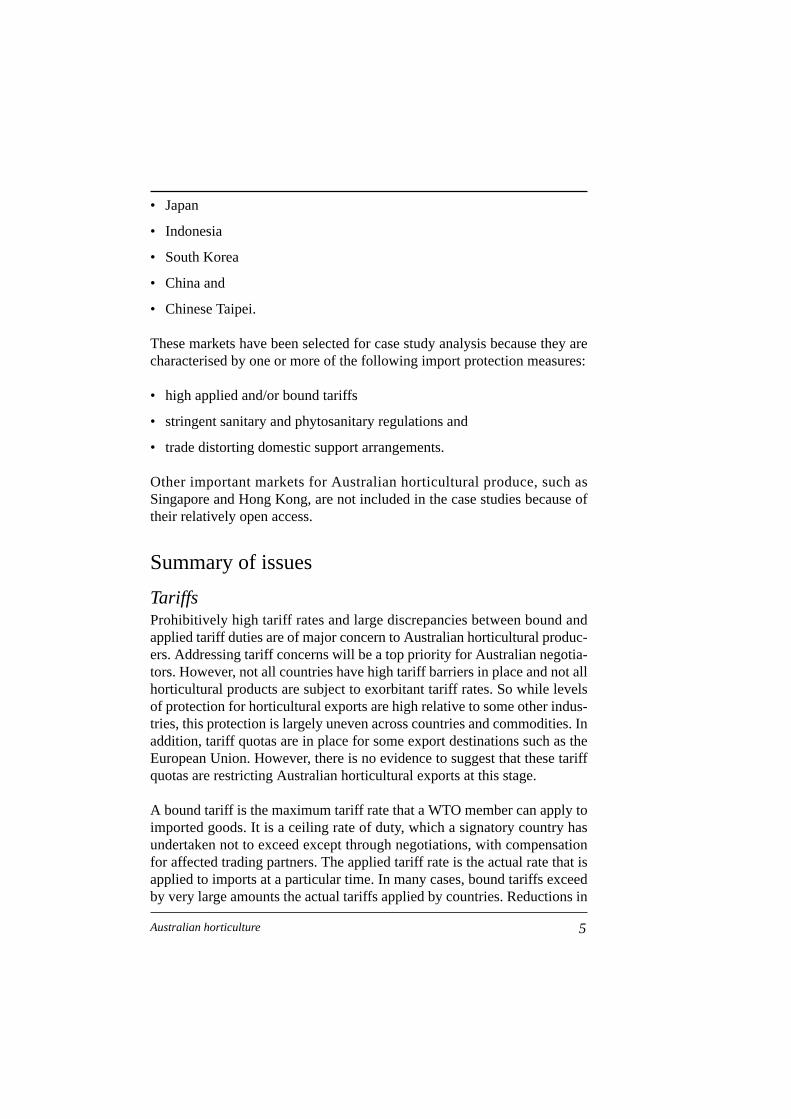
Although horticultural crops are grown throughout Australia, the majorityof production occurs in Victoria, South Australia, Queensland and New SouthWales (figure C). Together, these four states accounted for around 87 percent of the value of total fruit and vegetable production in 1997-98 (ABS1999).
Australian export trends and competitionIn the ten years to 1998-99, the value of Australian horticultural exportsincreased by 112 per cent to A$1.2 billion. This reflects a large rise in freshfruit exports, which rose by 270 per cent to A$348 million over that period.
1Australian horticulture
PART 1
2 Australian horticulture
Gross value of Australian agricultureA
1987-88
1988-89
1989-90
1990-91
1991-92
1992-93
1993-94
1994-95
1995-96
1996-97
1997-98
$b
5
10
15
20
25HorticultureAll other agriculture
Gross value of Australian horticultural production,by sector, 1997-98B
Citrus 7%
Pome fruit 7%
Potatoes 10%
Grapes 20% Nursery and cut flowers 14%
Other 43%
Total value $5.1 billion
Gross value of horticultural production, by state, 1997-98C
$m
300
600
900
1200
NorthernTerritory
TasmaniaWesternAustralia
SouthAustralia
Queens-land
VictoriaNewSouth Wales
This increase in exports was driven, in part, by a large increase in the valueof fresh citrus exports.
Asian and Pacific markets (including New Zealand) are the major destina-tions for fresh Australian horticultural exports. While many horticulturalindustries plan to extend and diversify their presence in Asia and the subcon-tinent, to countries such as China, South Korea and India, markets in NorthAmerica, the United Kingdom and the Middle East are also targeted forexpansion.
Australia has a counterseasonal advantage in the supply of many fresh horti-cultural products such as apples, pears, citrus and vegetables to the northernhemisphere. However, it faces considerable competition from other south-ern hemisphere suppliers such as New Zealand, South Africa, Argentina,Chile and Brazil. Most of these southern hemisphere countries, together withthe United States, are also significant competitors in Asian markets.
Australian market share in the major horticultural export destinations variesconsiderably. For example:
• Australia is the dominant supplier of carrots and cauliflowers to Malaysiaand Singapore, with over 90 per cent of the import market.
• Australia is also a major supplier of macadamias to the United States andprocessed tomatoes to New Zealand, accounting for 42 per cent and 58per cent respectively of imports by these countries. Australia holds simi-lar market shares for imported canned fruit sold into Canada, the EuropeanUnion and Japan.
• However, Australian exports of products such as chestnuts and avocadosdo not hold any significant market share. Additionally, despite exportvolumes of cut flowers increasing considerably in recent years, Australiahas only a small market share in its two largest cut flower markets, Japanand the United States, holding 7 per cent and 0.5 per cent respectively.
Australian support arrangements
Tariff protection and antidumping provisionsIn line with World Trade Organisation (WTO) commitments, Australiantariffs on all imports of horticultural products are no higher than 5 per centof the landed (import) value and are zero on all fresh fruit and vegetables.
3Australian horticulture
A countervailing duty is imposed on canned peaches from Greece and anantidumping levy is imposed on peeled tomatoes from Italy. Both aredesigned to compensate for European Union production and export subsi-dies.
Phytosanitary controlsBecause of the risk of foreign pest and disease incursions, Australia main-tains stringent phytosanitary controls on imports of horticultural products.The industry is committed to ensuring effective protection measures remainin place.
The import risk analysis process for plants and plant products uses a rangeof the international standards for phytosanitary measures as a scientific basisfor assessing requests for market access.
Horticulture and multilateral tradenegotiations The forthcoming multilateral agricultural trade negotiations will provide anopportunity to address market access issues and domestic support arrange-ments arising from the Uruguay Round. Market access issues are central tothe multilateral negotiations as outlined in the stated GATT/WTO principle:
Predictable and growing access to markets: ‘This includes a continuingcommitment by WTO members to reduction of tariff and nontariff barri-ers to trade, as well as transparency in domestic laws, regulations andpractices’. (Howard 1997, p. 7)
A range of trade policies including stringent quarantine requirements, tariffand quota protection, bilateral trade agreements and obstructive importlicences restrict access to many important Australian export markets.
Measures affecting horticultural trade with the following key Australianexport markets are discussed in some detail:
• European Union
• United States
4 Australian horticulture
• Japan
• Indonesia
• South Korea
• China and
• Chinese Taipei.
These markets have been selected for case study analysis because they arecharacterised by one or more of the following import protection measures:
• high applied and/or bound tariffs
• stringent sanitary and phytosanitary regulations and
• trade distorting domestic support arrangements.
Other important markets for Australian horticultural produce, such asSingapore and Hong Kong, are not included in the case studies because oftheir relatively open access.
Summary of issues
TariffsProhibitively high tariff rates and large discrepancies between bound andapplied tariff duties are of major concern to Australian horticultural produc-ers. Addressing tariff concerns will be a top priority for Australian negotia-tors. However, not all countries have high tariff barriers in place and not allhorticultural products are subject to exorbitant tariff rates. So while levelsof protection for horticultural exports are high relative to some other indus-tries, this protection is largely uneven across countries and commodities. Inaddition, tariff quotas are in place for some export destinations such as theEuropean Union. However, there is no evidence to suggest that these tariffquotas are restricting Australian horticultural exports at this stage.
A bound tariff is the maximum tariff rate that a WTO member can apply toimported goods. It is a ceiling rate of duty, which a signatory country hasundertaken not to exceed except through negotiations, with compensationfor affected trading partners. The applied tariff rate is the actual rate that isapplied to imports at a particular time. In many cases, bound tariffs exceedby very large amounts the actual tariffs applied by countries. Reductions in
5Australian horticulture
tariff barriers will be illusory if cuts in the bound rates — which are the basisfor both negotiation and commitments — do not reduce the actual tariffapplied (ABARE 1999).
For the purposes of this report, relatively low tariff levels (below 10 per cent)are not identified, as they are not considered to be significant impedimentsto trade given the greater level of trade restraints found in other markets.
Sanitary and phytosanitary regulationsWhile issues relating to sanitary and phytosanitary regulations are outsidethe Uruguay Round Agreement on Agriculture, their existence has an impor-tant bearing on market access. Therefore, any strategy by horticulturalexporters to expand effective market access must take into account the barri-ers posed by quarantine regulations. Thus, sanitary and phytosanitary regu-lations can be expected to influence various countries’ approaches to themultilateral negotiations as well as ongoing bilateral negotiations betweencountries (ABARE 1999).
The most important quarantine issue affecting access for Australian horti-cultural products relates to regulations designed to protect domestic indus-tries from incursions of fruit fly species endemic to Australia. This and otherquarantine related issues are widespread across Australian horticulturalcommodities and extend beyond the range of case study countries consid-ered here. Further bilateral negotiations, combined with cooperative effortsbetween the relevant domestic organisations, will be crucial to reducing quar-antine related trade obstacles in the future.
Domestic support and export subsidiesDomestic support in importing countries can greatly affect market opportu-nities for Australian horticulture, even if there is relatively liberal access tothose markets. Also domestic support in competing exporting countries canresult in the generation of surpluses that compete on world markets withAustralian products. In some instances these exports may be assisted throughdirect export subsidies as well as domestic subsidies.
Domestic support can take many forms including government subsidies toincrease prices to farmers for their products, subsidies for farm inputs suchas water or subsidisation of capital infrastructure. In some instances thesupport can be regionally based within markets to assist farmers to maintain
6 Australian horticulture
regional employment or regional landscapes (such as vineyard or olive grovelandscapes). All of these subsidies tend to increase domestic production,which can impinge on market opportunities for imports.
Export subsidies are among the most distorting of support arrangements, anda reduction in these arrangements would bring significant benefits to theAustralian horticulture industry. However, any negotiated benefits would belimited if there were a reorientation toward other distorting support meth-ods that would further inhibit horticultural exports from Australia.
The following is a summary of the key policy arrangements identified asbeing of potential concern to the Australian horticulture industry in its effortsto expand trade. These are discussed in more detail in the following sections.
• The European Union enforces strict food safety standards and has hightariffs on many commodities. EU farmers receive a range of governmentsupports under the Common Agricultural Policy that include compensa-tion payments for product withdrawal, direct production subsidies, exportsubsidies and rootstock adjustment programs. In addition, Europeanproducers of processed horticultural goods benefit from manufacturingsubsidies.
• The United States has in place a number of arrangements that impedetrade in horticultural products. These include: tariffs that are considerablyhigher than Australian levels; the North American Free Trade Agreementwhich favors imports from Canada and Mexico over other trading nations;and strict quarantine controls for some products that impose fumigationcosts on exporting countries, even when there is no disease or pest risk.The United States has a range of indirect industry support measures, includ-ing a comparatively high specific import duty on orange juice.
• Japan has relatively high tariff rates on some imported horticultural prod-ucts. It also enforces stringent quarantine controls on all horticulturalimports, considering access on the basis of each variety being a separateproduct.
• In Indonesia, there is a large discrepancy in the applied and bound tariffrates on most horticultural imports.
• Only a limited range of horticultural products have been granted accessto South Korea. Once granted, stringent quarantine measures and a hightariff quota system on fruit and vegetables restrict this access. South Koreaadopts a ‘one product at a time per country’ policy for assessing access.
7Australian horticulture
• Official access to markets in China, when achieved, is likely to be impededby sanitary and phytosanitary measures on imports of various fruits andvegetables. Gaining access takes considerable time, as China’s policy isto assess just one product at a time per country. To date Australia has onlybeen granted access to China for Tasmanian apples. China also has veryhigh import duties of around 30 per cent. China’s accession to the WTOin the near future is likely to result in reductions to these trade barriers.
• Chinese Taipei applies high, two-tier seasonal tariffs, import quotas, prohi-bitions and strict quarantine measures on many horticultural imports. Arecently adopted chemical residue testing procedure has also delayed horti-cultural exports because of increased paperwork and an as yet incompletelist of safe chemicals registered with Chinese Taipei officials. It is expectedthat Chinese Taipei will join the WTO following China’s accession. Thisis likely to result in reduced trade barriers and greater transparency intrade procedures.
Implications for Australian horticulture in thecontext of negotiationsThis study identifies a number of impediments to market access facingAustralian exports of horticultural products. The main constraint on tradeappears to be quarantine restrictions imposed by importing countries. ForAustralian product to gain access to markets that have been restricted on thebasis of quarantine it will be necessary for Australian authorities to negoti-ate protocols with the relevant authorities in importing countries. WhereAustralia or even discrete regions within Australia are not affected by thepests or diseases of concern, failure of the importing country to allow importsfrom Australia would appear to be unjustified.
Australian access to many world markets is also restricted by high tariffs forhorticultural products. The main markets of concern to the Australian indus-try include Thailand, South Korea, China and Chinese Taipei. If Australianhorticultural exports are to gain or improve access to these markets it willbe essential that future WTO agriculture negotiations result in significantcuts to tariffs.
One of the main domestic support arrangements affecting horticulture wouldappear to be the European Union’s policies for fresh and processed fruit andvegetables. However, domestic support commitments under the WTOUruguay Round Agreement on Agriculture are for agriculture as a whole
8 Australian horticulture
rather than for individual products or product groupings (such as horticul-ture). This, together with other limitations of the domestic support commit-ments, such as exemptions for decoupled support and production limitingarrangements, mean that domestic support commitments are relatively weak(Roberts et al. 1999).
If the distortions to trade from domestic support policies are to be reduced,it will be necessary for future negotiations to agree to effective disciplineson domestic support. This will include ensuring that only properly decou-pled support measures are excluded from negotiated reductions and havingcommitments on domestic support based on individual products, or at themost, groups of closely related products. These requirements are as relevantto horticultural products as they are to other agricultural commodities.
9Australian horticulture
Trade policy analysis – case studies
Demand for horticultural products is a major determinant of the size andprosperity of the Australian horticulture industry. Demand is in part influ-enced by conditions of access to markets. Many markets have high tariff andnontariff barriers that stifle imports and reduce economic gains from effi-ciency and specialisation. Reducing barriers to trade is critical to exposingproducers and consumers to market prices and to assuring market access forcompetitive and efficient producers. Increasing market access would lead togains for taxpayers and consumers in countries with large trade distortions.It would also benefit efficient producers around the world, resulting in neteconomic gains for the world as a whole.
The discussion in this part provides a case study analysis of countries thathave one or more significant market access issues for the Australian horti-culture industry and are agreed priority markets for the industry.
Following recently signed bilateral agreements between the United Statesand China, it is evident that China (and subsequently Chinese Taipei) willjoin the WTO in 2000. China’s and Chinese Taipei’s accession to the WTOis expected to reduce many of the market access barriers that exist in thesecountries.
10 Australian horticulture
PART 2
European Union
In 1995 the European Union was the third largest producer of fresh fruit andvegetables after China and India (European Commission 1998). The EuropeanUnion protects its domestic horticulture sectors through both tariff and non-tariff barriers. Nevertheless, the European Union is currently a major marketpriority for Australian horticultural exports, especially apples, nuts, onionsand beetroot.
TariffsEU tariffs on imported processed horticultural products are of concern toAustralian exporters. For example, tariffs of 15.6 per cent to 18 per cent arelevied on processed tomatoes, while Australian exports of canned fruit andjuice into the European Union face a tariff rate of 19.8 per cent. These ratesare considerably higher than Australia’s tariff rate on processed tomatoesand canned fruit and juice of 5 per cent. The European Union levies tariffrates of 9.5 per cent and 13.5 per cent on imports of prepared or preservedmacadamias as well as fresh or dried macadamia kernels.
Australian exporters of cut flowers are significantly disadvantaged in theEuropean Union. Australia’s major competitors in this market are the south-ern African nations and Israel that are considered to be developing nations.As such, they receive preferential treatment in the form of low tariff duties,while Australia faces import tariffs of between 11.3 per cent and 20 per cent.
While the European Union levies a relatively high applied tariff rate of 12per cent on imports of fresh strawberries, the bound rate is higher still, at20.8 per cent.
Sanitary and phytosanitary requirementsOther than strict food safety standards applying in the United Kingdom forproducts such as apples and pears, there appear to be few quarantine barri-ers applied by the European Union. This may be due, in part, to membercountries of the European Union not requiring treatment for Mediterraneanfruit fly, which is widespread throughout the European Union.
11Australian horticulture
EUROPEAN UNION
A phytosanitary certificate conforming to the International Plant ProtectionConvention must accompany all imports. Official inspection in the export-ing country (on which the phytosanitary certificate is based) must take placenot more than 14 days prior to shipment.
Domestic support and export subsidiesThe European Union, under the Common Agricultural Policy, provides fora number of domestic support regimes that influence its fruit and vegetableproduction and trade, including a fresh fruit and vegetable regime and aprocessed fruit and vegetable regime. Both of these regimes, however, havebeen subject to reform in recent years in an attempt to bring about a moremarket oriented sector. For fresh fruit and vegetables, intervention is still inplace and export subsidies continue to be paid. For processed fruit and vegeta-bles, the level of production aid is an area for negotiation.
A proposed common potato regime has been developed by a number of inter-ested countries. However, the Agricultural Council of the Commission attheir meeting in November 1996 rejected the proposed regime and as theissue has not reappeared on the Council agenda the proposed potato regimewill not be considered in this section.
Fresh fruit and vegetable regimeThe fresh fruit and vegetable regime was reformed in 1996 with the inten-tion of creating a more market oriented sector. The stated objectives of thereformed regime are to achieve a balance between supply and demand atprices that are fair to producers and to encourage specialisation within theEuropean Union while taking into account third country trade. The reformedregime strengthens the position of producer organisations through a newoperating fund while providing for a reduction in the role of subsidised with-drawals (intervention). All fruit and vegetables are covered by this regimeexcept potatoes, wine grapes, bananas, sweetcorn, beans and peas for fodderand olives.
InterventionThe objective of intervention is to stabilise prices in years of glut but not toprovide an alternative outlet to the market. It provides compensation fromEU funds to producers withdrawing the following products from the market–– apples, clementines, apricots, lemons, melons, nectarines, peaches,aubergines, sweet oranges, pears, cauliflowers, table grapes, tomatoes, watermelons, mandarins (including satsumas, tangerines and other hybrids).
12 Australian horticulture
EUROPEAN UNION
Products withdrawn from the market can be distributed free to approvedcharitable organisations if they do not affect the market. Alternatively, prod-ucts can be used as animal feed or distilled into industrial alcohol. If anyproducts cannot be disposed of in the above way, they must be destroyed insuch a way that takes into account possible environmental impacts. Thisintervention process differs greatly from that of other schemes such as dairy,beef and grains, where the EU intervention agencies accumulate interven-tion stocks of these products. The products are then sold on the domesticmarket, if prices rise sufficiently, or exported with the aid of export subsi-dies, thereby distorting the market. That does not mean, however, that theEU arrangements for horticulture are not market distorting.
Compensation for product withdrawn from the market is only paid forproduce of marketable quality. The levels of compensation are derived fromprices set in the 1995-96 price fixing round. For withdrawal compensationin 1997 (the first year of application) a reduction of 20 per cent was madeto the initial price for all products other than citrus. Between 1997 and 2002compensation will have declined in equal stages till it reaches a rate 40 percent below the initial level. Although citrus produce will have similar reduc-tions in compensation levels over the five year period, it is not calculated ona percentage basis.
Limits on the volume of produce eligible for EU withdrawal compensationhave also been established. These limits were set at 50 per cent of themarketed production of each eligible product in the 1997 marketing year (30per cent for citrus fruits), reducing in equal amounts to 10 per cent in thefifth marketing year (8.5 per cent for apples and pears). During this periodof reduction, the existing ‘stabiliser mechanism’ will continue to operate ifneeded. Under this mechanism, the value of compensation reduces if with-drawal exceeds defined ‘threshold’ volumes. For example, only 3.9 per centof marketed production of apples and 6.1 per cent of pears were withdrawnin 1996-97 (European Commission 1998).
Although the intervention scheme in operation is market distorting, it is diffi-cult to assess the extent of the impact it has on the market for fresh fruit andvegetable produce. The withdrawal of produce by the producer organisa-tions would lead to some price support although the level of compensationappears to be low compared with market prices.
With the reform of the fresh fruit and vegetable regime in 1996, interven-tion has been declining and more emphasis is being placed on product devel-
13Australian horticulture
EUROPEAN UNION
opment and improvement using producer organisations rather than directlysupporting the industry.
Producer organisationsProducer organisations have access to intervention but they can also submitproposals for operational programs aimed at improving production andmarketing.
To gain access to EU funds, producer organisations must draw up an oper-ational program, which is 50 per cent funded by the European Union (up toan overall ceiling), with the remaining costs covered by member contribu-tions. Some of the objectives of the program should include promotion ofcultivation practices and production techniques that ensure production isplanned and adjusts according to demand, reduces costs, stabilises producerprices and improves product quality.
The operational fund of producer organisations may be used to finance marketwithdrawals, either by paying a supplement to the European Union with-drawal compensation, or by paying withdrawal compensation for productsnot eligible for Union withdrawal compensation.
Marketing standardsThe European Union applies marketing standards for fresh horticulturalproduce. These standards apply to all products at all stages of distributionfrom the grower’s packhouse to the retail shop and to imports and exports,but excludes farm gate sales and produce intended for processing. The stan-dards include criteria of quality, size, labeling, packaging and presentation.Produce can be rejected if it does not meet marketing standards and thusstringent application of these may be used to limit the amount of fresh produceimported into the European Union.
Other forms of supportProducers of citrus fruit who have contracts with processors are eligible forthe payment of processing aid to make processing a more attractive alter-native to withdrawal from the market. This aid results in increased pricesfor processing fruit and larger volumes processed.
In the European Union, orchard grubbing grants have been available to grow-ers of apples, pears, peaches and nectarines to reduce surpluses. At presentall schemes are closed.
14 Australian horticulture
EUROPEAN UNION
Export subsidies are available to EU exporters of apples, lemons, oranges,peaches, nectarines, table grapes, tomatoes and certain nuts to third coun-tries to compensate for the difference between EU and world prices. Anexport licence is required to be eligible for the export subsidies.
Under the WTO Agreement on Agriculture, the volume of subsidised exportsmust decline by 21 per cent while expenditure on the export subsidises mustdecline by 36 per cent from their 1986-90 base level, over the period from1995 to the year 2000. In 2000 the European Union’s maximum annual allow-able quantity of subsided fresh fruit and vegetable, including citrus, will be906 900 tonnes, compared with around 1.1 million tonnes in 1995. In 1997,expenditure on EU export subsidies for fresh fruit and vegetables was US$89million.
Processed fruit and vegetablesThe processed fruit and vegetable regime has been developing since 1968and was most recently reformed in 1996. The main objective of this regimeis to provide production aid to the processing industry to make it morecompetitive on world markets. The aim is to compensate local processorsfor the higher cost of raw materials sourced from within the European Union.However, the structure of the scheme results in it institutionalising the highercost of these raw materials.
Production aidProduction aid is paid to processors of dried figs, prunes, peaches, pears andtomato products if they contract before the beginning of the marketing yearto pay producers a specified minimum price for raw material. Both the rawmaterial and the finished products have to meet minimum quality criteria.Canned pineapple also qualifies for production aid under similar but sepa-rate provisions.
The intention of production aid is to take into account the difference betweenthe minimum price and the price of the raw materials on the world market.The minimum price is determined according to the price set in previousmarketing years and movement of prices in the fresh sector. Account is alsotaken of the difference between the minimum price and prices in majorcompeting countries, as well as trends in the volume and value of externaltrade. Because of production aid, trade with third country suppliers of rawproduce for processing is reduced even if these suppliers could supply theproduct at a lower cost than the EU suppliers could. Imports are further disad-vantaged by the changed regime in that processors are only eligible for
15Australian horticulture
EUROPEAN UNION
production aid if they have supply contracts with recognised EU producerorganisations.
As an example, for the 1999-2000 marketing year the minimum price forpeaches intended for the production of peaches in syrup and/or natural fruitjuice will be 28.37 euro per 100 kilogram net. The production aid for thesame product will be 6.10 euro per 100 kilogram net.
Some provisions have been made to reduce market imbalances that occur asa result of production aid. Aid for peaches and pears in syrup or natural juiceswill be reduced in subsequent years if average production in the previousthree marketing years exceeds established thresholds. Aid for the followingyear is then reduced in proportion to the amount by which the threshold wasexceeded. The thresholds are 582 000 tonnes net weight for peaches in syrupand/or natural juices (EU production in 1996-97 was 494 000 tonnes) and102 805 tonnes net weight for Williams and Rocha pears in syrup and/ornatural juices (EU production in 1996-97 was 126 000 tonnes). As 1996-97was the first marketing year where these provisions applied, the first threeyear average will be for the 1996-97, 1997-98 and 1998-99 marketing years.
For processed tomato products, aid is limited by quota to a fixed volume ofproduction. In addition, a system of preliminary contracts between tomatogrowers and processors ensures that adequate area is planted to meet thedemands of the local processing industry.
As the world price used to calculate the level of production aid is the farm-gate price of fresh products in third countries, any pre-farmgate improve-ments in productivity in these countries will not improve the competitivenessof these products in the European Union. Instead it will simply lower theworld price that is used to calculate the level of production aid that wouldcorrespondingly increase. However, productivity improvements post-farm-gate will improve the competitiveness of third country canned products inthe European Union.
As production aid is based on production levels, processors increase produc-tion up to the thresholds to increase total aid payments. There is an incen-tive for producers to at least maintain production at around the thresholdlevels. The production aid would also tend to provide support for the priceof raw products that meet the quality standards. As a result production ofboth processed and unprocessed fruit is distorted by the payment of produc-tion aid.
16 Australian horticulture
EUROPEAN UNION
Specific measuresThe introduction of specific measures to promote and improve the compet-itiveness of products of major regional importance is provided for in the baseregulation if such products are faced with strong international competition.
Export subsidiesExport subsides for some processed products are paid on the basis of thedifference between EU and third country prices to enable products coveredby the regime to be exported competitively to third countries. The productscurrently eligible for subsidies are processed tomatoes, provisionally pre-served cherries, glace cherries, processed hazelnuts and certain pure orangejuices. Additionally, where the products incorporate added sugar, subsidiesmay be fixed on the percentage of added sugar in processed fruit andvegetable products. This is to compensate for the high supported price foradded sugar in the European Union.
To comply with the Uruguay Round agreement, the volume of subsidisedexports must decline by 21 per cent while expenditure on the export subsi-dies must decline by 36 per cent from their 1986–90 base level over the sixyear implementation period from 1995 to 2000. In the year 2000, the Euro-pean Union’s maximum annual allowable quantity of subsidised processedfruit and vegetables will be 158 600 tonnes, compared with around 200 800tonnes in 1995.
17Australian horticulture
EUROPEAN UNION
United States
The United States is a major market for Australian horticulture, especiallyfresh citrus, macadamia nuts and cut flowers. The Australian apple and pearindustry is interested in extending its presence in the United States and thecitrus industry is seeking expanded access (under treatment) for areas thatcannot qualify for fruit fly area freedom.
TariffsThe United States applies high tariff rates on many processed horticulturalgoods. For example, tariff rates of 16.2–18.5 per cent are applied to importsof Australian canned fruit and juice, compared with Australia’s tariff rate of5 per cent. A 23 per cent ad valorem duty is imposed by the United Stateson imported preserved macadamias, while fresh or dried macadamia nuts inshell and fresh or dried macadamia kernels are levied at US1.8c a kilogramand US7c a kilogram respectively. The tariff rate on imported processedtomatoes is 12.3 per cent, which is considerably higher than Australia’s tariffrate of 5 per cent.
In addition Australian exports of fresh citrus and avocados to the UnitedStates face tariffs of US2c a kilogram and US12c a kilogram respectively.
Sanitary and phytosanitary requirements While the United States does not have a comprehensive list of pests anddiseases, it may regard any pest that does not exist or is not widespread inthe United States as a quarantine pest.
Operating on the basis of an open list of unspecified pests is not a scientificapproach and reduces the transparency of pest risk analysis as laid down inthe WTO Agreement on the Application of Sanitary and PhytosanitaryMeasures (European Commission 1999).
Import permits are required for a large range of restricted items includingfruits and vegetables. It is expected that permit applications be submitted tothe relevant authorities at least 30 days before the arrival of the shipment atthe port of entry.
18 Australian horticulture
UNITED STATES
A phytosanitary certificate is also required for many items including fruit,nuts, vegetables, plants and plant products. Certificates must be issued notmore than 15 days before shipment. Certificates are not required for freshcut flowers or processed plant products unless otherwise restricted.
There are a number of SPS issues affecting Australian exports of horticul-tural products to the United States. These apply to apples and pears, cher-ries, cut flowers and chestnuts.
Apple and pear exports to the United States require accompanying docu-mentation including an import permit, phytosanitary certificate and addi-tional declarations covering treatment of light brown apple moth and fruitflies.
Under the restriction applying to apples and pears, exports are permittedentry provided that:
• they have been produced in accordance with the Workplan for ExportCertification of Australian Apples, Pears and Nashi; or
• they are inspected for light brown apple moth on arrival.
The first option is conducted under guidelines established by the Animal andPlant Health Inspection Service (APHIS) of the United States and must besupervised by an APHIS officer at industry expense.
The second option relies on Australian clearance procedures and compul-sory US inspection on arrival. The US inspection authorities adopt a virtu-ally zero tolerance policy of pests. If detected the shipment must be eitherdestroyed or reshipped to an alternative market (Mexico and Canada willnot accept the shipment if it fails US inspection).
While the United States has approved in-transit cold treatment for fruit fly,they do not accept that preclearance inspection procedures by AQIS for lightbrown apple moth are sufficient to remove the optional requirement for USinspection on arrival. This is despite these procedures being approved byother importers of Australian apples and pears such as New Zealand.
While imports of cherries are not currently permitted into the United States,there is a pest risk assessment pending. However, according to the Australian
19Australian horticulture
UNITED STATES
industry, US authorities claim they do not have the resources to completethe assessment and it may be two years before they can address the issue.
As reported by the European Commission (1999), ‘for new non-manufac-tured agricultural products, there are requirements for import permits to theUnited States. The procedures between application and the inclusion in thelist of approved products are excessively long, even several years. This hasbeen experienced even in cases where other products from the same area ofproduction with the same phytosanitary risks were permitted.’
Under article 6 in the Sanitary and Phytosanitary Agreement, provisionsexist for countries to recognise regions within an exporting country as beingdisease or pest free.
As with other fruit susceptible to fruit fly in Australia, there are cherry produc-tion regions that have been recognised domestically as fruit fly free underthe Interstate Certified Assurance program. The industry argues that over-seas markets should acknowledge these areas, as is the case with citrus tothe United States, claiming that fruit would be cleaner from chemicals andcould be exported at less cost.
While exports of cut flowers and ornamentals generally do not require aphytosanitary certificate, the Australian industry claims that US importinspections are overly stringent and are impeding commercial trade.
Another issue is the rules governing cut flowers of the rutaceae family suchas boronia and yellow bells. As citrus belongs to the same family, any plantswithin this family are technically subject to the same protocols as citrus inrelation to citrus canker. While citrus exports are permitted under area free-dom provisions, flowers of the rutaceae family are produced outside of theseareas and are not permitted under those provisions. AQIS states that Australiais free of citrus canker and is seeking recognition of country freedom fromthe United States to expedite the export of these cut flowers (L. Ransom,AQIS, personal communication, September 1999).
The chestnut industry has also raised concerns over the length of time requiredto gain import permits, claiming that potential buyers have been lost as aresult of waiting for permits. They also claim that US protocols for fumiga-tion are for insects that do not exist in Australia.
20 Australian horticulture
UNITED STATES
AQIS is also working with the citrus and tomato industries in efforts toimprove the range of access of these products from Australia.
The United States presently only accepts citrus from areas with fruit fly areafreedom status (Riverland South Australia; Sunraysia New South Wales,Victoria; Murrumbidgee Irrigation Area New South Wales), with cold ster-ilisation only allowed as a fall back treatment in the event of a breach of areafreedom for those areas (not accepted as a frontline treatment for non fruitfly free areas). The United States also adopts a tough stance on citrusblackspot.
Domestic support and export subsidiesDomestic support for horticultural products in the United States appears tobe minimal.
Under the 1996 farm bill, production flexibility contracts are available foreligible producers and these only include those who had participated or hadcertified acreage in the wheat, feed grains, cotton and rice programs in anyone of the past five years (US Department of Agriculture 1996). Horticulturalproducers are not eligible for this assistance. There is some planting flexi-bility on contract acreage where any commodity may be grown except fruitsand vegetables. This would act to prevent areas that might otherwise bediverted to fruit and vegetables being used for horticulture. That provisionwould tend to support internal US prices for fruit and vegetables.
21Australian horticulture
UNITED STATES
Japan
Japan is a major export destination for Australian cut flowers, mangos,macadamias, oranges and mandarins.
TariffsAustralian exports of fresh citrus and citrus juice to Japan are impeded byrelatively high tariff rates. Applied tariffs on oranges range from 17.3 percent between June and November, to 34.7 per cent for the remainder of theyear. Tariffs on mandarins are 18 per cent all year. Japan has an ad valoremtariff on citrus juice imports at applied rates of between 22.5 and 31.5 percent, or at 24.33 yen a kilogram, whichever is greatest. In spite of these tariffrates Japan is Australia’s fifth largest citrus export market. A reduction intariffs would enable Australia to further develop this market.
Access to Japanese markets for Australian exports of apples and pineapplesare impeded by a tariff rate of 20 per cent.
Sanitary and phytosanitary requirementsJapan is relatively free of exotic pests and diseases and effectively pursuesa minimal risk import policy in its quarantine and food safety decisions.
General import prohibitions exist on ‘all plants and plant products whichserve as hosts of injurious insects or pathogens unknown or of restrictedoccurrence in Japan’. Japan’s list of nonquarantine organisms is incompleteand does not include many insects that are common to Japan and manyexporting countries such as aphids and mites. Japan’s system of zero toler-ance means that products which may carry nonharmful insects are requiredto undergo needless fumigation (European Commission 1999).
In addition, a phytosanitary certificate is required for fresh fruit and vegeta-bles. While a phytosanitary certificate is not required for Australian driednative flowers, clearance by the Japanese is reported to be quicker and easierif a certificate is obtained (AQIS 1999). The pests of main concern forAustralian exports to Japan are fruit fly and codling moth.
22 Australian horticulture
JAPAN
The Japanese approval procedures for fresh fruit are very long (up to threeyears), costly and lacking in transparency (European Commission 1999).The quarantine measures applied by Japan result in extensive researchrequirements before import bans are lifted. Even after imports are approved,the procedures for many of the treatments to guarantee no pest or diseaseentry can be very costly, effectively pricing imports out of the domesticmarket (Milgate 1995).
In cases such as stonefruit, apples, pears and mangos, phytosanitary proto-cols may cover only specific limited product varieties, excluding other, almostidentical varieties. Japan requires repeated testing of established quarantinetreatments each time a new variety of an already allowed agriculturalcommodity is approved for import.
In addition to quarantine measures, strict food safety standards apply andchemical residue testing is carried out on imported fruit and vegetables whereimports exceed 100 tonnes a year for a particular product. There are currentlytests for 104 chemicals (Milgate 1995).
Under a list of key sectoral priorities for 1999-2000, the Australian govern-ment has identified recognition of equivalence by the Japanese Health andWelfare Ministry of certification by AQIS and testing by accredited labora-tories. It has also identified the need for the Japanese government to lift itstesting requirement for agricultural chemicals that are not registered for usein Australia or not used in certain products (Department of Foreign Affairsand Trade 1999).
The lack of recognition by Japan of mainland area freedom from fruit fliesand other pests and diseases in Australia is an important issue of concern forAustralia. As of September 1999, AQIS had a submission for fruit fly areafreedom nearing completion. Other horticultural products, including a rangeof vegetables, would similarly benefit from Japanese acceptance of area free-dom provisions.
Other quarantine issues specific to Japan include the granting of import accessfor a further four varieties of mangos. Japanese quarantine authorities recentlydecided to lift import restrictions on the varieties Keitt, Palmer, R2E2 andKent.
There is also an application for the export of mainland tomatoes to Japan,with the development of risk management options pending.
23Australian horticulture
JAPAN
Domestic support and export subsidiesIn Japan there are no export subsidies, credit programs, transport subsidies,and tax and investment incentives (US Department of Agriculture 1998). Agri-cultural support in Japan is largely provided through administered prices,trade measures and supply management regimes, such as the vegetable supplystabilisation fund. In the 1997 fiscal year (April–March), Japan was 86 percent self-sufficient in vegetables and 53 per cent in fruit (MAFF 1998). Asa result, for vegetables in particular, domestic production dominates themarket, although imports of various kinds of fresh vegetables have been onthe increase in recent years.
Domestic food prices in Japan are high and the Japanese food self-suffi-ciency rate is the lowest among the OECD countries. The Japanese tend toassociate food security with high self-sufficiency. Generally, Japan has ahigh level of food security because of its high incomes and ability to competefor supplies on world markets. However, the perception of vulnerabilitythrough low self-sufficiency appears to have been one of the key issues indesigning a new institutional framework for agriculture which is currentlybeing put into place.
Japan has achieved its 20 per cent targeted reduction in domestic support foragriculture as a whole under the Uruguay Round, as measured by the GATTAggregate Measurement of Support. The measurement was 3.7 trillion yenin 1992, which was 26 per cent less than during the base period, 5.0 trillionyen. Japan does not use any export subsidies that are subject to the reduc-tion commitments under the Uruguay Round agreement.
24 Australian horticulture
JAPAN
South Korea
South Korea is a significant market for Australian potatoes. The citrus andstonefruit industries are also interested in entering this market if quarantineand tariff quota impediments can be overcome.
TariffsAustralia is currently denied access to the South Korean citrus market onquarantine grounds. However, even if these restrictions were lifted, accessto this market would potentially be impeded by a high tariff quota system.Within quota tariffs are 50 per cent, while above quota tariffs are bound ashigh as 152 per cent for mandarins.
Similarly, access to the South Korean market for Australian onion produc-ers is impeded by prohibitive tariffs which are 135 per cent or 180 won perkilogram, whichever is greatest. The Australian chestnut export industry isstill in its infancy. However, commercial trade with the South Korean marketwould be prohibited by tariff rates of 219.4 per cent or 1470 won per kilo-gram, whichever is greatest.
With the exception of citrus, applied tariff rates for many horticultural prod-ucts are relatively low. Bound rates, however, are generally very high and itis on these rates that negotiations are held. For example, the bound rate onapples, pears, avocados and stonefruit is 45 per cent, on citrus 50 per cent,and on cauliflower and broccoli 27–40.5 per cent.
Sanitary and phytosanitary requirements While bound tariffs on agricultural products are excessively high, there isalso a wide range of quarantine and customs related impediments, particu-larly on horticulture, that have emerged over recent years.
Under the general restrictions of South Korean import law, all shipments aresubject to inspection and, if harmful organisms or soil are found, they canbe treated, destroyed or refused entry.
25Australian horticulture
SOUTH KOREA
Phytosanitary certificates must accompany all admissible plants, plant prod-ucts, their containers and packing materials. Other food products that do notrequire a phytosanitary certificate must have health certificates.
The most typical trade barriers in South Korea are nontariff barriers thatcommonly result from nontransparent regulatory practices. The lack of regu-latory transparency and consistency can affect licensing, inspections, typeapproval, marking/labeling requirements and other standards. Despite theAdministrative Procedures Act of 1996, the government is still inconsistentin providing public notice, and announcing minimum comment periods andtransitional periods before implementation of new regulations (US Depart-ment of State 1998).
Australian access to the South Korean horticulture market is currently limitedto potatoes, onions, carrots, leafy and flowering type vegetables and cut flow-ers, with access for other horticultural products restricted by quarantinemeasures.
The Australian horticulture industry has identified access for citrus (orangesand lemons) as its highest priority and technical discussions between quar-antine agencies have been under way for several years to obtain acceptanceof Australian fruit (Department of Foreign Affairs and Trade 1999).
Domestic support and export subsidiesLike Japan, agricultural policy development in South Korea has been aimedat maintaining a high degree of self-sufficiency. Farm income has beensupported primarily through strong government intervention, and thus, theagricultural sector is highly dependent on government support (MAF 1999).Specific information on South Korean government intervention is difficultto find, therefore more general comments on support are provided.
Vegetable production is of great importance to South Korean agriculture.Major vegetables grown are Chinese cabbage, radish, red pepper, garlic andonion. Several kinds of fruit including apples, pears, mandarin oranges,grapes and sweet persimmon are produced in South Korea. Fruit productionhas increased steadily with government encouragement.
South Korea had no export subsidies subject to reduction commitments underGATT during the base period and therefore no reduction commitments existunder this element in South Korea’s schedule (MAF 1999).
26 Australian horticulture
SOUTH KOREA
Establishment of a system of fostering professional farm operating units The South Korean Ministry of Agriculture and Forestry (MAF) has a planto enhance competitiveness of full time farmers who display growth poten-tial and enthusiasm. Under the plan, MAF will foster 150 000 full time farm-ers by 2004, of which 30 000 will be involved in horticulture.
Reduction of government subsidies to farm operating units and theirprogressive conversion to loans The excessive government subsidies to farmers limit the farmers’ self-reliance. With the aim of addressing these effects, it was decided that subsi-dies for farmers and corporate farms should be phased out and converted toloans by the year 2001.
Toward a new integrated financial support system for farm operations MAF has decided to move toward a new integrated system of granting finan-cial support for individual farm units in each period when they need financ-ing. Before financial support is granted, an in-depth analysis and evaluationof the longer term farming programs that are submitted by individual farm-ing units will be carried out. The new system is scheduled to be fully imple-mented by 2001 after being practised on a pilot basis during 1999 (MAF1999).
27Australian horticulture
SOUTH KOREA
Indonesia
Indonesia is one of Australia’s most important horticultural export markets,with significant quantities of Australian citrus, apples, pears, stonefruit,melons and potatoes being sold into this market.
TariffsWhile the applied tariff rates on imports of Australian horticultural productsinto Indonesia are very low and as such, are not considered a barrier to trade,Indonesian bound rates are very high. For example, Indonesia imposes anapplied tariff rate of 5 per cent on imports of fresh citrus, but the bound rate,which could be applied, is 40–50 per cent. Bound rates of 40–50 per centapply to many other horticultural goods such as apples, pears, avocados,canned fruit, vegetables and stonefruit.
With bound tariffs being substantially greater than applied tariffs, if govern-ment policy were to become more inward looking, the Indonesian govern-ment could legitimately raise applied tariff rates to very high noncommerciallevels. So while the actual applied rates are relatively low there is scope toincrease these rates to the high ceiling levels set by the bound rates. To limitthe scope for this to occur, significant reductions in bound rates would berequired.
Sanitary and phytosanitary requirementsAustralia has access to Indonesia for a wide range of horticultural products.Products can pass Indonesian quarantine requirements for fruit fly by eitherarea freedom or the adoption of a range of disinfestation methods.
All permitted imports are subject to preshipment inspection by an Australianbased Indonesian inspection organisation. All products valued at US$5000or more must be issued a certificate for goods to be cleared through IndonesiaCustoms.
A phytosanitary certificate is required for all plants and plant products. Pro-cessed food requires a health certificate.
28 Australian horticulture
INDONESIA
Indonesian quarantine is not identified as a significant barrier to entry and thusmay be regarded as a low priority area for negotiations or bilateral discussions.
Domestic support and export subsidiesThere is little detailed information available on domestic support arrange-ments in Indonesia for horticultural products. Credit facilities exist for devel-oping food crops and horticulture, although details of such facilities arelimited. Among others there appear to be credit facilities for farmers and forprimary cooperatives.
The Indonesian Ministry of Agriculture has identified that the support anddevelopment of food crops and horticulture is an important policy issue(Ministry of Agriculture 1999). The aim of this increased focus on food cropsand horticultural development is to increase production and productivity, toimprove post-harvest and product quality. To achieve these objectives, theDirectorate General of Food Crops and Horticulture has developed a numberof programs, such as farming system development, integrated small farm-ers development, and the infrastructures and resources development program.
The Indonesian government also encourages investment in horticulture andfood crops (Ministry of Agriculture 1999). This includes investment in thefarming system, post-harvest procedure, processing, procurement of produc-tion inputs and marketing. In the current policy on investment in this areathe target of food crops and horticulture was 62.8 billion rupiahs or 50 percent of the total investment in the agriculture sector. However, details on thespecific nature of this investment policy in relation to horticulture are notreadily available.
29Australian horticulture
INDONESIA
China
If market access impediments including high tariff barriers can be overcome,China holds great potential as an export market for Australian horticulture.With China to become a member of the WTO in 2000 many of the currentbarriers to access are likely to be reduced.
TariffsWith most favored nation status, Australia faces tariffs of 30 per cent onexports of apples, pears, cherries, macadamias, canned fruit and vegetables.With the exception of apples, other fresh horticultural imports from Australiaare only approved for the hotel trade and not general domestic consumption.
Sanitary and phytosanitary requirementsApples from Tasmania are the only fresh horticultural products that havebeen granted general access to China. This access was achieved largelythrough Tasmania’s pest and disease free status. Further access to China formangos and citrus is a current industry priority.
As established trade protocol with China is very limited, little is known aboutthe specifics of China’s quarantine requirements for horticultural products.Phytosanitary certificates are required for all plants and unprocessed plantproducts, while import permits are only required for imports that are usuallyprohibited.
With China’s likely accession to the WTO most of its trade barriers will haveto be dismantled or substantially reduced as it commits to open its marketsto world exports.
Domestic support and export subsidiesSpecific information on domestic support arrangements in China for horti-cultural products is difficult to obtain; however, some general informationis available. According to the US State Department (1998a), direct subsi-dies for Chinese exports were abolished on 1 January 1991. However, anumber of indirect subsidies to China’s manufactured exporters still exist,
30 Australian horticulture
CHINA
such as guaranteed provision of energy, raw materials or labor supplies andbank loans that need not be repaid or which enjoy lengthy or preferentialpayment terms. Exporters also have access to tax rebates and duty exemp-tions on imported inputs for export production.
As part of its negotiations to join the WTO, China announced in 1997 thatit would not reintroduce export subsidies for agricultural goods followingits accession. As little public information about the central government’s1997 and 1998 budget revenue and expenditures has been released, it is diffi-cult to verify that export subsidies are not used. In 1997, total subsidies fordomestic price support and loss making state owned enterprises representedabout 11 per cent of total revenues.
31Australian horticulture
CHINA
Chinese Taipei
Chinese Taipei is a market in which Australian exports could be furtherexpanded. However, import quotas and tariffs are impeding current marketdevelopment. Nevertheless, Australia has established itself as an importantsupplier of fresh kiwifruit and stonefruit to this market.
It is expected that Chinese Taipei will also join the WTO soon after China’saccession. As a part of this process, the removal of import quotas on apples,citrus, plums and peaches and the reduction in import tariffs remains a keypriority for the Australian horticultural industry.
TariffsAccess for horticultural products to Chinese Taipei is restricted by tariffsand quotas. Australia has a quota allocation of 2400 tonnes for apples and600 tonnes for citrus (excluding mandarins). While the duty on apples is 50per cent, the duty on pears and fresh citrus is 40 per cent. Tariff duties ononions, cauliflower and broccoli range from 32.5 to 40 per cent and on stone-fruit, from 35 to 50 per cent. The tariff on avocados is 28 per cent. Whileimports of fresh cherries attract a lower duty of 12 per cent, it is still highby Australian standards.
Sanitary and phytosanitary requirementsAccess to the Chinese Taipei market is prohibited for some horticulturalproducts on quarantine grounds, while access for most other products isrestricted. Approval for restricted products needs to be sought from theChinese Taipei Board of Foreign Trade and/or the Bureau of CommodityInspection and Quarantine. There are often additional declarations andphytosanitary certificates required for certain pests.
The presence in Australia of burrowing nematode, Mediterranean fruit fly,Queensland fruit fly and codling moth, together with other injurious pestsand diseases, are of major concern to the authorities in Chinese Taipei. Strictdisinfestation procedures are enforced for all allowable fresh product (exceptof Tasmanian origin) imported into Chinese Taipei.
32 Australian horticulture
CHINESE TAIPEI
Where fruit fly host products are exported from mainland Australia to ChineseTaipei by airfreight, the product must undergo fruit fly disinfestation treat-ment of fixed temperature fumigation with methyl bromide followed by adefined period under cold storage prior to export.
The Australian stonefruit industry argues that the fixed temperature systemis detrimental to fruit quality and would prefer to have a sliding scale system(as used for exports to other markets) recognised by Chinese Taipei author-ities. Although a sliding scale treatment is accepted for the same fruit exportedfrom the United States, Chinese Taipei insists on Australia providing compre-hensive scientific data to prove the effectiveness of the sliding scale treat-ment for Australian fruit (P. McFarlane, Australian Fresh Stonefruit GrowersAssociation, personal communication, September 1999).
For seafreight export to Chinese Taipei the product is required to undergo a14 day in-transit cold disinfestation treatment for fruit fly. In the case of cher-ries, this disrupts the timing of the fruit to the market and can result in poorprices. The industry would prefer that the same treatment could be under-taken in Australia under appropriate supervision, thus allowing the fruit tobe airfreighted to the market in a more timely manner (I. Hay, CherryHaven,personal communication, October 1999).
An issue for the horticulture industry in general is to pursue recognition ofmainland area freedom from fruit fly as is provided for under Article 6 ofthe Sanitary and Phytosanitary Agreement.
Domestic support and export subsidiesThe policy objectives governing Chinese Taipei’s national agricultural indus-try include developing the agricultural industry, constructing farming villagesand taking care of farmers. Chinese Taipei recently redesigned their agri-cultural policies (Council of Agriculture 1996). A new program called theCross-Century Agricultural Development Program was implemented in fiscalyear 1998 (from July 1997). The period of implementation for this programis four years.
Although details on this new program are difficult to find it is understoodthat under this program the production and area planted to unpolished rice,raw sugar cane and dryland crops such as corn, sorghum and soybean willbe reduced. Direct payments for acreage set aside and rotation of high valueproducts and horticultural produce such as flowers will be granted for areas
33Australian horticulture
CHINESE TAIPEI
released by the above measures. These direct payments encourage increasedproduction of crops that are eligible for the payments, ultimately increasingthe amount of produce available on the domestic market and for export. Thisincreased domestic production will then compete with imports and also otherproduct on the global market.
In addition, a number of direct and indirect subsidy programs are offered toagricultural producers by the Chinese Taipei government (US State Depart-ment 1998b). These include financial assistance and guaranteed domesticprices higher than those prevailing on the global market. Incentives that mayhave the effect of subsidising exports are also provided to industrial firmsin export processing zones and to firms in identified emerging industries. AsChinese Taipei is currently in the process of WTO accession, it must notifythe WTO of these programs. As a result some of these subsidy programsmay need to be amended or abolished if they are deemed inconsistent withWTO principles.
34 Australian horticulture
CHINESE TAIPEI
Industry profiles
The principal features of key Australian horticultural industries are discussedin detail in the remainder of this report. Aspects of these sectors include:location of production and output trends; export performance by key markets;Australian support arrangements; market access issues in important markets;and assistance to local industries in export markets and in the main compet-ing exporting countries.
The discussion for each industry is not exhaustive. A range of sources wasused. The most important of these were the Australian Bureau of Statistics,the United Nations, US Department of Agriculture, and persons engaged inthe local (Australian) industries.
The following horticultural sectors are covered in this part of the report:
• almonds
• apples and pears – fresh
• avocados
• canning fruit
• cherries
• chestnuts
• citrus (fresh) and citrus juice
• custard apples
• cut flowers
• macadamias
• mangos, melons, pawpaws and pineapples
• potatoes
• stonefruit – fresh
• strawberries
• tomatoes – fresh
• tomatoes – processed
• vegetables (excluding potatoes and tomatoes)
35Australian horticulture
PART 3
Almonds
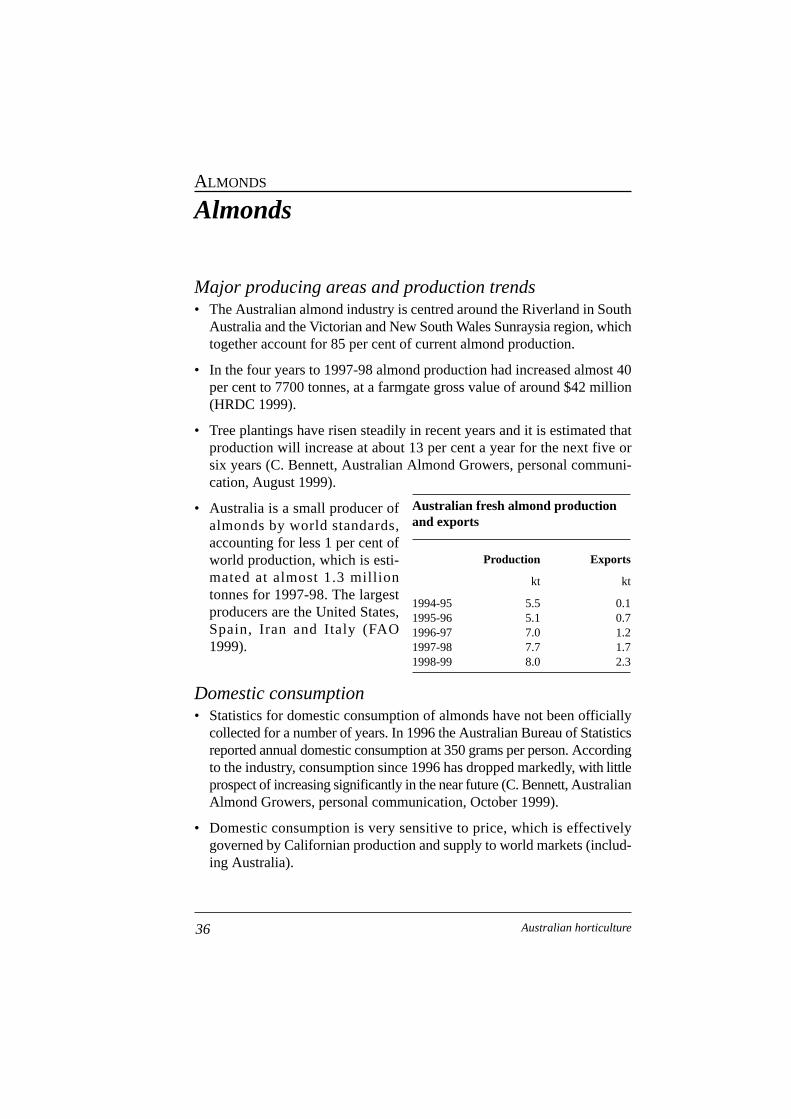
Major producing areas and production trends• The Australian almond industry is centred around the Riverland in South
Australia and the Victorian and New South Wales Sunraysia region, whichtogether account for 85 per cent of current almond production.
• In the four years to 1997-98 almond production had increased almost 40per cent to 7700 tonnes, at a farmgate gross value of around $42 million(HRDC 1999).
• Tree plantings have risen steadily in recent years and it is estimated thatproduction will increase at about 13 per cent a year for the next five orsix years (C. Bennett, Australian Almond Growers, personal communi-cation, August 1999).
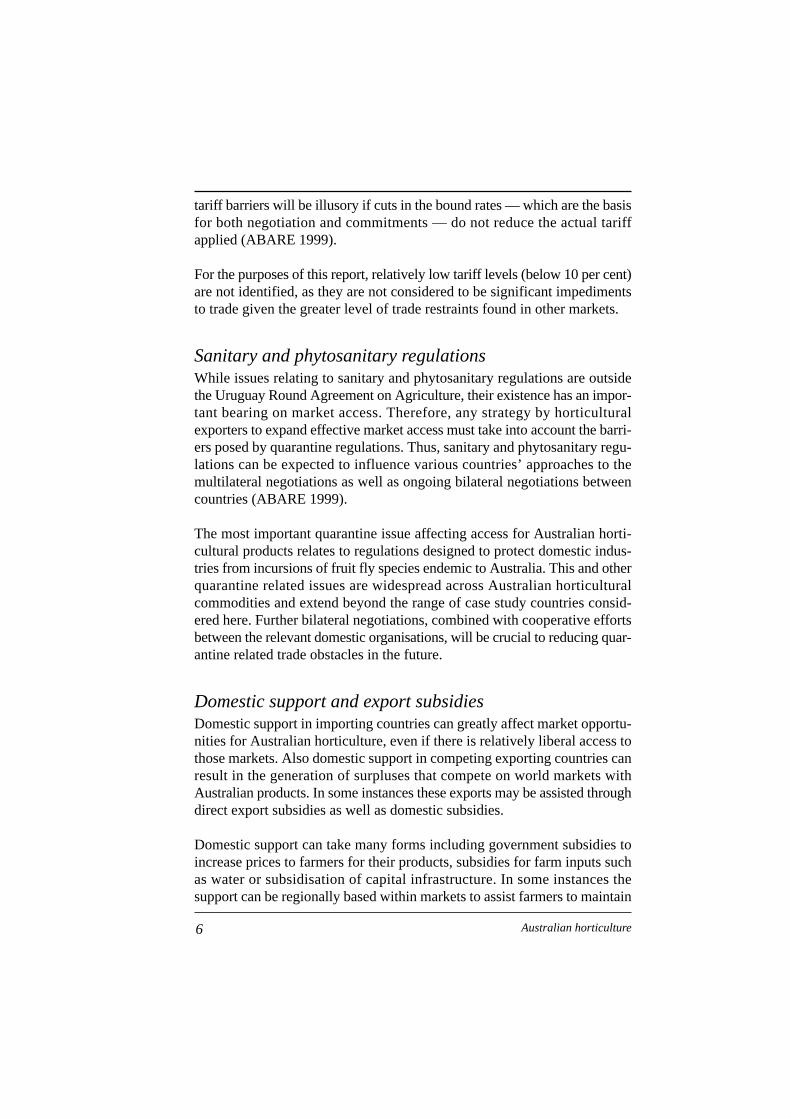
• Australia is a small producer ofalmonds by world standards,accounting for less 1 per cent ofworld production, which is esti-mated at almost 1.3 milliontonnes for 1997-98. The largestproducers are the United States,Spain, Iran and Italy (FAO 1999).
Domestic consumption• Statistics for domestic consumption of almonds have not been officially
collected for a number of years. In 1996 the Australian Bureau of Statisticsreported annual domestic consumption at 350 grams per person. Accordingto the industry, consumption since 1996 has dropped markedly, with littleprospect of increasing significantly in the near future (C. Bennett, AustralianAlmond Growers, personal communication, October 1999).
• Domestic consumption is very sensitive to price, which is effectivelygoverned by Californian production and supply to world markets (includ-ing Australia).
36 Australian horticulture
ALMONDS
Australian fresh almond productionand exports
Production Exports
kt kt
1994-95 5.5 0.11995-96 5.1 0.71996-97 7.0 1.21997-98 7.7 1.71998-99 8.0 2.3
Export trends and competition• Consistent increases in production combined with a decline in domestic
consumption, have resulted in a significant increase in exports over thepast five years, albeit from a low base.
• Exports of almonds increased from 105 tonnes in 1994-95 to over 2300tonnes in 1998-99, with a value of almost $11 million. Australia is consid-ered to be the largest southern hemisphere supplier.
• With an expected growth in production of around 13 per cent a year forthe next five or six years and little prospect of significant increases in dom-estic consumption, the industry will be increasingly reliant on exports.
• Export markets for almonds have traditionally been opportunistic. Forexample, in each of the three years to 1996-97, the top three export desti-nations were different markets (see export table).
• Since then, however, India has become the major importer of Australianalmonds, accounting for around 90 per cent of total Australian exports in1997-98 and 1998-99.
• European countries such as Spain, Germany, France and the UnitedKingdom are regarded as potential markets. While these markets preferlocal, stronger flavored varieties, consumption far exceeds domesticproduction. Consequently, these countries import large quantities ofalmonds. At present, these imports are predominantly being sourced fromthe United States.
• Australia’s main variety is the same as that produced by the United Statesand Australia is a price taker on world markets. One view within theAustralian industry is that a shift to the European preferred varieties wouldestablish a viable long term market niche, thus avoiding much of the directcompetition with the Californian producers (C. Bennett, Australian AlmondGrowers, personal communication, October 1999).
• The United States dominates virtually every export market for almonds.Australia holds negligible shares in the export markets to which it shipsproduct. However, Australia does have a counterseasonal supply advan-tage in exporting to northern hemisphere markets.
State/regional export contributions• South Australia has been the dominant almond exporting state and in 1998-
99 exported 60 per cent (1373 tonnes) of total almond exports (by volume).
37Australian horticulture
ALMONDS
Australian support arrangements• No known domestic support arrangements.
Market access issues• The major market access issue for the almond industry centres on India
which has a very high tariff rate of 40 per cent on almond imports. Thisis much higher than most other importing countries.
• Thailand too has a very high tariff of 60 per cent. While it remains at thislevel it is unlikely that this market will be considered an export opportu-nity.
• Tariffs on almonds shipped into the European Union, at around 6 per cent,are not considered to be a barrier to access.
Industry assistance in major importing and exportingcountries• No known assistance for overseas exporters.
Technical barriers to trade• There are no known technical barriers to trade.
38 Australian horticulture
ALMONDS
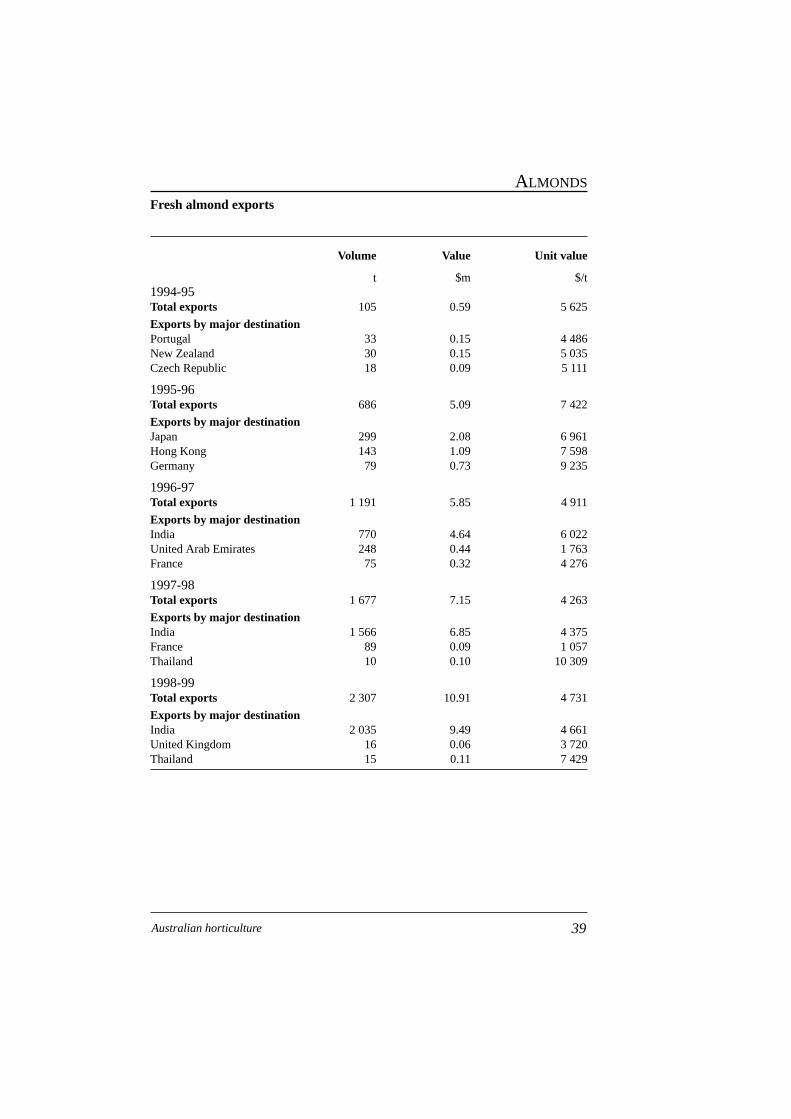
Fresh almond exports
Volume Value Unit value
t $m $/t1994-95Total exports 105 0.59 5 625
Exports by major destinationPortugal 33 0.15 4 486New Zealand 30 0.15 5 035Czech Republic 18 0.09 5 111
1995-96Total exports 686 5.09 7 422
Exports by major destinationJapan 299 2.08 6 961Hong Kong 143 1.09 7 598Germany 79 0.73 9 235
1996-97Total exports 1 191 5.85 4 911
Exports by major destinationIndia 770 4.64 6 022United Arab Emirates 248 0.44 1 763France 75 0.32 4 276
1997-98Total exports 1 677 7.15 4 263
Exports by major destinationIndia 1 566 6.85 4 375France 89 0.09 1 057Thailand 10 0.10 10 309
1998-99Total exports 2 307 10.91 4 731
Exports by major destinationIndia 2 035 9.49 4 661United Kingdom 16 0.06 3 720Thailand 15 0.11 7 429
39Australian horticulture
ALMONDS
Apples and pears – fresh
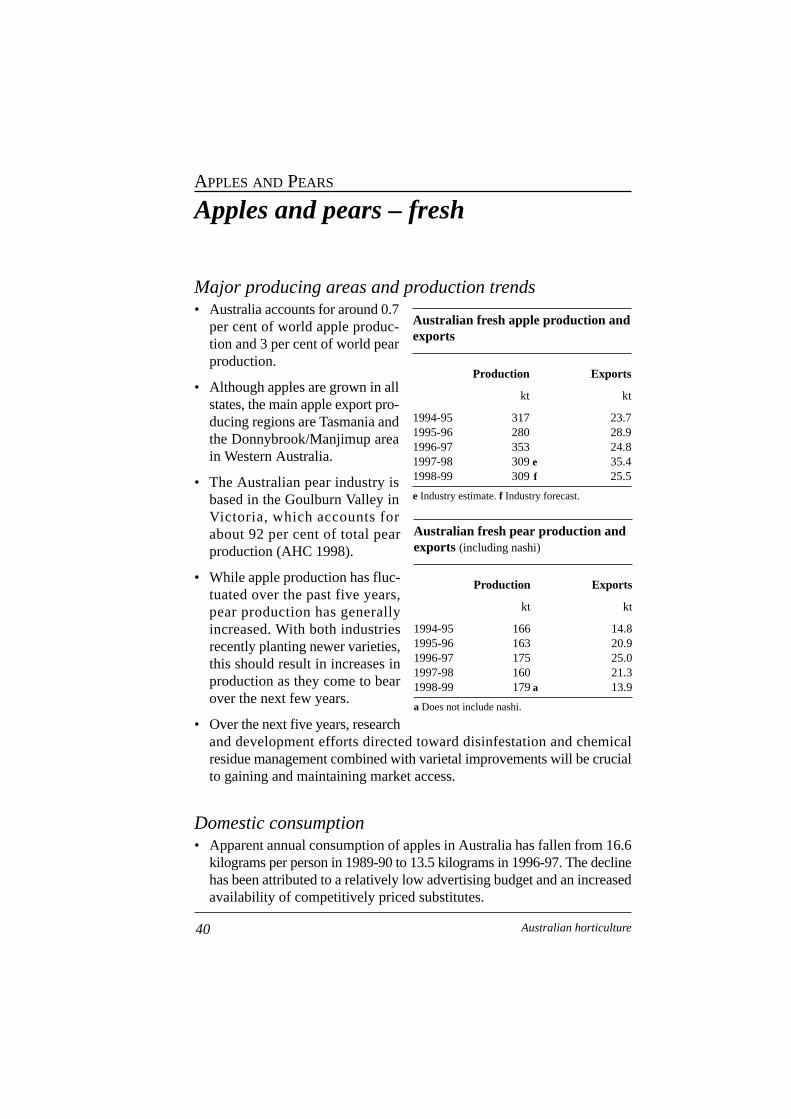
Major producing areas and production trends• Australia accounts for around 0.7
per cent of world apple produc-tion and 3 per cent of world pearproduction.
• Although apples are grown in allstates, the main apple export pro-ducing regions are Tasmania andthe Donnybrook/Manjimup areain Western Australia.
• The Australian pear industry isbased in the Goulburn Valley inVictoria, which accounts forabout 92 per cent of total pearproduction (AHC 1998).
• While apple production has fluc-tuated over the past five years,pear production has generallyincreased. With both industriesrecently planting newer varieties,this should result in increases inproduction as they come to bearover the next few years.
• Over the next five years, researchand development efforts directed toward disinfestation and chemicalresidue management combined with varietal improvements will be crucialto gaining and maintaining market access.
Domestic consumption• Apparent annual consumption of apples in Australia has fallen from 16.6
kilograms per person in 1989-90 to 13.5 kilograms in 1996-97. The declinehas been attributed to a relatively low advertising budget and an increasedavailability of competitively priced substitutes.
40 Australian horticulture
APPLES AND PEARS
Australian fresh apple production andexports
Production Exports
kt kt
1994-95 317 23.71995-96 280 28.91996-97 353 24.81997-98 309 e 35.41998-99 309 f 25.5
e Industry estimate. f Industry forecast.
Australian fresh pear production andexports (including nashi)
Production Exports
kt kt
1994-95 166 14.81995-96 163 20.91996-97 175 25.01997-98 160 21.31998-99 179 a 13.9
a Does not include nashi.
• Over the three years to 1996-97, apparent annual consumption of pears(not including nashi) was relatively stable and averaged around 5.3 kilo-grams per person.
Export trends and competitionApproximately 10 per cent of the apple crop and pear crop are exported eachyear. Although Australian exports form a very small proportion of worldtrade, they fill a counterseasonal supply requirement in the northern hemi-sphere.
While Asian markets are the major destinations for apple and pear exports,the industry plans to extend its presence in the United States, China and theUnited Kingdom.
Apples• Apple exports peaked in 1997-98 at 35 400 tonnes, with an estimated
value of around $38 million, before falling back to average levels of around25 500 tonnes, worth $31 million in 1998-99.
• The major destinations of apple exports from Australia are Malaysia,Singapore the United Kingdom and recently Sri Lanka. Combined, thesemarkets accounted for over 60 per cent of the total volume and value ofexports in 1998-99.
• Unit returns from pink lady variety apples shipped to the United Kingdomwere just over 150 per cent higher than the average returns from otherdestinations in 1998-99 and have historically been very high. Althoughthe quantity exported to the United Kingdom is considerably lower thanthat entering Asian markets, the high returns make it an attractive marketto service.
• Australia faces competition from New Zealand, South Africa, Argentina,Chile and Brazil in the counterseasonal supply of apples to the northernhemisphere. Each of these countries is extremely cost competitive com-pared with Australia and, with the exception of New Zealand, is geo-graphically closer to the high valued US and European markets. Most ofthese southern hemisphere countries, together with the United States, arealso significant competitors in the Asian markets of Malaysia, Singaporeand the Philippines.
• With the exception of Malaysia (where Australian apples accounted for20 per cent of the market in 1996), the Australian share of export markets
41Australian horticulture
APPLES AND PEARS
is dwarfed by that of New Zealand which was the sixth biggest appleexporter in the world in 1997 (FAO 1999).
Pears (including nashi)• Pear exports peaked in 1996-97 at 25 000 tonnes, with an estimated value
of around $30 million. Following a biennial year of reduced productionin 1997-98, exports in 1998-99 fell to 13 900 tonnes, valued at $17 million.
• The major export markets for pears are Singapore, Hong Kong andMalaysia, which together accounted for 77 per cent of the volume shippedin 1998-99.
• In Singapore and Malaysia, Australian pears (European type) hold 25–30per cent of the market, but face significant competition from China (Asiantype), which holds between 55 and 60 per cent of those markets.
• In the Hong Kong market, imports from elsewhere in China and Japanaccount for almost 80 per cent of the market between them, with Australiaand South Africa each holding around 6 per cent (UNCTAD 1999).
• The US market, in which the Australian industry is keen to improve itsposition and which currently takes around 1 per cent of Australian exportsof pears, obtains over 80 per cent of its counterseasonal imports from thesouthern hemisphere suppliers of Chile and Argentina. This is forecast tocontinue because of US trade investments in South America.
State/regional export contributionsApples• State level export data reveal that exports from Tasmania tend to be into
lower value markets, while those from Western Australia service highervalue markets. In 1998-99, 55 per cent of the volume and 47 per cent ofthe value of fresh apple exports came from Tasmania. Tasmania’s free-dom from pests such as fruit fly has been the main factor in its exportprominence. Western Australia was the next largest exporter, accountingfor 19 per cent and 25 per cent of the volume and value of exports respec-tively. Its proximity to the northern hemisphere and Asian markets hasbeen a factor in its export success.
Pears • In 1998-99, just over 80 per cent of fresh pear exports came from Victoria.
Western Australia was the next largest exporter, accounting for 13 per centof exports.
42 Australian horticulture
APPLES AND PEARS
Australian support arrangements• Australia maintains a ban on apple imports from most countries (Japan,
Korea, China excluded), under existing quarantine regulations because ofthe possible introduction of pests and disease, the most prominent of whichis fireblight.
• There have been several unsuccessful applications by New Zealand tohave access granted to the Australian market. A further application waslodged in January 1999 and is currently under consideration by the govern-ment.
• Although there are no duties on the import of pears into Australia, quar-antine related restrictions on fireblight restrict access to potential exporterssuch as the United States.
Market access issues• There are no significant market access issues for Australian apples and
pears in the current major markets of Singapore, Malaysia, Hong Kongand the United Kingdom.
• Singapore and Hong Kong are ‘free’ ports in so far as they do not imposeimport tariffs or require phytosanitary certificates.
• While Malaysia has reduced its tariffs significantly over recent years, itmaintains a degree of control over imports through import licensingrequirements.
• As part of the European Union, the United Kingdom does not have anoverly restrictive tariff regime for apples and pears. However, it does main-tain very strict quality and food safety standards that may prevent the entryof produce that is acceptable to other markets.
• The distance to the UK market results in very high transport costs and isthe main reason that this market is difficult to maintain. This is com-pounded by the strong competition from other southern hemisphere sup-pliers that are considerably closer, such as South Africa and Chile.
• For these reasons, it is likely that the United Kingdom will only be anexport option under opportunistic conditions (except exports of the pinklady variety, as this is a dedicated trade) such as when there are crop disas-ters in other countries that Australia competes against.
43Australian horticulture
APPLES AND PEARS
• Recently, Sri Lanka has emerged as a significant export market for Aus-tralian apples. However, an applied tariff of 35 per cent will restrict thegrowth into this market.
• The industry is now turning its main focus to the United States, whichimports roughly twice the volume of apples and pears as Malaysia andSingapore. However, establishing appropriate import protocols with theUnited States has been a costly and lengthy process to date.
• While the only import duty is US0.6 cents a kilogram for pears deliveredbetween 1 July and 31 March, the US requires all quarantine clearance tobe undertaken on arrival and will not authorise the preclearance of fruitby AQIS in Australia.
• While the United States has approved the in-transit cold treatment of fruitfly, they do not accept the preclearance inspection procedures by AQISfor light brown apple moth. This is despite these procedures beingapproved by other importers of Australian apples such as New Zealand.
• This leaves the industry with two options — either chance inspection onreaching the United States, where if light brown apple moth is detected,the product must either be destroyed or reshipped to an alternative market(Mexico and Canada will not accept it either); or employ a USDA inspec-tor to clear the product preshipment at significant cost to the packers.
• China holds good potential as an export market for Australian apples andpears. However, inconsistencies in the administration of imports have sofar retarded any significant growth. China is also a significant producerof apples, with production increasing.
• China has strict sanitary and phytosanitary requirements for the import offruits and vegetables along with duties of 30 per cent for countries withMFN status and 100 per cent for other countries (depending on the portof entry).
• While Tasmanian apples (because of that state’s fruit fly free status) havegained official access to mainland China by meeting its stringent quaran-tine protocols, the benefits of having done so are reduced because ofproduce illegally or unofficially entering the mainland via Hong Kong. Itis estimated that up to 60 per cent of fruit shipped to Hong Kong ends upin mainland China (K. McGillen, exporter, personal communication,September 1999).
44 Australian horticulture
APPLES AND PEARS
• In 1998, China improved the enforcement of tariff collection and otherimport regulations. While this move has increased the cost of using unof-ficial import channels, the effect on trade to date has not been great.However, with 1999’s official apple import total and re-export totals muchcloser than in years past, the greater enforcement might be causing a largerportion of fruit to enter China via official channels (USDA 1999).
• Chinese Taipei is another market for which Australian exports could bedeveloped further; however, import quotas and high tariffs are dilutingmuch of the interest of exporters at present.
• Exports of apples from all countries into Chinese Taipei, except from theUnited States and Canada, are limited by quotas.
• Australia faces an import quota of 2400 tonnes for apples into ChineseTaipei and a duty rate of 50 per cent. There is no quota on pears but theduty is 40 per cent.
• The discriminatory use of import quotas by Chinese Taipei is trade distort-ing and hampers the generic promotion and development of freshAustralian fruit into the market. For this reason there has been a reluc-tance to commit resources to developing Chinese Taipei as a market, andas a result the apple quota has not been met in recent years.
Industry assistance in major importing and exportingcountries• The European Union has in place a number of support arrangements
including compensation payments for product withdrawal, production andexport subsidies and rootstock adjustment programs. For more detail, referto the trade policy analysis section.
Technical barriers to trade• No technical barriers to trade identified.
45Australian horticulture
APPLES AND PEARS
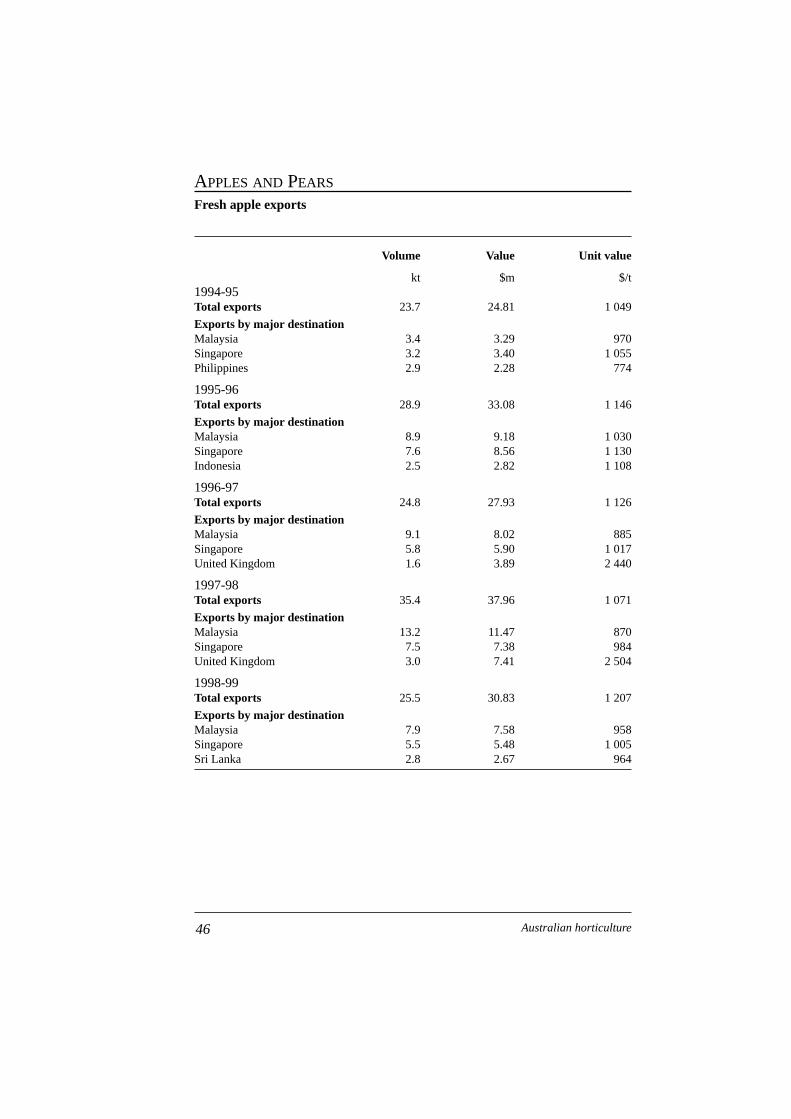
Fresh apple exports
Volume Value Unit value
kt $m $/t1994-95Total exports 23.7 24.81 1 049
Exports by major destinationMalaysia 3.4 3.29 970Singapore 3.2 3.40 1 055Philippines 2.9 2.28 774
1995-96Total exports 28.9 33.08 1 146
Exports by major destinationMalaysia 8.9 9.18 1 030Singapore 7.6 8.56 1 130Indonesia 2.5 2.82 1 108
1996-97Total exports 24.8 27.93 1 126
Exports by major destinationMalaysia 9.1 8.02 885Singapore 5.8 5.90 1 017United Kingdom 1.6 3.89 2 440
1997-98Total exports 35.4 37.96 1 071
Exports by major destinationMalaysia 13.2 11.47 870Singapore 7.5 7.38 984United Kingdom 3.0 7.41 2 504
1998-99Total exports 25.5 30.83 1 207
Exports by major destinationMalaysia 7.9 7.58 958Singapore 5.5 5.48 1 005Sri Lanka 2.8 2.67 964
46 Australian horticulture
APPLES AND PEARS
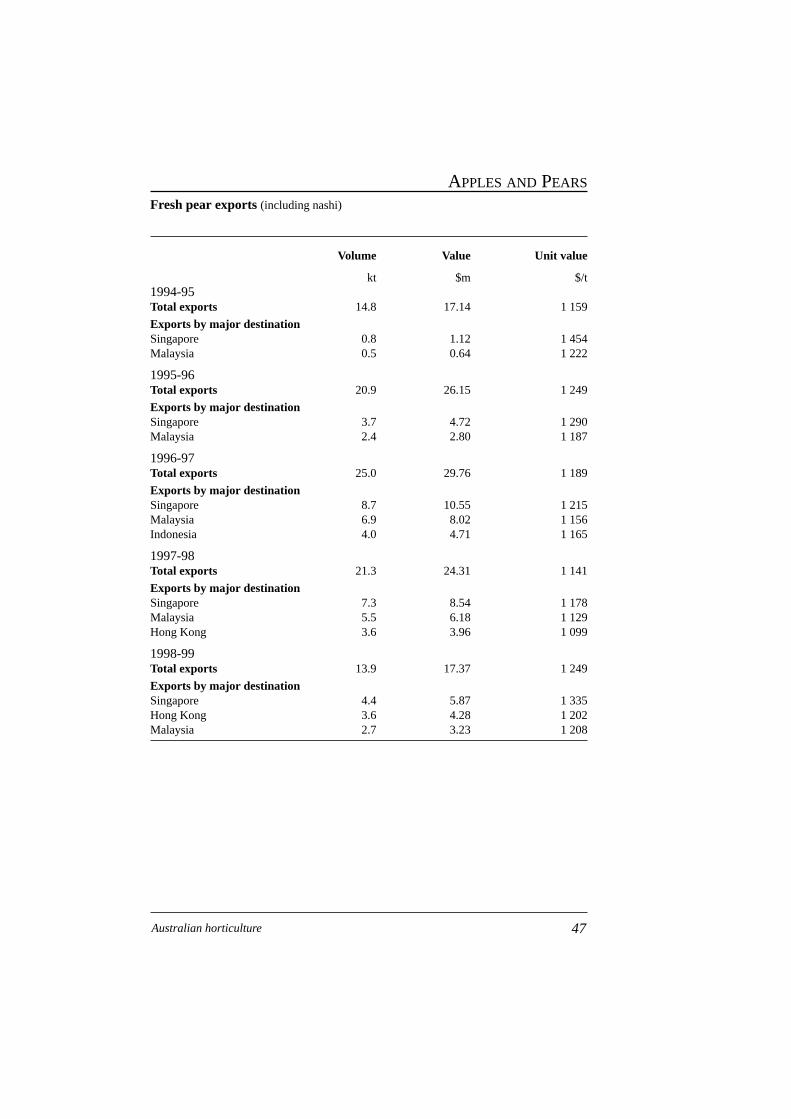
Fresh pear exports (including nashi)
Volume Value Unit value
kt $m $/t1994-95Total exports 14.8 17.14 1 159
Exports by major destinationSingapore 0.8 1.12 1 454Malaysia 0.5 0.64 1 222
1995-96Total exports 20.9 26.15 1 249
Exports by major destinationSingapore 3.7 4.72 1 290Malaysia 2.4 2.80 1 187
1996-97Total exports 25.0 29.76 1 189
Exports by major destinationSingapore 8.7 10.55 1 215Malaysia 6.9 8.02 1 156Indonesia 4.0 4.71 1 165
1997-98Total exports 21.3 24.31 1 141
Exports by major destinationSingapore 7.3 8.54 1 178Malaysia 5.5 6.18 1 129Hong Kong 3.6 3.96 1 099
1998-99Total exports 13.9 17.37 1 249
Exports by major destinationSingapore 4.4 5.87 1 335Hong Kong 3.6 4.28 1 202Malaysia 2.7 3.23 1 208
47Australian horticulture
APPLES AND PEARS
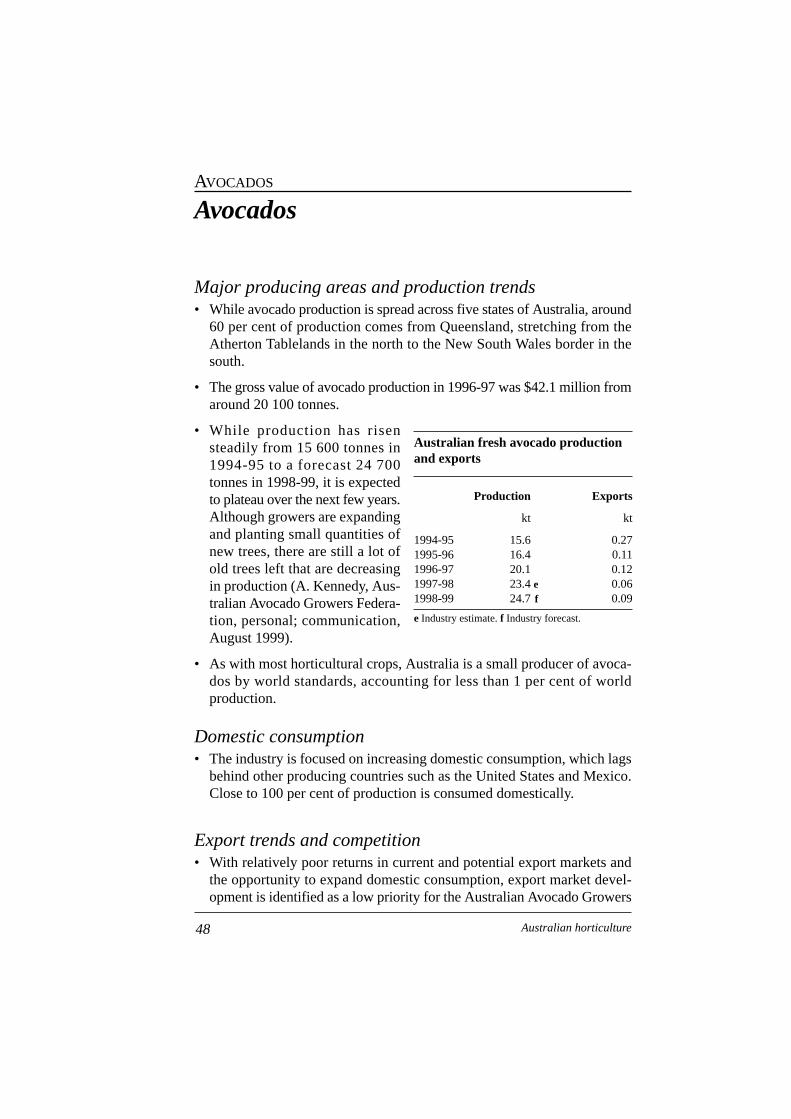
Avocados
Major producing areas and production trends• While avocado production is spread across five states of Australia, around
60 per cent of production comes from Queensland, stretching from theAtherton Tablelands in the north to the New South Wales border in thesouth.
• The gross value of avocado production in 1996-97 was $42.1 million fromaround 20 100 tonnes.
• While production has risensteadily from 15 600 tonnes in1994-95 to a forecast 24 700tonnes in 1998-99, it is expectedto plateau over the next few years.Although growers are expandingand planting small quantities ofnew trees, there are still a lot ofold trees left that are decreasingin production (A. Kennedy, Aus-tralian Avocado Growers Federa-tion, personal; communication,August 1999).
• As with most horticultural crops, Australia is a small producer of avoca-dos by world standards, accounting for less than 1 per cent of worldproduction.
Domestic consumption• The industry is focused on increasing domestic consumption, which lags
behind other producing countries such as the United States and Mexico.Close to 100 per cent of production is consumed domestically.
Export trends and competition• With relatively poor returns in current and potential export markets and
the opportunity to expand domestic consumption, export market devel-opment is identified as a low priority for the Australian Avocado Growers
48 Australian horticulture
AVOCADOS
Australian fresh avocado productionand exports
Production Exports
kt kt
1994-95 15.6 0.271995-96 16.4 0.111996-97 20.1 0.121997-98 23.4 e 0.061998-99 24.7 f 0.09
e Industry estimate. f Industry forecast.
Association over the short to medium term (R. Dalton, Australian AvocadoGrowers Association, personal communication, August 1999).
• With industry focus on domestic consumption, avocado exports havedecreased from 270 tonnes in 1994-95 to just 85 tonnes in 1998-99, worthalmost $245 000.
• The three major export destinations in 1998-99 were Singapore, HongKong and New Zealand, which together accounted for 82 per cent of totalexports.
• Given the negligible export quantities, Australia does not have any marketshare of significance in avocado importing countries.
• The major world producers of avocados are Mexico and the United Stateswhich, in 1998-99, produced an estimated 700 000 tonnes and 140 000tonnes a year respectively (AHC 1999).
• The largest importing country for avocados is France, which accountedfor almost 40 per cent of world imports in 1997 (FAO 1999).
State/regional export contributions• Between 1994-95 and 1998-99 Queensland gradually replaced New South
Wales as the predominant exporting state.
• In 1994-95, when avocado exports were at their highest, New South Walesaccounted for 63 per cent of exports and Queensland 29 per cent.
• However, by 1998-99 export volumes had declined substantially, andQueensland exports accounted for 75 per cent (64 tonnes) of the totalvolume of avocado exports.
Australian support arrangements• New Zealand is the only country that currently has access to the Australian
market.
• Some major quarantine barriers would need to be overcome for fruit fly,before countries such as Mexico and South Africa would be allowed accessto the Australian market (R. Dalton, Australian Avocado Growers Associ-ation, personal communication, August 1999).
49Australian horticulture
AVOCADOS
Market access issues• Given the most recent export markets (in 1998-99) were Singapore, Hong
Kong and New Zealand there were no significant market access barriers,with only New Zealand having fruit fly protocols on imports.
• The industry is not aware of any particular trade issues for avocados, otherthan the problems associated with Queensland fruit fly and the necessaryprotocols for the various markets.
• While exports are not a primary focus at present, the United States(California) is regarded as the most likely market to be targeted in thefuture. Currently, there is a US12 cents a kilogram tariff on avocado exportsto the United States.
• Thailand has been a small market in the past and does not impose quar-antine measures. However, its very high tariff rate of 60 per cent is a largeimpediment to any significant export volumes.
• Chinese Taipei is another potential market identified by the industry.However, while a 28 per cent tariff rate and stringent quarantine require-ments exist, development in this market is unlikely.
Industry assistance in major importing and exportingcountries• No known assistance in other countries.
Technical barriers to trade• There are no known technical barriers to trade.
50 Australian horticulture
AVOCADOS
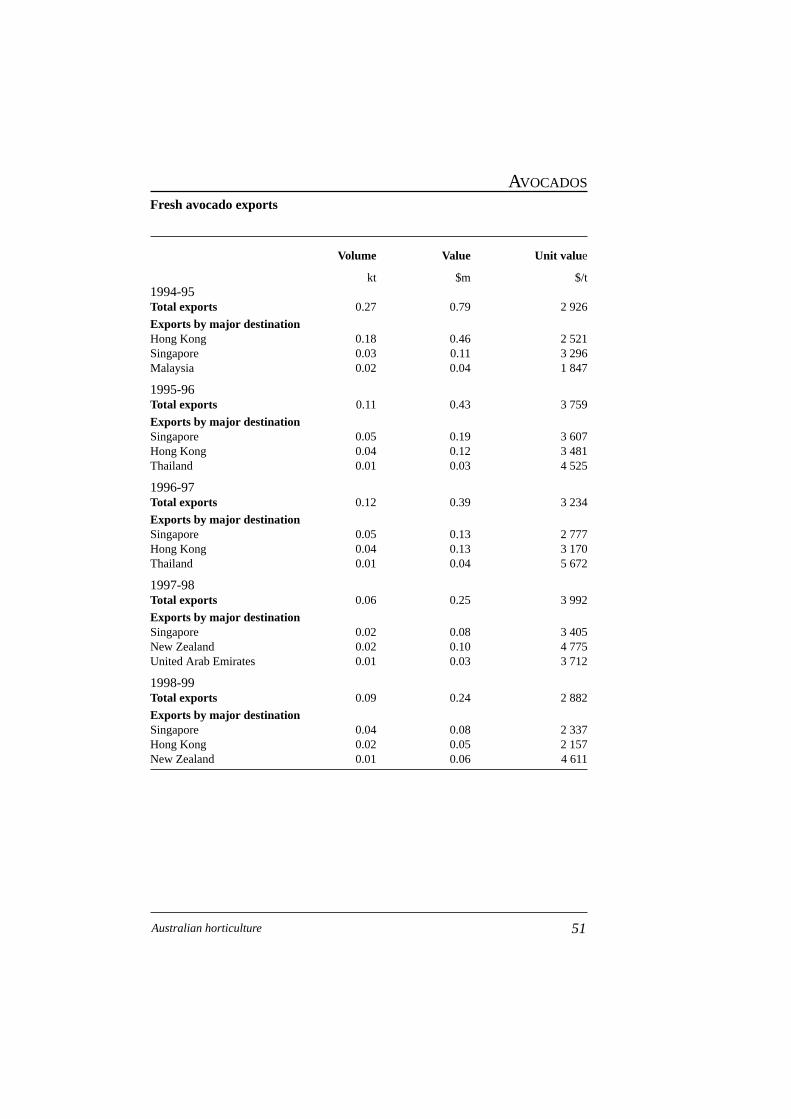
Fresh avocado exports
Volume Value Unit value
kt $m $/t1994-95Total exports 0.27 0.79 2 926
Exports by major destinationHong Kong 0.18 0.46 2 521Singapore 0.03 0.11 3 296Malaysia 0.02 0.04 1 847
1995-96Total exports 0.11 0.43 3 759
Exports by major destinationSingapore 0.05 0.19 3 607Hong Kong 0.04 0.12 3 481Thailand 0.01 0.03 4 525
1996-97Total exports 0.12 0.39 3 234
Exports by major destinationSingapore 0.05 0.13 2 777Hong Kong 0.04 0.13 3 170Thailand 0.01 0.04 5 672
1997-98Total exports 0.06 0.25 3 992
Exports by major destinationSingapore 0.02 0.08 3 405New Zealand 0.02 0.10 4 775United Arab Emirates 0.01 0.03 3 712
1998-99Total exports 0.09 0.24 2 882
Exports by major destinationSingapore 0.04 0.08 2 337Hong Kong 0.02 0.05 2 157New Zealand 0.01 0.06 4 611
51Australian horticulture
AVOCADOS
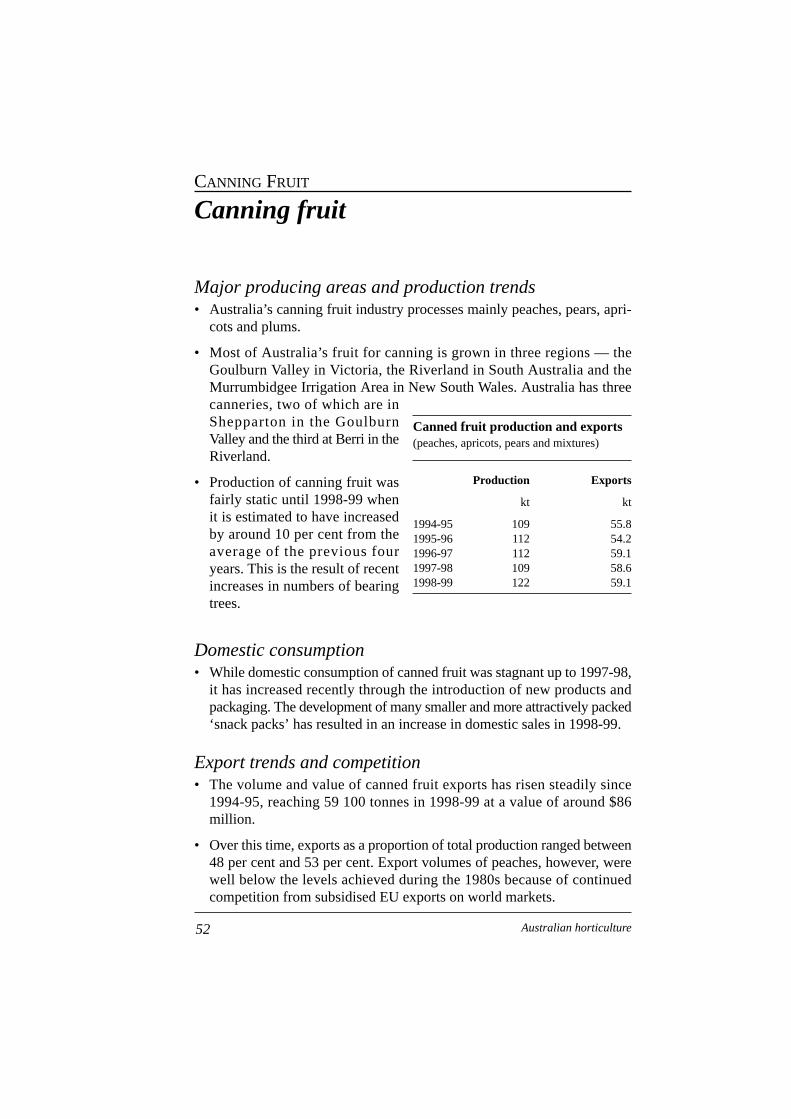
Canning fruit
Major producing areas and production trends• Australia’s canning fruit industry processes mainly peaches, pears, apri-
cots and plums.
• Most of Australia’s fruit for canning is grown in three regions — theGoulburn Valley in Victoria, the Riverland in South Australia and theMurrumbidgee Irrigation Area in New South Wales. Australia has threecanneries, two of which are inShepparton in the GoulburnValley and the third at Berri in theRiverland.
• Production of canning fruit wasfairly static until 1998-99 whenit is estimated to have increasedby around 10 per cent from theaverage of the previous fouryears. This is the result of recentincreases in numbers of bearingtrees.
Domestic consumption• While domestic consumption of canned fruit was stagnant up to 1997-98,
it has increased recently through the introduction of new products andpackaging. The development of many smaller and more attractively packed‘snack packs’ has resulted in an increase in domestic sales in 1998-99.
Export trends and competition• The volume and value of canned fruit exports has risen steadily since
1994-95, reaching 59 100 tonnes in 1998-99 at a value of around $86million.
• Over this time, exports as a proportion of total production ranged between48 per cent and 53 per cent. Export volumes of peaches, however, werewell below the levels achieved during the 1980s because of continuedcompetition from subsidised EU exports on world markets.
52 Australian horticulture
CANNING FRUIT
Canned fruit production and exports (peaches, apricots, pears and mixtures)
Production Exports
kt kt
1994-95 109 55.81995-96 112 54.21996-97 112 59.11997-98 109 58.61998-99 122 59.1
• In the five years to 1998-99, Australia’s major export markets (in termsof volume) for canned fruit were Canada, Japan and the United Kingdom.However, the proportion of total exports to these markets has fallen overthis time, and in 1998-99 they represented just 49 per cent of the volumeand 45 per cent of the value of total Australian exports.
• While Australia’s market share of imports in Canada, Japan and the UnitedKingdom varies by fruit type, Australia holds significant market sharesfor canned pear imports in all three markets (40 per cent in Canada, 45per cent in the European Union and 55 per cent in Japan) (UNCTAD 1999).
• The unit export returns that Australia receives have historically been high-est in Japan, followed by Canada and the United Kingdom.
• The major world suppliers of canned fruits are the United States andEurope (principally Spain and Greece). Other key competitors are SouthAfrica, China, Chile, Argentina, Thailand and Kenya.
State/regional export contributions• Victoria accounts for virtually all of the export volume and value of canned
fruit.
Australian support arrangements• In 1992, Australia imposed a series of antidumping and countervailing
duties for a range of imports including canned peaches from Spain, Greeceand China, and pears from China.
• Following a review in 1996, it was found that the only duty that shouldstill apply was the countervailing duty against the production aid currentlyapplying to imports of canned peaches from Greece.
• This duty has been calculated at A$2.81 per basic carton (24 kilogramsgross) and applies for a period of five years beginning February 1997.
• The current duty is less than the original duty of A$4.38 as the sugar rebatecomponent of the duty was removed.
Market access issues• One of the major trade concerns facing the Australian canned fruits indus-
try is the risk of losing Canadian market share to the United States as a
53Australian horticulture
CANNING FRUIT
result of the North American Free Trade Agreement (NAFTA). Under thisagreement tariffs on canned fruit exports from the United States to Canadawill be phased out.
• The Australian government is pressing for similar treatment under theCanada–Australia Trade Agreement (CANATA), which states that tariffson Australian products to Canada should not exceed those imposed on athird country.
• Tariffs of 19.8 per cent in Europe and 16.2 per cent to 18.5 per cent in theUnited States are well above Australian tariff levels (5 per cent) and area barrier to trade (A. Prater, Canned Fruits Industry Council of Australia,personal communication, September 1999).
Industry assistance in major importing and exportingcountries• Manufacturing subsidies and other benefits that are available to manu-
facturers in the European Union work to the disadvantage of the Australiancanned deciduous fruits industry.
• It is claimed by the Australian industry that various mechanisms are beingused by the European Union to magnify these subsidies and other bene-fits. The Australian industry is calling for the introduction of systemswithin the European Union to eliminate such distortions (A. Prater, CannedFruits Industry Council of Australia, personal communication, September1999).
Technical barriers to trade• There are no known technical barriers to trade.
54 Australian horticulture
CANNING FRUIT
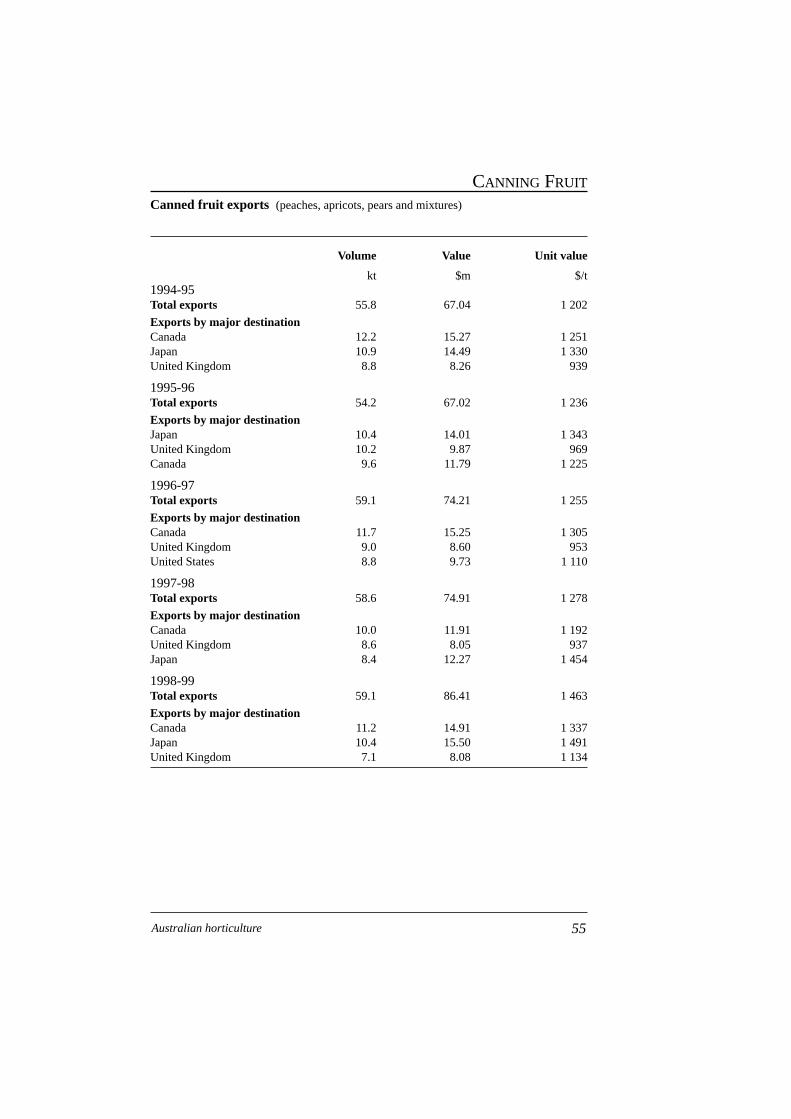
Canned fruit exports (peaches, apricots, pears and mixtures)
Volume Value Unit value
kt $m $/t1994-95Total exports 55.8 67.04 1 202
Exports by major destinationCanada 12.2 15.27 1 251Japan 10.9 14.49 1 330United Kingdom 8.8 8.26 939
1995-96Total exports 54.2 67.02 1 236
Exports by major destinationJapan 10.4 14.01 1 343United Kingdom 10.2 9.87 969Canada 9.6 11.79 1 225
1996-97Total exports 59.1 74.21 1 255
Exports by major destinationCanada 11.7 15.25 1 305United Kingdom 9.0 8.60 953United States 8.8 9.73 1 110
1997-98Total exports 58.6 74.91 1 278
Exports by major destinationCanada 10.0 11.91 1 192United Kingdom 8.6 8.05 937Japan 8.4 12.27 1 454
1998-99Total exports 59.1 86.41 1 463
Exports by major destinationCanada 11.2 14.91 1 337Japan 10.4 15.50 1 491United Kingdom 7.1 8.08 1 134
55Australian horticulture
CANNING FRUIT
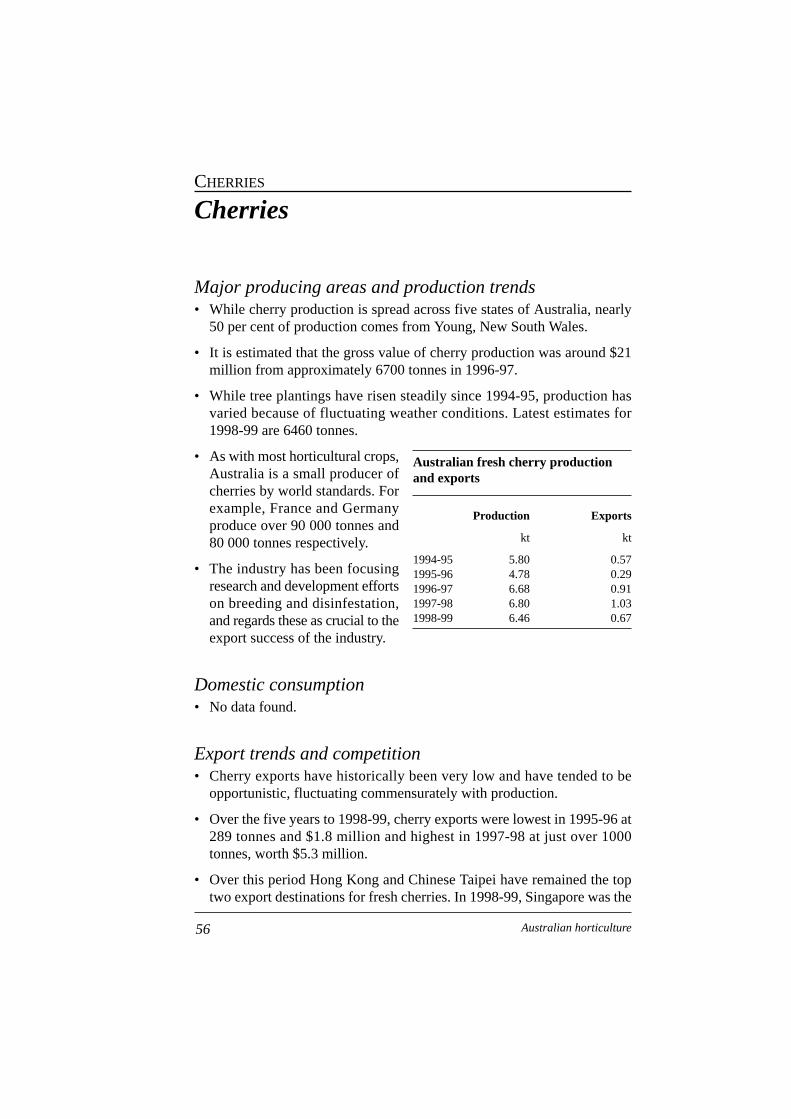
Cherries
Major producing areas and production trends• While cherry production is spread across five states of Australia, nearly
50 per cent of production comes from Young, New South Wales.
• It is estimated that the gross value of cherry production was around $21million from approximately 6700 tonnes in 1996-97.
• While tree plantings have risen steadily since 1994-95, production hasvaried because of fluctuating weather conditions. Latest estimates for1998-99 are 6460 tonnes.
• As with most horticultural crops,Australia is a small producer ofcherries by world standards. Forexample, France and Germanyproduce over 90 000 tonnes and80 000 tonnes respectively.
• The industry has been focusingresearch and development effortson breeding and disinfestation,and regards these as crucial to theexport success of the industry.
Domestic consumption• No data found.
Export trends and competition• Cherry exports have historically been very low and have tended to be
opportunistic, fluctuating commensurately with production.
• Over the five years to 1998-99, cherry exports were lowest in 1995-96 at289 tonnes and $1.8 million and highest in 1997-98 at just over 1000tonnes, worth $5.3 million.
• Over this period Hong Kong and Chinese Taipei have remained the toptwo export destinations for fresh cherries. In 1998-99, Singapore was the
56 Australian horticulture
CHERRIES
Australian fresh cherry productionand exports
Production Exports
kt kt
1994-95 5.80 0.571995-96 4.78 0.291996-97 6.68 0.911997-98 6.80 1.031998-99 6.46 0.67
third largest market, replacing the United Kingdom (1997-98) and Thailand(1994-95 to 1996-97).
• The United States dominates all Australia’s export markets for cherries,with latest figures suggesting it held (by value) around 82 per cent, 92 percent and 73 per cent of the import markets of Hong Kong, Chinese Taipeiand Singapore respectively in 1998 (UNCTAD 1999).
• In comparison, Australia held around 14 per cent, 2 per cent and 20 percent of the Hong Kong, Chinese Taipei and Singapore markets respec-tively (UNCTAD 1999).
• Aside from the United States, Australia’s main competition for Asianmarkets comes from New Zealand and Canada whose market shares aregenerally below those of Australia.
State/regional export contributions• New South Wales has been the predominant cherry exporting state over
the past five years, accounting for 55 per cent of total exports in 1998-99.
• At the same time, exports of cherries from Victoria increased from 14 percent to 22 per cent, while South Australia’s contribution fell from 20 percent to 17 per cent in 1998-99.
• However, export freight costs vary depending on the port of departure,and fruit may be transported interstate for export.
Australian support arrangements• No known domestic support arrangements.
Market access issues• Of the top three export markets for Australian cherries only Chinese Taipei
has an import tariff. This is set at 12 per cent. If Chinese Taipei is success-ful in gaining accession to the WTO, it is likely that its import tariff levelswill be reduced.
• Chinese Taipei also requires very stringent quarantine treatment, involv-ing 14 day in-transit cold treatment of the fruit. This disrupts the timingof the fruit to the market and can result in poor prices to the exporter (I. Hay, CherryHaven, personal communication, October 1999). The un-expected recent introduction of chemical residue testing also caused
57Australian horticulture
CHERRIES
problems for the industry in having to provide evidence that cherry exportsmet the requirements.
• The industry would prefer that the same treatment could be undertakenin Australia under appropriate supervision, thus allowing the fruit to beairfreighted to the market when demand and hence prices were more favor-able.
• Other potential markets could include mainland China and Thailand;however, duty rates of 30 per cent and 60 per cent respectively make thesemarkets unviable.
• Gaining access to the United States market is also proving difficult, as USauthorities claim they have no resources to complete the pest risk analy-sis, and it may be two years before they can (I. Hay, CherryHaven, personalcommunication, October 1999).
• As with other fruits susceptible to fruit fly, there are cherry productionregions that have been recognised domestically as fruit fly free under theInterstate Certified Assurance program.
• The industry argues that these areas should be recognised by overseasmarkets, such as with citrus to the United States, claiming that the fruitwould be cleaner from chemicals and could be exported at less cost, bene-fiting both supplier and buyer (I. Hay, CherryHaven, personal communi-cation, October 1999).
Industry assistance in major importing and exportingcountries• No known industry assistance in other countries.
Technical barriers to trade• There are no known technical barriers to trade.
58 Australian horticulture
CHERRIES

Fresh cherry exports
Volume Value Unit value
t $m $/t1994-95Total exports 574 3.15 5 488
Exports by major destinationHong Kong 252 1.54 6 112Chinese Taipei 141 0.54 3 864Thailand 73 0.37 5 100
1995-96Total exports 289 1.79 6 201
Exports by major destinationHong Kong 98 0.62 6 282Chinese Taipei 63 0.34 5 403Thailand 53 0.30 5 634
1996-97Total exports 906 4.26 4 699
Exports by major destinationHong Kong 364 1.68 4 608Chinese Taipei 239 0.98 4 095Thailand 127 0.78 6 144
1997-98Total exports 1 028 5.25 5 108
Exports by major destinationHong Kong 429 2.20 5 121Chinese Taipei 385 1.61 4 171United Kingdom 64 0.44 6 902
1998-99Total exports 670 4.75 7 085
Exports by major destinationHong Kong 247 1.56 6 317Chinese Taipei 217 1.48 6 814Singapore 76 0.61 7 970
59Australian horticulture
CHERRIES
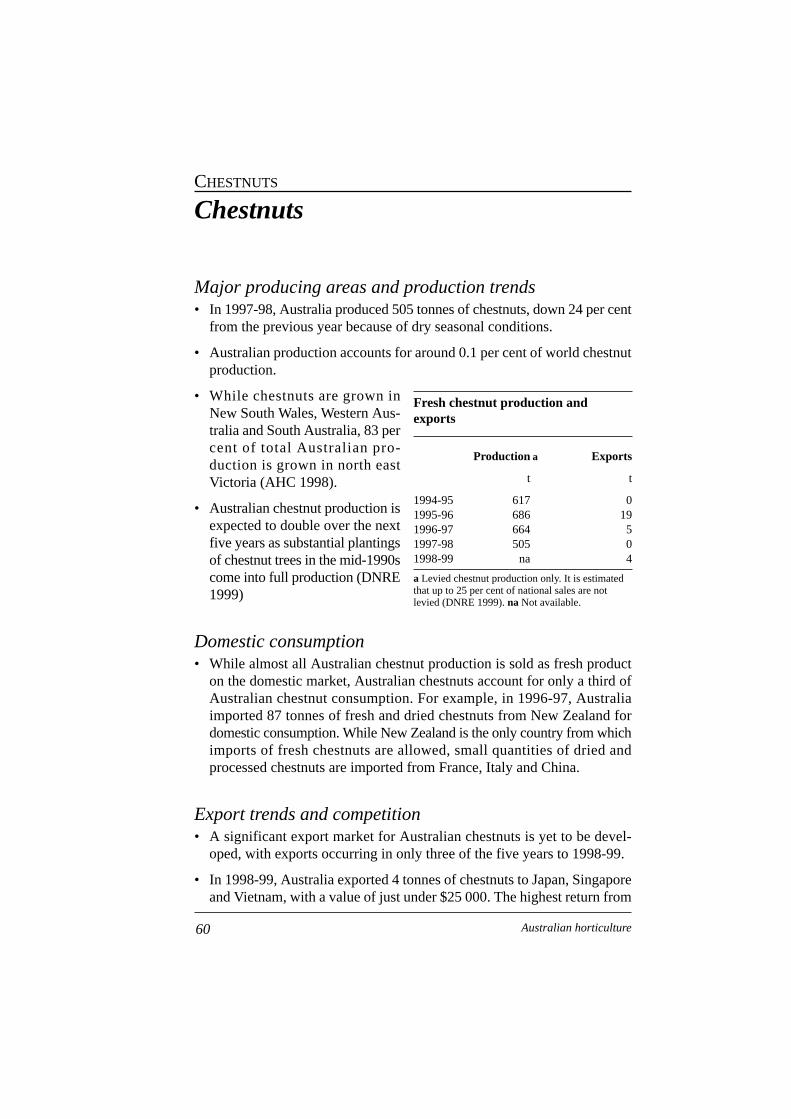
Chestnuts
Major producing areas and production trends• In 1997-98, Australia produced 505 tonnes of chestnuts, down 24 per cent
from the previous year because of dry seasonal conditions.
• Australian production accounts for around 0.1 per cent of world chestnutproduction.
• While chestnuts are grown inNew South Wales, Western Aus-tralia and South Australia, 83 percent of total Australian pro-duction is grown in north eastVictoria (AHC 1998).
• Australian chestnut production isexpected to double over the nextfive years as substantial plantingsof chestnut trees in the mid-1990scome into full production (DNRE1999)
Domestic consumption• While almost all Australian chestnut production is sold as fresh product
on the domestic market, Australian chestnuts account for only a third ofAustralian chestnut consumption. For example, in 1996-97, Australiaimported 87 tonnes of fresh and dried chestnuts from New Zealand fordomestic consumption. While New Zealand is the only country from whichimports of fresh chestnuts are allowed, small quantities of dried andprocessed chestnuts are imported from France, Italy and China.
Export trends and competition• A significant export market for Australian chestnuts is yet to be devel-
oped, with exports occurring in only three of the five years to 1998-99.
• In 1998-99, Australia exported 4 tonnes of chestnuts to Japan, Singaporeand Vietnam, with a value of just under $25 000. The highest return from
60 Australian horticulture
CHESTNUTS
Fresh chestnut production andexports
Production a Exports
t t
1994-95 617 01995-96 686 191996-97 664 51997-98 505 01998-99 na 4
a Levied chestnut production only. It is estimatedthat up to 25 per cent of national sales are notlevied (DNRE 1999). na Not available.
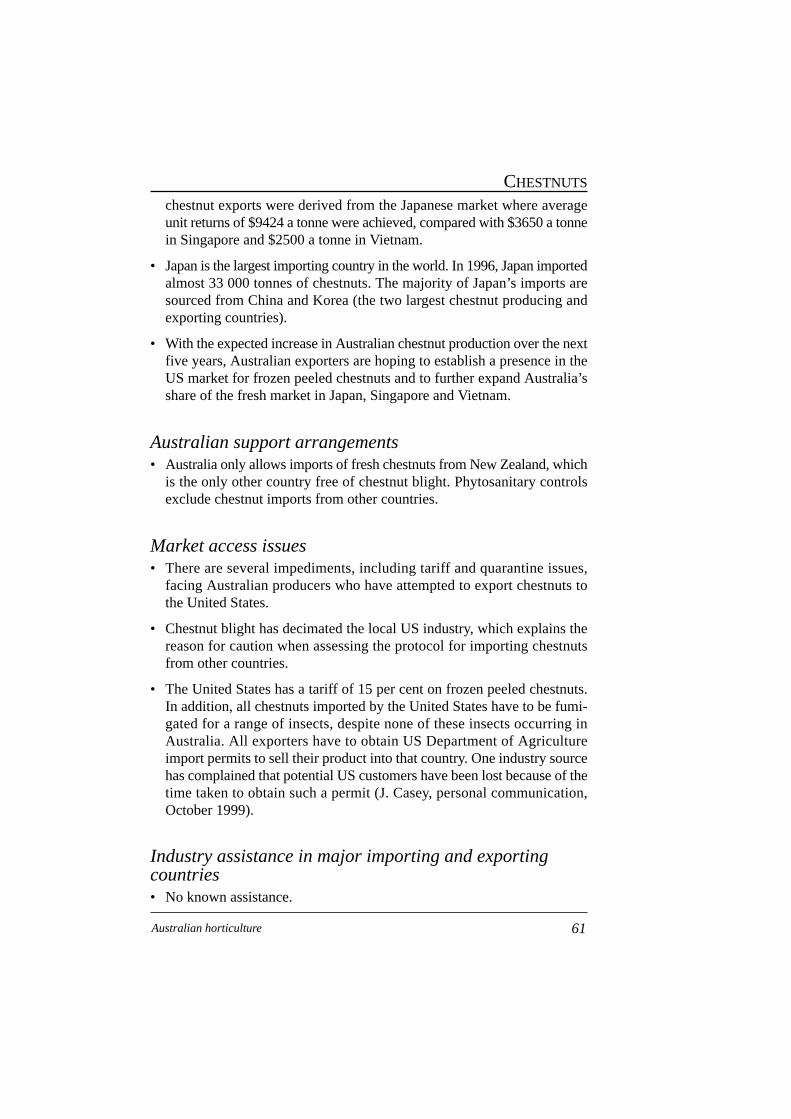
chestnut exports were derived from the Japanese market where averageunit returns of $9424 a tonne were achieved, compared with $3650 a tonnein Singapore and $2500 a tonne in Vietnam.
• Japan is the largest importing country in the world. In 1996, Japan importedalmost 33 000 tonnes of chestnuts. The majority of Japan’s imports aresourced from China and Korea (the two largest chestnut producing andexporting countries).
• With the expected increase in Australian chestnut production over the nextfive years, Australian exporters are hoping to establish a presence in theUS market for frozen peeled chestnuts and to further expand Australia’sshare of the fresh market in Japan, Singapore and Vietnam.
Australian support arrangements• Australia only allows imports of fresh chestnuts from New Zealand, which
is the only other country free of chestnut blight. Phytosanitary controlsexclude chestnut imports from other countries.
Market access issues• There are several impediments, including tariff and quarantine issues,
facing Australian producers who have attempted to export chestnuts tothe United States.
• Chestnut blight has decimated the local US industry, which explains thereason for caution when assessing the protocol for importing chestnutsfrom other countries.
• The United States has a tariff of 15 per cent on frozen peeled chestnuts.In addition, all chestnuts imported by the United States have to be fumi-gated for a range of insects, despite none of these insects occurring inAustralia. All exporters have to obtain US Department of Agricultureimport permits to sell their product into that country. One industry sourcehas complained that potential US customers have been lost because of thetime taken to obtain such a permit (J. Casey, personal communication,October 1999).
Industry assistance in major importing and exportingcountries• No known assistance.
61Australian horticulture
CHESTNUTS
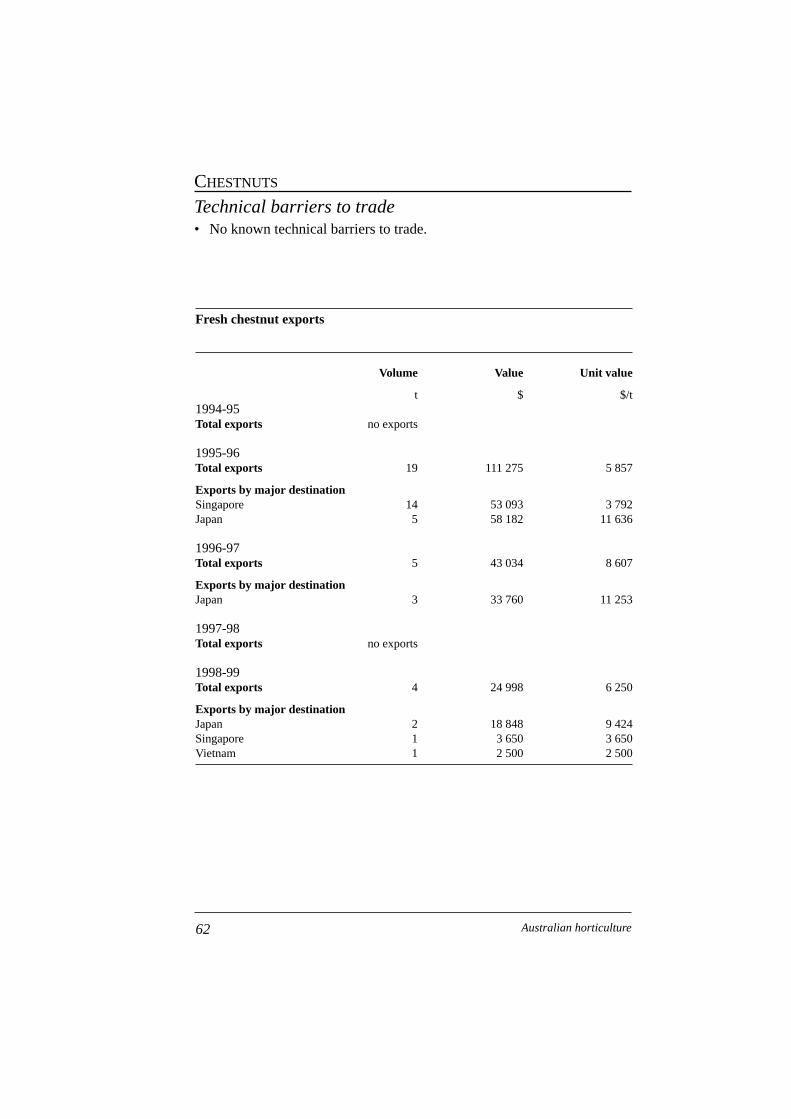
Technical barriers to trade• No known technical barriers to trade.
62 Australian horticulture
CHESTNUTS
Fresh chestnut exports
Volume Value Unit value
t $ $/t1994-95Total exports no exports
1995-96Total exports 19 111 275 5 857
Exports by major destinationSingapore 14 53 093 3 792Japan 5 58 182 11 636
1996-97Total exports 5 43 034 8 607
Exports by major destinationJapan 3 33 760 11 253
1997-98Total exports no exports
1998-99Total exports 4 24 998 6 250
Exports by major destinationJapan 2 18 848 9 424Singapore 1 3 650 3 650Vietnam 1 2 500 2 500
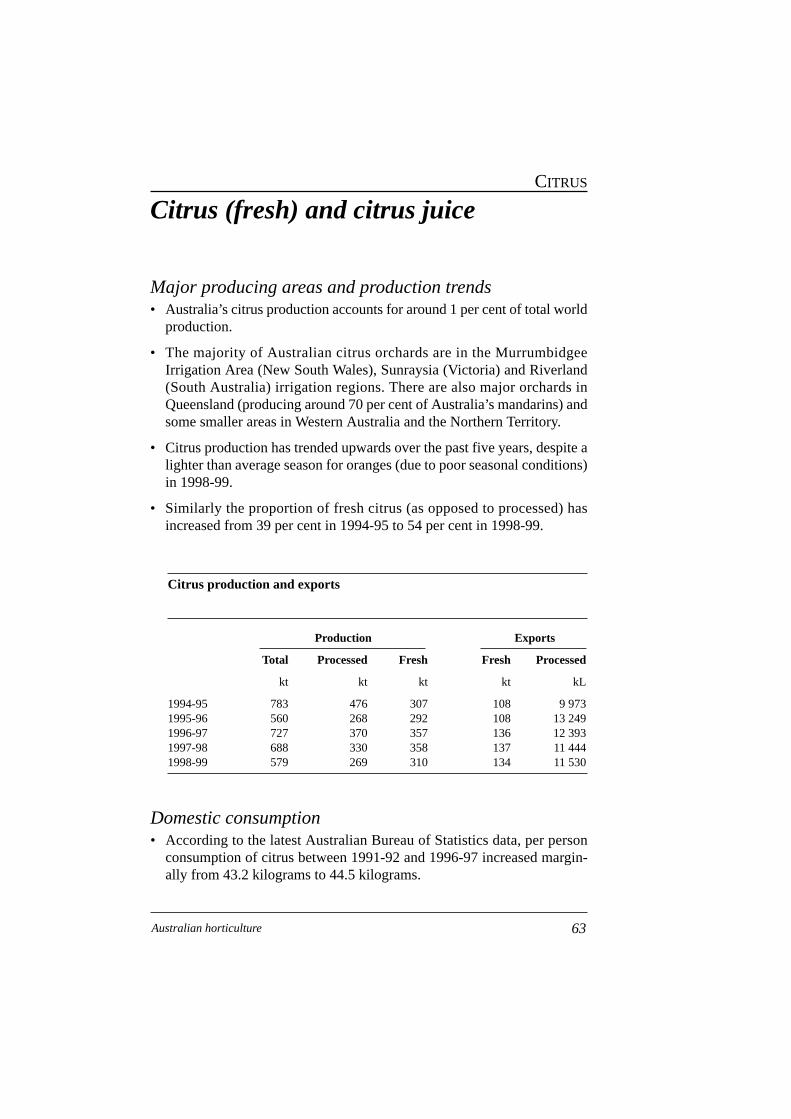
Citrus (fresh) and citrus juice
Major producing areas and production trends• Australia’s citrus production accounts for around 1 per cent of total world
production.
• The majority of Australian citrus orchards are in the MurrumbidgeeIrrigation Area (New South Wales), Sunraysia (Victoria) and Riverland(South Australia) irrigation regions. There are also major orchards inQueensland (producing around 70 per cent of Australia’s mandarins) andsome smaller areas in Western Australia and the Northern Territory.
• Citrus production has trended upwards over the past five years, despite alighter than average season for oranges (due to poor seasonal conditions)in 1998-99.
• Similarly the proportion of fresh citrus (as opposed to processed) hasincreased from 39 per cent in 1994-95 to 54 per cent in 1998-99.
63Australian horticulture
CITRUS
Citrus production and exports
Production Exports
Total Processed Fresh Fresh Processed
kt kt kt kt kL
1994-95 783 476 307 108 9 9731995-96 560 268 292 108 13 2491996-97 727 370 357 136 12 3931997-98 688 330 358 137 11 4441998-99 579 269 310 134 11 530
Domestic consumption• According to the latest Australian Bureau of Statistics data, per person
consumption of citrus between 1991-92 and 1996-97 increased margin-ally from 43.2 kilograms to 44.5 kilograms.
Export trends and competitionFresh citrus• Exports of fresh citrus represent the single highest returning horticultural
commodity, generating close to $150 million (from 134 200 tonnes) in1998-99, an increase of almost $50 million (26 200 tonnes) from 1994-95.
• Despite this, Australian exports of fresh citrus account for around just1 per cent of world exports. The United States and Spain combined accountfor over 40 per cent (FAO 1999).
• The major destination of fresh citrus exports from Australia is the AsiaPacific region, with principal markets being Hong Kong, Singapore, theUnited States, Malaysia, Japan and New Zealand.
• The counterseasonal supply of citrus from Australia provides export oppor-tunities into the United States market.
• Export returns from the United States in 1998-99 were around 42 per centhigher than average export returns to citrus in all markets.
• Over the three years to 1997 Australia achieved a slight increase in marketshare in Malaysia from 42 per cent to 44 per cent. In the same period,orange exports to the United States registered a greater than threefoldincrease and import market share rose from 42 per cent to 49 per cent.
• However, in this time Mexico realised a sixfold increase in orange exportsto the United States, lifting its import market share from 16 per cent to 33per cent.
• While import market share in Japan rose slightly from 3 per cent to 5 percent in the three years to 1997, shares fell in Singapore, from 40 per centto 30 per cent, and Hong Kong, from 7 per cent to 4 per cent.
• European countries such as Germany, France, the Netherlands and theUnited Kingdom are the world’s leading importers of fresh citrus and theindustry is beginning to turn its attention to these markets.
Citrus juice• The processed citrus juice market is dominated by Brazil, which accounts
for around 40 per cent of total world exports (FAO 1999).
• In 1997 it was estimated that around 90 per cent of Australian orange juiceexports were reconstituted Brazilian concentrate (ABARE 1998).
64 Australian horticulture
CITRUS
• Australian exports of citrus juice in 1998-99 were around 11.5 millionlitres, worth almost $15 million, representing around half a per cent ofworld exports.
• While export volumes have increased slightly over the past five yearsexport returns have generally decreased as unit values have fallen byapproximately 24 per cent since 1994-95.
• The major destinations of Australia’s citrus juice exports are New Zealand,Japan and Hong Kong.
State/regional export contributions• In 1998-99, 46 per cent of the volume and 43 per cent of the value of fresh
citrus exports came from South Australia. Negotiations with the UnitedStates that secured entry of fruit from the Sunraysia and the MurrumbidgeeIrrigation Area (from 1996) may result in these areas expanding their shareof fresh exports.
• While the above applies primarily to oranges, the vast majority of man-darins for export are produced in Queensland and do not have access tothe United States.
• In 1998-99 exports of citrus juice originated predominantly from Victoriaand New South Wales, each accounting for around 40 per cent of thevolume and value of juice exports.
Australian support arrangements• Historically, the Australian citrus processing sector received high levels
of assistance in the form of tariffs, import quotas and sales tax exemp-tions and concessions.
• In the past decade these protection measures have been substantiallyreduced and the tariff on imported frozen concentrated orange juice hasdeclined from 35 per cent ad valorem in 1988 to its current level of 5 percent.
• A concessional wholesale sales tax rate of 12 per cent also exists for allfruit based beverages containing at least 25 per cent fruit juice (Australianor imported) that are consumed domestically. The tax rate for products ofless than 25 per cent fruit juice is 21 per cent.
65Australian horticulture
CITRUS
Market access issuesFresh citrus• Hong Kong and Singapore, two of Australia’s largest markets, have no
tariffs on imported fresh citrus.
• Malaysia has a 10 per cent ad valorem tariff on fresh citrus imports.
• The United States has a fixed rate tariff of US2 cents a kilogram fororanges.
• Other important markets include Indonesia, where a tariff of 5 per centapplies, and Japan, where the tariff for oranges ranges from 17.3 per centbetween June and November to 34.7 per cent for the rest of the year.Japan’s tariff on mandarins is 18 per cent all year round.
• Reductions in import duties in Thailand from the current applied rate of48 per cent are being sought by the industry. However, produce enteringthe country unofficially from various sources is also an issue as it limitsofficial trade (B. Curren, Australian Citrus Growers Incorporated, personalcommunication, September 1999).
• The Philippines market also presents some obstacles, including quaran-tine protocols requiring cold disinfestation and requirements for importcertificates, which restrict direct trade. The current applied tariff level forcitrus is 20 per cent.
• Small import quotas (600 tonnes in 1997, 1998 and 1999) and high twotier seasonal tariffs of around 40 per cent and 20 per cent restrict citrusexports (excluding mandarins) to Chinese Taipei. Higher allocations arebeing sought (including provisions for mandarins) pending ChineseTaipei’s accession to the WTO when it is reported that restrictions will belifted (B. Curren, Australian Citrus Growers Incorporated, personal com-munication, October, 1999).
Citrus juice• Japan has an ad valorem tariff on citrus juice imports at applied rates of
between 22.5 per cent to 31.5 per cent or at 24.33 yen a kilogram (whichever is greater), depending on the level of added sugar or by weight ofsucrose.
• There are no import tariffs into New Zealand.
• As with fresh citrus there are no tariffs to product exported to Hong Kong.
66 Australian horticulture
CITRUS
Quarantine• South Korea is seen as a potential market for oranges, lemons and man-
darins but Australia is currently denied access for quarantine reasons. Ahigh tariff quota system is also a potential barrier to the Korean market.In quota tariffs are 50 per cent and out of quota tariffs are bound at 79.4per cent and 152 per cent for mandarins.
• Substantial quarantine barriers are progressively being overcome, partic-ularly in the United States and more recently in Japan.
• Nevertheless, Japan maintains a requirement for cold disinfestation againstfruit flies, including fruit from regions accepted by other importing coun-tries as having area freedom from fruit flies (B. Curren, Australian CitrusGrowers Incorporated, personal communication, October, 1999).
• Japan has recently removed the automatic rejection of ‘fresh style’ citrusjuice that contains black spot mould after the Japanese Ministry of Healthdeclared that it posed no health risk. Australian citrus companies willscreen juice to reduce black particles.
• The United States only accepts citrus imports from fruit fly exclusionzones. Better access is being sought with cold sterilisation as a front linetreatment.
• For Queensland in particular, improved access is being sought to the UnitedStates and New Zealand on the issue of citrus black spot for fresh fruit.
• In April 1999 agreement was reached with Japan on imports of mandarins,subject, however, to cold disinfestation supervised and monitored inAustralia by Japanese Ministry of Agriculture, Forestry and Fisheriesofficers.
• Over the next five years research and development efforts to extend controlor prevent fruit fly infestation as well as varietal improvements will bethe focus of the industry and crucial to gaining and maintaining marketaccess.
Industry assistance in major importing and exportingcountriesSpain• Spain is one of the largest producers and exporters of citrus in the world.
Regional, national and EU government support and assistance have createda large domestic citrus industry.
67Australian horticulture
CITRUS
• Of the various forms of support the following two programs are seen aspotentially trade distorting, and thus contrary to WTO principles:
– rootstock adjustment program ($3000 per hectare subsidy to upgradeto disease tolerant rootstocks), and
– fruit juice industry support (a 75 per cent subsidy which brings the valueof juicing oranges from $50 a tonne to $200 a tonne).
Technical barriers to trade• The most typical trade barriers in Korea are nontariff barriers that com-
monly result from nontransparent regulatory practices. The lack of regu-latory transparency and consistency can affect licensing, inspections, typeapproval, marking/labeling requirements and other standards. Despite theAdministrative Procedures Act of 1996, the government is still inconsis-tent in providing public notice, and announcing minimum comment peri-ods and transitional periods prior to implementation of new regulations(US Department of State 1999).
68 Australian horticulture
CITRUS
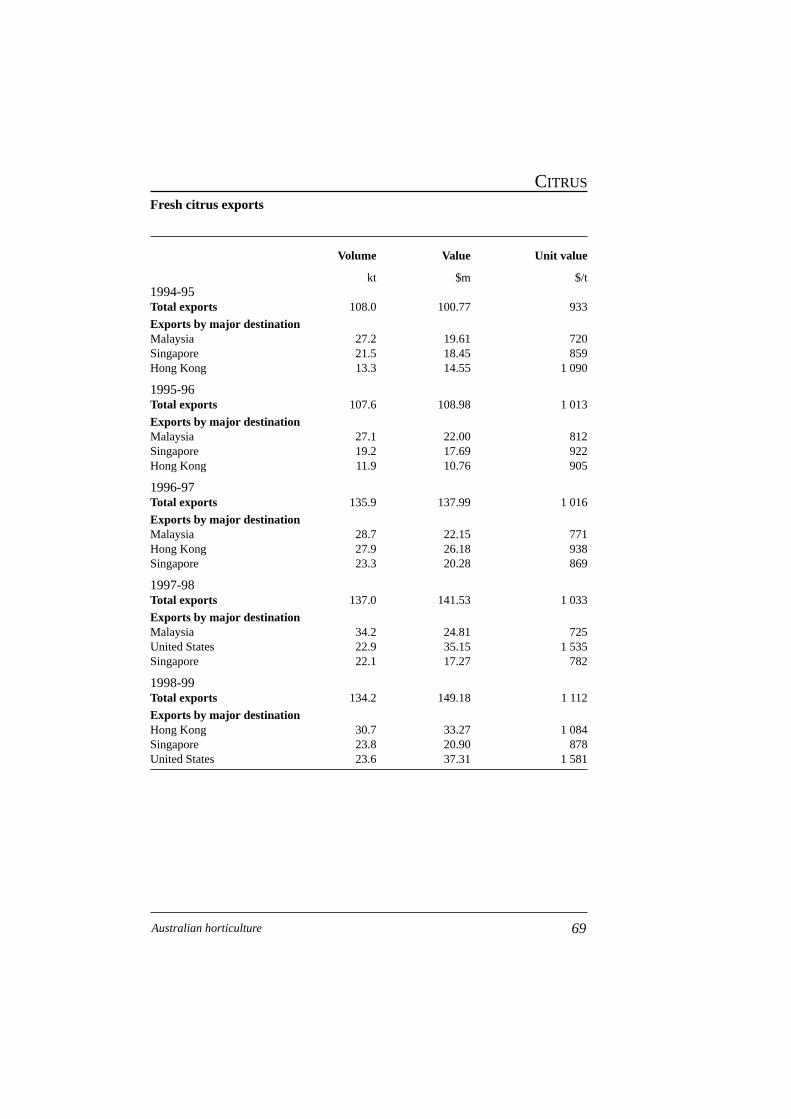
Fresh citrus exports
Volume Value Unit value
kt $m $/t1994-95Total exports 108.0 100.77 933
Exports by major destinationMalaysia 27.2 19.61 720Singapore 21.5 18.45 859Hong Kong 13.3 14.55 1 090
1995-96Total exports 107.6 108.98 1 013
Exports by major destinationMalaysia 27.1 22.00 812Singapore 19.2 17.69 922Hong Kong 11.9 10.76 905
1996-97Total exports 135.9 137.99 1 016
Exports by major destinationMalaysia 28.7 22.15 771Hong Kong 27.9 26.18 938Singapore 23.3 20.28 869
1997-98Total exports 137.0 141.53 1 033
Exports by major destinationMalaysia 34.2 24.81 725United States 22.9 35.15 1 535Singapore 22.1 17.27 782
1998-99Total exports 134.2 149.18 1 112
Exports by major destinationHong Kong 30.7 33.27 1 084Singapore 23.8 20.90 878United States 23.6 37.31 1 581
69Australian horticulture
CITRUS
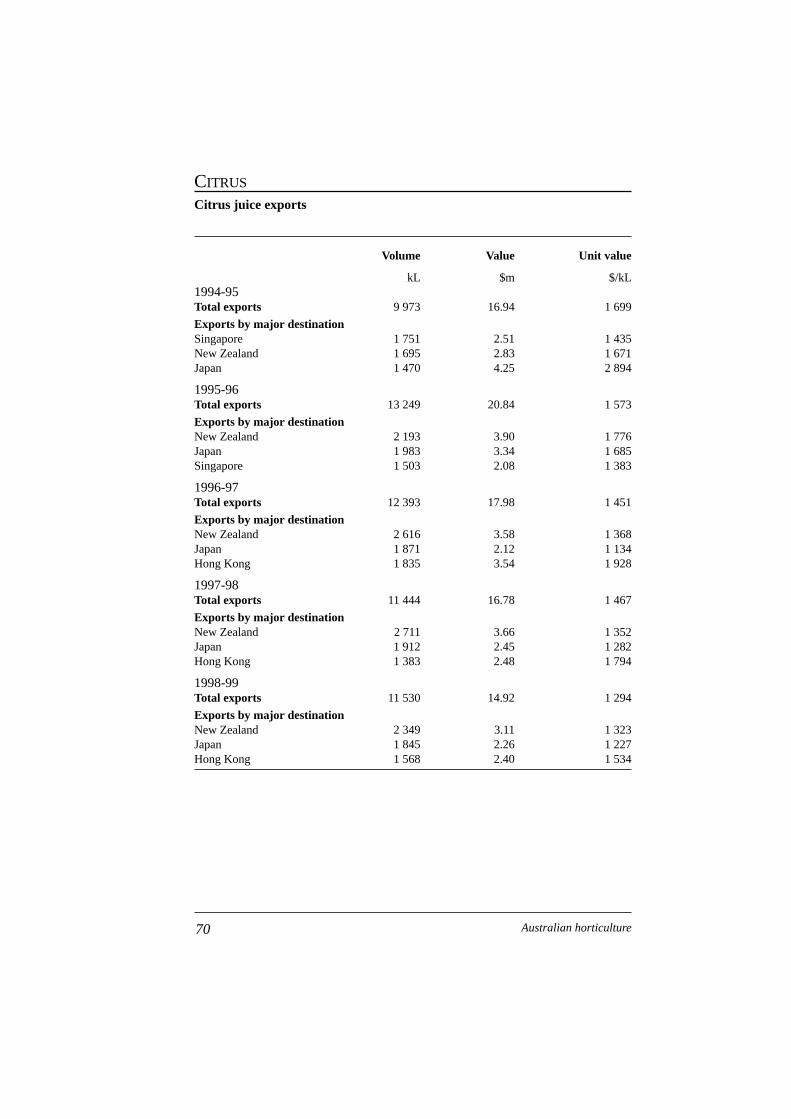
Citrus juice exports
Volume Value Unit value
kL $m $/kL1994-95Total exports 9 973 16.94 1 699
Exports by major destinationSingapore 1 751 2.51 1 435New Zealand 1 695 2.83 1 671Japan 1 470 4.25 2 894
1995-96Total exports 13 249 20.84 1 573
Exports by major destinationNew Zealand 2 193 3.90 1 776Japan 1 983 3.34 1 685Singapore 1 503 2.08 1 383
1996-97Total exports 12 393 17.98 1 451
Exports by major destinationNew Zealand 2 616 3.58 1 368Japan 1 871 2.12 1 134Hong Kong 1 835 3.54 1 928
1997-98Total exports 11 444 16.78 1 467
Exports by major destinationNew Zealand 2 711 3.66 1 352Japan 1 912 2.45 1 282Hong Kong 1 383 2.48 1 794
1998-99Total exports 11 530 14.92 1 294
Exports by major destinationNew Zealand 2 349 3.11 1 323Japan 1 845 2.26 1 227Hong Kong 1 568 2.40 1 534
70 Australian horticulture
CITRUS
Custard apples
Major producing areas and production trends• Australia is a leading commercial custard apple growing country. Pro-
duction is primarily between Alstonville on the New South Wales northcoast to the Atherton Tablelands in northern Queensland. The main produc-tion areas include the Atherton Tablelands, Yeppoon, Bundaberg, theSunshine Coast, and the northern districts of New South Wales.
• While statistics for custard apples are limited, industry estimates putproduction at around 7500 tonnes a year, with a gross value of productionat around $15 million (R. Broadley, Australian Custard Apple Growers,personal communication, October 1999).
• According to industry, there is a potential to double production in the nextfive years following recent large scale increases in planted trees, mainlyin northern New South Wales (R. Broadley, Australian Custard AppleGrowers, personal communication, October 1999).
Domestic consumption• No official data on the domestic consumption of custard apples are avail-
able. However, industry sources suggest that domestic consumption ofcustard apples in Australia is relatively flat and there is a need to concen-trate on the export market, given the expected increases in production (R.Broadley, Australian Custard Apple Growers, personal communication,October 1999).
Export trends and competition• The export supply period of custard apples from Australia is between
March and October.
• Custard apple exports are in the infant stage at present and the AustralianBureau of Statistics does not record exports separately.
• Industry estimates that approximately 225 tonnes of custard apples areexported into Singapore and Hong Kong each year at a value of around$810 000 (R. Broadley, Australian Custard Apple Growers, personalcommunication, October 1999).
71Australian horticulture
CUSTARD APPLES
• As with many other fruits, it is apparent that some of the exports to HongKong are consigned to mainland China. Further development of directaccess to mainland China is being sought (R. Broadley, Australian CustardApple Growers, personal communication, October 1999).
• Other markets that are currently under consideration for export develop-ment are Japan, Malaysia, Canada and Europe.
• While Spain is the other major producer of custard apples, it consumes80 per cent of its production domestically, with the remaining 20 per centfiltering through to other European Union countries.
• Chile also supplies markets in the United States, Japan and Europe butharvests toward the end of the Australian season.
• Australia therefore has a competitive advantage as an out of season pro-ducer, relative to the other supplying countries.
State/regional export contributions• Export custard apples are sourced from the main growing regions of
Yeppoon, the Atherton Tablelands, Bundaberg, the Sunshine Coast andthe northern districts of New South Wales.
Australian support arrangements• No known domestic support arrangements.
Market access issues• For the current established export markets of Singapore and Hong Kong
there are no market access issues. Malaysia, a likely market, also seemsto have fairly open market access.
• As Canada and Europe do not require quarantine procedures for fruit fly,these markets are also relatively open. However, limited availability ofcargo space and limited transport life of custard apples have delayed devel-opment of these markets to date.
• To gain access to Japan, however, accepted procedures for the disinfes-tation of Queensland fruit fly must be established and applications mustbe lodged through official channels.
72 Australian horticulture
CUSTARD APPLES
• Thailand is another market that the industry would consider entering butis deterred from doing so because of tariff rates in excess of 40 per cent.
• Similarly, Saudi Arabia is a potential market but has a tariff of 12 per centfor custard apples. Given that there is no local industry with which im-ported custard apples would compete, there may be grounds for reducingthe tariff.
Industry assistance in major importing and exportingcountries• The industry is not aware of any industry assistance in other countries.
Technical barriers to trade• There are no known technical barriers to trade.
73Australian horticulture
CUSTARD APPLES
Cut flowers
Major producing areas and production trends• The Australian cut flower industry has been estimated to be worth $270
million at the farmgate and around $350 million at the retail level (FECA1999).
• However, total Australian floricultural production accounts for less than1 per cent of the world flower trade, which is estimated to be worth A$33billion (FECA 1999).
• World production of Australian native flowers is estimated at $400 million(wholesale), of which Australian production accounts for around $85million or 21 per cent.
• Production of cut flowers occurs in all states of Australia. Traditionalflowers tend to be grown in Victoria, New South Wales, Queensland andTasmania. Exotic production centres around Queensland and northernAustralia, while native flower production is based in Western Australia.
• The majority of flowers grown for the domestic market are traditionalflower species, the majority of exports consist of Australian natives andSouth African proteaceae.
• While there is no official record of cut flower production over any signif-icant length of time, it is clear from the substantial growth in exports overthe past two decades that production has increased significantly.
Domestic consumption• Australian cut flower consumption per person is low in comparison with
other developed countries. For example, Australian cut flower consump-tion is estimated to be around $20 per person a year. This compares with$100 in Italy, $72 in Japan, $62 in the Netherlands and $36 for the UnitedStates.
• On this basis there is considerable scope for expansion of the domesticmarket through promotion (H. Moody, in Horticulture Australia 1995).
74 Australian horticulture
CUT FLOWERS
Export trends and competition• Exports of cut flowers and foliage have increased substantially since the
early 1980s when they were valued at around $3 million. In 1998-99, 4000tonnes of cut flowers were exported, with a value of $28 million.
• Over 90 per cent of flower exports are natives and exotic proteaceae.
• Japan, the United States and the Netherlands have been the most signifi-cant Australian export markets for some time, representing around 73 percent of total exports in 1998-99. Japan, being the major market, aloneaccounted for over 37 per cent of total exports.
• Australia accounts for around 7 per cent of the value of Japanese cut flowerimports, with the Netherlands, Thailand and New Zealand each account-ing for 25 per cent, 20 per cent and 15 per cent respectively (UNCTADdata 1999).
• Australia’s share of the US import market is only half a per cent. Themajor supplier to the United States is Columbia, accounting for around60 per cent of imports (UNCTAD 1999).
• Australia’s share of the EU market is negligible, while Israel, Kenya andColumbia account for 27 per cent, 20 per cent and 19 per cent respectively(UNCTAD 1999).
• South Africa directly competes with Australian exports of Australiannatives and exotic proteaceae and is improving its varieties, quality andquantity.
State/regional export contributions• State contributions to total cut flower exports have changed slightly in the
five years to 1998-99.
• In 1994-95 Western Australia (54 per cent) and Victoria (24 per cent) werethe major exporting states, by value of exports.
• By 1998-99, Victoria’s contribution had increased to 27 per cent, whileWestern Australia’s share had fallen to 45 per cent. Queensland exportsrose strongly over this time, increasing the state’s share from 8 per centto 16 per cent.
• While total exports from New South Wales are relatively small, it producesthe majority of orchids, which are the highest value export product.
75Australian horticulture
CUT FLOWERS
Australian support arrangements• No known domestic support arrangements.
Market access issues• Although Japan and the United States are Australia’s largest export
markets, access to these two markets is impeded by strict quarantinemeasures and to a lesser extent by tariff protection.
• While tariffs on cut flowers and foliage (under a preferential tax rate) intoJapan are zero, Japan operates a system of zero tolerance for all pests notincluded on its list of nonquarantine organisms.
• Japan is supposed to have adopted an insect determination process thesame as the United States so that only insects found to be risks are pre-vented entry. However, it appears they still maintain the 100 per cent rejec-tion policy (R. Klopper, Flower Export Council of Australia, personalcommunication, September 1999).
• Japan’s list of nonquarantine organisms is incomplete, and does not includemany common insects that are present in Australia and Japan, such asaphids and mites. Japan treats any flowers that have such nonharmfulinsects on them in the same way as if they were infested by harmful organ-isms (European Commission 1999).
• Similarly for the United States, while tariffs at between 4.3 per cent and8.3 per cent are not overly restrictive, the Australian industry is concernedby the stringent approach applying to import inspections on the basis ofquarantine (similar to citrus) (B. Harris, Collina exports, personal commu-nication, September 1999).
• Another problem facing flower exports to the United States is that flow-ers such as boronia and yellowbells that are part of the same family ascitrus (rutaceae), face the same import quarantine protocols as citrus fruitin relation to citrus canker.
• While citrus exports to the United States are allowed under area freedomprovisions, the flowers of the rutaceae family are produced outside thesearea freedom boundaries.
• AQIS state that Australia is free of citrus canker and are seeking recog-nition of country freedom from the United States to expedite the exportof flowers of the rutaceae family (L. Ransom, AQIS, personal communi-cation, September 1999).
76 Australian horticulture
CUT FLOWERS
• Market access issues also exist in Malaysia where dried product is requiredto undergo extreme heat treatment to be allowed entry. However, accord-ing to industry, some of the dried product that Australia exports to theNetherlands is then reshipped to Malaysia without requiring treatment(J. Prior, Flower Export Council of Australia, personal communication,September 1999).
• Import tariffs and preferential treatments toward developing countries arethe main hurdles that face Australian cut flower exports to Europe. WhileAustralian exports encounter import tariffs of between 11.3 per cent and20 per cent, Israel and southern African nations enjoy preferential dutyrates as developing nations. (R. Klopper, Flower Export Council of Aus-tralia, personal communication, September 1999).
• Lengthy quarantine inspection times on fresh flowers in Korea are prohibit-ing significant Australian exports. Inspection should take half a day butin Korea it can take up to eight days (R. Klopper, Flower Export Councilof Australia, personal communication, September 1999).
• Duty rates into countries such as China, Thailand, Indonesia and ChineseTaipei are very high, despite the fact that, for the last two countries inparticular, Australia does not export the same varieties of flowers as theirlocal product (J. Hayler, Exporter, personal communication, September1999).
• There is a two tier duty arrangement for flowers into Switzerland.(R. Klopper, Flower Export Council of Australia, personal communica-tion, September 1999).
Industry assistance in major importing and exportingcountries• The Israeli government heavily subsidises the production and freight of
its cut flowers, which are predominantly Australian natives. This makesit very difficult for Australian exporters to be price competitive in Europeanmarkets (B. Harris, Collina exports, personal communication, September1999).
• Korean flower exports are granted easy access to Japan and receive freightrebates from the Korean government (J. Prior, Flower Export Council ofAustralia, personal communication, September 1999).
77Australian horticulture
CUT FLOWERS
Technical barriers to trade• The most typical trade barriers in Korea are nontariff barriers that com-
monly result from nontransparent regulatory practices. The lack of regu-latory transparency and consistency can affect licensing, inspections, typeapproval, marking/labeling requirements and other standards. Despite theAdministrative Procedures Act of 1996, the government is still inconsis-tent in providing public notice, and announcing minimum comment peri-ods and transitional periods prior to implementation of new regulations(US Department of State 1999).
78 Australian horticulture
CUT FLOWERS
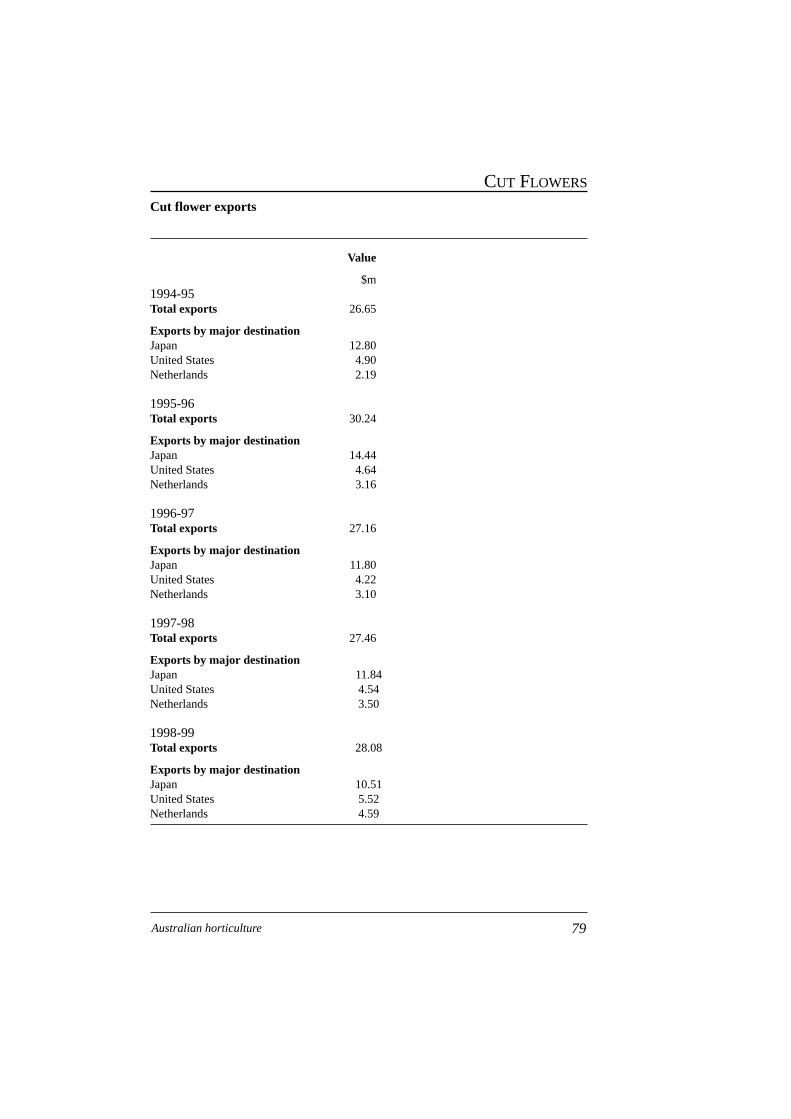
79Australian horticulture
CUT FLOWERS
Cut flower exports
Value
$m1994-95Total exports 26.65
Exports by major destinationJapan 12.80United States 4.90Netherlands 2.19
1995-96Total exports 30.24
Exports by major destinationJapan 14.44United States 4.64Netherlands 3.16
1996-97Total exports 27.16
Exports by major destinationJapan 11.80United States 4.22Netherlands 3.10
1997-98Total exports 27.46
Exports by major destinationJapan 11.84United States 4.54Netherlands 3.50
1998-99Total exports 28.08
Exports by major destinationJapan 10.51United States 5.52Netherlands 4.59
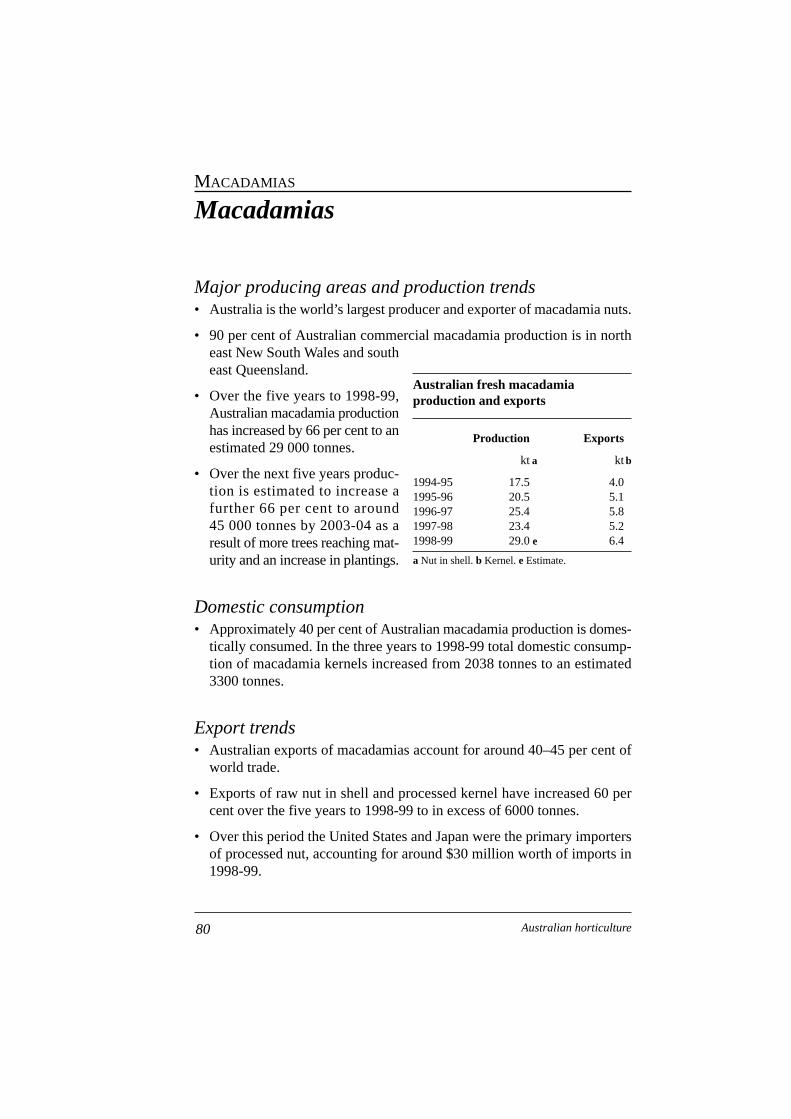
Macadamias
Major producing areas and production trends• Australia is the world’s largest producer and exporter of macadamia nuts.
• 90 per cent of Australian commercial macadamia production is in northeast New South Wales and southeast Queensland.
• Over the five years to 1998-99,Australian macadamia productionhas increased by 66 per cent to anestimated 29 000 tonnes.
• Over the next five years produc-tion is estimated to increase afurther 66 per cent to around45 000 tonnes by 2003-04 as aresult of more trees reaching mat-urity and an increase in plantings.
Domestic consumption• Approximately 40 per cent of Australian macadamia production is domes-
tically consumed. In the three years to 1998-99 total domestic consump-tion of macadamia kernels increased from 2038 tonnes to an estimated3300 tonnes.
Export trends• Australian exports of macadamias account for around 40–45 per cent of
world trade.
• Exports of raw nut in shell and processed kernel have increased 60 percent over the five years to 1998-99 to in excess of 6000 tonnes.
• Over this period the United States and Japan were the primary importersof processed nut, accounting for around $30 million worth of imports in1998-99.
80 Australian horticulture
MACADAMIAS
Australian fresh macadamiaproduction and exports
Production Exports
kt a kt b
1994-95 17.5 4.01995-96 20.5 5.11996-97 25.4 5.81997-98 23.4 5.21998-99 29.0 e 6.4
a Nut in shell. b Kernel. e Estimate.
• Other major importers based on volume over the same period were HongKong and mainland China.
• European countries such as Germany, Belgium and the Netherlands alsocontribute to high export returns and more recently volume sales, throughthe import of processed nut.
• Australia’s market share of imports by the United States and Japan isaround 42 per cent and 50 per cent respectively (1995 figures).
• Australia’s main competitor in Japan is Kenya but its market share de-creased from 46 per cent in 1994 to 36 per cent in 1996.
• Other major competitors are Hawaii, South Africa, Malawi, Guatemalaand Costa Rica.
• World production, and hence exports, are expected to increase dramati-cally over the next five years, as a result of increased plantings in recentyears in major macadamia producing countries.
State/regional export contributions• In 1998-99, New South Wales contributed over 50 per cent of the volume
and value of total exports of macadamias. While Queensland accountedfor over 40 per cent of export volume and value.
Australian support arrangements• No known domestic support arrangements.
Market access issues• Trade in current and potential markets is restricted by tariffs on value
added products.
United States• Current tariffs are applied as follows:
– fresh or dried nut in shell: US1.8c/kg
– fresh or dried kernel: US7c/kg
– prepared or preserved: 23 per cent of cif value.
81Australian horticulture
MACADAMIAS
Europe• Current tariffs are applied as follows:
– nut in shell and kernel: 2 per cent of cif value (all countries except theUnited Kingdom)
– prepared and preserved (Germany): 13.5 per cent of cif value
– chocolate kernel: 9.5 per cent of cif value.
United Kingdom• Current tariffs are applied as follows:
– nut in shell and kernel: duty exempt
– prepared and preserved: 13.9 per cent of cif value
– chocolate kernel: 9.5 per cent of cif value.
India• Potentially a very important market but essentially remains closed through
tariff and nontariff barriers.
• The situation is understood to be as follows:
– nut in shell and kernel: 40 per cent of cif value, plus special additionalduty at 4 per cent (introduced last year)
– prepared and preserved: 40 per cent of cif value plus special additionalduty at 4 per cent
– chocolate kernel: 40 per cent of cif value plus countervailing duty of16 per cent plus special additional duty at 4 per cent of countervailingduty paid.
Mainland China• An emerging nut in shell market, slightly less prohibitive tariff on value
added.
– nut in shell and kernel: 30 per cent of cif value
– prepared and preserved: 30 per cent of cif value
– chocolate kernel: 12 per cent of cif value.
Israel• 25 per cent duty, with a preferential trade agreement with the United States
in place.
82 Australian horticulture
MACADAMIAS
Quarantine• No known unnecessarily restrictive quarantine barriers.
Industry assistance in major importing and exportingcountries• Not known.
Technical barriers to trade• No known technical barriers to trade.
83Australian horticulture
MACADAMIAS
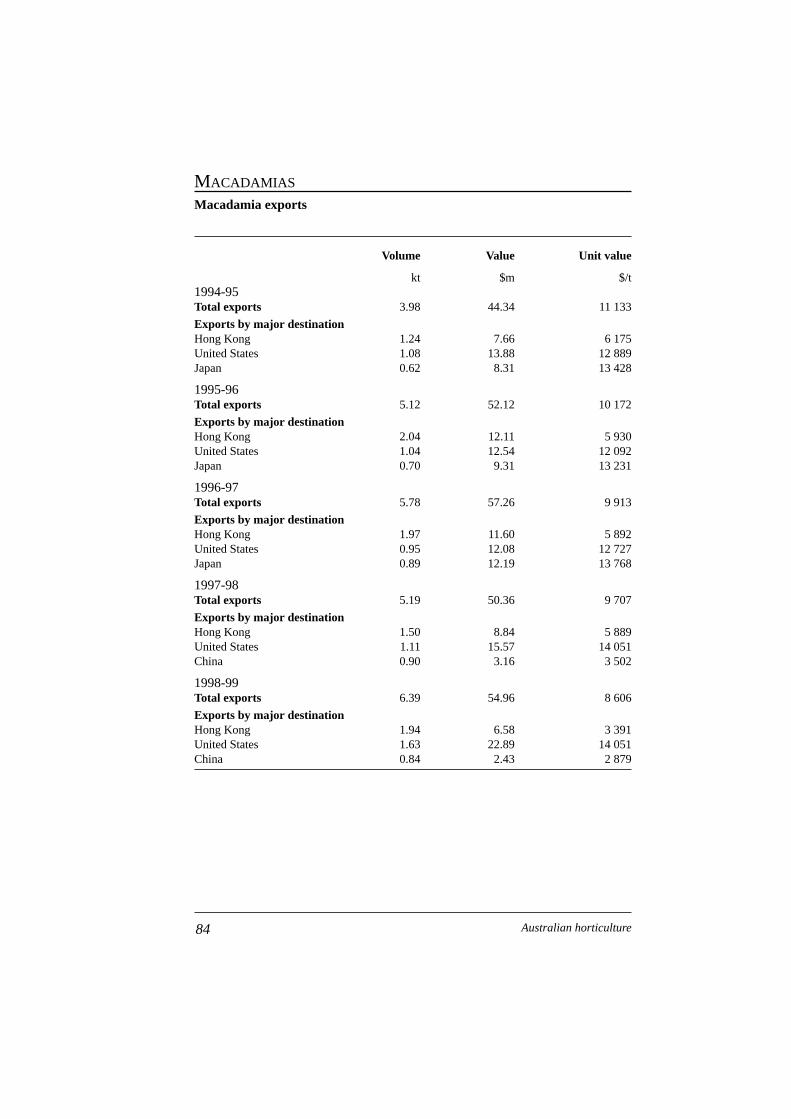
Macadamia exports
Volume Value Unit value
kt $m $/t1994-95Total exports 3.98 44.34 11 133
Exports by major destinationHong Kong 1.24 7.66 6 175United States 1.08 13.88 12 889Japan 0.62 8.31 13 428
1995-96Total exports 5.12 52.12 10 172
Exports by major destinationHong Kong 2.04 12.11 5 930United States 1.04 12.54 12 092Japan 0.70 9.31 13 231
1996-97Total exports 5.78 57.26 9 913
Exports by major destinationHong Kong 1.97 11.60 5 892United States 0.95 12.08 12 727Japan 0.89 12.19 13 768
1997-98Total exports 5.19 50.36 9 707
Exports by major destinationHong Kong 1.50 8.84 5 889United States 1.11 15.57 14 051China 0.90 3.16 3 502
1998-99Total exports 6.39 54.96 8 606
Exports by major destinationHong Kong 1.94 6.58 3 391United States 1.63 22.89 14 051China 0.84 2.43 2 879
84 Australian horticulture
MACADAMIAS
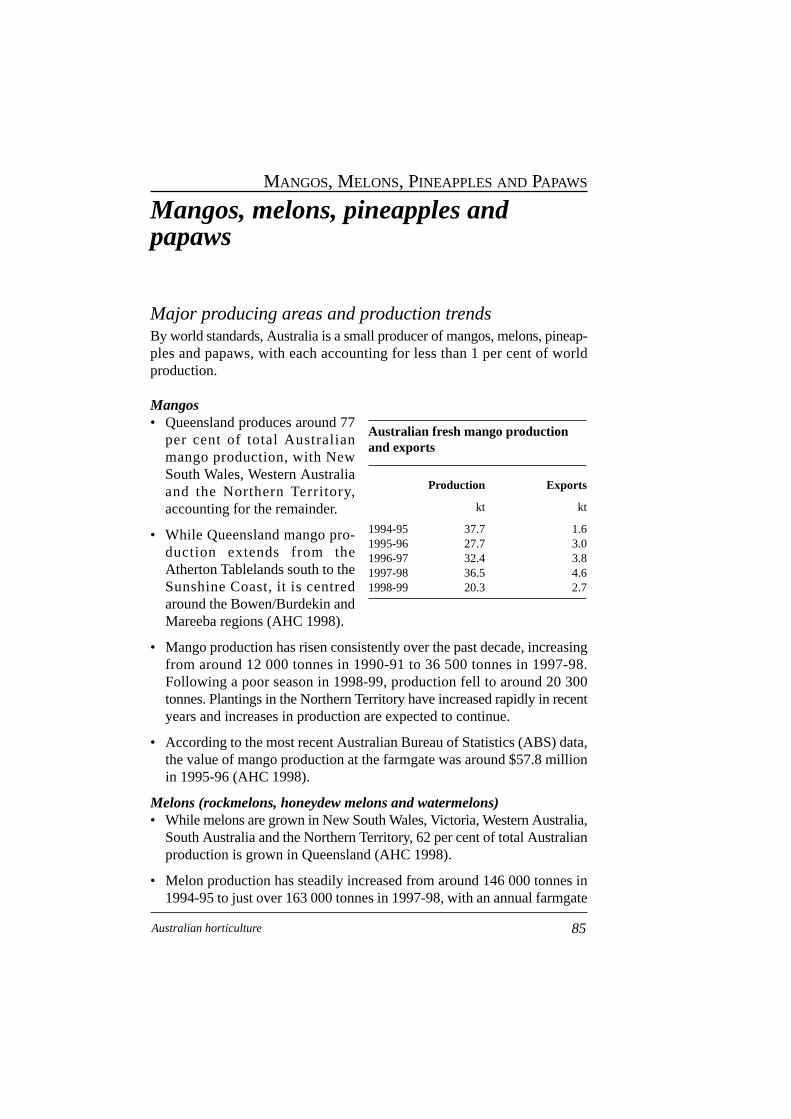
Mangos, melons, pineapples andpapaws
Major producing areas and production trendsBy world standards, Australia is a small producer of mangos, melons, pineap-ples and papaws, with each accounting for less than 1 per cent of worldproduction.
Mangos• Queensland produces around 77
per cent of total Australianmango production, with NewSouth Wales, Western Australiaand the Northern Territory,accounting for the remainder.
• While Queensland mango pro-duction extends from theAtherton Tablelands south to theSunshine Coast, it is centredaround the Bowen/Burdekin andMareeba regions (AHC 1998).
• Mango production has risen consistently over the past decade, increasingfrom around 12 000 tonnes in 1990-91 to 36 500 tonnes in 1997-98.Following a poor season in 1998-99, production fell to around 20 300tonnes. Plantings in the Northern Territory have increased rapidly in recentyears and increases in production are expected to continue.
• According to the most recent Australian Bureau of Statistics (ABS) data,the value of mango production at the farmgate was around $57.8 millionin 1995-96 (AHC 1998).
Melons (rockmelons, honeydew melons and watermelons)• While melons are grown in New South Wales, Victoria, Western Australia,
South Australia and the Northern Territory, 62 per cent of total Australianproduction is grown in Queensland (AHC 1998).
• Melon production has steadily increased from around 146 000 tonnes in1994-95 to just over 163 000 tonnes in 1997-98, with an annual farmgate
85Australian horticulture
MANGOS, MELONS, PINEAPPLES AND PAPAWS
Australian fresh mango productionand exports
Production Exports
kt kt
1994-95 37.7 1.61995-96 27.7 3.01996-97 32.4 3.81997-98 36.5 4.61998-99 20.3 2.7
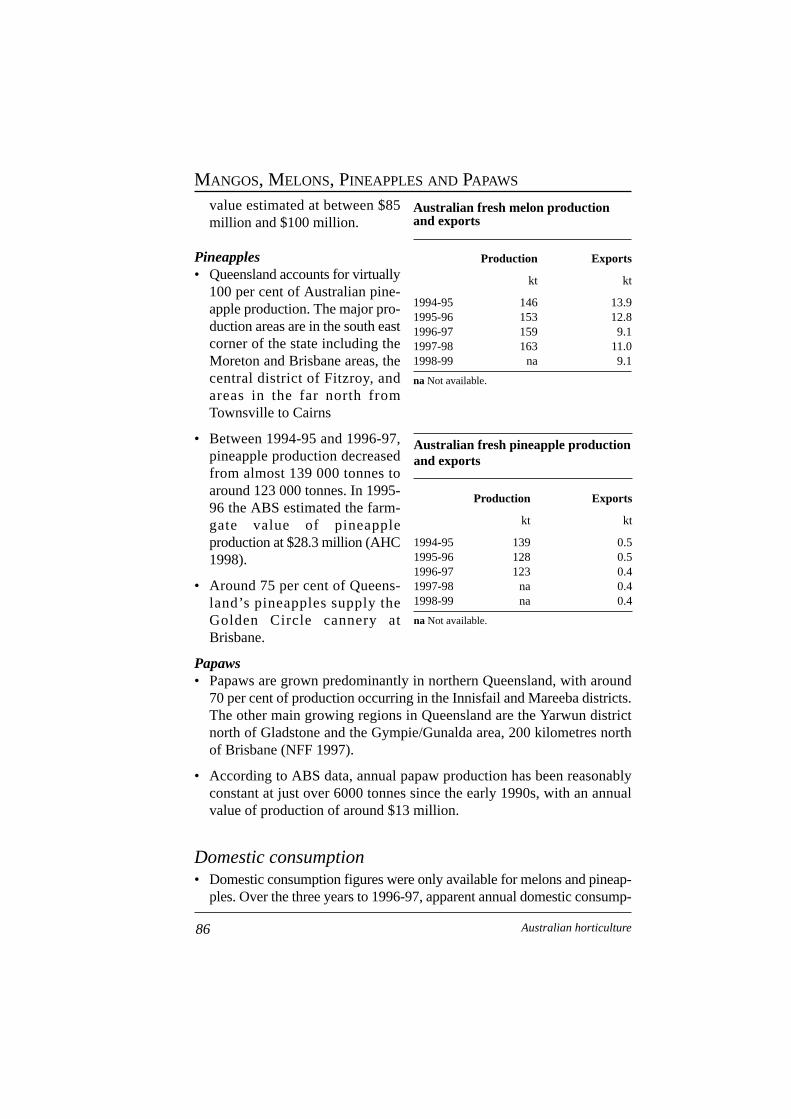
value estimated at between $85million and $100 million.
Pineapples• Queensland accounts for virtually
100 per cent of Australian pine-apple production. The major pro-duction areas are in the south eastcorner of the state including theMoreton and Brisbane areas, thecentral district of Fitzroy, andareas in the far north fromTownsville to Cairns
• Between 1994-95 and 1996-97,pineapple production decreasedfrom almost 139 000 tonnes toaround 123 000 tonnes. In 1995-96 the ABS estimated the farm-gate value of pineappleproduction at $28.3 million (AHC1998).
• Around 75 per cent of Queens-land’s pineapples supply theGolden Circle cannery atBrisbane.
Papaws• Papaws are grown predominantly in northern Queensland, with around
70 per cent of production occurring in the Innisfail and Mareeba districts.The other main growing regions in Queensland are the Yarwun districtnorth of Gladstone and the Gympie/Gunalda area, 200 kilometres northof Brisbane (NFF 1997).
• According to ABS data, annual papaw production has been reasonablyconstant at just over 6000 tonnes since the early 1990s, with an annualvalue of production of around $13 million.
Domestic consumption• Domestic consumption figures were only available for melons and pineap-
ples. Over the three years to 1996-97, apparent annual domestic consump-
86 Australian horticulture
MANGOS, MELONS, PINEAPPLES AND PAPAWS
Australian fresh pineapple productionand exports
Production Exports
kt kt
1994-95 139 0.51995-96 128 0.51996-97 123 0.41997-98 na 0.41998-99 na 0.4
na Not available.
Australian fresh melon productionand exports
Production Exports
kt kt
1994-95 146 13.91995-96 153 12.81996-97 159 9.11997-98 163 11.01998-99 na 9.1
na Not available.
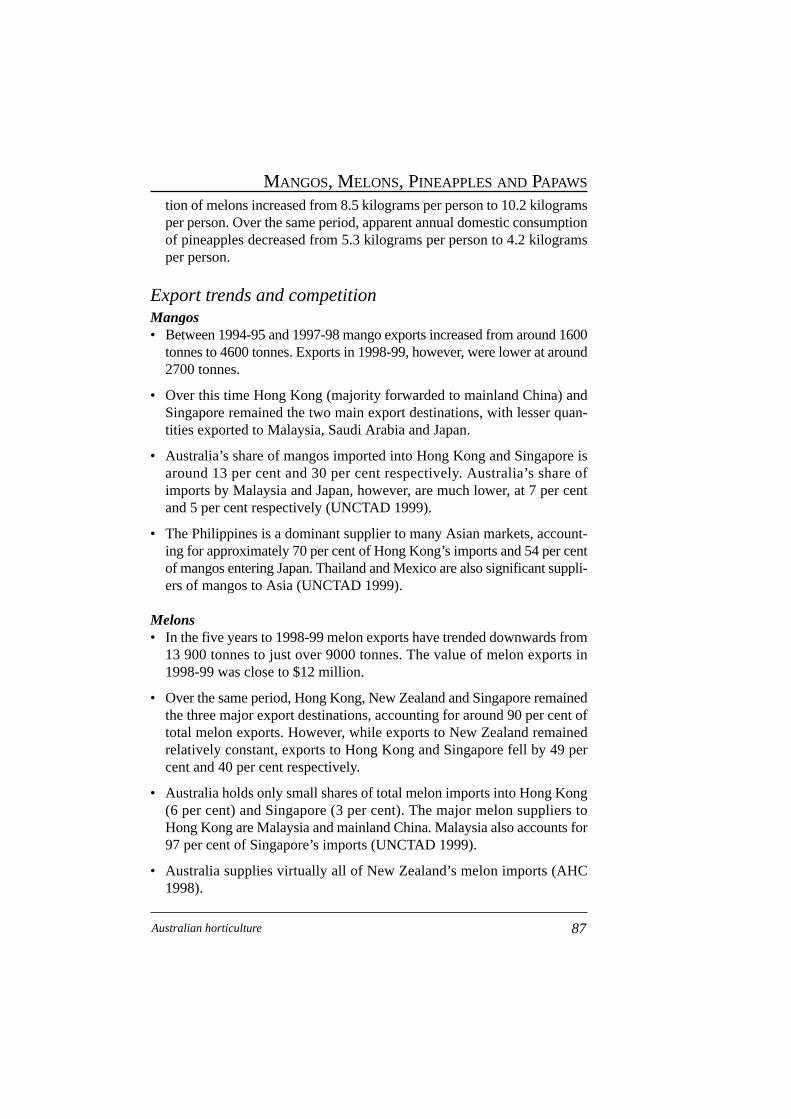
tion of melons increased from 8.5 kilograms per person to 10.2 kilogramsper person. Over the same period, apparent annual domestic consumptionof pineapples decreased from 5.3 kilograms per person to 4.2 kilogramsper person.
Export trends and competitionMangos• Between 1994-95 and 1997-98 mango exports increased from around 1600
tonnes to 4600 tonnes. Exports in 1998-99, however, were lower at around2700 tonnes.
• Over this time Hong Kong (majority forwarded to mainland China) andSingapore remained the two main export destinations, with lesser quan-tities exported to Malaysia, Saudi Arabia and Japan.
• Australia’s share of mangos imported into Hong Kong and Singapore isaround 13 per cent and 30 per cent respectively. Australia’s share ofimports by Malaysia and Japan, however, are much lower, at 7 per centand 5 per cent respectively (UNCTAD 1999).
• The Philippines is a dominant supplier to many Asian markets, account-ing for approximately 70 per cent of Hong Kong’s imports and 54 per centof mangos entering Japan. Thailand and Mexico are also significant suppli-ers of mangos to Asia (UNCTAD 1999).
Melons• In the five years to 1998-99 melon exports have trended downwards from
13 900 tonnes to just over 9000 tonnes. The value of melon exports in1998-99 was close to $12 million.
• Over the same period, Hong Kong, New Zealand and Singapore remainedthe three major export destinations, accounting for around 90 per cent oftotal melon exports. However, while exports to New Zealand remainedrelatively constant, exports to Hong Kong and Singapore fell by 49 percent and 40 per cent respectively.
• Australia holds only small shares of total melon imports into Hong Kong(6 per cent) and Singapore (3 per cent). The major melon suppliers toHong Kong are Malaysia and mainland China. Malaysia also accounts for97 per cent of Singapore’s imports (UNCTAD 1999).
• Australia supplies virtually all of New Zealand’s melon imports (AHC1998).
87Australian horticulture
MANGOS, MELONS, PINEAPPLES AND PAPAWS
• Markets are also growing for melons into the Middle East (M. Milgate,QFVG, personal communication, October 1999).
Pineapples• Australian pineapple exports are very minor totaling 420 tonnes, with a
value of around $400 000 in 1998-99. In the past three years, 100 per centof exports have gone to New Zealand.
• Australia supplies about 22 per cent of New Zealand’s total pineappleimports, the major supplier being the Philippines with a 64 per cent share(UNCTAD 1999).
Papaws• Exports of papaws from Australia are negligible, amounting to just 10
tonnes (exported to the Middle East) in 1998-99.
State/regional export contributions• The majority of fruit covered in this profile is grown in, and exported
from, Queensland.
Australian support arrangements• No known domestic support arrangements.
Market access issues• The major market access issue for Australian mangos and melons relates
to Queensland fruit fly status and disinfestation techniques.
• Market access for mangos to Japan has improved with the recent decisionby Japanese quarantine authorities to lift import restrictions on the varietiesKeitt, Palmer, R2E2 and Kent.
• The mango industry is currently seeking access to China, with a pest anddisease list forwarded to the Chinese authorities for evaluation.
• Currently, the Australian mango and melon industry is looking at alter-native quarantine treatments including a low cost heat treatment whichwill help facilitate access to export markets (P. Pearce, QFVG, personalcommunications, October 1999).
88 Australian horticulture
MANGOS, MELONS, PINEAPPLES AND PAPAWS
• While Australian exports of rockmelons to New Zealand are not restricted,honeydew melons have only interim access. There have been several inci-dences in the past two years where Australian access of this variety hasbeen closed for a short period of time over concerns about fruit fly larvalinfestation (P. Pearce, QFVG, personal communications, October 1999).
• Australia papaw producers are currently unable to gain access to NewZealand because of concerns about Australia’s current chemical disin-festation procedure for oriental scale and fruit fly. New Zealand protocolrequires hot air treatment, rather than chemical treatment (D. Walker,QFVG subcommittee, personal communications, October 1999).
Industry assistance in major importing and exportingcountries• No known assistance for overseas exporters.
Technical barriers to trade• There are no known technical barriers to trade.
89Australian horticulture
MANGOS, MELONS, PINEAPPLES AND PAPAWS
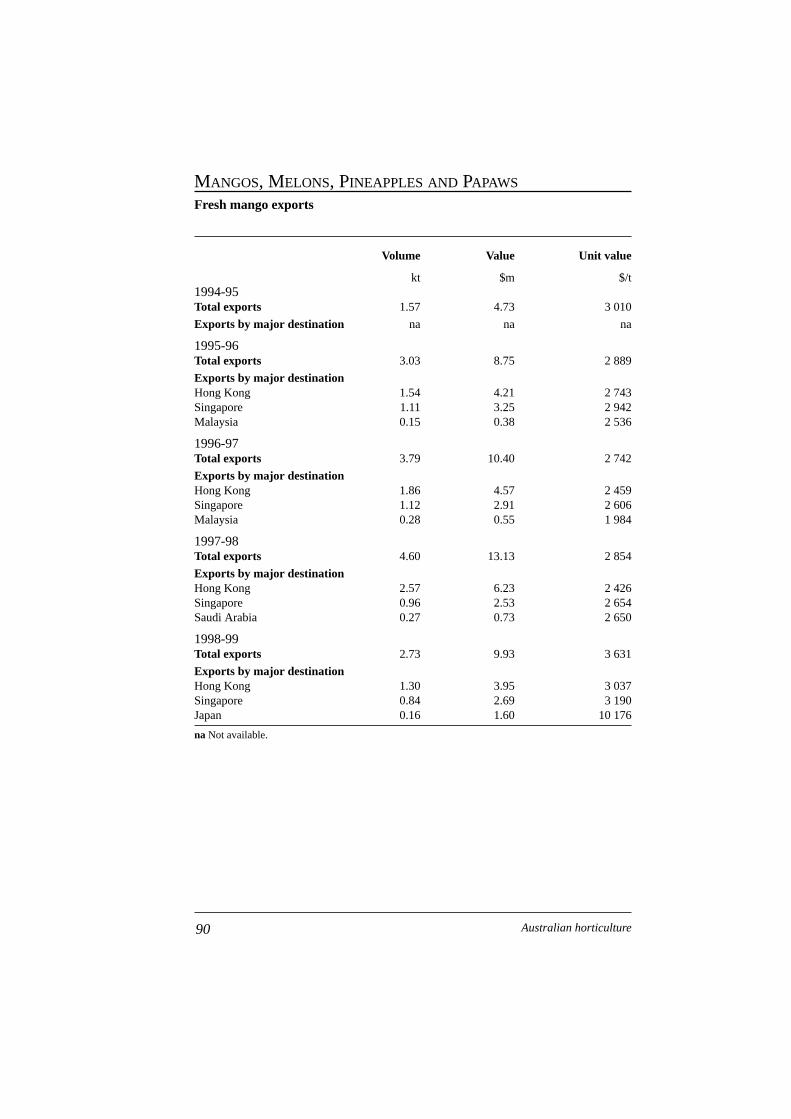
Fresh mango exports
Volume Value Unit value
kt $m $/t1994-95Total exports 1.57 4.73 3 010
Exports by major destination na na na
1995-96Total exports 3.03 8.75 2 889
Exports by major destinationHong Kong 1.54 4.21 2 743Singapore 1.11 3.25 2 942Malaysia 0.15 0.38 2 536
1996-97Total exports 3.79 10.40 2 742
Exports by major destinationHong Kong 1.86 4.57 2 459Singapore 1.12 2.91 2 606Malaysia 0.28 0.55 1 984
1997-98Total exports 4.60 13.13 2 854
Exports by major destinationHong Kong 2.57 6.23 2 426Singapore 0.96 2.53 2 654Saudi Arabia 0.27 0.73 2 650
1998-99Total exports 2.73 9.93 3 631
Exports by major destinationHong Kong 1.30 3.95 3 037Singapore 0.84 2.69 3 190Japan 0.16 1.60 10 176
na Not available.
90 Australian horticulture
MANGOS, MELONS, PINEAPPLES AND PAPAWS
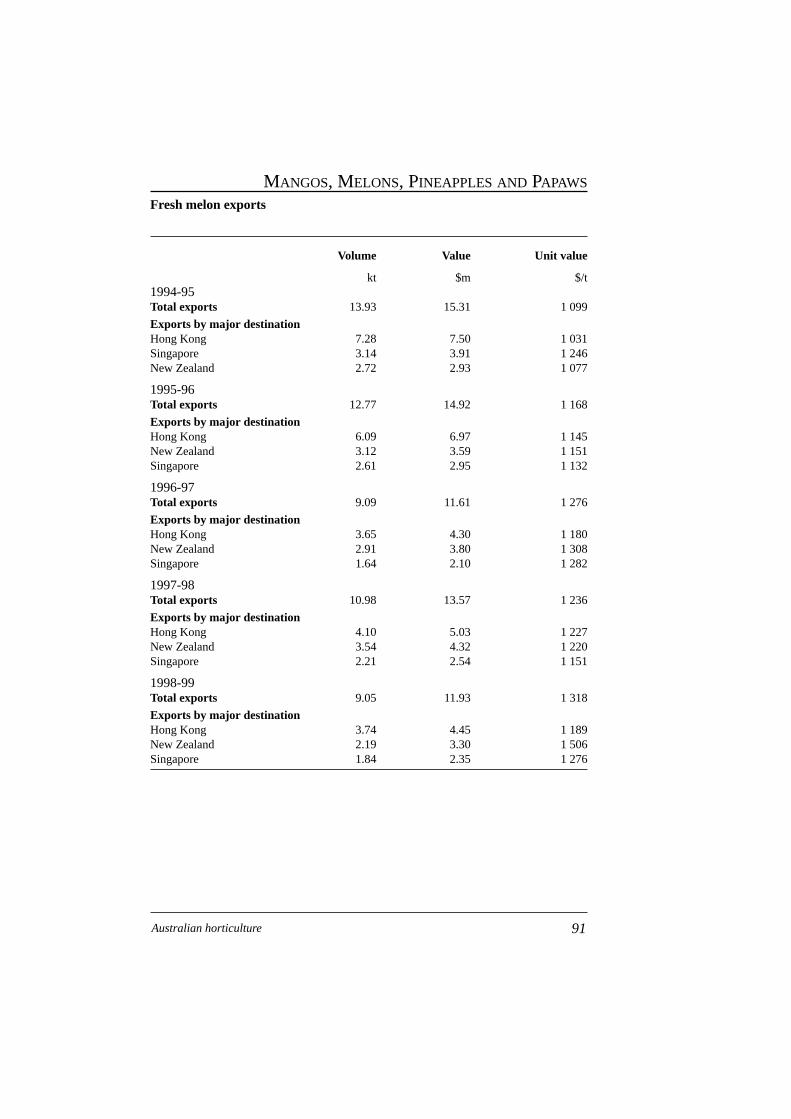
Fresh melon exports
Volume Value Unit value
kt $m $/t1994-95Total exports 13.93 15.31 1 099
Exports by major destinationHong Kong 7.28 7.50 1 031Singapore 3.14 3.91 1 246New Zealand 2.72 2.93 1 077
1995-96Total exports 12.77 14.92 1 168
Exports by major destinationHong Kong 6.09 6.97 1 145New Zealand 3.12 3.59 1 151Singapore 2.61 2.95 1 132
1996-97Total exports 9.09 11.61 1 276
Exports by major destinationHong Kong 3.65 4.30 1 180New Zealand 2.91 3.80 1 308Singapore 1.64 2.10 1 282
1997-98Total exports 10.98 13.57 1 236
Exports by major destinationHong Kong 4.10 5.03 1 227New Zealand 3.54 4.32 1 220Singapore 2.21 2.54 1 151
1998-99Total exports 9.05 11.93 1 318
Exports by major destinationHong Kong 3.74 4.45 1 189New Zealand 2.19 3.30 1 506Singapore 1.84 2.35 1 276
91Australian horticulture
MANGOS, MELONS, PINEAPPLES AND PAPAWS
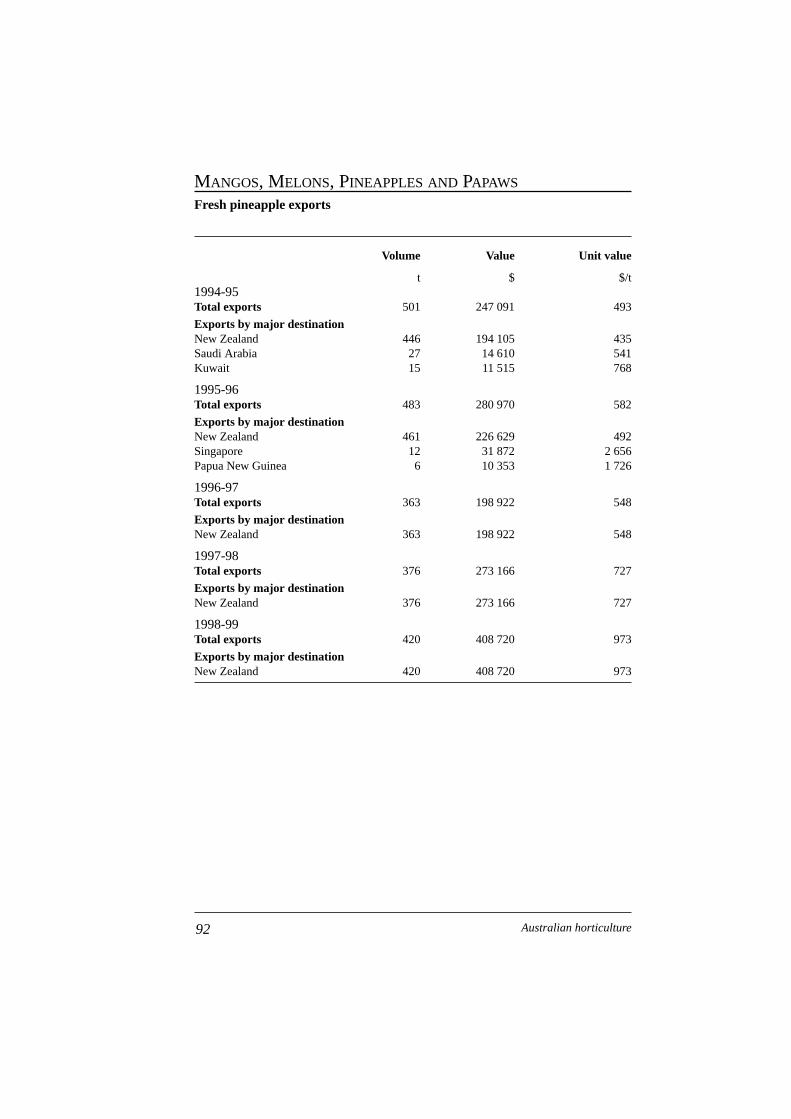
Fresh pineapple exports
Volume Value Unit value
t $ $/t1994-95Total exports 501 247 091 493
Exports by major destinationNew Zealand 446 194 105 435Saudi Arabia 27 14 610 541Kuwait 15 11 515 768
1995-96Total exports 483 280 970 582
Exports by major destinationNew Zealand 461 226 629 492Singapore 12 31 872 2 656Papua New Guinea 6 10 353 1 726
1996-97Total exports 363 198 922 548
Exports by major destinationNew Zealand 363 198 922 548
1997-98Total exports 376 273 166 727
Exports by major destinationNew Zealand 376 273 166 727
1998-99Total exports 420 408 720 973
Exports by major destinationNew Zealand 420 408 720 973
92 Australian horticulture
MANGOS, MELONS, PINEAPPLES AND PAPAWS
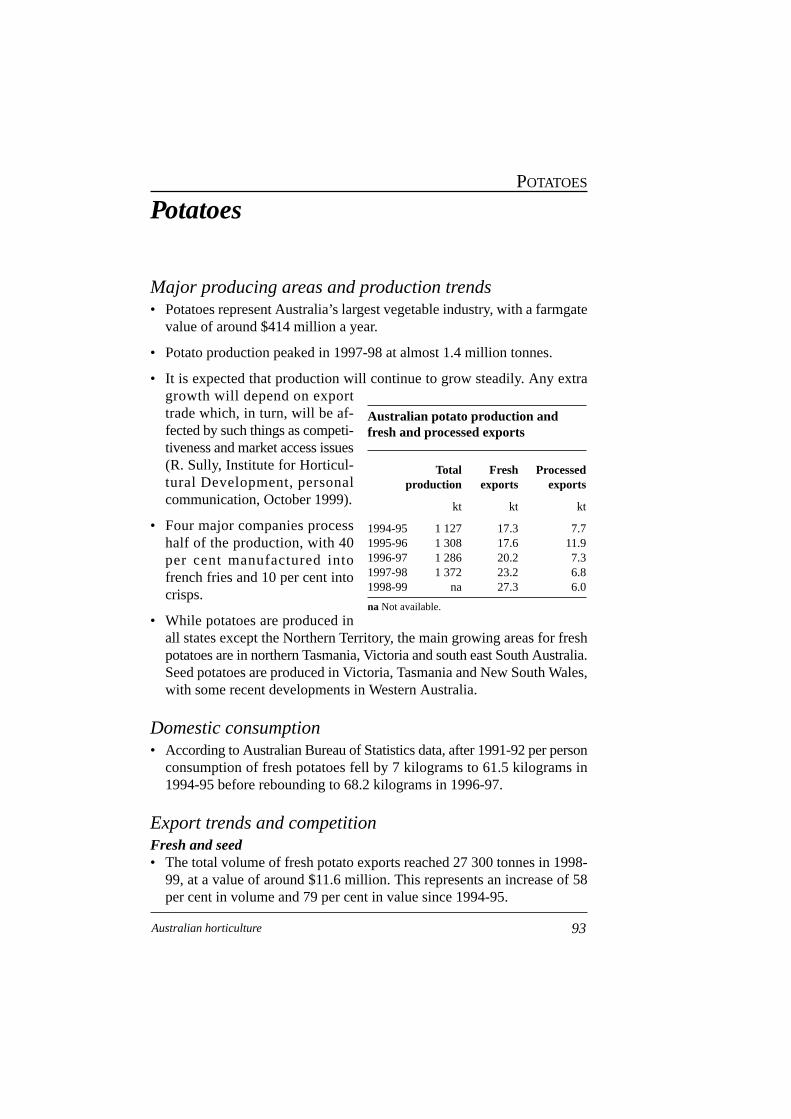
Potatoes
Major producing areas and production trends• Potatoes represent Australia’s largest vegetable industry, with a farmgate
value of around $414 million a year.
• Potato production peaked in 1997-98 at almost 1.4 million tonnes.
• It is expected that production will continue to grow steadily. Any extragrowth will depend on exporttrade which, in turn, will be af-fected by such things as competi-tiveness and market access issues(R. Sully, Institute for Horticul-tural Development, personalcommunication, October 1999).
• Four major companies processhalf of the production, with 40per cent manufactured intofrench fries and 10 per cent intocrisps.
• While potatoes are produced inall states except the Northern Territory, the main growing areas for freshpotatoes are in northern Tasmania, Victoria and south east South Australia.Seed potatoes are produced in Victoria, Tasmania and New South Wales,with some recent developments in Western Australia.
Domestic consumption• According to Australian Bureau of Statistics data, after 1991-92 per person
consumption of fresh potatoes fell by 7 kilograms to 61.5 kilograms in1994-95 before rebounding to 68.2 kilograms in 1996-97.
Export trends and competitionFresh and seed• The total volume of fresh potato exports reached 27 300 tonnes in 1998-
99, at a value of around $11.6 million. This represents an increase of 58per cent in volume and 79 per cent in value since 1994-95.
93Australian horticulture
POTATOES
Australian potato production andfresh and processed exports
Total Fresh Processedproduction exports exports
kt kt kt
1994-95 1 127 17.3 7.71995-96 1 308 17.6 11.91996-97 1 286 20.2 7.31997-98 1 372 23.2 6.81998-99 na 27.3 6.0
na Not available.
• While exports of fresh potatoes have increased, they still represent onlyaround 3 per cent of production for the fresh market.
• In the five years to 1998-99, the major export markets (in terms of volume)for potatoes were Korea, Malaysia and Singapore. However, these marketsaccounted for just 57 per cent of the volume and 53 per cent of the valueof total potato exports. While not within the top three, Mauritius is also asignificant export market for Australian potatoes.
• Over the past five years there has been little difference in unit returns fromsales in the leading export markets.
• Given its relatively small volume of exports, Australia still maintains areasonably strong market share in its principal export markets.
• Australian fresh potatoes account for around 12 per cent, 13 per cent and20 per cent of the imports of Malaysia, Mauritius and Singapore respec-tively.
• Australia also accounts for around 46 per cent of the imports of seed potatointo Mauritius, although the quantities are relatively low.
• Being the world’s largest potato exporter, the Netherlands is the largestcompetitor in most markets of interest to Australia. Other significantcompetitors include New Zealand, Indonesia and South Africa.
Processed potato exports• While export volumes of processed potatoes are considerably less than
fresh exports, at around 6000 tonnes in 1998-99, their value was onlyslightly less at around $8 million.
• Despite this, export volumes and values have been falling from the 1995-96 levels of just under 12 000 tonnes and $18 million respectively.
• Exports to New Zealand and Japan have decreased the most, and in 1998-99 the three largest export markets were Malaysia, New Zealand and PapuaNew Guinea, which together accounted for 60 per cent of the volume andvalue of total processed exports.
• Apart from some processed potato products to New Zealand, Australiaholds negligible market share in any market.
• The major world exporters of processed potato product are the Netherlands,the United States and Canada.
94 Australian horticulture
POTATOES
State/regional export contributions• Being the largest potato producer, Victoria is also the dominant exporter
of potatoes, contributing 71 per cent of the volume and 67 per cent of thevalue of total potato exports in 1998-99. The main export producing areasare central west Gippsland, Ballarat and the sandy soil regions of theVictorian Murray (A. Henderson, Department of Natural Resources andEnvironment, personal communication, September 1999).
• In the five years to 1998-99 Tasmania’s contribution to total exports (pro-cessed and seed potato) increased from 10 per cent to 17 per cent in termsof volume and value.
Australian support arrangements• No known domestic support arrangements
Market access issues• The main market access issue for the potato industry is quarantine and
relates to the recognition of area freedom from potato cyst nematode (PCN)in Victoria and Western Australia in particular.
• While it has been demonstrated that PCN was constrained to a very smallarea in Victoria, countries such as Korea and Japan place blanket bans onexports from the entire state, or in some cases, Australia in general.
• Inconsistencies seem to exist because despite the fact that exporters suchas the Netherlands and other European suppliers have PCN, they areallowed access to some of these markets.
• However, similar to the case of fruit fly, efforts by the industry to demon-strate area freedom are accepted by other importing countries such asMalaysia, Singapore and Hong Kong.
• Another concern for the industry is the preferential access given to theUnited States by Chinese Taipei. The Australian industry may be compet-itive in the Chinese Taipei market if it was not for the discriminatory accessgiven to the United States (R. Cadman, Department of Natural Resourcesand Environment, personal communication, September 1999).
95Australian horticulture
POTATOES
Industry assistance in major importing and exportingcountries• The Common Agricultural Policy (CAP) in the European Union does not
extend to potatoes. Thus, there are no EU price supports, export subsidiesor import levies on this product.
Technical barriers to trade• The most typical trade barriers in Korea are nontariff barriers that com-
monly result from nontransparent regulatory practices. The lack of regu-latory transparency and consistency can affect licensing, inspections, typeapproval, marking/labeling requirements and other standards. Despite theAdministrative Procedures Act of 1996, the government is still inconsis-tent in providing public notice, and announcing minimum comment peri-ods and transitional periods prior to implementation of new regulations(US Department of State 1999).
96 Australian horticulture
POTATOES
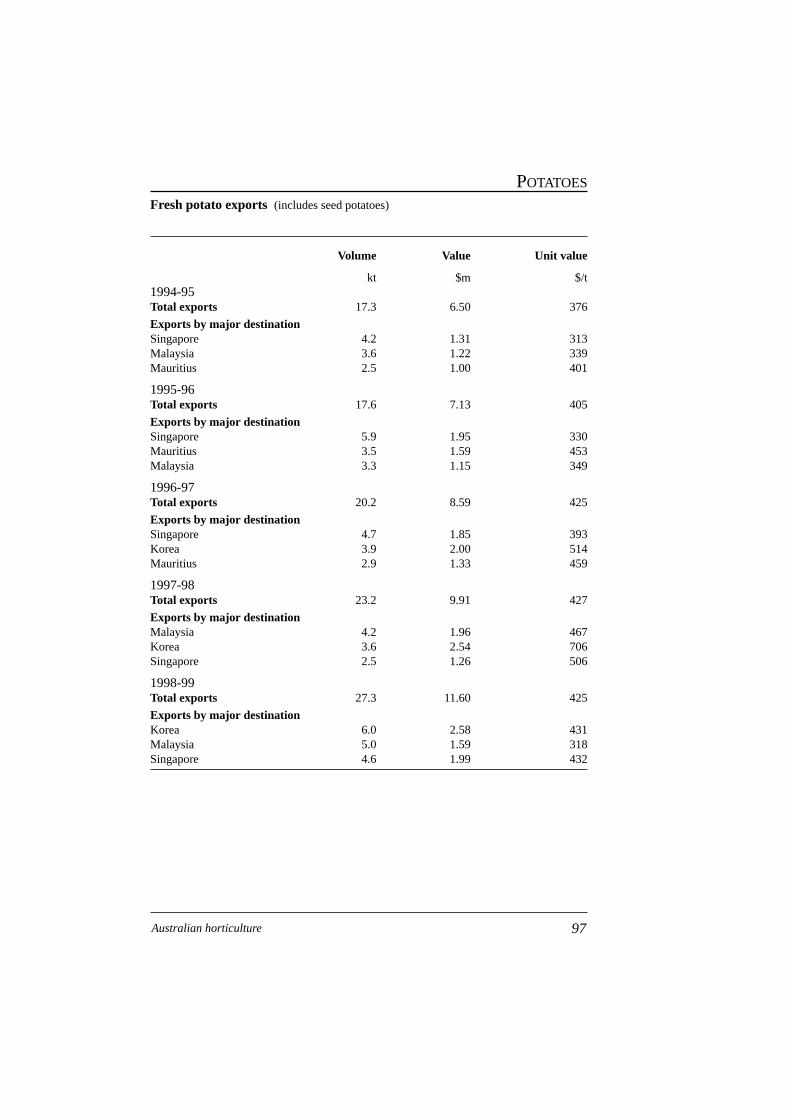
Fresh potato exports (includes seed potatoes)
Volume Value Unit value
kt $m $/t1994-95Total exports 17.3 6.50 376
Exports by major destinationSingapore 4.2 1.31 313Malaysia 3.6 1.22 339Mauritius 2.5 1.00 401
1995-96Total exports 17.6 7.13 405
Exports by major destinationSingapore 5.9 1.95 330Mauritius 3.5 1.59 453Malaysia 3.3 1.15 349
1996-97Total exports 20.2 8.59 425
Exports by major destinationSingapore 4.7 1.85 393Korea 3.9 2.00 514Mauritius 2.9 1.33 459
1997-98Total exports 23.2 9.91 427
Exports by major destinationMalaysia 4.2 1.96 467Korea 3.6 2.54 706Singapore 2.5 1.26 506
1998-99Total exports 27.3 11.60 425
Exports by major destinationKorea 6.0 2.58 431Malaysia 5.0 1.59 318Singapore 4.6 1.99 432
97Australian horticulture
POTATOES
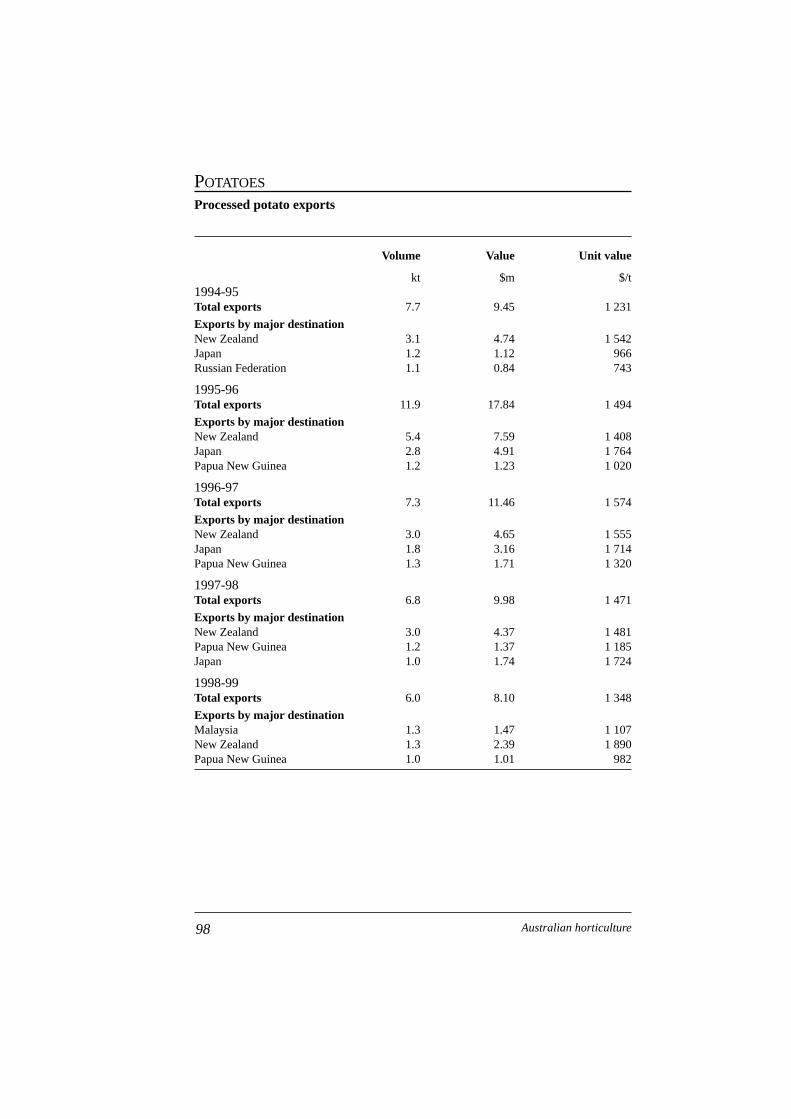
Processed potato exports
Volume Value Unit value
kt $m $/t1994-95Total exports 7.7 9.45 1 231
Exports by major destinationNew Zealand 3.1 4.74 1 542Japan 1.2 1.12 966Russian Federation 1.1 0.84 743
1995-96Total exports 11.9 17.84 1 494
Exports by major destinationNew Zealand 5.4 7.59 1 408Japan 2.8 4.91 1 764Papua New Guinea 1.2 1.23 1 020
1996-97Total exports 7.3 11.46 1 574
Exports by major destinationNew Zealand 3.0 4.65 1 555Japan 1.8 3.16 1 714Papua New Guinea 1.3 1.71 1 320
1997-98Total exports 6.8 9.98 1 471
Exports by major destinationNew Zealand 3.0 4.37 1 481Papua New Guinea 1.2 1.37 1 185Japan 1.0 1.74 1 724
1998-99Total exports 6.0 8.10 1 348
Exports by major destinationMalaysia 1.3 1.47 1 107New Zealand 1.3 2.39 1 890Papua New Guinea 1.0 1.01 982
98 Australian horticulture
POTATOES
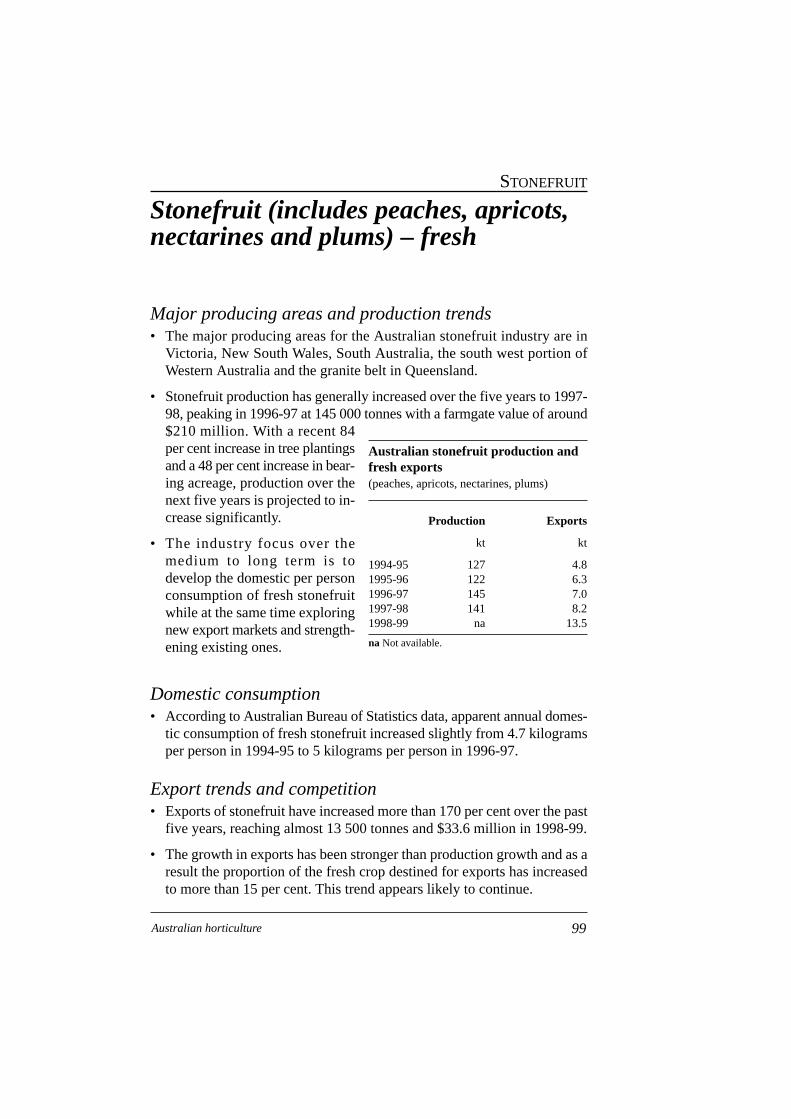
Stonefruit (includes peaches, apricots,nectarines and plums) – fresh
Major producing areas and production trends• The major producing areas for the Australian stonefruit industry are in
Victoria, New South Wales, South Australia, the south west portion ofWestern Australia and the granite belt in Queensland.
• Stonefruit production has generally increased over the five years to 1997-98, peaking in 1996-97 at 145 000 tonnes with a farmgate value of around$210 million. With a recent 84per cent increase in tree plantingsand a 48 per cent increase in bear-ing acreage, production over thenext five years is projected to in-crease significantly.
• The industry focus over themedium to long term is todevelop the domestic per personconsumption of fresh stonefruitwhile at the same time exploringnew export markets and strength-ening existing ones.
Domestic consumption• According to Australian Bureau of Statistics data, apparent annual domes-
tic consumption of fresh stonefruit increased slightly from 4.7 kilogramsper person in 1994-95 to 5 kilograms per person in 1996-97.
Export trends and competition• Exports of stonefruit have increased more than 170 per cent over the past
five years, reaching almost 13 500 tonnes and $33.6 million in 1998-99.
• The growth in exports has been stronger than production growth and as aresult the proportion of the fresh crop destined for exports has increasedto more than 15 per cent. This trend appears likely to continue.
99Australian horticulture
STONEFRUIT
Australian stonefruit production andfresh exports (peaches, apricots, nectarines, plums)
Production Exports
kt kt
1994-95 127 4.81995-96 122 6.31996-97 145 7.01997-98 141 8.21998-99 na 13.5
na Not available.
• While total tree plantings have increased by 84 per cent recently, theproportion representing exportable varieties has increased by around200–300 per cent (P. McFarlane, AFSGA, personal communication,September 1999).
• Australian exports form a very small proportion of world trade, but areable to help fill counterseasonal supply requirements in the northern hemi-sphere.
• The major destinations of stonefruit exports from Australia in recent yearshave been Hong Kong, Chinese Taipei and Singapore, which, in 1998-99,accounted for around 85 per cent of the volume and value of total exports.The surge in exports is reflected in increased quantities to Hong Kong andChinese Taipei in particular.
• Australian stonefruit exports to Singapore and Hong Kong (peaches andnectarines) are currently around 40 per cent and 18 per cent of total importsby those countries (TRAINS 1998; UN trade data via MarketAg, 1997).While the share of Singapore’s imports has remained much the same overthe past five years, Australia’s presence in Hong Kong has been increas-ing gradually.
• As with many horticultural commodities, a significant proportion of thestonefruit exports to Hong Kong may be re-exported to mainland China,thus avoiding the heavy tariffs imposed on direct exports to China.
• While the United States exports large quantities of stonefruit to many ofthe Asian markets Australia supplies, they do so in Australia’s offseasonand so are not regarded as direct competitors.
• Australia does face competition, however, from the southern hemispheresupplies of New Zealand into Chinese Taipei, and Chile into Hong Kong.
• While South Africa is a large producer, its proximity to the EuropeanUnion means the majority of its counterseasonal exports go to Europeanmarkets.
State/regional export contributions• The key growing regions of export variety stonefruit are:
– The Riverland, South Australia: plums and nectarines
– Swan Hill, Victoria: nectarines
– Goulburn Valley, Victoria: all stonefruit
100 Australian horticulture
STONEFRUIT
– Tumut/Young/Orange, New South Wales: a variety of different fruitsincluding fresh cherries
– Donnybrook, Western Australia: plums.
• Over the past five years there has been a significant shift in the exportperformance of the states.
• The proportion of exports of fresh stonefruit departing Western Australiahas declined from 53 per cent of the total export volume in 1994-95 to 37per cent in 1998-99.
• Over the same period exports from Victoria increased from 11 per cent to29 per cent by volume. These patterns are also true for the value of exports.
• According to industry, it is likely that the trend toward increased exportsfrom the eastern states will continue as the majority of recent new plant-ings of export variety fruit have occurred in the Goulburn Valley region.
Australian support arrangements• No known support arrangements.
Market access issues• While Hong Kong and Singapore (both free ports) are two of the largest
export markets for Australian stonefruit, much of the stonefruit enteringHong Kong is understood to be on-shipped to China. Thus China, indi-rectly, represents a large market.
• Given that gaining official access to the Chinese market is difficult andthe duties are very high, recent attempts by Chinese customs to curb ‘un-official’ shipments from Hong Kong may have a detrimental affect ontotal exports.
• There are also market access concerns over Chinese Taipei and someuncertainty about what affect accession to the WTO will have on therestrictive import practices that are currently in place.
• Chinese Taipei is characterised by very high tariff duties. Tariffs on peachesand nectarines are 50 per cent, apricots 45 per cent and plums 35 per cent.
• In addition, quotas which are in effect for peaches and plums (1000 tonnescombined) but not for nectarines, are hampering efforts to develop stone-fruit exports into Chinese Taipei on a unified basis.
101Australian horticulture
STONEFRUIT
• As a result, the recent growth in exports to Chinese Taipei has been drivenby nectarines, while the quota on peaches and plums appears to be restrict-ing the import of this otherwise competitive fruit.
• Another major concern about Chinese Taipei is the lack of recognition ofAustralia’s fruit fly disinfestation procedures for fresh stonefruit. In partic-ular, Chinese Taipei will not accept a sliding scale system of methylbromide treatment of fruit fly for exports from Australia (P. McFarlane,AFSGA, personal communication, September 1999). Chinese Taipei does,however, accept fruit which has been treated using the sliding scale proce-dure from the United States.
• Unless comprehensive scientific data are provided to prove the effec-tiveness of the sliding scale treatment in Australia, Chinese Taipei insiststhat a fixed temperature system is used, which is detrimental to fruit qual-ity. This latter treatment is used for air freighted stonefruit (P. McFarlane,AFSGA, personal communication, September 1999).
• The other accepted treatment is cold sterilisation (used primarily for seafreight). However, this is detrimental to the quality of fragile fruit and isonly used for plums and some newly developed ‘nonmelting’ nectarines.
• Of most importance, and applicable to the Asian region in general is thelack of recognition of Australian mainland area fruit fly freedom for stone-fruit producing regions.
• Citrus has paved the way somewhat in gaining the acceptance of someAsian markets of fruit fly free areas. However, the process could bespeeded up, as there are areas that would be able to export immediatelywithout treatment.
Industry assistance in major importing and exportingcountries• The European Union has in place a number of support arrangements
including compensation payments for product withdrawal, production andexport subsidies and rootstock adjustment programs. For more detail, referto the Trade Policy Analysis section.
Technical barriers to trade• There are no known technical barriers to trade.
102 Australian horticulture
STONEFRUIT
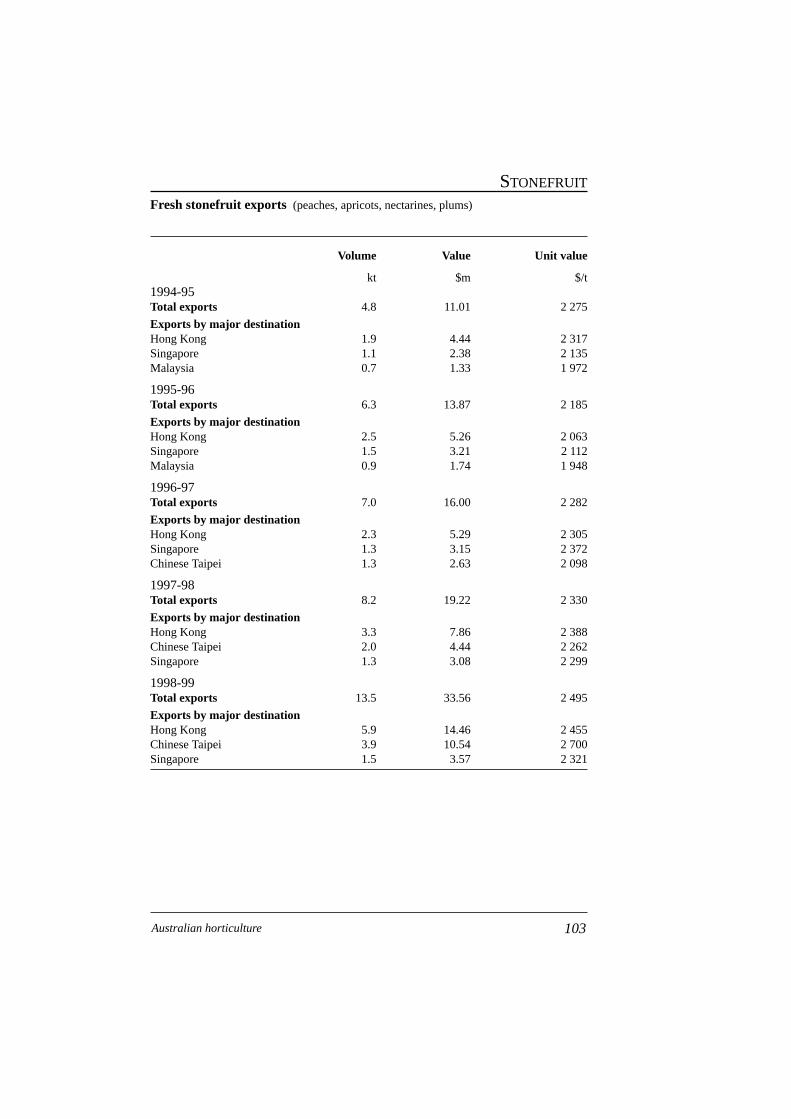
Fresh stonefruit exports (peaches, apricots, nectarines, plums)
Volume Value Unit value
kt $m $/t1994-95Total exports 4.8 11.01 2 275
Exports by major destinationHong Kong 1.9 4.44 2 317Singapore 1.1 2.38 2 135Malaysia 0.7 1.33 1 972
1995-96Total exports 6.3 13.87 2 185
Exports by major destinationHong Kong 2.5 5.26 2 063Singapore 1.5 3.21 2 112Malaysia 0.9 1.74 1 948
1996-97Total exports 7.0 16.00 2 282
Exports by major destinationHong Kong 2.3 5.29 2 305Singapore 1.3 3.15 2 372Chinese Taipei 1.3 2.63 2 098
1997-98Total exports 8.2 19.22 2 330
Exports by major destinationHong Kong 3.3 7.86 2 388Chinese Taipei 2.0 4.44 2 262Singapore 1.3 3.08 2 299
1998-99Total exports 13.5 33.56 2 495
Exports by major destinationHong Kong 5.9 14.46 2 455Chinese Taipei 3.9 10.54 2 700Singapore 1.5 3.57 2 321
103Australian horticulture
STONEFRUIT
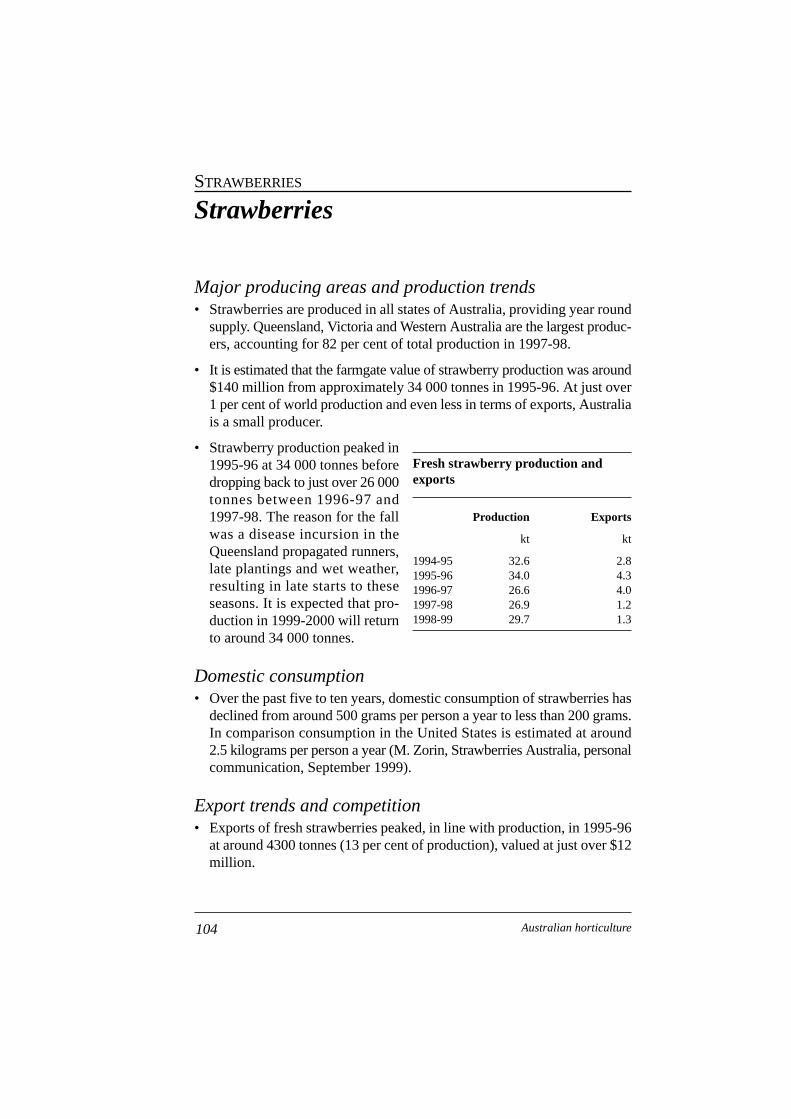
Strawberries
Major producing areas and production trends• Strawberries are produced in all states of Australia, providing year round
supply. Queensland, Victoria and Western Australia are the largest produc-ers, accounting for 82 per cent of total production in 1997-98.
• It is estimated that the farmgate value of strawberry production was around$140 million from approximately 34 000 tonnes in 1995-96. At just over1 per cent of world production and even less in terms of exports, Australiais a small producer.
• Strawberry production peaked in1995-96 at 34 000 tonnes beforedropping back to just over 26 000tonnes between 1996-97 and1997-98. The reason for the fallwas a disease incursion in theQueensland propagated runners,late plantings and wet weather,resulting in late starts to theseseasons. It is expected that pro-duction in 1999-2000 will returnto around 34 000 tonnes.
Domestic consumption• Over the past five to ten years, domestic consumption of strawberries has
declined from around 500 grams per person a year to less than 200 grams.In comparison consumption in the United States is estimated at around2.5 kilograms per person a year (M. Zorin, Strawberries Australia, personalcommunication, September 1999).
Export trends and competition• Exports of fresh strawberries peaked, in line with production, in 1995-96
at around 4300 tonnes (13 per cent of production), valued at just over $12million.
104 Australian horticulture
STRAWBERRIES
Fresh strawberry production andexports
Production Exports
kt kt
1994-95 32.6 2.81995-96 34.0 4.31996-97 26.6 4.01997-98 26.9 1.21998-99 29.7 1.3
• However, falls in production in the following two years, combined witheffects of the Asian economic downturn, resulted in exports decreasingto around 1300 tonnes (4 per cent of production) in 1998-99, valued atjust over $8.5 million.
• Over the past five years Hong Kong and Singapore have been the top twoexport destinations for fresh strawberries based on volume. In 1998-99,the United Kingdom was the third largest market by volume but with unitreturns more than 68 per cent higher than Hong Kong and Singapore; theUnited Kingdom was the leading destination by value.
• Australia’s import market share in Hong Kong was highest in 1994 ataround 40 per cent by volume. However, this declined to around 18 percent in 1997 (UNCTAD 1999).
• Over the same period the US import market share in Hong Kong increasedfrom 47 per cent in 1994 to 63 per cent in 1997 (UNCTAD 1999).
• Since 1993 Australia’s share of Singapore imports ranged from 14 percent to 23 per cent. According to latest figures for 1997 Australia’s sharehad fallen back to just over 20 per cent (UNCTAD 1999).
• The United States supplied an average of 62 per cent of Singapore’simports since 1993. In 1997 its share was 59 per cent (UNCTAD 1999).
• Australia’s share of the UK market is less than 1 per cent, with Spain aloneaccounting for over 55 per cent of all UK imports.
• Apart from the United States, which is the world’s largest producer ofstrawberries, Australia’s main competition in Asian markets comes fromNew Zealand, with market shares only slightly below those of Australia.
State/regional export contributions• Over the five years to 1998-99, the proportion of total exports from
Western Australia, Queensland and New South Wales has been erratic,with each state accounting for the majority of exports at one time oranother.
• In 1998-99, exports from Queensland represented just 5 per cent of totalexports, New South Wales accounted for 14 per cent, while WesternAustralia accounted for 76 per cent.
• This variability reflects in part, variations in export freight costs at differ-ent ports. Transporting strawberries interstate can reduce costs.
105Australian horticulture
STRAWBERRIES
Strawberries are regularly transported from South Australia to New SouthWales; thus not all strawberries exported from New South Wales aresourced from within that state.
Australian support arrangements• No known domestic support arrangements.
Market access issues• The main market access issues facing the strawberry industry involve
resolving quarantine barriers relating to Queensland and Mediterraneanfruit fly, which prevent entry to certain countries.
• The industry is concerned that strawberries that enter Hong Kong freelyare then reshipped and allowed entry to China and Japan, thus avoidingthe quarantine protocols that presently prohibit or greatly restrict directaccess to these markets. It is also possible that fruit enters Chinese Taipeivia Hong Kong. Direct access to these markets is preferable to ensure thathandling and marketing of the fruit is under the supervision of the indus-try.
• There are similar concerns that fruit sold to Singapore ends up in otherAsian markets that Australia does not have direct import access to (M. Zorin, Strawberries Australia, personal communication, September1999).
Industry assistance in major importing and exportingcountries• No known assistance.
Technical barriers to trade• There are no known technical barriers to trade.
106 Australian horticulture
STRAWBERRIES
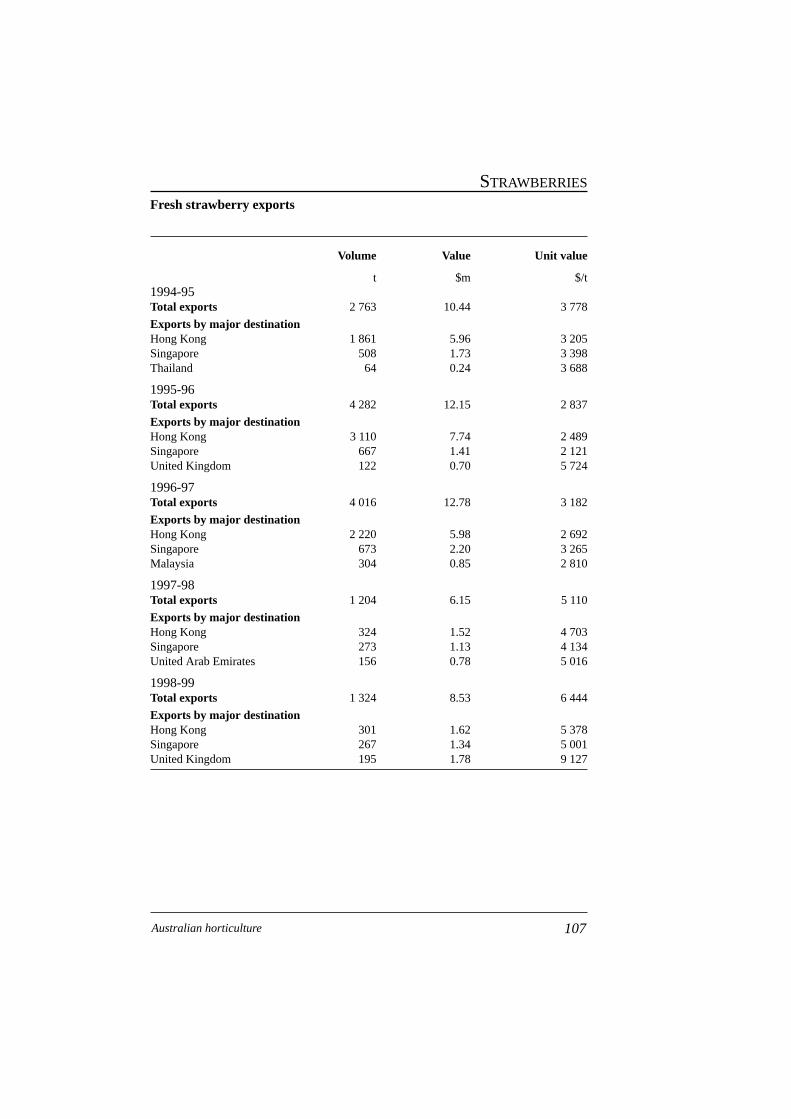
Fresh strawberry exports
Volume Value Unit value
t $m $/t1994-95Total exports 2 763 10.44 3 778
Exports by major destinationHong Kong 1 861 5.96 3 205Singapore 508 1.73 3 398Thailand 64 0.24 3 688
1995-96Total exports 4 282 12.15 2 837
Exports by major destinationHong Kong 3 110 7.74 2 489Singapore 667 1.41 2 121United Kingdom 122 0.70 5 724
1996-97Total exports 4 016 12.78 3 182
Exports by major destinationHong Kong 2 220 5.98 2 692Singapore 673 2.20 3 265Malaysia 304 0.85 2 810
1997-98Total exports 1 204 6.15 5 110
Exports by major destinationHong Kong 324 1.52 4 703Singapore 273 1.13 4 134United Arab Emirates 156 0.78 5 016
1998-99Total exports 1 324 8.53 6 444
Exports by major destinationHong Kong 301 1.62 5 378Singapore 267 1.34 5 001United Kingdom 195 1.78 9 127
107Australian horticulture
STRAWBERRIES
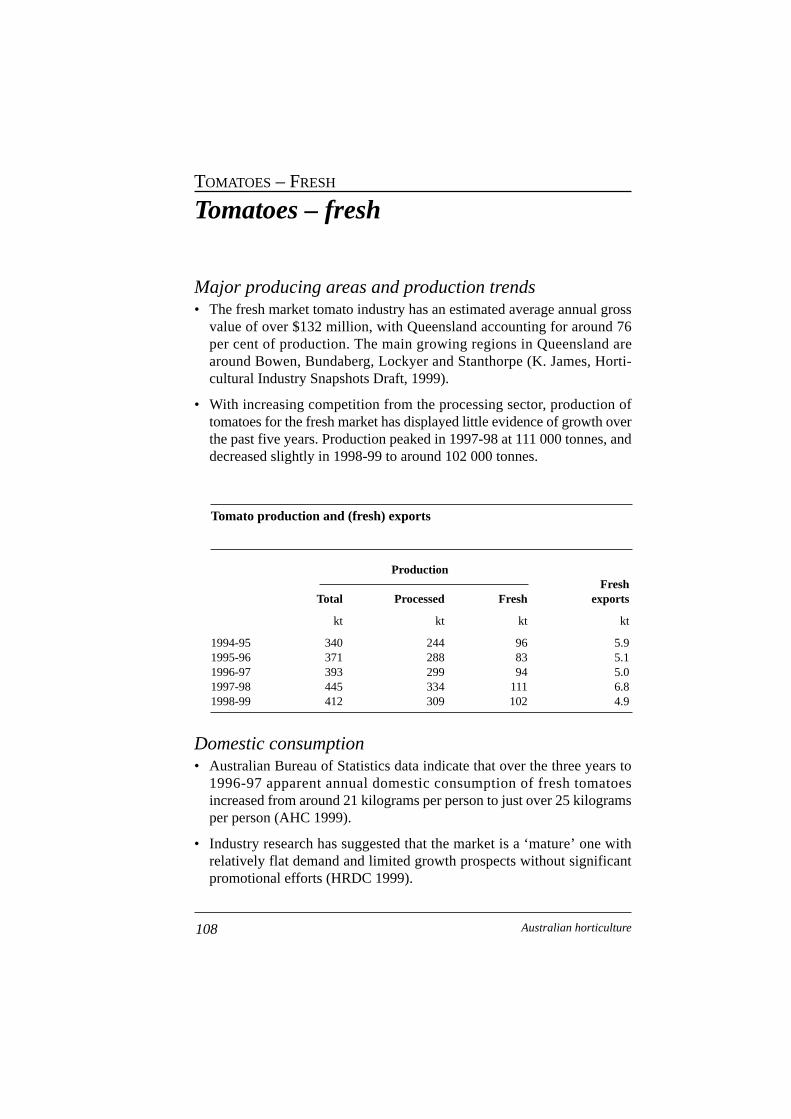
Tomatoes – fresh
Major producing areas and production trends• The fresh market tomato industry has an estimated average annual gross
value of over $132 million, with Queensland accounting for around 76per cent of production. The main growing regions in Queensland arearound Bowen, Bundaberg, Lockyer and Stanthorpe (K. James, Horti-cultural Industry Snapshots Draft, 1999).
• With increasing competition from the processing sector, production oftomatoes for the fresh market has displayed little evidence of growth overthe past five years. Production peaked in 1997-98 at 111 000 tonnes, anddecreased slightly in 1998-99 to around 102 000 tonnes.
108 Australian horticulture
TOMATOES – FRESH
Tomato production and (fresh) exports
ProductionFresh
Total Processed Fresh exports
kt kt kt kt
1994-95 340 244 96 5.91995-96 371 288 83 5.11996-97 393 299 94 5.01997-98 445 334 111 6.81998-99 412 309 102 4.9
Domestic consumption• Australian Bureau of Statistics data indicate that over the three years to
1996-97 apparent annual domestic consumption of fresh tomatoesincreased from around 21 kilograms per person to just over 25 kilogramsper person (AHC 1999).
• Industry research has suggested that the market is a ‘mature’ one withrelatively flat demand and limited growth prospects without significantpromotional efforts (HRDC 1999).
Export trends and competition• As with production, exports of fresh tomatoes fluctuated over the five
years to 1998-99. Exports peaked in 1997-98 at 6800 tonnes before declin-ing to 4860 tonnes at a value of $7.72 million in 1998-99.
• In each of the five years to 1998-99, New Zealand, Singapore and HongKong accounted for over 94 per cent of all fresh tomato exports. NewZealand alone accounted for between 50 and 70 per cent of annual exportsover this period.
• Australia has traditionally been the sole supplier of fresh tomatoes to NewZealand.
• Australia’s share of Singapore’s import market, however, has declinedfrom around 20 per cent in 1994 to around 8 per cent in 1996. This is de-spite Malaysia and Thailand maintaining their share of the import marketat around 55 per cent and 25 per cent respectively (UNCTAD 1999).
• In recent years, Australia’s share of the Malaysian import market has fallenbelow 30 per cent. Large increases in imports from Thailand seem to bethe main reason for this loss of market share (UNCTAD 1999).
• Aside from Malaysia and Thailand, Australia also faces competition fromthe United States and China in the fresh tomato export market.
State/regional export contributions• Queensland is the dominant producer and exporter of fresh tomatoes. In
1998-99, around 82 per cent of fresh tomato exports were shipped fromQueensland.
Australian support arrangements• No domestic support arrangements.
Market access issues• With 94 per cent of fresh tomato exports in 1998-99 shipped to countries
with zero import duties, tariffs are not a current concern.
• Singapore and Hong Kong, the second and third ranked export destina-tions, do not require any quarantine treatment of fresh tomatoes.
109Australian horticulture
TOMATOES – FRESH
• While treatment for possible fruit fly in exports of fresh tomatoes to NewZealand is well established and accepted, it is restricted to just five vari-eties. Research is progressing to incorporate more varieties.
• Japan has priority in terms of new market development and, in conjunc-tion with AQIS, the industry is focusing efforts toward gaining accep-tance into the Japanese market — and have an application pending.
• Other markets identified by the industry for potential development areChinese Taipei and the Middle East. However, high tariff rates of between10 and 12 per cent are impeding the process, and in the case of ChineseTaipei, exports are prohibited and efforts to gain an import permit haveas yet been unsuccessful (M. Milgate, QFVG, personal communication,October 1999).
• The tomato industry is also pursuing greenhouse tomato access to theUnited States. Initial production of greenhouse tomatoes would occur prin-cipally in South Australia.
Industry assistance in major importing and exportingcountries• No known industry assistance in other countries.
Technical barriers to trade• There are no known technical barriers to trade.
110 Australian horticulture
TOMATOES – FRESH
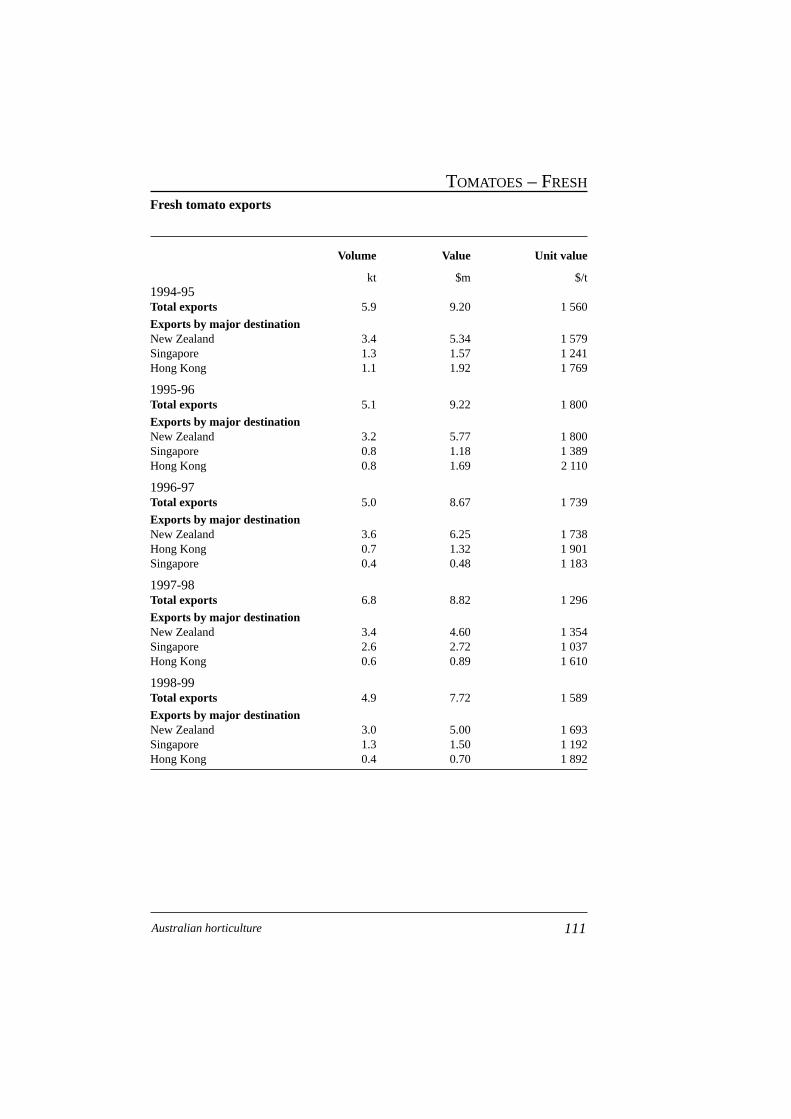
Fresh tomato exports
Volume Value Unit value
kt $m $/t1994-95Total exports 5.9 9.20 1 560
Exports by major destinationNew Zealand 3.4 5.34 1 579Singapore 1.3 1.57 1 241Hong Kong 1.1 1.92 1 769
1995-96Total exports 5.1 9.22 1 800
Exports by major destinationNew Zealand 3.2 5.77 1 800Singapore 0.8 1.18 1 389Hong Kong 0.8 1.69 2 110
1996-97Total exports 5.0 8.67 1 739
Exports by major destinationNew Zealand 3.6 6.25 1 738Hong Kong 0.7 1.32 1 901Singapore 0.4 0.48 1 183
1997-98Total exports 6.8 8.82 1 296
Exports by major destinationNew Zealand 3.4 4.60 1 354Singapore 2.6 2.72 1 037Hong Kong 0.6 0.89 1 610
1998-99Total exports 4.9 7.72 1 589
Exports by major destinationNew Zealand 3.0 5.00 1 693Singapore 1.3 1.50 1 192Hong Kong 0.4 0.70 1 892
111Australian horticulture
TOMATOES – FRESH
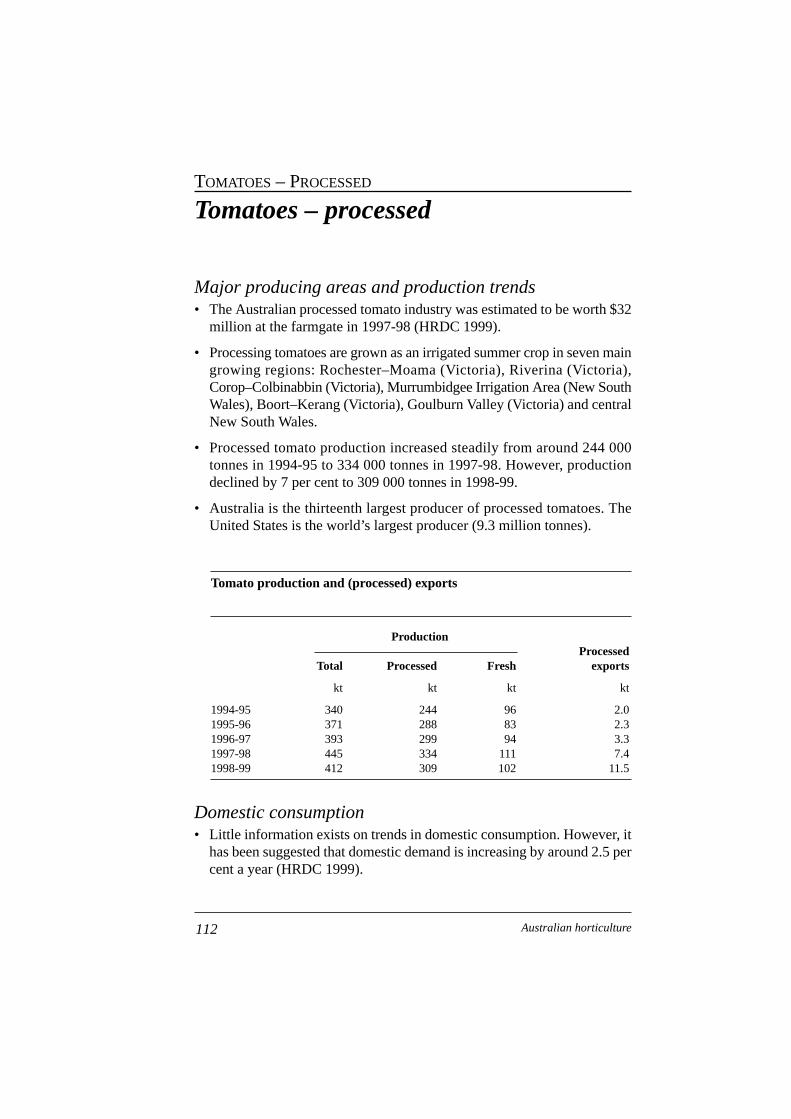
Tomatoes – processed
Major producing areas and production trends• The Australian processed tomato industry was estimated to be worth $32
million at the farmgate in 1997-98 (HRDC 1999).
• Processing tomatoes are grown as an irrigated summer crop in seven maingrowing regions: Rochester–Moama (Victoria), Riverina (Victoria),Corop–Colbinabbin (Victoria), Murrumbidgee Irrigation Area (New SouthWales), Boort–Kerang (Victoria), Goulburn Valley (Victoria) and centralNew South Wales.
• Processed tomato production increased steadily from around 244 000tonnes in 1994-95 to 334 000 tonnes in 1997-98. However, productiondeclined by 7 per cent to 309 000 tonnes in 1998-99.
• Australia is the thirteenth largest producer of processed tomatoes. TheUnited States is the world’s largest producer (9.3 million tonnes).
112 Australian horticulture
TOMATOES – PROCESSED
Tomato production and (processed) exports
ProductionProcessed
Total Processed Fresh exports
kt kt kt kt
1994-95 340 244 96 2.01995-96 371 288 83 2.31996-97 393 299 94 3.31997-98 445 334 111 7.41998-99 412 309 102 11.5
Domestic consumption• Little information exists on trends in domestic consumption. However, it
has been suggested that domestic demand is increasing by around 2.5 percent a year (HRDC 1999).
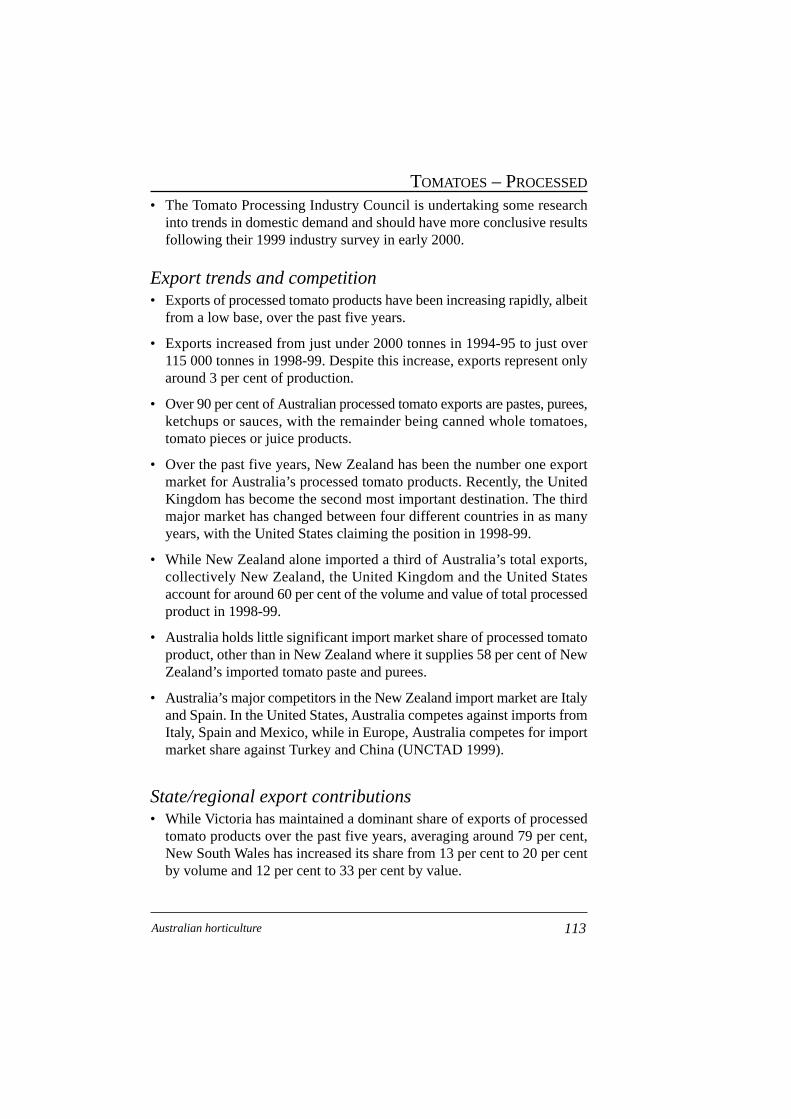
• The Tomato Processing Industry Council is undertaking some researchinto trends in domestic demand and should have more conclusive resultsfollowing their 1999 industry survey in early 2000.
Export trends and competition• Exports of processed tomato products have been increasing rapidly, albeit
from a low base, over the past five years.
• Exports increased from just under 2000 tonnes in 1994-95 to just over115 000 tonnes in 1998-99. Despite this increase, exports represent onlyaround 3 per cent of production.
• Over 90 per cent of Australian processed tomato exports are pastes, purees,ketchups or sauces, with the remainder being canned whole tomatoes,tomato pieces or juice products.
• Over the past five years, New Zealand has been the number one exportmarket for Australia’s processed tomato products. Recently, the UnitedKingdom has become the second most important destination. The thirdmajor market has changed between four different countries in as manyyears, with the United States claiming the position in 1998-99.
• While New Zealand alone imported a third of Australia’s total exports,collectively New Zealand, the United Kingdom and the United Statesaccount for around 60 per cent of the volume and value of total processedproduct in 1998-99.
• Australia holds little significant import market share of processed tomatoproduct, other than in New Zealand where it supplies 58 per cent of NewZealand’s imported tomato paste and purees.
• Australia’s major competitors in the New Zealand import market are Italyand Spain. In the United States, Australia competes against imports fromItaly, Spain and Mexico, while in Europe, Australia competes for importmarket share against Turkey and China (UNCTAD 1999).
State/regional export contributions• While Victoria has maintained a dominant share of exports of processed
tomato products over the past five years, averaging around 79 per cent,New South Wales has increased its share from 13 per cent to 20 per centby volume and 12 per cent to 33 per cent by value.
113Australian horticulture
TOMATOES – PROCESSED
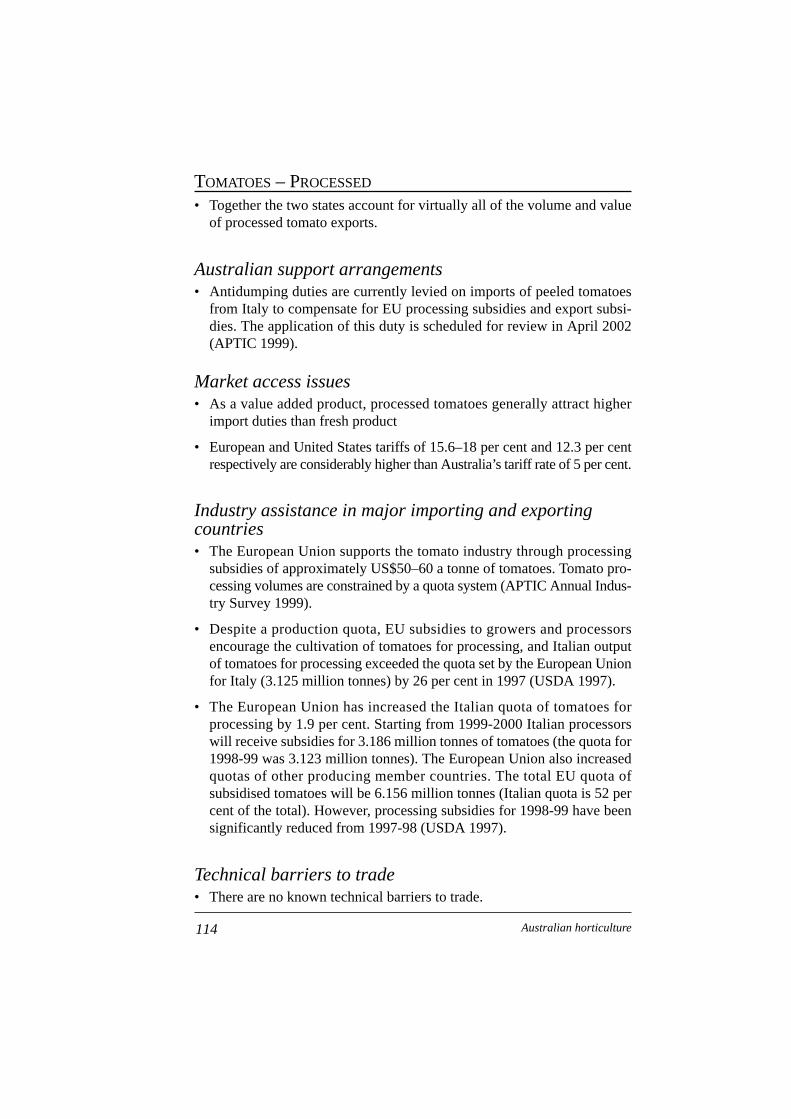
• Together the two states account for virtually all of the volume and valueof processed tomato exports.
Australian support arrangements• Antidumping duties are currently levied on imports of peeled tomatoes
from Italy to compensate for EU processing subsidies and export subsi-dies. The application of this duty is scheduled for review in April 2002(APTIC 1999).
Market access issues• As a value added product, processed tomatoes generally attract higher
import duties than fresh product
• European and United States tariffs of 15.6–18 per cent and 12.3 per centrespectively are considerably higher than Australia’s tariff rate of 5 per cent.
Industry assistance in major importing and exportingcountries• The European Union supports the tomato industry through processing
subsidies of approximately US$50–60 a tonne of tomatoes. Tomato pro-cessing volumes are constrained by a quota system (APTIC Annual Indus-try Survey 1999).
• Despite a production quota, EU subsidies to growers and processorsencourage the cultivation of tomatoes for processing, and Italian outputof tomatoes for processing exceeded the quota set by the European Unionfor Italy (3.125 million tonnes) by 26 per cent in 1997 (USDA 1997).
• The European Union has increased the Italian quota of tomatoes forprocessing by 1.9 per cent. Starting from 1999-2000 Italian processorswill receive subsidies for 3.186 million tonnes of tomatoes (the quota for1998-99 was 3.123 million tonnes). The European Union also increasedquotas of other producing member countries. The total EU quota ofsubsidised tomatoes will be 6.156 million tonnes (Italian quota is 52 percent of the total). However, processing subsidies for 1998-99 have beensignificantly reduced from 1997-98 (USDA 1997).
Technical barriers to trade• There are no known technical barriers to trade.
114 Australian horticulture
TOMATOES – PROCESSED
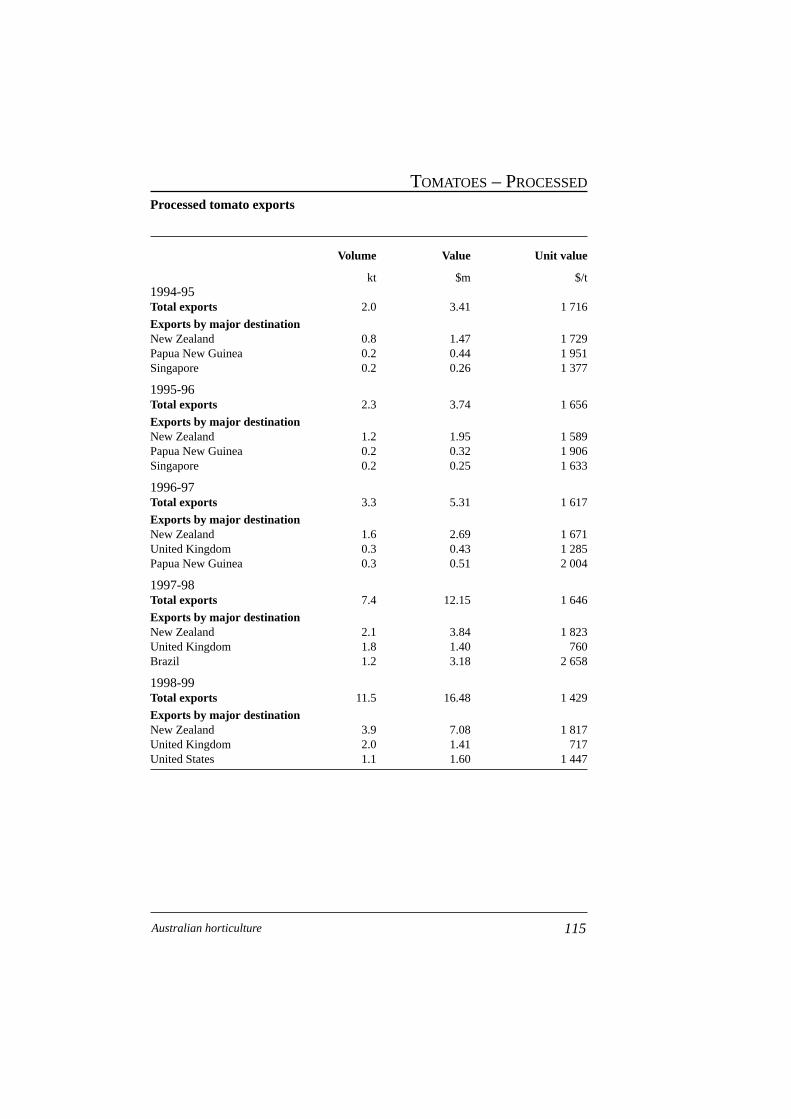
Processed tomato exports
Volume Value Unit value
kt $m $/t1994-95Total exports 2.0 3.41 1 716
Exports by major destinationNew Zealand 0.8 1.47 1 729Papua New Guinea 0.2 0.44 1 951Singapore 0.2 0.26 1 377
1995-96Total exports 2.3 3.74 1 656
Exports by major destinationNew Zealand 1.2 1.95 1 589Papua New Guinea 0.2 0.32 1 906Singapore 0.2 0.25 1 633
1996-97Total exports 3.3 5.31 1 617
Exports by major destinationNew Zealand 1.6 2.69 1 671United Kingdom 0.3 0.43 1 285Papua New Guinea 0.3 0.51 2 004
1997-98Total exports 7.4 12.15 1 646
Exports by major destinationNew Zealand 2.1 3.84 1 823United Kingdom 1.8 1.40 760Brazil 1.2 3.18 2 658
1998-99Total exports 11.5 16.48 1 429
Exports by major destinationNew Zealand 3.9 7.08 1 817United Kingdom 2.0 1.41 717United States 1.1 1.60 1 447
115Australian horticulture
TOMATOES – PROCESSED
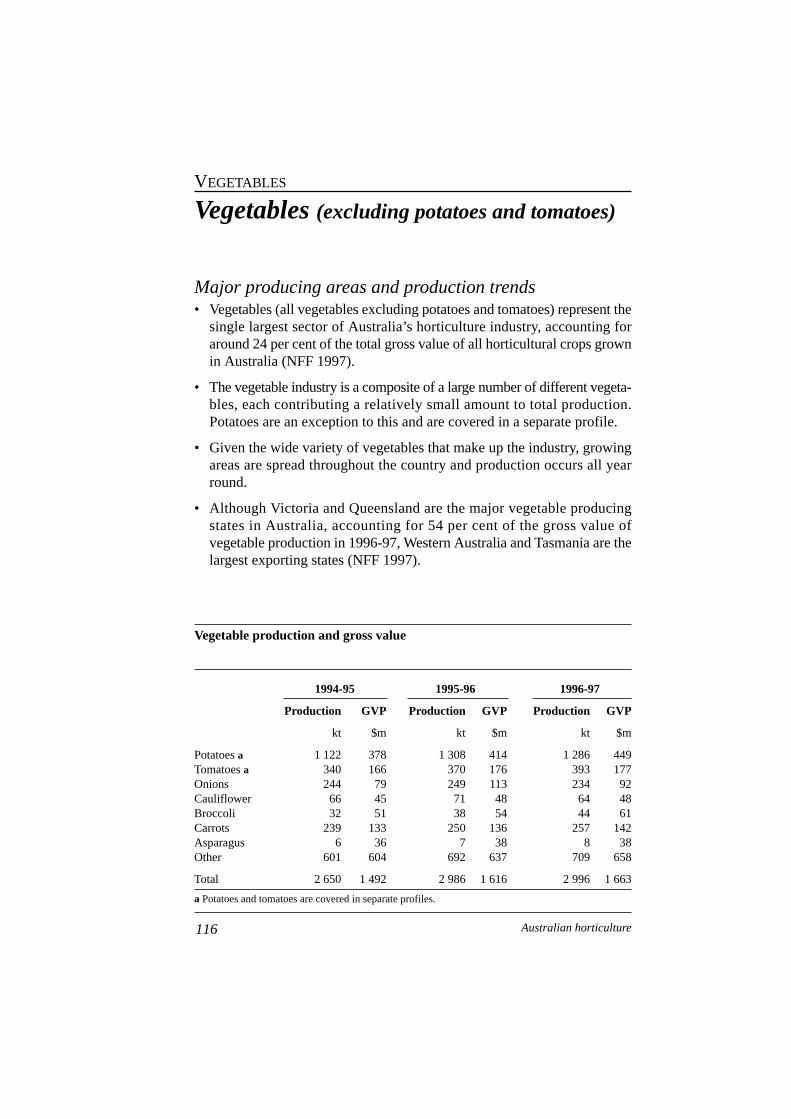
Vegetables (excluding potatoes and tomatoes)
Major producing areas and production trends• Vegetables (all vegetables excluding potatoes and tomatoes) represent the
single largest sector of Australia’s horticulture industry, accounting foraround 24 per cent of the total gross value of all horticultural crops grownin Australia (NFF 1997).
• The vegetable industry is a composite of a large number of different vegeta-bles, each contributing a relatively small amount to total production.Potatoes are an exception to this and are covered in a separate profile.
• Given the wide variety of vegetables that make up the industry, growingareas are spread throughout the country and production occurs all yearround.
• Although Victoria and Queensland are the major vegetable producingstates in Australia, accounting for 54 per cent of the gross value ofvegetable production in 1996-97, Western Australia and Tasmania are thelargest exporting states (NFF 1997).
116 Australian horticulture
VEGETABLES
Vegetable production and gross value
1994-95 1995-96 1996-97
Production GVP Production GVP Production GVP
kt $m kt $m kt $m
Potatoes a 1 122 378 1 308 414 1 286 449Tomatoes a 340 166 370 176 393 177Onions 244 79 249 113 234 92Cauliflower 66 45 71 48 64 48Broccoli 32 51 38 54 44 61Carrots 239 133 250 136 257 142Asparagus 6 36 7 38 8 38Other 601 604 692 637 709 658
Total 2 650 1 492 2 986 1 616 2 996 1 663
a Potatoes and tomatoes are covered in separate profiles.
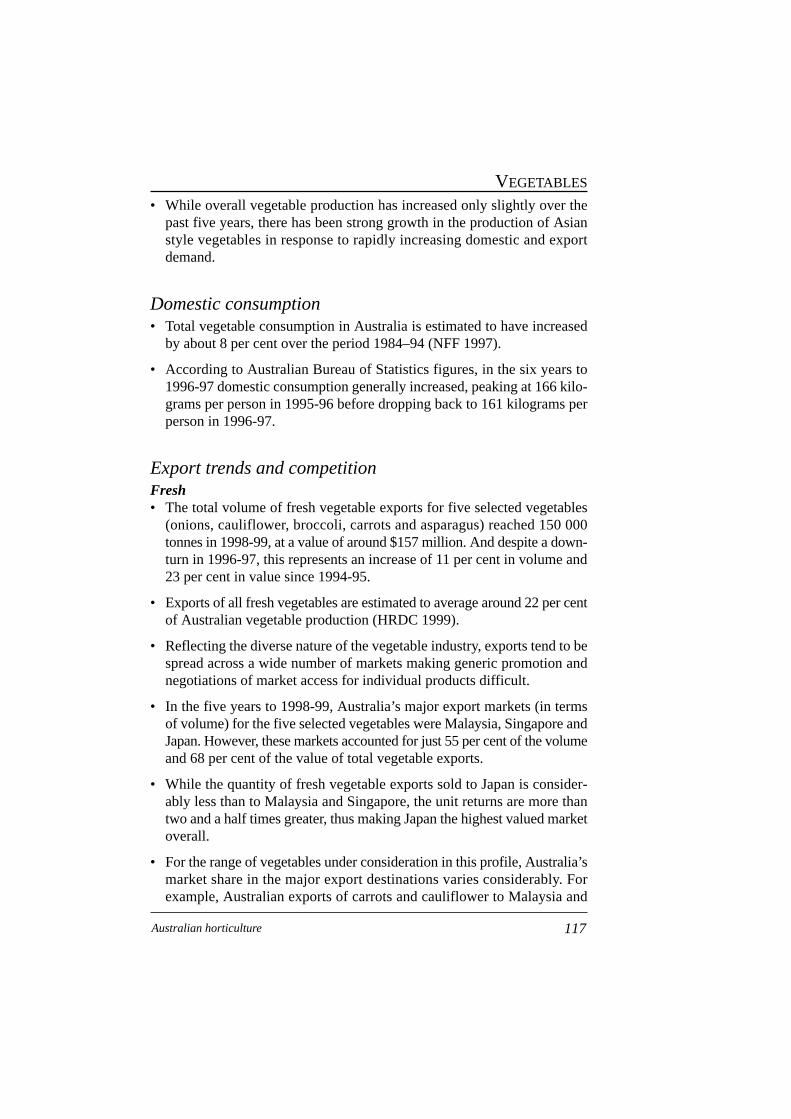
• While overall vegetable production has increased only slightly over thepast five years, there has been strong growth in the production of Asianstyle vegetables in response to rapidly increasing domestic and exportdemand.
Domestic consumption• Total vegetable consumption in Australia is estimated to have increased
by about 8 per cent over the period 1984–94 (NFF 1997).
• According to Australian Bureau of Statistics figures, in the six years to1996-97 domestic consumption generally increased, peaking at 166 kilo-grams per person in 1995-96 before dropping back to 161 kilograms perperson in 1996-97.
Export trends and competitionFresh• The total volume of fresh vegetable exports for five selected vegetables
(onions, cauliflower, broccoli, carrots and asparagus) reached 150 000tonnes in 1998-99, at a value of around $157 million. And despite a down-turn in 1996-97, this represents an increase of 11 per cent in volume and23 per cent in value since 1994-95.
• Exports of all fresh vegetables are estimated to average around 22 per centof Australian vegetable production (HRDC 1999).
• Reflecting the diverse nature of the vegetable industry, exports tend to bespread across a wide number of markets making generic promotion andnegotiations of market access for individual products difficult.
• In the five years to 1998-99, Australia’s major export markets (in termsof volume) for the five selected vegetables were Malaysia, Singapore andJapan. However, these markets accounted for just 55 per cent of the volumeand 68 per cent of the value of total vegetable exports.
• While the quantity of fresh vegetable exports sold to Japan is consider-ably less than to Malaysia and Singapore, the unit returns are more thantwo and a half times greater, thus making Japan the highest valued marketoverall.
• For the range of vegetables under consideration in this profile, Australia’smarket share in the major export destinations varies considerably. Forexample, Australian exports of carrots and cauliflower to Malaysia and
117Australian horticulture
VEGETABLES
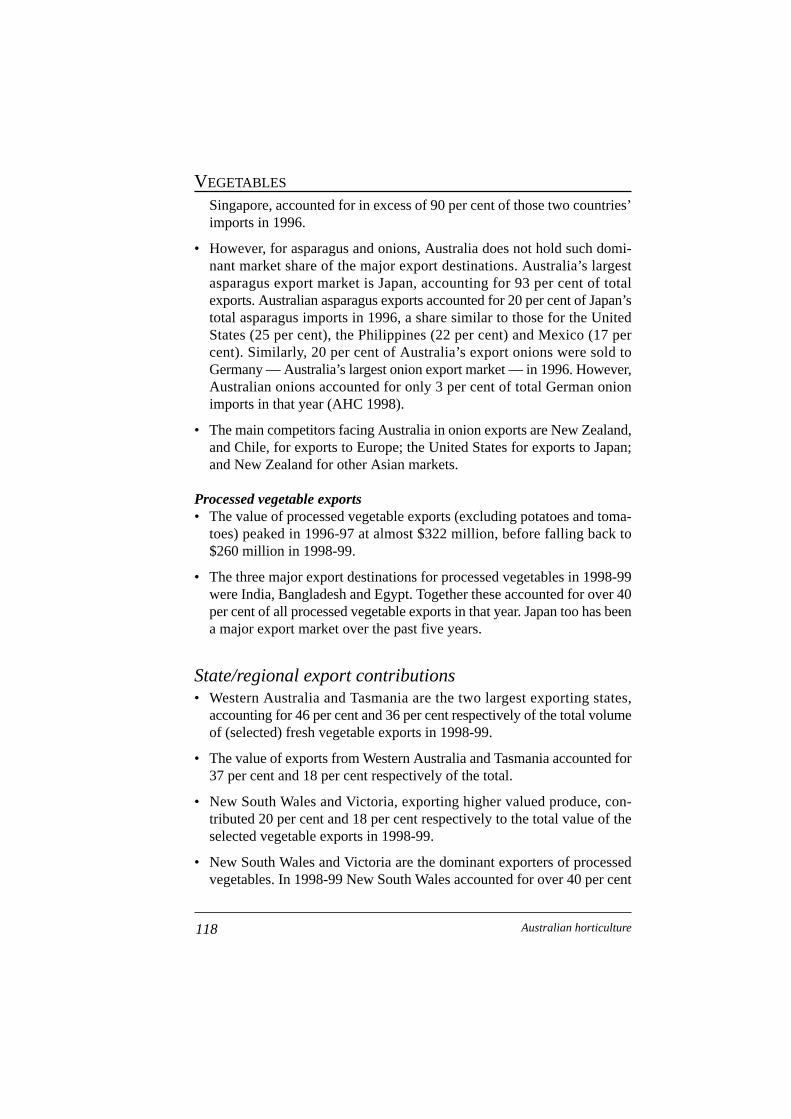
Singapore, accounted for in excess of 90 per cent of those two countries’imports in 1996.
• However, for asparagus and onions, Australia does not hold such domi-nant market share of the major export destinations. Australia’s largestasparagus export market is Japan, accounting for 93 per cent of totalexports. Australian asparagus exports accounted for 20 per cent of Japan’stotal asparagus imports in 1996, a share similar to those for the UnitedStates (25 per cent), the Philippines (22 per cent) and Mexico (17 percent). Similarly, 20 per cent of Australia’s export onions were sold toGermany — Australia’s largest onion export market — in 1996. However,Australian onions accounted for only 3 per cent of total German onionimports in that year (AHC 1998).
• The main competitors facing Australia in onion exports are New Zealand,and Chile, for exports to Europe; the United States for exports to Japan;and New Zealand for other Asian markets.
Processed vegetable exports• The value of processed vegetable exports (excluding potatoes and toma-
toes) peaked in 1996-97 at almost $322 million, before falling back to$260 million in 1998-99.
• The three major export destinations for processed vegetables in 1998-99were India, Bangladesh and Egypt. Together these accounted for over 40per cent of all processed vegetable exports in that year. Japan too has beena major export market over the past five years.
State/regional export contributions• Western Australia and Tasmania are the two largest exporting states,
accounting for 46 per cent and 36 per cent respectively of the total volumeof (selected) fresh vegetable exports in 1998-99.
• The value of exports from Western Australia and Tasmania accounted for37 per cent and 18 per cent respectively of the total.
• New South Wales and Victoria, exporting higher valued produce, con-tributed 20 per cent and 18 per cent respectively to the total value of theselected vegetable exports in 1998-99.
• New South Wales and Victoria are the dominant exporters of processedvegetables. In 1998-99 New South Wales accounted for over 40 per cent
118 Australian horticulture
VEGETABLES
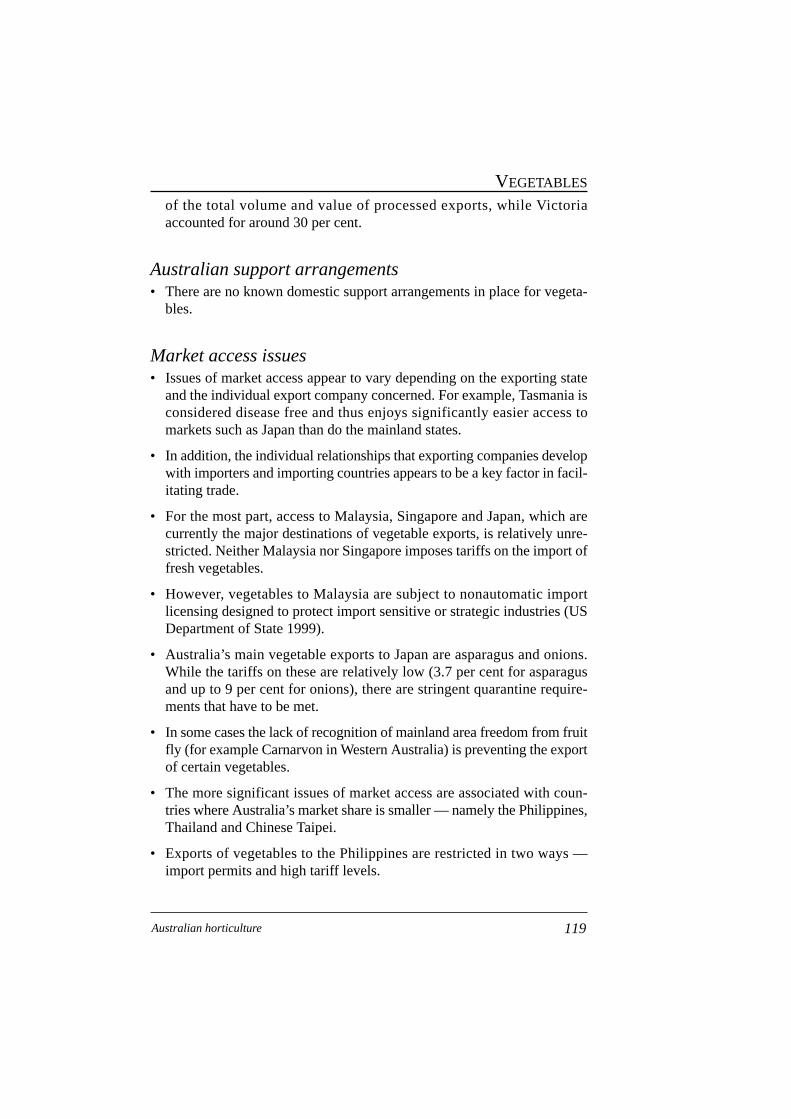
of the total volume and value of processed exports, while Victoriaaccounted for around 30 per cent.
Australian support arrangements• There are no known domestic support arrangements in place for vegeta-
bles.
Market access issues• Issues of market access appear to vary depending on the exporting state
and the individual export company concerned. For example, Tasmania isconsidered disease free and thus enjoys significantly easier access tomarkets such as Japan than do the mainland states.
• In addition, the individual relationships that exporting companies developwith importers and importing countries appears to be a key factor in facil-itating trade.
• For the most part, access to Malaysia, Singapore and Japan, which arecurrently the major destinations of vegetable exports, is relatively unre-stricted. Neither Malaysia nor Singapore imposes tariffs on the import offresh vegetables.
• However, vegetables to Malaysia are subject to nonautomatic importlicensing designed to protect import sensitive or strategic industries (USDepartment of State 1999).
• Australia’s main vegetable exports to Japan are asparagus and onions.While the tariffs on these are relatively low (3.7 per cent for asparagusand up to 9 per cent for onions), there are stringent quarantine require-ments that have to be met.
• In some cases the lack of recognition of mainland area freedom from fruitfly (for example Carnarvon in Western Australia) is preventing the exportof certain vegetables.
• The more significant issues of market access are associated with coun-tries where Australia’s market share is smaller — namely the Philippines,Thailand and Chinese Taipei.
• Exports of vegetables to the Philippines are restricted in two ways —import permits and high tariff levels.
119Australian horticulture
VEGETABLES
• Import permits, which limit the export of some vegetables to the Philip-pines to small lots per vegetable type per shipment, greatly restrict exportsbecause trading in such small quantities is uneconomic (R. Grey, WestcorpExports, personal communication, September 1999).
• In addition to import permits, the Philippines imposes relatively high tarifflevels on the import of vegetables. Carrots, cauliflower and broccoli faceduties of 20 per cent, while duties on onions, which are under a quotasystem, range from 30 per cent ‘in quota’ to 60 per cent ‘out of quota’.
• As with other horticultural commodities, Thailand imposes very hightariffs of 60 per cent on imported vegetables.
• Chinese Taipei has relatively high import duties on onions, carrots, cauli-flower and broccoli, ranging from 32.5 per cent to 40 per cent.
Industry assistance in major importing and exportingcountries• Spain as a major domestic supplier of onions to Europe, is therefore a
competitor for Australia.
• Under the Common Agricultural Policy, Spanish farm incomes areprotected by direct payments, and guaranteed farm prices are higher thanworld prices, thereby encouraging production above that which mightotherwise occur.
Technical barriers to trade• There are no known technical barriers to trade.
120 Australian horticulture
VEGETABLES
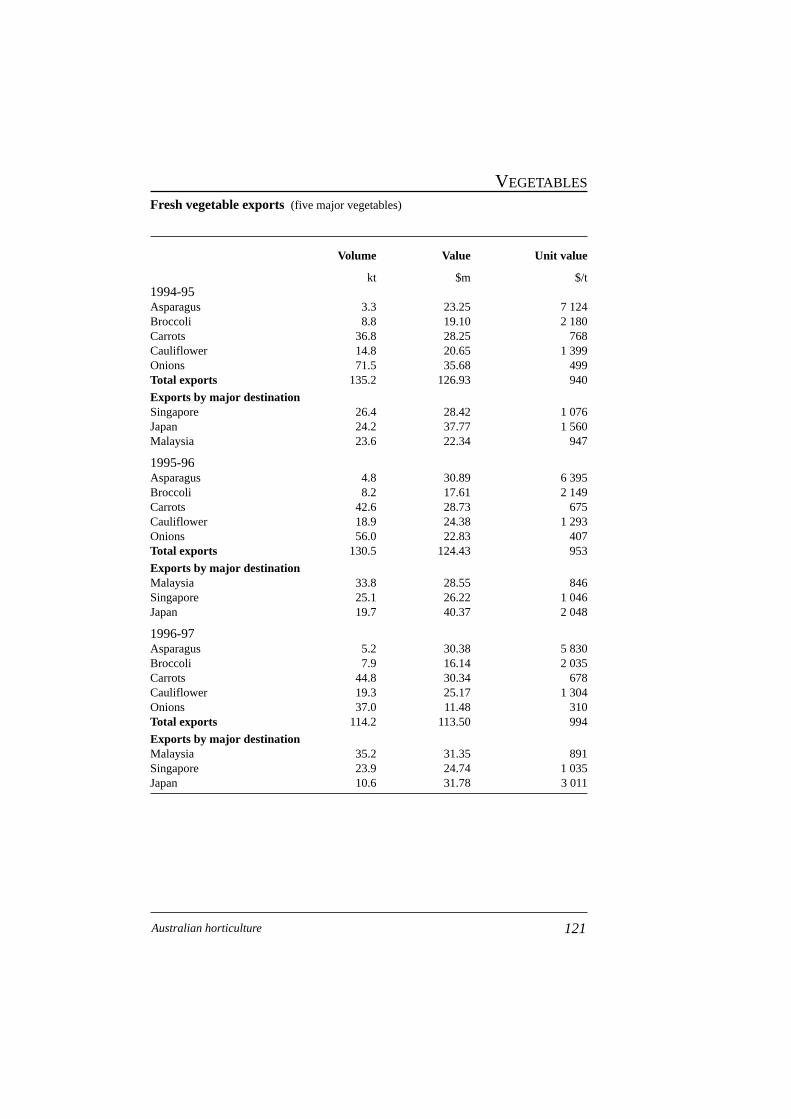
Fresh vegetable exports (five major vegetables)
Volume Value Unit value
kt $m $/t1994-95Asparagus 3.3 23.25 7 124Broccoli 8.8 19.10 2 180Carrots 36.8 28.25 768Cauliflower 14.8 20.65 1 399Onions 71.5 35.68 499Total exports 135.2 126.93 940
Exports by major destinationSingapore 26.4 28.42 1 076Japan 24.2 37.77 1 560Malaysia 23.6 22.34 947
1995-96Asparagus 4.8 30.89 6 395Broccoli 8.2 17.61 2 149Carrots 42.6 28.73 675Cauliflower 18.9 24.38 1 293Onions 56.0 22.83 407Total exports 130.5 124.43 953
Exports by major destinationMalaysia 33.8 28.55 846Singapore 25.1 26.22 1 046Japan 19.7 40.37 2 048
1996-97Asparagus 5.2 30.38 5 830Broccoli 7.9 16.14 2 035Carrots 44.8 30.34 678Cauliflower 19.3 25.17 1 304Onions 37.0 11.48 310Total exports 114.2 113.50 994
Exports by major destinationMalaysia 35.2 31.35 891Singapore 23.9 24.74 1 035Japan 10.6 31.78 3 011
121Australian horticulture
VEGETABLES
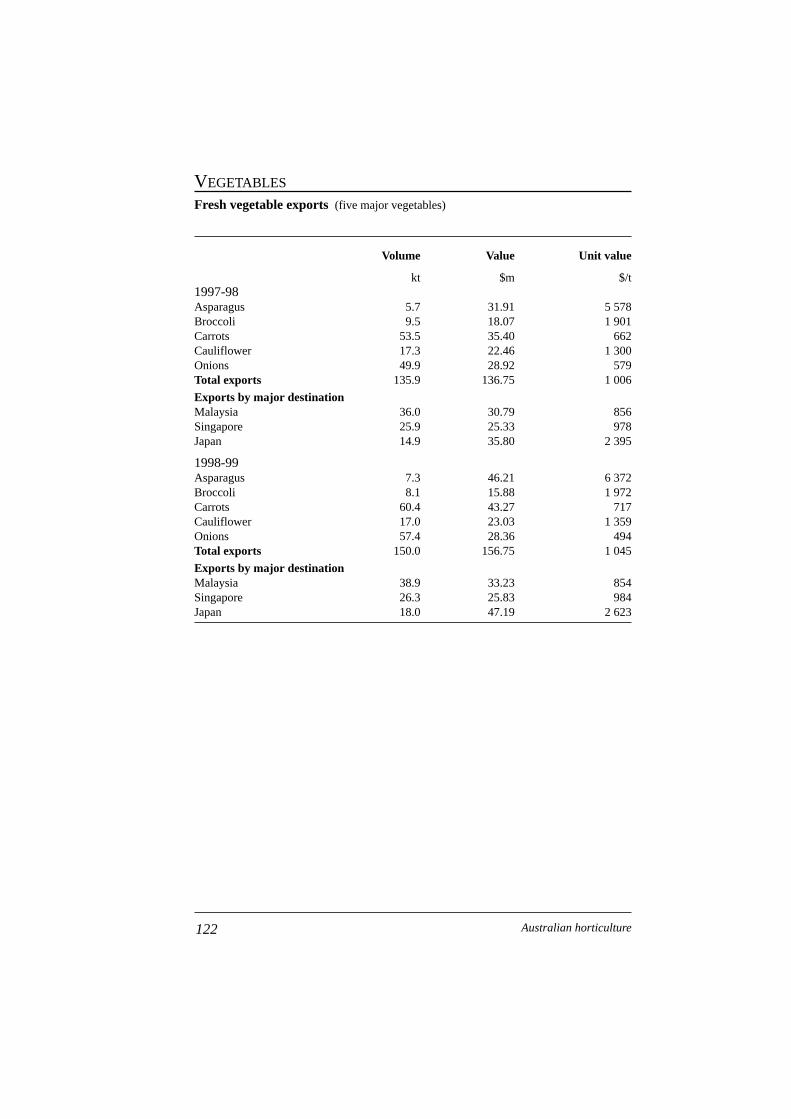
Fresh vegetable exports (five major vegetables)
Volume Value Unit value
kt $m $/t1997-98Asparagus 5.7 31.91 5 578Broccoli 9.5 18.07 1 901Carrots 53.5 35.40 662Cauliflower 17.3 22.46 1 300Onions 49.9 28.92 579Total exports 135.9 136.75 1 006
Exports by major destinationMalaysia 36.0 30.79 856Singapore 25.9 25.33 978Japan 14.9 35.80 2 395
1998-99Asparagus 7.3 46.21 6 372Broccoli 8.1 15.88 1 972Carrots 60.4 43.27 717Cauliflower 17.0 23.03 1 359Onions 57.4 28.36 494Total exports 150.0 156.75 1 045
Exports by major destinationMalaysia 38.9 33.23 854Singapore 26.3 25.83 984Japan 18.0 47.19 2 623
122 Australian horticulture
VEGETABLES
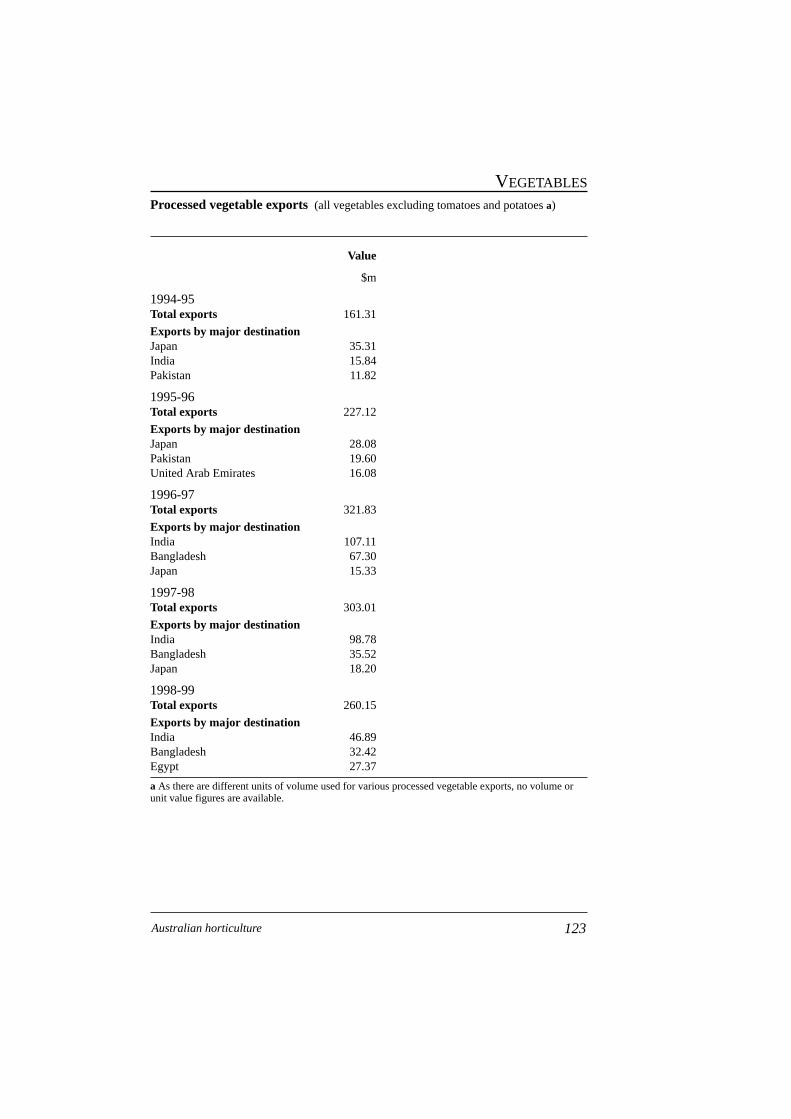
Processed vegetable exports (all vegetables excluding tomatoes and potatoes a)
Value
$m
1994-95Total exports 161.31
Exports by major destinationJapan 35.31India 15.84Pakistan 11.82
1995-96Total exports 227.12
Exports by major destinationJapan 28.08Pakistan 19.60United Arab Emirates 16.08
1996-97Total exports 321.83
Exports by major destinationIndia 107.11Bangladesh 67.30Japan 15.33
1997-98Total exports 303.01
Exports by major destinationIndia 98.78Bangladesh 35.52Japan 18.20
1998-99Total exports 260.15
Exports by major destinationIndia 46.89Bangladesh 32.42Egypt 27.37
a As there are different units of volume used for various processed vegetable exports, no volume orunit value figures are available.
123Australian horticulture
VEGETABLES
References
ABARE 1998, Australian Citrus Industry and Government Assistance,Current Issues 98.2, Canberra.
—— 1999, WTO Agricultural Negotiations: Important Market Access Issues,ABARE Research Report 99.3, Canberra.
ABS (Australian Bureau of Statistics) 1998, Value of Agricultural Com-modities Produced, cat. no. 7503.0, Canberra.
—— 1999, Agriculture, cat. no. 7113.0, Canberra.
Australian Horticultural Corporation 1999, Australian Horticultural StatisticsHandbook 1999/2000, Sydney.
—— 1998, Australian Horticultural Statistics Handbook 1997/1998, Sydney.
Australian Processing Tomato Industry Council 1999, Annual Industry Survey1999, Prepared by Barry Horn Consulting, Blackburn South, Victoria.
AQIS (Australian Quarantine and Inspection Service) 1999, PhytosanitaryDatabase: Japan, Canberra (http://netdeployment.aqis.gov.au/phyto/asp/country.asp?ID=615, November).
Council of Agriculture (Chinese Taipei) 1996, Agricultural Status and PolicyDevelopment in ROC on Taiwan 1996 (http://www.coa.gov.tw/english/index.html, 8 November).
Department of Foreign Affairs and Trade 1999, Trade Outcomes andObjectives Statement (http://www.dfat.gov.au/toos/toos1999a.pdf,November).
European Commission 1998, The Agricultural Situation in the EuropeanUnion, 1997 Report, Luxembourg.
—— 1999, Market Access Sectoral and Trade Barriers Database (http://mkaccdb.eu.int/mkdb/mkdb.pl?METHOD=COUNTRY, October).
124 Australian horticulture
FAO (Food and Agriculture Organisation) 1999, FAOSTAT database (http://apps.fao.org/lim500/nph-wrap.pl?Trade.CropsLivestockProducts&Domain=SUA, September).
Flower Export Council of Australia 1999, A Snapshot of AustralianFloriculture and Exports (http://www.iinet.net.au/~feca/industry.htm,September).
Horticultural Research and Development Corporation 1999, 1999-2000Business Plan, Canberra.
Howard, J. 1997, ‘Why open trade is critical to economic development’,Economic Reform Today, no. 3, p. 7.
MAF (Ministry of Agriculture and Forestry of the Republic of Korea) 1999,(http:// 152.99.166.2/eng/neweng/emaff.htm, 8 November).
MAFF (Ministry of Agriculture, Forestry and Fishery of Japan) 1998, AnnualReport on Japanese Agriculture FY 1998, (http://www.maff.go.jp/hakusyo/kaigai/ehakusyo.pdf, 8 November 1999).
Milgate, M. 1995, The Asian position, Unpublished paper.
Ministry of Agriculture (Indonesia), Food Crops and Horticulture Subsector:Development Policies and Opportunities (http://www.deptan.go.id/pelu-ang/eng-tph.html, 9 November).
National Farmers Federation 1997, Australian Agriculture, Morescope,Hawthorn East, Victoria.
Roberts, I., Podbury, T., Tielu, A., Vanzetti, D., Andrews, N., Mélanie, J.and Hinchy, M. 1999, Reforming World Agricultural Trade Policies,ABARE Research Report 99.12 and RIRDC Publication no. 99/96,ABARE, Canberra.
UNCTAD (United Nations Conference on Trade and Development) 1999,United Nations Trade Analysis and Information System, (http://cs.usm.my/cgi-bin/untrains/train6.pl, September).
125Australian horticulture
US Department of Agriculture 1996, The Federal Agriculture Improvementand Reform Act of 1996, Office of Communications, (http://www.usda.gov/farmbill/title0.htm, 8 November 1999).
—— 1997, Global Agriculture Information Network Report, no. IT9024Foreign Agricultural Service, Washington DC.
—— 1998, US and Competitor Expenditures on Export Promotion andExport Subsidies for Agricultural, Forestry and Fishery Products(http://www.fas. usda.gov/cmp/com-study/1997/compet97.PDF, 5November 1999).
—— 1999, Global Agriculture Information Network Report, no. CH9637Foreign Agricultural Service, Washington DC.
US State Department 1998a, Report on Economic Policy and TradePractices: China,(http://www.state.gov/www/issues/economic/trade_reports/eastasia98/china98.html, November 1999).
—— 1998b, Report on Economic Policy and Trade Practices: Taiwan(http://www.state.gov/www/issues/economic/trade_reports/eastasia98/taiwan98.html, November 1999).
——1998c, Report on Economic Policy and Trade Practices: Malaysia,(http://www.state.gov/www/issues/economic/trade_reports/eastasia98/malaysia98.htm, November 1999).
—— 1998d, Report on Economic Policy and Trade Practices: South Korea(http://www.state.gov/www/issues/economic/trade_reports/eastasia98/korea98.html, November 1999).
126 Australian horticulture