australian benchmark 2014 - fujitsu€¦ · au itsx 2014 au itsx 2012 australia itsx by index...
TRANSCRIPT

ICT Sustainability:
AustralianBenchmark2014

Opening Comment
Dermot O’Gorman,CEO WWF-Australia
2
A few weeks ago the Intergovernmental Panel on Climate Change, the IPCC, handed down its Fifth Assessment Report on the science behind global warming and the impacts on the planet. The report which represents the work of almost 2000 scientists, is based on over 31000 scientific references. It has been reviewed by 195 member governments before being published and the results are clear: Global warming is real, it is happening now and it is being caused by human activity. Namely through the burning of fossil fuels for energy and rapid deforestation across the globe.
Global warming impacts now threaten our oceans, forests and river systems; food and water security; and even human lives and livelihoods. And of course it will impact the plants, animals and eco-systems that many of us hold dear, including, here in Australia, the mountain pygmy possum, Carnaby’s black cockatoo, the western swamp tortoise, rock-wallabies and marine turtles and the iconic Great Barrier Reef.
We still have time to take action, keep global warming under two degrees Celsius and avert the worst impacts of climate change. However, only if we act quickly and decisively to ensure that carbon emissions peak by 2020 and then start to rapidly decline. An accelerated focus on energy efficiency has been identified as one of the cornerstones of action needed to prevent global warming. The International Energy Agency notes that improvements in energy efficiency are still not happening fast enough. Over the past ten years, global energy intensity reduced by 1.6% per year; but the rate of improvement needs to increase to 2.9% per year until 2035. This is why reports such as this one are so important.
This report provides a unique, research-based perspective on the sustainability of the Australian ICT sector and also offers practical guidance on improvements that organisations can make. In amongst a range of suggested sustainability improvements, energy efficiency stands out as a quick and profitable win that can provide lasting positive impacts for organisations and also the planet. In addition the ICT sector in Australia and globally will need to move quickly on decarbonising its energy supply.
Fujitsu should be congratulated on demonstrating leadership in this area by providing clear benchmarking and also guidance on solutions. This report should be required reading. Not just for CIOs and CEOs, but for anyone who has an interest in how a more sustainable and energy efficient ICT sector can help avoid the worst impacts of global warming and make a positive contribution to the sustainability of the Earth and all its inhabitants.
Dermot O’GormanCEO WWF-Australia
© Laurent Desarnaud - WWF-Australia

3
Foreword
Rob Stokes,NSW Environment Minister
Information and communications technology is one of the world’s fastest growing energy consumers. Explosive growth in devices, data and the need to stay connected have seen a corresponding increase in energy demand, which also means a greater challenge when it comes to emissions.
I welcome this report from Fujitsu, which provides an in-depth insight into sustainability and energy efficiency in ICT. This report shows there is much ICT leaders can do to help reduce the environmental impact of their industry, while also saving energy and reducing costs.
Fujitsu has been a true partner in the NSW Government’s efforts to cut emissions and encourage energy efficiency. As part of a technical working group, the company’s advice has been integral in helping to create the world leading NABERS Energy for data centres benchmarking tools. By championing their use, Fujitsu is contributing to these robust tools becoming the industry standard.
The NSW government is taking firm measures to reduce its ICT emissions by:
NSW is also strengthening the energy efficiency markets for households, businesses and government through our comprehensive Energy Efficiency Action Plan. The plan includes a number of practical support mechanisms, such as the Energy Saver program which assists business to reduce their energy consumption and costs, and the Energy Savings Scheme, which provides incentives for organisations to be more efficient.
I congratulate Fujitsu for showing leadership in this important area and I look forward to working together in the future to realise our shared goals.
■ setting high NABERS targets for government owned data centre infrastructure and ICT equipment in its recently released Government Resource Efficiency Policy, and
■ consolidating its numerous smaller data centres into two highly efficient enterprise class data centre facilities.

A Message from Mike FosterWell into the second decade of this new millennium, businesses are facing a number of global issues that are significantly redefining the landscape in which they compete. Sustainability has become perhaps one of today’s most pressing social issues, and is now a commonly used term in contemporary business lexicon. And justifiably so.
The world population of 7.2 billion (in mid-2013) is projected to increase by almost one billion people within the next twelve years - and even further to 9.6 billion by 2050. A disconcerting thought considering we are already rapidly reaching the limits of our planet’s growth. Greenhouse Gas (GHG) emissions cease to slow as China and India expand at unbridled rates, biodiversity loss continues and food scarcity and natural disasters are becoming all the more prolific. Factoring an ever growing population into this dire mix is making for one lethal cocktail. We are fast reaching the critical tipping point that will put our current way of life and our future society at risk.
Adding fuel to the fire is the growth of ICT. The proliferation of smart mobile devices, data and our incessant need to be connected 24/7 have resulted in the ICT industry undergoing exponential growth in recent years with no signs of slowing. It is now estimated that ICT as an industry is responsible for around 3% of the world’s total global emissions. While this may seem insignificant, to put these figures in perspective, ICT’s emissions are comparable to those of the total global aviation industry or the total annual emissions of Australia, New Zealand and Indonesia combined. Further, given current growth rates, experts estimate total emissions will rise to 6% - or in some cases - 10% by 2020. At 10% our emission’s will be on par with the global aluminium smelting or cement production industries and India or Russia are added to the aforementioned list. In short, ICT’s impact on the environment is of growing concern.
As advances in technology grow stronger by the minute, so too is our capacity to help bridge the gap between IT and sustainability. At Fujitsu our global vision is to provide a “Human Centric Society”. That is, to harness the power of ICT to the benefit of society as a whole. As part of this wider mission we take the view that it is both our obligation to: reduce and ultimately reverse our current 3% share of emissions and: play a pivotal role in driving down the remaining 97% of emissions through ICT enabling technology. No longer will ICT be a contributor to emissions, but it will become a key enabler going forward enabling business and society to develop and grow while driving down the ultimate impact we as humans have on the environment.
With this in mind it gives me great pleasure to introduce to you the Australian ICT Sustainability Benchmark Report. This is the fourth edition of its kind and our objective is simple: To highlight to industry key areas in IT where performance and efficiency improvements are required and outline actions that we need to take to play our role in sustainability.
Limits to Growth and Global Capacity (Fujitsu Group Sustainability Report 2013)
4

As a final remark, we have seen at first hand while working with our customers, how bringing both the IT and Sustainability or Environment teams together can provide businesses with a powerful platform for success in ICT Sustainability. Accordingly, in addition to highlighting results and key figures, this report is also intended to serve as a practical guide and collaborative resource for both your IT and Sustainability departments with everyday application and inspiration. Throughout the report youwill find a number of expert quotes, helpful tips and advice and quick wins businesses can start implementing today to achieve both improved efficiency and competitive gains. Why are we waiting? We have the insight right now to start making a simple yet profound difference and the time to act is now.
Mike FosterChief Executive OfficerFujitsu Australia and New Zealand Limited
This report takes a critical look at all the key areas of the ICT supply chain. From Lifecycle Management, the Data Centre, End User Computing and Metrics, to how we measure and manage performance and ICT energy use, we’ve taken a whole systems view. It is an extensive piece of research lead by our experienced Sustainability team and involved interviews and surveys from 200 CIO’s and IT leaders across the country. Although this is our forth such report this is the first time we have ever taken a deep dive into Australia. We’ve also integrated Technology Enablement into this model - an exciting emerging area that looks at how we are utilising technology to support other parts of the business and in other industries. The use of teleconferencing to reduce travel and smart meters for energy monitoring are two modest examples of ICT enablers that reduce environmental load, all while enabling business to harness significant competitive benefits.
Unfortunately this report shows that advances in these areas are somewhat stalled and that our industry is not taking full advantage of the key opportunities that ICT Sustainability presents to organisations. There is a lot of opportunity to improve, and the aim of this report is therefore to encourage industry to lift the bar, shine the spotlight on what needs to be done and also promote the areas of excellence.
5

6
“The ICT Sustainability Benchmark report is so much more than a report, it’s a great tool that allows organisations tofundamentally shift their approach to sustainable IT, for the better of their organisation and the planet.”Glen McLatchie – General Manager ICT, Meridian Energy Limited
About the Cover Photo:Heart Reef is a natural composition of coral that lies in Australia’s Great Barrier Reef Marine Park in Queensland. The reef is one of Australia’s national icons which spans 345,000 km2 which is larger than the entire area of the UK and Ireland. In recent years climate change has been identified as the most serious threat to the future of the reef.
Report GuideThis report consists of five key areas covered by ICT Sustainability being End User Computing, Equipment Lifecycle (Procurement and Disposal), Enterprise and Data Centre, Technology Enablement and Metrics. Under each section we have the Australian ICT Sustainability Index Score for that component, known as the ITSx, along with summary comments and trends. Also included are expert insights, focus areas and quick wins supported by industry commentary and examples. The objective of this report is not only to present the results of this survey but to also act as a practical guide for both the IT and Sustainability departments within organisations.

Australian Commentary
50.1
51.7
38.6
50.1 51.7
0 10 20 30 40 50 60 70 80 90 100
Lifecycle
End User
Enterprise
Enablement
Metrics
ITSx
AU ITSx 2014 AU ITSx 2012
Australia ITSx by Index Component 2014 vs 2012
46.0 40.2
59.6 50.6
51.4 56.4
48.6 50.7
51.3 52.6
Overall the 2014 Australian ICT Sustainability Benchmark study has produced an interesting set of results for Australia. The most interesting fact drawn from the 2014 ICT Sustainability Index is the emphasis that many industries are now placing on the innovative use of ICT to achieve greater efficiencies, and hence better emissions management to tackle climate change. Every industry sector has shown some improvement, some by a little, such as Heavy Industry, and some by a great deal as is the case for the Financial sector. Overall, the Enablement metric has improved by 118% on the 2012 result. An additional highlight is the improvement in the area of Metrics with the majority of industry sectors showing improvements. ICT sustainability, and in fact all sustainability initiatives, start with measurement. While we have all heard Peter Drucker’s famous slogan “what gets measured, gets managed”, this mantra could well be ‘measure, monitor, manage, and mitigate’ when it comes to ICT performance. In the 2 years since the previous ICT sustainability study it would appear that industry is now starting to apply these mantras.
The ICT Sustainability Index has 5 component. Three relate to technologies including End User, Enterprise and Lifecycle, plus Enablement and Metrics, reviewed above. It is unfortunate to see that some of the gains in technology management have been lost over the past 2 years, with all the gains achieved in Enablement (i.e. ‘applied technologies’) and Metrics. The majority of these losses have occurred within the Enterprise metrics, which includes data centres. One could speculate that the advent of both Cloud services and a more competitive hosting market have resulted in the CIO reducing their attention on data centre improvements. Therefore losses across technologies have been offset against gains in ICT management, with the net result being a positive 3% improvement in the ICT Sustainability Index.
7

8
Australia Key Numbers AT A GLANCE
NUMBER OF RESPONSES AVERAGE ITSx SCORE FOR AUS
51.7
54.9
43.1
200
BEST INDUSTRY
LOWEST INDUSTRY
LOWEST INDUSTRY
HIGHEST INDUSTRY
LOWEST ORGANISATION SCORE
HIGHEST ORGANISATION
SCORE
HAVE RESPONSIBILITY FOR ICT POWER
BILLS
HAVE NEVER THOUGHT ABOUT THEIR ICT POWER
BILL
AVERAGE ITSx SCORE FOR ORGANISATIONS THAT:
DIFFERENCE IN ITSX SCORE BETWEEN THOSE WITH NO IDEA ABOUT THEIR ICT POWER
CONSUMPTION AND THOSE THAT MEASURE AND BUDGET FOR IT
? 62.533.965.2
65.2
Government
Metrics -Heavy Industry
Enablement - Wholesale Retail,
Logistics
Heavy Industry
65.2
85.5 12.2
36.3
9
End User Computing
Overall ITSx: 48.6 Overall Score Card: D
Australia Sector Leader: Finance / Business Services ITSx: 57.3 Score: C+
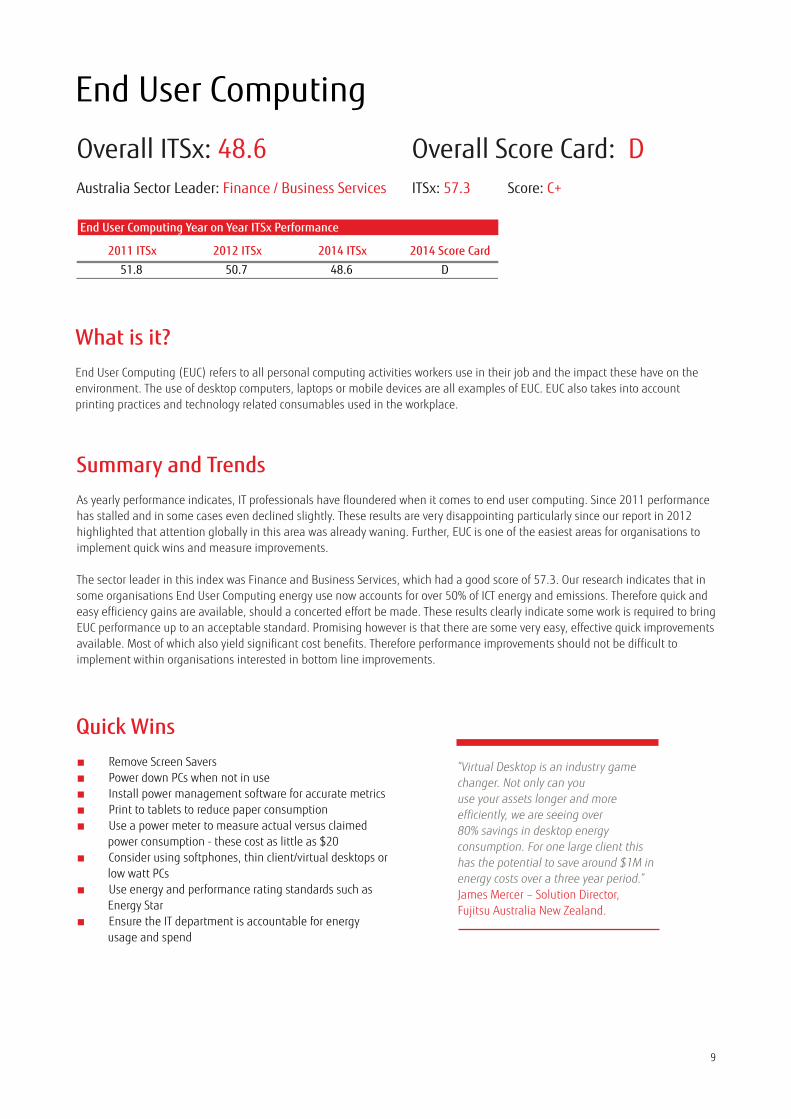
2011 ITSx 2012 ITSx 2014 ITSx 2014 Score Card51.8 50.7 48.6 D
End User Computing Year on Year ITSx Performance
What is it? End User Computing (EUC) refers to all personal computing activities workers use in their job and the impact these have on the environment. The use of desktop computers, laptops or mobile devices are all examples of EUC. EUC also takes into account printing practices and technology related consumables used in the workplace.
Summary and Trends As yearly performance indicates, IT professionals have floundered when it comes to end user computing. Since 2011 performance has stalled and in some cases even declined slightly. These results are very disappointing particularly since our report in 2012 highlighted that attention globally in this area was already waning. Further, EUC is one of the easiest areas for organisations to implement quick wins and measure improvements. The sector leader in this index was Finance and Business Services, which had a good score of 57.3. Our research indicates that in some organisations End User Computing energy use now accounts for over 50% of ICT energy and emissions. Therefore quick and easy efficiency gains are available, should a concerted effort be made. These results clearly indicate some work is required to bring EUC performance up to an acceptable standard. Promising however is that there are some very easy, effective quick improvements available. Most of which also yield significant cost benefits. Therefore performance improvements should not be difficult to implement within organisations interested in bottom line improvements.
Quick Wins■ Remove Screen Savers ■ Power down PCs when not in use■ Install power management software for accurate metrics■ Print to tablets to reduce paper consumption■ Use a power meter to measure actual versus claimed power consumption - these cost as little as $20■ Consider using softphones, thin client/virtual desktops or low watt PCs■ Use energy and performance rating standards such as Energy Star ■ Ensure the IT department is accountable for energy usage and spend
“Virtual Desktop is an industry game changer. Not only can you use your assets longer and more efficiently, we are seeing over 80% savings in desktop energy consumption. For one large client this has the potential to save around $1M in energy costs over a three year period.” James Mercer – Solution Director, Fujitsu Australia New Zealand.

10
End User ComputingIn Focus: Power Management One simple area that can yield almost immediate return on investment (ROI) is power management. However a key issue our findings reveal is that IT managers have no incentive to improve EUC performance when they are not responsible for the organisation’s power management budget. We refer to this as the split incentive problem: “Why should the IT department invest in power management when we don’t pay the bill or reap the benefits?” Addressing this issue will see significant improvementsin this area.
“In 2012 networked devices grew globally by two billion to reach a total of 12 billion and rapid growth is expected to continue”.(Connecting with a Low Carbon Future, Telstra 2014)
End User Computing ITSx by Industry Sector, 2014
AU ITSx 2014 Index Average
AU ITSx 2014 Individual Leader
Wholesale / Retail / Logistics
Government
IT / Comms / Media
Finance / Business Services
Heavy Industry
0 10 20 30 40 50 60 70 80 90 100
48.6
90.4
57.3
52.2
42.0
48.0
38.2
Expert’s Opinion (Connection Research Insights)Developing energy efficiency at the desktop is considered to be a ‘low hanging fruit’ for ICT Sustainability. Most corporations have likely undertaken at least one technology refresh or upgrade of EUC since the onset of the “Green Debate” five years ago and there are significant opportunities for companies and Government agencies to fully resolve power utilisation for the End User. Accordingly, it is disappointing to see a reduction in efforts in this area.
The ideal solution, which is also very easy to implement, is to install power management software across all networked devices. There are many solutions to choose from, both international and local, and for the most part, the cost savings will offset the technology costs. Yet, in the event that IT departments are reluctant to implement yet another project, irrespective of the positive outcomes, the standard desktop does come with a suitable set of tools to also help increase efficiency. This basic requirement involves liaising with the procurement department to acquire the most energy efficient devices, implement a recycling program, and then configure the company-wide Standard Operating Environment (SOE) to accommodate energy efficiencies. These measures alone would address 50% of the potential opportunities to enhance efficiency at very little cost.
The more advanced wave of technology solutions entails the implementation of desktop virtualisation architected to accommodate a “Bring Your Own Device” (BYOD) type solution. While there is still much debate being waged in the ICT world around which approaches are best for End User computing, there is simply little justification for corporations to have reduced their efforts in this area. It is a surprising and disappointing result all round.

11
Nij Smellinghe, a Dutch Hospital, found the employees were in the habit of leaving PCs on overnight. With a goal of operating with minimal impact to the environment, the IT department wanted to address this practice in order to curb all unnecessary energy consumption. While employees were encouraged to power down their PCs after use, the hospital found that behavioural changes were only yielding modest outcomes. Accordingly, the hospital investigated a technology solution that could help Nij Smellinghe both better understand its IT energy consumption and identify opportunities to reduce its consumption in order achieve its energy goals. By implementing Cisco's energy management solution, EnergyWise, the hospital saw immediate results in energy savings and reduced carbon emissions to a level far beyond its initial expectations.
According to Jan Pieter Evenhuis, Nij Smellinghe's IT Consultant, the Cisco Energy Manager solution delivered far more energy management capabilities than they thought possible. "It is easy to deploy and easy to use. Best of all it is making a positive impact on Nij Smellinghe’s initiatives to reduce energy consumption and costs while supporting the hospital’s main goal of providing outstanding patient care.” Since implementing the software the hospital has enjoyed savings of over 30% in their ICT energy costs. The technology solution was also able to be extended to improve the energy performance of the hospital's IP phones, printers and other devices with an IP address to realise additional savings. What's more, Cisco's EnergyWise system has continued to raise awareness of energy conservation among Nij Smellinghe's employees helping improve the hospital’s energy ratings to an even greater level.
Case Study: Cisco EnergyWise
12
What Is It? Lifecycle looks at how we procure, use and dispose of ICT assets. Using the right equipment and utilising standards such as Energy Star and EPEAT can achieve significant savings. eWaste is a major global environmental issue that can pollute our waterways and cause major intergenerational health issues. Lifecycle management is a key area that needs to be taken seriously if organisations are serious about enhancing their sustainability performance and reducing their environmental burden.
Overall ITSx: 51.3 Overall Score Card: C
Australia Sector Leader: Public Sector ITSx: 54.1 Score: C
Equipment Lifecycle Procurement and Disposal
Lifecycle Year on Year ITSx Performance
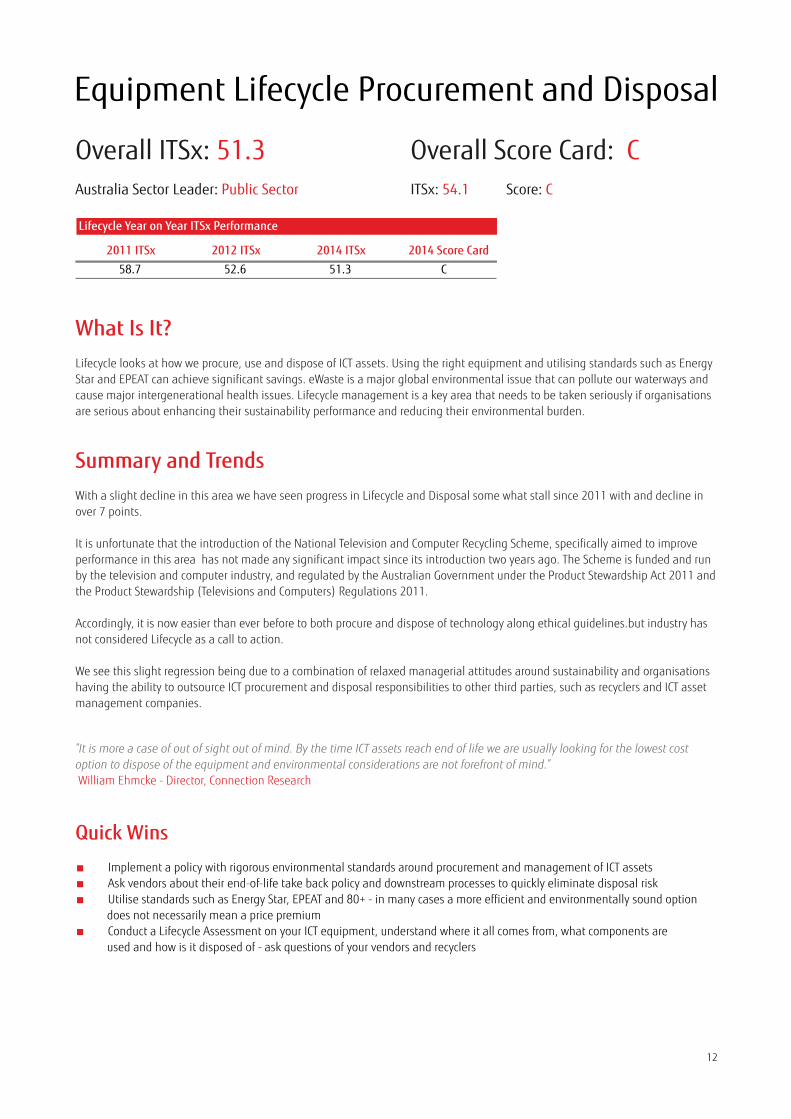
2011 ITSx 2012 ITSx 2014 ITSx 2014 Score Card58.7 52.6 51.3 C
Lifecycle Year on Year ITSx Performance
Summary and Trends With a slight decline in this area we have seen progress in Lifecycle and Disposal some what stall since 2011 with and decline in over 7 points.
It is unfortunate that the introduction of the National Television and Computer Recycling Scheme, specifically aimed to improve performance in this area has not made any significant impact since its introduction two years ago. The Scheme is funded and run by the television and computer industry, and regulated by the Australian Government under the Product Stewardship Act 2011 and the Product Stewardship (Televisions and Computers) Regulations 2011.
Accordingly, it is now easier than ever before to both procure and dispose of technology along ethical guidelines.but industry has not considered Lifecycle as a call to action.
We see this slight regression being due to a combination of relaxed managerial attitudes around sustainability and organisations having the ability to outsource ICT procurement and disposal responsibilities to other third parties, such as recyclers and ICT asset management companies.
Quick Wins
■ Implement a policy with rigorous environmental standards around procurement and management of ICT assets■ Ask vendors about their end-of-life take back policy and downstream processes to quickly eliminate disposal risk■ Utilise standards such as Energy Star, EPEAT and 80+ - in many cases a more efficient and environmentally sound option does not necessarily mean a price premium■ Conduct a Lifecycle Assessment on your ICT equipment, understand where it all comes from, what components are used and how is it disposed of - ask questions of your vendors and recyclers
“It is more a case of out of sight out of mind. By the time ICT assets reach end of life we are usually looking for the lowest costoption to dispose of the equipment and environmental considerations are not forefront of mind.” William Ehmcke - Director, Connection Research

13
Equipment Lifecycle Procurement and Disposal
In Focus: Exporting the Problem
“For those clients who don’t have an eWaste policy I simply show them the SBS video clip and ask one question. What would be the impact to your business if the eWaste found in places like Ghana had your asset register tag on it?”Lee Stewart - Head of Sustainability, Fujitsu Australia and New Zealand
In Focus: What is EPEAT?The Electronic Product Environmental Assessment Tool (EPEAT) is a comprehensive global environmental rating system that helps purchasers identify environmentally friendly and efficient computers and electronics. The tool takes into account several categories of environmental attributes when rating electronic products. These include: ■ Reduction or elimination of hazardous materials■ Material selection■ Design for end-of-life■ Product longevity/life extension■ Energy conservation■ End-of-life management■ Corporate performance■ Packaging
Equipment Lifecycle ITSx by Industry Sector, 2014
AU ITSx 2014 Index Average
AU ITSx 2014 Individual Leader
Wholesale / Retail / Logistics
Government
IT / Comms / Media
Finance / Business Services
Heavy Industry
0 10 20 30 40 50 60 70 80 90 100
51.3
89.3
25.6
42.0
47.1
53.7
54.1
46.3
47.3
52.7
“Over their lifetime, the 647 million EPEAT-registered electronics purchased globally since 2006, will deliver significantenvironmental benefits. Compared to products not meeting EPEAT criteria, these electronics will result in the reduction of morethan 463,000 metric tons of hazardous waste, the elimination of enough mercury to fill 3.5 million fewer thermometers, andwill reduce solid waste by the equivalent of 164,000 U.S. households’ annual waste.” (www.epeat.net)
In 2011 Australian broadcaster SBS exposed the issue of exporting Australian eWaste to Ghana. Described as “eWaste Hell” this piece of investigative journalism exposed the practices of exporting unprocessed eWaste disguised as repairs. Not only is this practice extremely unethical it hasalso caused significant brand and reputational damage to the Australian companies involved.
Expert’s Opinion (Connection Research Insights)Lifecycle management for ICT equipment simply makes good sense. It consists of three basic phases: Procurement, Disposal and Compliance. The key drawcard for addressing Lifecycle initiatives is that they rarely require new budget, and more often than not simply require a re-allocation of existing resources. Many companies are blind to the hidden asset value of old end of life computing assets, both hardware and software through on-selling or refurbishing for new markets.
There has been a steady decline in the measures associated with the Lifecycle metric. This comes at a time when the recycling industry has been developing and maturing. Therefore the IT department may be failing due to a lack of clear corporate direction rather than the removal of previous best practices.

14
Enterprise and Data Centre
Overall ITSx: 51.4 Overall Score Card: C
Australian Sector Leader: Wholesale / Retail / Logistics ITSx: 62.3 Score: C+
2011 ITSx 2012 ITSx 2014 ITSx 2014 Score Card56.7 56.4 51.4 C
Enterprise Year on Year ITSx Performance
10 Data Centre Quick Wins■ Install light sensors in Data Halls – don’t pay for lighting 24/7 when people are not there■ Install rack blanking panels and side brushes – improves rack airflow and takes only a few minutes to install■ Increase Data Hall temperature - refer to ASHRAE standards for guidance, check equipment and importantly increase the temperature in small increments■ Use heat reflective paint on roofs■ Increase chiller flow and return temperatures - usually set at 6/12 degrees (Celsius), these should be reviewed and can be raised to 10/15 degrees■ Use adjustable floor vents to improve cooling and air flows ■ Repair and plug any leaks in Data Halls - up to 25–30% more energy is wasted through “leaked cooling”*■ Install under-floor pressure control systems ■ Implement Cold / Hot aisle containment■ Be more informed - review educative guidelines such as Green Grid, EU Code of Conduct, and the Australian NABERS rating for Data Centres
*Data Centre talk, Daniel Prabhu, Mar 2012
What Is It? The Enterprise index looks at the associated sustainability performance of Data Centre operations in addition to the broader hosting environment of ICT infrastructure, Networks, Software Architecture. This index also looks at organisation’s adoption and readiness to outsourcing and cloud applications.
Summary and Trends Enterprise and Data Centre sustainability performance has taken a definite backwards step over the past two years. The below par scores are disappointing considering the significant impact these operations have on the environment, and given that efficiency gains in enterprise management are almost always coupled with lucrative financial paybacks through reduced energy costs. However, the low scores across all sectors in this area provide an exciting platform for future win-win sustainability improvements from which businesses can now build. It is possible that the decline in Enterprise and Data Centre performance is due to the promotion of cloud and new hosting services that have prompted CIOs to refrain from further investment with existing data centres. With advancements in cloud platforms rapidly changing the data centre services landscape, data centres of tomorrow will look very different than those of 2012. For example, in 2012 cloud hosting such as Amazon Web Services did not exist. Today it has revolutionised software delivery processes. While data centre services is a rapidly evolving and changing landscape, there is no justification for corporate complacency nor a reason for CIOs to overlook proven ICT practices that clearly aid sustainability.

15
Enterprise and Data Centre
PUE =Total Facility Energy
IT Equipment Energy
“NABERS rating for Data Centres is a comprehensive and trusted assessment that provides our customers with validation of ourapplication of best practices in this area.” Mike Foster CEO Fujitsu Australia New Zealand.
In Focus: NABERS Energy for Data Centre Rating The National Australian Built Environment Rating System (NABERS) is a Government run programme for rating the sustainability of building operations. Renowned for their independence and rigour, NABERS ratings has already developed a strong, reputable foothold in Australia’s office and shopping centre markets.
Today, 77% of all offices across the Australian market are now rated with NABERS Energy, and tenants are increasingly demanding minimum NABERS performance standards. This has helped to drive a remarkable energy efficiency revolution across this sector. Last year, NABERS released a new tool developed in partnership with industry – NABERS Energy for Data Centres. Based on twelve months of energy bills, the core rating is based on Power Usage Effectiveness (PUE) and is measured using a clear, objective and strict set of guidelines. This makes the NABERS standard not only considerably more robust than traditional ways of measuring PUE, but it also gives data centre customers a significantly more accurate insight into their probable energy costs. Director of the Metropolitan Branch of the Office of Environment, Mr. Tom Grosskopf, says “the NABERS protocols for collecting and analysing data are proven and trusted across the property industry. As a data centre customer, if you want an accurate insight into how efficiently your provider is using their energy, accept no substitute.”
In Focus: What is PUE? Power usage effectiveness (PUE) is a measure of how efficiently a data centre uses energy. It is a contrast ratio between the total amount of energy used by the facility, to the energy delivered to computing equipment. The perfect PUE is 1.0. That implies all energy going into the data centre is used for the computing load and there is no need for cooling, lighting and power back up etc. A good PUE rating for organisations is about 1.6 which rates 4 stars on the National Australian Built Environment Rating System (NABERS) energy efficiency rating.

16
Enterprise and Data Centre
Enterprise and Data Centre ITSx by Industry Sector, 2014
AU ITSx 2014 Index Average
AU ITSx 2014 Individual Leader
Wholesale / Retail / Logistics
Government
IT / Comms / Media
Finance / Business Services
Heavy Industry
0 10 20 30 40 50 60 70 80 90 100
51.4
96.0
53.7
46.9
37.3
53.3
62.3
Expert’s Opinion (Connection Research Insights)
The data centre offers one of the greatest opportunities for improved energy efficiencies and has been the most widely researched and analysed aspect of ICT Sustainability. The challenge is one of ‘turning the ship after it has left the dock’. The technology lifecycles in Data Centres are considerably longer than other aspects of ICT, and this is especially pertinent to the base building data centre environment. Replacing HVAC and cooling infrastructure in existing Data Centres is a substantial task at considerable expense.
In parallel with the ICT Sustainability movement, there has been the massive growth in outsourced and newly built data centre facilities. Comparative to existing builds, new facilities have a considerably better PUE as well as the ability to negotiate fixed PUE contracts. Enterprise ICT will continue to be a centre for energy efficiencies and much of the hard work can be easily outsourced.
In addition to the growth in third party facilities, major vendors in the data centre equipment sector now truly understand the energy efficiency paradigm shift, and have responded accordingly.
“72% of companies surveyed do not have a documented strategy for reducing energy use in the data center, although most agree that data center energy consumption is a real issue of concern.” (Green Grid)
“In 2013 alone, nearly 3 million computer rooms in the US used enough electricity to power all of the households in New York City for two years. This is equivalent to the annual output of 34 large coal-fired power plants. If just half of the savings potential from adopting energy efficiency best practices were realized, America’s data centers could slash their electricity consumption by as much as 40 percent. In 2014, this represents savings of $3.8 billion and 39 billion kilowatt-hours, equivalent to the annual electricity consumption of all the households in the state of Michigan.” (Natural Resources Defence Council, 2014)
17
Technology Enablement
Overall ITSx: 59.6 Overall Score Card: C+
Australian Sector Leader: Wholesale / Retail / Logistics ITSx: 65.2 Score: B
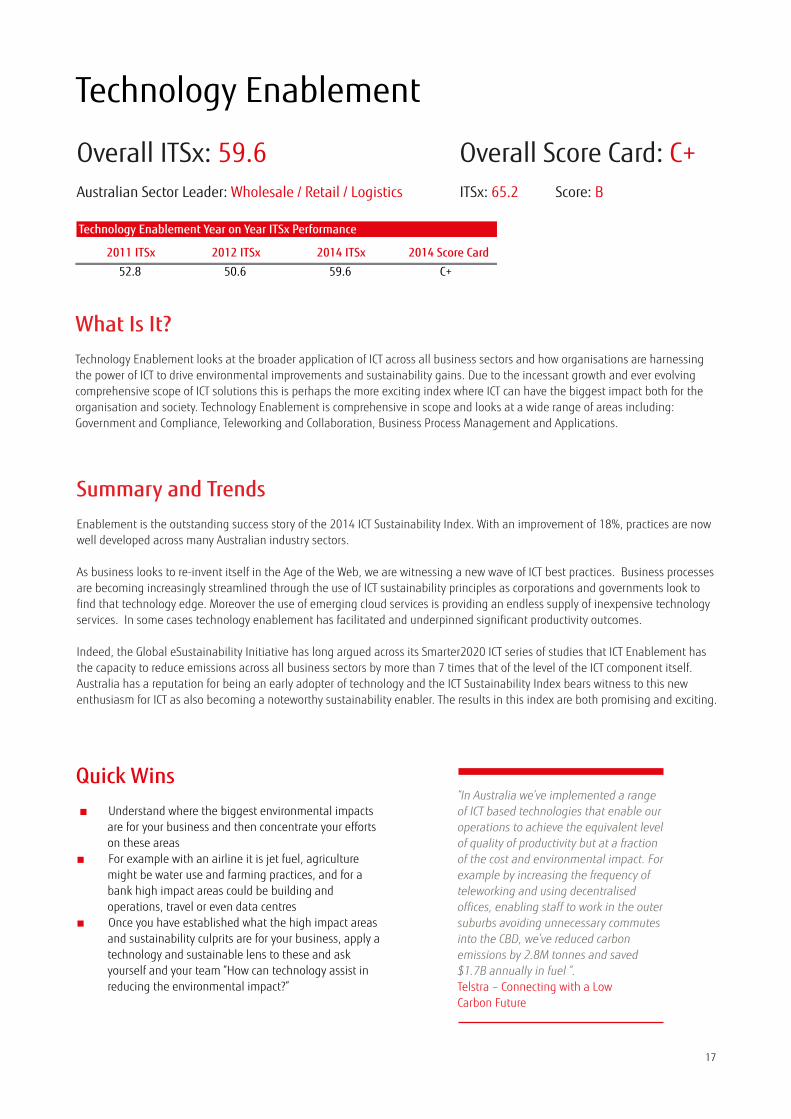
2011 ITSx 2012 ITSx 2014 ITSx 2014 Score Card52.8 50.6 59.6 C+
Technology Enablement Year on Year ITSx Performance
Quick Wins ■ Understand where the biggest environmental impacts are for your business and then concentrate your efforts on these areas ■ For example with an airline it is jet fuel, agriculture might be water use and farming practices, and for a bank high impact areas could be building and operations, travel or even data centres ■ Once you have established what the high impact areas and sustainability culprits are for your business, apply a technology and sustainable lens to these and ask yourself and your team “How can technology assist in reducing the environmental impact?”
“In Australia we’ve implemented a range of ICT based technologies that enable our operations to achieve the equivalent level of quality of productivity but at a fraction of the cost and environmental impact. For example by increasing the frequency of teleworking and using decentralised offices, enabling staff to work in the outer suburbs avoiding unnecessary commutes into the CBD, we’ve reduced carbon emissions by 2.8M tonnes and saved $1.7B annually in fuel ”. Telstra – Connecting with a Low Carbon Future
What Is It? Technology Enablement looks at the broader application of ICT across all business sectors and how organisations are harnessing the power of ICT to drive environmental improvements and sustainability gains. Due to the incessant growth and ever evolving comprehensive scope of ICT solutions this is perhaps the more exciting index where ICT can have the biggest impact both for the organisation and society. Technology Enablement is comprehensive in scope and looks at a wide range of areas including: Government and Compliance, Teleworking and Collaboration, Business Process Management and Applications.
Summary and Trends Enablement is the outstanding success story of the 2014 ICT Sustainability Index. With an improvement of 18%, practices are now well developed across many Australian industry sectors. As business looks to re-invent itself in the Age of the Web, we are witnessing a new wave of ICT best practices. Business processes are becoming increasingly streamlined through the use of ICT sustainability principles as corporations and governments look to find that technology edge. Moreover the use of emerging cloud services is providing an endless supply of inexpensive technology services. In some cases technology enablement has facilitated and underpinned significant productivity outcomes.
Indeed, the Global eSustainability Initiative has long argued across its Smarter2020 ICT series of studies that ICT Enablement has the capacity to reduce emissions across all business sectors by more than 7 times that of the level of the ICT component itself. Australia has a reputation for being an early adopter of technology and the ICT Sustainability Index bears witness to this new enthusiasm for ICT as also becoming a noteworthy sustainability enabler. The results in this index are both promising and exciting.

18
Technology Enablement
Technology Enablement ITSx by Industry Sector, 2014
AU ITSx 2014 Index Average
AU ITSx 2014 Individual Leader
Wholesale / Retail / Logistics
Government
IT / Comms / Media
Finance / Business Services
Heavy Industry
0 10 20 30 40 50 60 70 80 90 100
59.6
84.5
63.7
59.3
52.7
54.4
65.2
In Focus: Qantas Pilots using iPads
Expert’s Opinion (Connection Research Insights) Enablement is increasingly touted as the holy grail of ICT Sustainability. There have been countless studies into how ICT can be used for improved energy performance. Every aspect of a corporation’s business processes is available for ICT renovation and improved energy performance. The GeSI (Global eSustainability Initiative) report – Smarter 2020 presents a vision for a sustainable world through responsible ICT-enabled transformation and remains the most definitive and compelling study into the ICT Enablement opportunity. First conducted in 2009, the study concludes that ICT has a 7 to 1 improvement ratio in terms of its carbon reduction versus emitting potential. Whereby for every kilogram of CO2e emitted by ICT, ICT-enabled solutions have the potential to reduce total annual emissions by as much as 7 kilograms.
Technology Enablement presents a true unique opportunity for the IT department. Rather than senior management seeing ICT as a cost centre, ICT has the ability to be part of the enablement equation and add significant value to the business.
What may seem like a trivial behavioural change, last year Qantas pilots began using iPads in the cockpit instead of carrying 20kg of flight manuals. With the amount of flights made each year and the reduced weight of the manuals, Qantas calculated that this form of Technology Enablement enables the company to save$1.5M annually in jet fuel.

19
Metrics
Overall ITSx: 46.0 Overall Score Card: D
Australia Sector Leader: Finance and Business Services ITSx: 48.7 Score: D
2011 ITSx 2012 ITSx 2014 ITSx 2014 Score Card43.9 40.3 46.0 D
Metrics Year on Year ITSx Performance
Category % Respondents ITSxWe never thought about itWe never see our power bill. ICT power consumption is not measured separately and we have no idea how much we consumeWe never see our power bill, but we are told how much we consumeWe get a separate power bill for ICT, but it is not part of the IT budgetWe get a separate power bill for ICT, and it is part of the IT budgetWe are totally responsible for the power consumption of the ICT function
Visibility of ICT Power Bill, 2014
39% 33.9
37% 57.6
24% 62.5
What Is It? The famous adage coined by Peter Drucker “What get measured gets managed” is certainly no understatement in today’s world when we talk about performance and efficiency improvements across business. Metrics is one of the most important aspects of understanding your organisation’s ICT Sustainability. You simply can’t improve what you don’t measure. Metrics includes the very important practice of monitoring, measuring and managing the cost and consumption of ICT energy.
Summary and Trends Our results consistently show that organisations that have strong metrics perform better in terms of ICT Sustainability overall. Although 2012 indicated a reduction in efforts that lost ground has now been made up and, more importantly, exceeded. Companies are now coming to understand that sustainability is about behaviour and behaviour requires measuring and monitoring of performance to understand how to improve. The importance of measuring electricity consumption so as to monitor usage and cost is the first port of call. It is probable that electricity price increases over the past 2 years have prompted business to sit-up and pay more attention to their consumption patterns, helping to improve this index rating.
Metrics have not only proven to yield sustainability improvements, but those firms with metrics integrated into their operations also benefit from competitive cost savings. With this in mind there is only one direction for Australian firms to go in this space – up.
Do you know your ICT Energy? A key question asked in the survey and one that in the past has been important to organisations’ overall ICT Sustainability performance has been IT departments’ understanding and ownership of the ICT Energy bill.
Today 61% of organisations have separated out the electricity consumption for ICT, with 24% having budgetary responsibility. Not only does measurement lead to management, financial accountability generates responsible action. Between those corporations that have never thought of monitoring the ICT energy bill, we see close to a 30 point improvement in the ICT Sustainability index for organisations which do account for energy consumption.

20
Expert’s Opinion (Connection Research Insights) The lack of organisations exhibiting and implementing good metrics for ICT Sustainability continues to limit progress across all industry sectors. It appears that the lack of attention to detail is closely aligned with fiscal responsibility for energy costs. Unless the CIO is given a specific budget for electricity cost and consumption there will always be a limited justification for firms to measure and manage the resource better. This point is as true today as it was 5 years ago.
The probable cause for the poor score is likely attributable to the lack of clearly articulated corporate directions. The ICT agenda has maintained a full ‘dance card’ for many years, with key issues around security, the web and evolving business requirements. These issues have typically superseded the importance of prioritising sustainability monitoring. But every new technology implementation is an opportunity for improved sustainability. Those companies that started to measure the inputs to ICT 5 years ago are today’s leaders within the ICT Sustainability sector.
Further, while there is ample supply of readily available information on the subject of metrics and methods to collect data, there has been limited investment in data interpretation for sustainability and the benefits this data brings organisations. Therefore data is seen to be of limited usefulness. The immediate requirement to improve ICT sustainability outcomes is to invest in analysis skills that transform raw data into compelling business opportunities. Most ICT products today offer some level of data access and collection componentry. Today most hardware will report on energy consumption, along with a range of other statistics, all of which are useful for monitoring and improving performance management.
Knowing the benefits metrics bring, the CIO of tomorrow will require a greater level of analytical skills with ICT to manage and monitor a broad portfolio of technologies. Energy management can simply be another index across a new set of metrics required to maintain a diaspora of technology services. Integrating energy into the ICT budget and making IT managers accountable for their energy consumption would be a fruitful and winning starting point.
Metrics
Quick Wins■ Know your ICT energy use – the simple calculation shown on the next page will help you establish this ■ Work out ICT energy use per employee■ Use a power meter to test actual vs claimed power consumption – especially useful in the evaluation phase of buying new equipment■ Have a separate ICT Sustainability or Green IT budget■ Ensure IT managers are accountable and cognisant of energy consumption in the business■ Create environmental benchmarks for your company and specifically the IT department - measure these on a monthly basis■ Measure Data Centre PUE and also ask external providers
Best Practice Beyond Quick Wins ■ Take full ownership of your ICT energy budget - negotiate a deal with your CFO where you accurately measure your ICT energy baseline, start a full efficiency program and reinvest savings■ Delegate an Officer or Manager Responsible for ICT Sustainability■ Set ICT Sustainability KPI’s and Strategy■ Install ICT Energy Monitoring Software across all assets including the Data Centre■ Establish an acceptable sustainable performance policy. Where do you see your goals in two to five years? What steps do you need to take to get there? Measurable goals are the only way to measure progress
“If you only remember one thing from this report it is to know your ICT energy. Treat it like cash in your business, measure it, monitor it and control it. This one thing alone will drive efficiencies across other areas of not just ICT but also your whole organisation.” Lee Stewart - Head of Sustainability, Fujitsu Australia and New Zealand
21
Metrics
Metrics ITSx by Industry Sector, 2014
AU ITSx 2014 Index Average
AU ITSx 2014 Individual Leader
Wholesale / Retail / Logistics
Government
IT / Comms / Media
Finance / Business Services
Heavy Industry
0 10 20 30 40 50 60 70 80 90 100
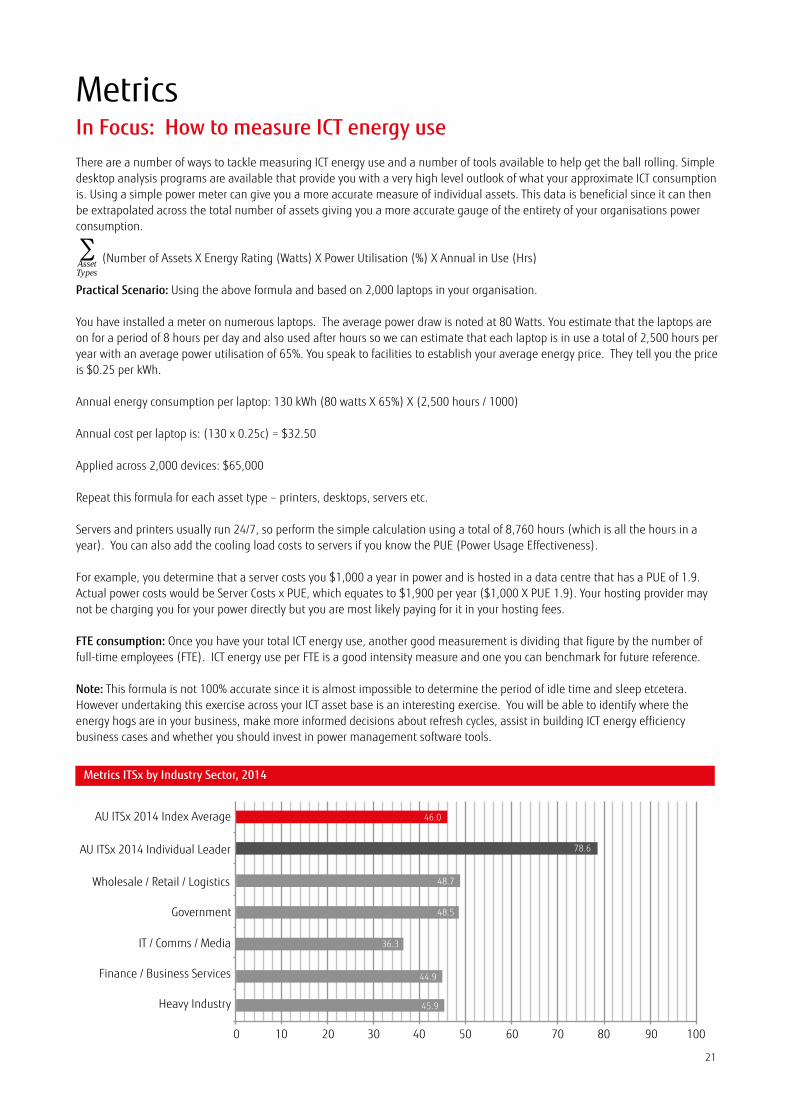
46.0
78.6
48.7
48.5
36.3
44.9
45.9
In Focus: How to measure ICT energy use There are a number of ways to tackle measuring ICT energy use and a number of tools available to help get the ball rolling. Simple desktop analysis programs are available that provide you with a very high level outlook of what your approximate ICT consumption is. Using a simple power meter can give you a more accurate measure of individual assets. This data is beneficial since it can then be extrapolated across the total number of assets giving you a more accurate gauge of the entirety of your organisations power consumption. (Number of Assets X Energy Rating (Watts) X Power Utilisation (%) X Annual in Use (Hrs)
Practical Scenario: Using the above formula and based on 2,000 laptops in your organisation.
You have installed a meter on numerous laptops. The average power draw is noted at 80 Watts. You estimate that the laptops are on for a period of 8 hours per day and also used after hours so we can estimate that each laptop is in use a total of 2,500 hours per year with an average power utilisation of 65%. You speak to facilities to establish your average energy price. They tell you the price is $0.25 per kWh.
Annual energy consumption per laptop: 130 kWh (80 watts X 65%) X (2,500 hours / 1000)
Annual cost per laptop is: (130 x 0.25c) = $32.50
Applied across 2,000 devices: $65,000
Repeat this formula for each asset type – printers, desktops, servers etc.
Servers and printers usually run 24/7, so perform the simple calculation using a total of 8,760 hours (which is all the hours in a year). You can also add the cooling load costs to servers if you know the PUE (Power Usage Effectiveness).
For example, you determine that a server costs you $1,000 a year in power and is hosted in a data centre that has a PUE of 1.9. Actual power costs would be Server Costs x PUE, which equates to $1,900 per year ($1,000 X PUE 1.9). Your hosting provider may not be charging you for your power directly but you are most likely paying for it in your hosting fees.
FTE consumption: Once you have your total ICT energy use, another good measurement is dividing that figure by the number of full-time employees (FTE). ICT energy use per FTE is a good intensity measure and one you can benchmark for future reference.
Note: This formula is not 100% accurate since it is almost impossible to determine the period of idle time and sleep etcetera. However undertaking this exercise across your ICT asset base is an interesting exercise. You will be able to identify where the energy hogs are in your business, make more informed decisions about refresh cycles, assist in building ICT energy efficiency business cases and whether you should invest in power management software tools.
TypesAsset yearperusedareassetsDaysdayperusedisassetHrs
hrperassetbyconsumedPowerassetofNumber
)
(

22
Concluding Remarks As this year’s report has shown, efforts to improve ICT Sustainability across Australian organisations has by and large stalled. Perhaps the most concerning aspect these findings have brought to life is that instead of making improvements from past years’ performance we have seen declines in a number of areas including Enterprise, End User and Lifecycle. Enterprise, a clear leader in 2012, has lost the most ground with a reduction of 5 points. This is evidenced with virtualisation reaching its maturity. Further, it appears that Data Centre and IT Infrastructure Managers’ focus on infrastructure has been put on hold as they come to terms with, and further understand the impacts of cloud and new data centre rack space in all major cities. They also have the added complexity of trying to get the most optimal returns on existing investments made over the last five years.
The NABERS Data Centre tool is a good governmental initiative that is bringing some rigour and credibility to energy efficiencies within the data centre. Yet the adoption of this tool still remains extremely low with only one data centre being officially NABERS rated at the time of this report.
Both Lifecycle and End User indexes have plateaued. This comes as a surprise since the enactment of the Australian eWaste legislation throughout the past two years, making it easier than ever before for companies to recycle eWaste and ethically dispose old equipment. Since these are the two easiest measures that can improve ICT sustainability this is a missed opportunity, which we believe to be reflective of reduced investment in sustainability processes and procedures.
On a more positive note, we have seen a definite improvement in Metrics and Technology Enablement scores. Better metrics is key since it enables organisations to develop appropriate business cases for sustainability and provides the necessary KPI’s from which improvement flows. As this report indicates, those that apply metrics well and measure their ICT energy use perform remarkably better. It is without a doubt that more investment in metrics will have a positive flow-on effect across all other sectors.
In our eyes the most exciting finding of this report concerns Technology Enablement. We at Fujitsu have long argued that Technology Enablement provides the most lucrative pool of opportunities to benefit organisations. Sustainability gains are also usually coupled with process improvements across organisations and the flow on benefits of Technology Enablement can be far reaching and beyond basic energy conservation.
The Qantas case study of pilots using iPad’s in the cockpit is but one example. The Telstra “Connecting with a Low Carbon Future” report released earlier this year also highlighting seven opportunities for ICT innovation that, if realised, could save businesses and consumers up to $8.1 billion in energy and travel costs, while cutting national carbon emissions by 4.7 per cent.
Over the next two years we hope to see some very real flow on benefits stemming from better Metrics and increased investment in Technology Enablement. These hold the potential to drive wholesale improvement and value across a breadth of practices, organisations and industries.
In the meantime we have designed this report to be of immediate use and benefit to your organisation and it serves both as an inspiration and as a tool to help improve your organisation’s ICT sustainability performance. We strongly recommended you use it and enjoy the benefits that you will no doubt reap. Improving ICT Sustainability is a smart business decision and one that achieves both lucrative environmental and financial goals.

23
About this Research
Our Research Methodology – The ICT Sustainability FrameworkThe ICT Sustainability Benchmark uses a methodology developed by Connection Research and The Royal Melbourne Institute of Technology. The results of our research have been used in the development of a standardised ICT Sustainability Index for ICT-using organisations. The index is designed to have application across any industry vertical or country. Five individual indices spanning key areas of ICT operations have been used to calculate ICT sustainability performance. These include:
■ Equipment Lifecycle Procurement and Disposal■ End User Computing■ Enterprise and Data Centre■ Technology Enablement■ Metrics
Across each of the 5 indices the ICT framework also takes into consideration additional influencing factors in determining the ICT index rating. These include attitude, policy, practice and technology, as outlined in the figure below.
Having defined the key areas of ICT Sustainability it is then possible to measure each individual component. This is achieved by using the Capability Maturity Model (CMM). The concept of the CMM is often used in the ICT industry to describe the level of implementation of various systems and is a standardised way of qualifying the maturity of a business process, ranging from 0 (no action at all) to 5 (optimised, or best practice). The CMM enables the development of a consistent framework for which to measure and benchmark organisations to measure and benchmark sustainability performance.
Factors used to determine the ICT index sustainability rating
ICT Sustainability Framework
Printing & Consumables
Attitude
Technology
Metrics
ManageMonitorMeasure Mitigate
Practice
Policy
Equipment Lifecycle
End User Computing
Enterprise & Data Centre
Technology Enablement
Software Architecture
Carbon Emissions Management
Outsourcing & Cloud
Business Applications
Data Centre ICT Equipment
Data Centre Environmentals
Networking & Communications
Business Process Management
Teleworking & Collaboration
Government & Compliance
Procurement
Recycle & Reuse
Disposal
Departmental Computing
PersonalComputing
DesktopMobile

24
The Research ProcessA total of 200 responses were collected through online surveys and interviews between March and August 2014. Respondents were asked over 100 questions about their ICT Sustainability policies, behaviour, and technologies in each of the five key areas of ICT Sustainability. A breakdown of respondents by industry sector is outlined in the table below.
The responses were weighted to deliver a score (out of 100) for each of the ICT Sustainability index components (attitude, policy, practice, technology, and metrics). These were then combined to determine the overall ICT Sustainability Index for each organisation, ensuring comparisons could be made between respondents.
Research HistoryThis research has been conducted in 2010, 2011 and 2012. In 2012 we went out to 1,200 CIOs across eight countries including Australia. To date we have collected survey data from over 3,000 CIO’s and with our partners Connection Research have been able to provide valuable and credible data to the ICT community. This is the first dedicated country specific report done for Australia.
References & ResourcesAmerican Data Centres Are Wasting Huge Amounts of Energy:www.nrdc.org/energy/files/data-center-efficiency-assessment-IB.pdf Connecting with a Low – Carbon Future:www.telstra.com.au/abouttelstra/download/document/telstra-lcf-report.pdf EPEAT : www.epeat.netFujitsu Sustainability – Our Heritage Your Future:www.fujitsu.com/global/Images/Fujitsu_SustainabilityOurHeritage.pdfFujitsu 2013 Sustainability Report – The Power of ICT for sustainability and beyond: www.fujitsu.com/global/Images/fujitsu2013report-e.pdfGlobal e-Sustainability Initiative – Smarter 2020: http://gesi.org/SMARTer2020Green Grid: www.thegreengrid.org Meridian Energy Case Study: www.fujitsu.com/global/Images/Fujitsu-Meridian-Energy-Case-Study.pdfQantas ICT Sustainability Case Study: www.fujitsu.com/au/about/resources/case-studies/240314-cs-qantas.html
About the Author:Lee Stewart is the Head of Sustainability for Fujitsu Australia and New Zealand. His responsibilities include the implementation of the regional Sustainability Strategy and targets as well as working with Fujitsu customers on ICT Sustainability strategy, solutions and consulting. He is also a member of the Fujitsu Global Sustainability Leadership Team and the Global Practice Lead for ICT Sustainability.
Australia Industry Sector % Respondents
Finance / Business Services
Government
Heavy Industry
IT / Comms / Media
Wholesale / Retail / Logistics
Respondents by Industry Sector, 2014
31%
15%
21%
11%
22%

AcknowledgmentsFujitsu would like to thank the many people and organisations involved in the production of this report. We would particularly like to express thanks to the 200 CIO’s and senior ICT managers who took the time to respond to our survey. Without their assistance this report would not have been possible.
We would also like to thank our research partners Connection Research for providing research expertise and data analysis, Sustain Ltd for editing of this report and also to Cisco for sponsoring the launch of this report.
About Fujitsu AustraliaFujitsu Australia is a leading service provider of business, information technology and communications solutions. We partner with our customers to consult, design, build, operate and support business solutions. From strategic consulting to application and infrastructure solutions and services. Fujitsu Australia is widely recognised as a leader in sustainability and has won a number of awards in sustainability the most notable being the 2011 Banksia Award for Sustainability Excellence.
www.fujitsu.com/auFUJITSU AUSTRALIA LIMITED
About Connection ResearchConnection Research is a market research and consulting company specialising in the analysis of sustainability issues. Services are provided in consumer and community sustainability, ICT Sustainability, building industry and trades, and carbon compliance.
About the World Wildlife FundWWF-Australia is part of the WWF International Network, the world’s leading, independent conservation organisation. Founded in 1961 we are active in over 100 countries and have close to five million supporters internationally. In Australia and throughout the oceanic region, we work with governments, businesses and communities so that people and nature can thrive within their fair share of the planet’s natural resources. WWF-Australia is a not-for-profit organisation with nearly 70% of our annual income donated by our dedicated supporters.