australia and new zealand nutrient reference … · web viewaustralian and new zealand nutrient...
TRANSCRIPT

Australian and New Zealand Nutrient Reference Values for Iodine
A report prepared for the Australian GovernmentDepartment of Health
ByExpert Working Group for IodineKaren Charlton, Creswell Eastman, Gary Ma, Judy Seal
Sheila Skeaff, and Christine Thomson
with Research Assistance from
Sonya Cameron, Elizabeth Gray, Zheng Feei Ma, and Cecilia Sam
May 2015
1
1 EXECUTIVE SUMMARY..................................................................................................4
2 SUMMARY OF RECOMMENDATIONS............................................................................7
3 INTRODUCTION............................................................................................................8
3.1 BACKGROUND TO DEVELOPMENT OF THE NUTRIENT REFERENCE VALUES....................................8
3.2 NUTRIENT REFERENCE VALUES..........................................................................................9
3.2.1 TERMINOLOGY..................................................................................................................9
3.3 NUTRIENT BACKGROUND INFORMATION............................................................................10
3.3.1 IODINE..........................................................................................................................10
3.3.2 IODINE STATUS IN AUSTRALIA AND NEW ZEALAND.................................................................11
3.4 CURRENT RECOMMENDED INTAKES OF IODINE....................................................................13
4 SCOPE AND PURPOSE.................................................................................................15
5 EVIDENCE REVIEW......................................................................................................16
5.1 SELECTION OF BIOMARKERS............................................................................................16
5.1.1 URINARY IODINE.............................................................................................................16
5.1.2 THYROID STATUS.............................................................................................................17
5.1.3 RADIOACTIVE IODINE........................................................................................................18
5.1.4 BRAIN FUNCTION............................................................................................................18
5.2 SELECTION OF EVIDENCE AND DATA..................................................................................19
5.2.1 DEFINING THE QUESTION..................................................................................................19
5.2.2 ADULTS.........................................................................................................................23
5.2.3 PREGNANCY...................................................................................................................24
5.2.4 CHILDREN......................................................................................................................26
5.3 REVIEW OF EVIDENCE....................................................................................................27
5.3.1 ASSESSMENT OF THE QUALITY OF EVIDENCE..........................................................................27
5.3.2 EVIDENCE CONSIDERED IN ESTIMATING THE EAR AND RDI FOR ADULTS....................................28
5.3.3 EVIDENCE CONSIDERED IN ESTIMATING THE EAR AND RDI FOR PREGNANT WOMEN.....................29
5.3.4 EVIDENCE CONSIDERED IN ESTIMATING THE UL FOR CHILDREN AND ADOLESCENTS AGES 1 THROUGH 18 YEARS...................................................................................................................................31
6 GUIDELINE RECOMMENDATIONS................................................................................35
6.1 PROPOSED RECOMMENDATIONS......................................................................................35
6.2 VALIDITY....................................................................................................................37
6.2.1 UL FOR CHILDREN............................................................................................................37
6.3 IMPLICATIONS AND ONGOING CHALLENGES.........................................................................37

6.3.1 IMPLICATIONS OF CHANGES TO THE UL FOR CHILDREN............................................................37
6.3.2 ONGOING CHALLENGE OF MEETING PREGNANCY AND LACTATION RDI.......................................38
6.3.3 INTERNATIONAL CONSISTENCY............................................................................................38
6.3.4 PRIORITIES FOR REMAINING QUESTIONS...............................................................................38
6.3.5 RESEARCH REQUIRED TO INFORM NRVS..............................................................................39
7 APPENDICES...............................................................................................................41
7.1 APPENDIX 1: STUDIES RELATING TO EAR FOR ADULTS..........................................................42
7.2 APPENDIX 2: STUDIES RELATING TO EAR FOR PREGNANCY....................................................56
7.3 APPENDIX 3: STUDIES RELATING TO UL FOR CHILDREN.........................................................92
7.4 APPENDIX 4: MEMBERSHIP OF GROUPS AND COMMITTEES INVOLVED IN THE DEVELOPMENT PROCESS111
7.4.1 MEMBERSHIP OF THE NUTRIENT REFERENCE VALUES STEERING GROUP...................................111
7.4.2 MEMBERSHIP OF THE NUTRIENT REFERENCE VALUES ADVISORY COMMITTEE...........................111
7.4.3 MEMBERSHIP OF THE NUTRIENT REFERENCE VALUES IODINE EXPERT WORKING GROUP.............111
8 ABBREVIATIONS AND GLOSSARY..............................................................................113
8.1 ABBREVIATIONS.........................................................................................................113
8.2 GLOSSARY................................................................................................................114
9 REFERENCES.............................................................................................................117
3

1 Executive SummaryThe Nutrient Reference Values (NRVs) are a set of recommended nutrient intakes used to assess dietary requirements of individuals and population groups. The current NRVs for Australia and New Zealand were published in 2006 (NHMRC 2006) after a comprehensive review process of the Recommended Dietary Intakes commissioned by the Australian Government Department of Health (Aus DoH) and the New Zealand Ministry of Health (NZ MoH). The National Health and Medical Research Council (NHMRC) who carried out the review recommended that these be reviewed every five years. In 2011 Aus DoH, in consultation with the NZ MoH, commissioned a scoping study for undertaking a review of the NRVs, which resulted in the development of a Methodological Framework for the review by Nous and a consortium of experts (Nous Group 2013). The purpose of the present review is to test this framework on three nutrients, sodium, fluoride, and iodine; the focus of this report is iodine.
Iodine is an essential nutrient for all mammals as an integral component of the pro-hormone thyroxine (T4) and the more potent active form 3,5,3’ tri-iodothyronine (T3), a key regulator of important cellular processes. Iodine deficiency results in a wide range of disorders, collectively termed ‘iodine deficiency disorders’ (IDD), including goitre, hypothyroidism, impairment of mental and physical development, and cretinism.
In New Zealand and Australia, endemic goitre in the early part of the 20th century was due to very low levels of iodine in the soils. Iodisation of salt, assisted by iodine contamination of dairy products through the use of iodophors as cleaning agents in the dairy industry, resulted in a reduction of goitre incidence and adequate iodine status from the 1960s to 1980s. A re-emergence of mild iodine deficiency in New Zealand and Australia was observed in the 1990s that coincided with a reduction in the use of iodophors and in the use of iodised salt. A new public policy on food fortification was developed to correct iodine deficiency, and mandatory fortification of bread with iodised salt in both Australia (October 2009) and New Zealand (September 2009) was implemented. Iodine status has increased in both countries as a result of fortification.
The Methodological Framework set out a number of steps to be followed in the process of the review including:
1. Define the question: The Expert Working Group (EWG) for iodine established a number of questions for the review of iodine NRVs. Since the purpose of the review was primarily to test the methodological framework and the timeframe was limited, the EWG chose to review the following NRVs only:
Estimated Average Requirement (EAR) Recommended Dietary Intake (RDI) for
healthy adults.
EAR and RDI for healthy pregnant women.
Upper Levels of Intake (UL) for children.
4

2. Selection of biomarkers: Biomarkers included urinary iodine concentration (UIC), thyroid function (thyroid volume, thyroid hormones, thyroid stimulating hormone (TSH), thyroglobulin (Tg), radioactive iodine uptake), and brain function (development and cognition).
3. Selection of evidence: The NRVs for iodine were last reviewed by Thomson in 2002 (Thomson, 2003) (later incorporated into the 2006 NRVs (NHMRC 2006). Therefore this report only includes original studies published since 2002. International reviews and other expert group reports were also considered.
4. Assessing the quality of evidence: Evidence was assessed according to the guidelines of the NHMRC (2009) and the body of evidence given a grade of recommendation.
5. Derivation of the NRV recommendations:
EAR and RDI for healthy adults: The EWG concluded that the most recent studies on iodine status and thyroid function in adults (i.e., published between 2002-2014) did not present any new evidence and that the current EAR (100 µg/day) and RDI (150 µg/day) should remain unchanged.Table 1:1 Recommended EAR and RDI for iodine for adults 19 years and older.
Men and Women EAR RDI
19-30 years 100 μg/day 150 μg/day
31-50 years 100 μg/day 150 μg/day
51-70 years 100 μg/day 150 μg/day
> 70 years 100 μg/day 150 μg/day
EAR and RDI of healthy pregnant women: Studies relevant to cognitive outcomes in children, and maternal and infant biochemical indices that could be used to set or modify the EAR or RDI in pregnancy were considered. However, the EWG concluded that there was insufficient new evidence to change the EAR and RDI set in 2006, and proposes to keep the current EAR (160 µg/day) and RDI (220 µg/day) for pregnant women.
Table 1:2 Recommended EAR and RDI for pregnant women
Category Microgram (μg) per day
EAR 160 μg/day
RDI 220 μg/day
UL for children aged 1-3, 4-8, 9-13, 14-18 years: In view of very limited suitable data to define a dietary intake that corresponds to an adverse effect in thyroid function, the
5
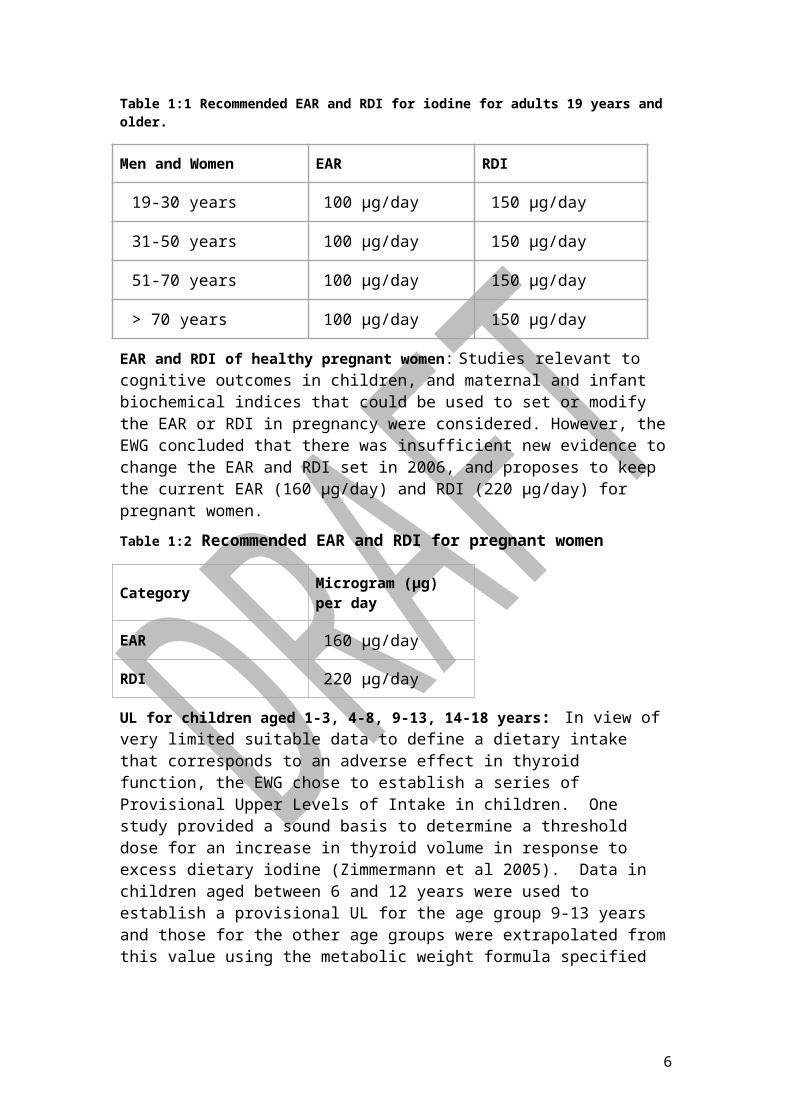
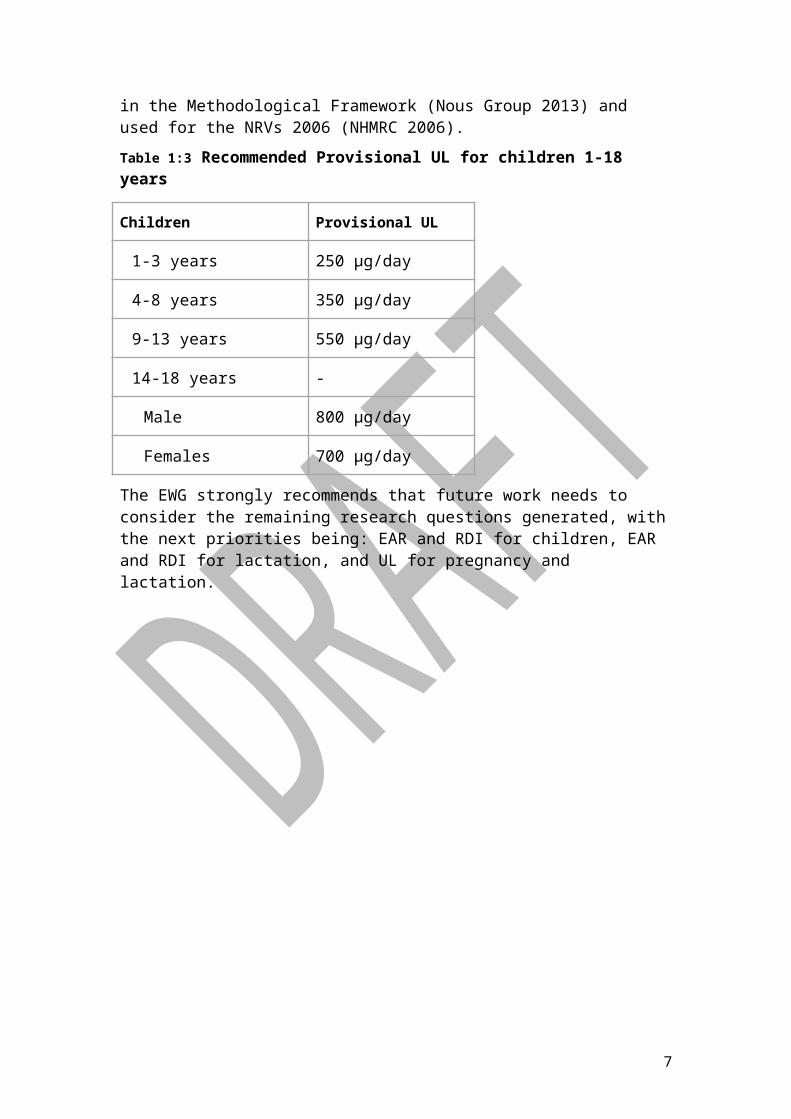
EWG chose to establish a series of Provisional Upper Levels of Intake in children. One study provided a sound basis to determine a threshold dose for an increase in thyroid volume in response to excess dietary iodine (Zimmermann et al 2005). Data in children aged between 6 and 12 years were used to establish a provisional UL for the age group 9-13 years and those for the other age groups were extrapolated from this value using the metabolic weight formula specified in the Methodological Framework (Nous Group 2013) and used for the NRVs 2006 (NHMRC 2006).
Table 1:3 Recommended Provisional UL for children 1-18 years
Children Provisional UL
1-3 years 250 μg/day
4-8 years 350 μg/day
9-13 years 550 μg/day
14-18 years -
Male 800 μg/day
Females 700 μg/day
The EWG strongly recommends that future work needs to consider the remaining research questions generated, with the next priorities being: EAR and RDI for children, EAR and RDI for lactation, and UL for pregnancy and lactation.
6
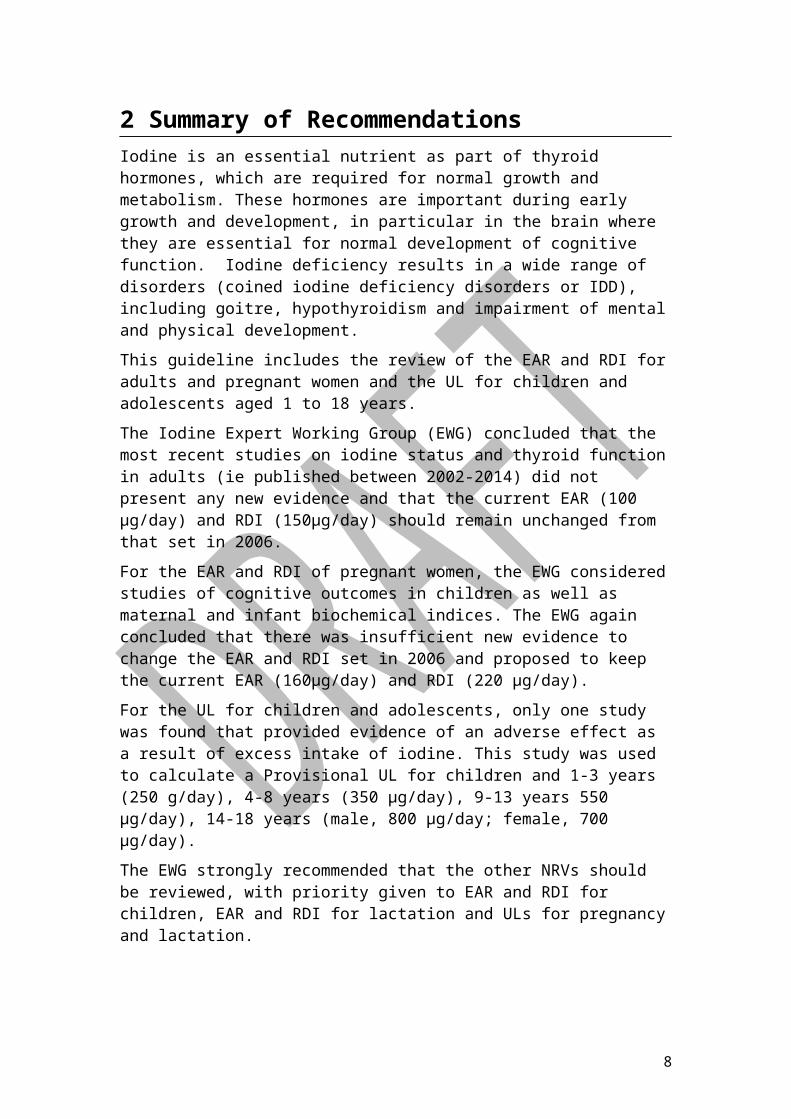
2 Summary of RecommendationsIodine is an essential nutrient as part of thyroid hormones, which are required for normal growth and metabolism. These hormones are important during early growth and development, in particular in the brain where they are essential for normal development of cognitive function. Iodine deficiency results in a wide range of disorders (coined iodine deficiency disorders or IDD), including goitre, hypothyroidism and impairment of mental and physical development.
This guideline includes the review of the EAR and RDI for adults and pregnant women and the UL for children and adolescents aged 1 to 18 years.
The Iodine Expert Working Group (EWG) concluded that the most recent studies on iodine status and thyroid function in adults (ie published between 2002-2014) did not present any new evidence and that the current EAR (100 µg/day) and RDI (150µg/day) should remain unchanged from that set in 2006.
For the EAR and RDI of pregnant women, the EWG considered studies of cognitive outcomes in children as well as maternal and infant biochemical indices. The EWG again concluded that there was insufficient new evidence to change the EAR and RDI set in 2006 and proposed to keep the current EAR (160µg/day) and RDI (220 µg/day).
For the UL for children and adolescents, only one study was found that provided evidence of an adverse effect as a result of excess intake of iodine. This study was used to calculate a Provisional UL for children and 1-3 years (250 g/day), 4-8 years (350 µg/day), 9-13 years 550 µg/day), 14-18 years (male, 800 µg/day; female, 700 µg/day).
The EWG strongly recommended that the other NRVs should be reviewed, with priority given to EAR and RDI for children, EAR and RDI for lactation and ULs for pregnancy and lactation.
7
3 Introduction
3.1 Background to Development of the Nutrient Reference Values
Nutrient Reference Values (NRVs) are a set of recommended nutrient intakes designed to assist nutrition and health professionals assess the dietary requirements of individuals and groups. Public health nutritionists, food legislators and the food industry also use the NRVs for dietary modelling and/or food labelling and food formulation.
The current NRVs for Australia and New Zealand were published in 2006 after a comprehensive review process of the Recommended Dietary Intakes (the only type of nutrient reference value that had been produced at the time), commissioned by the Australian Government Department of Health (DoH) in conjunction with the New Zealand Ministry of Health (NZ MoH).
The review resulted in a new set of recommendations known as the Nutrient Reference Values (NRVs) for Australia and New Zealand (2006). The National Health and Medical Research Council (NHMRC) carried out the 2006 review and recommended that these guidelines be reviewed every five years to ensure values remain relevant, appropriate and useful.
In 2011 Aus DOH, in consultation with the NZ MoH, commissioned a scoping study to determine the need and scope for a review of NRVs. The scoping study considered developments in comparable countries, expert opinions, stakeholder consultation and public submissions. The scoping study concluded there was sufficient justification for conducting a review and as a result, Aus DoH and the NZ MoH engaged the Nous Group and a technical team led by Baker IDI to develop a Methodological Framework to guide future NRV reviews.
A Steering Group is overseeing the review process and is responsible for all strategic, funding and technical decisions of the review. It consists of representatives from both funding agencies, Aus DoH and the NZ MoH. The Steering Group is also responsible for the ongoing monitoring of triggers for a new review, and ensuring nutrient reviews are conducted in a timely manner. Reviews are being conducted on a rolling basis to ensure NRVs remain relevant and appropriate. The process complies with the 2011 NHMRC Procedures and requirements for meeting the 2011 NHMRC standard for clinical practice guidelines. The scoping study also identified the rationale and triggers for reviewing specific nutrients including changes or developments to NRVs in comparable OECD countries, emergence of new evidence, impact on public health priorities and/or concerns regarding the strength of the underlying methodology or evidence. Iodine was identified as a priority nutrient for review.
The Steering Group has appointed an Advisory Committee as an expert reference and advisory group that also acts as an independent moderator of nutrient recommendations. The Advisory Committee comprises members with a broad range
8

of expertise, including experts in the areas of micronutrients, toxicology, public health, end user needs, research, chronic disease, nutrition and macronutrients.
The Steering Group (with the advice of the Advisory Committee), established a group of experts to conduct this iodine review. The Expert Working Group (EWG) was primarily responsible for examining scientific evidence and establishing nutrient values. Membership of the groups involved in the development of the NRV guidelines can be found in Appendix 7.4.
3.2 Nutrient Reference Values
3.2.1 Terminology
The suite of NRVs outlined in the 2006 document (NHMRC 2006), adapted from the US/Canadian Dietary Reference Intakes (DRI), were considered to remain applicable for this NRV review with no change of name to the reference indicators, which are defined as follows (NHMRC 2006, Nous Group 2013).
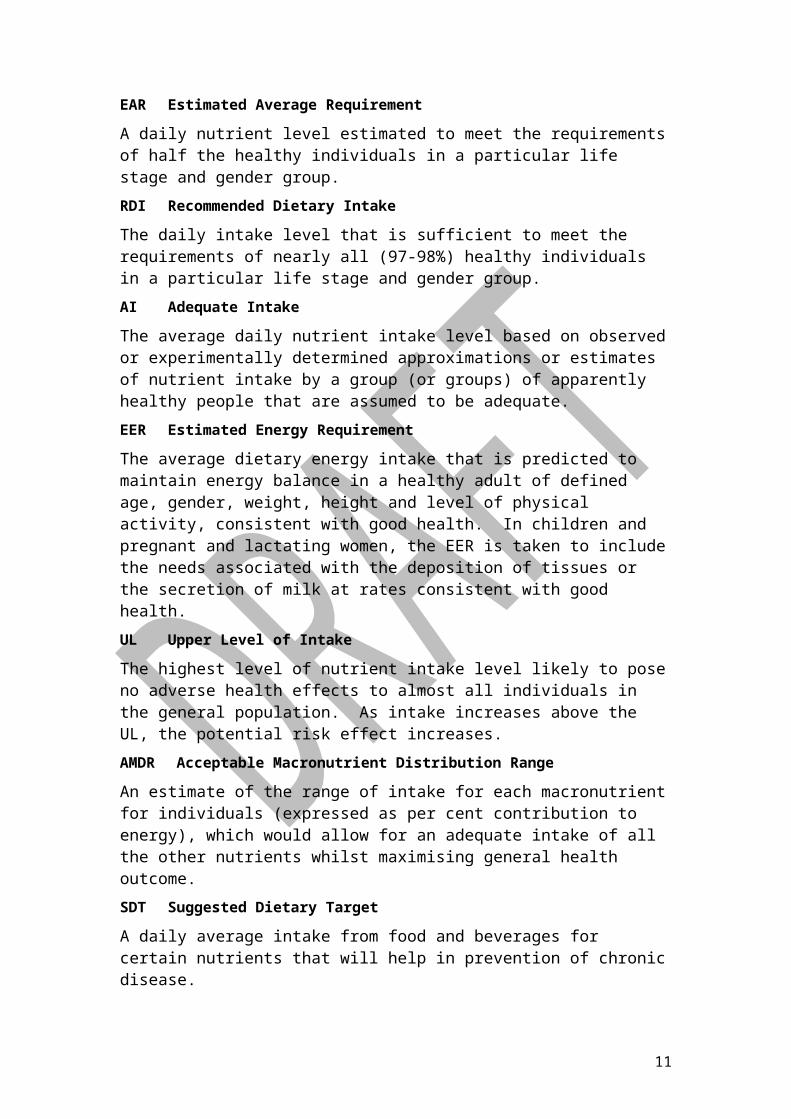
EAR Estimated Average Requirement
A daily nutrient level estimated to meet the requirements of half the healthy individuals in a particular life stage and gender group.
RDI Recommended Dietary Intake
The daily intake level that is sufficient to meet the requirements of nearly all (97-98%) healthy individuals in a particular life stage and gender group.
AI Adequate Intake
The average daily nutrient intake level based on observed or experimentally determined approximations or estimates of nutrient intake by a group (or groups) of apparently healthy people that are assumed to be adequate.
EER Estimated Energy Requirement
The average dietary energy intake that is predicted to maintain energy balance in a healthy adult of defined age, gender, weight, height and level of physical activity, consistent with good health. In children and pregnant and lactating women, the EER is taken to include the needs associated with the deposition of tissues or the secretion of milk at rates consistent with good health.
UL Upper Level of Intake
The highest level of nutrient intake level likely to pose no adverse health effects to almost all individuals in the general population. As intake increases above the UL, the potential risk effect increases.
AMDR Acceptable Macronutrient Distribution Range
An estimate of the range of intake for each macronutrient for individuals (expressed as per cent contribution to energy), which would allow for an adequate intake of all the other nutrients whilst maximising general health outcome.
SDT Suggested Dietary Target
9

A daily average intake from food and beverages for certain nutrients that will help in prevention of chronic disease.
3.3 Nutrient Background Information
3.3.1 Iodine
Iodine is an essential nutrient for all mammals as an integral component of the pro-hormone thyroxine (T4) and the more potent active form 3,5,3’ tri-iodothyronine (T3), a key regulator of important cellular processes. The thyroid hormones are required for normal growth and metabolism and are particularly important during early growth, development and maturation of most organs. The developing brain is a key target organ of the thyroid hormones, which therefore play an essential role in the development of neurological and cognitive function. The thyroid hormones are also important for energy production and oxygen consumption in cells, thereby maintaining the body’s metabolic rate (Zimmerman 2009).
Iodine deficiency, resulting from inadequate intakes and consequently altered thyroid function, results in a wide range of disorders, collectively termed ‘iodine deficiency disorders’ (IDD). These have been well documented in a number of excellent reviews (Zimmerman 2009, WHO/UNICEF/ICCIDD 2007, Hetzel 1983, Zimmerman et al 2008) and will be described briefly here. The most damaging effect of iodine deficiency is during pregnancy when the fetal brain is developing and can result in adverse effects such as neurological cretinism with severe intellectual impairment, deafness, spastic paresis of the limbs and other psychomotor disorders. Iodine deficiency during neonatal life, in children and adults can lead to goitre and hypothyroidism as well as impairment of mental and physical development. While endemic goitre is the most visible consequence of IDD, the most significant and profound effects are on the brain. Impaired intellectual development of people living in iodine deficient areas is of particular concern, especially when all of the adverse effects of iodine deficiency can be prevented by long-term, sustainable iodine prophylaxis.
In New Zealand and Australia endemic goitre in the early part of the 20th century was due to very low levels of iodine in the soils. Iodisation of salt, assisted by iodine contamination of dairy products through the use of iodophors as cleaning agents in the dairy industry, resulted in a reduction of goitre incidence and reports of adequate iodine status from the 1960s to 1980s. A re-emergence of mild iodine deficiency in New Zealand was observed in the 1990s which coincided with replacement of iodophors used in the dairy industry with chlorine-based and organic sanitizers (Thomson 2004). A similar situation pertains to Australia where iodine deficiency was also recognized in the 1990s and later documented nationally in school children in the 2003-2004 National Iodine Nutrition Study (NINS) (Li et al 2006). These observations became the main driver for the development of new public policy on food fortification to correct iodine deficiency in Australia and New Zealand. As a result, the mandatory fortification of bread with iodised salt in both
10
Australia (October 2009) and New Zealand (September 2009) was fully implemented with the intention of correcting iodine deficiency in the population.
On the other hand, the effects of high iodine intake on thyroid function are variable depending chiefly on the magnitude of the excessive iodine intake and on the response of people with underlying thyroid disease, particularly autoimmune thyroid disease (Teng et al 2006, Prummel et al 2004). Adverse effects of high intakes include both hyperthyroidism and hypothyroidism, with or without goitre, and an increased incidence of autoimmune thyroid disease (Thomson 2003).
3.3.2 Iodine status in Australia and New Zealand
Information on dietary intakes of iodine in Australia and New Zealand is limited because of inadequate food composition data, and because of the difficulty in quantifying the use and intake of iodised salt at the table and in cooking. Iodine intake can be estimated from urinary iodine excretion as the majority of intake (approximately 90%) of dietary iodine is excreted in urine (Anderson et al 2009).
The most comprehensive and recent data on iodine status of Australians is provided by the 2011-12 Australian National Health Survey (NHS) (Australian Bureau of Statistics 2013), obtained after the mandatory fortification of bread with iodised salt in October 2009. These results show that Australian adults had a population median urinary iodine concentration (UIC) of 124 µg/L, ranging from 113 to 144 µg/L across the states and territories, with 12.8% of the population having a UIC of less than 50µg/L. These values are well within the range of iodine sufficiency (ie UIC >100 µg/L and no more than 20% of the population with UIC below 50 µg/L) (WHO/UNICEF/ICCIDD 2007). There are a lack of national data examining the iodine status of pregnant women. A pre-post comparison of surveys conducted in a regional area of New South Wales indicates that mandatory fortification has improved the overall median UIC of pregnant women but that non-users of iodine-containing supplements remain at risk of inadequacy (Charlton & Eastman 2013).
Comparison between the 2003-04 NINS of school children 8-10 years in five Australian states prior to mandatory fortification (which showed that these children as a group were mildly iodine deficient) and the 2011-12 NHS after fortification, shows that the median UIC of 8-10 year old children has significantly increased in each of these states as indicated in Table 3.1. Children generally had a higher median UIC than adults: those 5-11 years had the highest median UIC (177 µg/L), followed by those aged 12-17 years (149 µg/L). Table 3:4 Comparison of UIC in adults pre-fortification and post-fortification
Location Pre-fortification Post-fortification
Australia
Adults ~89-110 µg/L 113-144 µg/L
Pregnant Women ~74-110 µg/L 163 µg/L
11

Location Pre-fortification Post-fortification
New Zealand
Adults 53 µg/L 73 µg/L
Pregnant Women 35/47 µg/L 105/85 µg/L
A time series analysis of cross-sectional urinary iodine surveys of Tasmanian school-aged children shows a progressive and stepwise improvement in iodine status from pre-fortification (median UIC 73 µg/L; 16.9%<50 µg/L), through a period of state-wide voluntary iodine fortification of bread from 2001 to 2009 (median UIC 108 µg/L; 9.6%<50 µg/L), and following mandatory iodine fortification of bread in 2009 (median UIC 129 µg/L; 3.4%<50 µg/L) (DePaoli et al 2013).
National data for New Zealand are not as recent and come from the New Zealand Adult Nutrition Survey 2008/09 (ANS) and the New Zealand National Children’s Nutrition Survey 2002 (CNS), both of which were carried out before implementation of mandatory fortification of bread with iodised salt had any impact on iodine status (University of Otago & NZ Ministry of Health 2011, Ministry of Health 2003).
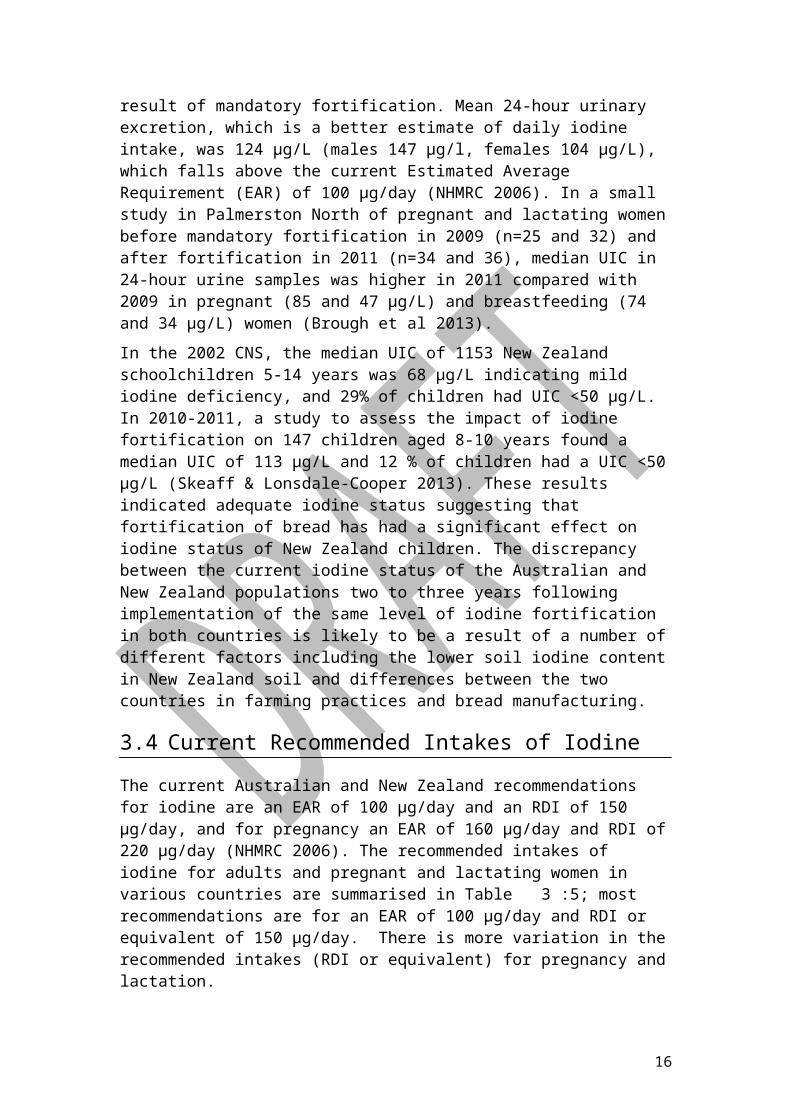
In the ANS, the median UIC of New Zealanders aged ≥15 years was 53 µg/L (males 55 µg/L; females 50 µg/L) falling within 50-99 µg/L indicating mild iodine deficiency (University of Otago & NZ Ministry of Health 2011). Of note was the high proportion of adults (47%) with UIC <50 µg/L. In 2012, a study to determine if the mandatory fortification of bread had improved iodine status chose a representative sample of 300 adults aged 18-74 years living in Wellington and Dunedin using 24-hour urine samples (Ministry for Primary Industries 2013). The median UIC was 73 µg/L, still falling in the mild iodine deficiency range, but significantly higher than that reported in the 2008/09 ANS (University of Otago & NZ Ministry of Health 2011), showing that there has been an increase in iodine status probably as a result of mandatory fortification. Mean 24-hour urinary excretion, which is a better estimate of daily iodine intake, was 124 µg/L (males 147 µg/l, females 104 µg/L), which falls above the current Estimated Average Requirement (EAR) of 100 µg/day (NHMRC 2006). In a small study in Palmerston North of pregnant and lactating women before mandatory fortification in 2009 (n=25 and 32) and after fortification in 2011 (n=34 and 36), median UIC in 24-hour urine samples was higher in 2011 compared with 2009 in pregnant (85 and 47 µg/L) and breastfeeding (74 and 34 µg/L) women (Brough et al 2013).
In the 2002 CNS, the median UIC of 1153 New Zealand schoolchildren 5-14 years was 68 µg/L indicating mild iodine deficiency, and 29% of children had UIC <50 µg/L. In 2010-2011, a study to assess the impact of iodine fortification on 147 children aged 8-10 years found a median UIC of 113 µg/L and 12 % of children had a UIC <50 µg/L (Skeaff & Lonsdale-Cooper 2013). These results indicated adequate iodine status suggesting that fortification of bread has had a significant effect on iodine status of New Zealand children. The discrepancy between the current iodine status of the Australian and New Zealand populations two to three years following
12

implementation of the same level of iodine fortification in both countries is likely to be a result of a number of different factors including the lower soil iodine content in New Zealand soil and differences between the two countries in farming practices and bread manufacturing.
3.4 Current Recommended Intakes of Iodine
The current Australian and New Zealand recommendations for iodine are an EAR of 100 µg/day and an RDI of 150 µg/day, and for pregnancy an EAR of 160 µg/day and RDI of 220 µg/day (NHMRC 2006). The recommended intakes of iodine for adults and pregnant and lactating women in various countries are summarised in Table 3:5; most recommendations are for an EAR of 100 µg/day and RDI or equivalent of 150 µg/day. There is more variation in the recommended intakes (RDI or equivalent) for pregnancy and lactation.
13

Table 3:5 Overview of RDI for iodine
NHMRC 2006 FNB/IOM 2001 WHO Secretariat et al 2007 EFSA 2014
Children
0-6 mo
7-12 mo
1-3 years
4-8 years
9-13 years
14-18 years
90 μg/day
110 μg/day
90 μg/day
90 μg/day
120 μg/day
150 μg/day
0-6 mo
7-12 mo
1-3 years
4-8 years
9-13 years
14-18 years
90 μg/day
110 μg/day
90 μg/day
90 μg/day
120 μg/day
150 μg/day
0-11 mo
1-5 years
6-12 years
>13 years
90 μg/day
90 μg/day
120 μg/day
150 μg/day
7-11 mo
1-3 years
4-6 years
7-10 years
11-14 years
15-17 years
70 μg/day
90 μg/day
90 μg/day
90 μg/day
120 μg/day
130 μg/day
Adults 150 μg/day 150 μg/day 150 μg/day 150 μg/day
Pregnancy 220 μg/day 220 μg/day 250 μg/day 200 μg/day
Lactation 270 μg/day 290 μg/day 250 μg/day 200 μg/day
14

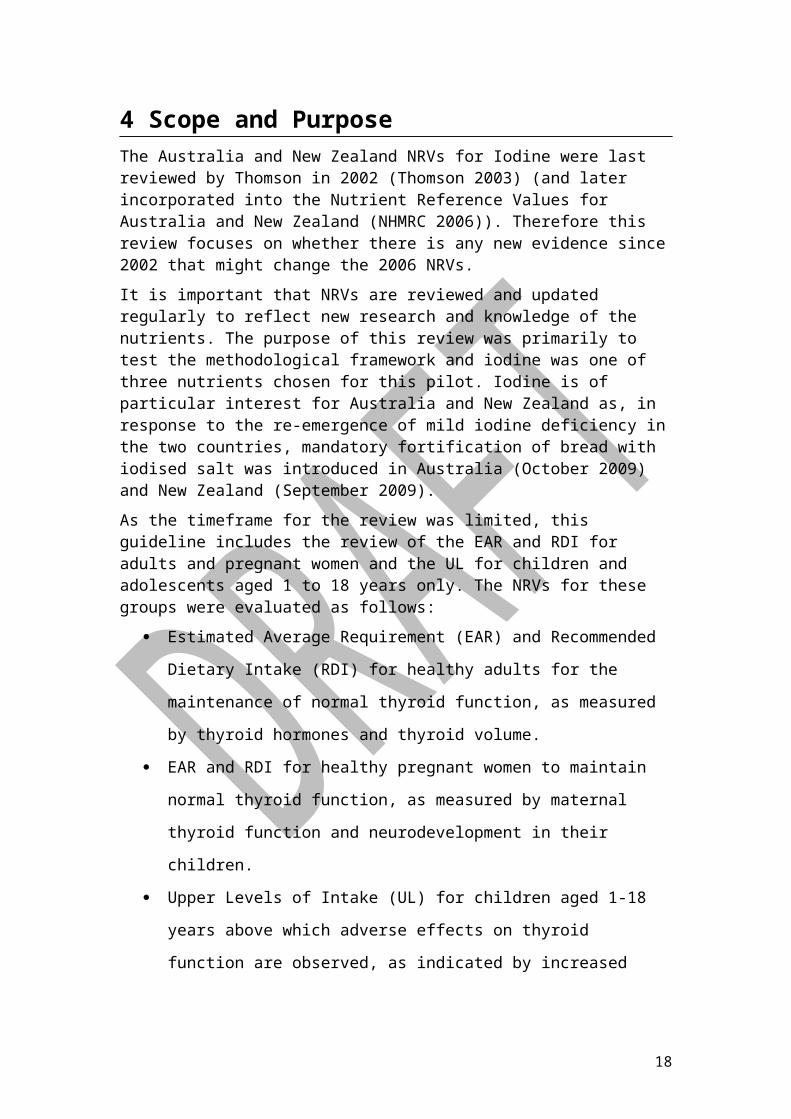
4 Scope and PurposeThe Australia and New Zealand NRVs for Iodine were last reviewed by Thomson in 2002 (Thomson 2003) (and later incorporated into the Nutrient Reference Values for Australia and New Zealand (NHMRC 2006)). Therefore this review focuses on whether there is any new evidence since 2002 that might change the 2006 NRVs.
It is important that NRVs are reviewed and updated regularly to reflect new research and knowledge of the nutrients. The purpose of this review was primarily to test the methodological framework and iodine was one of three nutrients chosen for this pilot. Iodine is of particular interest for Australia and New Zealand as, in response to the re-emergence of mild iodine deficiency in the two countries, mandatory fortification of bread with iodised salt was introduced in Australia (October 2009) and New Zealand (September 2009).
As the timeframe for the review was limited, this guideline includes the review of the EAR and RDI for adults and pregnant women and the UL for children and adolescents aged 1 to 18 years only. The NRVs for these groups were evaluated as follows:
Estimated Average Requirement (EAR) and Recommended Dietary Intake
(RDI) for healthy adults for the maintenance of normal thyroid function, as
measured by thyroid hormones and thyroid volume.
EAR and RDI for healthy pregnant women to maintain normal thyroid
function, as measured by maternal thyroid function and neurodevelopment
in their children.
Upper Levels of Intake (UL) for children aged 1-18 years above which adverse
effects on thyroid function are observed, as indicated by increased thyroid
volume and/or abnormal thyroid hormone levels.
The iodine EWG strongly recommends that future work needs to consider the remaining NRVs for iodine, with the next priorities being: EAR and RDI for children, EAR and RDI for lactation and ULs for pregnancy and lactation.
15
5 Evidence Review
5.1 Selection of Biomarkers
There are a number of biomarkers that can be used to assess iodine status including urinary iodine concentration (UIC), thyroid function [thyroid volume, thyroid hormones, serum Thyroid Stimulating Hormone (TSH), serum thyroglobulin (Tg), thyroidal radioactive iodine uptake], and brain function (development and cognition). Such data are typically collected in both observational and intervention studies.
5.1.1 Urinary Iodine
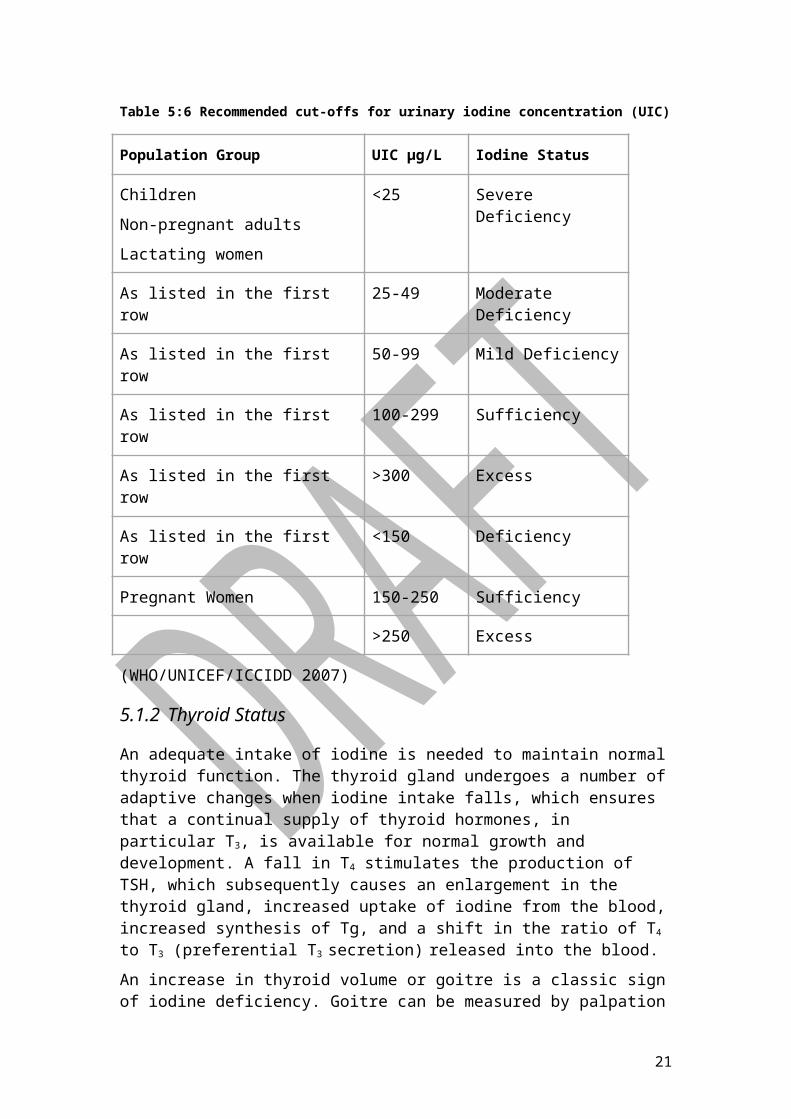
Approximately 90% of dietary iodine is excreted in the urine (Andersen et al 2009; Zimmermann 2009), thus the most commonly used biomarker of iodine status is urinary iodine concentration (UIC). Because UIC has high intra- and inter-individual variation (König et al 2011), UIC should not be used to assess iodine status in individuals. WHO/UNICEF/ICCIDD state that a median UIC <100 μg/L in groups of school aged children and non-pregnant adults and <150 μg/L in groups of pregnant women including lactating mothers indicate iodine deficiency in that population (WHO/UNICEF/ICCIDD 2007). Table 5.1 outlines the recommended cut-offs for UIC including ranges used to categorise the severity of iodine deficiency as well as iodine excess. Casual or spot urine samples are typically obtained from subjects although UIC can also be determined in 24-hour samples, but the higher respondent burden associated with such samples limits their practical use in many studies. One advantage of 24-hour urine samples is that they are able to provide an objective estimate of daily iodine intake (Zimmermann 2009). WHO/UNICEF/ICCIDD recommendations are based on UIC in spot samples; caution should be used when interpreting data obtained from 24-hour samples as urine volumes greater than 1.0 L, found in New Zealand adults (Ministry for Primary Industries 2013) may lower UIC resulting in an overestimation of iodine deficiency.
16
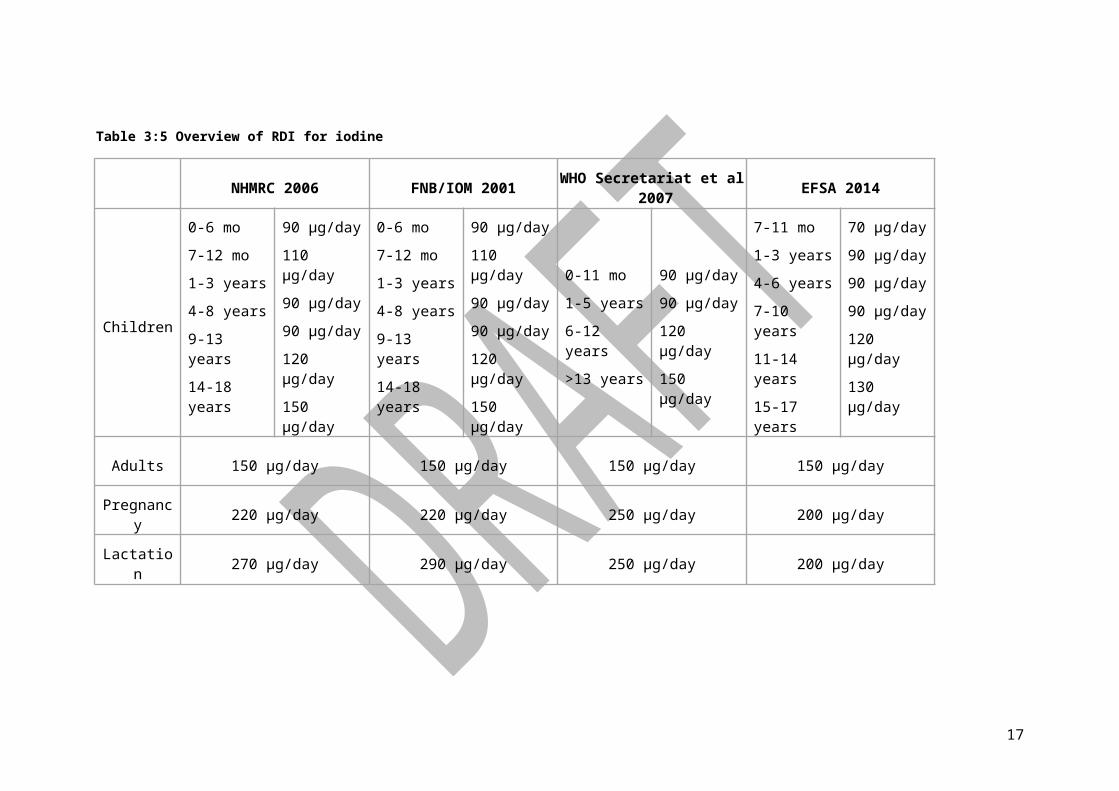
Table 5:6 Recommended cut-offs for urinary iodine concentration (UIC)
Population Group UIC μg/L Iodine Status
Children
Non-pregnant adults
Lactating women
<25 Severe Deficiency
As listed in the first row 25-49 Moderate Deficiency
As listed in the first row 50-99 Mild Deficiency
As listed in the first row 100-299 Sufficiency
As listed in the first row >300 Excess
As listed in the first row <150 Deficiency
Pregnant Women 150-250 Sufficiency
>250 Excess
(WHO/UNICEF/ICCIDD 2007)
5.1.2 Thyroid Status
An adequate intake of iodine is needed to maintain normal thyroid function. The thyroid gland undergoes a number of adaptive changes when iodine intake falls, which ensures that a continual supply of thyroid hormones, in particular T3, is available for normal growth and development. A fall in T4 stimulates the production of TSH, which subsequently causes an enlargement in the thyroid gland, increased uptake of iodine from the blood, increased synthesis of Tg, and a shift in the ratio of T4 to T3 (preferential T3 secretion) released into the blood.
An increase in thyroid volume or goitre is a classic sign of iodine deficiency. Goitre can be measured by palpation by trained physicians and graded according to criteria of WHO/UNICEF/ICCIDD. This manual and highly labour intensive skill is now replaced by thyroid technique, which produces consistent and reproducible results with normal reference ranges published for school-aged children (Zimmerman et al 2000). The presence of goitre in >5% of the population indicates iodine deficiency (WHO/UNICEF/ICCIDD 2007).
TSH, T4, and T3, although readily and routinely measured in many populations, are insensitive indices of iodine status except in severe iodine deficiency and in newborns. Elevated neonatal TSH (i.e. >5 IU/mL) in >3% of newborns indicates iodine deficiency, however, despite routine assessment of neonatal TSH measurement in most countries for diagnosis of congenital hypothyroidism, its use in assessing iodine status in populations is not generally recommended because of
17
many unresolved technical issues in the application of this technology Li & Eastman 2010). In older children and adults, in milder forms of iodine deficiency the body maintains these hormones within normal reference ranges, leading WHO/UNICEF/ICCIDD to state that these blood parameters should not be used to assess iodine status (WHO/UNICEF/ICCIDD 2007).
The secretion of Tg from the thyroid gland increases in iodine deficiency and has been positively correlated with thyroid volume. The use of Tg as an index of iodine status is relatively new with the primary focus on school-aged children. Over the last six to seven years Zimmermann and colleagues have published a number of large studies of children living in a number of different countries, with varying degrees of iodine deficiency as assessed by UIC (Zimmerman et al 2013). These studies have determined the normal reference range for Tg as well as recently proposing that a median Tg >13 μg/L indicates iodine deficiency in this age group (Zimmerman et al 2013). However, the usefulness of Tg in assessing iodine status in non-pregnant adults and pregnant women has yet to be confirmed. It should be emphasised that measurement of changes in serum Tg response to changing iodine intake is simply an index of adaptation by the thyroid but does not necessarily indicate thyroid dysfunction.
5.1.3 Radioactive Iodine
The uptake of radioactive 131I is used as a test of thyroid function in clinical settings (Gibson 2005). This involves determining the fraction of an orally administered dose of 131I that is concentrated in the thyroid gland; in iodine deficiency, a larger proportion of the radioactive iodine will be rapidly taken up by the thyroid gland compared with when the thyroid is replete with iodine. Due to radiation exposure, and its imprecision as a function of insufficient iodine intake, this method of determining iodine deficiency is no longer used. However, 131I was used in the 1960s in a handful of iodine balance studies.
5.1.4 Brain Function
The adverse effects of iodine deficiency on brain development and function are well accepted; neurological cretinism, characterised by classical neurological abnormalities and profound mental impairment, is only observed in regions with severe iodine deficiency. Over the last decade, a growing interest and appreciation that the relationship between iodine deficiency and brain function may be a continuum has resulted in an increasing number of studies attempting to assess the association between maternal iodine status and brain development. The measures used in such studies to assess brain function, however, vary widely depending on the age of the subjects but also in what aspect of brain function they measure. For example, some studies include tests of development (eg Bayley’s Infant Scales of Development, Brunet-Lezine) cognition (IQ measured by Weschler Intelligence Scale for Children, Stanford-Binet) and school achievement (eg reading ability). Data obtained from many of these studies using diverse testing methods in several different countries are well summarised in the online text “thyroidmanager.org” (Eastman & Zimmerman, 2014).
18

5.2 Selection of evidence and data
5.2.1 Defining the question
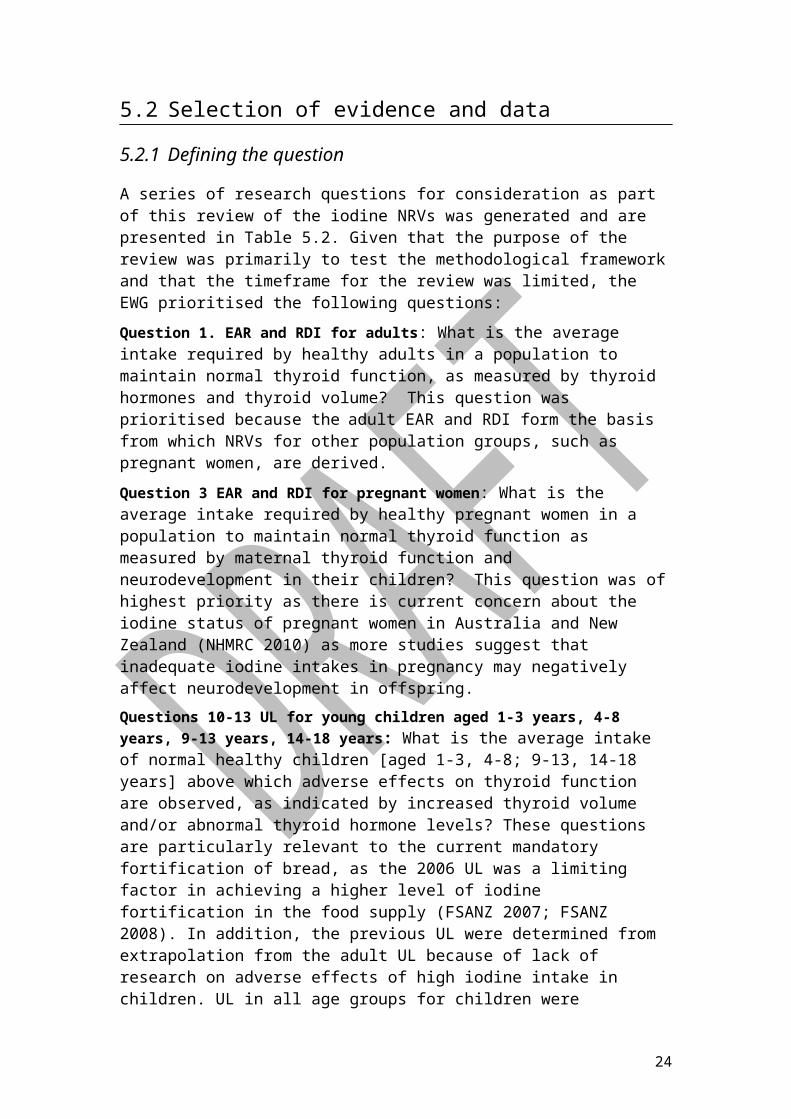
A series of research questions for consideration as part of this review of the iodine NRVs was generated and are presented in Table 5.2. Given that the purpose of the review was primarily to test the methodological framework and that the timeframe for the review was limited, the EWG prioritised the following questions:
Question 1. EAR and RDI for adults: What is the average intake required by healthy adults in a population to maintain normal thyroid function, as measured by thyroid hormones and thyroid volume? This question was prioritised because the adult EAR and RDI form the basis from which NRVs for other population groups, such as pregnant women, are derived.
Question 3 EAR and RDI for pregnant women: What is the average intake required by healthy pregnant women in a population to maintain normal thyroid function as measured by maternal thyroid function and neurodevelopment in their children? This question was of highest priority as there is current concern about the iodine status of pregnant women in Australia and New Zealand (NHMRC 2010) as more studies suggest that inadequate iodine intakes in pregnancy may negatively affect neurodevelopment in offspring.
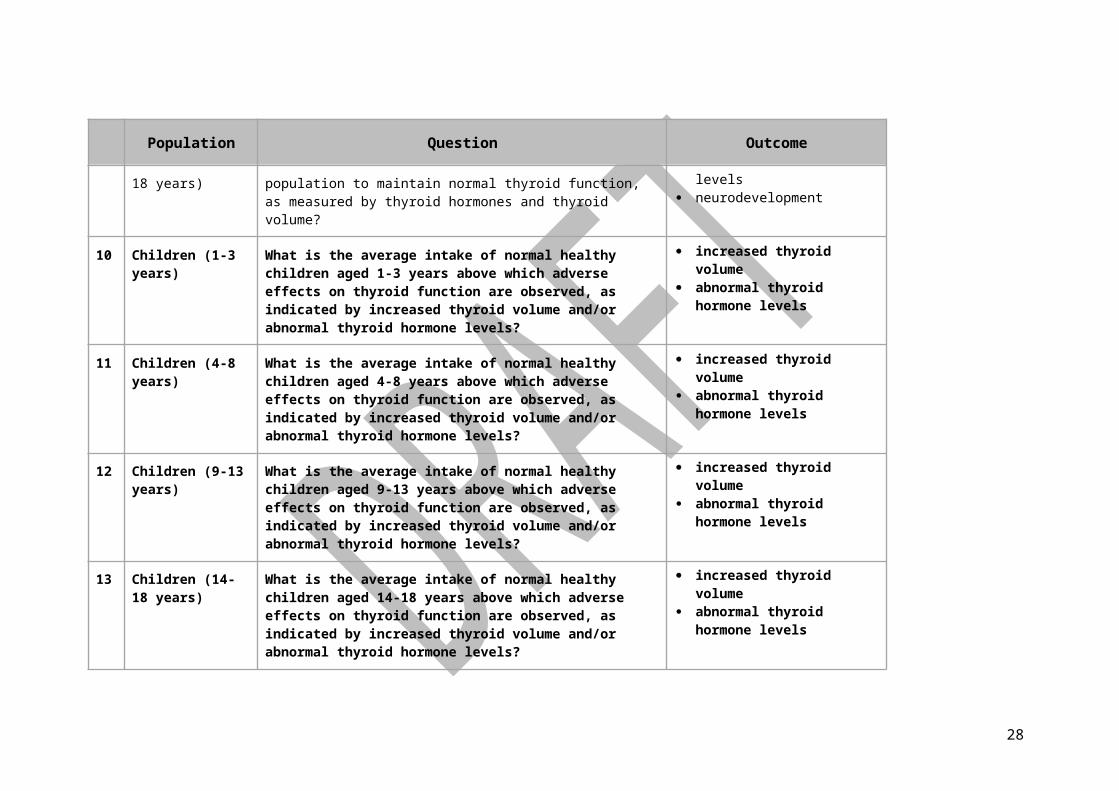
Questions 10-13 UL for young children aged 1-3 years, 4-8 years, 9-13 years, 14-18 years: What is the average intake of normal healthy children [aged 1-3, 4-8; 9-13, 14-18 years] above which adverse effects on thyroid function are observed, as indicated by increased thyroid volume and/or abnormal thyroid hormone levels? These questions are particularly relevant to the current mandatory fortification of bread, as the 2006 UL was a limiting factor in achieving a higher level of iodine fortification in the food supply (FSANZ 2007; FSANZ 2008). In addition, the previous UL were determined from extrapolation from the adult UL because of lack of research on adverse effects of high iodine intake in children. UL in all age groups for children were considered. The UL for infants (0-1 years) was judged not determinable at this stage because there are insufficient data on adverse effects.
The EWG recommend that the remaining questions (see Table 5:7) require consideration in the future as part of the overall review of iodine.
19
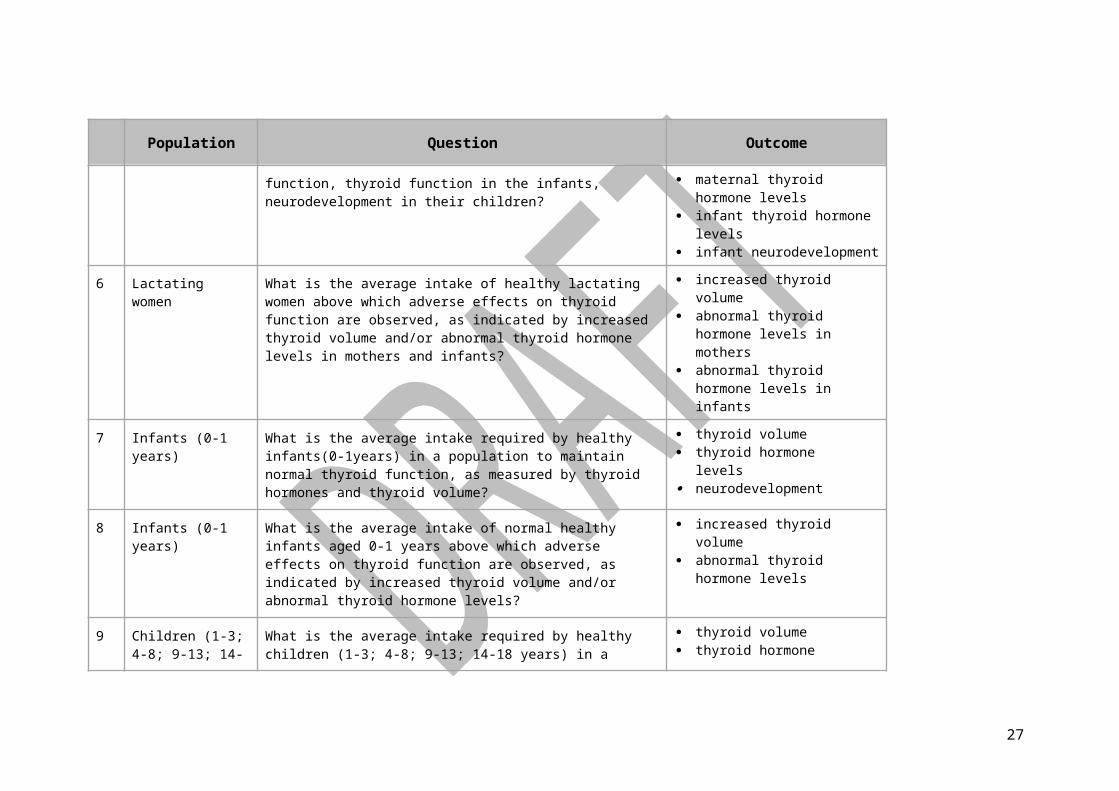
Table 5:7 Questions for the review of the iodine NRVs
Population Question Outcome
1 Adults What is the average intake required by healthy adults in a population to maintain normal thyroid function, as measured by thyroid hormones and thyroid volume?
thyroid volume thyroid hormone levels
2 Adults What is the average intake of healthy adults above which adverse effects on thyroid function are observed, as indicated by increased thyroid volume and/or abnormal thyroid hormone levels?
increased thyroid volume abnormal thyroid hormone levels
3 Pregnant women What is the average intake required by healthy pregnant women in a population to maintain normal thyroid function as measured by maternal thyroid hormones and thyroid volume and neurodevelopment in their children?
maternal thyroid volume maternal thyroid hormone levels neurodevelopment in their
children
4 Pregnant women What is the average intake of healthy pregnant women above which adverse effects on thyroid function are observed, as indicated by increased thyroid volume and/or abnormal thyroid hormone levels?
increased thyroid volume abnormal thyroid hormone levels
5 Lactating women What is the average intake required by healthy lactating women in a population to maintain normal thyroid function as measured by maternal thyroid function, thyroid function in the infants, neurodevelopment in their children?
adequate iodine content of breast milk
maternal thyroid volume maternal thyroid hormone levels infant thyroid hormone levels infant neurodevelopment
6 Lactating women What is the average intake of healthy lactating women above which adverse effects on thyroid function are observed, as indicated by increased thyroid volume and/or abnormal thyroid hormone levels in mothers and infants?
increased thyroid volume abnormal thyroid hormone levels
in mothers abnormal thyroid hormone levels
20
Population Question Outcome
in infants
7 Infants (0-1 years) What is the average intake required by healthy infants(0-1years) in a population to maintain normal thyroid function, as measured by thyroid hormones and thyroid volume?
thyroid volume thyroid hormone levels neurodevelopment
8 Infants (0-1 years) What is the average intake of normal healthy infants aged 0-1 years above which adverse effects on thyroid function are observed, as indicated by increased thyroid volume and/or abnormal thyroid hormone levels?
increased thyroid volume abnormal thyroid hormone levels
9 Children (1-3; 4-8; 9-13; 14-18 years)
What is the average intake required by healthy children (1-3; 4-8; 9-13; 14-18 years) in a population to maintain normal thyroid function, as measured by thyroid hormones and thyroid volume?
thyroid volume thyroid hormone levels neurodevelopment
10 Children (1-3 years) What is the average intake of normal healthy children aged 1-3 years above which adverse effects on thyroid function are observed, as indicated by increased thyroid volume and/or abnormal thyroid hormone levels?
increased thyroid volume abnormal thyroid hormone
levels
11 Children (4-8 years) What is the average intake of normal healthy children aged 4-8 years above which adverse effects on thyroid function are observed, as indicated by increased thyroid volume and/or abnormal thyroid hormone levels?
increased thyroid volume abnormal thyroid hormone
levels
12 Children (9-13 years) What is the average intake of normal healthy children aged 9-13 years above which adverse effects on thyroid function are observed, as indicated by increased thyroid volume and/or abnormal thyroid hormone levels?
increased thyroid volume abnormal thyroid hormone
levels
21

Population Question Outcome
13 Children (14-18 years)
What is the average intake of normal healthy children aged 14-18 years above which adverse effects on thyroid function are observed, as indicated by increased thyroid volume and/or abnormal thyroid hormone levels?
increased thyroid volume abnormal thyroid hormone
levels
22

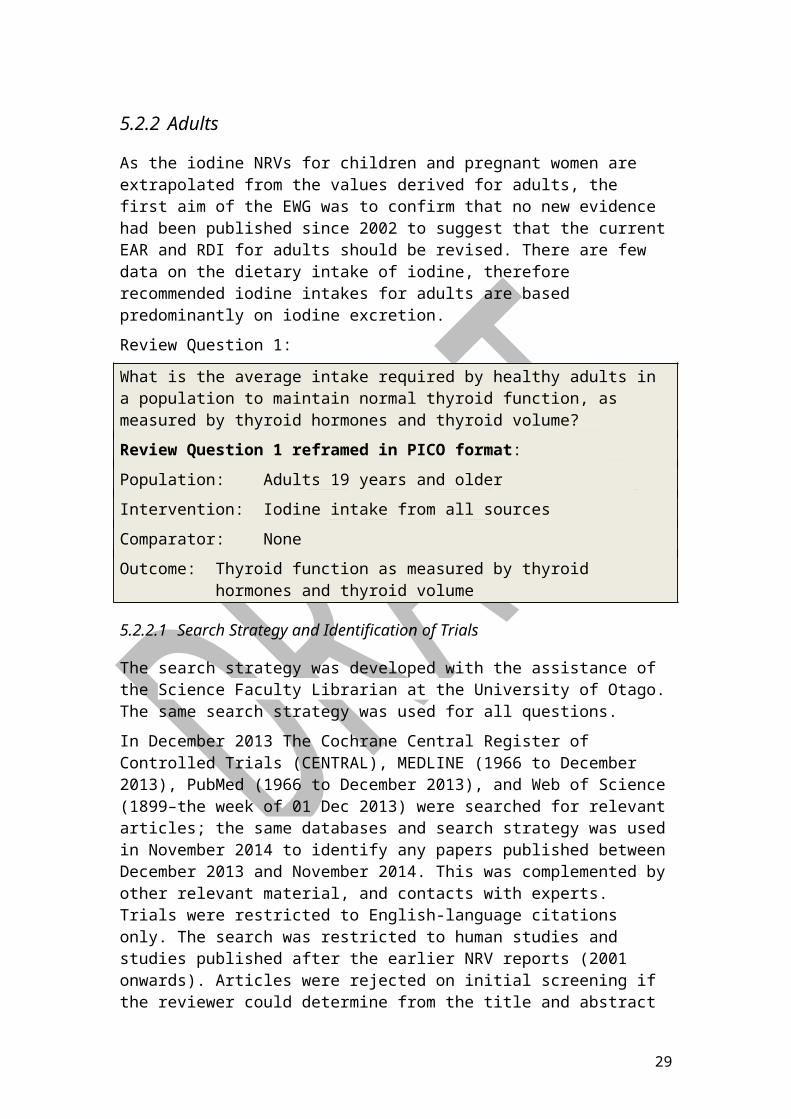
5.2.2 Adults
As the iodine NRVs for children and pregnant women are extrapolated from the values derived for adults, the first aim of the EWG was to confirm that no new evidence had been published since 2002 to suggest that the current EAR and RDI for adults should be revised. There are few data on the dietary intake of iodine, therefore recommended iodine intakes for adults are based predominantly on iodine excretion.
Review Question 1:
What is the average intake required by healthy adults in a population to maintain normal thyroid function, as measured by thyroid hormones and thyroid volume?
Review Question 1 reframed in PICO format:
Population: Adults 19 years and older
Intervention: Iodine intake from all sources
Comparator: None
Outcome: Thyroid function as measured by thyroid hormones and thyroid volume
5.2.2.1 Search Strategy and Identification of Trials
The search strategy was developed with the assistance of the Science Faculty Librarian at the University of Otago. The same search strategy was used for all questions.
In December 2013 The Cochrane Central Register of Controlled Trials (CENTRAL), MEDLINE (1966 to December 2013), PubMed (1966 to December 2013), and Web of Science (1899–the week of 01 Dec 2013) were searched for relevant articles; the same databases and search strategy was used in November 2014 to identify any papers published between December 2013 and November 2014. This was complemented by other relevant material, and contacts with experts. Trials were restricted to English-language citations only. The search was restricted to human studies and studies published after the earlier NRV reports (2001 onwards). Articles were rejected on initial screening if the reviewer could determine from the title and abstract that the study was not a relevant study, or if the study did not meet our selection criteria. When a paper could not be rejected with certainty from the title and abstract, the full text of the article was obtained for further evaluation. The terms used to search for relevant studies are listed in Table 5:8.Table 5:8 Search terms used to identify studies for relating the Iodine EAR and RDI for Adults
Search terms
1. Adult*2. normal human*3. (1) AND (2)
23
Search terms
4. iodine deficien*5. iodine status*6. urinary iodine concentration7. UIC*8. iodine*9. iodide*10. iodate*11. iodized salt*12. iodized oil*13. (4) OR (5) OR (6) OR (7) OR (8) OR (9) OR (10) OR (11) OR (12)14. thyroid funct*15. T3*16. T4*17. TSH*18. Goitre19. (14) OR (15) OR (16) OR (17) OR (18)20. (3) AND (13) AND (19)
5.2.2.2 Search results:
At the conclusion of the search, 19 studies were identified as being relevant to iodine status in healthy adults (see Table 7:19 in Appendix 1 for details of individual studies). In addition two reports from international experts committees were considered by the EWG in the current report (EFSA, 2014; Gunnarsdottir & Dahl 2012).
5.2.2.3 Data extraction, (selection and coding)
Three members of the research team (SC, ZFM, CS) independently reviewed titles and abstracts of the identified studies. The data extraction tables were used to extract the relevant data fields from each included study by a research assistant.
5.2.3 Pregnancy
The EWG examined the most recent (i.e., since 2002) evidence for iodine status during pregnancy. Effects of iodine status during pregnancy (as measured from UIC) were examined in relation to: maternal biochemical outcomes (e.g. thyroid function); and infant/childhood cognition. The specific question executed in the search strategy was:
Review Question 3:
What is the average intake required by healthy pregnant women in a population to maintain normal thyroid function as measured by maternal thyroid hormones and thyroid volume and neurodevelopment in their children?
Review Question 3 reframed in PICO format:
24

Population: Pregnant women
Intervention: Iodine intake from all sources
Comparator: None
Outcome: Normal thyroid function as measured by maternal thyroid hormones, maternal thyroid volume, and neurodevelopment in the child
5.2.3.1 Search Strategy and Identification of Trials
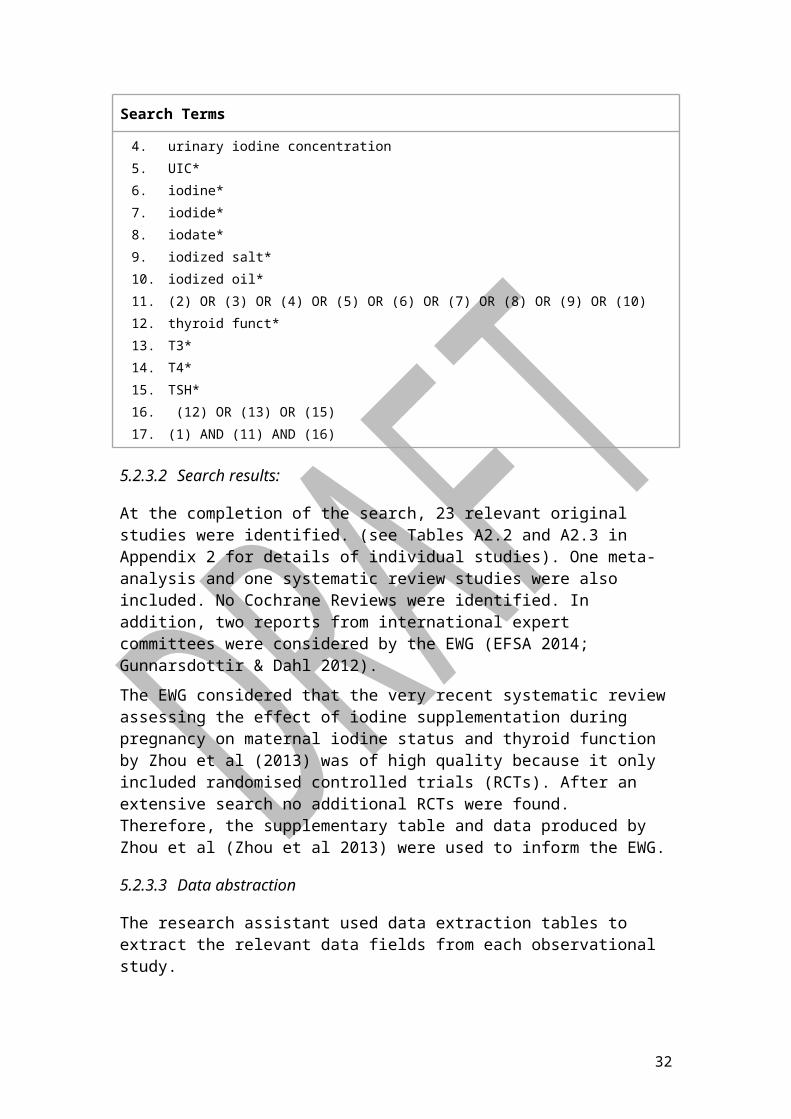
Refer to section 5.2.2.1Table 5:9 Search terms used to identify studies relating to EAR and RDI for pregnant women
Search Terms
1. Pregnan*2. iodine deficien*3. iodine status*4. urinary iodine concentration5. UIC*6. iodine*7. iodide*8. iodate*9. iodized salt*10. iodized oil*11. (2) OR (3) OR (4) OR (5) OR (6) OR (7) OR (8) OR (9) OR (10)12. thyroid funct*13. T3*14. T4*15. TSH*16. (12) OR (13) OR (15)17. (1) AND (11) AND (16)
5.2.3.2 Search results:
At the completion of the search, 23 relevant original studies were identified. (see Tables A2.2 and A2.3 in Appendix 2 for details of individual studies). One meta-analysis and one systematic review studies were also included. No Cochrane Reviews were identified. In addition, two reports from international expert committees were considered by the EWG (EFSA 2014; Gunnarsdottir & Dahl 2012).
The EWG considered that the very recent systematic review assessing the effect of iodine supplementation during pregnancy on maternal iodine status and thyroid function by Zhou et al (2013) was of high quality because it only included randomised controlled trials (RCTs). After an extensive search no additional RCTs were found. Therefore, the supplementary table and data produced by Zhou et al (Zhou et al 2013) were used to inform the EWG.
25

5.2.3.3 Data abstraction
The research assistant used data extraction tables to extract the relevant data fields from each observational study.
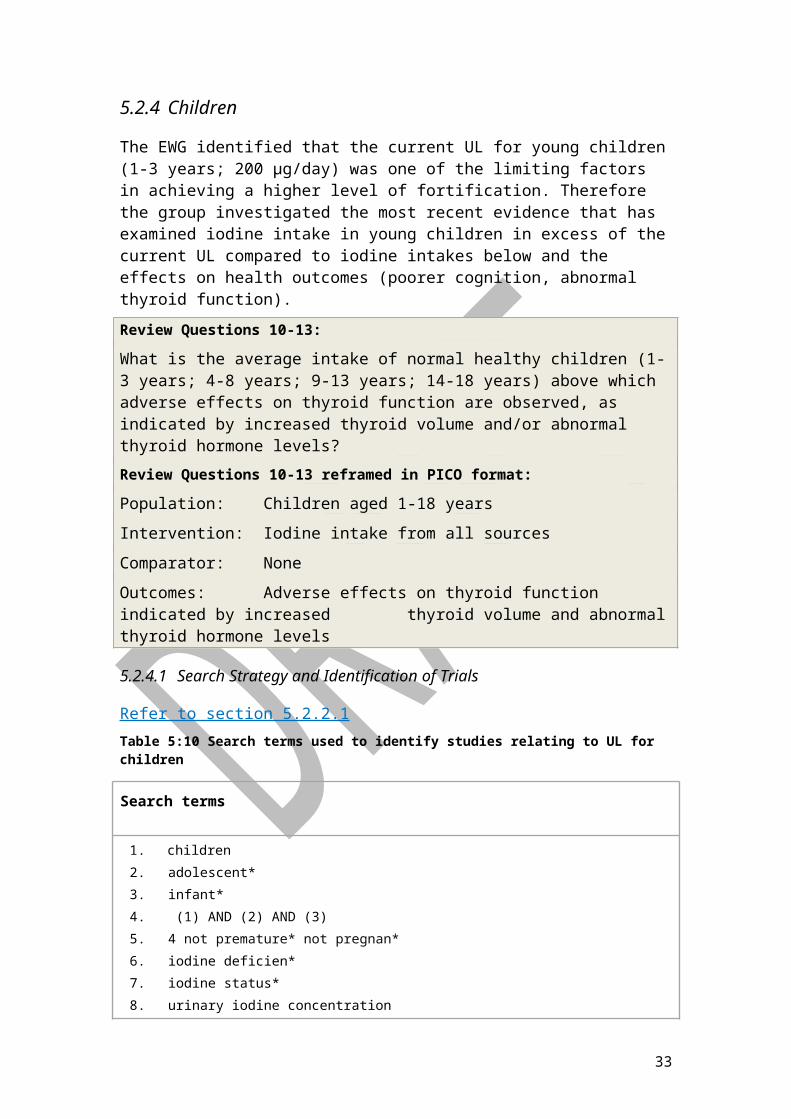
5.2.4 Children
The EWG identified that the current UL for young children (1-3 years; 200 µg/day) was one of the limiting factors in achieving a higher level of fortification. Therefore the group investigated the most recent evidence that has examined iodine intake in young children in excess of the current UL compared to iodine intakes below and the effects on health outcomes (poorer cognition, abnormal thyroid function).
Review Questions 10-13:
What is the average intake of normal healthy children (1-3 years; 4-8 years; 9-13 years; 14-18 years) above which adverse effects on thyroid function are observed, as indicated by increased thyroid volume and/or abnormal thyroid hormone levels?
Review Questions 10-13 reframed in PICO format:
Population: Children aged 1-18 years
Intervention: Iodine intake from all sources
Comparator: None
Outcomes: Adverse effects on thyroid function indicated by increased thyroid volume and abnormal thyroid hormone levels
5.2.4.1 Search Strategy and Identification of Trials
Refer to section 5.2.2.1Table 5:10 Search terms used to identify studies relating to UL for children
Search terms
1. children2. adolescent*3. infant*4. (1) AND (2) AND (3)5. 4 not premature* not pregnan*6. iodine deficien*7. iodine status*8. urinary iodine concentration9. UIC*10. iodine*11. iodide*12. iodate*13. iodized salt*14. iodized oil*
26
Search terms
15. (6) OR (7) OR (8) OR (9) OR (10) OR (11) OR (12) OR (13) OR (14)16. 15 not zinc17. thyroid funct*18. T3*19. T4*20. TSH*21. Goitre22. Physical grow*23. Cognitive disorder*24. Behavioral disorder*25. (15) OR (16) OR (17) OR (18) OR (19) OR (20) OR (21) OR (22) OR (23) OR (24)26. 25 not cancer* not mutation* not thyroiditis* not carcinoma not hashimoto*27. (5) AND (16) AND (26)
5.2.4.2 Search results:
At the completion of the search, 13 original studies were identified as being relevant to the upper level of iodine status in children (see Table 7:30 in Appendix 3 for details of individual studies). One systematic review/meta-analysis was also found. In addition, two reports from international expert committees were considered by the EWG (EFSA 2014; Gunnarsdottir & Dahl 2012).
5.3 Review of Evidence
5.3.1 Assessment of the quality of evidence
Evidence was assessed according to the NHMRC (NHMRC 2009). Studies were graded individually by one member of the EWG using the NHMRC (2009) criteria (NHMRC 2009). The quality rating of level of evidence for each study is presented in the final column of the data abstraction tables (Appendix Tables A1-A3). The overall assessment and critique of the body of evidence for each NRV evaluated in this report was first assessed according to the NHMRC approach (NHMRC 2009) (Table 5.6); Body of Evidence (BOE) statement tables summarising the studies relevant to each review question can be found in the Appendices. (Tables A1.1, A2.1, A3.2-A3.5). Studies that were deemed of sufficient quality to be used to revise the NRV were evaluated using GRADE (Table 7:24).
The components assessed in the quality rating process were:
1. The evidence base, in terms of the number of studies, level of evidence and quality of studies (risk of bias).
2. The consistency of the study results.
27
3. The potential clinical impact of the proposed recommendation.
4. The generalisability of the body of evidence to the target population for the guideline.
5. The applicability of the body of evidence to the Australian and New Zealand healthcare context.
Table 5:11 Definition of NHMRC grades of recommendations
Grade of recommendation Description
A Body of evidence can be trusted to guide evidence
B Body of evidence can be trusted to guide evidence in most situations
C Body of evidence provides some support for recommendation(s) but care should be taken in its application
D Body of evidence is weak and recommendation must be applied with caution
5.3.2 Evidence considered in estimating the EAR and RDI for Adults
5.3.2.1 Previous recommended intake levels for Australia and New Zealand.
In the 2003 report (Thomson 2003) later adopted into the Nutrient Reference Values for Australia and New Zealand (NHMRC 2006), Thomson derived an EAR for adults based on iodine balance studies (Vought & London 1964, Vought & London 1967, Hays et al 2001, Jahreis et al 2001) in accordance with the FMB:IOM (Food and Nutrition Board 2001). The balance studies indicated that iodine balance is achieved at intakes over 100 µg/day but not below 40 µg/day. In addition, Thomson considered a relevant New Zealand study in adults relating urinary iodide to thyroid volume that indicated physiological requirements of 85–100 µg/day (Thomson et al 2001). Therefore, these studies pointed to a value of 100 µg/day, which was adopted as the proposed EAR. The RDI was set assuming a CV of 20% for the EAR (Food and Nutrition Board 2001), and rounded up to reflect the possible influence of natural goitrogens, which gave an RDI of 150 µg/day. Although there is no scientific evidence to show that goitrogens in foods exert an effect on iodine requirements in a Western diet, goitrogens are found in foods commonly eaten in Australasia (i.e. cruciferous vegetables), thus an assumption of a small effect is not unreasonable.
5.3.2.2 Additional evidence published since 2002 and considered in this report
Original studies:
28
A total of 18 studies published between 2002-2014 were identified, of which two were level II, two were level III-2, one level III-3 and 13 level IV. The EWG agreed that these studies did not provide evidence to change the current EAR (100 µg/day) and RDI (150 µg/day) (Table 7:19 in Appendix 1).
International Reviews and other expert groups:
The EWG notes that the recent systematic review by Gunnarsdottir and Dahl (Gunnarsdottir & Dahl 2012) and the Scientific Opinion on Dietary Reference Values for iodine produced by the European Food Safety Authority (EFSA 2014 ) supports the EWG’s conclusion that there is no new evidence to inform the EAR and RDI.
The RDI is determined from the EAR plus two SDs, or for iodine, two times the CV of 20% (i.e. RDI = EAR + (2x20%EAR)) (Food and Nutrition Board 2001). The CV for iodine was calculated to be 20% in accordance with the 2003 report (Thomson 2003), which was guided by the US/Canadian DRIs (Food and Nutrition Board 2001). This CV was based on data from Fisher and Oddie (Fisher & Oddie 1969) who calculated from their data on thyroid radio-iodine turnover studies a CV of 40% (Fisher & Oddie 1969), part of which was due to the complexity of the experimental design and calculations used to estimate turnover. Assuming that half of the variation was due to experimental design, a CV of 20% was chosen by Food and Nutrition Board (2001).
The RDI has been rounded to the nearest 50 μg to reflect possible influence of natural goitrogens, giving 150 μg/day for males and females. From the data available, there is no indication that iodine requirement differs by sex.
5.3.3 Evidence considered in estimating the EAR and RDI for pregnant women
5.3.3.1 Previous recommended intake levels for NZ and Australia
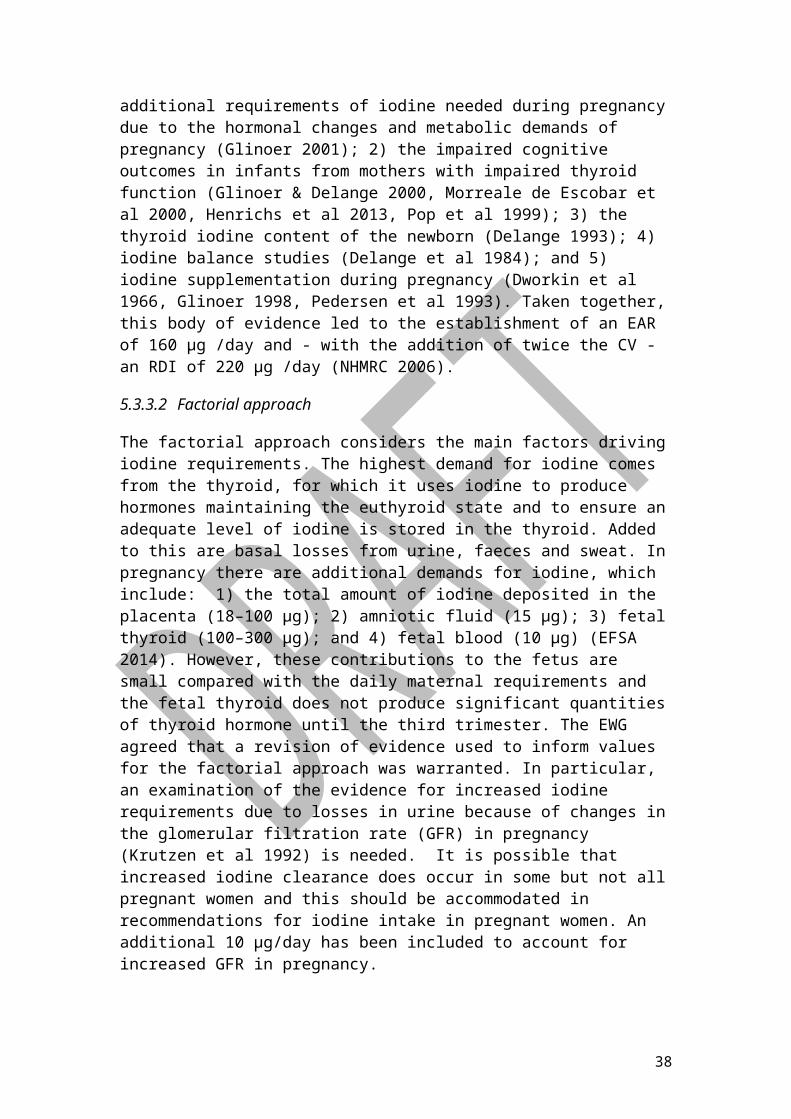
The recommendation in 2006 considered several indicators for deriving the iodine requirement for pregnancy (Thomson 2003, NHMRC 2006). These included: 1) the additional requirements of iodine needed during pregnancy due to the hormonal changes and metabolic demands of pregnancy (Glinoer 2001); 2) the impaired cognitive outcomes in infants from mothers with impaired thyroid function (Glinoer & Delange 2000, Morreale de Escobar et al 2000, Henrichs et al 2013, Pop et al 1999); 3) the thyroid iodine content of the newborn (Delange 1993); 4) iodine balance studies (Delange et al 1984); and 5) iodine supplementation during pregnancy (Dworkin et al 1966, Glinoer 1998, Pedersen et al 1993). Taken together, this body of evidence led to the establishment of an EAR of 160 μg /day and - with the addition of twice the CV - an RDI of 220 μg /day (NHMRC 2006).
5.3.3.2 Factorial approach
The factorial approach considers the main factors driving iodine requirements. The highest demand for iodine comes from the thyroid, for which it uses iodine to produce hormones maintaining the euthyroid state and to ensure an adequate level of iodine is stored in the thyroid. Added to this are basal losses from urine, faeces
29

and sweat. In pregnancy there are additional demands for iodine, which include: 1) the total amount of iodine deposited in the placenta (18–100 μg); 2) amniotic fluid (15 μg); 3) fetal thyroid (100–300 μg); and 4) fetal blood (10 μg) (EFSA 2014). However, these contributions to the fetus are small compared with the daily maternal requirements and the fetal thyroid does not produce significant quantities of thyroid hormone until the third trimester. The EWG agreed that a revision of evidence used to inform values for the factorial approach was warranted. In particular, an examination of the evidence for increased iodine requirements due to losses in urine because of changes in the glomerular filtration rate (GFR) in pregnancy (Krutzen et al 1992) is needed. It is possible that increased iodine clearance does occur in some but not all pregnant women and this should be accommodated in recommendations for iodine intake in pregnant women. An additional 10 μg/day has been included to account for increased GFR in pregnancy.
The main additional requirement during pregnancy results from the increased (~50%) synthesis of thyroid hormones by the mother, corresponding to a need for additional iodine capture by the thyroid of 25 μg/day. The equation of Fisher and Oddie (Fisher & Oddie 1969) derived in non-pregnant euthyroid adults has been used in pregnant women to suggest that an extra 25 μg/day can be accumulated in the thyroid by an additional iodine intake of 44 μg/day (EFSA 2014). The iodine needed for synthesis of thyroid hormones in the fetus is estimated to be around 2–4 μg/day (Evans et al 1967). With the additional 10 µg/day for GFR this leads to a total additional iodine intake in pregnancy rounded to 60 μg/day.
5.3.3.3 Effect on maternal thyroid function
One Level I study with low risk of bias (this included eight supplementation randomised controlled trials (RCT) with two trials conducted in women living in an area of severe iodine deficiency and six trials in women living in areas of moderate to mild iodine deficiency), 10 Level III-2 (cohort) studies, and 19 Level IV studies suggests that despite low UIC observed in some populations thyroid hormone production remains normal in pregnancy. The use of pregnancy-appropriate reference values (i.e. TSH of >2.5 mIU/L in first trimester and > 3.0 mIU/L in trimesters 2 and 3) was not always considered. No obvious dose-response relation was seen. The effect of iodine supplementation on changes in thyroid hormone concentrations in mothers and infants was not consistent (Zhou et al 2013). WHO/UNICEF/ICCIDD do not recommend the use of TSH or thyroid hormones (T3 and T4) to routinely assess iodine status, particularly in populations of moderate to mild iodine deficiency, because these are not sensitive indicators of iodine status (WHO/UNICEF/ICCIDD 2007). Neonatal TSH from a heelprick blood sample could be used as an index of maternal iodine status but was not considered in this report.
5.3.3.4 Effect on infant neurodevelopmental in their children
One meta-analysis of studies published between 1980-2011 in children aged 5 years or younger found that iodine deficient children had 6.9-10.2 IQ points less than iodine replete children (Bougma et al 2013). However, of the 24 studies included in this meta-analysis, only two were Level II (RCT), eight Level III-1, and 13 Level III-2
30

studies. Two more recent Level II studies found no differences in child neurological development associated with iodine supplementation.
Seven Level III-2 birth cohort studies were largely non-comparable due to the differing iodine status of the samples of pregnant women, both within and between countries. In many cases, supplementation strategies were introduced in the geographical areas under study, but not at the same time during the study follow-up period, thus making measurement of exposure to supplementation unclear. The lack of consistency across studies regarding the use of instruments to measure infant development and cognitive functioning in young children poses additional difficulties in assessing the body of evidence. The most commonly used instruments in young children are Bayley Scales of Infant Development and whereas in school-aged children (8–9 years), Intelligence Quotient (IQ) is measured, as well as literacy and numeracy skills. Various measures of maternal thyroid function were used across studies. Most studies obtained one first trimester urine sample for the determination of UIC, a measure that is known to have high day-to-day variability, and is unlikely to be a true reflection of habitual iodine status for the duration of pregnancy. It is likely that future studies addressing the impact of iodine intake and thyroid function in pregnancy on neurocognitive development of children will include maternal measures of serum T4 levels, since virtually all the free T4 available to embryonic and fetal tissues, particularly the brain, comes from maternal serum during the first half of pregnancy and well into the last trimester.
The EWG concludes that there was insufficient evidence with regard to maternal (Table 7:22) and infant biochemical indices (Table 7:22), or cognitive outcomes in children (Table 7:29 in Appendix 2) that could be used to set or modify the EAR or RDI in pregnancy. Therefore the EWG found no new evidence that challenges the EAR and RDI set in 2006 and proposes to keep the current EAR and RDI for pregnancy. The two recent reviews from Europe (Gunnarsdottir & Dahl 2012, EFSA 2014) also support the EWG's conclusion that there is no new evidence for iodine requirements and pregnancy. However, the EWG notes that in 2007 a WHO Secretariat increased the recommended intake of iodine in pregnancy to 250 μg/day (Delange et al 2007) although they also acknowledge a lack of data in this area.
5.3.4 Evidence considered in estimating the UL for Children and Adolescents ages 1 through 18 years
5.3.4.1 Previous recommended UL for Australia and New Zealand
In the 2003 report by Thomson, the ULs for children and adolescents were extrapolated from the adult UL on the basis of metabolic weight [(bodyweight)0.75].The adult UL was derived from the Lowest-Observed-Adverse-Effect level (LOAEL) of 1700 μg/day and an uncertainly factor of 1.5, giving a UL of 1,100 μg/day for adults greater than 19 years of age. This adult value was adjusted for children on the basis of body weight, but no UL was established for infants because of lack of evidence (Thomson 2003, NHMRC 2006).
31
5.3.4.2 Observational evidence
A total of 18 observational studies were identified (Table 7:29 in Appendix 3). The study by Zimmermann et al (2005) presented a dose response relationship with UIC and thyroid volume. This was an observational study of an international sample of children aged 6–12-years (n = 3319) from 5 continents with iodine excretion ranging from adequate (116 μg/L) to excessive (728 μg/L). In the combined sample, after adjustment for age, sex, and body surface area, log (thyroid volume) began to rise at a log (UI concentration) >2.7, which, when back transformed to the linear scale, corresponds to a UIC of ~500 μg/L. The EWG noted that other thyroid function markers collected in this study were in the normal range, even at high levels of iodine intake. In addition the EWG considered the 2013 study also by Zimmerman et al (2013), which was similarly conducted in an international sample of 6-12 year old children. The results indicated that compared to iodine-sufficient children, those with iodine deficiency (UIC <100 μg /L) had a higher prevalence of elevated Tg values as did those with iodine excess (UIC >300 μg/L).
Most of the studies combined the age group 6–12 years which is problematic for assessing the evidence for setting of ULs for the following NRV age categories: 4–8 years, 9–12 years, 13-18 years. For the 14– 18 years age groups, evidence was particularly sparse, with only three Level IV (cross sectional) studies with high risk of bias, two of which were conducted in refugee camps in Africa where iodine excess was related to very high iodine levels in tap water. The other study from Brazil had similar limited generalisability to the Australian and New Zealand situation.
The previous ULs set for these age groups were calculated by extrapolation from the adult UL. No direct experimental evidence was available then and little new evidence has emerged since.
5.3.4.3 Intervention studies
Two intervention studies (one Level II (RCT) and a Level III-2 study) were identified in the search for the UL in children (Huda et al 2001, Li et al 2012). However, due to the high risk of bias associated with these intervention studies, the EWG agreed these studies would not be used to set the UL in children.
5.3.4.4 Derivation of the Provisional UL
There are few studies that investigate the effects of excess dietary iodine in children for the purpose of establishing a UL. In view of the limited amount of suitable data to define a dietary intake, which corresponds to an adverse effect in thyroid function the EWG decided to establish a series of provisional upper levels of intake in children aged between 1 and 18 years.
The Committee identified one study by Zimmermann et al (2005), which could provide a sound basis to determine a threshold dose for an increase in thyroid volume in response to excess dietary iodine; this paper was evaluated using GRADE (Table 3.1). The EWG noted that an increase in thyroid volume could be considered to be an adaptation in response to high dietary iodine intake. In the absence of other indicators of thyroid dysfunction an increase in thyroid volume is not necessarily an
32
adverse effect. It is possible, given this, that the UL could be set higher.
Uncertainty factor: As this study which established a threshold dose between an enlarged thyroid gland and dietary iodine involved many children (n=3319) aged between 6 and 12 years across five continents, confidence that a daily iodine exposure resulting in a urinary excretion of 500 µg I/L will result in an enlarged thyroid gland in children is high. Accordingly, an uncertainty factor of 1 was considered appropriate because the data includes a sensitive endpoint in the most vulnerable subpopulation in humans.
The study by Zimmerman et al (2005) in children aged between 6 and 12 years was used to establish a provisional UL for the age group 9-13 years. Provisional ULs for the other age groups were extrapolated from this value using the metabolic weight formula as for the NRVs (NHMRC 2006). The daily median iodine intake was estimated by converting the UIC of 500 µg/L from the Zimmermann et al (2005) study. This was converted to 550 µg/day based on iodine excretion of 90% of dietary intake (Anderson et al 2009) and an assumed 24-hour urine volume for children of approximately 1 L (Mattson & Lindstrom 1995). These considerations result in a Provisional UL for children 9-13 years of 550 µg/day.
The formulae for extrapolating to other age groups were those specified in the Methodological Framework (Nous group 2013) and used for the NRVs 2006 (NHMRC 2006). The formula for 1-3 year age group included an adjustment for the difference in growth rate between 9-13 years (0.15) and 1-3 year olds (0.3) (NHMRC 2006). This was not a necessary consideration in calculating provisional UL for the other age groups because the growth factors for 4-8 and 14-18 year olds are the same as that for 9-13 year olds.
The approximate proportional increase in protein requirements for growth (FAO/WHO/UNU 1985) was used as an estimate of the growth factor (Table 5:12).
Table 5:12 Estimated growth factor by age group
Age group Growth factor
7 mo – 3 years 0.30
4-8 years 0.15
9-13 years 0.15
14-18 years males 0.15
FAO/WHO/UNU 1985
The reference body weights for children 4 years and older used in the calculation were those generated from data from the 2011-12 Australian Health Survey and ideal BMI for children; the most recent US reference body weight data were used for infants and children aged 1-3 years as no suitable Australian and New Zealand data were available for these age groups.
33
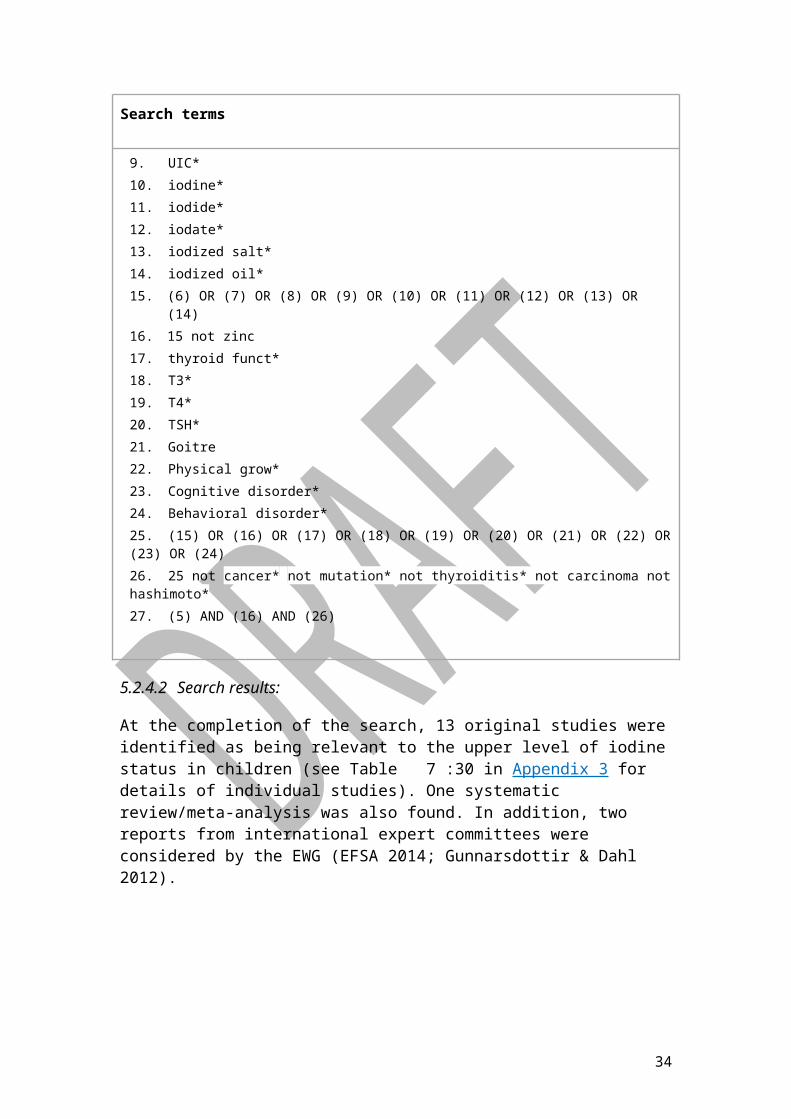
Table 5:13 ‘Ideal’ body weights for selected age and sex groups
Gender Age ‘Ideal’ Body Weight (kg)
Children 2-3 years 12
4-8 years 22
Males 9-13 years 39
14-18 years 63
19+ years 67
Females 9-13 years 40
14-18 years 57
19+ years 57
Thus the Provisional UL (PUL) for the 2-3 year, 4-8 year, 14-18 year age groups are as follows (calculated to the nearest 10µg):
PUL1-3 = PUL 9-13 * (weight 1-3/weight 9-13) 0.75 * (1+0.15)
= (550 * (12/39) 0.75 * 1.15) µg/day
= 260 µg/day
NB This calculation is based on ‘Ideal’ body weight for 1-3 year old children.
PUL4-8 = PUL 9-13 * (weight 4-8/weight 9-13) 0.75
= (550 * (22/39)0.75) µg/day
= 360 µg/day
PUL9-13 = 550 µg/day
PUL14-18 males = PUL 9-13 * (weight 14-18/weight 9-13) 0.75
= (550 * (63/39) 0.75 ) µg/day
= 790 µg/day
PUL14-18 females = PUL 9-13 * (weight 14-18/weight 9-13) 0.75
= (550 * (57/40) 0.75 ) µg/day
= 720 µg/day
NB. It should be noted that this value for females 14-18 years applies only to those who are neither pregnant nor lactating.
34

6 Guideline RecommendationsThe Iodine Expert Working Group (EWG) concluded that the most recent studies on iodine status and thyroid function in adults (ie published between 2002-2014) did not present any new evidence and that the current EAR (100 µg/day) and RDI (150µg/day) should remain unchanged from that set in 2006 (Table 6:14; Table 6:15). Similarly there was no new evidence to change the EAR (160 µg/day) and RDI (220 µg/day) for pregnant women (Table 6:16). On the other hand the EWG recommends changes to the ULs for children, based on one study which provided a sound basis to determine a threshold dose for an increase in thyroid volume in response to excess dietary iodine (Zimmermann et al 2005). However, in view of the limited data, the EWG recommends that these be renamed Provisional ULs (Table 6:17). These are compared with the current ULs in Error: Reference source not found.
6.1 Proposed recommendations
Table 6:14 Recommended Iodine EAR for adults aged 19 years and older
Gender groups/age Measurement of iodine (μg/day)
EAR for Men
19-30 years 100 μg/day of iodine
31-50 years 100 μg/day of iodine
51-70 years 100 μg/day of iodine
> 70 years 100 μg/day of iodine
EAR for Women
19-30 years 100 μg/day of iodine
31-50 years 100 μg/day of iodine
51-70 years 100 μg/day of iodine
> 70 years 100 μg/day of iodine
35
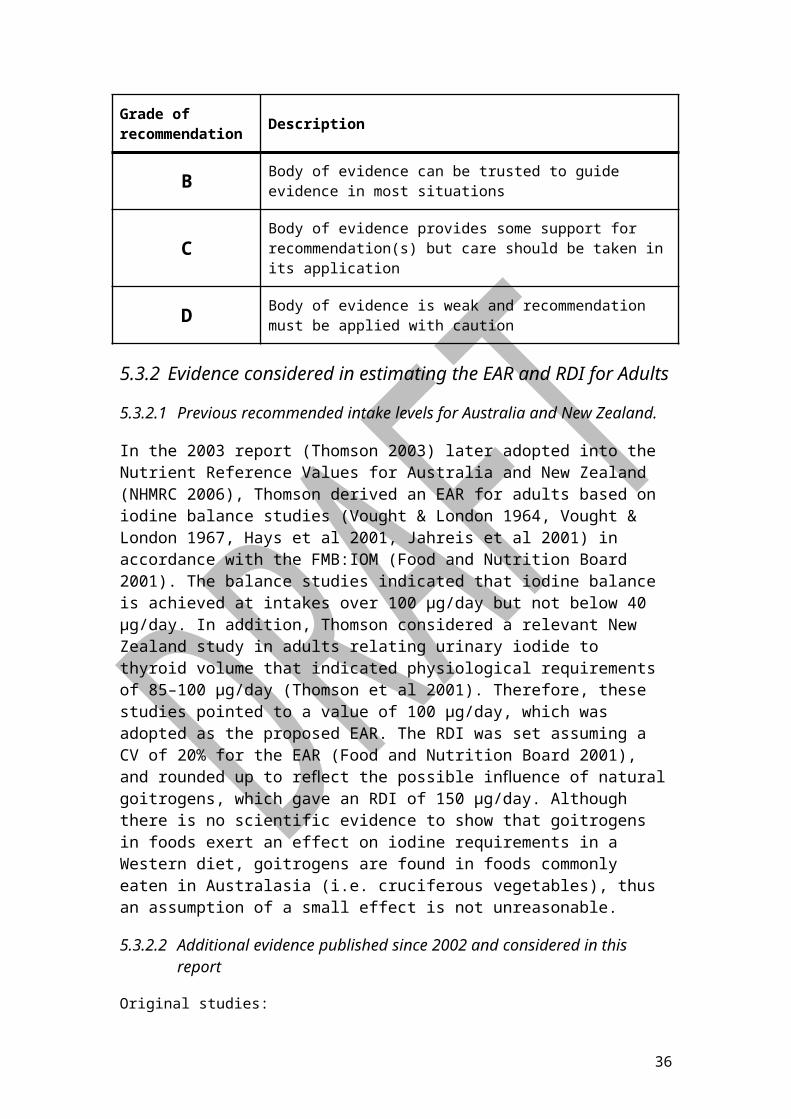
Table 6:15 Recommended Iodine RDI for adults aged 19 years and older
RDI for Men
19-30 years 150 μg/day of iodine
31-50 years 150 μg/day of iodine
51-70 years 150 μg/day of iodine
> 70 years 150 μg/day of iodine
RDI for Women
19-30 years 150 μg/day of iodine
31-50 years 150 μg/day of iodine
51-70 years 150 μg/day of iodine
> 70 years 150 μg/day of iodine
Table 6:16 Recommended EAR and RDI for pregnant women
Pregnancy Measurement of iodine (μg/day)
EAR for Pregnancy 160 μg/day of iodine
RDI for Pregnancy 220 μg/day of iodine
Table 6:17 Recommended Provisional UL of intake for children
Children Provisional UL
1-3 years 250 μg/day
4-8 years 350 μg/day
9-13 years 550 μg/day
14-18 years
Male
Female
800 μg/day
700 μg/day
36

Table 6:18 Comparison of 2006 ULs with recommended Provisional ULs for children
Children 2006 UL Provisional UL
1-3 years 200 μg/day 260 (250) μg/day
4-8 years 300 μg/day 360 (350) μg/day
9-13 years 600 μg/day 550 (550) μg/day
14-18 years
Male
Female
900 μg/day
900 μg/day
790 (800) μg/day
720 (700) μg/day
6.2 Validity
6.2.1 UL for children
In the previous review of the NRVs, ULs for children were extrapolated from relatively small (n=30 adults) dose response studies (NHMRC 2006), while in this review an attempt was made to derive the ULs from studies on children. As iodine requirements are influenced by stages of growth, deriving NRVs for children from studies of children is more likely to better reflect nutrient requirements than extrapolating from adults. In determining the UL for children, heavy reliance was placed on evidence from one study by Zimmermann et al (2005). For this reason we chose to set Provisional ULs instead of ULs. However, the study in question included data for over 3000 children aged 6-12 years from across five continents. These data were used to estimate a provisional UL for children aged 9-13 years and ULs for the other 1-3, 4-8 and 14-18 years age groups were extrapolated using metabolic weight.
6.3 Implications and ongoing challenges
6.3.1 Implications of changes to the UL for children
It is not anticipated that the recommended changes to the UL for children will have any significant implications for policy in Australia and New Zealand. During the consideration of mandatory fortification with iodine for Australia and New Zealand in 2008, comprehensive dietary modelling was undertaken. This modelling showed that fortification of bread with iodised salt would result in iodine intakes that would exceed the UL in 6% of children aged 2-3 years (FSANZ 2008). Whilst an increase in the UL for this age group from 200 to 300 µg is likely to reduce the proportion of 2-3 year olds who would exceed the UL, the magnitude of increase is unlikely to justify extending fortification of the Australian and New Zealand food supply.
37
6.3.2 Ongoing challenge of meeting pregnancy and lactation RDI
In 2010 the NHMRC and New Zealand MOH recommended that pregnant and lactating women require an iodine supplement of 150 µg/day, in addition to their dietary intake, to meet the requirements for pregnancy and lactation. This was in recognition that the mandatory iodine fortification of bread program, introduced in 2009, was designed to meet the needs of the general population but was insufficient to meet the needs of pregnant and lactating women (NHMRC 2010; MOH 2010). Given that the EWG recommended no change in the existing RDI for pregnancy, it may be necessary to continue to recommend iodine supplements for pregnant and lactating women in Australia and New Zealand in order for them to achieve recommended intakes.
6.3.3 International consistency
The recommendations of the EWG are still consistent with the Institute of Medicine (Food and Nutrition Board 2001). EFSA have recommended (not yet adopted) that an Adequate Intake be set rather than EAR and RDI because of the lack of evidence (EFSA 2014). The WHO recommended intake in pregnancy is 250 µg/day, (WHO Secretariat 2007) although some WHO/FAO publications still list the RDI in pregnancy at 200 µg/day. The recommendation of the EWG of 220 µg/day is less than the 250 µg/day from WHO, but more than the EFSA adequate intake of 200 µg/day (EFSA 2014). Thus, across countries and expert bodies, the RDI for iodine in pregnancy currently ranges from 200 to 250 µg/day.
6.3.4 Priorities for remaining questions
Due to time constraints the EWG was not able to consider all the research questions generated in Table 5.2. Future work needs to consider the remaining questions with the next priorities being:
EAR/RDI for children as there is emerging evidence of the adverse effects of mild iodine deficiency on cognitive development.
EAR/RDI for lactation as there is emerging evidence of the effect of inadequate maternal iodine intake on early cognitive development.
ULs for pregnancy and lactation given that the NHMRC and NZ MOH recommend supplementation with an additional 150 µg iodine/day during pregnancy and lactation (NHMRC 2010; MOH 2010). In New Zealand there exists a single subsidised 150 µg iodine tablet which is a registered medicine and subject to appropriate quality controls. In Australia and New Zealand there also exists a range of commercial supplements with varying iodine contents below, at and above 150 µg, that may also contain other nutrients.
6.3.5 Research required to inform NRVs
Establishing NRVs relies on available published evidence. The following areas of research have been identified as priorities that would strengthen future work on NRVs.
38
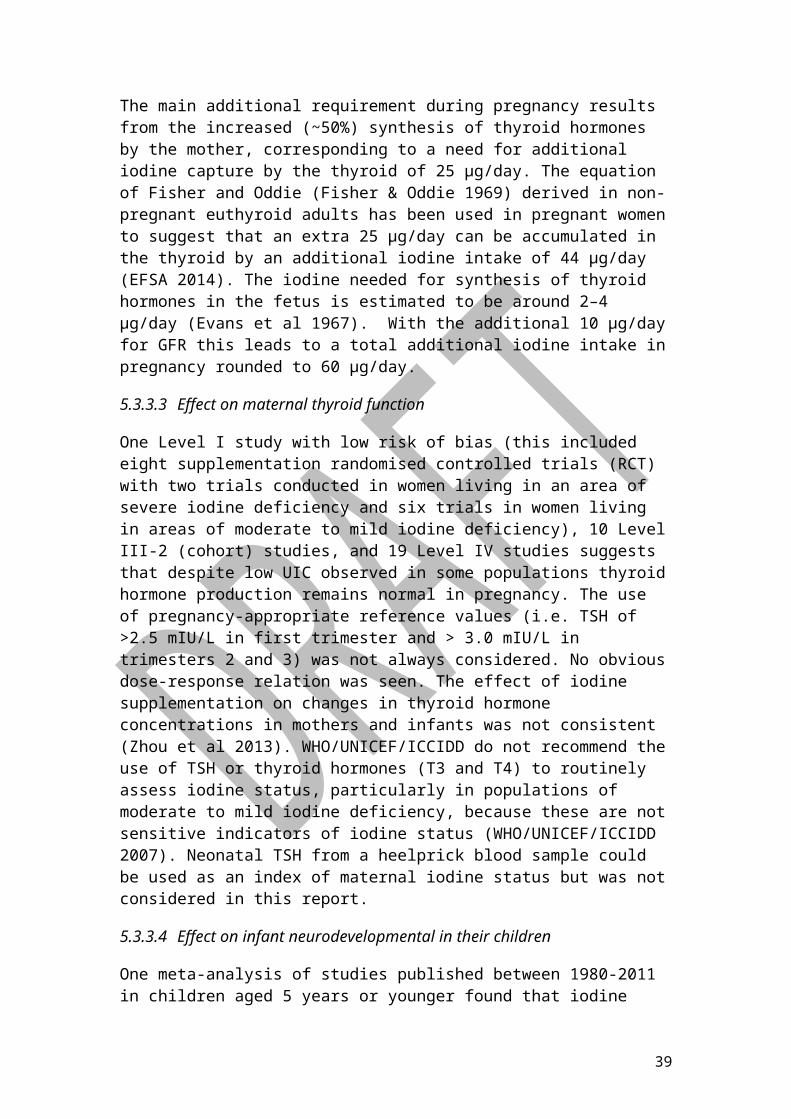
Much of the evidence informing requirements for iodine has been drawn from natural experiments either resulting from geographical areas with varying iodine nutrition or from pre-post studies following iodine prophylaxis. It is disappointing that there has been little new evidence upon which to base recommendations for iodine requirements. Focused research on dose-response studies in healthy populations would assist in providing clearer evidence for cut-points for NRVs. However, it is acknowledged that this sort of research is both costly and ethically challenging. For example it may not be ethically acceptable to undertake RCTs to determine the effect of iodine deficiency or excess intake in children or pregnant women.
More research on identifying more robust biomarkers for assessing iodine status in healthy populations, such as Tg, is required. There has been an over-reliance in many studies in using only UIC as an index of iodine status, despite the large intra- and inter-individual variation associated with UIC. This is of particular concern when assessing the iodine status of pregnant women, as many studies in pregnancy use UIC at a single time point as an indicator of iodine status for the duration of pregnancy. Another consideration is the relationship between the iodine content/stores in the thyroid and thyroid hormone synthesis. While serum TSH is regarded as the best marker of thyroid function during pregnancy, the value and appropriateness of free T4 levels remains unresolved (De Groot et al 2012).
There are very few studies that provide data on dietary iodine intakes, including national surveys. This means that iodine intakes are estimated from UIC; the assumption that 90% of dietary iodine is excreted in the urine has yet to be validated over a range of physiological conditions (i.e. pregnancy, various states of hydration, and over nutrition) and genetic factors (i.e. ethnicity).
There are a lack of data on obstetric/pregnancy complications and outcomes from maternal iodine deficiency. Studies examining the effects of changes in thyroid function, but ignoring the effects of iodine nutrition, show that suboptimal maternal thyroid hormone production may produce profound adverse obstetrical events such as miscarriage, gestational hypertension, pre-eclampsia and premature labour (De Groot et al 2012).
The Provisional ULs for children were determined using extrapolations with metabolic weights and an assumption that there is a positive and linear association between body weight and iodine requirements. Research underpinning this association is needed.
More research is needed on the adverse effects of iodine deficiency on cognitive function in children. Focusing research on specific aspects of cognition that are most likely to be affected and developing a consistent approach to measuring the size of the effect will be invaluable for future nutrient reference value work. Agreement needs to be reached in deciding upon specific, standardised tools used to undertake these behavioral studies in children as comparisons of results from different methods are often difficult and have not been validated. A complication associated with research into adverse effects of iodine relate to the fact that populations exposed to long term iodine deficiency are at greater risk of responding adversely to increasing iodine nutrition than iodine replete populations (Teng et al 2006).
39

40
7 Appendices
41
7.1 Appendix 1: Studies relating to EAR for Adults
Table 7:19 Body of Evidence for EAR and RDI for adults 19 years and older
Review Question 1 What is the average intake required by healthy adults in a population to maintain normal thyroid function, as measured by thyroid hormones and thyroid volume?
Component Rating Notes
Evidence Base Good 2 Level II + 2 Level III-2 + 1 Level III-3 + 13 Level IV studies
Consistency Excellent Consistent results for UIC with increasing iodine intake for varying reported intakes/excretion of iodine (UIC). Consistent results for normal thyroid function (TSH, thyroid volume and thyroid antibodies) across a range of UIC
Clinical impact Good The earlier balance studies indicated that iodine balance is achieved at intakes over 100 µg/day but not below 40 µg/day. Studies support normalising of thyroid function with UIC above 100 µg/L.
Generalisability SatisfactoryPopulation/s studied in body of evidence differ to target population for guideline but it is clinically sensible to apply this evidence to target population. Countries with severe I deficiency may have more adverse outcomes related to high I intakes compared to replete or mild-moderate I deficient countries such as Australia and New Zealand.
Applicability Good Applicable to Australian and New Zealand healthcare context with few caveats.
Draft Recommendation Reviewed studies do not provide evidence to change the current EAR (100 µg/day) and RDI (150 µg/day) for adults.
Recommendation B Body of evidence can be trusted to guide practice in most situations.
42
Table 7:20 Studies relating to the EAR for Adults (Review question 1)
First author year,
Area
Study design Population, participants, iodine status of area
Outcome measures
Dietary assessment method
Results Confounders adjusted for/sensitivity analysis
Study quality and comments*
Aghini Lombardi et al 2013
Pescopagano, Italy
Cross-sectional survey in 1995 & 2010
N=1148 in 2010 & n= 1411 in 1995
TV, TSH, FT3, FT4, TgAb, TPOAb,UIE
Use of iodized salt
Goitre rate was lower in 2010 than in 1995 (25.8% vs 46.1%, P<0.0001). In 2010 vs. 1995, thyroid autonomy in subjects younger than 45 yrs (3 of 579, 0.5% vs. 25 of 1010, 2.5% P = .004) & non-autoimmune hyperthyroidism in subjects older than 45 yrs old (8 of 569, 1.4% vs. 18 of 401, 4.5%, P = .03) were less frequent. The rate of hypothyroidism was higher in 2010 vs. 1995 (5.0% vs. 2.8%, P =0.005), mainly because of an increased frequency of subclinical hypothyroidism in subjects younger than 15 yrs (7 of 83, 8.4% vs. 0 of 419, 0.0%, P < .0001).
Serum thyroid autoantibodies (19.5% vs. 12.6%; P<0.0001) & Hashimoto's thyroiditis (14.5% vs. 3.5%; P<0.0001) were more frequent in 2010 than in 1995
N/A Level IV
Effect of voluntary iodine prophylaxis
43
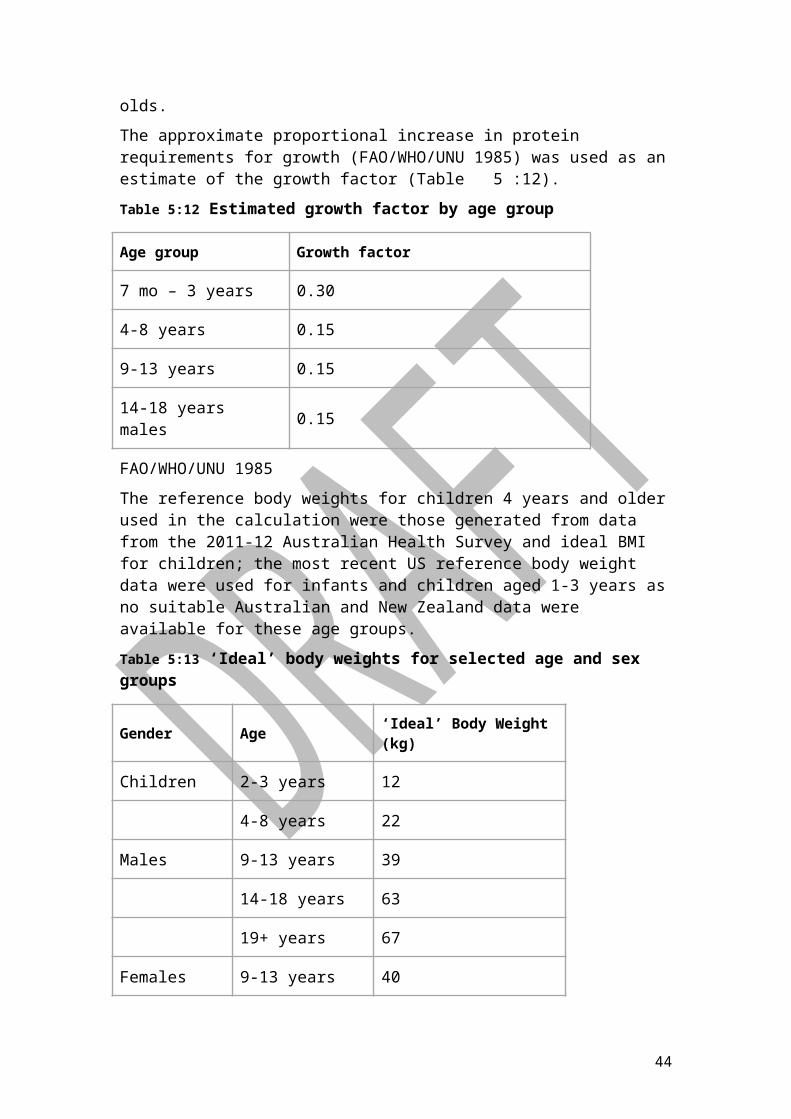
First author year,
Area
Study design Population, participants, iodine status of area
Outcome measures
Dietary assessment method
Results Confounders adjusted for/sensitivity analysis
Study quality and comments*
Ayturk et al, 2009
Turkey
Case-control study
N=539 (total)
n=278 in the metabolic syndrome group (33.1% male) & n=261 in the control group
(30.7% male)
Newly diagnosed patients with metabolic syndrome
(18-74 yrs) & controls
Mild-to moderate ID
TV, TSH,
& nodule prevalence, anthropometry, FT3, FT4, TSH .
No information on iodine nutrition (neither urine iodine nor iodine intake)
TSH was correlated with the presence of metabolic syndrome.
Insulin resistance, waist circumference & triglycerides independent predictors of
TV. TSH was significantly correlated with the presence of MetS. In a multiple linear regression analysis, independent predictors of TV (mL) were (B, 95% CI); waist circumference
(cm) 0.335 (0.089- 0.161), triglycerides
(mg/dL) 0.136 (0.003-0.016), & insulin resistance 0.143 (0.512-2.731).
BMI, smoking, fatmass
Level III-3
No measure of iodine status based on the area being mild to moderately deficient
Bulow Pedersen et al, 2011
Denmark
Two cross-sectional population studies.
Group 1: n= 4649 (median UI 61 μg/liter)
group 2: n= 3570 (median UI 101
TPO-Ab & Tg-Ab
Not assessed Antibodies were more common in group 2. Than group 1: TPO-Ab > 30 U/ml, group1 vs. group2: 14.3 vs. 23.8% (p < 0.001); Tg-Ab > 20 U/ml, group1 vs. group2: 13.7 vs. 19.9% (p < 0.001). The group2 vs.
Bread, fish, water & milk intake, estimated salt intake, iodine
Level IV
44

First author year,
Area
Study design Population, participants, iodine status of area
Outcome measures
Dietary assessment method
Results Confounders adjusted for/sensitivity analysis
Study quality and comments*
μg/litre) group1 effect was confirmed in multivariate regression models (group1 reference): TPO-Ab: OR (95% CI): 1.80 (1.59-2.04); Tg-Ab: 1.49 (1.31-1.69). The increase in frequency of thyroid antibodies was most pronounced in young females & especially observed at low concentrations of antibodies.
supplements, education, self-rated health, smoking, alcohol intake & physical activity
Camargo et al, 2008
Sao Paulo, Brazil
Population based, cross-sectional study
N= 1085
Population exposed to excessive iodine intake for 5 yrs (table salt iodine concentration 40-100mg/kg salt).
TV, TSH, FT4, UIC, TPO, thyroid echogenicity,
Sample of salt consumed in the home were taken
Table salt at the time of the study was 20-60 mg/kg salt. In 45% UI excretion was above 300 μg/l & in 14.1 above 400 μg/l.
Prevalence of Chronic autoimmune thyroiditis (CAT) was 16.9%.
8% of population with CAT had hypothyroidism. Hyperthyroidism was diagnosed in 3.3% & Goitre in 3.1% of population.
Level IV
Combet et al, 2014
A 14-day intervention study
N=42
Mildly iodine deficient
UIC, TSH, TT3, FT3, TT4, FT4 & Tg
Iodine-specific FFQ & 4-day weighed food
Median UIC at baseline and 14-day were 78 & 140 μg/L respectively; TSH at 14-day was significantly
Level II
45

First author year,
Area
Study design Population, participants, iodine status of area
Outcome measures
Dietary assessment method
Results Confounders adjusted for/sensitivity analysis
Study quality and comments*
Glasgow, UK Subjects took 356 μg iodine daily
diary higher (p˂0.001) after supplementation. No significant difference was observed in TT3, TT3, TT4, FT4 and Tg after supplementation.
Du et al, 2014
Caizhuang, Dongwenzhuang, Fengrun, Yangfang, Xicuan, Shuangzhai, Houhuangtai, Lizhuang, Anrong, Hutong & Tieshangang,
China
Cross sectional study
N=2147
Tieshangang (iodine deficient area), Xicuan, Shuangzhai, Houhuangtai, Lizhuang, Anrong & Hutong (iodine sufficient areas) , Caizhuang, Dongwenizhuang, Fengrun & Yangfang (iodine excess areas)
UIC, TSH, FT3, FT4, TgAb,TPOAb, TRAb & TV
Questionnaire on smoking and drinking habits; sample of iodized salt & drinking water taken in preselected iodine deficient area
Median UICs for iodine deficient, iodine sufficient and iodine excess areas were 62, 229 & 750 μg/L, respectively. TSH was significantly correlated with deficient iodine intake (β =-1.219, p=0.028) & excess iodine intake (β =1.764, p=0.001).
Level IV
Elahi & Hussain, 2013
Cross-sectional
N=110 TSH, FT3 & FT4 Use of iodized salt
Mean TSH, FT3 and FT4 were 1.4 mU/L, 3.2 pmol/L & 15.6 pmol/L,
Level IV
46

First author year,
Area
Study design Population, participants, iodine status of area
Outcome measures
Dietary assessment method
Results Confounders adjusted for/sensitivity analysis
Study quality and comments*
Lahore, Pakistan
study
Severely iodine deficient area
respectively.
28% of the subjects used iodised salt
Leung et al, 2011
Boston, USA
Cross-sectional
n=78 vegetarians, n=63 vegans
Without thyroid disease & not pregnant
Iodine sufficient
UIC, T4, TSH, perchlorate & thiocyanate concentrations
Soy FFQ & questionnaire on iodine supplement use
Median UIC of vegans (78.5 μg/litre; range 6.8-964.7 μg/litre) was lower than vegetarians (147.0 μg/L; range 9.3-778.6 μg/L) (P < 0.01).
Median urinary thiocyanate concentration of vegans (630 μg/L; range 108-3085 μg/L) was higher than vegetarians (341 μg/L; range 31-1963 μg/litre) (P < 0.01).
No between-group differences in urinary perchlorate concentrations (P = 0.75), TSH (P = 0.46), & FT4 (P = 0.77). Urinary iodine, perchlorate, & thiocyanate levels were not associated with TSH (P = 0.59) or FT4 (P = 0.14), even when adjusted for multiple variables.
Smoking, thiocyanate-rich food consumption
Level IV
Low Generalizability to Australian population
47
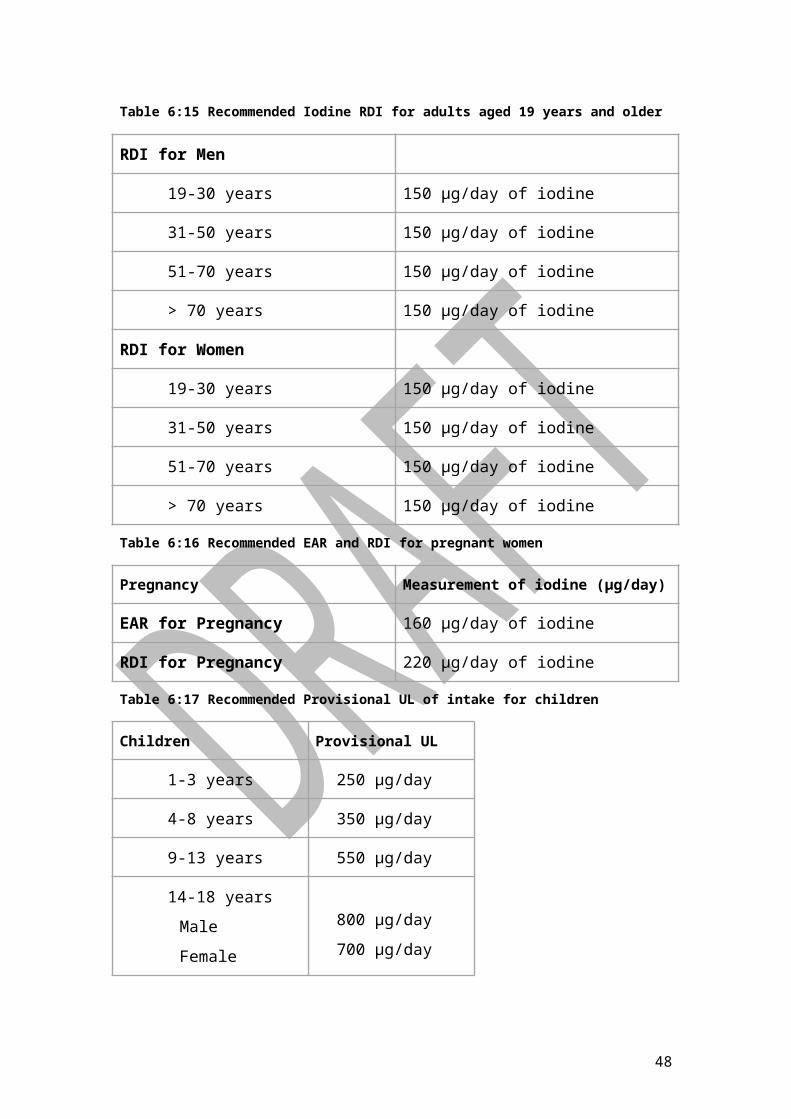
First author year,
Area
Study design Population, participants, iodine status of area
Outcome measures
Dietary assessment method
Results Confounders adjusted for/sensitivity analysis
Study quality and comments*
Krejbjerg et al, 2014
Copenhagen & Aalborg, Denmark
Longitudinal population-based study
N=2208
Copenhagen (mild iodine deficiency) & Aalborg (moderate iodine deficiency)
UIC & TV FFQ At follow-up, the median UIC in Copenhagen increased from 61 to 73 μg/L & in Aalborg from 45 to 76 μg/L respectively. At follow-up, median thyroid volume increased significantly in Copenhagen (p=0.001), whereas median thyroid volume in Aalborg decreased (p=0.07).
Age, gender, smoking status, familial disposition, region, baseline BMI, baseline TSH, baseline TPOAb, baseline hypoechogenicity, baseline thyroid enalrgement & baseline multinodularity
Level IV
Kocak et al, 2014
Trabzon,
Cross-sectional study
N=2500 UIC, TSH, FT3, TPOAb, TgAb, Tg & TV
Questionnaire including the type of salt used.
Median UICs for adults with no goitre and a goitre were 123 and 123 respectively. Mean TSH was significantly higher in adults with
48

First author year,
Area
Study design Population, participants, iodine status of area
Outcome measures
Dietary assessment method
Results Confounders adjusted for/sensitivity analysis
Study quality and comments*
Turkey no goitre (p˂0.0005) than adults with a goitre. Mean FT3 was significantly lower in adults with no goitre (p=0.002) than adults with a goitre. Mean FT4 was significantly lower in adults with no goitre (p=0.008) than adults with a goitre.
Meisinger et al, 2012
Germany (South vs. Northeast (NE))
2 population-based surveys using standardised protocol: the study of health Pomerania (NE) & Kooperative Gesundheitdforschung (South)
n=2505 (south) & n=2316 (NE)
(Age 25-74 yrs), no known thyroid disease
Moderate (NE), moderate-severe (south) ID
UIC, TSH, TV No assessment Median UIC was 110 mg/l (64; 169 mg/l) in NE & 151 mg/l (97; 214 mg/l) in South. Median TSH was 0.81 mIU/l (0.56; 1.15 mIU/l) in NE & 1.22 mIU/l (0.84; 1.80 mIU/l) in South.
Frequency of elevated TSH (TSH ≥2.12 mIU/l) was 4.3% in NE & 14.1% in South (P<0.001). Suppressed TSH (<0.25 mIU/l) was seen in 3.5 (NE) & 1.7% (south)(P<0.001).
The proportion of ultrasonographic findings was 55.5% in NE & 68.0% in South.The frequency of serum TPO-Abs
Study region, age and sex.
Smoking habit
Level IV
49

First author year,
Area
Study design Population, participants, iodine status of area
Outcome measures
Dietary assessment method
Results Confounders adjusted for/sensitivity analysis
Study quality and comments*
did not differ between NE & South
Meng et al, 2013
Gansu, Shandong, Fujian, Jilin, Anhui & Chongqing provinces, China
Cross sectional study
N=699 UIC, TSH,FT4,Tg, TgAb & TPOAb
Household salt samples
Median UIC, TSH, FT4 and Tg were 260 μg/L, 1.8 mU/L, 16.6 pmol/L & 7.0 μg/L, respectively. TSH decreased from ~ UIC 50 to 300 μg/L and increase from UIC 300 to 550 μg/L.
Level IV
Rasmussen et al, 2008
Denmark
Two cross-sectional studies before & after mandatory fortification
Group 1: n= 4649 (median UI 61 μg/liter) (before fortification was introduced)
Group 2: n= 3570 (median UI 101 μg/liter )(after mandatory iodization of salt)
FFQ UIC increased in all age & sex groups after fortification. However, the iodine intake was still below the recommended in the youngest age groups in both cities & in women 40–45 yrs of age living in Aalborg.
Intake of milk & salt had strong significant direct associations with iodine excretion (P <0·001).
Bread, fish, water & milk intake, estimated salt intake, iodine supplements, education, self-rated health, smoking, alcohol & physical
Level IV
Large groups, but different samples (pre and post)
Same participants in Bulow Pedersen [59]
50

First author year,
Area
Study design Population, participants, iodine status of area
Outcome measures
Dietary assessment method
Results Confounders adjusted for/sensitivity analysis
Study quality and comments*
activity
Rasmussen et al, 2013
Denmark
Prospective cohort
(Danish DanThyr cohort)
Followed up at 11 yrs
N= 2465 UIC, Iodine intake, Bodyweight & height, supplement use
FFQ & supplement questionnaire
Median (IQR) UIC increased by 19 (-25-68) μg/L to 83 (47-133) μg/L. Estimated 24-h iodine excretion increased by 36 (-21-95) μg/24-h to 134 (93-206), & calculated total iodine intake (diet plus supplements) increased by 16 (-18-48) μg/day. Iodine excretion increased in all age & gender groups, but was still below the recommended amount at follow-up.
Increase in iodine excretion was positively associated with milk intake, supplement use & bread intake at follow-up. Salt intake, education, self-rated health, smoking, alcohol & physical activity were not associated with the increase in iodine excretion.
Bread, fish, water & milk intake, estimated salt intake, iodine supplements, education, self-rated health, smoking, alcohol intake & physical activity
Level III-2
Sang et al A 4-wk, double-blind,
N= 256 euthyroid adults
Total iodine intake, FT4, FT3,
24-hr recall The mean iodine intake from the diets & salt intake were 105 ± 25 &
Level II, low
51

First author year,
Area
Study design Population, participants, iodine status of area
Outcome measures
Dietary assessment method
Results Confounders adjusted for/sensitivity analysis
Study quality and comments*
2012
Tianjin China
placebo-controlled, RCT
Randomly assigned to 1 of 12 intervention groups with various
iodine supplement doses ranging from 0 to 2000 μg/d
Iodine sufficient UIC, TSH, TPOAb, TGAb, TV
258 ± 101 μg/d, respectively. In comparison with the placebo group, all iodide-supplemented groups responded with significant increases in median UIC (P < 0.05) & in TSH concentration (P < 0.05). TV decreased after 4 wk in the high-iodine intervention groups (1500-2000 μg). Subclinical hypothyroidism appeared in the groups that received 400μg iodine suppl (giving total intake of 800 μg/day) (5%) & 500-2000 μg Iodine suppl (15-47%).
risk of bias
Dose response study, but n per group small
Useful to determine UL (1500-2000 ug in high dose arm)
Teng et al, 2006
3 communities in China (Panshan, Zhangwu
and
Prospective Cohort
N= 3018
Panshan & Zhangwu (northeastern
China, mild-moderate ID) &
Huanghua (excessive
TV, nodules, TSH, UIC, Anti-TPO, TG, TGAb
Among the mildly deficient iodine intake, those with more than adequate intake, & those with excessive intake, the cumulative incidence of overt hypothyroidism was 0.2%, 0.5%, & 0.3%, respectively; that of subclinical hypothyroidism, 0.2%, 2.6%, & 2.9%, respectively; & that
Level III-2
But with caveats
Analysis by region (n = 3 groups). Group defined as mild iodine
52

First author year,
Area
Study design Population, participants, iodine status of area
Outcome measures
Dietary assessment method
Results Confounders adjusted for/sensitivity analysis
Study quality and comments*
Huanghua) Iodine intake) of autoimmune thyroiditis, 0.2%, 1.0%, & 1.3%, respectively.
Among subjects with euthyroidism & antithyroid antibodies at baseline, the 5-yr incidence of elevated serum thyrotropin levels was greater among those with more than adequate or excessive iodine intake than among those with mildly deficient iodine intake. A baseline serum thyrotropin level of 1.0 to 1.9 mIU per litre was associated with the lowest subsequent incidence of abnormal thyroid function.
deficiency had MUIC of 97 (46-137) ug/L – “normal”?
No adverse effect on overt hypothyroidism. Good retention (80%), similar across three regions of high MUIC, but some evidence of increased effect at MUIC > 200 ug/L for subclinical hypothyrodism and autoimmune thyroiditis.
5 yr follow-up may be too
53

First author year,
Area
Study design Population, participants, iodine status of area
Outcome measures
Dietary assessment method
Results Confounders adjusted for/sensitivity analysis
Study quality and comments*
short for long latency period disease
Generalizability to Australia and NZ questionable
Tonacchera et al, 2012
Italy
Intervention
Iodized vegetables
Vege serve =
100 g potatoes, carrots, tomatoes, or salad containing 45 mg of iodine.
N=50 (age 19-50)
Participants consumed a single serving of vegetables /day for 2wks
UI excretion (baseline, during & end of study). TV, TSH, FT4, FT3, TPOAb, TGAb (baseline & end of study)
The UI concentration measured in volunteers before the intake of vegetables was 98.3 mg/L (basal value), increasing to 117.5 mg/L during the intake of vegetables. 7 days after the discontinuation of vegetable intake, UI was 85 mg/L. UIC increment was 19.6% compared with the basal value (P =0.035).
Level IV
Non-randomised
No control group
Before-after design
van de Ven et al, 2014
Two cross sectional
N=980 UIC, TSH, TT3, FT4 & TPOAb
No assessment At follow-up, the median UIC was 130 μg/L. TSH decreased by 5.4%
Level IV
54
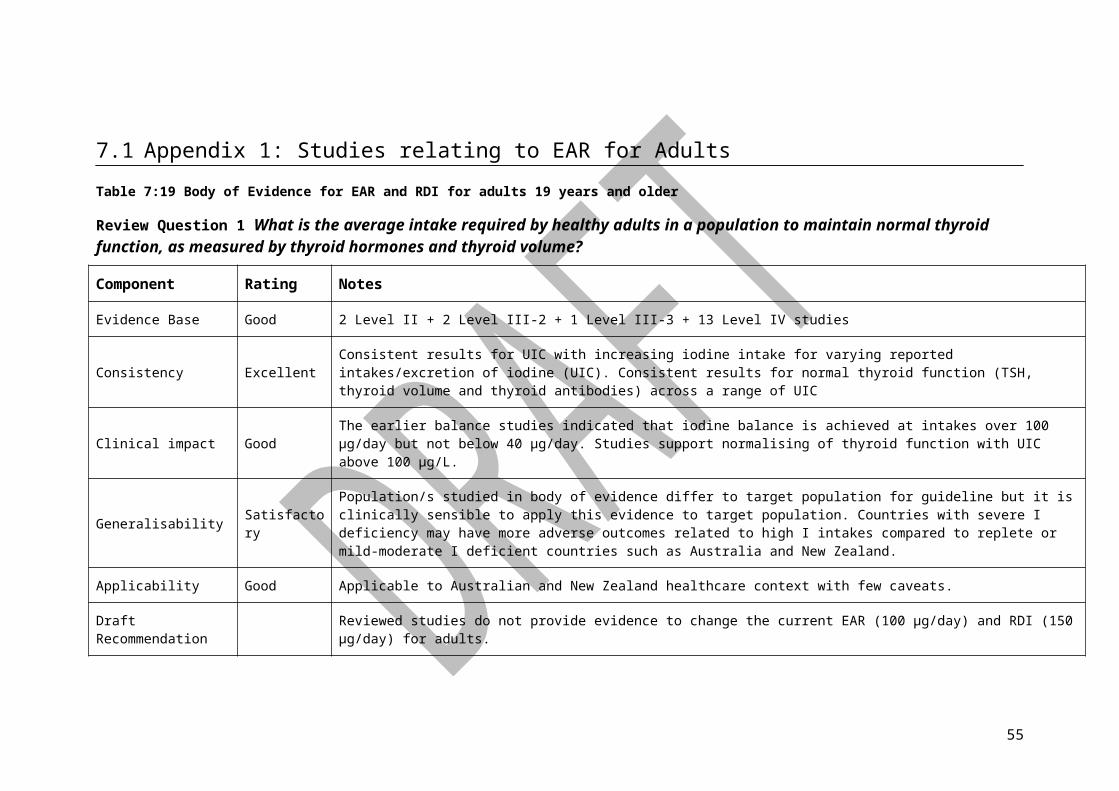
First author year,
Area
Study design Population, participants, iodine status of area
Outcome measures
Dietary assessment method
Results Confounders adjusted for/sensitivity analysis
Study quality and comments*
Nijmegen, Netherlands
surveys (95%CI 2.5-8.3%) & FT4 increased by 3.7% (95%CI 2.9-4.65).
Vejbjerg et al, 2007
Northern
Copenhagen, & Aalborg
Two cross-sectional studies before & after mandatory fortification
Group 1: n= 4649 (median UI 61 μg/litre) (before fortification of salt was introduced)
Group 2: n= 3570 (median UI 101 μg/litre)(after mandatory iodization of salt)
TV, nodules, UIC
Questionnaire on eating & drinking habits
There was a lower median TV in all age groups after iodization. The largest relative decline was among the younger females from the area with previous, moderate iodine deficiency. After iodization, there were no regional differences in median TV in the age groups younger than 45 yr.
After adjustment, a lower mean TV was seen among those with multiple nodules in both areas & in the group with diffuse structure in the area with moderate iodine deficiency. Before the iodization, 17.6% of the total cross-section had thyroid enlargement; after the iodization, 10.9% of the cross-section had thyroid enlargement.
region, sex, age, lifestyle (tobacco, alcohol, iodine supplementation, & oral contraceptives), familial disposition
(at least one first-degree relative with thyroid disease), educational level, parity, & BMI
Level IV
Pre-post but in different groups; intervention not controlled by researchers (more like a natural experiment – high risk of bias, no control of confounders).
Rasmussen et al, 2008 [63]
Abbreviations ID iodine deficiency, TV thyroid volume, TRAb, thyrotropin receptor antibody, BMI Body Mass Index, UIC urinary iodine concentration, FFQ food frequency questionnaire, yr year, *NHMRC reference for quality rating. Aetiology ranking system used for studies used to determine EAR.
55
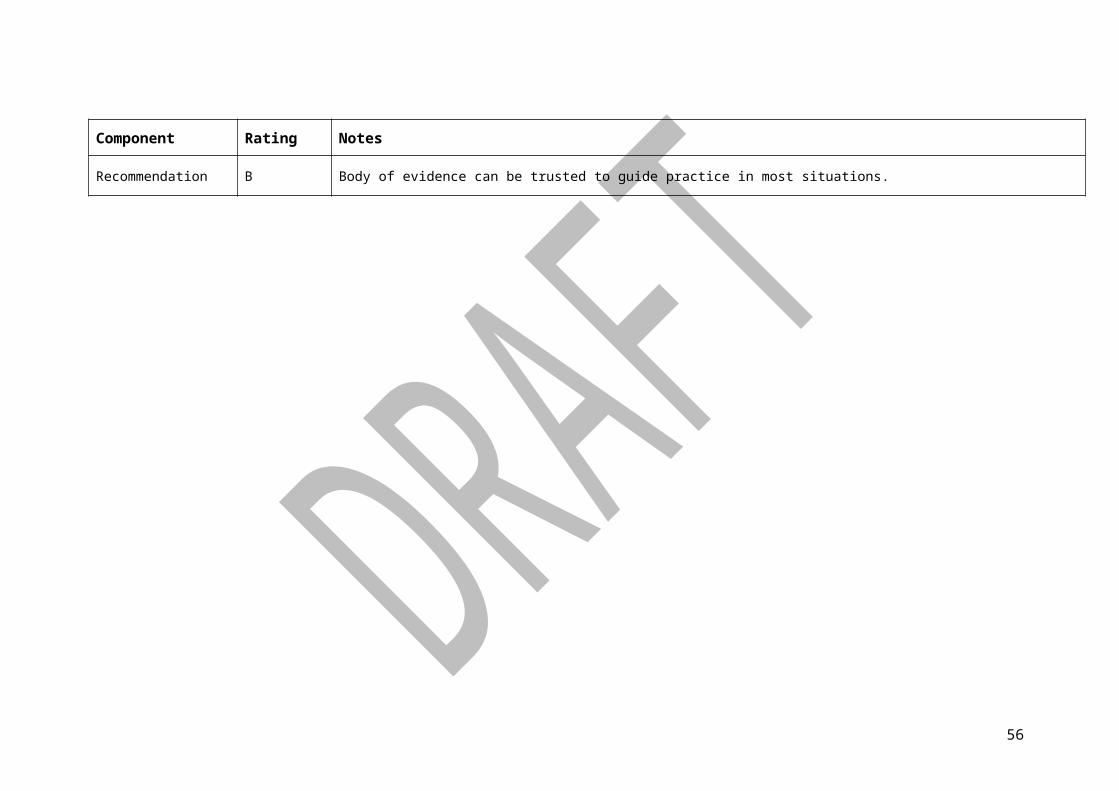
7.2 Appendix 2: Studies relating to EAR for Pregnancy
Table 7:21 Body of Evidence for EAR and RDI for pregnant women
Review Question 3: What is the average intake required by healthy pregnant women in a population to maintain normal thyroid function as measured by maternal thyroid function and neurodevelopment in their children?
Component Rating Notes
Evidence Base Poor
Thyroid function: 1 Level I study with low risk of bias + 10 Level III-2 (cohort) studies + 19 Level IV (cross sectional) studies
Neurodevelopment: 2 Level I studies (one includes n=24 studies, but only 2 RCTs; the other includes n=12 RCTs, of which only 2 (with high risk of bias) report cognitive outcomes) + 2 Level II (RCTs) with low risk of bias + 7 level III-2 studies (birth cohort) with moderate risk of bias (potential for confounding, loss to follow-up)
Consistency Poor Lack of consistency between studies.
Clinical impact Moderate Thyroid function: Despite a low UIC observed in some populations, thyroid hormone production remains normal in pregnancy. Not all studies used pregnancy-appropriate reference values for TSH of >2.5 mIU/L in first trimester and > 3.0 mIU/L in trimesters 2 and 3. No obvious dose-response relation was seen. The effects of iodine supplementation on changes in thyroid hormone concentrations in mothers and infants were not consistent. In the meta-analysis, one of the three iodine intervention studies conducted in mild to moderate iodine deficiency countries reported increased maternal T4 levels; none reported increased maternal T3 levels. Only one of the 6 RCTs found reduced maternal TSH levels after iodine supplementation.
Neurodevelopment: Meta-analysis showed benefit of adequate iodine status on IQ in children aged <5 years. The 2 level II studies showed inconsistent results (one positive effect of iodine supplementation on neurocognitive functioning in children aged 5-7 years, the other demonstrated worse outcomes at 6– 18 mo, compared to iodised salt use in pregnancy) but the different age groups of children and use of psychomotor instruments between studies is problematic. Two RCTs included in a meta-analysis reported reduced cretinism and improved IQ in children living in areas of severe iodine deficiency associated with maternal iodine supplementation. All studies in older children (5–9 years) consistent and in favour of iodine
56
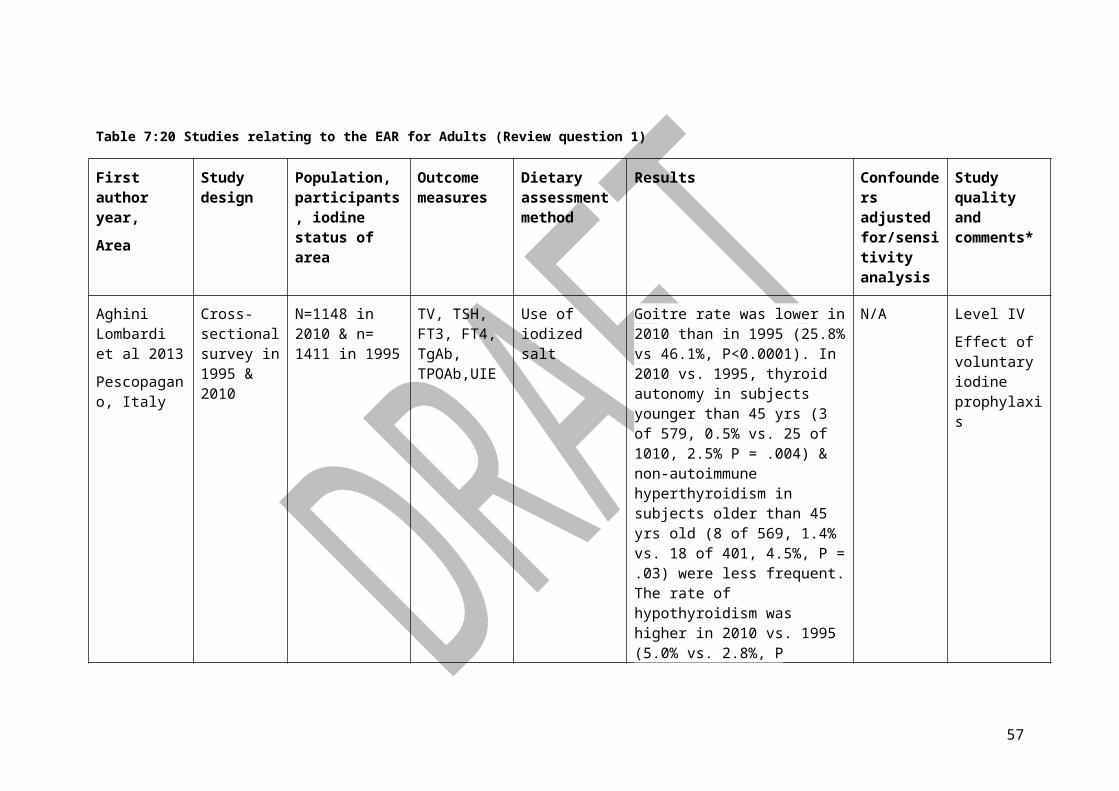
Component Rating Notes
supplementation.
Generalisability Satisfactory
Thyroid function: Population studies in body of evidence similar to the target population for the guideline
Neurodevelopment: Studies undertaken in populations with different iodine status, ranging from severe (China) and moderate (Spain) iodine deficiency to iodine replete (Netherlands). Improved verbal IQ, reading, spelling skills at age 8-9y demonstrated in two large Level III-2 studies in Australia and UK; both countries have mild ID.
Applicability Satisfactory Thyroid function: Directly applicable to Australian healthcare context (evidence from mild to moderate I deficiency countries).
Neurodevelopment: Probably applicable to Australian and New Zealand healthcare context with some caveats.
Draft Recommendation
Thyroid function: There is insufficient evidence with regard to maternal indices or child development that could be used to set or modify the EAR or RDI in pregnancy. In the absence of no new evidence to challenge the EAR and RDI set in 2002, it is proposed that the current EAR and RDI for pregnancy is kept at 160 ug/day and 220 ug/day, respectively.
Neurodevelopment: Evidence could not be considered for changing EAR for pregnancy based on limited information on neurological outcomes in children.
It should be noted that pregnancy outcomes were not evaluated as no studies assessed pregnancy outcomes.
Recommendation CThyroid function: Body of evidence provides some support for recommendation(s) but care should be taken in its application. Neurodevelopment: Body of evidence provides some support for recommendation(s) but care should be taken in its application.
Table 7:22 Studies related to pregnancy EAR and thyroid function during pregnancy (Review Question 3)
Observational studies
57

First author year,
Area
Study design Population, participants, iodine status of area
Outcome measures
Dietary assessment method
Results Confounders adjusted for/sensitivity analysis
Study quality and comments
Aguayo et al, 2013
Biscay, Spain
Prospective cohort N=2014 (1st trimester)
N= 1322 (2nd trimester)
N=1868 neonatal TSH
Baseline Iodine status of population not specified
TSH, FT4, FT3, TPO-Ab, UIC (spot) in 1st and 2nd trimester
Neonatal TSH
No assessment In the 1st & 2nd trimester median UICs were 88.5 µg /L and140 µg /L, respectively. No relationship was found between UIC & FT4, or maternal & neonatal TSH. In trimester 1&2,9.7% and 7.5% of women were TPO-Ab positive, respectively. The percentage of miscarriages in healthy women was 8.9%, 21.2% women with overt hypothyroidism (p < 0.001) and 15.6% in women with subclinical hypothyroidism (p < 0.025). The miscarriage rate was not higher in TPO-Ab-positive women.
Level III-2
Amouzegar et al, 2014
Tehran, Iran
Prospective cohort
Followed throughout pregnancy
N=203 pregnant women not taking iodine supplements
UIC, TSH, TT3, TT4, FT4I, TgAb & TPOAb
No assessment Median UICs in the 1st, 2nd & 3rd trimesters were 218, 160 & 148 μg/L, respectively. In the 1st trimester, three spot urine samples were collected.
Median TSH was significantly lower in the 1st trimester (p=0.004) than in the 2nd & 3rd trimesters. Mean TT4 was significantly lower in the 1st trimester (p=0.00) than in the 2nd & 3rd trimesters. No significant difference was observed in TT3 between
Level III-2
58
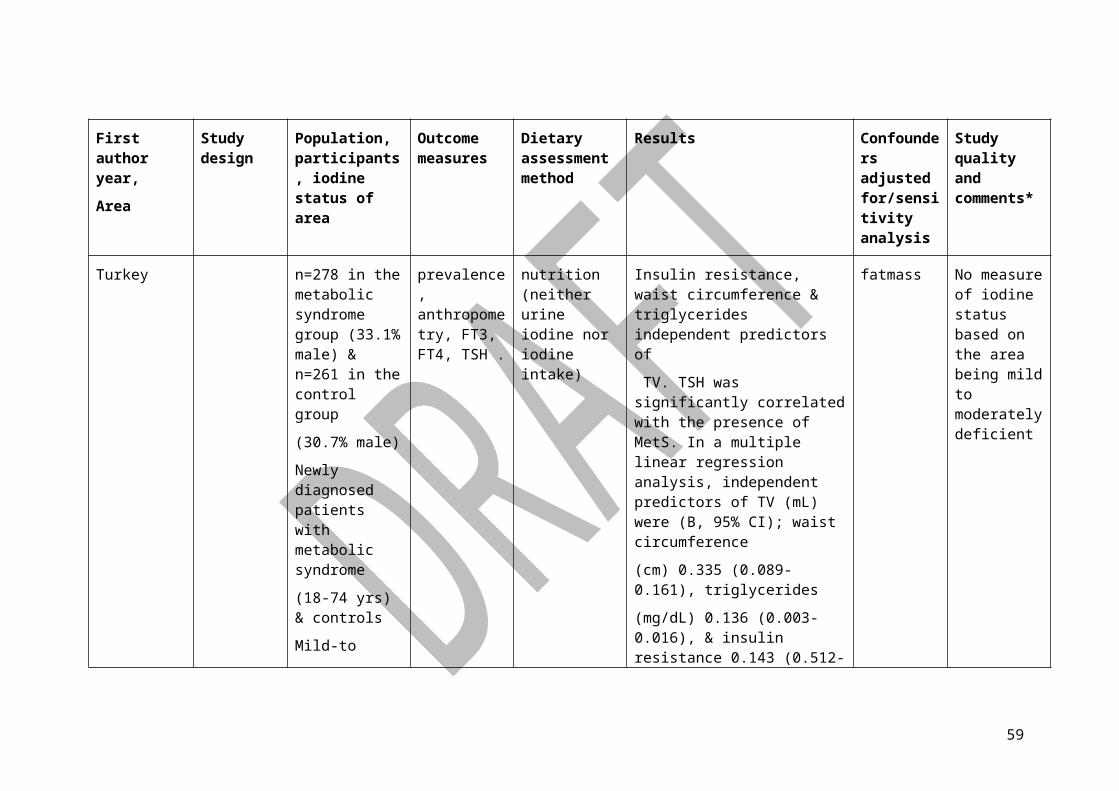
First author year,
Area
Study design Population, participants, iodine status of area
Outcome measures
Dietary assessment method
Results Confounders adjusted for/sensitivity analysis
Study quality and comments
the trimesters.
Antonangeli et al, 2002
Pisa Italy
Prospective cohort
Followed up at 1st antenatal visit, the 18th–26th, & 29th–33rd wk of gestation, & at the 3rd & 6th mth after delivery.
N=86 pregnant women (randomized into 2 groups & treated daily for 6mths after delivery) with 200 μg iodide/day (group A) or 50μg iodide/day (group B).
Marginally iodine deficient
TV, TSH, FT4, FT3, and UIC
TgAb, TPOAb
No assessment No significant changes in serum free thyroid hormones and TSH concentrations were found during gestation in either group.
Level III-2
Supplementation given after delivery
Blumenthal et al, 2012
Sydney
Cross-sectional
At antenatal visit (between 7 & 11 wks gestation)
N=367 TSH, FT4
UI excretion (spot)
Median UIC for all women was 81 μg/l (interquartile range 41-169 μg/l). 71.9% of the women exhibited a UIC of <150 μg/l. 26% of the women had a UIC <50 μg/l, and 12% had a UIC <20 μg/l. The only detectable influences on UIC were daily milk intake and pregnancy supplements.
Level IV
59
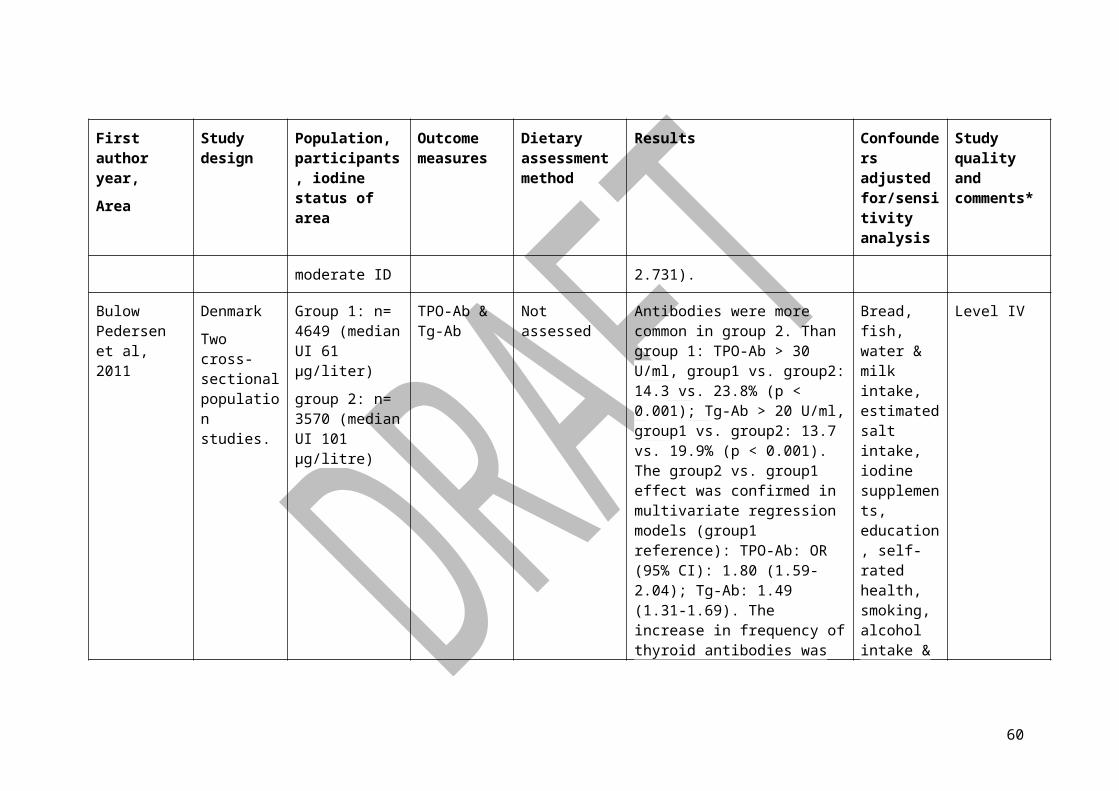
First author year,
Area
Study design Population, participants, iodine status of area
Outcome measures
Dietary assessment method
Results Confounders adjusted for/sensitivity analysis
Study quality and comments
No association between UIC and thyroid function and no evidence for an effect of iodine intake on thyroid function
Brucker-Davis et al, 2013
Nice, France
Prospective, randomised, intervention study
Follow throughout pregnancy & 3 mo postpartum.
RCT
G1 (n=32): pregnancy vitamins with 150 μg iodine
G2 (n=54): pregnancy vitamins without iodine
Median UICs for the iodine supplemented and control groups were 111 &103 μg/L.
UIC, TSH, FT3, TT4, FT4, Tg, TgAb, TPOAb, TBG & TV
Median UICs in the 2nd & 3rd trimesters were significantly higher in iodine group (p≤0.05 & p≤0.001) than placebo group. No significant difference was observed in TSH, FT3, TT4, FT4 & Tg in 2nd & 3rd trimesters between both groups.
Both groups received a document on how to achieve optimum dietary intake.
Level II
60
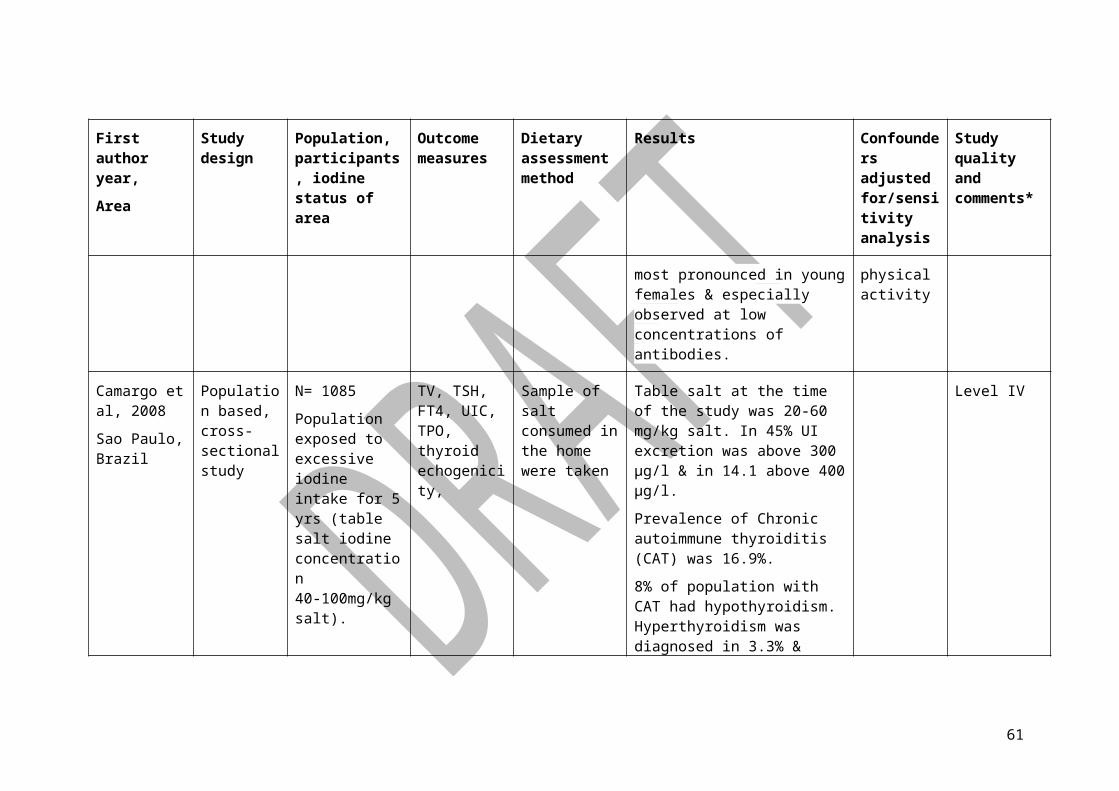
First author year,
Area
Study design Population, participants, iodine status of area
Outcome measures
Dietary assessment method
Results Confounders adjusted for/sensitivity analysis
Study quality and comments
Charoo et al, 2013
Kashmir, India
Prospective cohort
Followed throughout pregnancy
N=51 pregnant women in the 1st trimester
UIC, TSH, TT3, FT3, TT4 & FT4
No assessment Median UICs in the 1st, 2nd & 3rd trimesters were 144, 134 & 123 μg/L, respectively. Mean TSH increased from 4.1 in the 1st trimester to 5.1 mU/L in the 3rd trimester. Mean TT3 decreased from 1.7 in the 1st trimester to 1.5 ng/dL in the 3rd trimester. Mean FT3 decreased from 5.7 in the 1st trimester to 4.2 pmol/LL in the 3rd trimester. Mean TT4 decreased from 13.6 in the 1st trimester to 11.6 μg/dL in the3rd trimester. Mean FT4 decreased from 19.4 in the 1st trimester to 14.2 pmol/L in the 3rd trimester.
All pregnant women did not take iodine supplements. Only healthy women were included.
Level III-2
Elahi & Hussain, 2013
Lahore, Pakistan
Prospective cohort
Followed throughout pregnancy
N=254 pregnant women
Severely iodine deficient area
UIC, TSH, FT3 & FT4
Use of iodized salt
Median UIC in the 1st trimester was 67 μg/L. Median TSH was significantly lower in the 1st trimester (p<0.05) than in the 2nd & 3rd trimesters. Mean FT3 was significantly lower in the 2nd trimester (p<0.05) than in the 1st & 3rd trimesters.
Level IV
61

First author year,
Area
Study design Population, participants, iodine status of area
Outcome measures
Dietary assessment method
Results Confounders adjusted for/sensitivity analysis
Study quality and comments
Mean FT4 was significantly lower in the 3rd trimester (p<0.05) than in the 1st & 2nd trimesters.
Data on UIC and use of iodized salt were published in Elahi et al. (2009). Only 34% of pregnant women used iodised salt. No data on the use of iodine supplements
Ferreira et al, 2014
São Paulo, Spain
Cross-sectional N=191 pregnant women in the 1st trimester
UIC, TSH, TT4, FT4, TgAb & TPOAb
No assessment Median UIC, mean TSH, TT4 and FT4 in the 1st trimester were 138 μg/L, 1.6 mIU/L, 10.0 μg/dL & 14.2 pmol/L, respectively.
All pregnant women did not use iodine supplements.
Level IV
Fister et al, 2009
Ljubljana Slovenia
Note: More data on this
Prospective cohort
Followed up at 1st & 3rd trimester & 4 mths postpartum
N=118 healthy pregnant women, with thyroid disease
Iodine sufficient
UIC, TV (ultrasound), serum TSH, BMI
No assessment 3rd trimester median UIC (176 mg/g creatinine) was higher than 4 & 14 mths after delivery (P = 0.030, P< 0.001, respectively).
TV in the 3rd trimester (11.3 ± 3.1 mL) was greater (P < 0.001) than in the 1st trimester (8.7 ± 2.5 mL), 4 mths after delivery (8.6 ± 2.5) & 14 mths after delivery (7.8 ± 2.4 mL).
TSH, BMI, maternal age, parity
Level III-2
62

First author year,
Area
Study design Population, participants, iodine status of area
Outcome measures
Dietary assessment method
Results Confounders adjusted for/sensitivity analysis
Study quality and comments
cohort was reported in a paper by Fister et al in 2011.
TSH was higher in 3rd trimester than in the 1st trimester & 4 mths after delivery (P = 0.007, P = 0.006, respectively).
Colour flow Doppler sonography pattern I was more frequent 4 mths after delivery than 14 mths after delivery (P < 0.001).
Peak systolic velocity was higher 4 mths after delivery than 14 mths after delivery (P < 0.001). Linear regression analysis revealed TSH & BMI as significant independent predictors for TV
Fuse et al, 2013
Chiba Prefecture,
Japan
Cross-sectional
Prospective cohort
Followed throughout pregnancy
N=563 pregnant women: 166 in the 1st trimester, 221 in the 2nd trimester & 176 in the 3rd trimester.
N=65 pregnant women in the 1st trimester
UIC, TSH, FT4, TgAb & TPOAb
Semi-quantitative FFQ
Median UICs in the 1st, 2nd & 3rd trimesters were 227, 259 & 205 μg/L, respectively. Median TSH was significantly lower in the 1st trimester (p˂0.05) than in the 2nd & 3rd trimesters. Median FT4 was significantly lower in the 2nd and 3rd trimesters (p˂0.05) than in the1st trimester.
Median UICs in the 1st, 2nd & 3rd trimesters were 216, 136 & 148 μg/L,
Two studies
Level III-2
Level IV
63
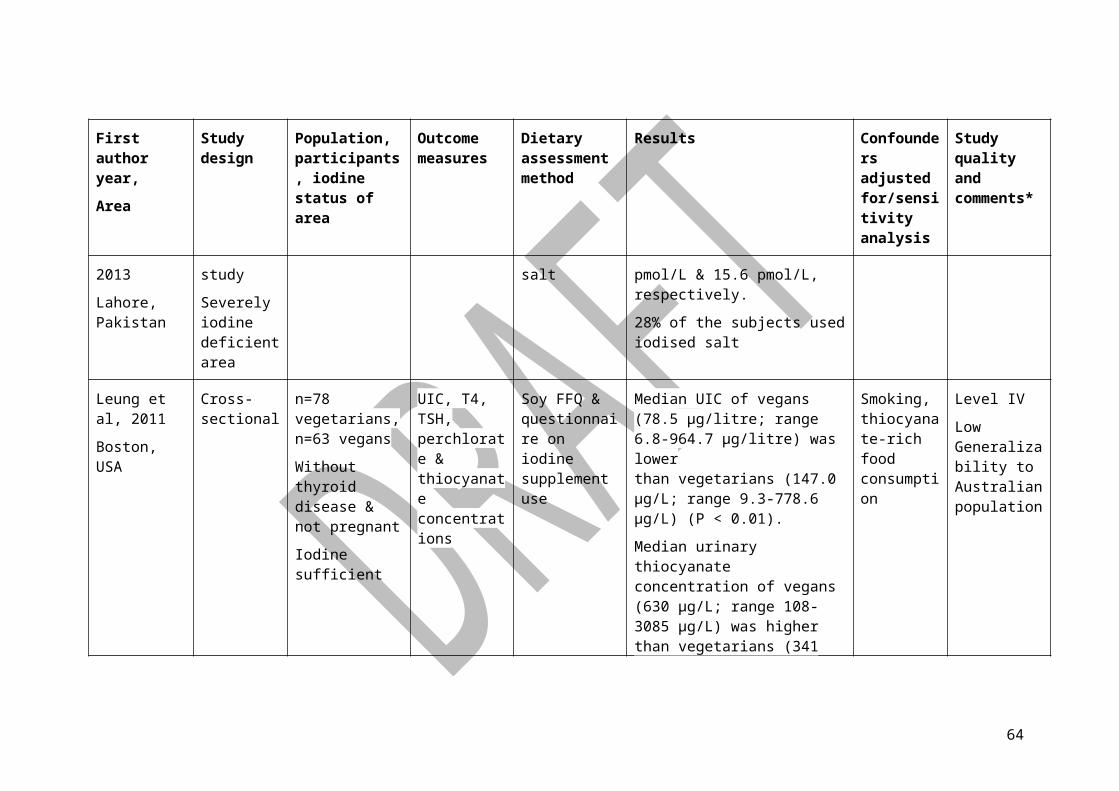
First author year,
Area
Study design Population, participants, iodine status of area
Outcome measures
Dietary assessment method
Results Confounders adjusted for/sensitivity analysis
Study quality and comments
respectively. Mean TSH was significantly lower in the 1st trimester (p˂0.05) than in the 2nd & 3rd trimesters. Mean FT4 was significantly lower in the 2nd and 3rd trimesters (p˂0.05) than in the1st trimester. No significant difference was observed in TT3 between the trimesters.
No data on the use of iodine supplements.
Gowachirapant et al, 2014
Bangkok,
Thailand
Cross-sectional N=514 pregnant women in the 1st trimester
UIC, TSH, TT3, FT3, TT4, FT4, Tg, TPOAb & TV
Household salt samples
Median UIC, TSH, TT3, FT3, TT4, FT4 & Tg in the 1st trimester were 112 μg/L, 1.1 mIU/L, 1.85 nmol/L, 4.9 pmol/L, 118.0 nmol/L, 13.9 pmol/L & 9.5 μg/L, respectively. Of these, 3% had overt hypothyroidism, 7% had subclinical hypothyroidism & 8% had isolated hypothyroxinaemia.
All pregnant women did not use iodine supplements.
Socio-demographic, UIC & thyroid function
Level IV
Habimana et al, 2014
Cross-sectional N=225 pregnant women: 76 in the 1st trimester, 71
UIC, TSH, FT3, FT4, Tg & TPOAb
No assessment Median UICs in the 1st, 2nd & 3rd trimesters were 138, 144 & 204 μg/L, respectively. Median TSH was significantly
Socio-demographic, group
Level IV
64
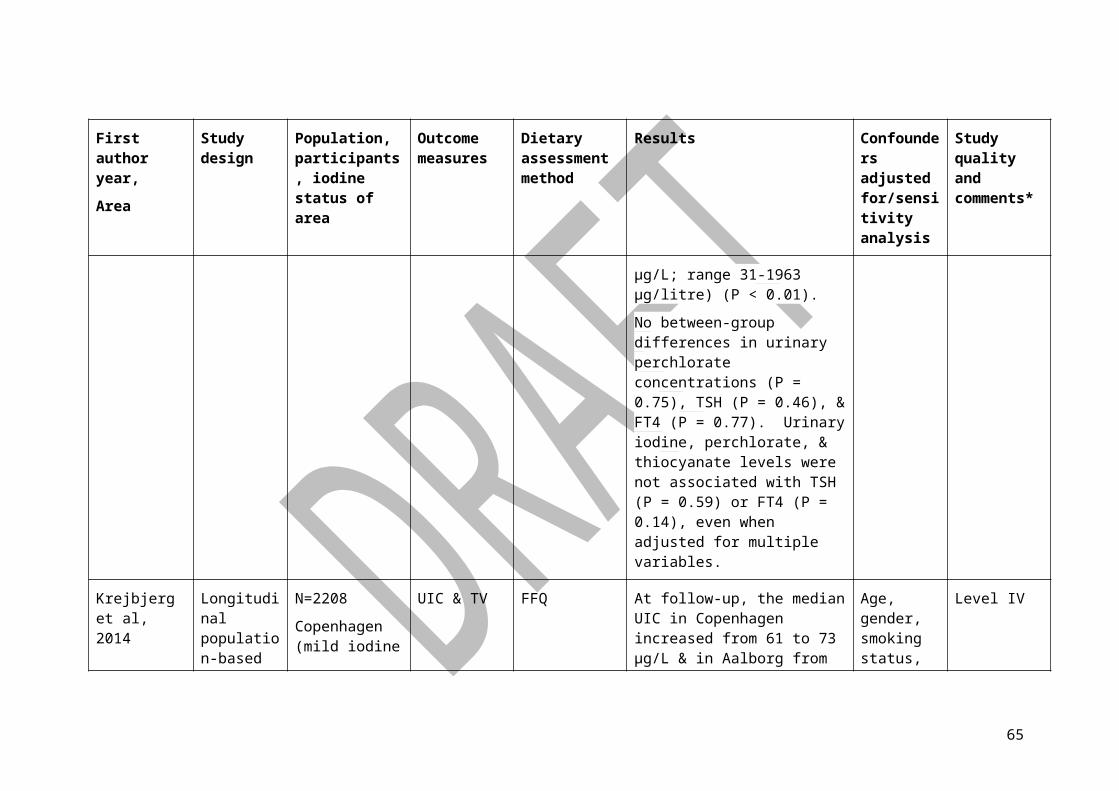
First author year,
Area
Study design Population, participants, iodine status of area
Outcome measures
Dietary assessment method
Results Confounders adjusted for/sensitivity analysis
Study quality and comments
Lubumbashi, Democratic Republic of Congo
in the 2nd trimester, 78 in the 3rd trimester
higher lower in the 1st trimester (p=0.005) than in the 2nd & 3rd trimesters. No significant difference was observed in FT3 (p=0.78) and FT4 (p=024) between the trimesters. Median Tg was significantly higher lower in the 1st trimester (p=0.01) than in the 2nd & 3rd trimesters.
Data on UIC reported in Habimana et al (2013). All pregnant women did not use iodine supplements.
of women, UIC & TPOAb status.
Jaiswal et al, 2014
Bangalore, India
Cross-sectional N=334 pregnant women in the 1st trimester
UIC, TSH, TT3, FT3, TT4, FT4, TG, TBG, TgAb, TPOAb &TV
Self-reported written questionnaire
Median UIC, TSH, TT3, FT3, TT4, FT4 & Tg in the 1st trimester were 184 μg/L, 1.2 mIU/L, 2.2 nmol/L, 5.7 pmol/L, 146.1 nmol/L, 14.3 pmol/L & 6.6 μg/L, respectively. Of these, 4% had overt hypothyroidism, 9% had subclinical hypothyroidism & 5% had hypothyroxinaemia.
34% of pregnant women used iodine supplements.
Maternal age, gestational age, hemoglobin, BMI, consanguinity, parity, maternal
Level IV
65
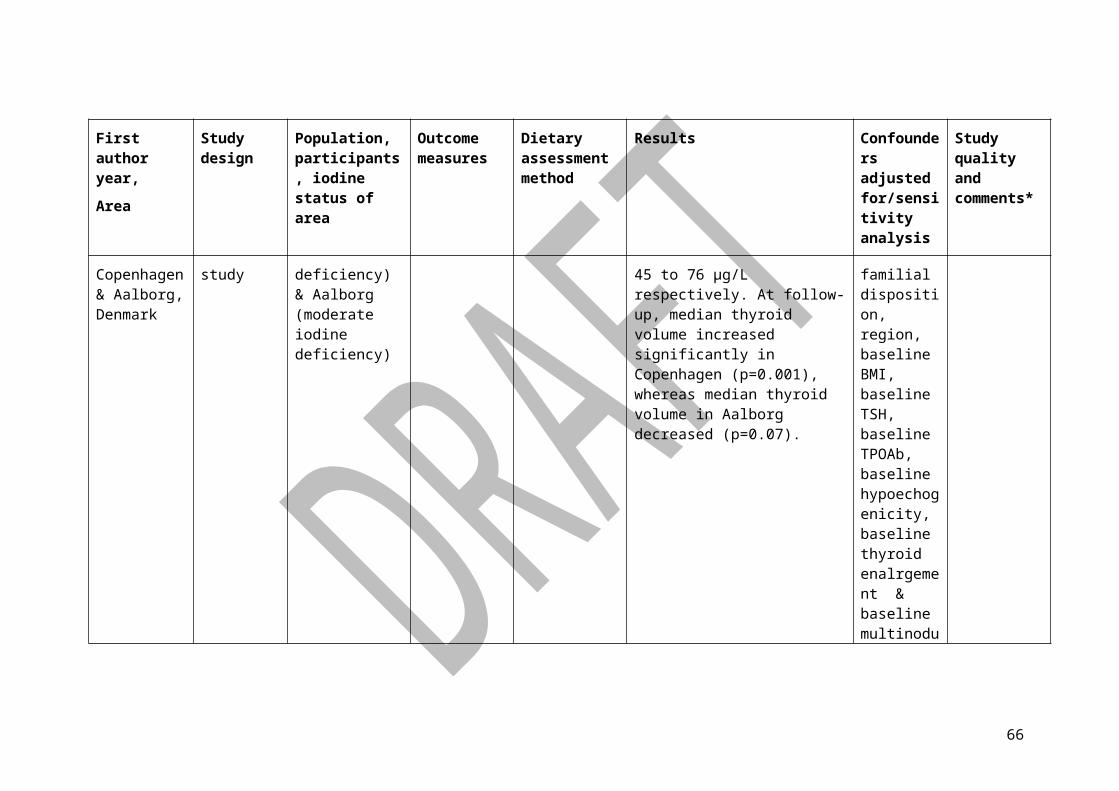
First author year,
Area
Study design Population, participants, iodine status of area
Outcome measures
Dietary assessment method
Results Confounders adjusted for/sensitivity analysis
Study quality and comments
education, maternal employment, food habits, reason for salt use, seafood intake, egg intake, use of iodine containing multinutrient powders and presence of thyroid antibodies above the cutoff values.
Joshi et al, 2014
Vadodara, India
Cross-sectional N=256 pregnant women in the 1st trimester
UIC, TSH, TT4 & FT4
No assessment Median UIC, TSH, TT4 & FT4 in the 1st trimester were 297 μg/L, 1.8 mIU/L, 10.24 μg /dL & 10.83 pmol/L, respectively. TSH was negatively correlated with FT4 (p˂0.01).
No data on the use of iodine supplements.
Level IV
Koukkou et al, 2014a
Athens, Greece
Prospective cohort
Followed throughout pregnancy
N=47 pregnant women
UIC, TSH, FT3, FT4 & TPOAb
No assessment Median UICs in the 1st, 2nd & 3rd trimesters were 113, 117 & 122 μg/L, respectively. No significant difference was observed in TSH between the trimesters. Women in the 1st trimester had a significantly higher mean FT3 (p<0.01) and FT4 (p<0.01) than women in the 2nd and 3rd trimesters.
No data on the use of iodine supplements.
Two studies
Level III-2
Level IV
66
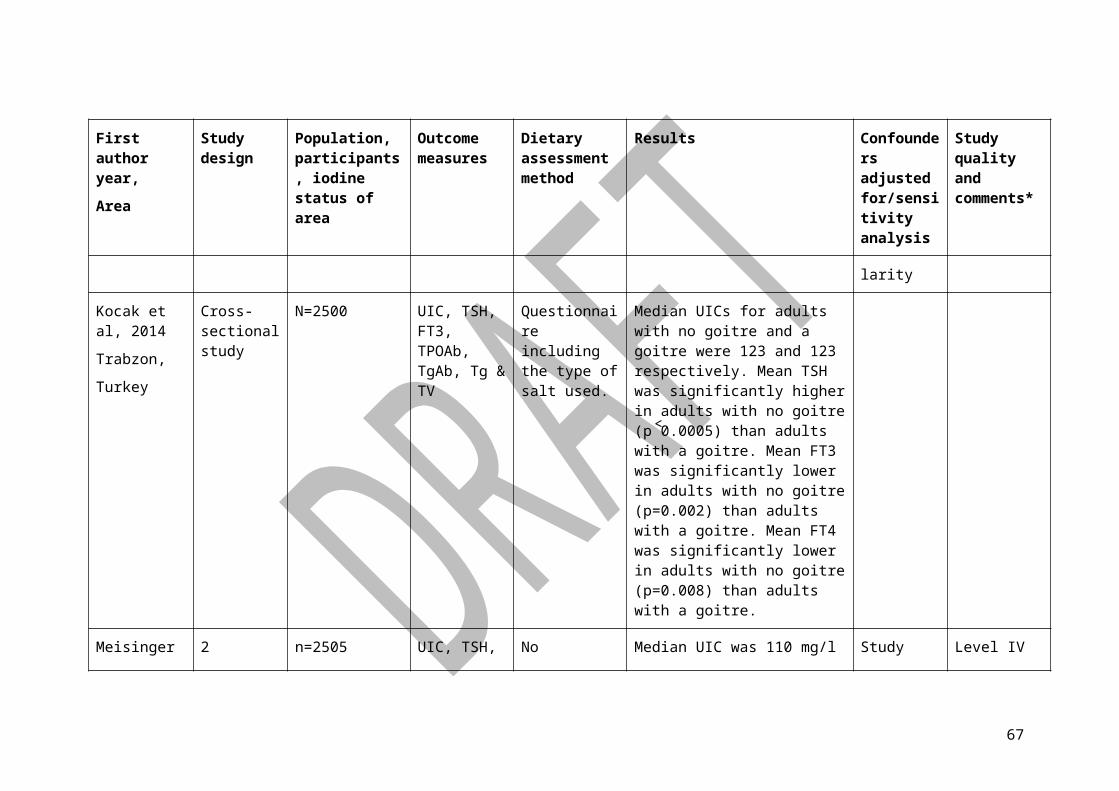
First author year,
Area
Study design Population, participants, iodine status of area
Outcome measures
Dietary assessment method
Results Confounders adjusted for/sensitivity analysis
Study quality and comments
Koukkou et al, 2014b
Athens & Patras, Greece
Prospective cohort & cross sectional
N=424 pregnant women
UIC, TSH, FT4, Tg & TPOAb
Use of iodized salt
Median UICs in the 1st, 2nd & 3rd trimesters were 130, 125 & 130 μg/L, respectively. Mean TSH was significantly lower in the 1st trimester (p<0.01) than in the 2nd & 3rd trimesters. Mean FT4 was significantly lower in the 3rd trimester (p<0.01) than in the 1st & 2nd trimesters. Median Tg was significantly lower in the 2nd trimester (p<0.01) than in the 1st & 3rd trimester.
All pregnant women did not use iodine supplements. Two spot urine samples collected on two different days for the determination of UIC.
Level IV
Kung et al, 2002
Southern China (Hong Kong)
Prospective cohort
Followed-up at 1st & 3rd trimester & 6wks & 3mths postpartum
N=221 healthy pregnant women, with no history of thyroid dysfunction
Borderline sufficient
UI, thyroid function (TSH, FT4, FT3, Tg), TV & nodules (ultrasound)
No assessment Thyroid nodules were detected in 34 (15.3%) in 1st trimester, 12 (5.4%) had > 1nodule. Women with thyroid nodules were older (P < 0.01) & had higher gravidity (P < 0.02) than those women without thyroid nodules. Patients with thyroid nodules had lower serum TSH values (P < 0.03) & higher Tg levels (P
Level III-2
67

First author year,
Area
Study design Population, participants, iodine status of area
Outcome measures
Dietary assessment method
Results Confounders adjusted for/sensitivity analysis
Study quality and comments
<0.05) throughout pregnancy. Appearance of new nodules was detected in 25 (11.3%) women. subjects with new nodule formation had higher UI excretion from 2nd trimester onward (P all < 0.05). No difference in their TSH & Tg levels throughout pregnancy. Fine-needle aspiration on nodules greater than 5 mm in any dimension after delivery (n =21) confirmed the majority having histological features consistent with nodular hyperplasia. No thyroid malignancy was detected.
Menéndez Torre et al, 2014
Asturias, Spain
Cross-sectional N=173 pregnant women in the 1st trimester
UIC, TSH, FT4 & TPOAb
Iodine supplements, use of iodised salt & dairy products.
Median UIC, mean TSH & mean FT4 were 197 μg/L, 2.1 mU/L & 1.2 ng/dL, respectively. No difference in TSH and FT4 between iodine supplemented and non-iodine supplemented women.
47% of pregnant women took iodine supplements.
Level IV
68

First author year,
Area
Study design Population, participants, iodine status of area
Outcome measures
Dietary assessment method
Results Confounders adjusted for/sensitivity analysis
Study quality and comments
Meng et al, 2013
Gansu, Shandong, Fujian, Jilin, Anhui & Chongqing provinces,
China
Cross-sectional N=699 pregnant women (trimester of pregnancy not reported)
UIC, TSH,FT4,Tg, TgAb & TPOAb
Household salt samples
Median UIC, TSH, FT4 and Tg were 206 μg/L, 1.7 mU/L, 13.3 pmol/L & 4.9 μg/L, respectively. TSH decreased from ~ UIC 50 to 300 μg/L and increase from UIC 300 to 550 μg/L.
No data on the use of iodine supplements.
Level IV
Moleti et al, 2009
Sicily Italy
Prospective cohort
Followed up at 12, 18, 24, 30 & 38 wks
N= 220 Pregnant women never tested for thyroid dysfunction
Mild ID
FT4, TSH
TPO-Ab Tg-Ab (at initial & final follow-up only)
Questionnaire about dietary habits, in particular iodized salt.
Thyroid autoantibodies were detectable in 8.2% women. Overall, the prevalence of hypothyroidism over the course of gestation was 11.8% (26/220), with a RR of hypothyroidism in antibody-positive women of 5.0 (chi (2) 20.02, P<0.0005). Nonetheless, almost 70% hypothyroid women tested negative for thyroid autoantibodies. 15/26 (57.7%) hypothyroid women were identified at presentation, & the remaining 11 at either early (6/11) or
Level III-2
69
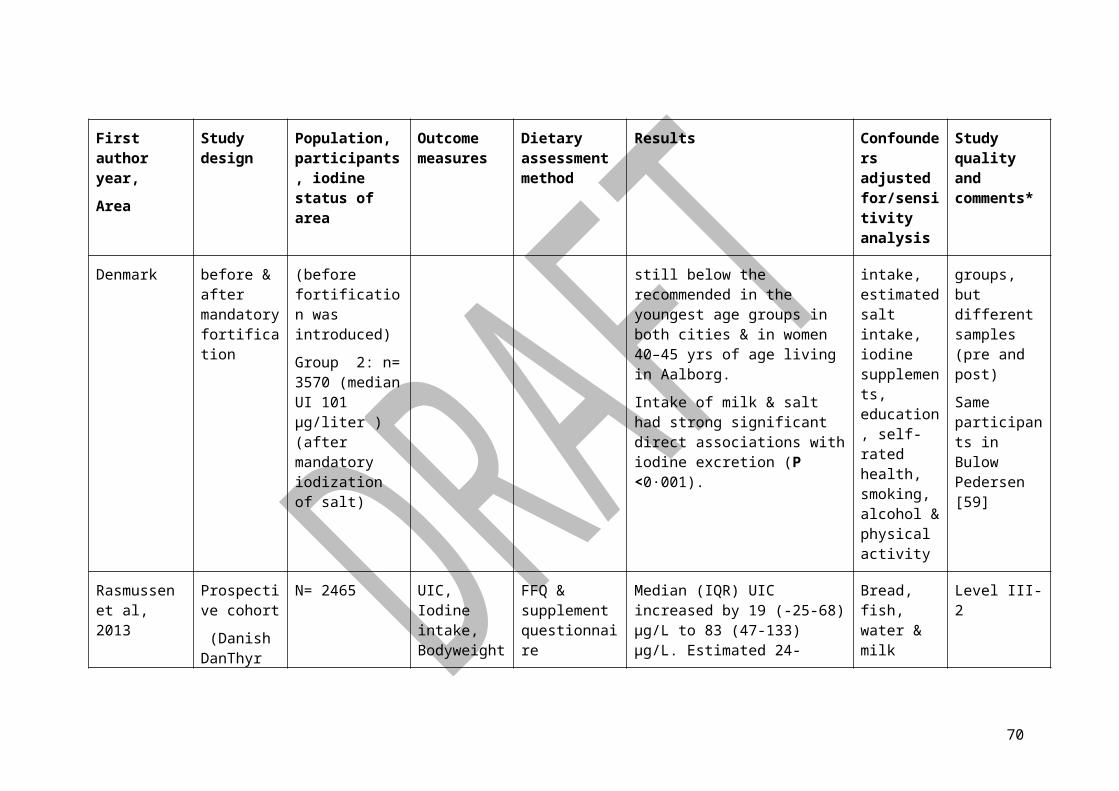
First author year,
Area
Study design Population, participants, iodine status of area
Outcome measures
Dietary assessment method
Results Confounders adjusted for/sensitivity analysis
Study quality and comments
late (5/11) phases of the 2nd trimester. Isolated hypothyroxinemia was observed in 56/220 (25.4%) women, mostly from the 2nd trimester onwards.
Moleti et al, 2011
Sicily Italy
Prospective cohort
Followed up at 12, 18, 24, 30 & 38 wks
N= 168 women receiving prenatal preparations containing 150 μg of iodine from early pregnancy (150-I group);
105 women who had regularly used (>2 yrs) iodized salt prior to becoming pregnant (I-salt group);
160 women neither taking
TSH, FT3 & FT4 Questionnaire about dietary habits, in particular iodized salt.
Mean TSH was higher among the 150-I women than in the remaining two groups, & in a high proportion of them, TSH values were found to exceed the upper limit for gestational age. The prevalence of low FT4 in the 150-I women was similar to that observed in the I-salt women & markedly lower than that recorded for the no-I group.
Note: this is the same study as Moleti et al 2009.
70
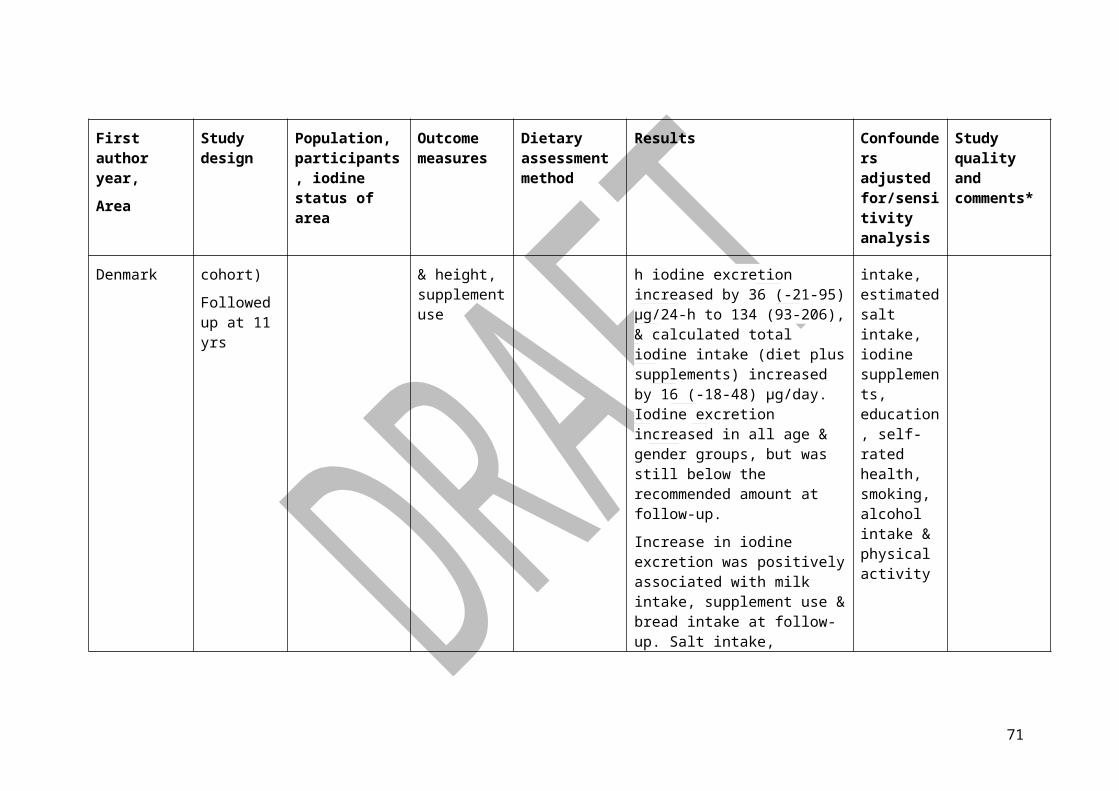
First author year,
Area
Study design Population, participants, iodine status of area
Outcome measures
Dietary assessment method
Results Confounders adjusted for/sensitivity analysis
Study quality and comments
iodine supplements nor using iodized salt (no-I group).
Mild ID
Moradi et al, 2013
Tehran,
Iran
Cross-sectional N=584 pregnant women: 162 in the 1st trimester & 422 in the 3rd trimester
UIC, TSH, FT3, TT4, FT4, FTI, T3RU & TPOAb
No assessment Median UIC, TSH, FT3, TT4 and FT4 were 240 μg/L, 2.2 mIU/L, 30.8 pmol/L, 10.0 μg/dL &12.4 pmol/L, respectively (only included data from pregnant women negative for TPO-Ab). No data on the use of iodine supplements.
Level IV
Moreno-Reyes et al, 2013
Belgium
National cross-sectional survey
Randomly sampled from 55 obstetric clinics
1311 pregnant women not taking thyroid medication (n=640 & 667 in 1st & 3rd trimester respectively)
UIC/Cr, TSH, TPO-Ab, TG, FT3, FT4
Face to face questionnaire for use of iodine-containing supplements, food consumption,
7.2% had elevated serum TSH &13.8% of these women were TPO-Ab positive. 4.1% had low serum TSH. 4% of entire population had positive TPO-Ab &/or Tg antibodies.
Thyroid disorders (abnormally high or low TSH) or thyroid autoimmunity was present in 18.6% & 12.3% in 1st & 3rd trimester
Gestational age, age, ethnicity, seasons, log UIC/Cr
Level IV
71
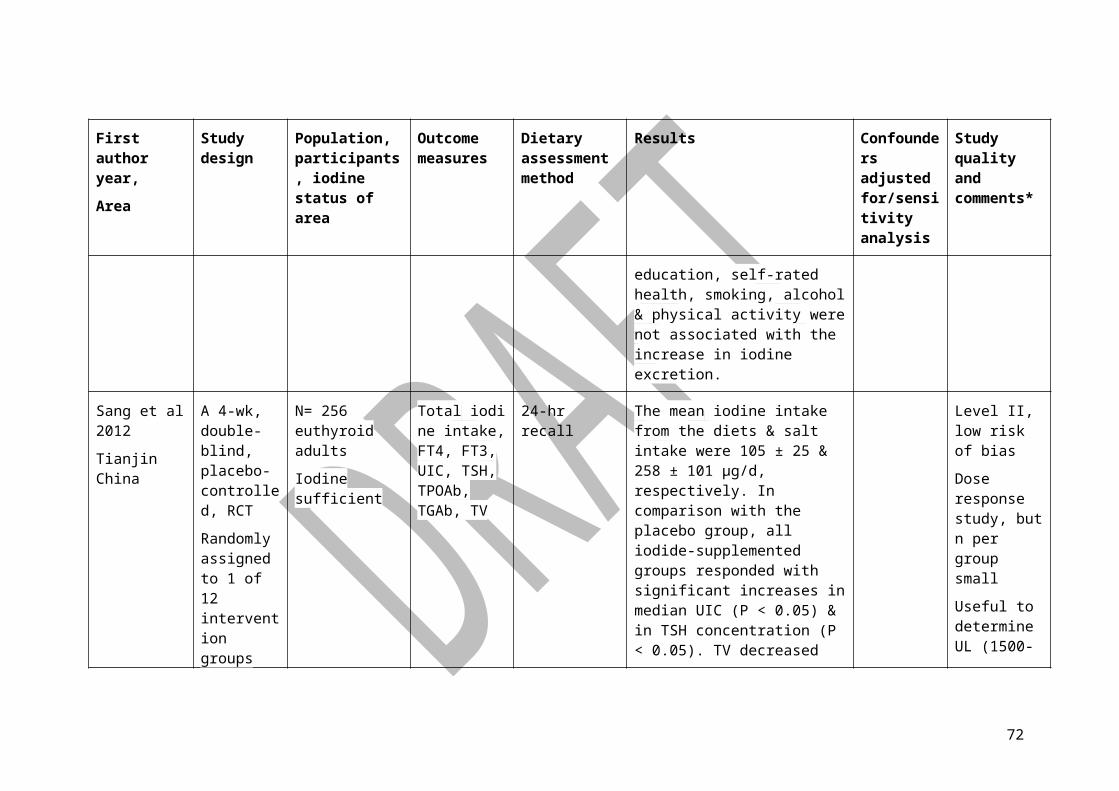
First author year,
Area
Study design Population, participants, iodine status of area
Outcome measures
Dietary assessment method
Results Confounders adjusted for/sensitivity analysis
Study quality and comments
Mild ID & use of iodized household salt
respectively. Women with adequate iodine (UIC/Cr = 150–249 µg /g) had lower median Tg concentration compared to moderately ID women (UIC/Cr ≤49 µg/g), 19 µg /L &25 µg /L, respectively.
Pettigrew-Porter et al, 2011
New Zealand
Cross-sectional N=170 UIC (spot urine), TV (ultrasound), FT4 & TSH
Semi-quantitative FFQ
The median UIC of the women was 38 lg ⁄ L. 7% of women had goitre.
Iodine intake was 48 lg ⁄ day. The majority of women had TSH and FT4 concentrations within pregnant reference ranges, suggesting that despite the low UIC observed in these women, thyroid hormone production was not affected.
Level IV
Raverot et al, 2012
Lyon, France
Cross-sectional
Iodine intake of general population <100 μg/day
N= 228 healthy pregnant women with no history of thyroid disease from 1st, 2nd, 3rd trimester of pregnancy (n=53, n=107, n=68
TSH, FT4, anti-TPO, Tg, UIC (spot) in 1st (6-13 wks), 2nd (14-27 wks), 3rd (28-38 wks) trimester of pregnancy
No assessment The median (range) UIC was 81 (8–832) l g/L, & 77% of pregnant women had a UIC < 150 l g/L. 11% had abnormal TSH or anti-TPO. Median FT4 (pmol/L) was 14.9, 12.6, & 11.5 in the 1st, 2nd, & 3rd trimesters, respectively. Median Tg in pregnant women was 16.2 l g/L, did not differ across trimesters, & was higher than in the
Maternal age, wk of gestation.
Level IV
72
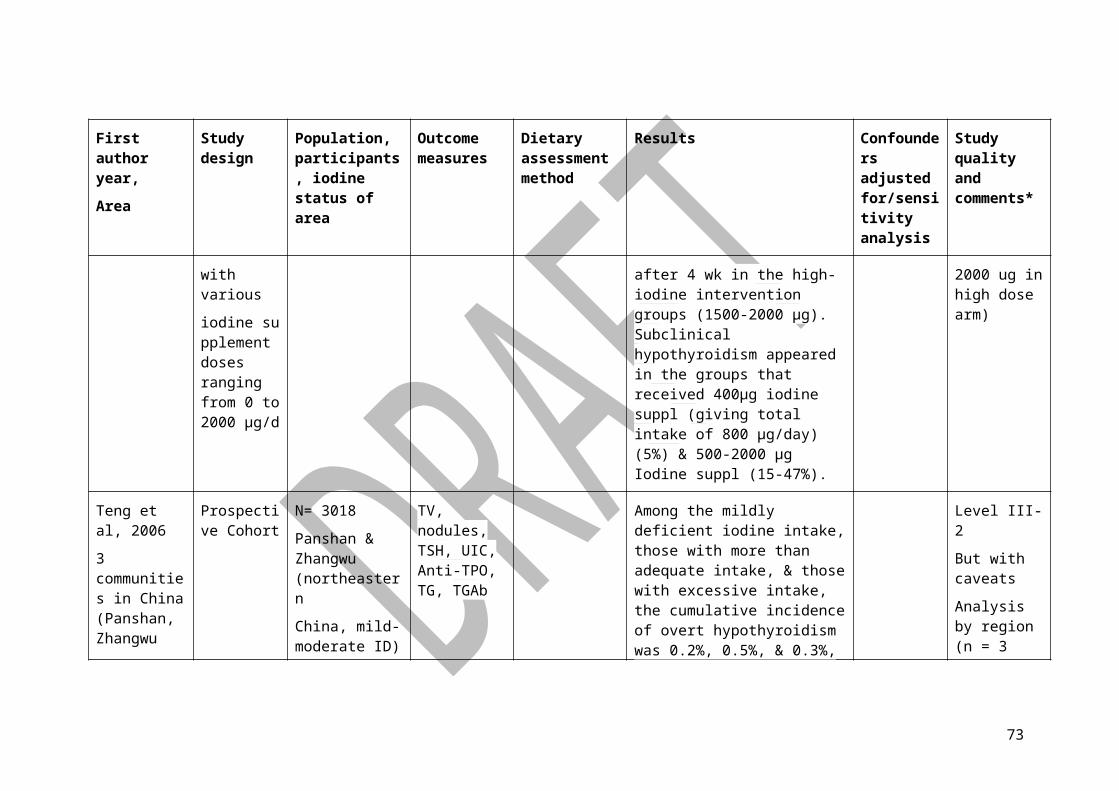
First author year,
Area
Study design Population, participants, iodine status of area
Outcome measures
Dietary assessment method
Results Confounders adjusted for/sensitivity analysis
Study quality and comments
respectively).
Controls (men & non pregnant women) provided reference intervals of thyroid test
control group of non-pregnant adults (11.7 l g/L) (p = 0.02). UIC did not predict any of the thyroid function tests.
Rebagliato et al, 2010
3 areas in Spain (Guipúzcoa, Sabadell, Valencia)
Cross-sectional N= 1844 pregnant women (gestational age range 8-23 wks) with no diagnosed thyroid pathology
Mild ID
FT4 & (TSH)
Iodine (spot urine) & questionnaire estimates of iodine intake from diet, iodized salt & supplements
There was an increased risk of TSH above 3 muU/mL in women who consumed 200μg or more of iodine supplements daily compared with those who consumed less than 100 ug/day (adjusted OR = 2.5 [95% CI = 1.2 to 5.4]). No association between UI & TSH levels (model 1). Pregnant women from the area with the highest median UI (168 microg/L) & highest supplement coverage (93%) showed the lowest values of serum FT4. (geometric mean = 10.09 pmol/L [9.98 to 10.19]) (model 2)
Model1: Area, country of origin, education level, parity, gestational age at sample
Model 2: Iodine intake from salt,
Level IV
Increased risk of elevated TSH (reference for pregnancy) in those taking supplements > 200ug/day
73

First author year,
Area
Study design Population, participants, iodine status of area
Outcome measures
Dietary assessment method
Results Confounders adjusted for/sensitivity analysis
Study quality and comments
food & supplements
Sahin et al, 2014
Reze, Turkey
Prospective cohort
Followed throughout pregnancy & 3 mo postpartum
N= 58 pregnant women
Severely iodine deficient area
UIE, TSH, FT3, FT4, TgAb, TPOAb & TV
No assessment Mean UIE, TSH, FT3 and FT4 in 1st trimester were 14 μg/L, 1.1 mIU/L, 5.1 pmol/L & 14.2 pmol/L, respectively.
Only included healthy pregnant women (no nodular thyroid disease). All pregnant women did not use iodine supplements.
Level III-2
Sang et al, 2012
Tianjin & Haixing, China
Cross-sectional N=384 (n=174 Tianjin, n= 210 Haixing) with no previous investigation of ID diseases.
Tianjin: Iodine sufficient
Haixing: Excessive iodine (due to water)
UIC (Morning urine)
FT3, FT4, TSH.
Median UIC of pregnant women with EI intake was higher than those with AI intake (P < 0.001). The prevalence of thyroid disease, especially subclinical hypothyroidism, in pregnant women with excessive iodine intake was significantly higher than in those with adequate iodine intake (P< 0.05). Subclinical hypothyroidism was the most frequent pattern of thyroid disease for pregnant women & those with positive or negative thyroid autoantibodies. Living with high
Level IV
74

First author year,
Area
Study design Population, participants, iodine status of area
Outcome measures
Dietary assessment method
Results Confounders adjusted for/sensitivity analysis
Study quality and comments
water iodine content & having UIC higher than 250μg/liter are associated risk factors for subclinical hypothyroidism in pregnant women (OR1 = 41.822, OR2 = 6.202; P < 0.05, where OR1 is the OR for living with high water iodine content & hypothyroidism & OR2 is the OR for UIC >250 μg g/liter & hypothyroidism).
Suarez Rodriguez et al, 2013
Spain
Cross sectional N=147 women in their 3rd trimester (wk 37) of pregnancy
Mild ID
TSH & T4 in mothers at booking.
TSH in the babies born to the 140 mothers in the postpartum group
FFQ Only 10.9% of pregnant women consumed more than 250 μg iodine daily, and 24.4%of them consumed less than 100μg daily. Mean free T4 levels were 9.37pmol/L, and 74 women (54.41%) had levels below the hypothyroxinemia threshold. TSH levels were normal in 135 newborns (96.4%), while 5 (3.6%) had levels higher than 5 μU/mL.
Level IV
Vandevijvere et al, 2013
National cross-sectional survey
Randomly sampled
N=1311
Pregnant women
Iodine status assessed 1 year after the introduction of
General questionnaire completed with practice
The median UIC was 124·1 μg/l and 122·6 μg/g creatinine when corrected for urinary creatinine. The median UIC in the 1st trimester (118·3 μg/l) was lower than
Note this is the same study as Moreno-Reyes et al
75

First author year,
Area
Study design Population, participants, iodine status of area
Outcome measures
Dietary assessment method
Results Confounders adjusted for/sensitivity analysis
Study quality and comments
Belgium from 55 obstetric clinics
not taking thyroid medication (n=640 & 667 in 1st & 3rd trimester respectively)
Mild ID
bread fortified with iodised salt
UIC, iodine intake
nurse that in the 3rd trimester (131·0 μg/l) but significantly higher than among non-pregnant women (84·8 μg/l). Iodine-containing supplement intake was reported by 60·8 % of the women & 57·4 % of the women took this supplement daily. The risk of iodine deficiency was higher in younger women, in women not taking iodine-containing supplements, with low consumption of milk and dairy drinks and during autumn. Women with a higher BMI had a higher risk of iodine deficiency but the risk was lower in women who reported alcohol consumption.
Age, trimester of pregnancy, region, BMI, smoking behavior, alcohol consumption, use of iodised household salt, bread consumption, fish consumption, milk and dairy drink consumption, education level, ethnicity & parity
2013
Velasco et al, 2013
Cross-sectional N= 233 healthy pregnant women
TSH, FT4, & FT3, No assessment Median maternal UIC was 126.5 μg/L. FT3, but not TSH and free FT4, correlated
Level IV
76
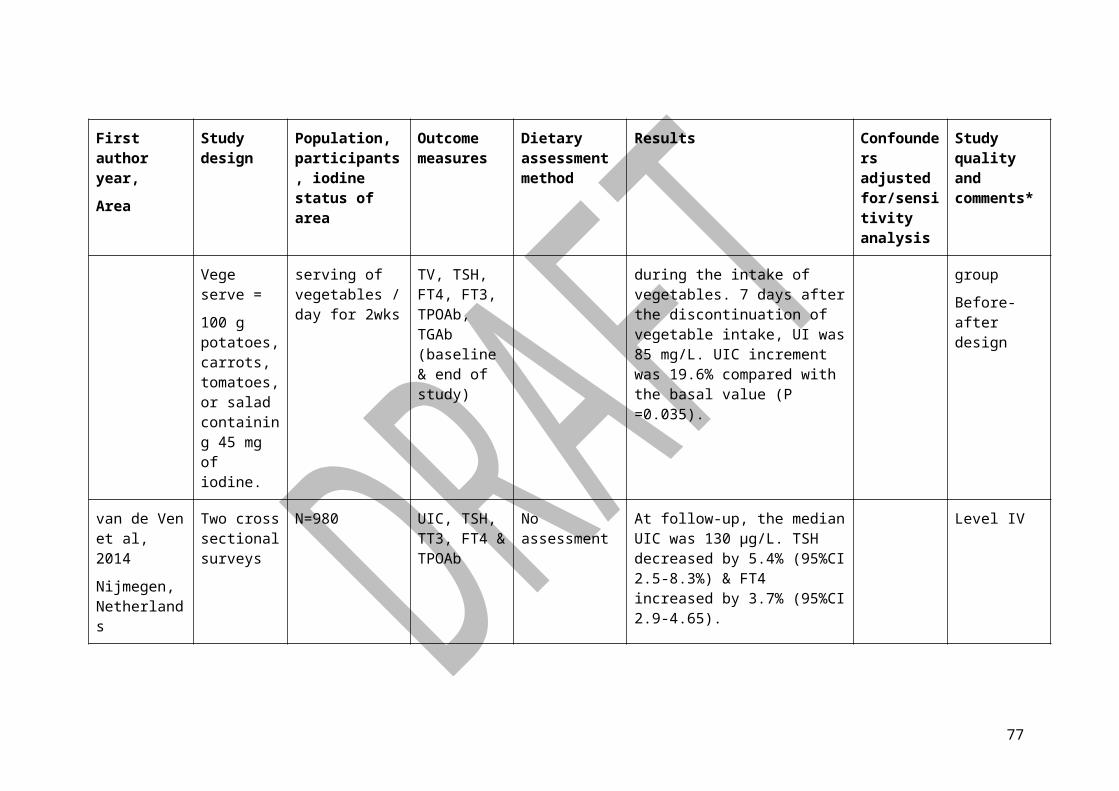
First author year,
Area
Study design Population, participants, iodine status of area
Outcome measures
Dietary assessment method
Results Confounders adjusted for/sensitivity analysis
Study quality and comments
Spain (29.7±5.6 years) and in their new-born.
Inclusion of women in the study was done within the 24 hours before delivery.
UIC significantly with the UIC (r=0.17, p=0.013). The cord blood TSH, FT4, and FT3 correlated positively with the maternal UIC at the time of delivery (r=0.24, p=0.001; r=0.16, p=0.032; and r=0.24, p=0.003, respectively). The cord blood and heel blood TSH correlated positively with the amniotic fluid iodine concentration (r=0.21, p=0.015 and r=0.15, p=0.036). The cord blood TSH correlated positively with the cord blood FT4 (r=0.21, p=0.022) and FT3 (r=0.32, p=0.017). The maternal TSH correlated with the cord blood TSH (r=0.22, p=0.014) and with the heel blood TSH (r=0.13, p=0.050).
Wang et al, 2014
Yongjing, China
Cross-sectional N=215 pregnant women: 70 in 1st trimester, 73 in 2nd trimester & 72 in 3rd trimester).
UIC, TSH, FT3,FT4, TgAb & TPOAb
Household salt & drinking water samples.
Median UICs in the 1st, 2nd & 3rd trimesters were 190, 153 & 145 μg/L, respectively. Mean TSH in pregnant women in the 2nd trimester was significantly lower (p˂0.05) than those in the 1st & 3rd trimesters. Mean FT3 in pregnant women in the 3rd trimester was
Level IV
77
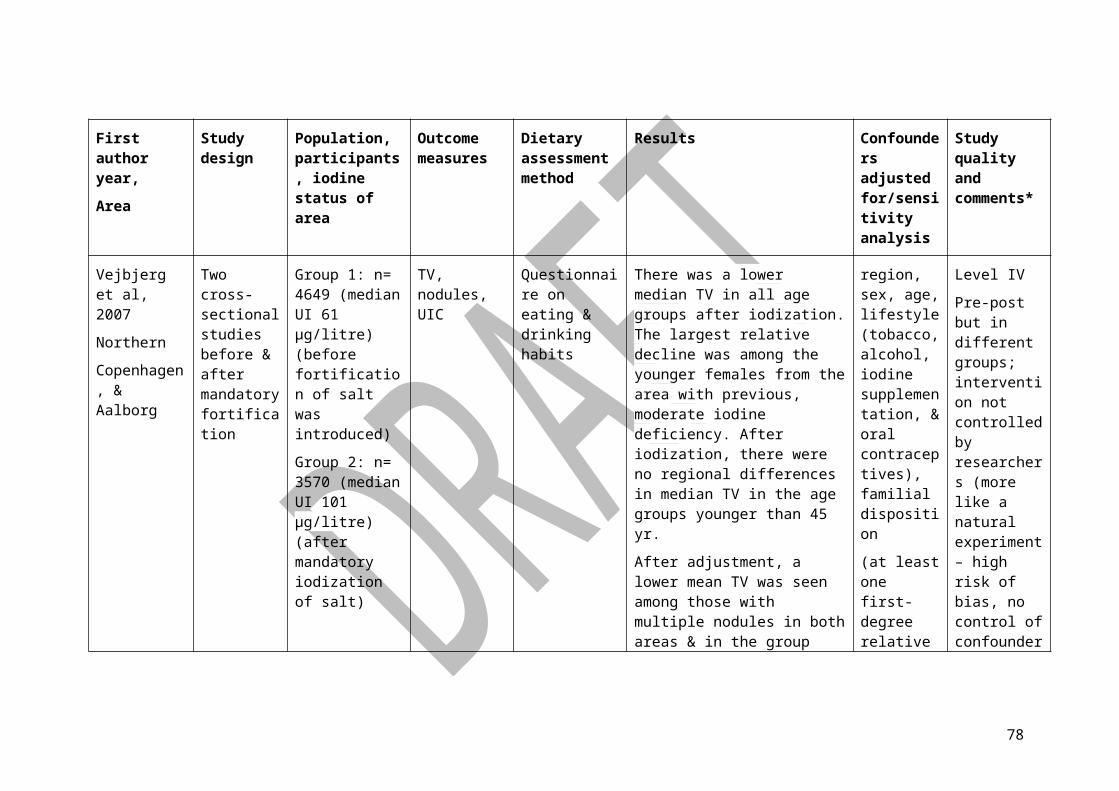
First author year,
Area
Study design Population, participants, iodine status of area
Outcome measures
Dietary assessment method
Results Confounders adjusted for/sensitivity analysis
Study quality and comments
significantly lower (p˂0.05) than those in the 1st & 2nd trimesters. FT3 decreased significantly with gestational age (p˂0.05). No difference was observed in FT4 between trimesters.
Systematic review of RCT
Author, date
Number of studies included
Search strategy Studies included Results of systematic review
Zhou et al 2013
12 RCTs Cochrane Central Register of Controlled Trials, EMBASE, MEDLINE, Cumulative Index to Nursing and Allied Health Literature and PsycINFO databases.
All RCTs comparing the effect of iodine supplementation with a parallel control group who received no iodine supplementation (or placebo) during pregnancy or the preconceptional period on clinical or biochemical outcomes were eligible for inclusion in the review.
Pregnant women or those of childbearing age regardless of
No obvious dose-response relation was seen. The effects of iodine supplementation on changes in thyroid hormone concentrations in mothers and infants were not consistent
When assessed in mothers, higher thyroxine concentrations were reported in 1 of 5 trials, lower TSH was reported in 1 of 6 trials, and lower thyroglobulin concentrations were reported in 2 of 4 trials in the iodine-supplemented group compared with control group. In infants of iodine-supplemented mothers, significant reductions in cord blood thyroglobulin were observed in 2 of 4 trials, and cord blood thyroxine was
Level I, with low risk of bias.
78

Author, date
Number of studies included
Search strategy Studies included Results of systematic review
iodine status or gestation at trial entry were included. Trials were eligible for inclusion in which women received any form of iodine supplementation, with or without other nutrients, in which the only difference between the treatment and comparison group was the presence or absence of iodine. The primary outcome was the cognitive development of children. Secondary outcomes included pregnancy and birth out- comes, childhood growth and mortality, iodine status, and thyroid function of mothers and infants. The search was restricted to human studies without language restrictions.
increased in 1 of 3 trials. There were no reports of significant changes in maternal triiodothyronine/free triiodothyronine or TBG, infant free thyroxine, triiodothyronine, TBG, or TSH between supplemented and control groups.
Women in the iodine-supplemented group compared with women in the control group had lower thyroid volumes in 1 of 2 trials that reported this outcome. Two other trials showed that supplementation reduced pregnancy increases in maternal thyroid volume; however, results were analyzed as percentage changes within groups and not based on the intention-to-treat principle. Children of supplemented mothers had lower thyroid volumes than did children of non-supplemented mothers in the 2 trials that reported this outcome.
Abbreviations: AI Adequate Intake, BMI Body Mass Index, CI Confidence Interval, EI Excessive Intake, OR Odds ratio, UIC Urinary Iodine Concentration, RR relative risk, TV thyroid volume1 FT3, free triiodothyronine; FT4, free thyroxine; m, months; MUI, median urinary iodine; MUIE, mean urinary iodine excretion; n, number; No diff, no difference; NR, not reported; P, probability; PP, postpartum; PPTD, postpartum thyroid dysfunction; rT3, reverse T3; T3, triiodothyronine; T4, thyroxine; TBG, thyroxine-
79
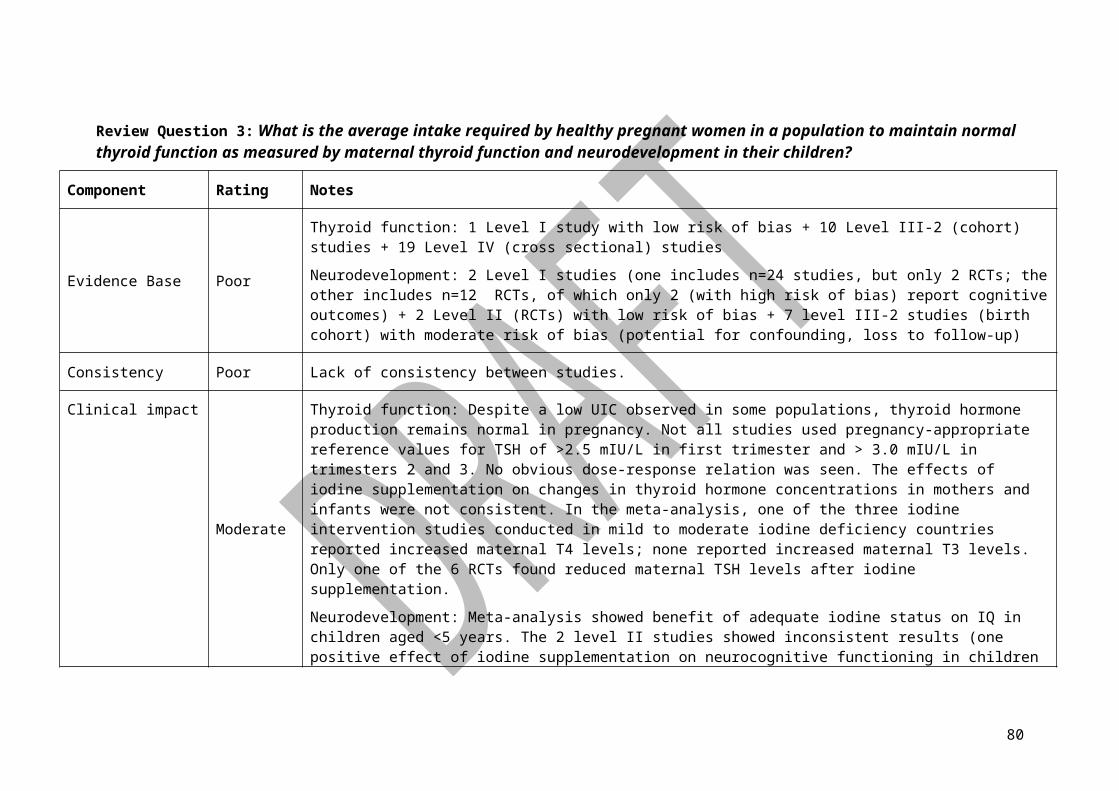
binding globulin; Tg, thyroglobulin; Tg-Ab, thyroglobulin antibodies; TM, trimester; TPO-Ab, thyroid peroxidase antibodies; TSH, thyroid-stimulating hormone or thyrotropin; TT3, total triiodothyronine; TT4, total thyroxine; UI, urinary iodine; wk(s), week(s); yr(s), year(s)
80

Table 7:23 Studies related to pregnancy EAR and neurological outcomes in their children (Review Question 3)
Observational studies
Author, year Sampling, location, year
Maternal assessment
No. of mother-child pairs
Gestational iodine status
Assessment test method
Child age at testing
Effect Quality Rating and Comments
Bath et al, 2013
PW participated in Avon Longitudinal Study of Parents and Children. Southwest England in the UK, 1991-1992 & 1999-2001
One Spot-urine sample in first trimester
958 mild-moderate ID; 67% had UICR ≤150ug/g
Wechsler Intelligence Scale for Children - IQNeale Analysis of Reading Ability - reading ability
8y Gestational UICR of <150ug/g is associated to low child verbal IQ, reading accuracy and reading comprehension vs. gestational UICR ≥150ug/g
Level III-2 (Birth cohort)
Single urine sample only provided in first trimester.
Effect of inadequate maternal UIC on child IQ might be attenuated due to potential iodine contamination of some urine samples. This might move iodine value towards 150ug/g or more.
Ghassabian et al, 2014
PW enrolled in the Generation R Study (a population-based birth cohort in Rotterdam, Netherlands),
Spot urine samples in the gestation age ˂18 weeks
1525 Median UIC was 230 μg/L and 297 μg/g; 12% of pregnant women had UIC˂150 μg/g.
A validated Dutch test batteries: two subsets of the Snijders-Oomen Niet-verbale intelligentic
6y Model 1 (unadjusted): A univariate association was reported between maternal low UIC and children's suboptimum non-
Level III-2
81

Author, year Sampling, location, year
Maternal assessment
No. of mother-child pairs
Gestational iodine status
Assessment test method
Child age at testing
Effect Quality Rating and Comments
2002-2006 Test-Revisie & the receptive subtest of the Taaltest voor Kinderren (TvK)
verbal IQ (unadjusted OR=1.44, 95% CI 1.02-2.02).
Model 2 (adjusted for child's sex & age at the time of cognitive assessment, maternal age & maternal education levels): No association between maternal low UIC and children's suboptimum non-verbal IQ (adjusted OR=1.21, 95% CI 0.85-1.73).
Model 3 (adjusted for child's sex & age at the time of cognitive assessment, ethnic background, birth order& history of breast feeding at age
82

Author, year Sampling, location, year
Maternal assessment
No. of mother-child pairs
Gestational iodine status
Assessment test method
Child age at testing
Effect Quality Rating and Comments
6 mo, & parental age at the time of pregnancy, maternal BMI, maternal history of smoking, maternal IQ, marital status, parental educational levels, maternal psychopathology in pregnancy, maternal folate concentration in early pregnancy, household income & time of urine sampling in pregnancy): No association between maternal low UIC and children's suboptimum non-verbal IQ (adjusted OR=1.33, 95%CI 0.92 to 1.92.
Hynes et al, 2013
PW attended the Royal Hobart Hospital,
One to three urine samples
228 mild-moderate ID; 71.1% had
Australian National Assessment
9y Gestational UIC of <150ug/L was associated to poor
Level III-2 (Birth cohort)
83

Author, year Sampling, location, year
Maternal assessment
No. of mother-child pairs
Gestational iodine status
Assessment test method
Child age at testing
Effect Quality Rating and Comments
Tasmania in Australia, 1999-2001 & 2009-2010
UIC<150ug/L;median UIC = 81ug/L
Program, NAPLAN and SARIS - literacy; numeracy
spelling in children vs. gestational UIC ≥150ug/L.
Voluntary iodine fortification program was implemented during the study. 17% children were born after but within 6 weeks of the fortification program being implemented
Julvez et al, 2013
PW enrolled in the INfancia y Medio Ambiente (INMA) project in Spain, 2004-2008
TSH & FT4 before the 21st week of gestation
1761 Iodine sufficient or mildly iodine deficient (data on UIC were reported in Rebagliato et al (2013) & Murcia et al (2010)
Bayley Scales of Infant Development
11-23 mo Low FT4 (˂5th percentile) was associated with a decrease of mental scores. No association was observed between TSH and mental or psychomotor scores.
Level III-2
Rebagliato et al, 2013
PW enrolled to the main public hospital or health center, Sabadell, Asturias and Gipuzkoa in Spain, 2004-
A 100-item SFFQ incl. questions on supplements & salt in 1st & 3rd trimester. Spot urine in 1st trimester
1519 mild-moderate ID; UIC ranged from 72ug/L to 212ug/L; median UIC in Gipuzkoa = 169ug/L; in
Bayley Scales of Infant Development
12-30m Child development was not associated to dietary iodine intake, iodized salt consumption, high maternal UIC (i.e. 100-149ug/L, 150-249ug/L and
Level III-2 (Birth cohort)
Range of UIC narrow. Good follow-up of infants at 1 yr (89%). Referent group = no supplements or <100ug/day (not
84
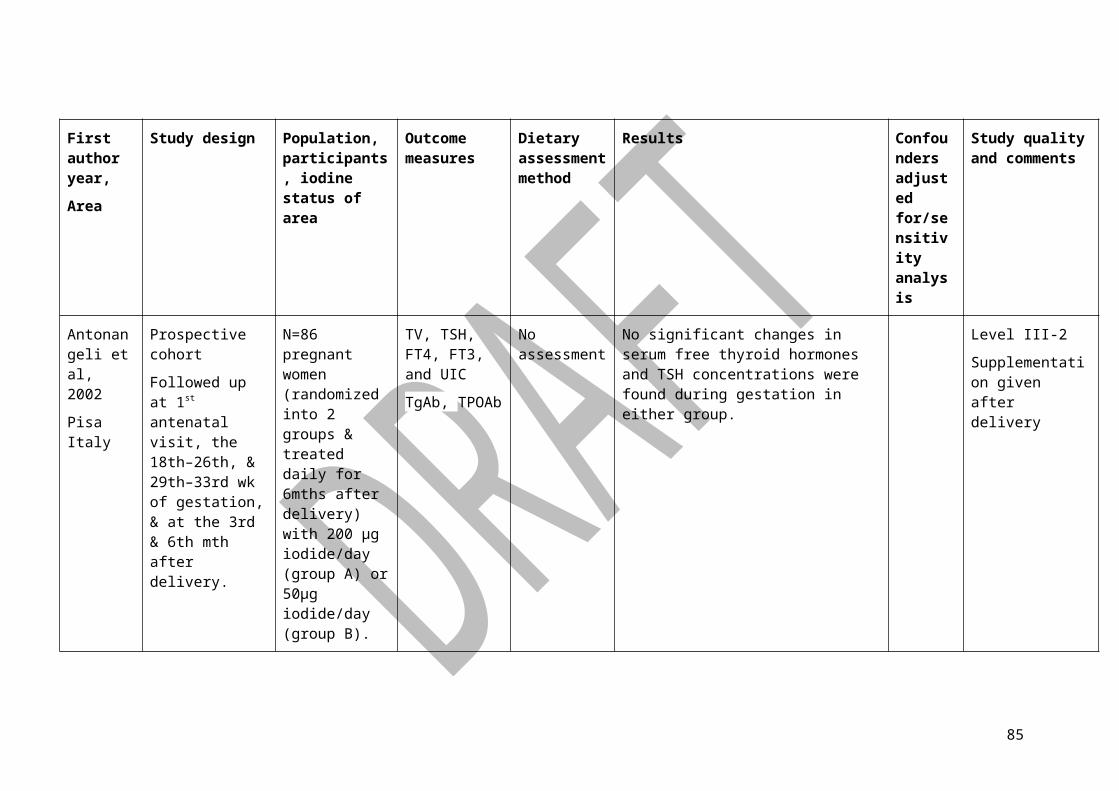
Author, year Sampling, location, year
Maternal assessment
No. of mother-child pairs
Gestational iodine status
Assessment test method
Child age at testing
Effect Quality Rating and Comments
2009 Sabadell = 90ug/L.Median dietary iodine intake = 162ug/day
≥250ug/L) vs. UIC<100ug/L, and high supplementary iodine intake (i.e. 100-149ug/day and ≥150ug/day) vs. intake <100ug/day.
Maternal supplementation of ≥150 μg/day
iodine related to 1.5-fold increase in odds of a psychomotor score < 85 (95% CI = 0.8, 2.9) and to 1.7-fold increase in odds of a mental score <85 (95% CI = 0.9, 3.0).
directly related to PICO question). Iodine supplementation programs differed in geographical regions. Maternal thyroid autoimmunity (thyroid antibodies) not measured. IQ of parents and quality of home environment not measured.
Suarez-Rodriguez et al, 2012
PW attended the University Clinic ofNavarra, Pamplona in Spain, 2002-2003 & 2006-
A blood sampleA 24-h urine sample in week 37 of gestation
70 Moderate ID: median UIC = 87ug/L (Note: 24hr urine sample). 80% had UIC <150ug/L & 56%
McCarthy Scales of Children's Abilities
38-60m Suboptimal free T4 concentration (<10th percentile vs. >10P) in PW was associated with lower general cognitive index,
Level III-2 (birth cohort). High level of bias - not all children of the women in the original sample were evaluated (n=70 children of 141
85
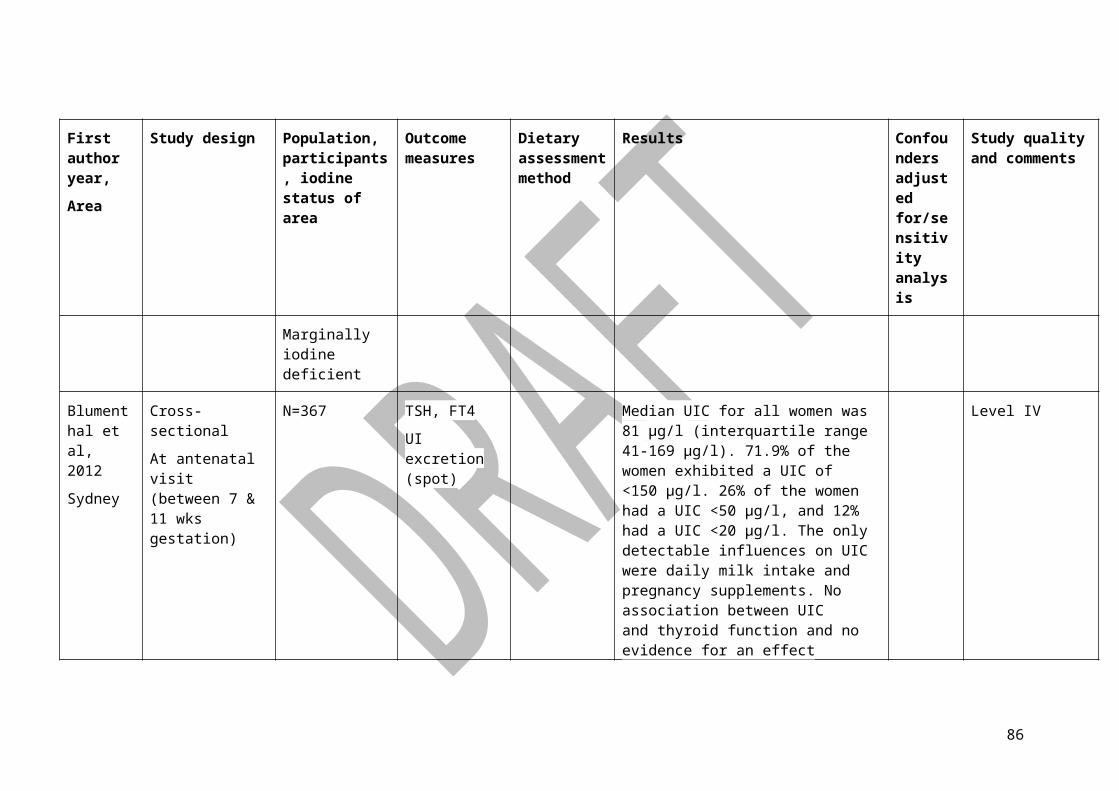
Author, year Sampling, location, year
Maternal assessment
No. of mother-child pairs
Gestational iodine status
Assessment test method
Child age at testing
Effect Quality Rating and Comments
2007 <50ug/L. For free serum T4, 54% of 140 participants had value <9.5pmol/L.
memory and perceptual-manipulative skills
enrolled women).
24hr UIC expressed as ug/L, other studies use spot UIC.
van Mil et al, 2012
Convenience sample of PW taking part in an ongoing birth cohort study, named Generation R Study, Rotterdam in Netherland, 2002-2010
A 293-item SFFQ. Behavior Rating Inventory of Executive Function for Preschoolers (BRIEF-P) A spot urine sample A blood sample
1123 Sufficient:median UIC=203ug/L (range: 9.3–1743.5mg/L)
BRIEF-P (completed by parents or caregiveers)
18-36m &8-10y
Maternal UIC was directly associated to children inhibition scores and working memory
Level III-2 (Birth cohort). Of 1156 mother-child pairs enrolled in the study, 1123 pairs (97%) completed the BRIEF-P.
Abbreviation: PW=PW UICR=urinary iodine-to-creatinine ratio; ID=iodine deficiency; UIC=urinary iodine concentration; SFFQ=semiquantitative food frequency questionnaire; h=hour; y=year; m=monthT4=throxin 4;
Intervention studies
86

Author, year, location
Inclusion criteria
Design and doses Sample size
Baseline or follow-up gestational iodine status
Assessment test method
Child age at testing
Main effect(s) Comments
Santiago et al, 2013,
Spain
Week 10 of pregnancy, and not taking iodine supplements
RCTG1: ISG2: 200ug KI/day & recommendation on using ISG3: 300ug KI/day & recommendation on using IS start before 10 week of gestation
n = 131(G1: 38)(G2: 55)(G3:38)
In the 3rd trimester, mean UIC was 144ug/L in IS group, 166ug/L in 200ug KI group, and 212ug/L in 300ug KI group
Bayley Scales 6-18m No significant differences were observed in child neurological development between groups.
Level II.
One-third of the women had been taking IS for ≥1year, and all women in this study appear to have a better iodine status than participants in previous studies.
O'Donnell et al, 2002
China
NS Comparative interventionG1: 400mg oral iodinated oil to PW in 1st or 2nd trimesterG2: 400mg oral iodinated oil to PW in the 3rd trimesterG3: 200mg oral iodinated oil to children at age 2-3 years
n=44(G1: 89)(G2: 103)(G3: 80)
The study was done in an area with visible goitre prevalence of 54% and congenital severe hypothyroidism of 2%.
Raven Progressive MatricesDevelopmental Test of Visual Motor IntegrationPurdue Pegboard TestDenver Developmental screening Test
5-7y No significant differences between groups in Raven test and language delays. Children whose mothers received iodine in the 1st or 2nd trimester in pregnancy (vs. those whose
Level II. Provides some evidence that early rather than late I supplementation is beneficial for better psychomotor skills at aged 5 – 7y. Control group was supplementation of children at age 2y, rather than no supplementation as in PICO question.
In G1, 23 children who might not receive sufficient
87
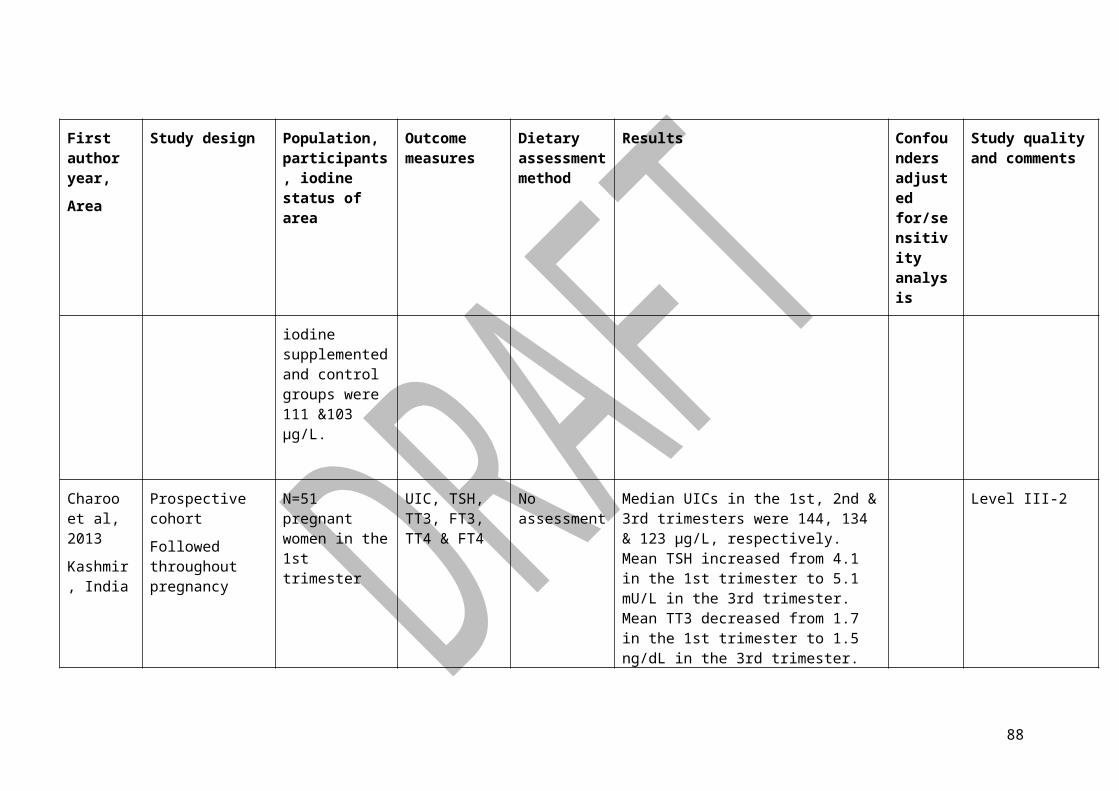
Author, year, location
Inclusion criteria
Design and doses Sample size
Baseline or follow-up gestational iodine status
Assessment test method
Child age at testing
Main effect(s) Comments
mothers were supplemented later or to children received supplementation at 2 years) have higher scores in Visual Motor Integration test, and in Purdue Pegboard test.
iodine from their mother who were supplemented 0.1mg KI daily for four days each year instead of 400mg iodinated oil. Details refer to Cao et al. (1994). paper.
Abbreviation: G1=group 1; G2=group 2; G3=group 3; IS=iodised salt; KI=potassium iodide; UIC=urinary iodine concentration; PW:PW
Meta-analysis
Authors, year,
Aim Time period of coverage, no. of articles
Inclusion criteria Exclusion criteria Main findings Comments
Bougma et al, 2013
Using meta-analysis to examine the
1980-2011, n=24(RCT: n=2)
1) Exposure to different iodine levels before pregnancy, during pregnancy
1) Use of non-standardized psychometric tests2) Sole focus on gross motor
Iodine deficient children had 6.9-10.2 IQ points lower than
Level I
Consistent results
88
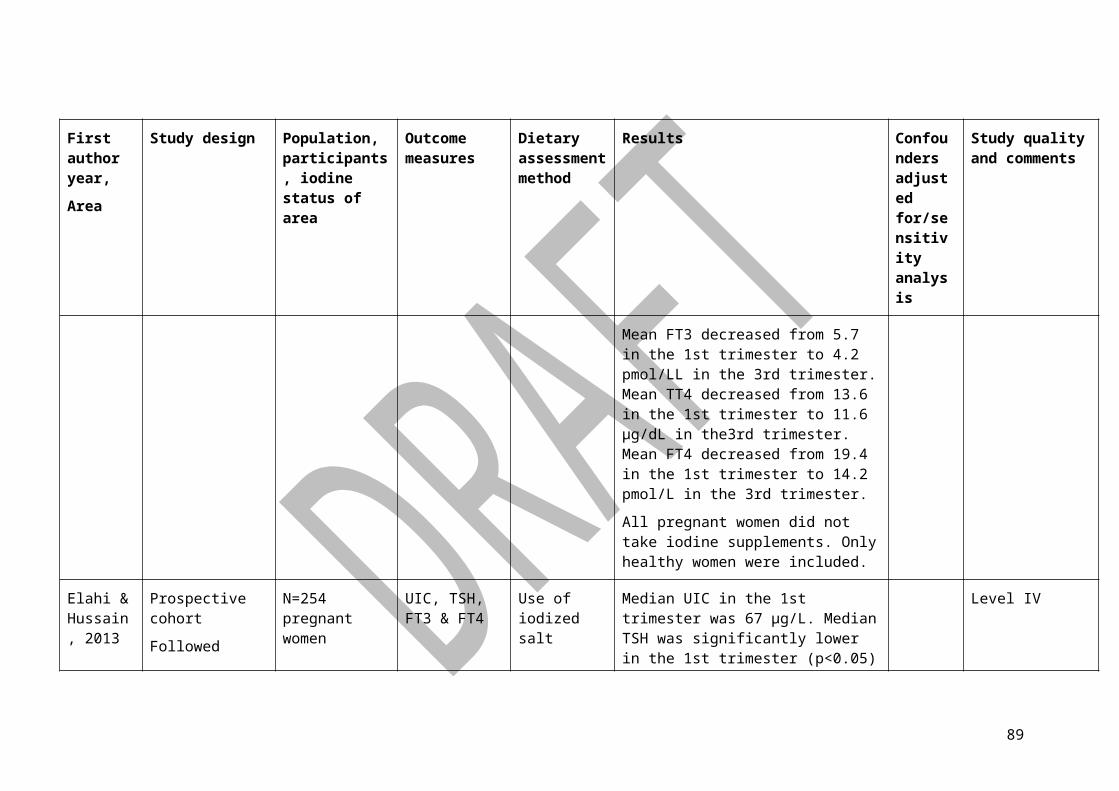
Authors, year,
Aim Time period of coverage, no. of articles
Inclusion criteria Exclusion criteria Main findings Comments
relationship between iodine and mental development of children 5 years old and under
(non-RCT intervention: n=8)(Cohort prospective by maternal I status: n=9)(Cohort prospective by infant I status: n=4)
or shortly after birth2) Examine iodine exposure and mental development outcome of children ≤5 years3) Have placebo, historical control, or iodine sufficient children of similar age as a control
milestones3) Cross-sectional observational designs that compared iodine-sufficient with iodine-deficient communities4) Stratification of mothers based on an indicator of thyroid dysfunction and/or antibody status rather than iodine status
iodine replete children
across study designs. Early pregnancy supplementation has better outcomes than 2nd and 3rd trimester, but only 2 RCTs, one in each (early vs late); both small N
Abbreviation: RCT=randomised controlled trial;
Systematic review of RCT
Author, date Number of studies included
Search strategy Studies included Results of systematic review
Zhou et al, 2013
12 RCTs Cochrane Central Register of Controlled Trials, EMBASE, MEDLINE, Cumulative Index to Nursing and Allied Health Literature and PsycINFO databases.
All RCTs comparing the effect of iodine supplementation with a parallel control group who received no iodine supplementation (or placebo) during pregnancy or the preconceptional period on clinical or biochemical outcomes were eligible for inclusion in the review.
Pregnant women or those of childbearing age regardless of iodine status or gestation
No obvious dose-response relation was seen. The effects of iodine supplementation on changes in thyroid hormone concentrations in mothers and infants were not consistent
When assessed in mothers, higher thyroxine concentrations were reported in 1 of 5 trials, lower TSH was reported in 1 of 6 trials, and lower thyroglobulin concentrations were reported in 2 of 4 trials in the iodine-
89

Author, date Number of studies included
Search strategy Studies included Results of systematic review
at trial entry were included. Trials were eligible for inclusion in which women received any form of iodine supplementation, with or without other nutrients, in which the only difference between the treatment and comparison group was the presence or absence of iodine. The primary outcome was the cognitive development of children. Secondary outcomes included pregnancy and birth out- comes, childhood growth and mortality, iodine status, and thyroid function of mothers and infants. The search was restricted to human studies without language restrictions.
supplemented group compared with control group. In infants of iodine-supplemented mothers, significant reductions in cord blood thyroglobulin were observed in 2 of 4 trials, and cord blood thyroxine was increased in 1 of 3 trials. There were no reports of significant changes in maternal triiodothyronine/free triiodothyronine or TBG, infant free thyroxine, triiodothyronine, TBG, or TSH between supplemented and control groups.
Women in the iodine-supplemented group compared with women in the control group had lower thyroid volumes in 1 of 2 trials that reported this outcome. Two other trials showed that supplementation reduced pregnancy increases in maternal thyroid volume; however, results were analyzed as percentage changes within groups and not based on the intention-to-treat principle. Children of supplemented mothers had lower thyroid volumes than did children of non-supplemented mothers in the 2 trials that reported this outcome.
Abbreviations: AI Adequate Intake, BMI Body Mass Index, CI Confidence Interval, EI Excessive Intake, OR Odds ratio, UIC Urinary Iodine Concentration, RR relative risk, TV thyroid volume
90
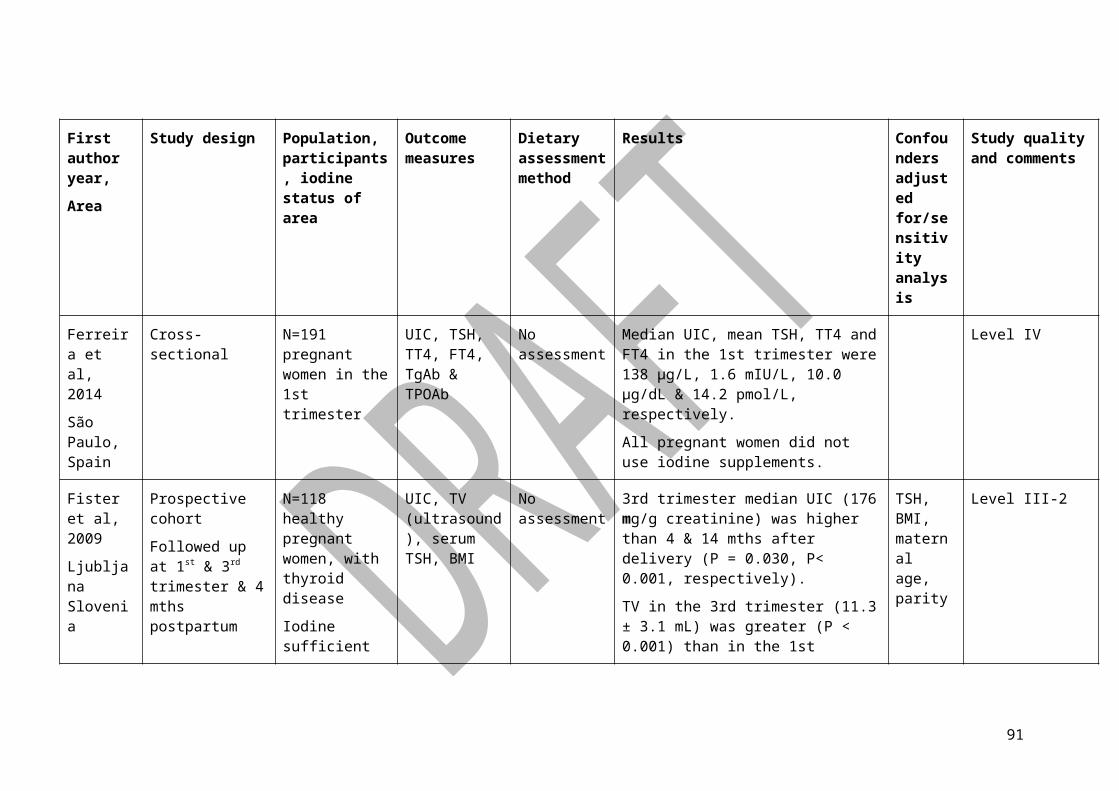
1 FT3, free triiodothyronine; FT4, free thyroxine; m, months; MUI, median urinary iodine; MUIE, mean urinary iodine excretion; n, number; No diff, no difference; NR, not reported; P, probability; PP, postpartum; PPTD, postpartum thyroid dysfunction; rT3, reverse T3; T3, triiodothyronine; T4, thyroxine; TBG, thyroxine-binding globulin; Tg, thyroglobulin; Tg-Ab, thyroglobulin antibodies; TM, trimester; TPO-Ab, thyroid peroxidase antibodies; TSH, thyroid-stimulating hormone or thyrotropin; TT3, total triiodothyronine; TT4, total thyroxine; UI, urinary iodine; wk(s), week(s); yr(s), year(s)
Abbreviation: PW=PW UICR=urinary iodine-to-creatinine ratio; ID=iodine deficiency; UIC=urinary iodine concentration; SFFQ=semiquantitative food frequency questionnaire; h=hour; y=year; m=monthT4=throxin 4;
91
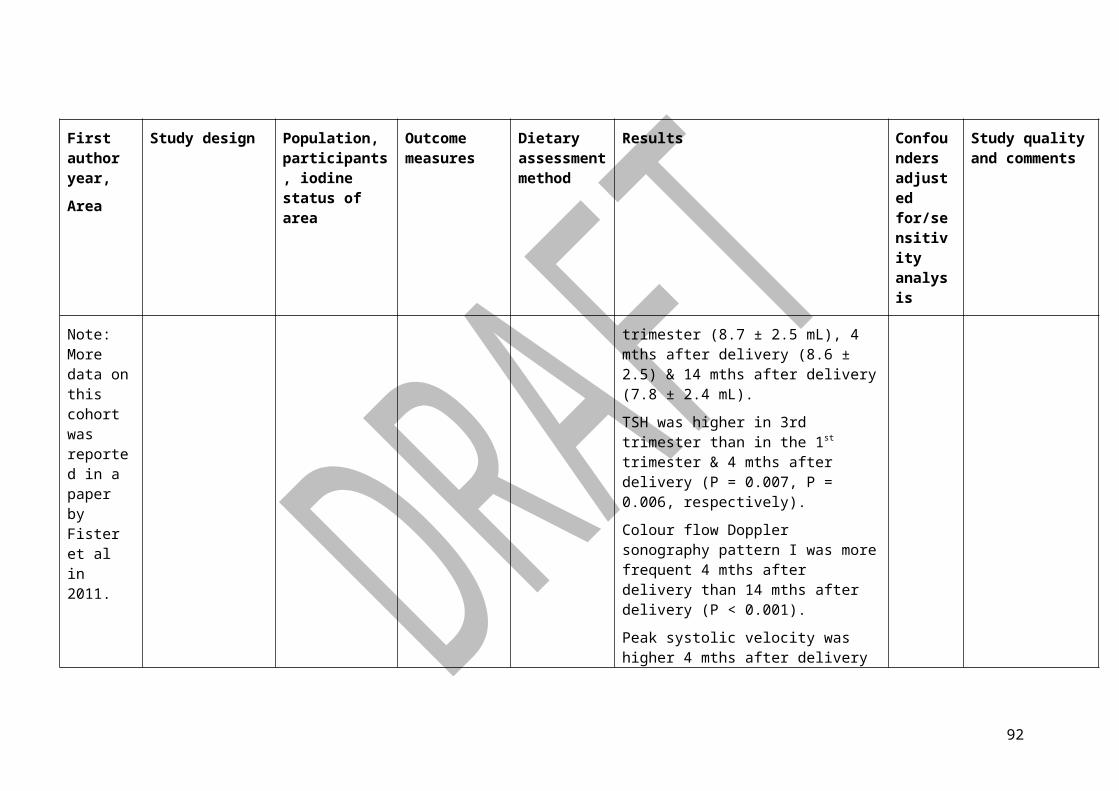
7.3 Appendix 3: Studies relating to UL for Children
Table 7:24 GRADE evaluation of Zimmerman et al (2005) paper used for determination of UL in children
Author(s):Date:Question: Iodine intake (urinary Iodine <300mc g/L) for normal thyroid function compared to Iodine intake (urinary iodine >300mc g/L) for abnormal thyroid fuction (measured by increased thyroid volume/hormone levels) for children 9-13 yearsSetting: general populationBibliography (systematic review):
Quality assessment No of patients Effect Quality Importance
No of studies
Study design
Risk of bias
Inconsistency Indirectness Imprecision
Other considerations
Iodine Intake (urinary Iodine <300mcg/L for normal thyroid function
Iodine Intake (urinary Iodine >300mcg/L for normal thyroid function (measured by increased thyroid volume/hormone levels)
Relative (95% CI)
Absolute (95% CI)
1 Observational studies
Not serious 1
Not serious 1 Not serious 1
Not serious 1
Dose response gradient
1651/3319 (49.7%)
1668/3319 (50.3%)
OR 1.75 (1.10 to 2.90)
136 more per 1000 (from
MODERATE
CRITAL
92
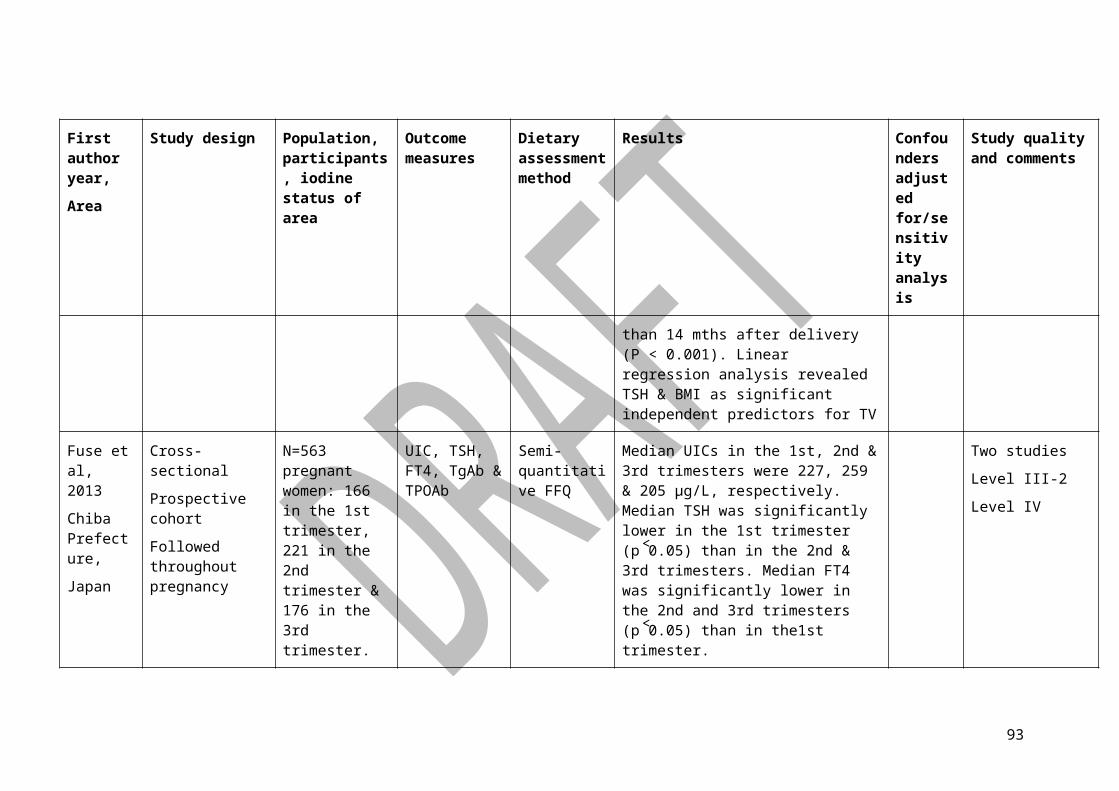
Quality assessment No of patients Effect Quality Importance
No of studies
Study design
Risk of bias
Inconsistency Indirectness Imprecision
Other considerations
Iodine Intake (urinary Iodine <300mcg/L for normal thyroid function
Iodine Intake (urinary Iodine >300mcg/L for normal thyroid function (measured by increased thyroid volume/hormone levels)
Relative (95% CI)
Absolute (95% CI)
24 more to 243 more 1
93

Table 7:25 Body of Evidence for Provisional UL in children 1-3 years
Review Question 10 What is the average intake of normal healthy children aged 1-3 years above which adverse effects on thyroid function are observed, as indicated by increased thyroid volume and/or abnormal thyroid hormone levels?
Component Rating Notes
Evidence Base Poor 1 Level II (RCT) + 1 Level III-3 + 17 Level IV studies
Consistency Poor Inconsistent results across studies. Study of Zimmerman et al. (2005) provides best evidence from children across a wide range of intakes in 5 continents and this showed an increase in thyroid volume) at a UI concentration of ~500 μg/L.
Clinical impact Moderate Health implications of sustained increased thyroid volume and elevated TSH levels in children not well defined.
Generalisability Satisfactory Most studies from China or Africa, therefore limited generalizability.
Applicability Satisfactory Probably applicable to Australian and New Zealand healthcare context with some caveats
Draft Recommendation A Provisional Upper Level (PUL) is set at 280 µg/day because of uncertainty related to evidence for this specific age group and a need to extrapolate values from UL calculated for age 9–13 years using metabolic weight formula.
Recommendation C Body of evidence provides some support for recommendation(s) but care should be taken in its application. Calculations were based on body weights for 2-3 year old children.
94

Table 7:26 Body of Evidence for Provisional UL in children 4-8 years
Review Question 11 What is the average intake of normal healthy children aged 4-8 years above which adverse effects on thyroid function are observed, as indicated by increased thyroid volume and/or abnormal thyroid hormone levels?
Component Rating Notes
Evidence Base Poor 1 Level II (RCT) + 1 Level III-3 + 17 Level IV studies.
Consistency Poor Inconsistent results across studies. Study of Zimmerman et al. (2005) provides best evidence from children across a wide range of intakes in 5 continents and this showed an increase in thyroid volume) at a UI concentration of ~500 μg/L.
Clinical impact Moderate Health implications of sustained increased thyroid volume and elevated TSH levels in children not well defined.
Generalisability Satisfactory Most studies from China or Africa, therefore limited generalizability.
Applicability Satisfactory Probably applicable to Australian and New Zealand healthcare context with some caveats
Draft Recommendation A Provisional Upper Level (PUL) is set at 350 µg/day because of uncertainty related to evidence for this specific age group and a need to extrapolate values from UL calculated for age 9–13 years using metabolic weight formula.
Recommendation C Body of evidence provides some support for recommendation(s) but care should be taken in its application.
95
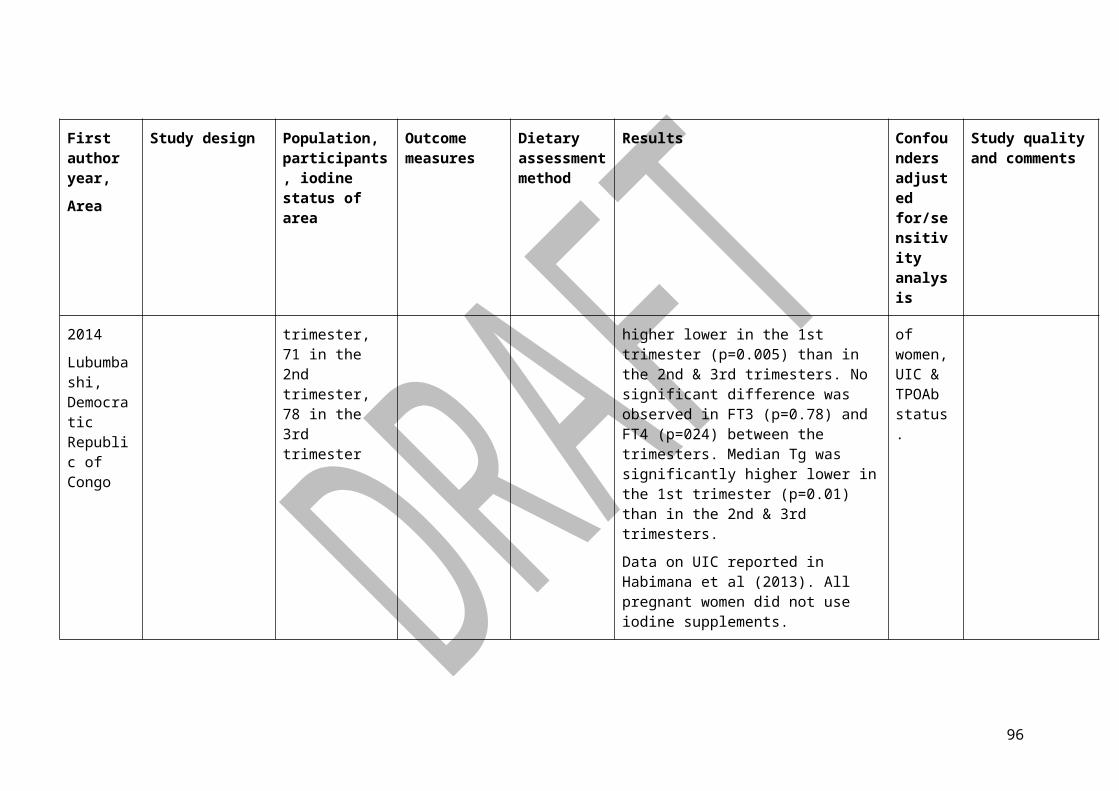
Table 7:27 Body of Evidence for Provisional UL in children 9-13 years
Review Question 12 What is the average intake of normal healthy children aged 9-13 years above which adverse effects on thyroid function are observed, as indicated by increased thyroid volume and/or abnormal thyroid hormone levels?
Component Rating Notes
Evidence Base Poor 1 Level II (RCT) + 1 Level III-3 + 17 Level IV studies.
Consistency Poor Inconsistent results across studies. Study of Zimmerman et al (2005) provides best evidence from children across a wide range of intakes in 5 continents and this showed an increase in thyroid volume) at a UI concentration of ~500 μg/L.
Clinical impact Moderate Health implications of sustained increased thyroid volume and elevated TSH levels in children not well defined.
Generalisability Satisfactory Most studies from China or Africa, therefore limited generalizability.
Applicability Satisfactory Probably applicable to Australian and New Zealand healthcare context with some caveats
Draft RecommendationUsing data from Zimmermann et al (2005) on thyroid volume in children 6-12 years, an iodine intake in excess of 550 µg/day compared to iodine intake below this level leads to a high thyroid volume. UL for the age group 9-13 years was set at 550 µg/day.
Recommendation C Body of evidence provides some support for recommendation(s) but care should be taken in its application.
96

Table 7:28 Body of Evidence for Provisional UL in children 14-18 years
Review Question 13 What is the average intake of normal healthy children aged 14-18 years above which adverse effects on thyroid function are observed, as indicated by increased thyroid volume and/or abnormal thyroid hormone levels?
Component Rating Notes
Evidence Base Poor 1 Level II (RCT) + 1 Level III-3 + 17 Level IV studies.
Consistency PoorInconsistent results across studies. Study of Zimmerman et al. (2005) provides best evidence from children across a wide range of intakes in 5 continents and this showed an increase in thyroid volume) at a UI concentration of ~500 μg/L.
Clinical impact Moderate Health implications of sustained increased thyroid volume and elevated TSH levels in children not well defined.
Generalisability Satisfactory Most studies from China or Africa, therefore limited generalizability.
Applicability Satisfactory Probably applicable to Australian and New Zealand healthcare context with some caveats
Draft RecommendationA Provisional Upper Level (PUL) is set at 820 µg/day for males and 750 µg/day for females because of uncertainty related to evidence for this specific age group and a need to extrapolate values from UL calculated for age 9–13 years using metabolic weight formula.
Recommendation C Body of evidence provides some support for recommendation(s) but care should be taken in its application.
97
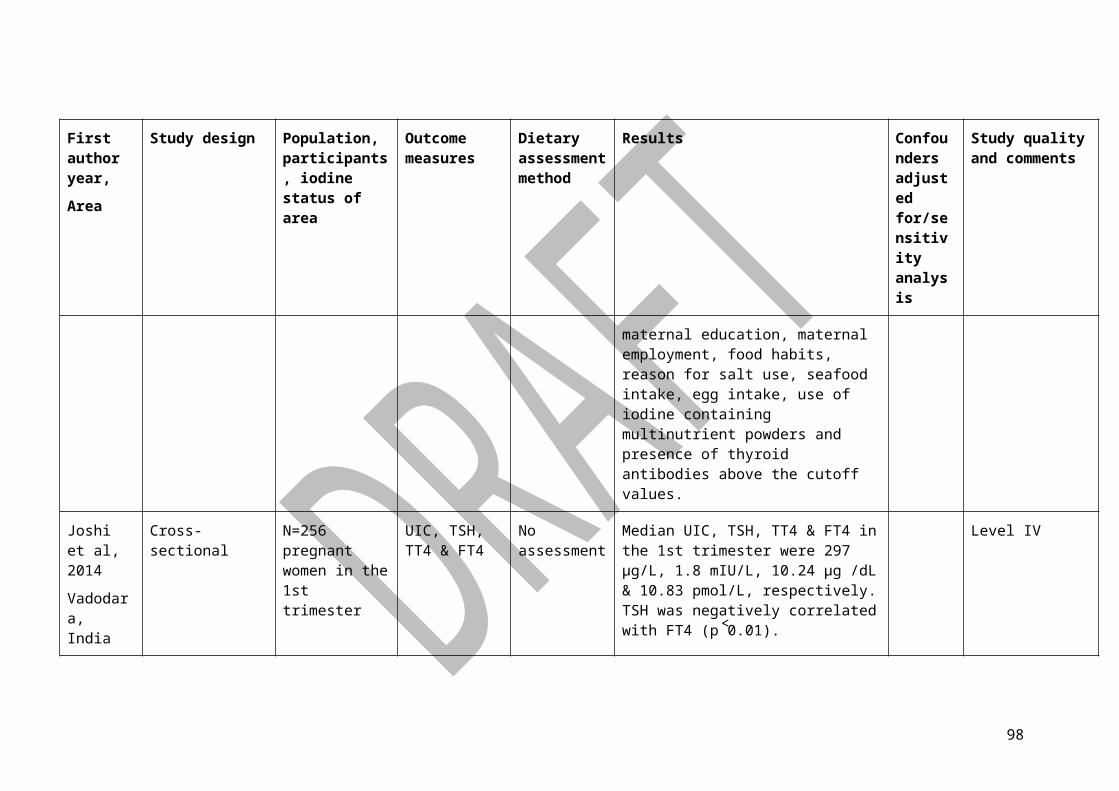
Table 7:29 Studies relating to Upper Limit in children (Review Questions 10-13)
Observational studies
Author, year Study type, Sampling, location, year
Number of subjectsGender: % (No)
Age (years)
Assessment on iodine status or clinical outcomes
Assessment of I intake
Outcomes Comments
Chen et al, 2012
Cross-sectional studyPurposive sample from two primary schools from Hebei in China, 2010
370 (60% B, 40% G)
7-13 Blood sampleUrine sample
NA Median UIC was 1032ug/LPrevalence of subclinical hypothyroidism and disease of thyroid gland by UIC level:<200ug/L: 0% and 0%; 200-399ug/L: 13.7% and 16.4%; >400ug/L: 26.9% and 52.4%
Level IV study, high risk of bias. Not a nationally representative sample. Only 6% of subjects has UIC <200ug/L, which cannot be used as a comparative control.
Feng, 2010 Cross-sectional studymultistage random sampling was used to select school children from villages at 5 cardinal points from Hebei in China, 2010
1209 8-12 Urine sample (n=584)Goiter grading by palpation
Calculated I intakeSalt sample
No difference in UIC was found between children with goiter and those without goiter.225ug/L UIC and 337ug/d estimated I intake in goiter patients (n=55, 9.42% of subjects); 207ug/L UIC and 310ug/d estimated I intake in
Level IV study
Prevalence of goiter might be underestimated due to the use of palpation vs. ultrasonic scan.
98
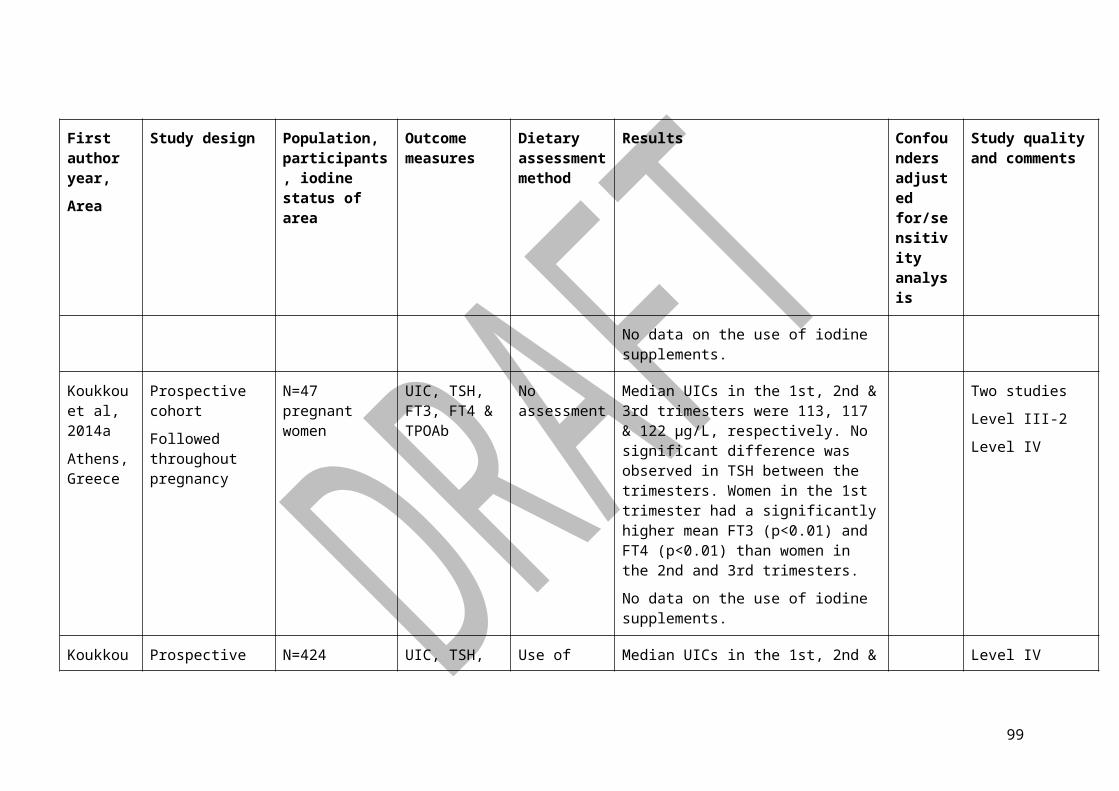
Author, year Study type, Sampling, location, year
Number of subjectsGender: % (No)
Age (years)
Assessment on iodine status or clinical outcomes
Assessment of I intake
Outcomes Comments
children without goiter (n=529, 90.58%)
Henjum et al, 2010
Cross-sectional studyRandom sample from 4 Saharawi refegee camps2007
421 6-14 Thyroid ultrasonic scanUrine sample
Drinking water sample Milk sample from livestocks
16% children had UIC of 100-299ug/L; 28% of 300-499ug/L; 38% of 500-000ug/L. Median [iodine] in drinking water was 108ug/L, and in milk was 595ug/L. Goiter rate based on total thyroid volume-for-body surface area was 86%.
Level IV study.Not relevant to Australia and New Zealand - 21% of subjects were underweight, 24% were stunted, and 9% had low BMI-for-age. Most had UIC indicative of excessive intakes.
Hussein et al, 2012
Cross-sectional studyProbability-proportional-to-size sampling methodG1: schoolchildren living in the Red Sea regionG2: schoolchildren living in the White Nile region,
G1: 140 (51% B, 49%G)G2: 140 (51% B, 49%G)
6-12 Urine sampleGoiter grading by palpation
Fish eating questionnaire Household salt sample
G1: iodine in salt varied from 141 to 361mg/kg; mean UIC was 588ug/L; goiter rate was 17.1%G2: no trace of iodine in salt samples; mean UIC was 176ug/L; goiter rate was 1.4%
Level IV study with high risk of bias.G1 and G2 are living in similar geographic areas where seafood is accessible.G1 and G2 are not comparable due to difference in dietary habits - 77.1% of children in G2
99
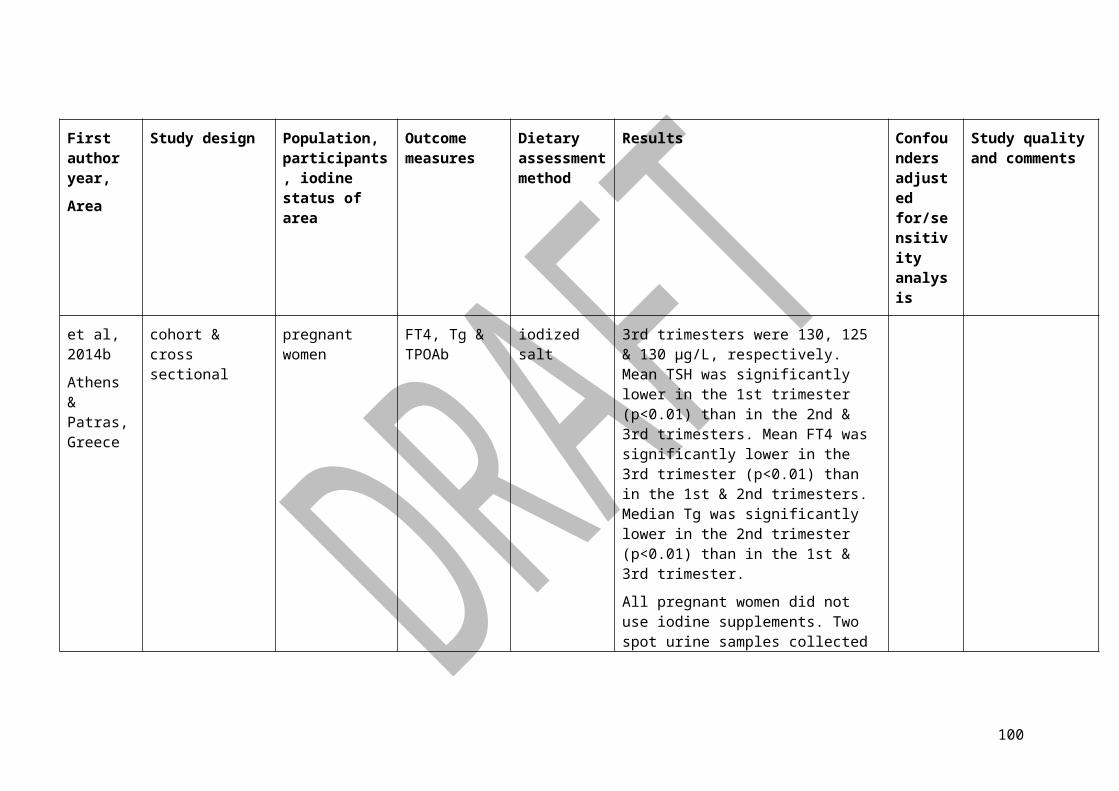
Author, year Study type, Sampling, location, year
Number of subjectsGender: % (No)
Age (years)
Assessment on iodine status or clinical outcomes
Assessment of I intake
Outcomes Comments
Sudan, 2006 consumed fish weekly while only 1.4% in G1 reported fish consumption.
Izzeldin et al, 2007
Cross-sectional studyMultistage random sampling method,Red Sea, 2006
141 6-12 Urine sample (n=141)Goiter grading by palpation
School salt sample (n=20)
Goiter rate was 17%UIC: 3.5%<100ug/L; 21.3% 100-299ug/L; 75.1% ≧ 300ug/LIodine content in salt ranged from 154mg/kg to 1272mg/kg
Level IV study with high risk of bias. A pilot study with a small sample size. Goiter rate was only reported in abstract but not in the body of the article
Li et al, 2012 Cross-sectional studyRandomly selected schoolchildren from village of 202 towns in 16 districts in China,2009-2010
1594 8-10 Thyroid ultrasonic scan
Drinking water sample (n=1097)Household salt sample (n=4501)
Median UIC is 336ug/L in regions with 150-300ug/L iodine in water, and is 494ug/L in regions with >300ug/L iodine in water.Goiter rate in region with >150ug/L water [iodine] was 8%No obvious relationship between salt intake and goiter rate.
Level IV study with high risk of bias.
Goiter rate cannot be compared between areas with different [iodine] in water - goiter rate was not assessed in regions with <150ug/L iodine in water, and goiter rate was not reported according to the [iodine] in water.Large sample size and national representative
100
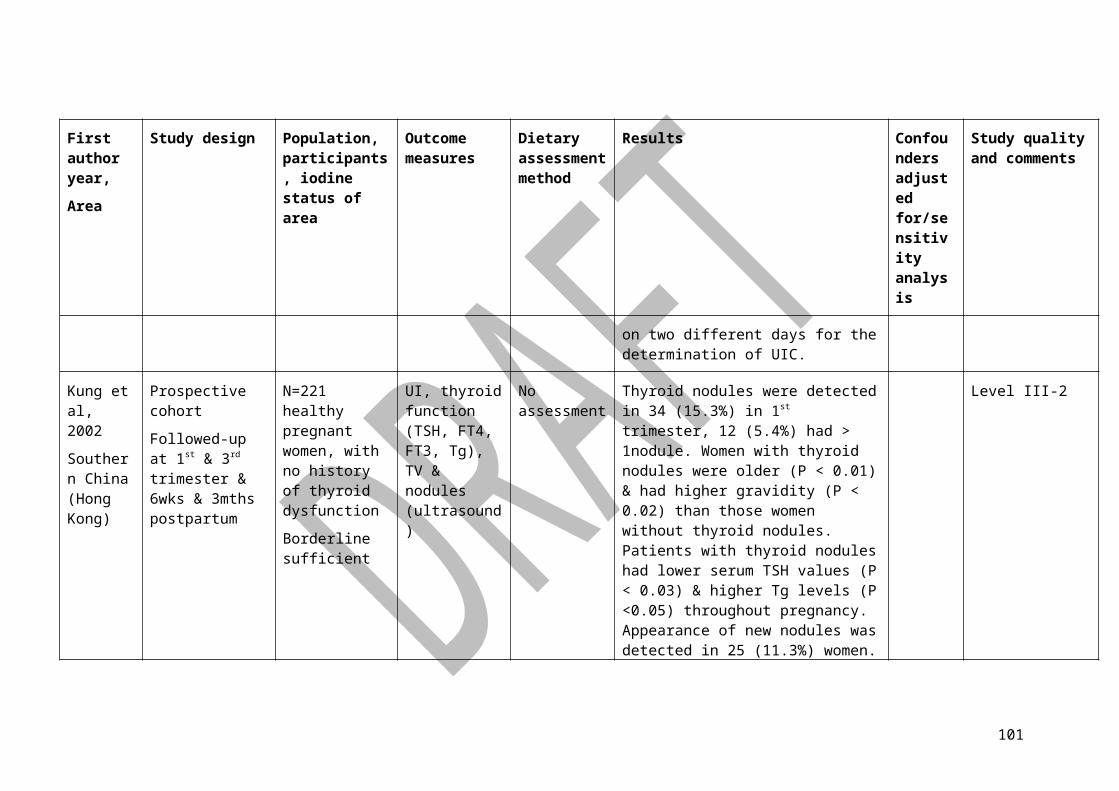
Author, year Study type, Sampling, location, year
Number of subjectsGender: % (No)
Age (years)
Assessment on iodine status or clinical outcomes
Assessment of I intake
Outcomes Comments
sample
Lv et al,, 2012 Cross-sectional studyProbability-proportional-to-size sampling method to randomly select subjects from 30 villages in Hebei Province, China2006
1259 (49% B; 51%G)
8-10 Thyroid ultrasonic scan (n=1259)Urine sample (n=363)
Drinking water sample (n=85)Household salt sample (n=301)
Goiter rate in villages with water iodine of <150ug/L is 10.8%, and in villages with water iodine of >150ug/L is 11%.In villages with water iodine of >150ug/L, median UIC in villages with iodised salt was 443ug/L, which is significantly higher than 350ug/L obtained from villages without iodised salt. 68% subjects had UIC >300ug/L.
Level IV study with high risk of bias. Frequency of seafood consumption was unknown.Only 29% of subject provided a urine sample.
Kassim et al, 2014
Cross-sectional study;
stratified, 2-stage, household cluster survey; 3 zones of Somalia; 2009
507 of 756 subjects were assessed for the presence of visible
6-11 UIC & recognition of visible goitre (not palpation)
Household FFQ &
salt sample
Goitre prevalence was higher in children living in Northwest Zone (median UIC: 288 μg/L; goitre prevalence: 1.3) than children living in South Centre Zone (median UIC:
Level IV
101
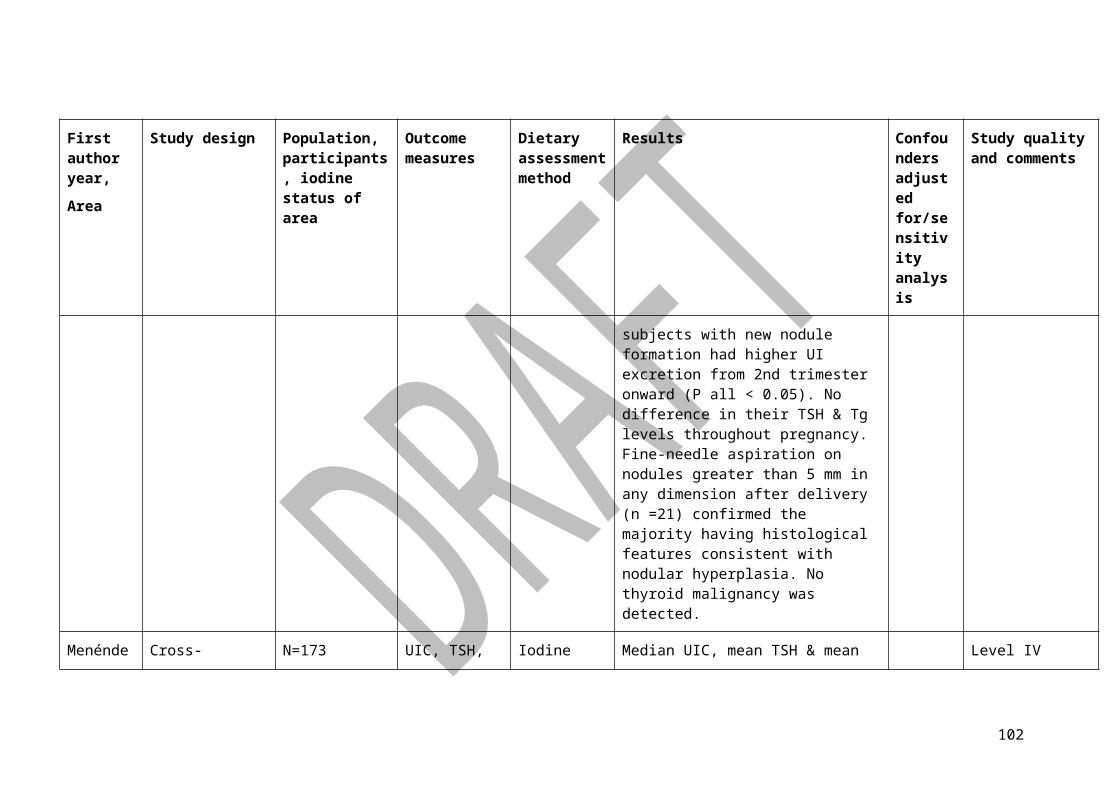
Author, year Study type, Sampling, location, year
Number of subjectsGender: % (No)
Age (years)
Assessment on iodine status or clinical outcomes
Assessment of I intake
Outcomes Comments
goitre (not palpation)
398 μg/L; goitre prevalence: 0.3).
It was unknown if goitre cases reported were caused by iodine-induced thyroid dysfunction.
Kim et al, 2014
Cross-sectional study;
(not reported);
high school students in Tuguegarao, Cagayan Valley, Philippines;
2013
146 (67M/79F) of 260 were assessed for TV measurement and use of iodised salt.
12-25 UIC & TV (by ultrasonography)
Use of iodised salt
Median UIC was 355 μg/L; no significant difference was observed in UIC between iodised salt and non-iodised salt users (p=0.099). Iodised salt users had a significantly lower TV than non-iodised salt users (p=0.032).
Level IV
Medani et al, 2013
Cross-sectional;
multi-stage random sampling;
Port Sudan, Sudan; 2006
31 of 654 children gave a spot urine sample
6-12 UIC & TV (by palpation)
No assessment Median UIC was 464 μg/L: 77.4% of children had a UIC>300 μg/L. Goitre rate was 35%.
Level IV
102
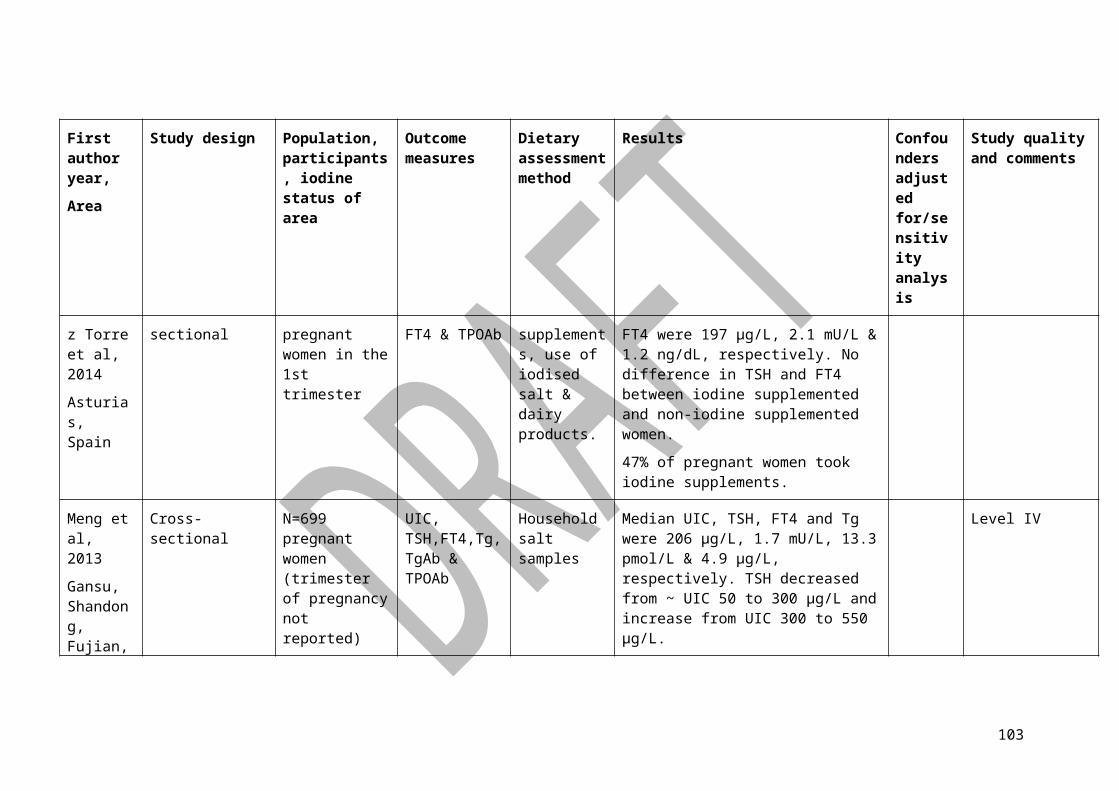
Author, year Study type, Sampling, location, year
Number of subjectsGender: % (No)
Age (years)
Assessment on iodine status or clinical outcomes
Assessment of I intake
Outcomes Comments
Meng et al, 2013
Cross-sectional;
100 children, 100 adults, 50 pregnant women & 50 lactating women were selected from each province;
Gansu, Shandong, Fujian, Jilin, Anhui & Chongqing provinces, China;
2009
627 (314 M/313F)
8-10 UIC, TSH,FT4,Tg, TgAb, TPOAb & TV (ultrasound).
Household salt samples
Median UIC, TSH, FT4 & Tg were 271 μg/L, 2.8 mU/L, 17.7 pmol/L & 5.8 μg/L, respectively. Goitre prevalence was 6.7%. TSH decreased from ~ UIC 50 to 300 μg/L and increase from UIC 300 to 550 μg/L.
Level IV
Rossi et al, 2002
Cross-sectional studyRandom sample from 21 villages/town in Central Brazil,
1977 (46% B, 54% G)
6-14 Thyroid ultrasonic scan (n=1788)Urine sample (n=1013)
Salt sample (n=1325)
Mean UIC was 360ug/L. 49% >300ug/LMean thyroid volume by age and sex3.10cm3 in boys aged 6-8y; 4.22cm3 in boys aged 9-14y;3.19cm3 in girls aged 6-8y; 4.44cm3 in girls aged
Level IV study with high risk of bias. Sample had exceptional excellent health and nutritional status (80% above the 97th percentile for height and weight, and 7.3% had excessive weight), thus
103
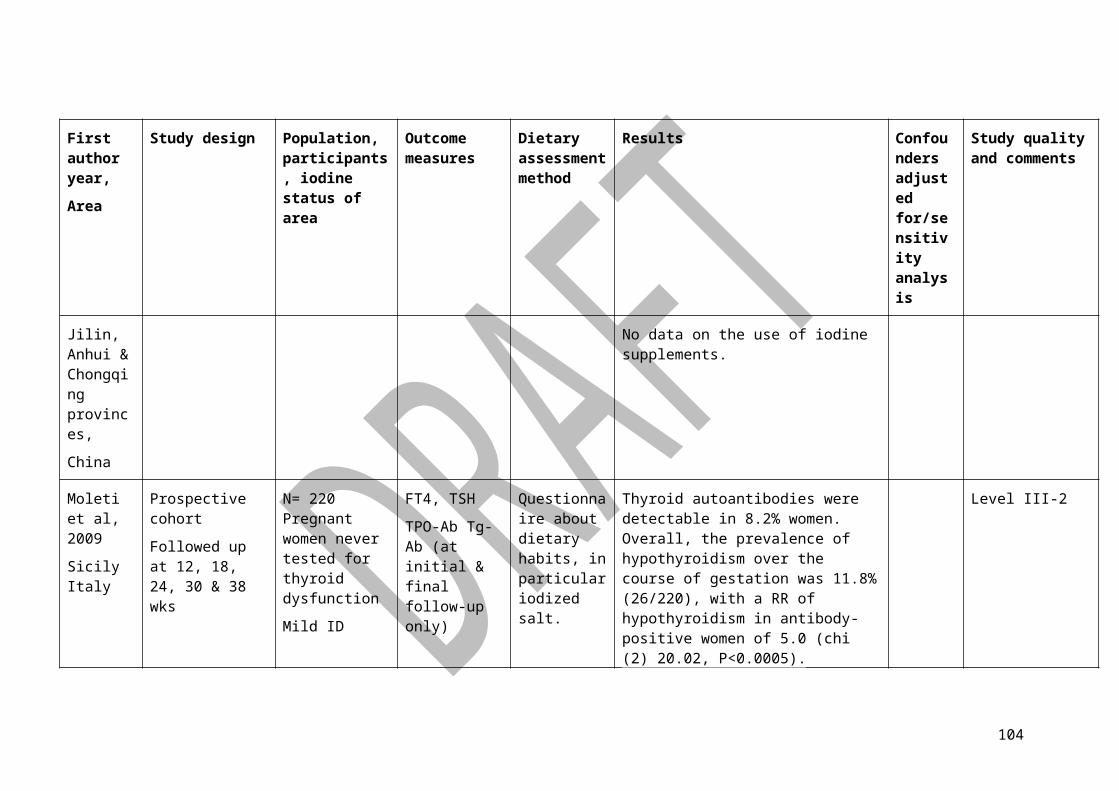
Author, year Study type, Sampling, location, year
Number of subjectsGender: % (No)
Age (years)
Assessment on iodine status or clinical outcomes
Assessment of I intake
Outcomes Comments
9-14y limited generalizability
Seal et al, 2006
Cross-sectional studyCluster sampling in 5 camps and systematic sampling in the remaining 1 camp. Sample from 6 refugee camps in Africa, 2001-2003
895 (54% B, 46% G)
10-19 Urine sampleRecognition of visible goitre (not palpation)
Market and household salt samples (n=11)
Calculated iodine intake was 440ug/d per personMedian UIC (goiter rate) in 4 camps was 726ug/L (0.4%); 1074ug/L (1.3%); 1170ug/L (7.1%); 570ug/L (0%)
Level IV study with high risk of bias.Low prevalence of goiter would be attributed to poor assessment method for goiter
Shen et al, 2011
Cross-sectional studyrandom sample from 299 towns in 9 provinces with median water [iodine] of >150ug/L, China, 2005-2006
56751 8-10 Urine sampleGoiter grading by palpation (n=26575) & thyroid ultrasonic scan (n=1413)
Drinking water sample (n=28857)
Goiter rate increased with increasing median UIC and median water [iodine] respectively. Compared to children with UIC of 100-199ug/L, RR for goitre was 1.56 for those with UIC of 300-399ug/L.
Level IV study, very large sample size. National representative sample only for those who might consume excessive iodine from water.No of children with UIC of 100-199ug/L (not published) might be small as towns with <150ug/L water [iodine] were not included
104
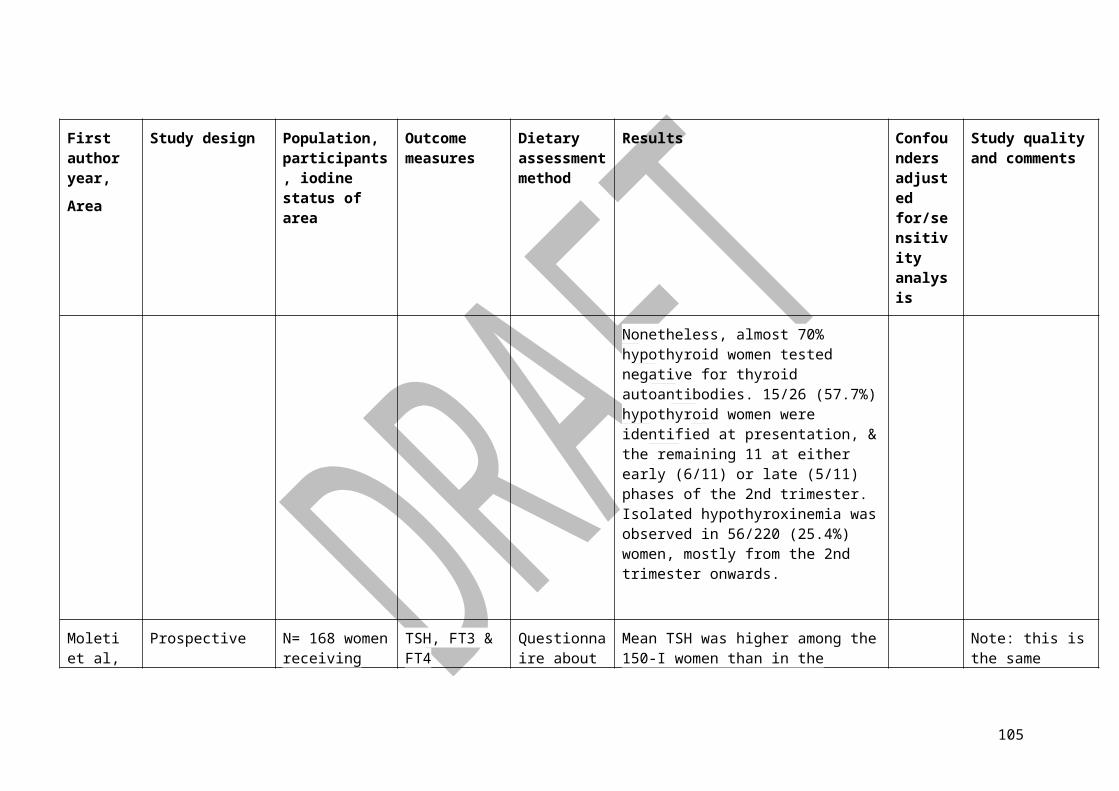
Author, year Study type, Sampling, location, year
Number of subjectsGender: % (No)
Age (years)
Assessment on iodine status or clinical outcomes
Assessment of I intake
Outcomes Comments
Teng et al, 2006
Cross-sectional study (convenience sample) from a 5-year cohort study in China, 2004
60 of 3018 subjects were children
8-10 Urine sample, blood sample, goiter grading by palpation & thyroid ultrasonic scan
Questionnaire elicited personal information, economic status of the family, eating habits, type of salt used, amount of salt ingested per day, and thepersonal or family history of thyroid diseases
Goiter rate among schoolchildren was not reported
Level IV study, few children.
Zimmerman, 2013
Cross-sectional studyMultiethnic sample from 12 countries intake ranging from adequate to excessive
2512 6 to 12 Measured UIC, TSH, total T4, Tg, and thyroid antibodies. Tg response to both low- and high-iodine intake was examined. Estimated the population cutoff
Standardized dried blood spots-Tg assay
Compared with iodine-sufficient children, there was a significantly higher prevalence of elevated Tg values in children with iodine deficiency (UIC <100 μg/L) and iodine excess (UIC
Level IV study with low risk of bias, Tvol measured by ultrasound, large sample from a range of populations with varying iodine status. Most comprehensive database to date.
105
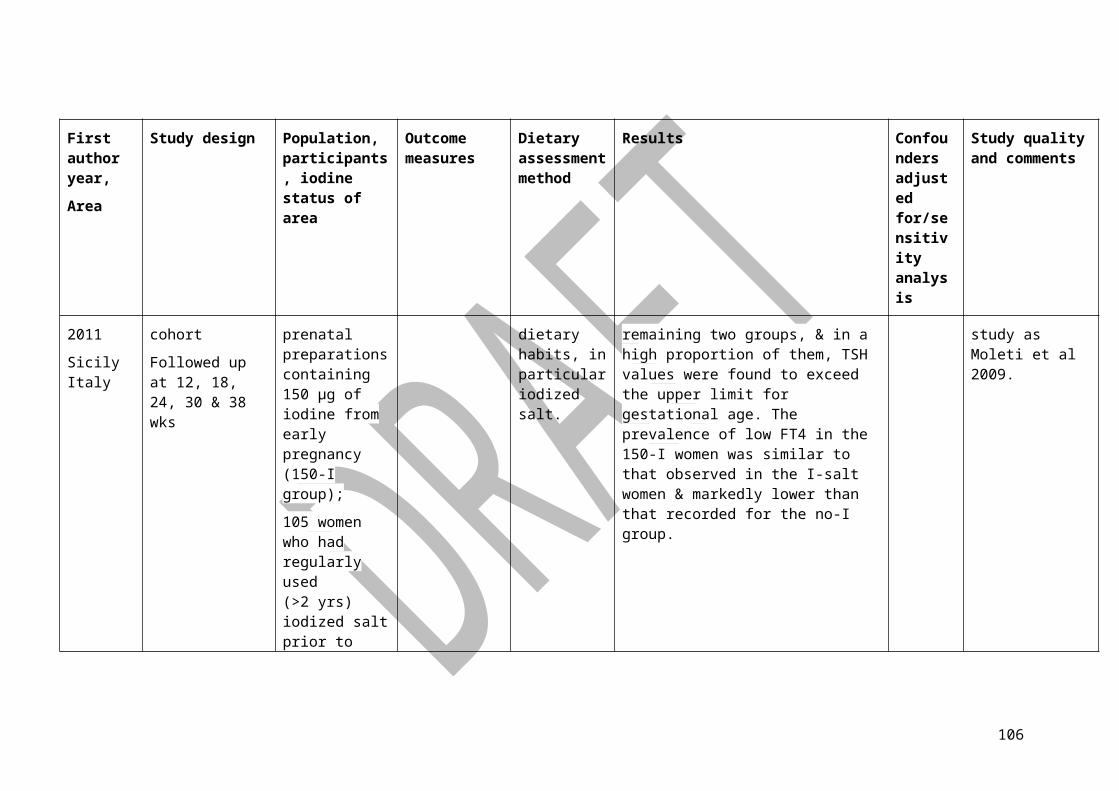
Author, year Study type, Sampling, location, year
Number of subjectsGender: % (No)
Age (years)
Assessment on iodine status or clinical outcomes
Assessment of I intake
Outcomes Comments
point for iodine deficiency or excess using Tg. Compared thyroid functions within the UIC ranges of 100-199 vs 200-299 μg/L.
>300 μg/L). There was no significant change in the prevalence of elevated Tg, TSH, T4, or thyroid antibodies comparing children within the UIC ranges of 100-199 vs 200-299 μg/L.
Zimmermann et al, 2005
Cross-sectional studyMultiethnic sample from 5 continents with iodine intake ranging from adequate to excessive,
3319 (53% B; 47% G)
6-12 Urine sample Thyroid ultrasonic scan
Iodine intake was estimated from median UIC
No significant correlation between UIC and age- and BSA-adjusted Tvol for all locations except coastal Hokkaido (median UIC was <300ug/L in the former locations vs. >700ug/L in the latter). In Coastal Hokkaido, OR for goier was 1.75 for a 10-fold increase in UIC.
Estimated median iodine intake, median UIC, age-and BSA-adjusted thyroid volume:
Level IV study with low risk of bias. Dose response was assessed and reported.Calculation of sample size was reported. Data from this large international sample had been used to determine a WHO reference values for thyroid volume by ultrasound in iodine sufficient schoolchildren (see Zimmermann (2004) Am J Clin Nutr)
106
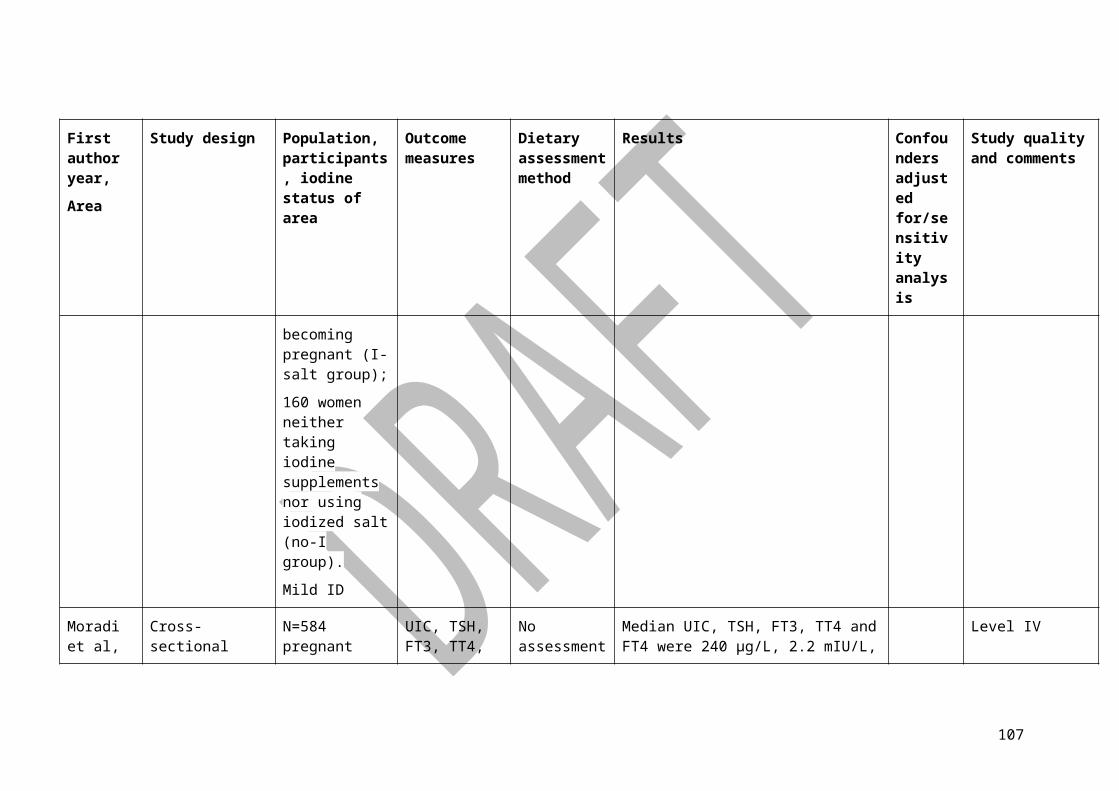
Author, year Study type, Sampling, location, year
Number of subjectsGender: % (No)
Age (years)
Assessment on iodine status or clinical outcomes
Assessment of I intake
Outcomes Comments
All sites: 241ug/d, 218ug/L, 2.54mlBy region:Jona, Switzerland: 120ug/d, 116ug/L, 2.59mlBanama, Bahrain: 183ug/d, 185ug/L, 2.16mlCape Town, South Africa: 205ug/d, 189ug/L, 2.39mlLima, Peru: 300ug/d, 253ug/L, 2.42mlChelsea, MA: 314ug/d, 292ug/L, 2.21mlCentral Hokkaido, Japan: 292ug/d, 296ug/L, 2.86mlCoastal Hokkaido, Japan: 241ug/d, 728ug/L, 4.91ml
Abbreviation: G1=group 1; G2=group 2; B=boys; G=girls; UIC=urinary iodine concentration; [iodine]=iodine concentration; RR=relative risk; [iodine]=iodine concentration; BSA=body surface area
Table 7:30 Studies relating to Upper Limit in children (Review Questions 10-13)
Intervention studies
107
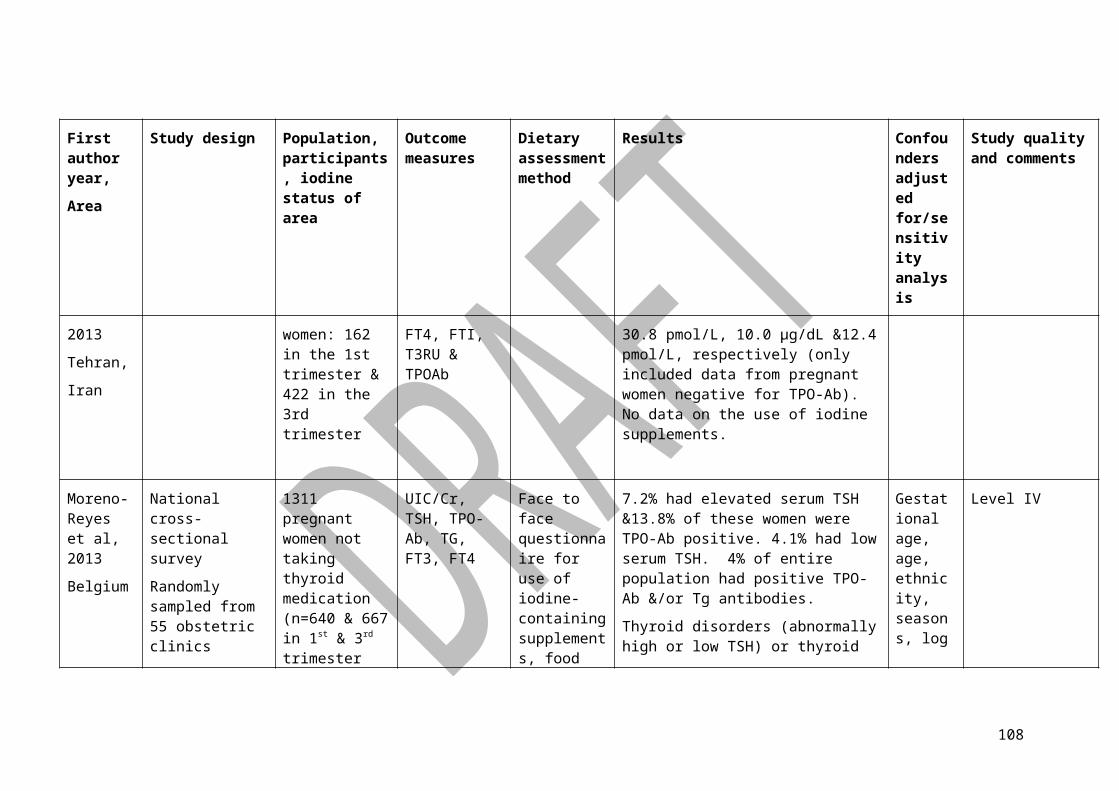
Author, year, location
Inclusion criteria Design and doses
Sample size
Baseline or follow-up gestational iodine status
Assessment test method
Main effect(s) Comments
Huda et al, 2001
Children (mean age of 9.8y) studying at one of 10 selected schools in Bangladesh
RCT (4m)G1: placeboG2: 400mg oral iodized poppy seed oil
G1:142G2: 145
Baseline median UIC: 2.86umol/L (362ug/L) for G1 & 2.76umol/L (349ug/L) for G2
Follow-up median UIC: 3.31umol/L (419ug/L) for G1 & 6.83umol/L (865ug/L) for G2
AnthropometrySerum T4, TSH, UICCognitive and motor function tests designed for Bangladeshi children
No difference was observed between groups for all cognitive and motor tests
Level II study with low risk of bias. According to the authors, the subjects are moderately iodine-deficient children, but their baseline median UIC are >300ug/L. The authors also claimed that normal median UIC is 7.9umol/L which is 1000ug/L.
Li et al, 2012 Volunteers from urban and rural areas in China
Before and after intervention randomised trial (27 day)G1: 6mg/kg iodised salt; G2: 15mg/kg iodised salt; G3: 24mg/kg iodised salt; G4: 34 mg/kg iodised salt
n=1099 G1: 269 G2: 290 G3: 271 G4: 269
In children aged 7-12y:Baseline median UIC among urban children ranged from 231ug/L to 354ug/L, and ranged from 456ug/L to 519ug/L in rural area
Median UIC Regardless area of origin, median UIC ranged from 105ug/L to 194ug/L in G1; ranged from 245ug/L to 252ug/L in G3; and ranged from 302ug/L to 336ug/L in G3
Level III-2 study with high risk of bias.
Sample was not randomly selected. Unclear whether participants had thyroid disease. Compliance and amount of salt intake were not reported.
108

Abbreviation: y=year; RCT=randomised controlled trial; G1=group 1; G2=group 2; UIC=urinary iodine concentration; T4=thyroxine; TSH=thyroid stimulating hormone
109

7.4 Appendix 4: Membership of groups and committees involved in the development process
7.4.1 Membership of the Nutrient Reference Values Steering Group
The Steering Group for the project was composed of representatives from the Australian Government Department of Health, and the New Zealand Ministry of Health.
7.4.2 Membership of the Nutrient Reference Values Advisory Committee
Professor Samir Samman (Chair) Department of Human Nutrition, University of Otago, New ZealandMs Janis Baines Food Standards Australia New ZealandAssociate Professor Marijka Batterham School of Mathematics and Applied Statistics, University of Wollongong, AustraliaProfessor Michael Fenech CSIRO Food & Nutritional Sciences, Adelaide, AustraliaProfessor Mark Lawrence School of Exercise and Nutrition Sciences, Deakin University, AustraliaProfessor Jim Mann School of Medicine, University of Otago, New ZealandProfessor Murray Skeaff Department of Human Nutrition, University of Otago, New ZealandProfessor Linda TapsellSchool of Medicine, University of Wollongong, AustraliaEmeritus Professor Christine Thomson (until February 2015)Department of Human Nutrition, University of Otago, New ZealandProfessor Lynne Daniels (2013)Head of School, Exercise & Nutrition Sciences, Queensland University of Technology,Queensland, Australia.
7.4.3 Membership of the Nutrient Reference Values Iodine Expert Working Group
Emeritus Professor Christine Thomson (Chair until February 2015)Department of Human Nutrition, University of Otago, New Zealand
Associate Professor Sheila Skeaff (Deputy Chair) Department of Human Nutrition, University of Otago, New Zealand
Associate Professor Karen Charlton School of Medicine, University of Wollongong, Australia
Professor Creswell Eastman School of Medicine, University of Sydney, Australia
110
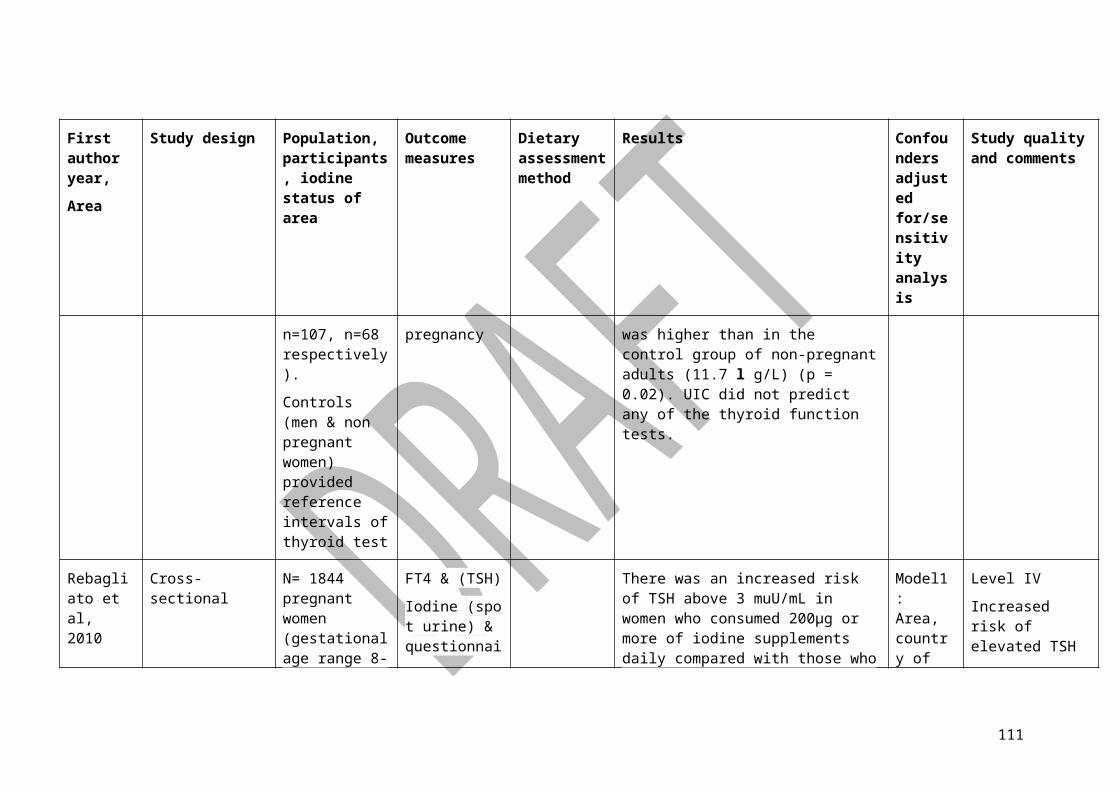
Ms Judy Seal Department of Health and Human Services, Tasmania, Australia
Observers
Associate Professor Gary MaAsia Pacific Regional International Council for Control of Iodine Deficiency Disorders (ICCIDD) Global Network, Sydney.
Iodine Research Assistants
Zheng Feei MaDepartment of Human Nutrition, University of Otago, New Zealand
Dr Sonya CameronDepartment of Human Nutrition, University of Otago, New Zealand
Cecilia SamDepartment of Human Nutrition, University of Otago, New Zealand
111
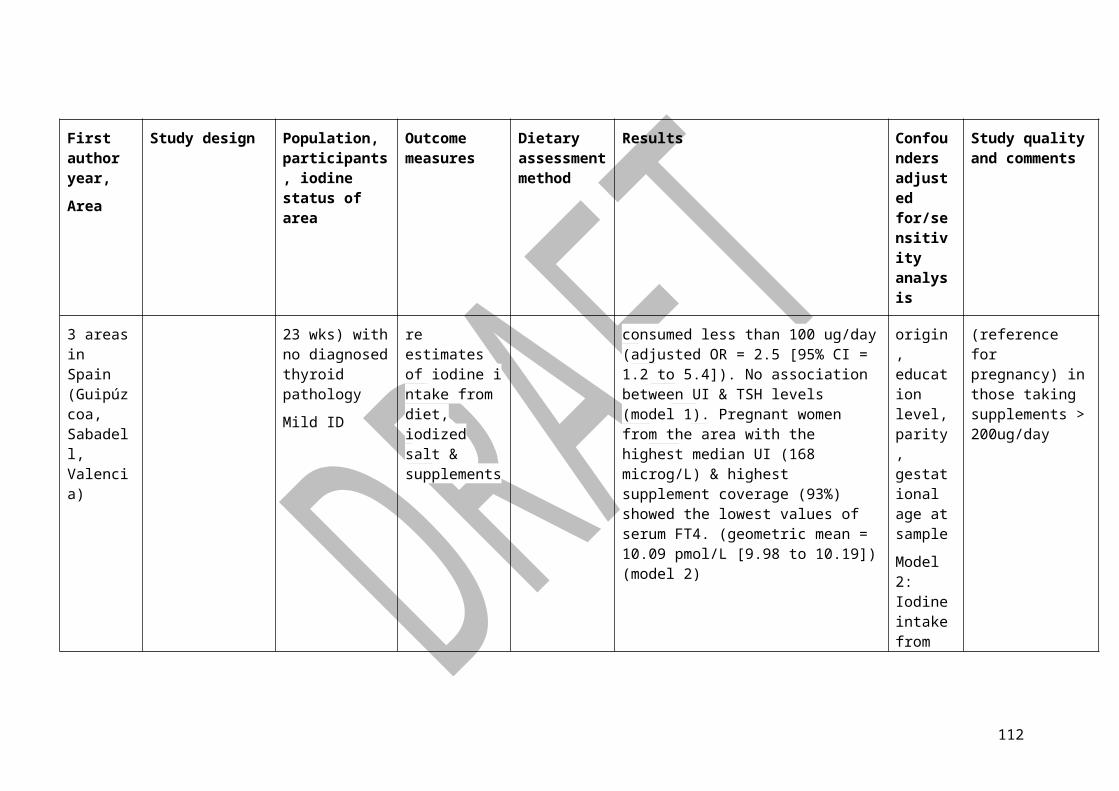
8 Abbreviations and Glossary
8.1 Abbreviations
Acronym Description
ANS
BOE
Adult Nutrition Survey
Body of Evidence
DoH
DRIs
Department of Health
Dietary Reference Intakes
EAR Estimated Average Requirement
EFSA European Food Safety Authority
EER Estimated energy requirement
EWG Expert Working Group
FAO Food and Agriculture Organization of the United Nations
FNB Food and Nutrition Board
FT3 Free 3,5,3' tri-iodothyronine
FT4
GFR
Free thyroxine
Glomerular Filtration Rate
ICCIDD International Council for the Control of Iodine Deficiency Disorders
ID Iodine deficiency
IDD Iodine deficiency disorders
IQ Intelligence Quotient
IOM Institute of Medicine
LOAEL Lowest-Observed-Adverse-Effect level
MoH Ministry of Health
NINS National Iodine Nutrition Study
NHMRC National Health and Medical Research Council
NHS National Health Survey
NRVs Nutrient Reference Values
NZ New Zealand
PICO Population, Intervention, Comparator, Outcome
PUL Provisional Upper Level of Intake
RCT Randomised controlled trial
112
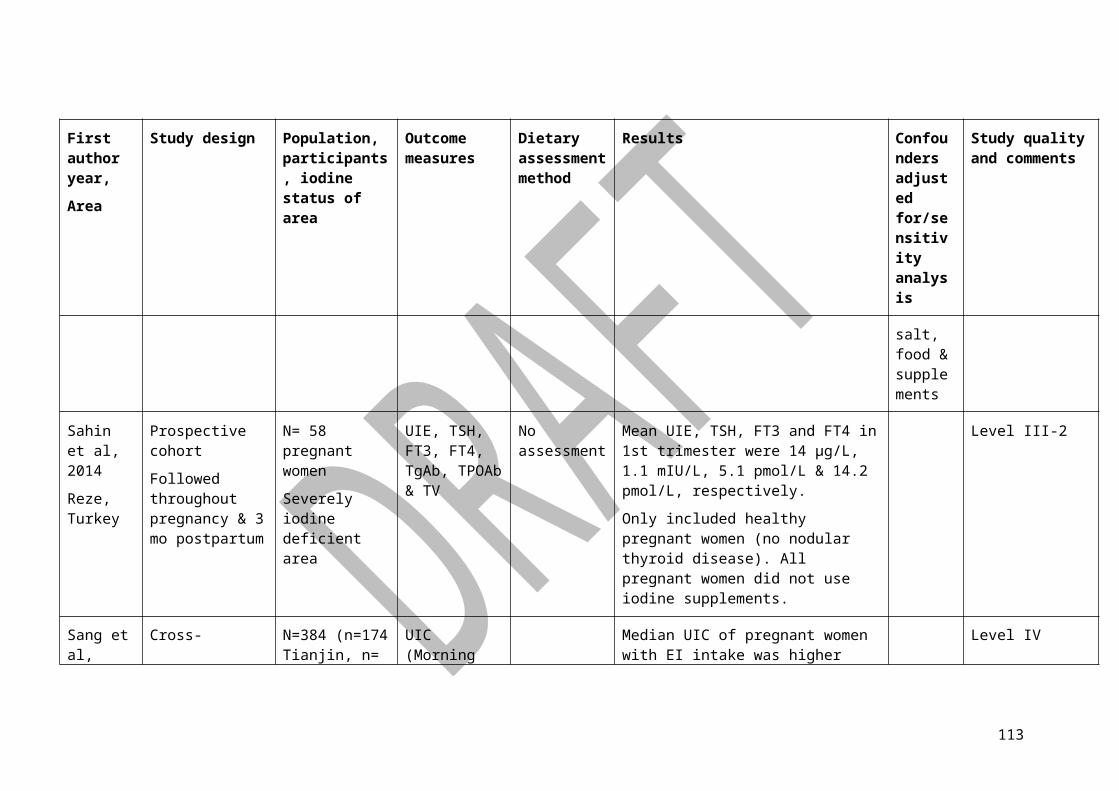
Acronym Description
RDI Recommended Dietary Intake
SDT Suggested Dietary Target
T3 3,5,3' tri-iodothyronine
T4 Thyroxine
Tg Thyroglobulin
TgAb Thyroglobulin antibody
TPOAb Thyroid peroxidase antibody
TSH Thyroid stimulating hormone
UIC Urinary iodine concentration
UIE Urinary iodine excretion
UL Upper Levels of Intake
UNU United Nations University
UNICEF United Nations Children's Fund (formerly United Nations International Children's Emergency Fund)
WHO World Health Organization
8.2 Glossary
Term Description
Adequate Intake (AI) The recommended average daily intake level based on observed or experimentally determined approximations or estimates of nutrient intake by a group (or groups) of apparently healthy people that are assumed to be adequate-used when an RDI or RDA cannot be determined.
Acceptable Macronutrient Distribution Range (AMDR)
An estimate of the range of intake for each macronutrient (expressed as percent contribution to energy), which would allow for an adequate intake of all the other nutrients while maximizing good health (applies only to adults and young people aged 14 years and over).
Dietary Reference Intakes (DRIs)
A set of four reference values for USA and Canada: Estimated Average Requirements (EAR), Recommended Dietary Allowances (RDA), Adequate Intakes (AI) and Tolerable Upper Intake Levels (UL).
Estimated Average Requirement (EAR)
A daily nutrient level estimated to meet the requirements of half of the healthy individuals in a particular life stage and gender group.
Estimated energy requirement (EER)
The average dietary energy intake that is predicted to maintain energy balance in a healthy adult of a defined age, gender, weight and level of
113

Term Description
physical activity, consistent with good health. For children and for pregnant and lactating women, the EER include needs associated with growth or the secretion of milk at rates consistent with good health.
Iodine deficiency disorders (IDD)
A range of health consequences or abnormalities of the body resulting from a prolonged lack or insufficient intake of iodine, ranging from simple goitre to cretinism, which is a condition of severely stunted physical and mental growth.
Lowest-Observed-Adverse-Effect level (LOAEL)
The lowest tested dose of a substance that has been reported to cause harmful (adverse) health effects on people or animals.
New Zealand Adult Nutrition Survey 2008/09 (ANS)
A nutrition survey carried out by the Ministry of Health to collect the information on food consumption, nutrient intake and biochemical nutrient levels in New Zealand adults aged 15+ years.
New Zealand National Children's Nutrition Survey 2002 (CNS)
A nutrition survey carried out by the Ministry of Health to collect food and nutrient information for 3275 school children aged 5–14 years.
Nutrient Reference Values (NRVs)
A set of recommendations for Australia and New Zealand for intakes of energy and nutrients aimed at avoiding deficiency and excess/toxicity; Estimated Average Requirements (EAR), Recommended Dietary Intakes (RDI), Adequate Intakes (AI) and Upper Intake Levels (UL). They also include guidance on the dietary patterns needed to reduce the risk of chronic disease.
Recommended Dietary Intake (RDI)
The average daily dietary intake level that is sufficient to meet the needs of nearly all (97–98%) healthy individuals in a particular life stage and gender group, including a margin of safety.
Suggested Dietary Target (SDT)
A daily average intake for certain nutrients that may help in the prevention of chronic disease (applies only to adults and young people aged 14 years and over).
3,5,3' tri-iodothyronine (T3)
One of the thyroid hormones produced by the thyroid gland.
Thyroxine (T4) One of the thyroid hormones produced by the thyroid gland.
Thyroglobulin (Tg) A protein in the thyroid gland that can be used as a marker for thyroid disease and thyroid cancer.
114
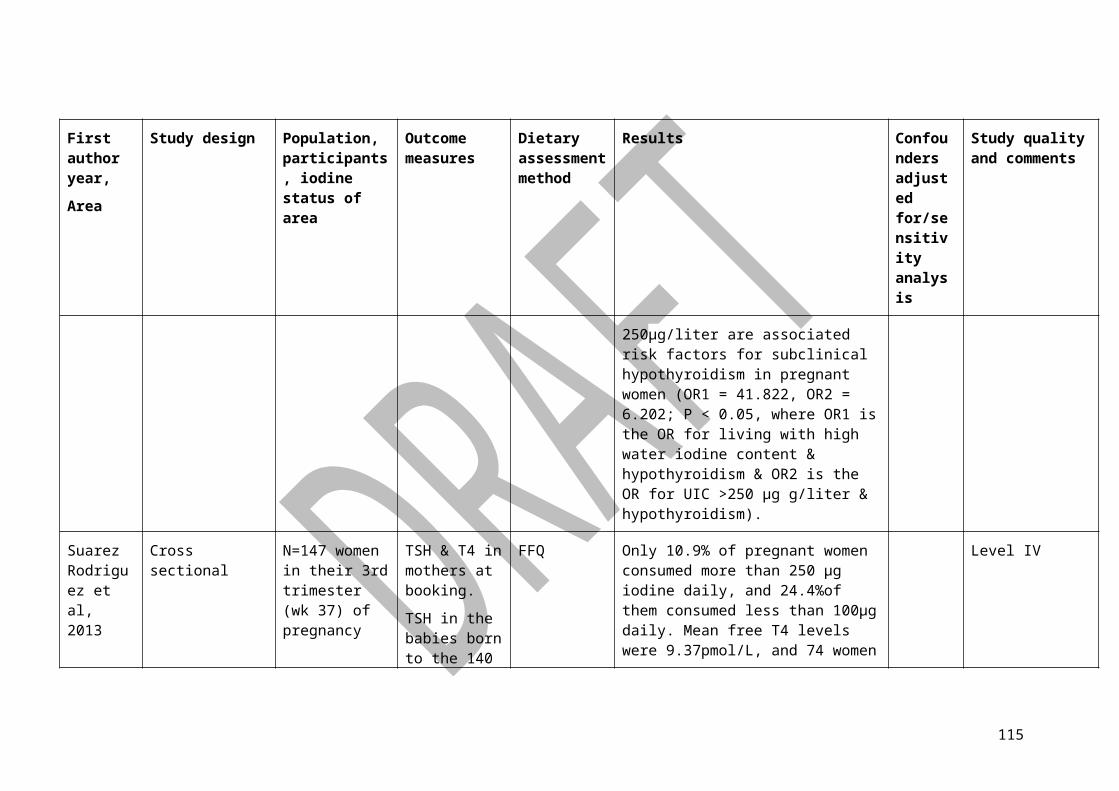
Term Description
Thyroid stimulating hormone (TSH)
A hormone, synthesized and secreted by the anterior pituitary gland under the control of TSH, that stimulates activity of the thyroid gland.
Upper Levels of Intake (UL)
The highest average daily nutrient intake level that is likely to pose no risk of adverse health effects to almost all individuals in the general population. As intake increases above the UL, the potential risk of adverse effects may increase.
115
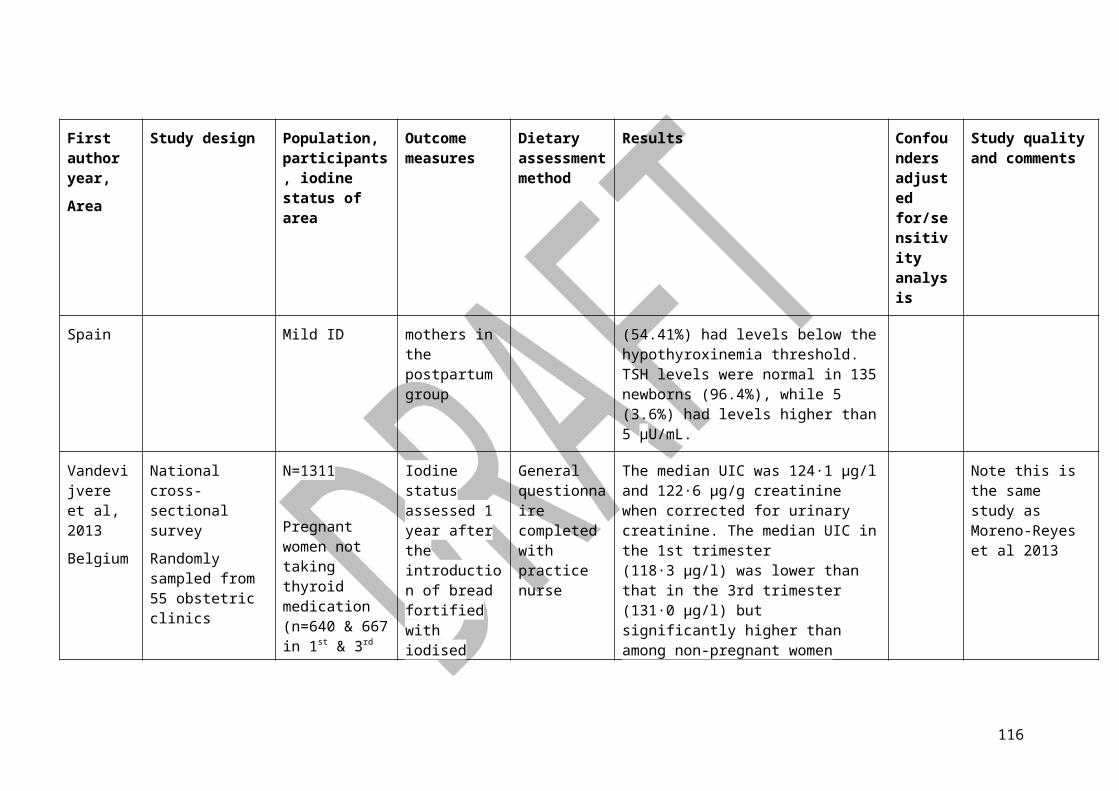
9 References Aghini Lombardi F, et al. The effect of voluntary iodine prophylaxis in a small rural
community: the Pescopagano survey 15 years later. J Clin Endocrinol Metab 2013 98:1031-9.
Aguayo A, et al. Urinary iodine and thyroid function in a population of healthy pregnant women in the North of Spain. J Trace Elem Med Biol 2013; 27:302-6.
Andersen S, et al. Variations in iodine excretion in healthy individuals. In: Preedy VR, Burrow GN, Watson RR eds. Comprehensive Handbook of Iodine: Nutritional, Biochemical, Pathological and Therapeutic Aspects. Burlington MA: Academic Press, 2009.
Amouzegar A, et al. An assessment of the iodine status and the correlation between iodine nutrition and thyroid function during pregnancy in an iodine sufficient area. Eur J Clin Nutr 2014; 68: 397-400.
Antonangeli L, et al. Comparison of two different doses of iodide in the prevention of gestational goiter in marginal iodine deficiency: a longitudinal study. Eur J Endocrinol 2002;147:29-34.
Australian Bureau of Statistics. Australian Health Survey: Biomedical Results for Nutrients 2011-12. 2013: Available at: www.abs.gov.au/ausstats/[email protected]/Lookup/4364.0.55.006 Chapter1202011-12.
Ayturk S, et al. Metabolic syndrome and its components are associated with increased thyroid volume and nodule prevalence in a mild-to-moderate iodine-deficient area. Eur J Endocrinol 2009;161:599-605.
Bath SC, et al. Effect of inadequate iodine status in UK pregnant women on cognitive outcomes in their children: results from the Avon Longitudinal Study of Parents and Children (ALSPAC). Lancet 2013;382:331-7.
Blumenthal N, et al. Iodine Intake and Thyroid Function in Pregnant Women in a Private Clinical Practice in Northwestern Sydney before Mandatory Fortification of Bread with Iodised Salt. J Thyroid Res 2012;2012:798963. DOI: 10.1155/2012/798963.
Bougma K, et al. Iodine and mental development of children 5 years old and under: a systematic review and meta-analysis. Nutrients 2013; 5:1384-416.
Brough L, et al. Iodine intake and status during pregnancy and lactation before and after government initiatives to improve iodine status, in Palmerston North, New Zealand: a pilot study. Maternal Child Nutrition 2013 DOI: 10.1111/mcn.12055.
Brucker-Davis F, et al. Iodine supplementation throughout pregnancy does not prevent the drop in ft4 in the second and third trimesters in women with normal initial thyroid function. Eur Thyroid J 2013; 2: 187-194.
Bulow Pedersen I, et al. A cautious iodization program bringing iodine intake to a low recommended level is associated with an increase in the prevalence of thyroid autoantibodies in the population. Clin Endocrinol (Oxf), 2011. DOI: 10.1111/j.1365-2265.2011.04008.x.
Camargo RY, et al. Thyroid and the environment: exposure to excessive nutritional iodine increases the prevalence of thyroid disorders in Sao Paulo, Brazil. Eur J Endocrinol 2008;159:293-9.
Charlton KE & Eastman CJ. Reinforcing the iodine message for pregnant women in Australia. Med J Aust 2013; 199:660.
116

Charoo BA, et al. Universal salt iodization is successful in kashmiri population as iodine deficiency no longer exists in pregnant mothers and their neonates: Data from a tertiary care hospital in north india. Indian J Endocrinol Metab 2013; 17: 310-317.
Chen W, et al. Investigation of thyroid function abnormalities in children in high water iodine areas of Hebei province. Zhonghua Yu Fang Yi Xue Za Zhi 2012; 46:148-51.
Combet E, et al. Low-level seaweed supplementation improves iodine status in iodine-insufficient women. Br J Nutr 2014; 112: 753-761.
De Groot et al. Management of thyroid dysfunction during pregnancy and postpartum; an Endocrine Society Clinical Practice Guideline. J Clin Endo and Metabolism 2012;97:2543-2565.
Delange F. Requirements of iodine in humans. In: Delange F, Dunn JT, Glinoer D, eds. Iodine deficiency in Europe: A continuing concern. New York: Plenum Press, 1993.
Delange F, et al. Negative iodine balance in preterm infants. Ann Endocrinol 1984; 45.
DePaoli KM, Seal JA, Burgess JR & Taylor R. Improved iodine status in Tasmanian school children after fortification of bread: a recipe for national success. Med J Aust 2013; 198: 492-494.
Dworkin HJ, et al. Relationship of iodine ingestion to iodine excretion in pregnancy. J Clin Endocrinol Metab 1966; 26:1329-42.
Du Y,et al. Iodine deficiency and excess coexist in china and induce thyroid dysfunction and disease: A cross-sectional study. PLoS ONE 2014; 9: e111937.
Eastman CJ & Zimmerman M. Chapter 20: The Iodine Deficiency Disorders. Thyroid Disease Manager, 2014: www.thyroidmanager.org/chapter/the-iodine-deficiency-disorders/.
EFSA NDA Panel (EFSA Panel on Panel on Dietetic Products Nutrition and Allergies), Draft Scientific opinion on Dietary Reference Values for iodine. EFSA Journal 2014; 12: 3660
Elahi S & Hussain Z. A longitudinal study of changes in thyroid related hormones among pregnant women residing in an iodine deficient urban area. ISRN Endocrinol 2013; 2013: 6.
Elahi S, et al. Iodine deficiency in pregnant women of lahore. J Pak Med Assoc 2009; 59: 741-743.
Evans TC, et al. Radioiodine uptake studies of the human fetal thyroid. J Nuclear Med 1967; 8: 157-65.
FAO/WHO/UNU. Energy and protein requirements. World Health Technical Report Series 724. World Health Organization, Geneva, 1985.
Feng C, et al. [Epidemiological survey on iodine nutrition of 8-10 year old school children in Wuqiao county of Hebei Province]. Wei Sheng Yan Jiu 2010; 39:218-21.
Ferreira SM, et al. Iodine insufficiency in pregnant women from the state of sao paulo. Arq Bras Endocrinol Metabol 2014; 58: 282-287.
Fisher DA & Oddie TH. Thyroidal radioiodine clearance and thryoid iodine accumulation: contrast between random daily variation and population data. J Clin Endocrinol Metab 1969; 29:111-5.
117
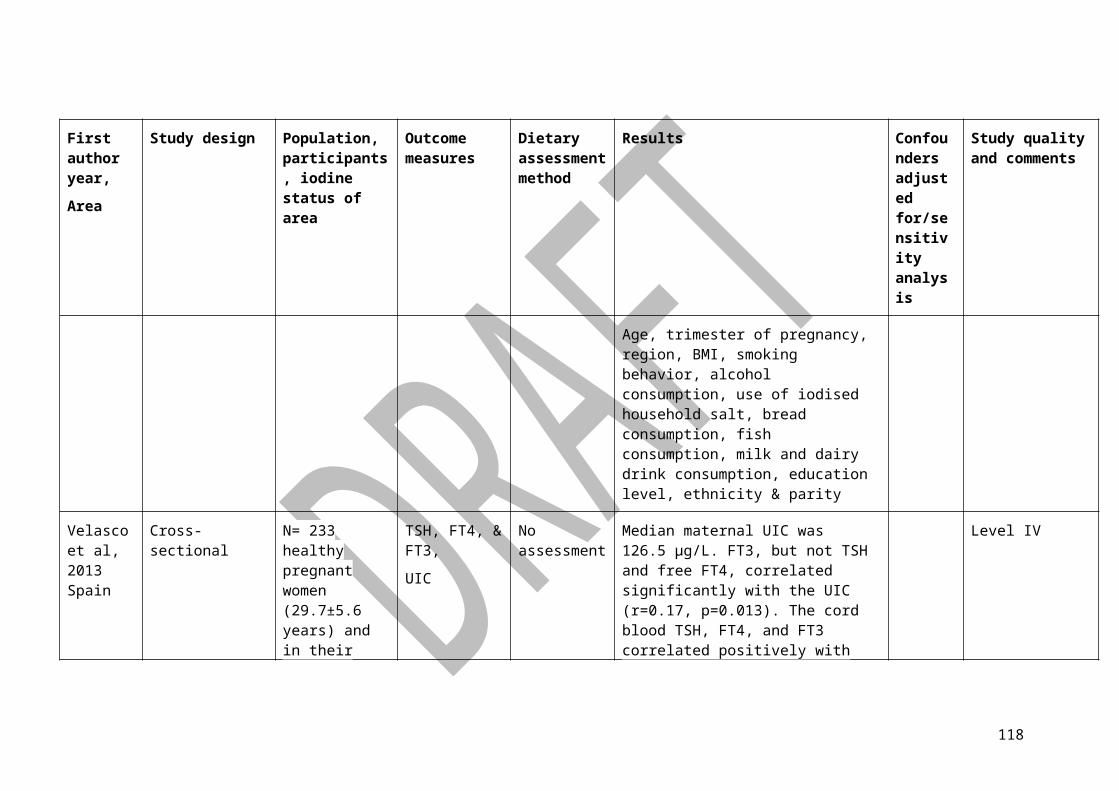
Fister P, et al. Thyroid volume changes during pregnancy and after delivery in an iodine-sufficient Republic of Slovenia. Eur J Obstet Gynecol Reprod Biol 2009;145:45-8.
Fister P, et al. Thyroid function in the third trimester of pregnancy and after delivery in an area of adequate iodine intake. Int J Gynaecol Obstet 2011. 112:52-5.
Food and Nutrition Board, Institute of Medicine. Dietary Reference Intakes for Vitamin A, Vitamin K, Boron, Chromium, Copper, Iodine, Iron, Manganese, Molybdenum, Nickel, Silicon, Vanadium, and Zinc. National Academy Press: Washington DC, 2001.
Food Standards Australia and New Zealand (FSANZ), P230 - Consideration of mandatory fortification with iodine, safety assessment and risk characterisation report . 2008 : Available from: www.foodstandards.gov.au/code/proposals/documents/P1003 SD9 –Safety Assessment.pdf
Food Standards Australia and New Zealand (FSANZ), P230 - Consideration of mandatory fortification with iodine, key issues for considerations at final assessment. 2008: Available from: www.foodstandards.gov.au/code/proposals/documents/Issues Paper - Mandatory Fortification with Iodine.doc)
Fuse Y, et al. Gestational changes of thyroid function and urinary iodine in thyroid antibody-negative japanese women. Endocr J 2013; 60: 1095-1106.
Ghassabian A, et al. Maternal urinary iodine concentration in pregnancy and children's cognition: Results from a population-based birth cohort in an iodine-sufficient area. BMJ Open 2014; 4: e005520.
Gibson RS. Principles of Nutritional Assessment. New York: Oxford University Press, 2005.
Glinoer D. Iodine supplementation during pregnancy: importance and biochemical assessment. Exp Clin Endocrinol Diabetes 1998;106, Suppl 3:S21.
Glinoer D & Delange F. The potential repercussions of maternal, fetal, and neonatal hypothyroxinemia on the progeny. Thyroid 2000; 10:871-87.
Glinoer D. Pregnancy and iodine. Thyroid 2001; 11:471-81.
Gowachirapant S, et al. Overweight increases risk of first trimester hypothyroxinaemia in iodine-deficient pregnant women. Matern Child Nutr 2014; 10: 61-71.
Gunnarsdottir I & Dahl L. Iodine intake in human nutrition: a systematic literature review. Food Nutr Res 2012;56.
Habimana L, et al. High prevalence of thyroid dysfunction among pregnant women in lubumbashi, democratic republic of congo. Thyroid 2014; 24: 568-575.
Habimana L, et al. Iodine and iron status of pregnant women in Lubumbashi, Democratic Republic of Congo. Public Health Nutr 2013; 16: 1362-1370.
Hays MT. Estimation of total body iodine content in normal young men. Thyroid 2001;11:671-5.
Henjum S, et al. Endemic goitre and excessive iodine in urine and drinking water among Saharawi refugee children. Public Health Nutr 2010; 13:1472-7.
Henrichs J, et al. Maternal hypothyroxinemia and effects on cognitive functioning in childhood: how and why? Clin Endocrinol (Oxf) 2013; 79:152-62.
Hetzel, B.S. Iodine Deficiency Disorders (IDD) and Their Eradication. Lancet 1983; 2: 1126-9.
118
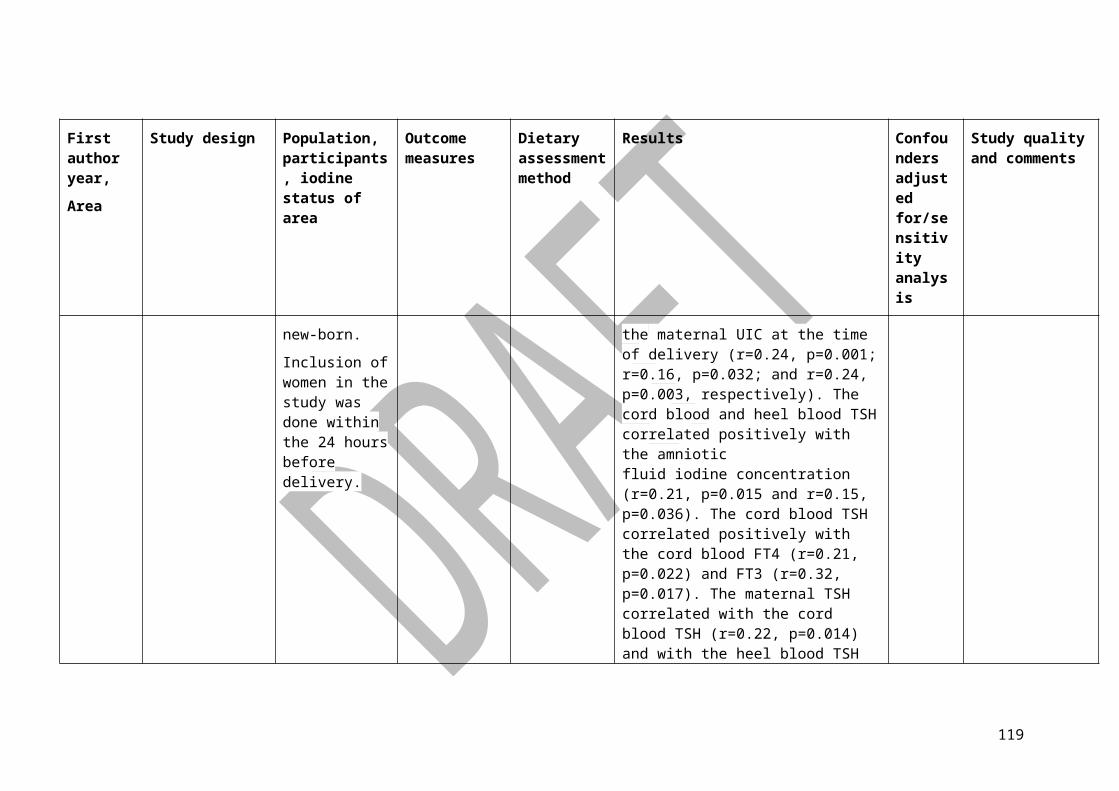
Huda SN, et al. Cognitive and motor functions of iodine-deficient but euthyroid children in Bangladesh do not benefit from iodized poppy seed oil (Lipiodol). J Nutr 2001; 131: 72-7.
Hussein IS, et al. Iodine status and fish intake of Sudanese schoolchildren living in the Red Sea and White Nile regions. Public Health Nutr 2012;15:2265-71.
Hynes KL, et al. Mild iodine deficiency during pregnancy is associated with reduced educational outcomes in the offspring: 9-year follow-up of the gestational iodine cohort. J Clin Endocrinol Metab 2013;98:1954-62.
Izzeldin HS, et al. Population living in the Red Sea State of Sudan may need urgent intervention to correct the excess dietary iodine intake. Nutr Health 2007; 18:333-41.
Jahreis G, et al. Bioavailability of iodine from normal diets rich in dairy products--results of balance studies in women. Exp Clin Endocrinol Diabetes 2001;109:163-7.
Jaiswal N, et al. High prevalence of maternal hypothyroidism despite adequate iodine status in Indian pregnant women in the first trimester. Thyroid 2014; 24: 1419-1429.
Joshi K, et al. Early gestation screening of pregnant women for iodine deficiency disorders and iron deficiency in urban centre in Vadodara, Gujarat, India. J Dev Orig Health Dis 2014; 5: 63-68.
Julvez J, et al. Thyroxine levels during pregnancy in healthy women and early child neurodevelopment. Epidemiology 2013; 24: 150-157.
Koukkou E, et al.Urine selenium changes during pregnancy do not correlate with thyroid autoantibodies in a mildly iodine deficient population. Biol Trace Elem Res 2014a; 157: 9-13.
Koukkou E, et al. No increase in renal iodine excretion during pregnancy: A telling comparison between pregnant women and their spouses. Hormones (Athens) 2014b; 13: 375-381.
Kung AW, et al. The effect of pregnancy on thyroid nodule formation. J Clin Endocrinol Metab 2002;87:1010-4.
Leung AM, et al. Iodine status and thyroid function of Boston-area vegetarians and vegans. J Clin Endocrinol Metab 2011;96:E1303-7.
Li M & Eastman CJ. Neonatal TSH screening: is it a sensitive and reliable tool for monitoring iodine status in populations? Best Pract Res Clin Endocrinol Metab 2010; 24:63-75.
Li M, et al. Are Australian children iodine deficient? Results of the Australian National Iodine Nutrition Study. Med J Aust 2006; 184:165-9.
Li WH, et al. Benefits and risks from the national strategy for improvement of iodine nutrition: a community-based epidemiologic survey in Chinese schoolchildren. Nutrition 2012; 28:1142-5.
Lv S, et al. An epidemiological survey of children's iodine nutrition and goitre status in regions with mildly excessive iodine in drinking water in Hebei Province, China. Public Health Nutr 2012;15:1168-73.
Kassim IA, et al. Iodine intake in Somalia is excessive and associated with the source of household drinking water. J Nutr 2014; 144: 375-381.
Kim BK, et al. Current iodine nutrition status and awareness of iodine deficiency in Tuguegarao, Philippines. Int J Endocrinol 2014; 2014: 7.
119

Kocak M, et al. Current prevalence of goiter determined by ultrasonography and associated risk factors in a formerly iodine-deficient area of Turkey. Endocrine 2014; 47: 290-298.
Konig, F., et al., Ten Repeat Collections for Urinary Iodine from Spot Samples or 24-Hour Samples Are Needed to Reliably Estimate Individual Iodine Status in Women. J Nutr 2011; 141:2049-54.
Krejbjerg A, et al. Iodine fortification may influence the age-related change in thyroid volume: A longitudinal population-based study (DanThyr). Eur J Endocrinol 2014; 170: 507-517.
Krutzen, E., et al., Glomerular filtration rate in pregnancy: a study in normal subjects and in patients with hypertension, preeclampsia and diabetes. Scandinavian Journal of
Clinical and Laboratory Investigation 1992;52.5;387-392.
Mattson S & Lindstrom S. Diuresis and voiding pattern in healthy schoolchildren. Br J Urol 1995;76:783-9.
Medani AM, et al. Excessive iodine intake, water chemicals and endemic goitre in a Sudanese coastal area. Public Health Nutr 2013; 16: 1586-1592.
Meisinger C, et al. Geographic variations in the frequency of thyroid disorders and thyroid peroxidase antibodies in persons without former thyroid disease within Germany. Eur J Endocrinol 2012;167:363-71.
Menéndez Torre E, et al. Iodine nutrition in pregnant women in the oviedo area. Is iodine supplementation required? Endocrinol Nutr 2014; 61: 404-409.
Meng F, et al. Assessment of iodine status in children, adults, pregnant women and lactating women in iodine-replete areas of China. PLoS ONE 2013; 8, e81294.
Ministry of Health. Iodine. Wellington, New Zealand 2010. Available from: http://www.health.govt.nz/our-work/preventative-health-wellness/nutrition/iodine
Moleti M, et al. Gestational thyroid function abnormalities in conditions of mild iodine deficiency: early screening versus continuous monitoring of maternal thyroid status. Eur J Endocrinol 2009; 160:611-7.
Moleti M, et al. Maternal thyroid function in different conditions of iodine nutrition in pregnant women exposed to mild-moderate iodine deficiency: an observational study. Clin Endocrinol (Oxf) 2011;74:762-8.
Moradi S, et al. Thyroid function in pregnant women: Iodine deficiency after iodine enrichment program. Gynecol Endocrinol 2013; 29: 596-599.
Moreno-Reyes R, et al. High prevalence of thyroid disorders in pregnant women in a mildly iodine-deficient country: a population-based study. J Clin Endocrinol Metab 2013;98:3694-701.
Morreale de Escobar G, et al. Is neuropsychological development related to maternal hypothyroidism or to maternal hypothyroxinemia? J Clin Endocrinol Metab 2000; 85:3975-87.
Ministry of Health, NZ Food NZ Children: Key results of the 2002 National Children’s Nutrition Survey. Wellington: Ministry of Health, 2003.
Ministry for Primary Industries. The Impact of Mandatory Fortification of Bread with Iodine. MPI Technical Paper No: 2013/025. 2013: Available at:
120
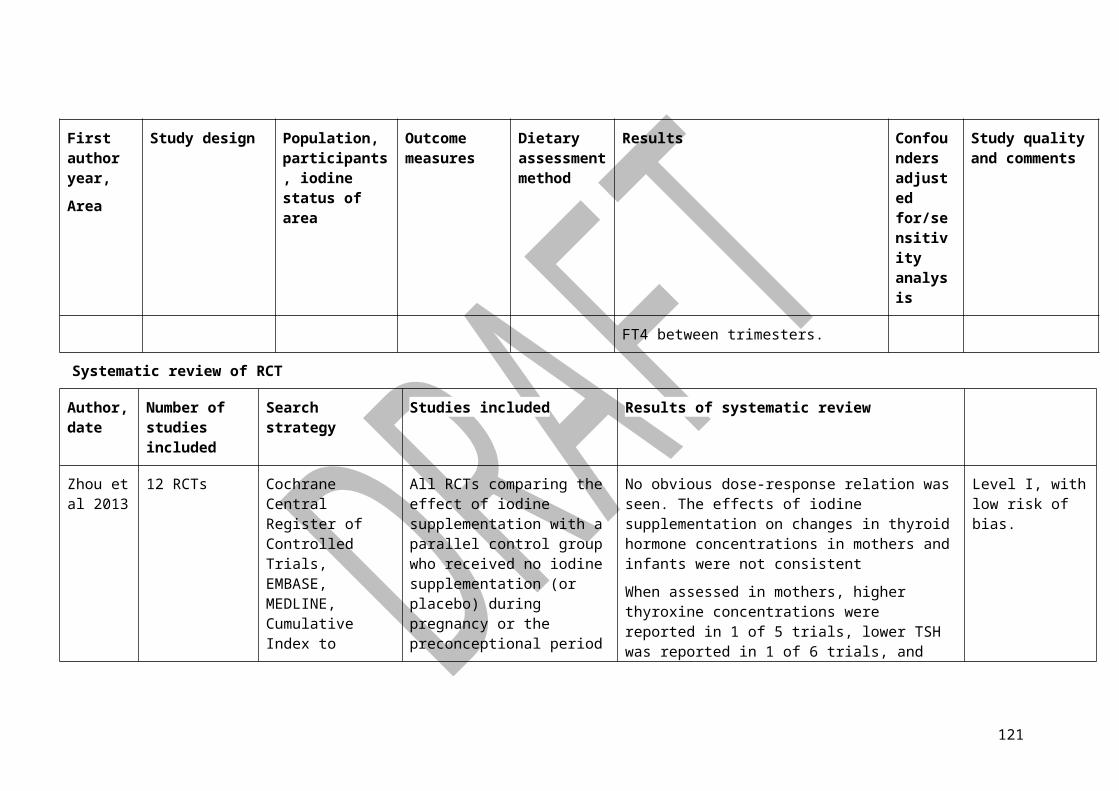
http://www.foodsafety.govt.nz/elibrary/industry/mandatory-fortification-bread-iodine.pdf.
Murcia M, et al. Iodine intake in a population of pregnant women: Inma mother and child cohort study, Spain. J Epidemiol Community Health 2010; 64: 1094-1099.
National Health and Medical Research Council (NHMRC) and the New Zealand Ministry of Health (MoH), Nutrient Reference Values for Australia and New Zealand Including Recommended Dietary Intakes. 2006: Available at: www.nhmrc.gov.au/_files_nhmrc/publications/attachments/n35.pdf.
National Research Council. Dietary Reference Intakes for Energy, Carbohydrate, Fiber, Fat, Fatty Acids, Cholesterol, Protein, and Amino Acids (Macronutrients). Washington, DC: The National Academies Press, 2005.
National Health and Medical Research Council (NHMRC). NHMRC levels of evidence and grades for recommendations for developers of guidelines. 2009: Available at: www.nhmrc.gov.au/_files_nhmrc/file/guidelinesevidence_statement_form.pdf.
Nous Group, Methodological framework for the review of Nutrient Reference Values. Department of Health and Ageing, 2013.
O'Donnell KJ, et al. Effects of iodine supplementation during pregnancy on child growth and development at school age. Dev Med Child Neurol 2002;44: 76-81.
Pedersen KM, et al. Amelioration of some pregnancy-associated variations in thyroid function by iodine supplementation. J Clin Endocrinol Metab 1993; 77:1078-83.
Pettigrew-Porter A, et al. Are pregnant women in New Zealand iodine deficient? A cross-sectional survey. Aust N Z J Obstet Gynaecol 2011;51(5):464-7.
Pop VJ, et al. Low maternal free thyroxine concentrations during early pregnancy are associated with impaired psychomotor development in infancy. Clin Endocrinol (Oxf) 1999; 50:149-55.
Prummel MF, et al. The environment and autoimmune thyroid diseases. Eur J Endocrinol 2004: 150:605-18.
Rasmussen LB, et al. Iodine intake before and after mandatory iodization in Denmark: results from the Danish Investigation of Iodine Intake and Thyroid Diseases (DanThyr) study. Br J Nutr 2008;100:166-73.
Rasmussen LB, et al. Mandatory iodine fortification of bread and salt increases iodine excretion in adults in Denmark - A 11-year follow-up study. Clin Nutr 2013. DOI: 10.1016/j.clnu.2013.10.024.
Raverot V, et al. Pregnant French women living in the Lyon area are iodine deficient and have elevated serum thyroglobulin concentrations. Thyroid 2012;22:522-8.
Rebagliato M, et al. Iodine intake and maternal thyroid function during pregnancy. Epidemiology 2010;21:62-9.
Rebagliato M, et al. Iodine Supplementation During Pregnancy and Infant Neuropsychological Development: INMA Mother and Child Cohort Study. Am J Epidemiol 2013; 177:944-57.
Rossi A, et al. Determination of thyroid volume by Sonography in healthy Brazilian schoolchildren. J Clin Ultrasound 2002; 30:226-31.
Sahin SB, et al. Alterations of thyroid volume and nodular size during and after pregnancy in a severe iodine-deficient area. Clin Endocrinol (Oxf) 2014; 81: 762-768.
121

Sang Z, et al. Exploration of the safe upper level of iodine intake in euthyroid Chinese adults: a randomized double-blind trial. Am J Clin Nutr 2012. 95:367-73.
Sang Z, et al. Thyroid dysfunction during late gestation is associated with excessive iodine intake in pregnant women. J Clin Endocrinol Metab 2012;97:E1363-9.
Santiago P, et al. Infant neurocognitive development is independent of the use of iodised salt or iodine supplements given during pregnancy. Br J Nutr 2013;110: 831-9.
Seal AJ, et al. Excess dietary iodine intake in long-term African refugees. Public Health Nutr 2006;9:35-9.
Shen H, et al. Geographical distribution of drinking-water with high iodine level and association between high iodine level in drinking-water and goitre: a Chinese national investigation. Br J Nutr 2011; 106:243-7.
Skeaff SA & Lonsdale-Cooper E. Mandatory fortification of bread with iodised salt modestly improves iodine status in schoolchildren. Br J Nutr 2013; 109:1109-13.
Suarez-Rodriguez M, et al. Hypothyroxinemia during pregnancy: the effect on neurodevelopment in the child. Int J Dev Neurosci 2012;30:435-8.
Suarez Rodriguez M, et al. Iodine intake during pregnancy: effects on thyroid function in mother and child. Endocrinol Nutr 2013;60:352-7.
Teng W, et al. Effect of iodine intake on thyroid diseases in China. N Engl J Med 2006: 354:2783-93.
Thomson CD, et al. Urinary iodine and thyroid status of New Zealand residents. Eur J Clin Nutr 2001; 55:387-92.
Thomson CD. Australian and New Zealand Nutrient Reference Values for Iodine. New Zealand: Ministry of Health, 2003.
Thomson CD. Selenium and iodine intakes and status in New Zealand and Australia. Br J Nutr 2004; 91:661-72.
Tonacchera M, et al. Iodine fortification of vegetables improves human iodine nutrition: in vivo evidence for a new model of iodine prophylaxis. J Clin Endocrinol Metab 2013;98:E694-7.
University of Otago & New Zealand Ministry of Health. A Focus on Nutrition: Key Findings of the 2008/09 New Zealand Adult Nutrition Survey. Wellington, New Zealand: New Zealand Ministry of Health, 2011.
van de Ven AC, et al. Longitudinal trends in thyroid function in relation to iodine intake: Ongoing changes of thyroid function despite adequate current iodine status. Eur J Endocrinol 2014; 170, 49-54.
van Mil NH, et al. Low urinary iodine excretion during early pregnancy is associated with alterations in executive functioning in children. J Nutr 2012;142: 2167-74.
Vandevijvere S, et al. Iodine deficiency among Belgian pregnant women not fully corrected by iodine-containing multivitamins: a national cross-sectional survey. Br J Nutr 2013;109:2276-84.
Vejbjerg P, et al. Effect of a mandatory iodization program on thyroid gland volume based on individuals' age, gender, and preceding severity of dietary iodine deficiency: a prospective, population-based study. J Clin Endocrinol Metab 2007;92:1397-401.
122
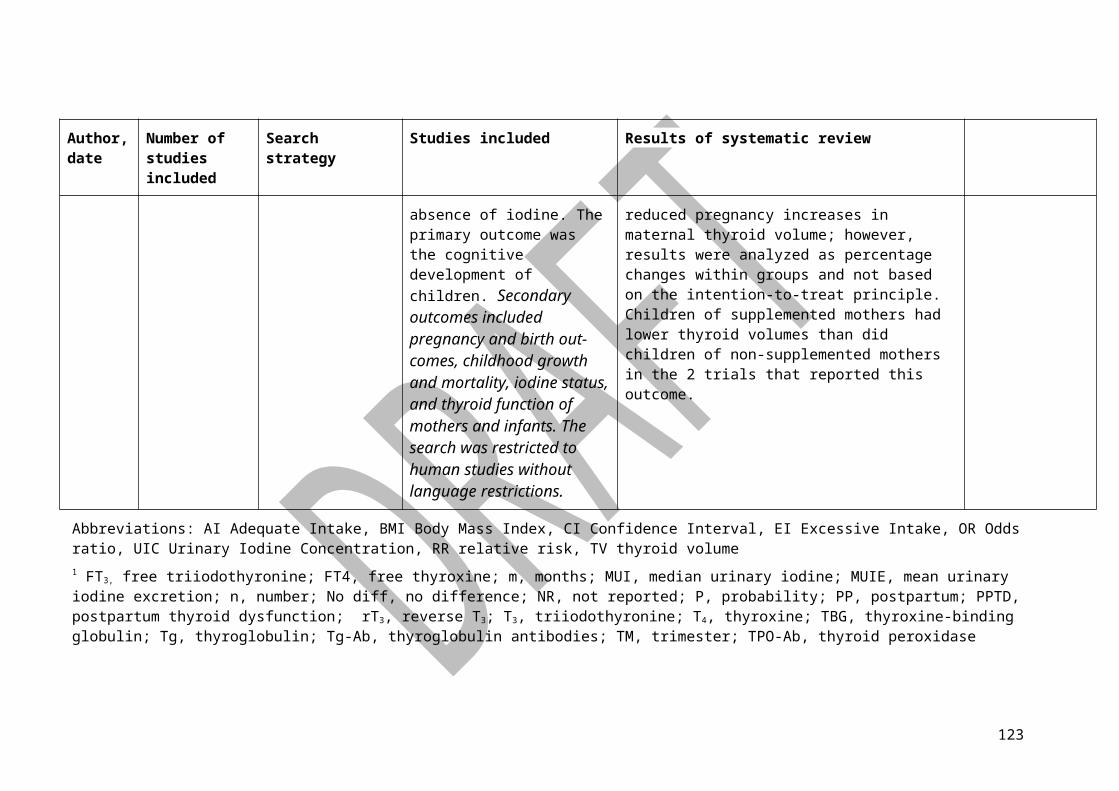
Velasco I, et al. Maternal-Fetal Thyroid Function at the Time of Birth and Its Relation with Iodine Intake. Thyroid 2013. DOI: 10.1089/thy.2013.0035
Vought RL & London WT. Iodine Intake and Excretion in Healthy Nonhospitalized Subjects. Am J Clin Nutr 1964. 15:124-32.
Vought RL & London WT. Iodine intake, excretion and thyroidal accumulation in healthy subjects. J Clin Endocrinol Metab 1967;27:913-9.
Wang Y, et al. [Changes of iodine nutrition status and thyroid function among pregnant women in iodine sufficient rural area of Gansu province]. Zhonghua Liu Xing Bing Xue Za Zhi 2014; 35: 49-52.
World Health Organisation, United Nations Children’s Fund, and International Council for the Control of Iodine Deficiency Disorders. WHO/UNICEF/ICCIDD. Assessment of Iodine Deficiency Disorders and Monitoring their Elimination. WHO: Geneva, 2007.
WHO Secretariat; Andersson M, de Benoist B, and Zupan J. Prevention and control of iodine deficiency in pregnant and lactating women and in children less than 2-years-old: conclusions and recommendations of the Technical Consultation. Public Health Nutrition 2007;20:1606-1611.
Zhou SJ, et al. Effect of iodine supplementation in pregnancy on child development and other clinical outcomes: a systematic review of randomized controlled trials. Am J Clin Nutr 2013; 98:1241-54.
Zimmermann M, et al. Thyroid ultrasound compared with World Health Organization 1960 and 1994 palpation criteria for determination of goiter prevalence in regions of mild and severe iodine deficiency. Eur J Endocrinol 2000; 143:727-31.
Zimmermann MB, et al. High thyroid volume in children with excess dietary iodine intakes. Am J Clin Nutr 2005; 81:840-4.
Zimmermann MB, et al. Iodine-deficiency disorders. Lancet 2008;372:1251-1262.
Zimmermann MB. Iodine Deficiency. Endocrine Reviews 2009;30:376-408.
Zimmermann MB, et al. Thyroglobulin is a sensitive measure of both deficient and excess iodine intakes in children and indicates no adverse effects on thyroid function in the UIC range of 100-299 mug/L: a UNICEF/ICCIDD study group report. J Clin Endocrinol Metab 2013;98:1271-80.
123