australia and new zealand nutrient reference · web viewaustralian and new zealand nutrient...
TRANSCRIPT
Australian and New Zealand Nutrient Reference Values for Sodium
A report prepared for the Australian Government Department of Health
ByExpert Working Group for Sodium
Dorothy Mackerras, Jacqui Webster, Rachael McLean, Barry Fields, Victoria Flood, and Linda Tapsell
with Research Assistance fromElizabeth Neale and Deborah Nolan-Clark
May 2015
1. Executive Summary.................................................................................3
2. Summary of Recommendations...............................................................3
3. Introduction.............................................................................................4
3.1 Sodium.......................................................................................................................5
4. Scope and Purpose..................................................................................7
5. Evidence Review (Technical report)........................................................10
5.1 Selection of biomarkers...........................................................................................10
5.1.1 Description of the biomarkers and end points selected for the review............10
5.1.2 Rationale for the selection of biomarker(s)......................................................10
5.2 Selection of evidence...............................................................................................12
5.2.1 Data used during the review.............................................................................13
5.2.2 Methodology....................................................................................................13
5.2.3 Assumptions and limitations............................................................................15
5.2.4 Rationale for decisions.....................................................................................15
5.3 Review of evidence..................................................................................................16
5.3.1 Methods used...................................................................................................16
5.3.2 Results..............................................................................................................17
6. Guideline recommendations..................................................................25
6.1 Rationale for any changes to previous values..........................................................25
6.1.1 New methodological framework......................................................................25
6.1.2 Outcomes of review.........................................................................................27
6.1.3 Comparisons with international guidelines......................................................29
6.2 Validity of recommendations...................................................................................30
7. Membership of groups and committees involved in the development process........................................................................................................ 32
8. Glossary.................................................................................................34
9. References.............................................................................................36
2

1. Executive SummaryThis report addresses the 2014 revision of the Upper Level of intake (UL) and Suggested Dietary Target (SDT) for sodium using the current Australian Methodological Framework for the Review of Nutrient Reference Values.
Sodium has an essential role in the maintenance of key physiological activities such as extracellular fluid volume and cellular membrane potential. It is readily available in the food supply. At the population level, the relationship between high sodium intakes and increased systolic blood pressure makes high sodium intake a significant public health issue. The most recent 2013 Australian Dietary Guidelines (ADG) include a recommendation to limit intakes of foods and drinks containing added salt (sodium chloride). The New Zealand Food and Nutrition Guideline Statements for Healthy Adults recommend preparing and choosing foods low in salt [1]. The ADG, New Zealand Food and Nutrition Guideline Statements and this revision of the NRV referred to generally healthy adults in Australia and New Zealand.
The revision of the UL focused on the negative health effect of increased blood pressure and applied a risk analysis approach. Biomarkers of sodium intake and health outcomes were identified and a systematic literature review (SLR) was conducted to address the evidence of risk. The evidence base was quality appraised and data derived from these studies were statistically analysed. A dose response relationship was confirmed, but a point at which the impact of increases in sodium intake increased the size of the effect on systolic blood pressure could not be determined in the range of the data examined. Thus, under the current criteria it was not possible to define a UL.
As the SDT is more concerned with guidance for shifting population intakes, the revision of the SDT included further considerations beyond the SLR conducted for the UL. The SDT was set at the desirable median intake (of 2000mg) for the population, and after examining the dietary modelling supporting the ADG. Positions taken by other authoritative bodies such as the WHO and IOM, were also considered.
2. Summary of Recommendations No Upper Level of intake for sodium has been set.
The evidence on sodium intake and increasing blood pressure in the population appears consistent but it was not possible to define the highest average daily sodium intake where no adverse effects on blood pressure could be observed within the range across which the analysis was done.
The recommendation is a change from the 2006 UL, reflecting the new guidance on the determinants of the UL. Within this framework, there is insufficient evidence to support the
3

determination of a single UL value with confidence. This does not mean consumption is safe at any level, but rather a point estimate for the UL cannot be determined.
Suggested Dietary Target (SDT) for sodium has been determined as 2000 mg.
The SDT is defined in consideration of the contribution of a nutrient intake to chronic disease risk. There is a convincing relationship between increasing sodium intake and increasing blood pressure in the population within the range across which the analysis was done.
The value is a change from the 2006 SDT. The guidance on the determination of the SDT has changed to now reflect the desirable median intake of the population.
The value for the SDT recognises that sodium intake is one dietary factor that contributes to the prevention of chronic disease, and that the effect of high sodium intakes is also seen in the context of a whole diet.
3. IntroductionThe review of Nutrient Reference Values was funded by the Australian government Department of Health and the New Zealand Ministry of Health. A Steering Group is overseeing the review process and is responsible for all strategic, funding and technical decisions of the review. It consists of representatives from both funding agencies, Health and the NZ MoH. The Steering Group is also responsible for the ongoing monitoring of triggers for a new review, and ensuring nutrient reviews are conducted in a timely manner. Reviews are being conducted on a rolling basis to ensure NRVs remain relevant and appropriate. The process complies with the 2011 NHMRC Procedures and requirements for meeting the 2011 NHMRC standard for clinical practice guidelines. The Steering Group has appointed an Advisory Committee as an expert reference and advisory group which also acts as an independent moderator of nutrient recommendations. The Advisory Committee comprises members with a broad range of expertise, including experts in the areas of micronutrients, toxicology, public health, end user needs, research, chronic disease, nutrition and macronutrients.
Nutrient Reference Values (NRVs) are a set of recommended nutrient intakes designed to assist nutrition and health professionals assess the dietary requirements of individuals and groups. Public health nutritionists, food legislators and the food industry also use the NRVs for dietary modelling and/or food labelling and food formulation. The current NRVs for Australia and New Zealand were published in 2006 after a comprehensive review process of the Recommended Dietary Intakes (the only type of nutrient reference value that had been produced at the time), commissioned by the then Department of Health (Health) in conjunction with the New Zealand Ministry of Health (NZ MoH). The review resulted in a new set of recommendations known as the Nutrient Reference Values for Australia and New
4
Zealand (2006). The National Health and Medical Research Council (NHMRC) carried out the 2006 review and recommended that all guidelines be reviewed every five years to ensure values remain relevant, appropriate and useful.
In 2011, Health in consultation with the NZ MoH, commissioned a scoping study to determine the need and scope for a review of NRVs. The scoping study considered developments in comparable countries, expert opinions, stakeholder consultation and public submissions. The scoping study concluded there was sufficient justification for conducting a review and as a result, Health and the NZ MoH engaged Nous Group and a technical team led by Baker IDI, to develop a Methodological Framework to guide future NRV reviews.
The scoping study also identified the rationale and triggers for reviewing specific nutrients including changes or developments to NRVs in comparable OECD countries, emergence of new evidence, impact on public health priorities and/or concerns regarding the strength of the underlying methodology or evidence. Sodium was identified as a priority nutrient for review and this has been funded by Health and NZ MoH. The Steering Group (with the advice of the Advisory Committee), established a group of experts to conduct this sodium review. The expert working group was primarily responsible for examining scientific evidence and establishing nutrient values. Membership of the groups involved in the development of the NRV guidelines can be found in Section 7.
3.1 Sodium
Sodium is a nutrient that is ubiquitous in the food supply and plays an essential role in human physiology. Excess sodium intakes have been associated with increased chronic disease risk, and in particular high blood pressure [2]. A comprehensive overview of the physiological role of sodium in the human body is provided in the Institute of Medicine’s, Dietary Reference Values document [3]. Briefly, sodium is the primary cation in human extracellular fluid. It has an essential role in the maintenance of key physiological activities such as extracellular fluid volume and cellular membrane potential [4]. Sodium balance is maintained through a range of physiological systems and hormones such as the renin-angiotensin-aldosterone hormone system, the sympathetic nervous system, atrial natriuretic peptide, the kallikrein-kinin system and other factors that regulate renal and medullary blood flow [5]. In the absence of a situation where excessive sweating may be occurring, urinary sodium excretion in humans is approximately equivalent to intake [3]. Thus urinary sodium excretion is often used as a biomarker of intake.
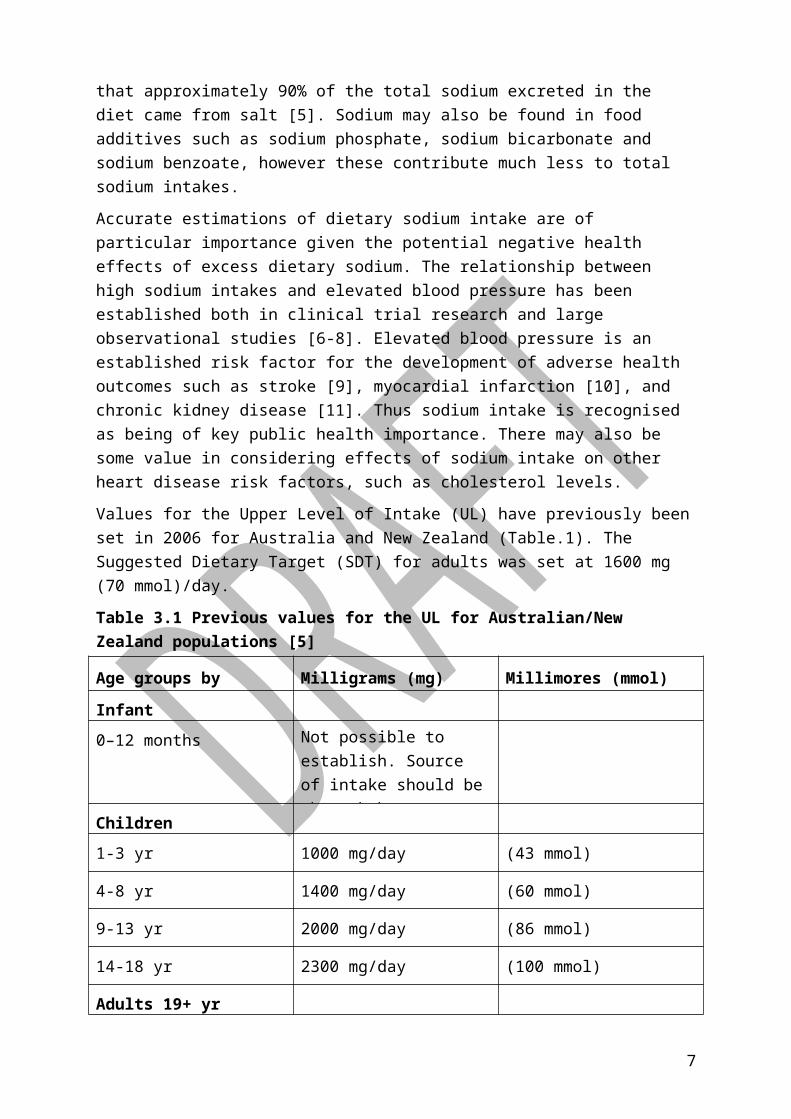
Sodium is largely consumed as sodium chloride, or ‘salt’. The 2006 NRVs accepted the position indicated in the literature that approximately 90% of the total sodium excreted in the diet came from salt [5]. Sodium may also be found in food additives such as sodium phosphate, sodium bicarbonate and sodium benzoate, however these contribute much less to total sodium intakes.
5
Accurate estimations of dietary sodium intake are of particular importance given the potential negative health effects of excess dietary sodium. The relationship between high sodium intakes and elevated blood pressure has been established both in clinical trial research and large observational studies [6-8]. Elevated blood pressure is an established risk factor for the development of adverse health outcomes such as stroke [9], myocardial infarction [10], and chronic kidney disease [11]. Thus sodium intake is recognised as being of key public health importance. There may also be some value in considering effects of sodium intake on other heart disease risk factors, such as cholesterol levels.
Values for the Upper Level of Intake (UL) have previously been set in 2006 for Australia and New Zealand (Table.1). The Suggested Dietary Target (SDT) for adults was set at 1600 mg (70 mmol)/day.
Table 3.1 Previous values for the UL for Australian/New Zealand populations [5]
Age groups by categories Milligrams (mg) Millimores (mmol)
Infant
0–12 months Not possible to establish. Source of intake should be through breast milk, formula and food only.
Children
1-3 yr 1000 mg/day (43 mmol)
4-8 yr 1400 mg/day (60 mmol)
9-13 yr 2000 mg/day (86 mmol)
14-18 yr 2300 mg/day (100 mmol)
Adults 19+ yr
Men 2300 mg/day (100 mmol)
Women 2300 mg/day (100 mmol)
Lactation
All ages 2300 mg/day (100 mmol)
6
4. Scope and PurposeThe purpose of this review is to assure the currency of NRVs for sodium with scientific methods and knowledge, particularly with relevance to population health. The area is constantly debated in the scientific literature. For example, it was noted that in the 2006 NRVs for Australia and New Zealand, the UL for sodium of 2300 mg/day (100 mmol/day) was based on experimental studies of sodium intake and blood pressure (such as the DASH trial [7]). The NRV document also refers to population studies showing low levels of hypertension and no other observed adverse effects where intakes were below this level. In 2014 there is not only a separate debate on the nature of the relationship between high blood pressure and morbidity and mortality in the population, but also new emerging evidence of associations between high sodium intakes and other endpoints such as stroke and cardiovascular disease [12].
The Expert Working Group (EWG) took the position that the association between high sodium intakes and elevated blood pressure indicated a significant public health problem for populations exposed to high sodium intakes. Given the potential for negative health effects from high sodium intakes, the most relevant NRVs for updating in this context remained the Upper Level of Intake and the Suggested Dietary Target. Further, as most of the available studies providing the evidence base were on adults, the focus of the review was on the UL and SDT for adult men and women. This approach was also adopted in the review of the Australian Dietary Guidelines. Due to time constraints, data relating to the essentiality of sodium were not examined, nor were considerations of whether an EAR or AI could be set to determine essentiality requirements. The effects of a single nutrient (sodium) on chronic disease risk was also considered in view of the fact this is only one component of a whole dietary pattern, whereas food synergies are likely to have the impact on health outcomes [13]. Nevertheless, unlike other single nutrients, the evidence linking sodium intakes to high blood pressure in populations has been recognised by authoritative bodies for some time.
This report focused on the revision of the Upper Level of Intake (UL) and Suggested Dietary Target (SDT) for sodium for adults using the methodological framework for the review of Nutrient Reference Values [14]. The EWG decided not to consider UL values for children due to time constraints for the pilot review.
The over-arching research question was ‘Is it possible to define a level of sodium intake above which there is an increased risk of adverse health outcomes in the general adult population?’
In conducting the SLR, the population, intervention, comparator and outcome (PICO) question framework was applied and stated:
7

‘What is the effect of lower versus higher intakes of sodium on blood pressure, total
cholesterol, HDL cholesterol and LDL cholesterol, myocardial infarction, total mortality and
stroke within the adult population?’
A risk analysis approach was applied to the development of the NRVs. The EWG noted the approach to risk assessment for nutrient toxicity utilised by authoritative bodies [15, 16], and that the terms used by the IOM were different from that of the WHO Food Risk Analysis Model[16]. The values derived for the NRVs were compared against existing intakes and recommendations, and interpretations were developed with reference to existing NRVs. The steps in the process reported here included:
Hazard identification: conducted through the identification of biomarkers of intake and effects, and by systematic identification of relevant scientific literature addressing evidence of risks.
Hazard characterisation: undertaken by quality appraisal of the literature and statistical analysis of data derived from the studies considered. This was done to evaluate adverse effects and assess dose response relationships. The UL was considered from this analysis.
Intake assessment: undertaken via a consideration of the AI for the referent population, and intakes levels commensurate with Dietary Modelling for the Foundation Diets which served as a Support Document for the Australian Dietary Guidelines.
Risk characterisation: undertaken with consideration of the generally well adult population that included adults with hypertension.
8

Figure 4.1 Risk assessment model for nutrient toxicity (adapted from IOM [15] and FAO/WHO [16])
Once a position on the UL for sodium was established by data analysis, comparisons were made with existing NRVs for sodium, and approaches to the derivation of the UL taken elsewhere.
In conducting the review of the UL, the EWG noted the following definition:
The UL is the highest average daily nutrient intake level likely to pose no adverse health
effects to almost all individuals in the general population. As intake increases above the UL,
the potential risk of adverse effects increases.
Using the NRV definitions the research question relating to the UL was
9

‘Is it possible to define the highest average daily sodium intake likely to pose no adverse effects to almost all individuals in the general adult population?’
In conducting the review of the SDT, the EWG noted the following definition:
The SDT is a daily average intake from food and beverages for certain nutrients that will help
in the prevention of chronic disease.
Using the NRV definitions the research question relating to the SDT was
‘What is the daily average sodium intake from food and beverages that will help in the
prevention of chronic disease?’
The SDT is a recommendation to provide advice for a directional change in the current population dietary intake. Consequently, several things are taken into consideration. Unlike the UL, the selection of a value as the SDT is not solely based on the data from the literature cited in the Systematic Literature Review, and additional considerations such as current population intakes had to be identified and weighed to make the decision.
5. Evidence Review (Technical report)The evidence review outlines the rationale for the approach taken to assessing the sodium-health relationship for the purposes of the NRVs. It covers the selection of biomarkers for dietary intake of sodium, disease end points, biomarkers of disease end points, and the approach taken to evidence review.
5.1 Selection of biomarkers
5.1.1 5.1.1 Description of the biomarkers and end points selected for the review
Dietary sodium: Urinary sodium excretion was considered to be the most robust dietary biomarker of sodium intake.
Blood pressure: Systolic, diastolic and mean arterial blood pressure. Total, low density lipoprotein LDL) and high density lipoprotein (HDL) cholesterol were used as biomarkers of disease risk, as adverse effects of sodium restriction on these lipids have been alleged.
Cardiovascular disease risk: a range of cardiovascular disease end points including total mortality, stroke and myocardial infarction.
5.1.2 5.1.2 Rationale for the selection of biomarker(s)
Dietary sodium: In order to examine the nature of the association between sodium intakes and health risk, accurate estimates of sodium intake are required. Given the known problems of dietary assessment methods, biomarkers of sodium intake were considered with reference to sodium physiology. Under normal circumstances the vast majority of
10

sodium excretion occurs via the urine (around 90%), and some sodium is also lost through the skin in sweat, and in faeces [17].
Limitations to the accuracy of dietary assessment data include lack of quantification of discretionary salt use, accuracy of information about brands of food items reported as consumed, accuracy of food composition databases, and day-to-day variability of sodium intake. Dietary assessment of sodium intakes may therefore underestimate total intake by around 10-20% [18, 19], although a recent validation study suggests that the USDA’s Automated Multiple-Pass Method of collecting dietary data using 24 hour recalls reports accurate sodium intake estimates. [20] Food frequency questionnaires (FFQ) are also used, and can overcome issues relating to day-to-day variability by assessing intake over longer periods, however it is difficult to accurately quantify intake using a FFQ, and this method will also depend greatly on the list of food items in the FFQ, and infrequently include information about brands [21].
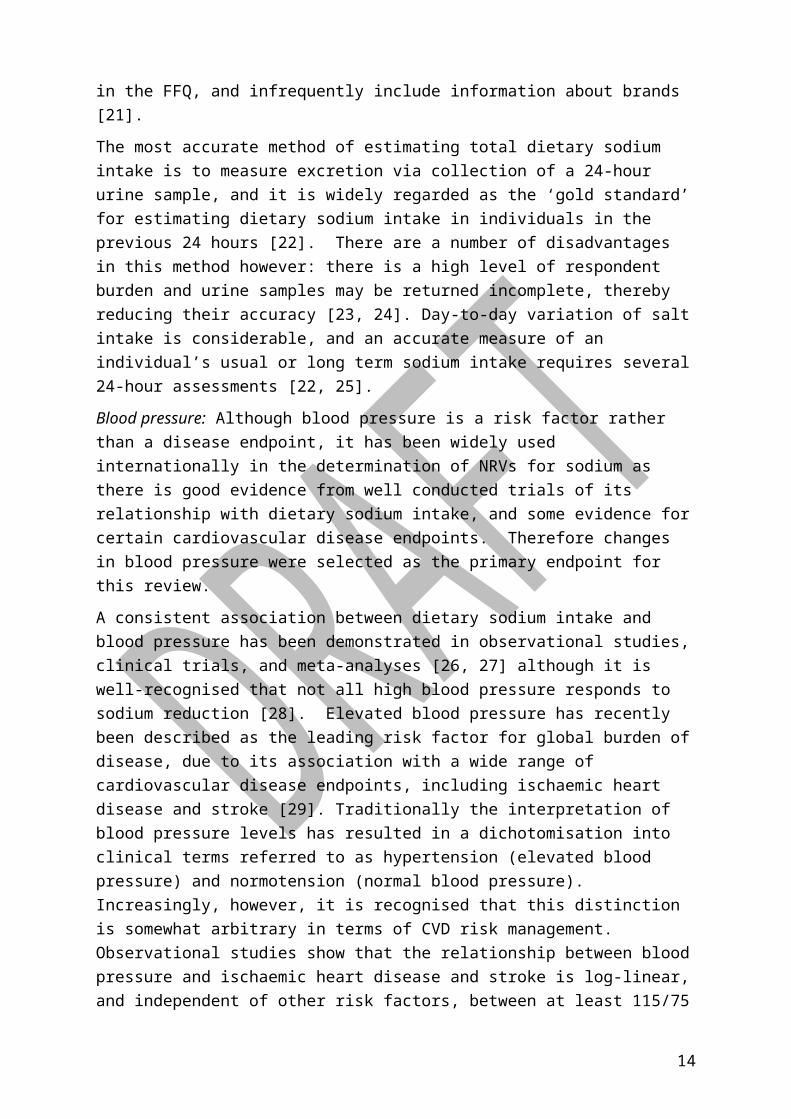
The most accurate method of estimating total dietary sodium intake is to measure excretion via collection of a 24-hour urine sample, and it is widely regarded as the ‘gold standard’ for estimating dietary sodium intake in individuals in the previous 24 hours [22]. There are a number of disadvantages in this method however: there is a high level of respondent burden and urine samples may be returned incomplete, thereby reducing their accuracy [23, 24]. Day-to-day variation of salt intake is considerable, and an accurate measure of an individual’s usual or long term sodium intake requires several 24-hour assessments [22, 25].
Blood pressure: Although blood pressure is a risk factor rather than a disease endpoint, it has been widely used internationally in the determination of NRVs for sodium as there is good evidence from well conducted trials of its relationship with dietary sodium intake, and some evidence for certain cardiovascular disease endpoints. Therefore changes in blood pressure were selected as the primary endpoint for this review.
A consistent association between dietary sodium intake and blood pressure has been demonstrated in observational studies, clinical trials, and meta-analyses [26, 27] although it is well-recognised that not all high blood pressure responds to sodium reduction [28]. Elevated blood pressure has recently been described as the leading risk factor for global burden of disease, due to its association with a wide range of cardiovascular disease endpoints, including ischaemic heart disease and stroke [29]. Traditionally the interpretation of blood pressure levels has resulted in a dichotomisation into clinical terms referred to as hypertension (elevated blood pressure) and normotension (normal blood pressure). Increasingly, however, it is recognised that this distinction is somewhat arbitrary in terms of CVD risk management. Observational studies show that the relationship between blood pressure and ischaemic heart disease and stroke is log-linear, and independent of other risk factors, between at least 115/75 mmHg and 185/115 mmHg [30, 31]. Cut points for the definition of ‘hypertension’ have varied over time, between countries, and are population
11

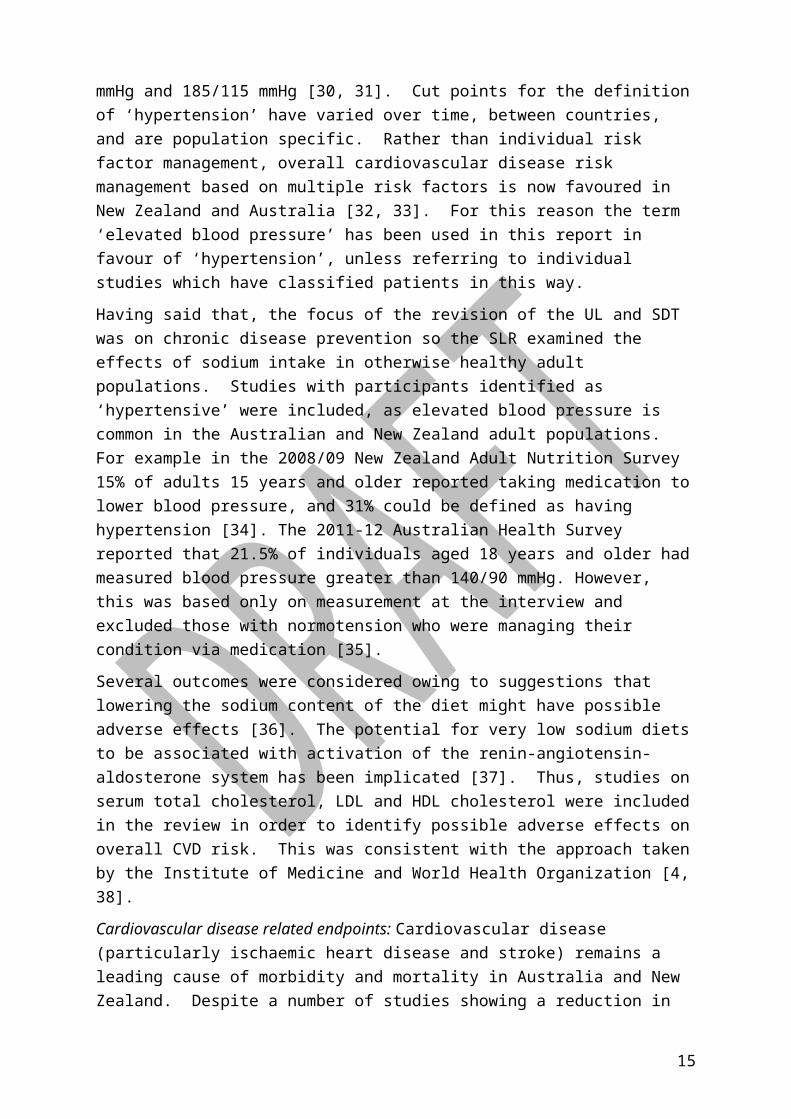
specific. Rather than individual risk factor management, overall cardiovascular disease risk management based on multiple risk factors is now favoured in New Zealand and Australia [32, 33]. For this reason the term ‘elevated blood pressure’ has been used in this report in favour of ‘hypertension’, unless referring to individual studies which have classified patients in this way.
Having said that, the focus of the revision of the UL and SDT was on chronic disease prevention so the SLR examined the effects of sodium intake in otherwise healthy adult populations. Studies with participants identified as ‘hypertensive’ were included, as elevated blood pressure is common in the Australian and New Zealand adult populations. For example in the 2008/09 New Zealand Adult Nutrition Survey 15% of adults 15 years and older reported taking medication to lower blood pressure, and 31% could be defined as having hypertension [34]. The 2011-12 Australian Health Survey reported that 21.5% of individuals aged 18 years and older had measured blood pressure greater than 140/90 mmHg. However, this was based only on measurement at the interview and excluded those with normotension who were managing their condition via medication [35].
Several outcomes were considered owing to suggestions that lowering the sodium content of the diet might have possible adverse effects [36]. The potential for very low sodium diets to be associated with activation of the renin-angiotensin-aldosterone system has been implicated [37]. Thus, studies on serum total cholesterol, LDL and HDL cholesterol were included in the review in order to identify possible adverse effects on overall CVD risk. This was consistent with the approach taken by the Institute of Medicine and World Health Organization [4, 38].
Cardiovascular disease related endpoints: Cardiovascular disease (particularly ischaemic heart disease and stroke) remains a leading cause of morbidity and mortality in Australia and New Zealand. Despite a number of studies showing a reduction in CVD associated with lower sodium intakes [39, 40] some recent observational studies have raised the possibility of an association between low sodium diets and increased risk of CVD (for example [41]). Therefore IHD, stroke and total mortality were included in the review to check for potential adverse effects on these outcomes of lowering sodium.
5.2 Selection of evidence
Evidence from the scientific literature was sought in two phases. First, systematic literature reviews (SLRs) recently produced by authoritative bodies and informing revisions of sodium NRVs were considered and individual studies referenced in these reviews were noted. Second an independent search was conducted to identify newly published studies or reviews that were not included in the previous reviews. The full body of evidence (all identified studies) then underwent critical appraisal using the GRADE system [42], and data from the studies were analysed for the current purposes.
12

5.1.3 5.2.1 Data used during the review
The evidence for this review was first examined through recently published SLRs reporting effects of reduced sodium intake on blood pressure, total cholesterol, HDL cholesterol, LDL cholesterol, myocardial infarction, total mortality or stroke. Six recently published SLRs [4, 43-47] were identified. Two of the SLRs [43, 44] also included data on the relationship between sodium intake and effects on factors that were outside the scope of the review, such as renin, aldosterone, renal function and triglycerides. In addition to the SLRs, references from the previous Institute of Medicine (IoM) Dietary Reference Values for sodium were examined [3].
The second phase of data collection was conducted through a systematic search of the literature as outlined below.
5.1.4 5.2.2 Methodology
The methodological framework provided to the Expert Working Group [14] served as a guiding document. The SLR methodology addressed the requirements of the PRISMA statement for Transparent Reporting of Systematic Reviews and Meta-analyses [48].
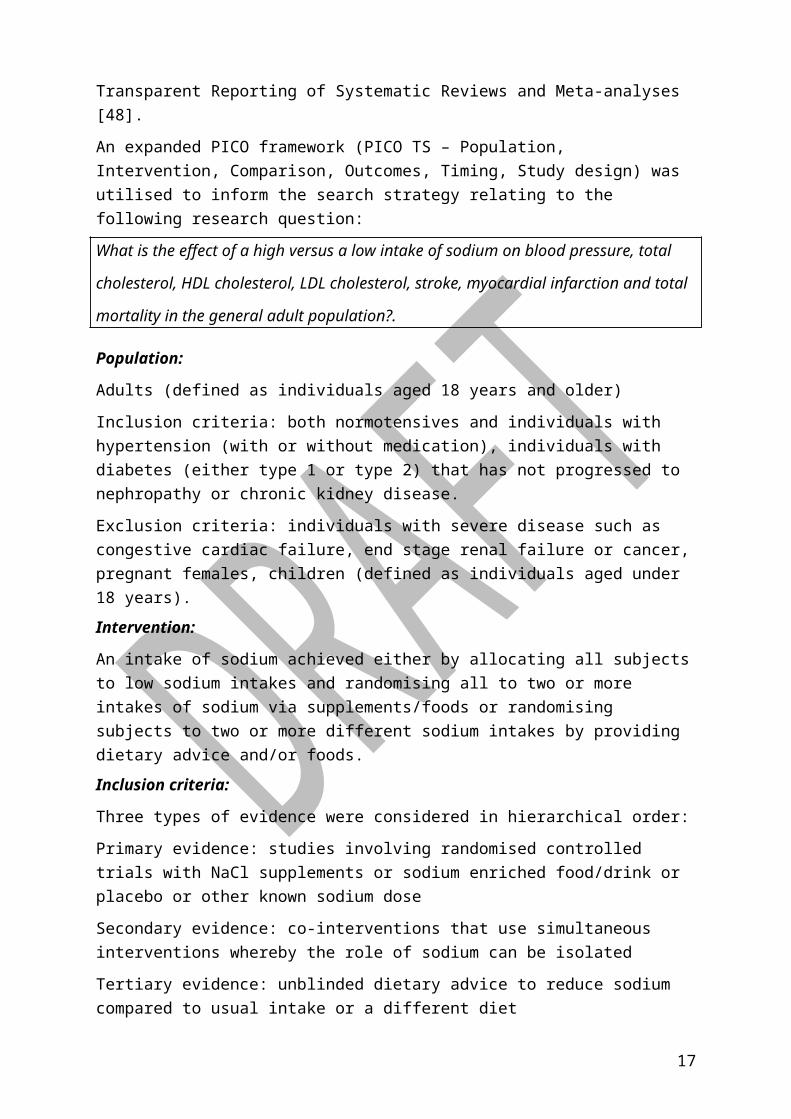
An expanded PICO framework (PICO TS – Population, Intervention, Comparison, Outcomes, Timing, Study design) was utilised to inform the search strategy relating to the following research question:
What is the effect of a high versus a low intake of sodium on blood pressure, total
cholesterol, HDL cholesterol, LDL cholesterol, stroke, myocardial infarction and total
mortality in the general adult population?.
Population:
Adults (defined as individuals aged 18 years and older)
Inclusion criteria: both normotensives and individuals with hypertension (with or without medication), individuals with diabetes (either type 1 or type 2) that has not progressed to nephropathy or chronic kidney disease.
Exclusion criteria: individuals with severe disease such as congestive cardiac failure, end stage renal failure or cancer, pregnant females, children (defined as individuals aged under 18 years).
Intervention:
An intake of sodium achieved either by allocating all subjects to low sodium intakes and randomising all to two or more intakes of sodium via supplements/foods or randomising subjects to two or more different sodium intakes by providing dietary advice and/or foods.
Inclusion criteria:
13
Three types of evidence were considered in hierarchical order:
Primary evidence: studies involving randomised controlled trials with NaCl supplements or sodium enriched food/drink or placebo or other known sodium dose
Secondary evidence: co-interventions that use simultaneous interventions whereby the role of sodium can be isolated
Tertiary evidence: unblinded dietary advice to reduce sodium compared to usual intake or a different diet
Studies including urinary sodium excretion data (minimum 8 hours)
Exclusion criteria:
Co-intervention studies where the role of sodium may not be isolated, studies without a minimum of 8 hours of urinary sodium excretion data, studies involving exercise as an intervention due to unknown effects on sodium excretion
Comparator:
A second arm was required in which subjects were given a different, well-described intake of sodium.
Outcome:
Studies must report one or more of total mortality, stroke, myocardial infarction, total, LDL or HDL cholesterol or blood pressure (must note method of measurement)
Time:
Study duration of trials measuring blood pressure, total, HDL or LDL cholesterol must be of at least 4 weeks duration. Studies evaluating myocardial infarction, stroke or total mortality must be of at least 6 months duration.
Study design:
Limited to randomised controlled trials.
As outlined above six SLRs examining reduced sodium intake and effects on blood pressure, total cholesterol, HDL cholesterol, LDL cholesterol, myocardial infarction, total mortality or stroke were identified. The studies included within these reviews were added to a database of potential literature to be evaluated against the inclusion and exclusion criteria of the current review.
To obtain articles published after the aforementioned systematic reviews (between 2011-2014), an additional systematic search was conducted. Of the six SLRs used, Graudal et al. [44] was identified as having a wider inclusion criteria than that defined by the Expert Working Group whereas the other reviews had narrower criteria. Therefore, the search terms and combinations were selected to align with the Graudal et al search strategy taking
14
into account the outcomes of interest defined in the present review. This allowed the Graudal review to be updated. Restrictions to the current analysis were then applied.
The databases Medline, Web of Science, PubMed and the Cochrane Library were searched with the search terms and limits described in Support Document 1.
Initially, the search was conducted to cover the time period of 22 July 2011 – 3 December 2013. The search was then updated to identify any new studies published up to November 2014.
All articles identified following both phases of the literature search were scrutinised against the previously defined inclusion and exclusion criteria by experienced researchers to determine their relevance to the current review.
5.1.5 5.2.3 Assumptions and limitations
The document review strategy followed the option of updating a review, as outlined in the Methodological Framework for the Revision of the NRVs [14] . A potential limitation of this approach was the reliance on published high quality SLRs from the peer-reviewed literature or expert groups to have done a thorough search and retrieved all relevant literature. However, the reviews came from several different groups who were working independently and so the risk of oversight was minimal. In addition, this review was limited to NRVs for adults and an evidence base focusing on the relationships between dietary sodium intake and blood pressure. A number of dietary and other factors have been shown to be associated with blood pressure including potassium intake, alcohol intake and weight status [49]. Furthermore, particular population groups such as African Americans, obese adults, and those with pre-existing elevated blood pressure may be more ‘salt sensitive’, which is reflected in, for example, the 2010 USDA Dietary Guidelines for Americans which recommend a lower SDT for sodium of 1500 mg/day “among persons who are 51 and older and those of any age who are African American or have hypertension, diabetes, or chronic kidney disease” [50]. However the subsequent IOM report has rejected this view, indicating a lack of evidence. The influences of other dietary factors, or specific population groups were not considered in the current analysis, introducing a potential source of error.
5.1.6 5.2.4 Rationale for decisions
Decisions on inclusions and exclusions of studies and on the PICO (TS) framework were made via consensus by the Expert Working Group. This was done in consideration of the methodological framework for the revision of the NRVs (13). It was pertinent to consider time constraints for the project when evaluating the evidence base, so the population was restricted to adults and the study designs to RCTs. Studies involving individuals with disease states such as congestive cardiac failure or end stage renal failure were excluded as the disease pathology may influence sodium or fluid status.
15

Studies which only included dietary assessment of sodium intake without measurement of urinary sodium excretion were not considered due to their potential for inaccuracies. Spot urine, overnight urine and 12-hour urine sampling have been used as a convenient alternative to 24-hour urinary collection. While spot urine collection shows promise as a method to estimate population level intake estimates, it is likely to be inaccurate on an individual level and therefore an unreliable measure of intake in clinical trials and observational studies linking sodium intake with health outcomes in individuals [51-53] because the unreliability in measurement can obscure links to potential small changes in health effects. Therefore, when defining the inclusion criteria for the current SLR studies had to include a collection of urine lasting at least 8 hours.
Study duration was restricted to a minimum of 4 weeks when evaluating changes in biomarkers of disease risk such as blood pressure and cholesterol. This time frame reflects the minimum time required to observe changes in blood pressure following dietary modification [54]. For studies assessing myocardial infarction, stroke and mortality, a time frame of 6 months was selected based on the chronic nature of these outcomes.
5.3 Review of evidence
5.1.7 5.3.1 Methods used
A risk of bias assessment table was developed for each study identified in the review. The table was based on the categories outlined in the Cochrane Handbook for Systematic Reviews of Interventions [55]. Additional information was added to the table to ensure that all information required for the Grading of Recommendations Assessment, Development and Evaluation (GRADE) method of appraising the quality of evidence in systematic reviews [42] were captured.
The GRADE approach to appraising the quality of evidence for each outcome was adopted for the current review. GRADEProfiler software (Version 3.6) was utilised to facilitate this process, with decisions on the quality of evidence guided by the strategy outlined by Barbui et al. [39] and Guyatt et al. [56]. Due to time constraints meta-analyses were not conducted for diastolic blood pressure and mortality outcomes (see Support Document 2), therefore GRADE assessments of the quality of evidence could not be conducted for these outcomes. In addition article summary tables included an assessment of the National Health and Medical Research Council (NHMRC) level of evidence [57].
Primary outcome
Full details of the statistical analyses on systolic blood pressure are contained in Support Document 2. Briefly, data from all included articles were summarised. Where available, data were extracted separately for gender, ethnicity and hypertension status subgroups. Studies were to be further characterised based on their participants’ hypertension status, which
16
was classified according to current Australian hypertension cut-offs to ensure currency of data [32] but this information was not always available.
Studies were analysed by comparing the effect on blood pressure in the group with the higher sodium excretion to the group with the lower sodium excretion, irrespective of whether the study author had called the group ‘intervention’ or ‘control’. Because studies tested a wide range of sodium intakes, the high intake in one study might have been the low intake in another. Where studies reported more than two groups [7, 58, 59], the low and intermediate groups (corresponding to sodium intakes of approximately 50 mmol/day and 100 mmol/day respectively) were selected for analysis based on consensus with the Expert Working Group.
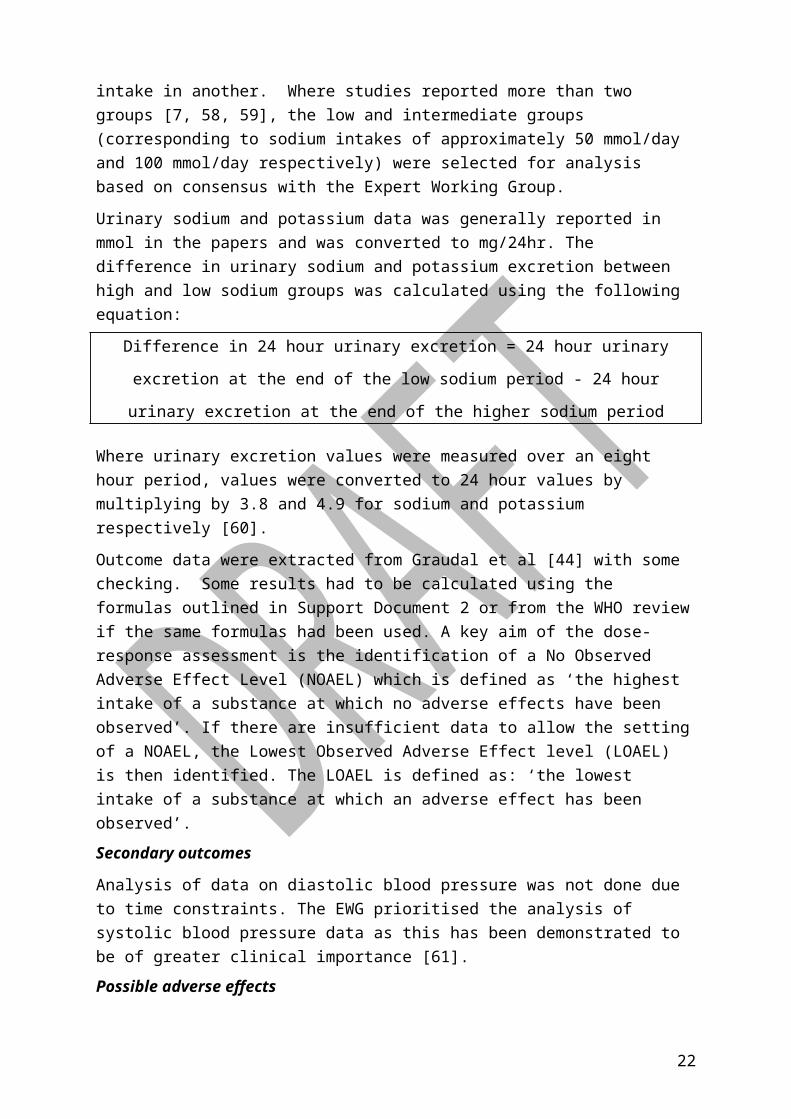
Urinary sodium and potassium data was generally reported in mmol in the papers and was converted to mg/24hr. The difference in urinary sodium and potassium excretion between high and low sodium groups was calculated using the following equation:
Difference in 24 hour urinary excretion = 24 hour urinary excretion at the end of the low
sodium period - 24 hour urinary excretion at the end of the higher sodium period
Where urinary excretion values were measured over an eight hour period, values were converted to 24 hour values by multiplying by 3.8 and 4.9 for sodium and potassium respectively [60].
Outcome data were extracted from Graudal et al [44] with some checking. Some results had to be calculated using the formulas outlined in Support Document 2 or from the WHO review if the same formulas had been used. A key aim of the dose-response assessment is the identification of a No Observed Adverse Effect Level (NOAEL) which is defined as ‘the highest intake of a substance at which no adverse effects have been observed’. If there are insufficient data to allow the setting of a NOAEL, the Lowest Observed Adverse Effect level (LOAEL) is then identified. The LOAEL is defined as: ‘the lowest intake of a substance at which an adverse effect has been observed’.
Secondary outcomes
Analysis of data on diastolic blood pressure was not done due to time constraints. The EWG prioritised the analysis of systolic blood pressure data as this has been demonstrated to be of greater clinical importance [61].
Possible adverse effects
Random-effects meta-analyses were conducted for total cholesterol, HDL cholesterol and LDL cholesterol data (Support Document 2). Results of studies reporting the relative risk of stroke, myocardial infarction and mortality were described.
5.1.8 5.3.2 Results
17
Details of the search findings and applications of exclusion criteria (including PRISMA flow diagram) are contained in Support Document 1. Briefly, 61 articles describing 57 studies were included in the SLR. One study [62] was identified as meeting the inclusion criteria during the initial 2011 - 2013 search. An addition study [35] was identified in the second search (3 December 2013 – 10 November 2014), however as its results were consistent with the larger body of evidence, inclusion of this study in the quantitative analysis would not influence the results of the review or result in downgrading of the evidence. Therefore it was not included in the meta-analysis. A PRISMA flow diagram detailing the inclusion and exclusion of studies is shown in Support Document 1.
The risk of bias assessments for all included studies are shown in the Support Document 1 as Appendix 5. The summary of findings table including GRADE assessments relevant to each outcome of interest are also shown in the Support Document 1 (Appendix 7).
The number of included studies conducted in Australia was 14 [35, 63-75], with 2 studies included that were conducted in New Zealand [76, 77]. Of the remaining studies, 28 were conducted in European countries [58, 78-103] and 14 in the USA [7, 59, 60, 62, 104-113]. No included studies were conducted in countries in the continents of Asia or Africa.
Data were available for a total of 2315 intervention participants and 2310 control participants in the parallel studies, with data available for 1574 participants (1549 for the meta-analyses). There were 26 parallel studies relating to sodium and a relevant health effect [60, 64-68, 70-72, 74, 75, 77, 78, 82-84, 90, 94, 95, 98, 101, 104, 105, 108-111] and 31 crossover studies (30 included in the meta-analyses) [7, 35, 58, 62, 63, 69, 73, 76, 80-82, 85-89, 91-93, 96, 97, 99-103, 106, 107, 109, 112, 113].
Resting systolic blood pressure
Fifty five studies [7, 58, 60, 62-66, 68-78, 80-113] contributing 66 strata were considered (see Support Document 2). Within these studies, 40 studies (46 strata) [58, 63-66, 70-73, 75-91, 93, 95, 97-99, 103-106, 108, 109, 112, 113] were conducted in participants with a degree of hypertension, 11 studies (14 strata) [60, 68, 69, 74, 81, 96, 100, 102, 107, 110, 111] were conducted in normotensive participants and 5 studies (6 strata) [7, 62, 92, 94, 101] were conducted in both normotensive and hypertensive populations (where the participants could not be separated into either hypertensive or normotensive). As previously described, an additional study conducted in normotensive participants [35], which found a non-significant reduction in systolic blood pressure, was not included in the meta-analysis but would be unlikely to influence results.
When sub-groups were considered, reductions in systolic blood pressure following a low sodium diet appeared to be different in participants with hypertension, with reported changes ranging from -17 mmHg to 6.3 mmHg, compared to studies of normotensive individuals (range: -10 mmHg to 1.7 mmHg), or those involving both normotensive and hypertensive individuals (range: -12 mmHg to 0.1 mmHg). As data on results in individuals of
18

different ethnicities were only available for two studies [87, 104], it was not considered appropriate to draw conclusions on the impact of ethnicity on blood pressure response.
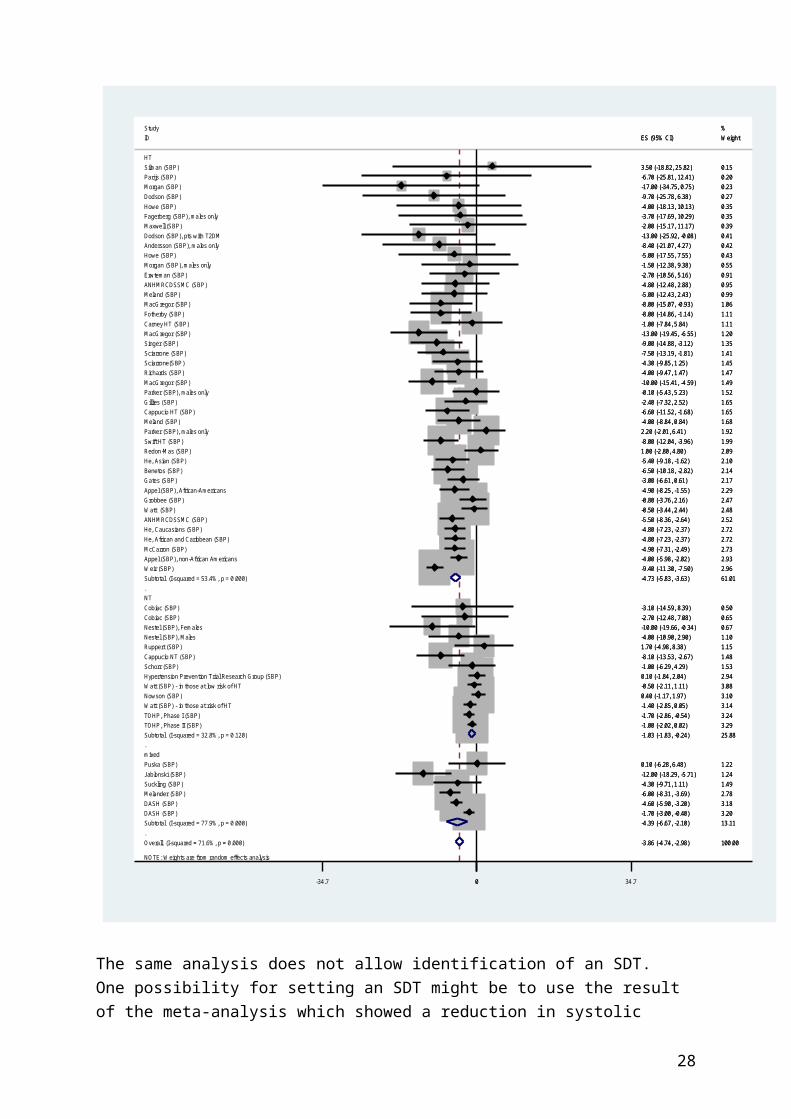
For the meta-analysis, fifty-five studies yielded 66 strata from which 5 were excluded from analysis owing to incomplete data or extreme values. Overall, there was a weighted average reduction in systolic blood pressure in the low sodium group compared to the high sodium group (-3.9mm Hg; 95%CI; -4.7 to -3.0 mm Hg). Heterogeneity among the studies was classified as medium overall (I2=72%). The impact on systolic blood pressure was different in normotensives (-1.0 mm Hg) and hypertensives (-4.7mm Hg). The studies included in the meta-analysis contained a much higher proportion of hypertensive groups than the prevalence in Australia or New Zealand and so the overall meta-analysis results cannot be extrapolated to the two countries. Using a prevalence of 30% (from a survey in Australia that defined hypertension based on either blood pressure measurement at interview or use of medication) to weight the category specific results for hypertensives and normotensives yields an estimated reduction of 2.1mm Hg in systolic bloodpressure in the adult population if mean sodium excretion decreases from about 3500 mg/day to about 2100 mg/day.
This meta-analysis confirms the accuracy of data extraction by yielding comparable overall estimates to other reviews. However, it does not allow the location of the UL to be determined because a cut-off point couldn’t be identified but also because the analysis assumes that the effect of a sodium reduction is unrelated to the actual intake. For a UL to be set, then the analysis would have to take into account the fact that the effect of a particular sodium reduction depends on the actual intake (or excretion).
The association between different measures of sodium excretion and systolic blood pressure were examined in several ways owing to the correlation between the three measures of sodium excretion (in the low group, the high group and the difference between the groups). A point at which increasing sodium excretion increased the impact on systolic blood pressure could not be identified either in all sub-groups or in hypertensives. The available data covered the range 1200-3300 mg/day sodium in the low sodium group and we conclude that the data are linear in this range. Similarly, no conclusion could be drawn when the study groups were categorised according to the excretion in the high sodium excretion group. Therefore, if there is a point at which the impact of increases in sodium intake increases the size of the effect on systolic blood pressure compared to lower intakes (i.e. a point that could approximate a UL), it does not lie in the range of the data examined. It cannot be extrapolated from the data because the systolic blood pressure response outside the range of the data may not be linear. This was noted, bearing in mind that the dose-response of a physiological parameter also may be non-linear but merely adaptive, and reversible, and therefore not adverse and not appropriate for setting a UL. Conversely, a response could be linear but end up crossing a tolerance threshold at a high enough intake of a substance, resulting in an adverse effect. Either way, the data available did not expose a
19
possible NOAEL or LOAEL from either of these perspectives that could be used to derive a UL.
20
Figure 5.2 Meta-analysis of the difference in systolic blood pressure in the group with lower 24 hour urinary Na excretion compared to the group with higher Na excretion, by hypertension status of participants at baseline, ordered by decreasing width of 95% confidence interval
21
NOTE: Weights are from random effects analysis
.
.
.
Overall (I-squared = 71.6%, p = 0.000)
Meland (SBP)
Cappucio HT (SBP)
ID
Subtotal (I-squared = 53.4%, p = 0.000)
Morgan (SBP)
Gillies (SBP)
Cobiac (SBP)
Subtotal (I-squared = 77.9%, p = 0.000)
Dodson (SBP)
Sciarrone(SBP)
Ruppert (SBP)
MacGregor (SBP)
Watt (SBP) - in those at risk of HT
Fagerberg (SBP), males only
Study
HT
TOHP, Phase II (SBP)
Grobbee (SBP)
mixed
Carney HT (SBP)
Parijs (SBP)
Suckling (SBP)Jablonski (SBP)
Parker (SBP), males only
Parker (SBP), males only
Appel (SBP), non-African Americans
Silman (SBP)
McCarron (SBP)
Nestel (SBP), Males
Cobiac (SBP)
DASH (SBP)
Gates (SBP)
Maxwell (SBP)
Melander (SBP)
He, African and Caribbean (SBP)
TOHP, Phase I (SBP)
Dodson (SBP), pts with T2DM
Nowson (SBP)
Howe (SBP)
Meland (SBP)
Fotherby (SBP)
Hypertension Prevention Trial Research Group (SBP)
Weir (SBP)
Andersson (SBP), males only
Benetos (SBP)
ANHMRCDSSMC (SBP)
Cappucio NT (SBP)
Sciarrone (SBP)
Watt (SBP) - in those at low risk of HT
ANHMRCDSSMC (SBP)
Puska (SBP)
MacGregor (SBP)
MacGregor (SBP)
Morgan (SBP), males only
Howe (SBP)
Subtotal (I-squared = 32.8%, p = 0.120)
Nestel (SBP), Females
He, Caucasians (SBP)
NT
He, Asian (SBP)
Richards (SBP)
Appel (SBP), African-Americans
Schorr (SBP)
Redon-Mas (SBP)
Erwteman (SBP)
Watt (SBP)
Swift HT (SBP)
DASH (SBP)
Singer (SBP)
-3.86 (-4.74, -2.98)
-5.00 (-12.43, 2.43)
-6.60 (-11.52, -1.68)
ES (95% CI)
-4.73 (-5.83, -3.63)
-17.00 (-34.75, 0.75)
-2.40 (-7.32, 2.52)
-2.70 (-12.48, 7.08)
-4.39 (-6.67, -2.10)
-9.70 (-25.78, 6.38)
-4.30 (-9.85, 1.25)
1.70 (-4.98, 8.38)
-10.00 (-15.41, -4.59)
-1.40 (-2.85, 0.05)
-3.70 (-17.69, 10.29)
-1.00 (-2.02, 0.02)
-0.80 (-3.76, 2.16)
-1.00 (-7.84, 5.84)
-6.70 (-25.81, 12.41)
-4.30 (-9.71, 1.11)-12.00 (-18.29, -5.71)
2.20 (-2.01, 6.41)
-0.10 (-5.43, 5.23)
-4.00 (-5.98, -2.02)
3.50 (-18.82, 25.82)
-4.90 (-7.31, -2.49)
-4.00 (-10.90, 2.90)
-3.10 (-14.59, 8.39)
-1.70 (-3.00, -0.40)
-3.00 (-6.61, 0.61)
-2.00 (-15.17, 11.17)
-6.00 (-8.31, -3.69)
-4.80 (-7.23, -2.37)
-1.70 (-2.86, -0.54)
-13.00 (-25.92, -0.08)
0.40 (-1.17, 1.97)
-5.00 (-17.55, 7.55)
-4.00 (-8.84, 0.84)
-8.00 (-14.86, -1.14)
0.10 (-1.84, 2.04)
-9.40 (-11.30, -7.50)
-8.40 (-21.07, 4.27)
-6.50 (-10.18, -2.82)
-4.80 (-12.48, 2.88)
-8.10 (-13.53, -2.67)
-7.50 (-13.19, -1.81)
-0.50 (-2.11, 1.11)
-5.50 (-8.36, -2.64)
0.10 (-6.28, 6.48)
-13.00 (-19.45, -6.55)
-8.00 (-15.07, -0.93)
-1.50 (-12.38, 9.38)
-4.00 (-18.13, 10.13)
-1.03 (-1.83, -0.24)
-10.00 (-19.66, -0.34)
-4.80 (-7.23, -2.37)
-5.40 (-9.18, -1.62)
-4.00 (-9.47, 1.47)
-4.90 (-8.25, -1.55)
-1.00 (-6.29, 4.29)
1.00 (-2.80, 4.80)
-2.70 (-10.56, 5.16)
-0.50 (-3.44, 2.44)
-8.00 (-12.04, -3.96)
-4.60 (-5.90, -3.20)
-9.00 (-14.88, -3.12)
100.00
0.99
1.65
Weight
61.01
0.23
1.65
0.65
13.11
0.27
1.45
1.15
1.49
3.14
0.35
%
3.29
2.47
1.11
0.20
1.491.24
1.92
1.52
2.93
0.15
2.73
1.10
0.50
3.20
2.17
0.39
2.78
2.72
3.24
0.41
3.10
0.43
1.68
1.11
2.94
2.96
0.42
2.14
0.95
1.48
1.41
3.08
2.52
1.22
1.20
1.06
0.55
0.35
25.88
0.67
2.72
2.10
1.47
2.29
1.53
2.09
0.91
2.48
1.99
3.18
1.35
0-34.7 0 34.7
The same analysis does not allow identification of an SDT. One possibility for setting an SDT might be to use the result of the meta-analysis which showed a reduction in systolic blood pressure when mean population excretion is lowered from about 3500 mg/day to 2100
22

mg/day. This would lead to an SDT of an intake that is equivalent to an excretion of 2100 mg/day, the mean intake of the ‘low intake’ groups in the studies.
Therefore the available data do not allow the setting of a LOAEL or a NOAEL, because an intake level at which the dose-response relationship is greater relative to the response at lower intakes has not been established.
Resting diastolic blood pressure
Fifty seven studies [7, 35, 58, 60, 62-78, 80-113] contributing 69 strata contributed to the exploration of resting diastolic blood pressure. Within these studies, 41 studies (48 strata) [58, 63-67, 70-73, 75-91, 93, 95, 97-99, 103-106, 108, 109, 112, 113] were conducted in participants with a degree of hypertension, 12 studies (15 strata) [35, 60, 68, 69, 74, 81, 96, 100, 102, 107, 110, 111] were conducted in normotensive participants and 5 studies (6 strata) [7, 62, 92, 94, 101] were conducted in a both normotensive and hypertensive populations (where the participants could not be separated into either hypertensive or normotensive).
As with systolic blood pressure, when sub-groups were considered, reductions in diastolic blood pressure following a low sodium diet appeared to be different in participants with hypertension, with changes ranging from -9 mmHg to 3.8 mmHg, compared to studies of normotensive individuals (range: -5 mmHg to 1.4 mmHg), or those involving both normotensive and hypertensive individuals (range: -3 mmHg to -0.7 mmHg).
Mean arterial pressure
A total of 7 studies (8 sub-analyses) evaluated the effect of sodium on mean arterial pressure [35, 79, 80, 96, 99, 100, 113] with changes following a low sodium diet ranging from -10 mmHg to 1 mmHg.
Serum cholesterol levels
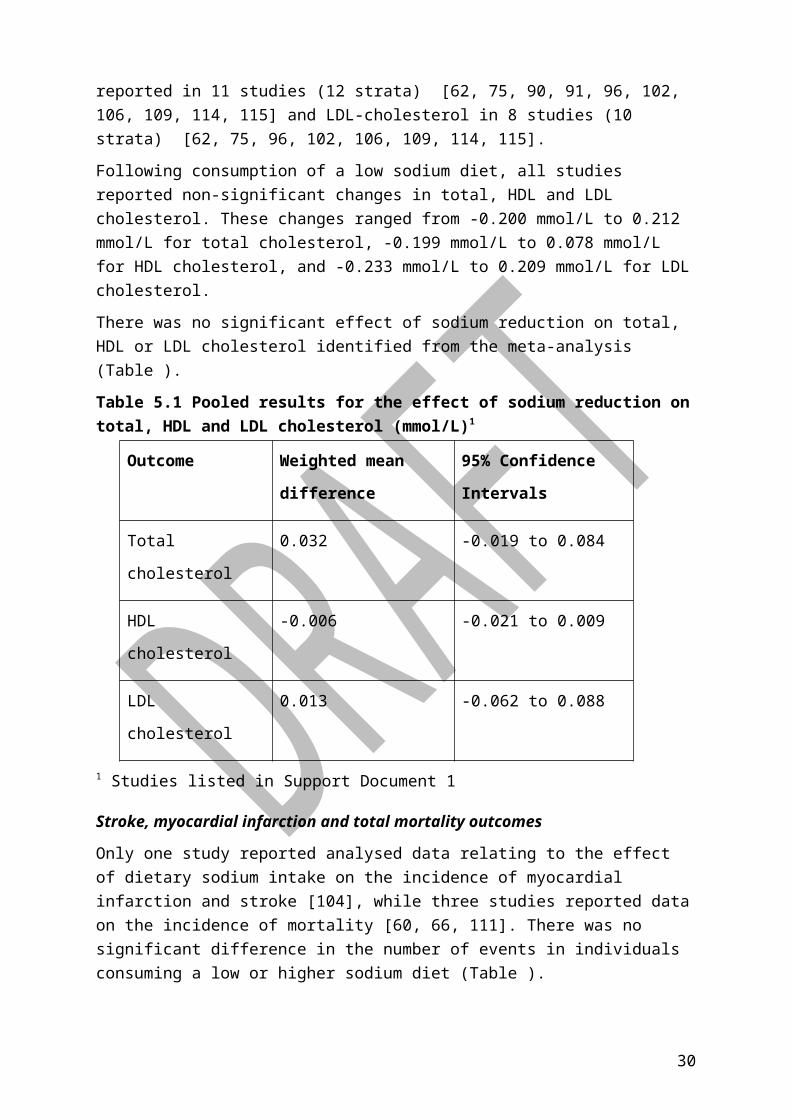
The effect of sodium on total cholesterol levels was reported in 14 studies (16 stata) [59, 62, 75, 81, 86, 90, 91, 96, 102, 106, 109, 113-115]. Outcomes for HDL-cholesterol were reported in 11 studies (12 strata) [62, 75, 90, 91, 96, 102, 106, 109, 114, 115] and LDL-cholesterol in 8 studies (10 strata) [62, 75, 96, 102, 106, 109, 114, 115].
Following consumption of a low sodium diet, all studies reported non-significant changes in total, HDL and LDL cholesterol. These changes ranged from -0.200 mmol/L to 0.212 mmol/L for total cholesterol, -0.199 mmol/L to 0.078 mmol/L for HDL cholesterol, and -0.233 mmol/L to 0.209 mmol/L for LDL cholesterol.
There was no significant effect of sodium reduction on total, HDL or LDL cholesterol identified from the meta-analysis (Table ).
23
Table 5.1 Pooled results for the effect of sodium reduction on total, HDL and LDL cholesterol (mmol/L)1
Outcome Weighted mean
difference
95% Confidence
Intervals
Total cholesterol 0.032 -0.019 to 0.084
HDL cholesterol -0.006 -0.021 to 0.009
LDL cholesterol 0.013 -0.062 to 0.088
1 Studies listed in Support Document 1
Stroke, myocardial infarction and total mortality outcomes
Only one study reported analysed data relating to the effect of dietary sodium intake on the incidence of myocardial infarction and stroke [104], while three studies reported data on the incidence of mortality [60, 66, 111]. There was no significant difference in the number of events in individuals consuming a low or higher sodium diet (Table ).
Table 5.2 Effect of sodium consumption on the incidence of long term outcomes
Outcomes Relative risk 95% confidence
intervalsStroke [104] 0.50 0.05, 5.47
Myocardial Infarction [104] 0.50 0.09, 2.70
Mortality
Morgan et al. [66]
Hypertension Prevention Trial [60]
Whelton [111]
2.91
1.04, 1.50
0.12, 68.81
0.07, 16.54
0.25, 8.96
24

6. Guideline recommendations No Upper Level of intake for sodium has been set.
The evidence on sodium intake and blood pressure in the population appears consistent but it was not possible to define the highest average daily sodium intake where no adverse effects on blood pressure could be observed.
The recommendation is a change from the 2006 UL, reflecting the new guidance on the determinants of the UL. Within this framework, there is insufficient evidence to support the determination of a single UL value with confidence. This does not mean consumption is safe at any level, but rather a point estimate for the UL cannot be made.
Suggested Dietary Target (SDT) for sodium has been determined as 2000 mg.
The SDT is defined in terms of the contribution of a nutrient intake to chronic disease risk and there is a convincing relationship between increasing sodium intake and increasing blood pressure in the population.
The value is a change from the 2006 SDT. The guidance on the determination of the SDT has changed to the desirable median of population intake. This is a lowering compared to current intakes which is in the right direction. This new value is supported by strong evidence that reducing from current dietary sodium intake to this level would reduce systolic blood pressure by 2mm Hg in the total population. It is the target recently arrived at by WHO using different criteria and aligns well with the dietary modelling for the ADG.
The value for the SDT recognises that sodium intake is one dietary factor attributable to the prevention of chronic disease, and that the effect of high sodium intakes is also seen in the context of a whole diet.
6.1 Rationale for any changes to previous values
The revised NRVs represent changes from the previous values. This reflects the revised definitions provided by the Framework document (13), consideration of the outcomes of the evidence review, and changes made by international authorities. A summary of these considerations are presented below.
6.1.1 6.1.1 New methodological framework
The new framework indicated that evidence should be assessed separately for deficiency status and the prevention of chronic disease. The sodium report focused on the latter because deficiency is not an issue for this nutrient. Contextual features were considered, including the feasibility of the NRVs given current food choices. In turn, this also recognised that sodium is delivered in foods that deliver other nutrients, and that there is a need for a diet to provide requirements for all nutrients as well as sodium. Finally global public health
25

efforts for addressing the prevalence of non-communicable diseases related to sodium intake were considered.
In the case of the UL, the Framework [14], states that: ‘ULs should only be developed when there is strong, high quality evidence supporting the potential for significant harm from realistically achievable dietary intakes (from diet and supplements combined)’. In cases where the data supporting adverse effects of high intakes of a nutrient is of poor quality, speculative, reliant on biomarkers of uncertain relationship to primary health outcomes, or derived from populations with unusual or deficient diets, alternative options to setting a UL may include setting a provisional UL, not determining a UL, or stating that a UL is not required [14].
Table 6.1 [14] Criteria for using different categories of Upper Level of Intake
Option Criteria Frequency
Upper Level of Intake
Good evidence of an adverse effect in humans at realistically achievable intakes;ANDSufficient data to support establishment of a dose response relationship.
Expressed per day, week or month as appropriate for individual nutrients.
Provisional UL
Sufficient evidence of adverse effects in humans at realistic levels of intake;ANDNature or extent of the evidence is insufficient to determine a point estimate of the safe upper level with reasonable confidence.
Expressed per day, week or month as appropriate for individual nutrients
Not determined
An absence of evidence of hazard;ORSome evidence of potential adverse effects at high intake levels well above that normally achievable in the diet;ORThe evidence is insufficient to support the determination of a UL with any confidence.
N/A
Not required
Good quality evidence demonstrating no adverse outcomes from nutrient intakes well above amounts normally achievable from the diet.
N/A
In order to determine a position with respect to these criteria, a risk analysis approach was taken for nutrient toxicity [15, 16]. Hazard identification involved the collection and evaluation of all available information relating to the adverse effects associated with consumption of a specific nutrient. In this context, the adverse effect, defined as: ‘any significant alteration in the structure or function of the human organism or any impairment of a physiologically important function’ [15] was addressed primarily in terms of an increase
26

in blood pressure from increased dietary sodium intake. The EWG found the model could not be used in its entirety for a number of reasons.
Biomarkers of intake and disease end points were justified (Section 7a). Relevant literature providing the evidence base for nutrient-health associations was identified (Section 7b). The SLR applied the GRADE quality appraisal process to examine individual studies (Section 7c and Support Document 1). The analysis of data derived from these studies confirmed there was an overall effect. The cutpoint analysis did not reveal a sodium intake at which the magnitude of the relationship between sodium and blood pressure changed. Thus it was not possible to determine a value for a UL.
Unlike the UL, the consideration of the SDT did not involve a dose-response analysis of potential adverse effects. Concepts such as NOAEL or LOAEL did not apply. In keeping with the new Framework, the SDT was set as a desired target for the population median intake.
6.1.2 6.1.2 Outcomes of review
While the SLR conducted for this report, and the associated statistical analysis showed a lack of evidence of effects of sodium intake on disease outcomes, mortality, and cholesterol levels, it did show consistent evidence of the effect of reducing sodium intake on reductions in systolic blood pressure in the range examined. Given that mortality and disease end points are likely to be influenced by multiple factors, (of which blood pressure is one), the EWG determined that the blood pressure effects were a significant enough basis on which for the the analysis to try to determine a UL. The effects were viewed progressively for cutpoints between 1100 mg/day and 3700 mg/day Na, by increments of 100 mg Na. Graphical analyses of data from these studies showed that below about 2000 mg/day, the difference in blood pressure was larger in the group of studies above the cutpoint than below the cutpoint (i.e. a stronger effect in the studies with higher sodium intakes that were categorised as belonging to a “low sodium group”) but the reverse was true above 2000 mg/day (not corrected for confounding by differences in the sodium range tested). The above cutpoint groups tested a smaller range of sodium differences than the below cutpoint set at all cutpoint values. The above and below cutpoint groups showed the same mean difference in systolic blood pressure when expressed per 500 mg difference in sodium (about -1.5 mmHg per 500 mg reduction in Na excretion). Therefore differences observed in the analysis of systolic blood pressure above and below 2000mg of sodium intake were due to confounding by variation among the studies in the sodium intakes prescribed between the high and low sodium groups. This analysis did not test for many small differences (for example from 1200 to 1500 mg) but as the relationship appeared present with increasing intakes the assumption was made that the difference was possibly similar.
The relationship between sodium and systolic blood pressure was related to the size of the reduction in sodium excretion and it did not vary across the range of 1200-3300 mg/day in the data examined. The EWG noted that an effect was observed in the DASH study [7]
27
which informed the setting of the UL in 2006. The analysis conducted for this 2014 review indicates a need to revise this position. The 2006 NRV report set the UL for sodium based on two studies [7, 58], but further studies and developments in methodology have expanded the range of inputs. The 2014 review worked from a definition of the UL which implicated a point above which an adverse effect was identifiable, but it was noted that both the studies considered for the 2006 review showed that there was a lessening of effect in the higher intake group. Further, the dose-response relationship between sodium and blood pressure examined in the 2014 review did not have any breakpoints. This means is it not possible to identify the NOAEL across the range of 1200-3300 mg/day in the low sodium group.
In this situation where it is accepted that there is an effect, but a NOAEL cannot be determined an UL cannot be set. The definitions of “Not determined” and “Not required” both refer to “well above that normally achievable in the diet”. Our SLR (Support Document 1) confirmed previous reviews that there was strong evidence that decreasing intakes of sodium decreased systolic blood pressure (the GRADE quality of evidence assessment was high when hypertensive and normotensive participants were analysed separately). The inclusion of new studies since the earlier versions of the review by He et al [116] (which was the basis of the salt guideline in the 2013 ADG) did not alter the association. Thus the analysis shows that it is not possible to identify an intake where the risk of change in systolic blood pressure shifts from non-existent to present (or from weaker to stronger). In answering the research question, it was not considered possible to define the highest average daily sodium intake likely to pose no adverse effects to almost all individuals in the general adult population. Thus it was not possible to define an UL based on the dose-response relationship between sodium and systolic blood pressure observed.
With respect to the SDT, a target for the prevention of raised blood pressure was considered relevant given that in the range of 1200-3300 mg of 24-hour Na excretion, a dose-response relationship can be observed between a decrease in sodium intake and decrease in systolic blood pressure (about 1.5 mmHg/500 mg). The meta-analysis showed a reduction in systolic blood pressure when mean population excretion was lowered from about 3500 mg/day to 2100 mg/day. This would lead to an SDT of an intake that is equivalent to an excretion of 2100 mg/day. The recommended SDT in this report is rounded to 2000mg to reflect:
Lack of a precision in change in the dose relationship at exactly 2100mg.
Consideration of the dietary modelling (below)
Consistency with international recommendations (such as WHO)
Acknowledgement that given current population mean intakes in Australia and New Zealand, a SDT of 2000mg is aspirational. The 2012 WHO guideline for sodium was established at 2000mg (5g/day salt) based on a comprehensive review and meta-analysis which concluded that reducing sodium to less than 2000mg/day was more
28

beneficial to blood pressure than reducing sodium intake but still consuming more than 2000mg/day.
As population dietary intake levels decrease and more data emerge about the relationship between sodium intake and blood pressure at lower levels (i.e. below 2000mg/day), further revision of the SDT downwards may be appropriate.
The dietary modelling for the Foundation Diets associated with the Australian Dietary Guidelines produced a value for dietary intake of about 1200 mg sodium/day in the process of working with a judicious combination of foods aimed at delivering all nutrient requirements (Table 6, Supporting Document 3). These models contained insufficient energy to cover the needs of most of the population, and the 7-day diets for the Total Diet models (which included foods beyond the minimum to meet nutrient requirements and meet energy needs) produced dietary sodium intakes closer to 1900-2700 mg/day (total omnivore diet models, with < 7 serves ‘extra’ foods/week for average young adult men and women). So setting the SDT at 2000 means that it is more likely to be achievable in parallel with obtaining a sufficient intake of energy. However, parallel initiatives to encourage the food industry to lower the salt content of foods will still be required. As changes to the food supply occur, it may be possible to achieve an adequate energy intake on lower sodium intakes, and so the SDT may be revised downwards.
6.1.3 6.1.3 Comparisons with international guidelines
The previous UL values for the 2006 Australia New Zealand and USA/Canada are the same, but EFSA and Japan have not set a UL for sodium (Table ). The 2005 IOM report noted that it is difficult to precisely determine a UL due to the ‘progressive and continuous’ nature of the relationship between sodium intake and blood pressure. In 2006 EFSA went further and stated that it was not possible to determine a threshold level of sodium intake below which there is unlikely to be adverse effects on blood pressure. Japan also did not set an UL although specific reasons for this were not detailed. Three of the countries have specified a value for adequacy to compensate for endogenous sodium losses but only Japan has called this an EAR rather than AI.
Table 6.2 Selected Sodium NRVs: Australia/New Zealand, USA/Canada, EFSA, Japan.
Country UL SDT AI Approach
Australia & New Zealand (2006) [5]
2300 mg /day (100 mmol/day)
1600 mg (70 mmol/day)
460-920 mg/day
UL: Based on population studies that identified low levels of hypertension and no other observed adverse effects with intakes below this level & experimental data
29
Country UL SDT AI Approach
SDT: Selected in line with past WHO recommendations
AI: Set to ensure basic sodium requirements are met and allow for adequate intake of other nutrients
USA & Canada (Institute of Medicine) (2005) [3]
2300 mg /day (100 mmol/day)
Not available
1.5 g/day (65 mmol/day) for adults aged 19-50
1.3 g/day (55 mmol/day) for adults aged 51-70
UL: Based on clinical trial evidence exploring dose response between blood pressure and sodium (commonly the next level above the adequate intake that was tested)
AI: based on meeting sodium needs and that of other nutrients inapparently healthy individuals with
using foods found in a Western-type diet
European Food Safety Authority (EFSA) (2006) [117]
Not available
Not available
UL: Report indicated available data not sufficient to establish a UL
SDT: not set as yet
Japan (2010) [118]
Not available
<9 g salt for males, <7.5 g salt for females
Did not set AI
Set an EAR of 600 mg/day
SDT: Review of epidemiological evidence of relationship between sodium intake, blood pressure and cancer – taking into consideration Japanese sodium intake and NRVs from Western countries
The issues raised by the different regional groups reflect many of the challenges faced in deriving the NRVs for Australia/ New Zealand as discussed in this report.
6.2 Validity of recommendations
30

In the context of this report, the validity of recommendations was considered in line with current dietary intakes. Most studies suggest that people in Australia and New Zealand have a dietary intake of approximately 3600 mg of sodium/day which is more than double the existing SDT [119]. A 2008 review of studies that used the 24 hour urine to measure sodium intake showed intakes of between 2440 mg/day (females only) and 4800mg/day [120]. Since then several more studies on small population groups using 24 hour urine have been published showing that sodium intake per person per day in Australia varies, for example, 2898 mg/day (Adelaide) [121], 3600 mg/day (Lithgow, NSW) [122] and 3800 mg/day for men and 2800 mg/day for women in Victoria.
The most recent estimate of dietary sodium intake for New Zealand adults is from a population survey of a representative sample of 301 adults aged 18-64 years living in two urban areas (Dunedin and Wellington) in 2012. Participants were recruited from the electoral roll and, due to a relatively low response rate of 23%, the sample was supplemented by 50 volunteers. Assessment of sodium intake was undertaken by 24 hour urine collection. The mean 24 hr sodium excretion was 3373 mg/day (95%CI 3208, 3539). The vast majority (93 %) of participants had a 24 hr sodium excretion that exceeded the SDT of 1600 mg/day while approximately three quarters (76%) had a 24 hr sodium excretion that exceeded the UL for sodium of 2300 mg/day [123]. These estimates are consistent with previous population surveys in New Zealand [124-126], suggesting that dietary sodium intake for adults has remained relatively stable over the past three decades.
The 2011-12 Australian Health Survey analysed the proportion of sodium that comes from the diet, excluding discretionary salt [127]. For the population aged 2 years and older, cereals and cereal products and cereal based product and dishes contribute 43% of dietary sodium (including 14.8% from breads, flat breads and sweet breads and English muffins and 14.6% from mixed dishes where cereal is the major ingredient), 8% of dietary sodium is contributed by milk products and dishes and 6% from processed meat. Although 1.9% of dietary sodium came from snack foods, including potato crisps, this varied by age from 4.8% among those aged 4-8 years to less than 1% in those aged over 50 years [127]. Similar figures have also been reported among an assessment of Australian Indigenous children and non-Indigenous children living in rural NSW (n=215), with 19-21% of sodium in the diet from bread, 14-16% from processed meat, 7-9% from take-away foods, 5.5-7.5% from potato crisps [128].
In New Zealand breads, cereals, and processed meats are likely to contribute most to sodium intake from processed food. Several analyses of results from the 1997 Adult Nutrition Survey matched to food composition data from the New Zealand Food Composition Database, and the New Zealand Total Diet Survey have been undertaken. These suggest that for all age groups bread made the greatest contribution to sodium intake from processed foods (at approximately 35-43%) [129]. Processed meats, sauces, breakfast
31
cereals and baked products are also likely to be important sources of dietary sodium [130]. Other foods that are likely to contribute significantly to dietary sodium intake in New Zealand include takeaways, dairy products, cereals and pasta, biscuits and cake and meat and meat products [131]. Since these analyses were undertaken the sodium content of bread has been reduced [132], however the effect of this on contribution to sodium intake has not been formally evaluated. Current sodium intake estimates suggest that it is going to be difficult for individuals or groups to reduce intake levels consistent with the proposed NRVs.
There are clearly challenges in setting NRVs for sodium, that are likely to be similar for a number of nutrients where the setting of NRVs is to reduce chronic disease, rather than reduce dietary deficiency. A precise threshold where intake is associated with increased evidence of harm is unable to be defined given the current evidence available. However, there is a large amount of consistent evidence associating higher sodium intakes and elevated blood pressure. Further clinical trials examining the effect of sodium lowering to levels below 1200 mg/day may in future reveal a threshold level. Lack of NRV guidance on this issue may be interpreted as lack of evidence, rather than lack of precision, and would be inconsistent with the goal of reducing chronic disease, and may undermine public health efforts to reduce sodium intake.
7. Membership of groups and committees involved in the development process
Membership of the Nutrient Reference Values Steering Group
The Steering Group for the project was composed of representatives from the Australian Government Department of Health, and the New Zealand Ministry of Health.
Membership of the Nutrient Reference Values Advisory Committee
Professor Samir Samman (Chair) Department of Human Nutrition, University of Otago, New Zealand
Ms Janis Baines Food Standards Australia New Zealand
Associate Professor Marijka Batterham School of Mathematics and Applied Statistics, University of Wollongong, Australia
Professor Michael Fenech CSIRO Food & Nutritional Sciences, Adelaide, Australia
Professor Mark Lawrence School of Exercise and Nutrition Sciences, Deakin University, Australia
32
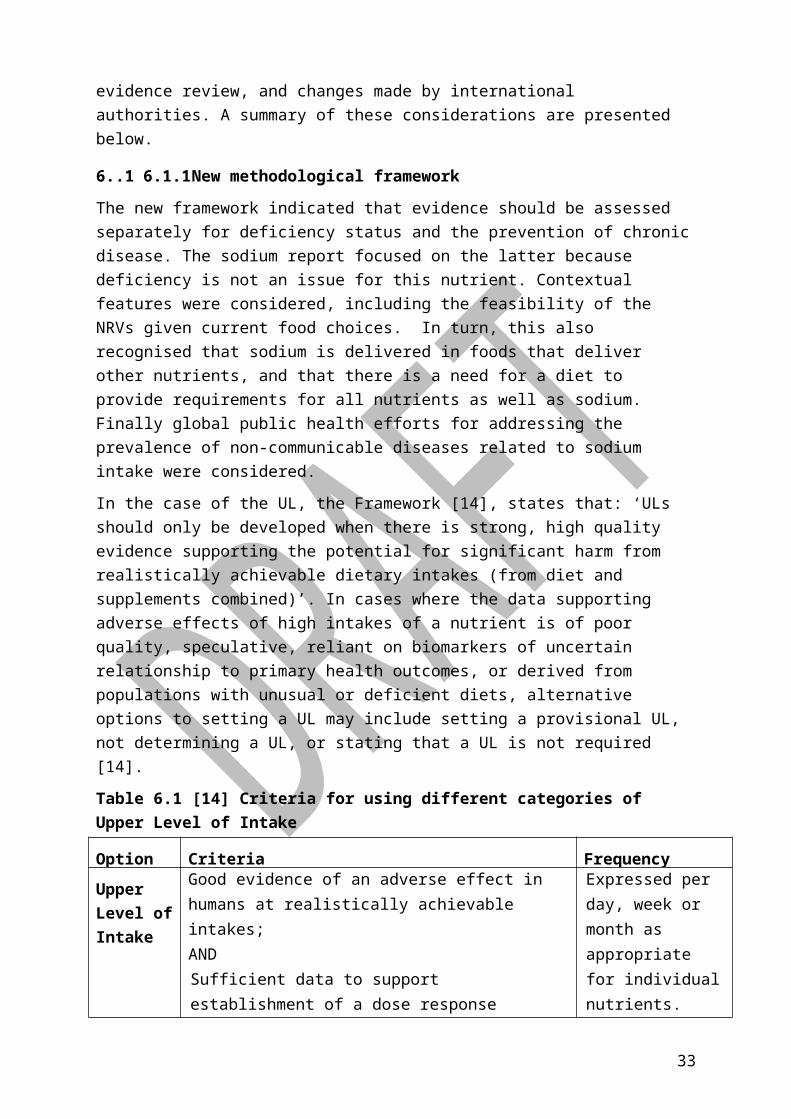
Professor Jim Mann School of Medicine, University of Otago, New Zealand
Professor Murray Skeaff Department of Human Nutrition, University of Otago, New Zealand
Professor Linda TapsellSchool of Medicine, University of Wollongong, Australia
Emeritus Professor Christine Thomson (until February 2015)Department of Human Nutrition, University of Otago, New Zealand
Professor Lynne Daniels (2013)Head of School, Exercise & Nutrition Sciences, Queensland University of Technology, Queensland, Australia.
Membership of the Nutrient Reference Values Sodium Expert Working Group
Professor Linda Tapsell (Chair) School of Medicine, University of Wollongong, Australia
Dr Barry FieldsFood Standards Australia New Zealand
Professor Vicki FloodFaculty of Health Sciences, University of Sydney, Australia
Professor Dorothy Mackerras Food Standards Australia New Zealand
Dr Rachael McLean Department of Human Nutrition, University of Otago, New Zealand
Dr Jacqui Webster The George Institute for Global Health, Australia
Observers
Ms Xenia Cleanthous
National Heart Foundation, Australia
Sodium Research Assistants
Dr Elizabeth Neale Landmark Nutrition, Australia
Dr Deborah Nolan-Clark Landmark Nutrition, Australia
33

8. GlossaryADG Australian Dietary Guidelines
AI Adequate Intake - The average daily nutrient intake level based on observed or experimentally determined approximations or estimates of nutrient intake by a group (or groups) or apparently healthy people that are assumed to be adequate (used when an EAR cannot be determined)
BP Blood Pressure
CI Confidence Interval
CVD Cardiovascular Disease
EAR Estimated Average Requirement - Nutrient level required to meet the needs of approximately half the healthy individuals in a particular life stage or gender group
FFQ Food Frequency Questionnaire
HDL High density Lipoprotein
HT Hypertensive – Usually defined as systolic blood pressure above ≥140 and/or diastolic blood pressure ≥90mmHg
IHD Ischaemic Heart Disease
IOM Institute of Medicine
K Potassium
LDL Low Density Lipoprotein
LOAEL Lowest Observed Adverse Effect level- Lowest dose at which there is a measurable adverse effect from a test substance in a test subject or population.
Na Sodium
NOAEL No Observed Adverse Effect Level - Highest dose at which there is a measurable adverse effect from a test substance in a test subject or population
NHMRC National Health and Medical Research Council - Australia's peak body for supporting health and medical research; for developing health advice for the Australian community, health professionals and governments; and for providing advice on ethical behaviour in health care and in the conduct of health and medical research
NRV Nutrient Reference Values - A set of nutritional recommendations, based on current scientific knowledge, used to assess the health status of populations and individuals.
NT Normotensive – Usually defined as blood pressure below 140/90mmHg
34

PICO (TS) Population, intervention, comparator, outcome, time, study design
SBP Systolic Blood Pressure
SDT Suggested Dietary Target - A daily average intake from food and beverages for certain nutrients that may help in the prevention of chronic disease.
SLR Systematic Literature Review
UF Uncertainty Factor
UL Upper Level of Intake - The highest average daily nutrient intake level likely to pose no adverse health effects to almost all individuals in the general population. As intake increases above the UL, the potential risk of adverse effects increases
USDA United States Drug Administration
WHO World Health Organization
35

9. References1. Ministry of Health, Food and Nutrition Guidelines for Healthy Adults: A background
paper, . 2003: Wellington.
2. Department of Health and Ageing and National Health and Medical Research Council, Australian Dietary Guidelines. 2013.
3. Food and Nutrition Board: Institute of Medicine, Dietary reference intakes for water, potassium, sodium, chloride and sulfate 2005, The National Academies Press: Washington ,DC.
4. Food and Nutrition Board: Institute of Medicine, Sodium intake in populations: assessment of evidence. 2013, The National Academies Press: Washington DC.
5. National Health and Medical Research Council and New Zealand Ministry of Health, Nutrient Reference Values for Australia and New Zealand including recommended dietary intakes. 2006.
6. Suckling, R.J., et al., Dietary salt influences postprandial plasma sodium concentration and systolic blood pressure. Kidney International, 2012. 81(4): p. 407-411.
7. Sacks, F.M., et al., Effects on blood pressure of reduced dietary sodium and the dietary approaches to stop hypertension (DASH) diet. New England Journal of Medicine, 2001. 344(1): p. 3-10.
8. Elliott, P., et al., Intersalt revisited: further analyses of 24 hour sodium excretion and blood pressure within and across populations. BMJ, 1996. 312(7041): p. 1249-1253.
9. Willmot, M., J. Leonardi-Bee, and P.M.W. Bath, High Blood Pressure in Acute Stroke and Subsequent Outcome: A Systematic Review. Hypertension, 2004. 43(1): p. 18-24.
10. Psaty, B.M., et al., Association between blood pressure level and the risk of myocardial infarction, stroke, and total mortality: The cardiovascular health study. Archives of Internal Medicine, 2001. 161(9): p. 1183-1192.
11. Jafar, T.H., et al., Progression of Chronic Kidney Disease: The Role of Blood Pressure Control, Proteinuria, and Angiotensin-Converting Enzyme Inhibition: A Patient-Level Meta-Analysis. Annals of Internal Medicine, 2003. 139(4): p. 244-252.
12. Cook, N.R., L.J. Appel, and P.K. Whelton, Lower Levels of Sodium Intake and Reduced Cardiovascular Risk. Circulation, 2014. 129(9): p. 981-989.
13. Jacobs, D.R. and L.C. Tapsell, Food, Not Nutrients, Is the Fundamental Unit in Nutrition. Nutrition Reviews, 2007. 65(10): p. 439-450.
36

14. Department of Health and Ageing, Methodological framework for the review of Nutrient Reference Values. 2013.
15. Food and Nutrition Board: Institute of Medicine, Dietary Reference Intakes: A Risk Assessment Model for Establishing Upper Intake Levels for Nutrients. 1998, National Academy Press: Washington DC.
16. Food and Agriculture Organization of the United Nations and World Health Organisation, A Model for Establishing Upper Levels of Intake for Nutrients and Related Substances. 2006: Geneva.
17. Sanchez-Castillo, C.P., W.J. Branch, and W.P.T. James, A test of the validity of the lithium-marker technique for monitoring dietary sources of salt in man. Clinical Science, 1987. 72: p. 87-94.
18. Espeland, M.A., et al., Statistical Issues in Analyzing 24-Hour Dietary Recall and 24-Hour Urine Collection Data for Sodium and Potassium Intakes. American Journal of Epidemiology, 2001. 153(10): p. 996-1006.
19. Khaw, K.T., et al., Blood pressure and urinary sodium in men and women: the Norfolk Cohort of the European Prospective Investigation into Cancer (EPIC-Norfolk). American Journal of Clinical Nutrition, 2004. 880: p. 1397-1403.
20. Rhodes, D.G., et al., The USDA Automated Multiple-Pass Method accurately assesses population sodium intakes. The American Journal of Clinical Nutrition, 2013. 97(5): p. 958-964.
21. Day, N., et al., Epidemiological assessment of diet: a comparison of a 7-day diary with a food frequency questionnaire using urinary markers of nitrogen, potassium and sodium. International Journal of Epidemiology, 2001. 30(2): p. 309-317.
22. Dyer, A.R., et al., Urinary biochemical markers of dietary intake in the INTERSALT Study. American Journal of Clinical Nutrition, 1997. 65: p. 1246S-53S.
23. Joint Health Surveys Unit, A survey of 24 hour and spot urinary sodium and potassium excretion in a representative sample of the Scottish population. 2007, National Centre for Social Research.
24. Whelton, P.K., et al., Sodium, Blood Pressure, and Cardiovascular Disease. Circulation, 2012.
25. Ovesen, L. and J. Boeing, The use of biomarkers in multicentric studies with particular consideration of iodine, sodium, iron, folate and vitamin D. European Journal of Clinical Nutrition, 2002. 56(Suppl 2): p. S12-S17.
37
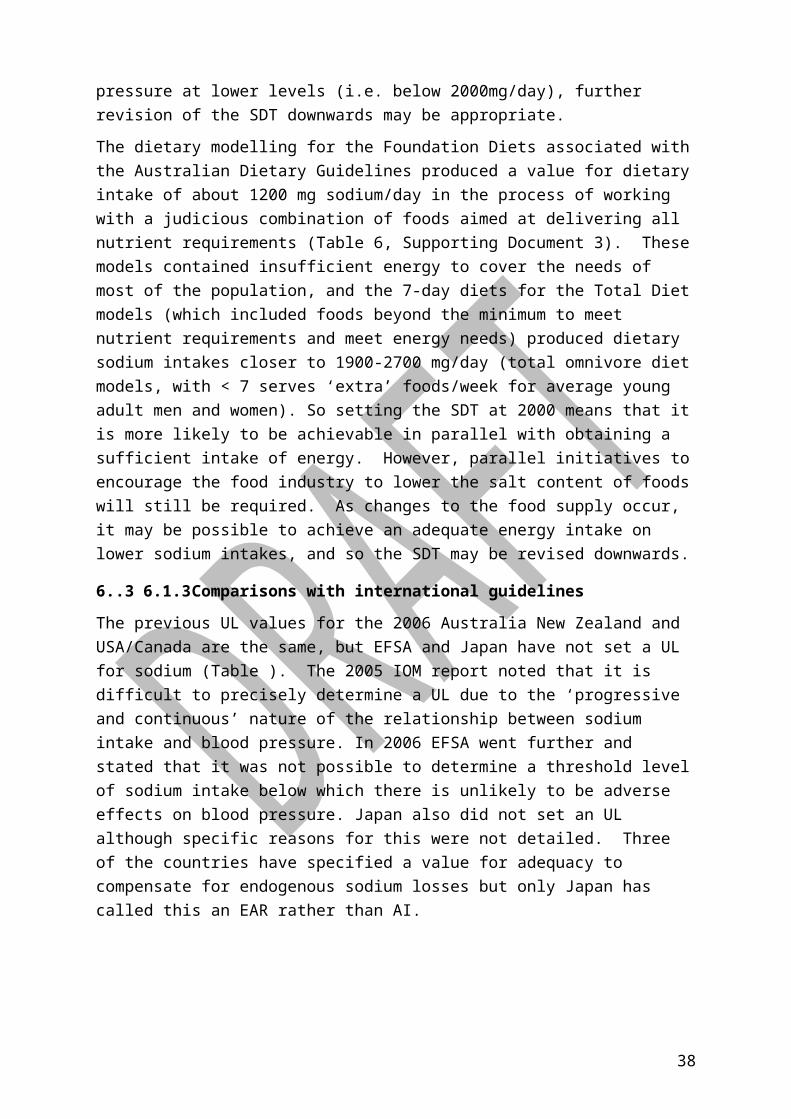
26. He, F.J., J. Li, and G.A. MacGregor, Effect of longer term modest salt reduction on blood pressure: Cochrane systematic review and meta-analysis of randomised trials. BMJ, 2013. 346.
27. He, F.J. and G.A. MacGregor, A comprehensive review on salt and health and current experience of worldwide salt reduction programmes. Journal of Human Hypertension, 2008. 23: p. 363-384.
28. Weinberger, M.H., Salt Sensitivity of Blood Pressure in Humans. Hypertension, 1996. 27(3): p. 481-490.
29. Lim, S.S., et al., A comparative risk assessment of burden of disease and injury attributable to 67 risk factors and risk factor clusters in 21 regions, 1990–2010: a systematic analysis for the Global Burden of Disease Study 2010. The Lancet, 2012. 380(9859): p. 2224-2260.
30. Asia Pacific Cohort Studies Collaboration, Blood pressure and cardiovascular disease in the Asia Pacific region. Journal of Hypertension, 2003. 21: p. 707-716.
31. Prospective Studies Collaboration, Age-specific relevance of usual blood pressure to vascular mortality: a meta-analysis of individual data for one million adults in 61 prospective studies. The Lancet, 2002. 360(9349): p. 1903-1913.
32. National Heart Foundation of Australia (National Blood Pressure and Vascular Disease Advisory Committee), Guide to management of hypertension. 2008 Updated 2010, National Heart Foundation of Australia.
33. New Zealand Guidelines Group, New Zealand Primary Care Handbook. 3rd ed. ed. 2012, Wellington: New Zealand Guidelines Group.
34. McLean, R.M., et al., Blood pressure and hypertension in New Zealand: results from the 2008/09 Adult Nutrition Survey. New Zealand Medical Journal, 2013. 126(1372): p. 66-79.
35. Dickinson, K.M., P.M. Clifton, and J.B. Keogh, A reduction of 3 g/day from a usual 9 g/day salt diet improves endothelial function and decreases endothelin-1 in a randomised cross_over study in normotensive overweight and obese subjects. Atherosclerosis, 2014. 233(1): p. 32-8.
36. Graudal, N.A., A.M. Galloe, and P. Garred, Effects of Sodium Restriction on Blood Pressure, Renin, Aldosterone, Catecholamines, Cholesterols, and Triglyceride. JAMA: The Journal of the American Medical Association, 1998. 279(17): p. 1383-1391.
37. McCarron, D.A., Physiology, Not Policy, Drives Sodium Intake. American Journal of Hypertension, 2013. 26(10): p. 1191-1193.
38

38. World Health Organization, Guideline: Sodium intake for adults and children. 2012, World Health Organization (WHO): Geneva.
39. Barbui, C., et al., Challenges in Developing Evidence-Based Recommendations Using the GRADE Approach: The Case of Mental, Neurological, and Substance Use Disorders. PLoS Med, 2010. 7(8): p. e1000322.
40. Cook, N.R., et al., Long term effects of dietary sodium reduction on cardiovascular disease outcomes: observational follow-up of the trials of hypertension prevention (TOHP). BMJ, 2007. 334(7599): p. 885.
41. Ekinci, E.I., et al., Dietary salt intake and mortality in patients with type 2 diabetes. Diabetes care, 2011. 34(3): p. 703-709.
42. Guyatt, G.H., et al., GRADE: an emerging consensus on rating quality of evidence and strength of recommendations. British Medical Journal, 2008. 336(7650): p. 924-926.
43. World Health Organisation, Effect of reduced sodium intake on blood pressure, renal function, blood lipids and other potential adverse effects. 2012.
44. Graudal, N.A., T. Hubeck-Graudal, and G. Jurgens, Effects of low sodium diet versus high sodium diet on blood pressure, renin, aldosterone, catecholamines, cholesterol, and triglyceride. Cochrane Database of Systematic Reviews, 2011(11).
45. World Health Organisation, Effects of reduced sodium intake on cardiovascular disease, coronary heart disease and stoke. 2012: Geneva.
46. He, F., J. Li, and G. MacGregor, Effect of longer-term modest salt reduction on blood pressure. Cochrane Database of Systematic Reviews, 2013(4).
47. Hooper, L., et al., Advice to reduce dietary salt for prevention of cardiovascular disease. Cochrane Database of Systematic Reviews, 2009(1).
48. Moher, D., et al., Preferred Reporting Items for Systematic Reviews and Meta-Analyses: The PRISMA Statement. PLoS Med, 2009. 6(7): p. e1000097.
49. Appel, L.J. and G. Amer Soc Hypertension Writing, ASH Position Paper: Dietary Approaches to Lower Blood Pressure. Journal of Clinical Hypertension, 2009. 11(7): p. 358-368.
50. United States Department of Agriculture Center for Nutrition Policy and Promotion, Dietary Guidelines for Americans. 2010.
51. McLean, R., S. Williams, and J. Mann, Monitoring Population Sodium Intake Using Spot Urine Samples: Validation in a New Zealand Population. Journal of Human Hypertension, 2014. in press.
39

52. Cogswell, M.E., et al., Validity of predictive equations for 24-h urinary sodium excretion in adults aged 18–39 y. The American Journal of Clinical Nutrition, 2013. 98: p. 1502-13.
53. Cobb, L.K., et al., Methodological Issues in Cohort Studies That Relate Sodium Intake to Cardiovascular Disease Outcomes: A Science Advisory From the American Heart Association. Circulation, 2014.
54. Obarzanek, E., et al., Individual blood pressure responses to changes in salt intake - Results from the DASH-Sodium trial. Hypertension, 2003. 42(4): p. 459-467.
55. The Cochrane Collaboration, Cochrane handbook for systematic reviews of interventions version 5.1.0. 2011.
56. Guyatt, G.H., et al., GRADE guidelines: 7. Rating the quality of evidence—inconsistency. Journal of Clinical Epidemiology, 2011. 64(12): p. 1294-1302.
57. National Health and Medical Research Council, How to use the evidence: assessment and application of scientific evidence. 2000.
58. Macgregor, G.A., et al., DOUBLE-BLIND-STUDY OF 3 SODIUM INTAKES AND LONG-TERM EFFECTS OF SODIUM RESTRICTION IN ESSENTIAL-HYPERTENSION. Lancet, 1989. 2(8674): p. 1244-1247.
59. Kirkendall, A.M., et al., The effect of dietary sodium chloride on blood pressure, body fluids, electrolytes, renal function, and serum lipids of normotensive man. The Journal of laboratory and clinical medicine, 1976. 87(3): p. 411-34.
60. Hypertension Prevention Trial Research, G., The hypertension prevention trial: Three-year effects of dietary changes on blood pressure. Archives of Internal Medicine, 1990. 150(1): p. 153-162.
61. Izzo Jr, J., D. Levy, and H. Black. Clinical advisory statement: Importance of systolic blood pressure in older Americans. [cited 2014; Available from: https://www.nhlbi.nih.gov/health/prof/heart/hbp/hbpstmt/hbpstmt.htm.
62. Jablonski, K.L., et al., Dietary Sodium Restriction Reverses Vascular Endothelial Dysfunction in Middle-Aged/Older Adults With Moderately Elevated Systolic Blood Pressure. Journal of the American College of Cardiology, 2013. 61(3): p. 335-343.
63. Gillies, A.H.B., et al., ADJUNCTIVE EFFECT OF SALT RESTRICTION ON ANTIHYPERTENSIVE EFFICACY. Clinical and Experimental Pharmacology and Physiology, 1984. 11(4): p. 395-398.
64. Howe, P.R.C., et al., EFFECT OF SODIUM RESTRICTION AND FISH-OIL SUPPLEMENTATION ON BP AND THROMBOTIC RISK-FACTORS IN PATIENTS TREATED WITH ACE-INHIBITORS. Journal of Human Hypertension, 1994. 8(1): p. 43-49.
40

65. Morgan, T. and A. Anderson, Sodium restriction can delay the return of hypertension in patients previously well-controlled on drug therapy. Canadian Journal of Physiology and Pharmacology, 1987. 65(8): p. 1752-1755.
66. Morgan, T., et al., HYPERTENSION TREATED BY SALT RESTRICTION. Lancet, 1978. 1(8058): p. 227-230.
67. Morgan, T.O. and J.B. Myers, HYPERTENSION TREATED BY SODIUM RESTRICTION. Medical Journal of Australia, 1981. 2(8): p. 396-397.
68. Nestel, P.J., et al., ENHANCED BLOOD-PRESSURE RESPONSE TO DIETARY SALT IN ELDERLY WOMEN, ESPECIALLY THOSE WITH SMALL WAIST-HIP RATIO. Journal of Hypertension, 1993. 11(12): p. 1387-1394.
69. Nowson, C.A., T.O. Morgan, and C. Gibbons, Decreasing dietary sodium while following a self-selected potassium-rich diet reduces blood pressure. Journal of Nutrition, 2003. 133(12): p. 4118-4123.
70. Parker, M., et al., 2-WAY FACTORIAL STUDY OF ALCOHOL AND SALT RESTRICTION IN TREATED HYPERTENSIVE MEN. Hypertension, 1990. 16(4): p. 398-406.
71. Chalmers, J., et al., AUSTRALIAN NATIONAL-HEALTH AND MEDICAL-RESEARCH COUNCIL DIETARY SALT STUDY IN MILD HYPERTENSION. Journal of Hypertension, 1986. 4: p. S629-S637.
72. Chalmers, J.P., FALL IN BLOOD-PRESSURE WITH MODEST REDUCTION IN DIETARY SALT INTAKE IN MILD HYPERTENSION. Lancet, 1989. 1(8635): p. 399-402.
73. Carney, S.L., et al., INCREASED DIETARY-SODIUM CHLORIDE IN PATIENTS TREATED WITH ANTIHYPERTENSIVE DRUGS. Clinical and Experimental Hypertension Part a-Theory and Practice, 1991. 13(3): p. 401-407.
74. Cobiac, L., et al., A LOW-SODIUM DIET SUPPLEMENTED WITH FISH OIL LOWERS BLOOD-PRESSURE IN THE ELDERLY. Journal of Hypertension, 1992. 10(1): p. 87-92.
75. Sciarrone, S.E.G., et al., A FACTORIAL STUDY OF SALT RESTRICTION AND A LOW-FAT HIGH-FIBER DIET IN HYPERTENSIVE SUBJECTS. Journal of Hypertension, 1992. 10(3): p. 287-298.
76. Richards, A.M., et al., BLOOD-PRESSURE RESPONSE TO MODERATE SODIUM RESTRICTION AND TO POTASSIUM SUPPLEMENTATION IN MILD ESSENTIAL-HYPERTENSION. Lancet, 1984. 1(8380): p. 757-761.
77. Arroll, B. and R. Beaglehole, SALT RESTRICTION AND PHYSICAL-ACTIVITY IN TREATED HYPERTENSIVES. New Zealand Medical Journal, 1995. 108(1003): p. 266-268.
78. Alli, C., et al., FEASIBILITY OF A LONG-TERM LOW-SODIUM DIET IN MILD HYPERTENSION. Journal of Human Hypertension, 1992. 6(4): p. 281-286.
41
79. Andersson, O.K., B. Fagerberg, and T. Hedner, IMPORTANCE OF DIETARY SALT IN THE HEMODYNAMIC ADJUSTMENT TO WEIGHT-REDUCTION IN OBESE HYPERTENSIVE MEN. Hypertension, 1984. 6(6): p. 814-819.
80. Benetos, A., et al., ARTERIAL EFFECTS OF SALT RESTRICTION IN HYPERTENSIVE PATIENTS - A 9-WEEK, RANDOMIZED, DOUBLE-BLIND, CROSSOVER STUDY. Journal of Hypertension, 1992. 10(4): p. 355-360.
81. Cappuccio, F.P., et al., Double-blind randomised trial of modest salt restriction in older people. Lancet, 1997. 350(9081): p. 850-854.
82. Dodson, P.M., et al., SODIUM RESTRICTION AND BLOOD-PRESSURE IN HYPERTENSIVE TYPE-II DIABETICS - RANDOMIZED BLIND CONTROLLED AND CROSSOVER STUDIES OF MODERATE SODIUM RESTRICTION AND SODIUM SUPPLEMENTATION. British Medical Journal, 1989. 298(6668): p. 227-230.
83. Erwteman, T.M., et al., BETA-BLOCKADE, DIURETICS, AND SALT RESTRICTION FOR THE MANAGEMENT OF MILD HYPERTENSION - A RANDOMIZED DOUBLE-BLIND TRIAL. British Medical Journal, 1984. 289(6442): p. 406-409.
84. Fagerberg, B., et al., BLOOD-PRESSURE CONTROL DURING WEIGHT-REDUCTION IN OBESE HYPERTENSIVE MEN - SEPARATE EFFECTS OF SODIUM AND ENERGY RESTRICTION. British Medical Journal, 1984. 288(6410): p. 11-14.
85. Fotherby, M.D. and J.F. Potter, EFFECTS OF MODERATE SODIUM RESTRICTION ON CLINIC AND 24-HOUR AMBULATORY BLOOD-PRESSURE IN ELDERLY HYPERTENSIVE SUBJECTS. Journal of Hypertension, 1993. 11(6): p. 657-663.
86. Grobbee, D.E., et al., SODIUM RESTRICTION AND POTASSIUM SUPPLEMENTATION IN YOUNG-PEOPLE WITH MILDLY ELEVATED BLOOD-PRESSURE. Journal of Hypertension, 1987. 5(1): p. 115-119.
87. He, F.J., et al., Effect of Modest Salt Reduction on Blood Pressure, Urinary Albumin, and Pulse Wave Velocity in White, Black, and Asian Mild Hypertensives. Hypertension, 2009. 54(3): p. 482-488.
88. Macgregor, G.A., et al., DOUBLE-BLIND RANDOMIZED CROSSOVER TRIAL OF MODERATE SODIUM RESTRICTION IN ESSENTIAL-HYPERTENSION. Lancet, 1982. 1(8268): p. 351-355.
89. Macgregor, G.A., et al., MODERATE SODIUM RESTRICTION WITH ANGIOTENSIN CONVERTING-ENZYME-INHIBITOR IN ESSENTIAL-HYPERTENSION - A DOUBLE-BLIND-STUDY. British Medical Journal, 1987. 294(6571): p. 531-534.
90. Meland, E. and A. Aamland, Salt restriction among hypertensive patients: Modest blood pressure effect and no adverse effects. Scandinavian Journal of Primary Health Care, 2009. 27(2): p. 97-103.
42

91. Meland, E., et al., Salt restriction: effects on lipids and insulin production in hypertensive patients. Scandinavian Journal of Clinical & Laboratory Investigation, 1997. 57(6): p. 501-505.
92. Melander, O., et al., Moderate salt restriction effectively lowers blood pressure and degree of salt sensitivity is related to baseline concentration of renin and N-terminal atrial natriuretic peptide in plasma. Journal of Hypertension, 2007. 25(3): p. 619-627.
93. Parijs, J., et al., MODERATE SODIUM RESTRICTION AND DIURETICS IN TREATMENT OF HYPERTENSION. American Heart Journal, 1973. 85(1): p. 22-34.
94. Puska, P., et al., CONTROLLED, RANDOMIZED TRIAL OF THE EFFECT OF DIETARY-FAT ON BLOOD-PRESSURE. Lancet, 1983. 1(8314): p. 1-5.
95. Redonmas, J., et al., ANTIHYPERTENSIVE ACTIVITY OF VERAPAMIL - IMPACT OF DIETARY-SODIUM. Journal of Hypertension, 1993. 11(6): p. 665-671.
96. Ruppert, M., et al., NEUROHORMONAL AND METABOLIC EFFECTS OF SEVERE AND MODERATE SALT RESTRICTION IN NONOBESE NORMOTENSIVE ADULTS. Journal of Hypertension, 1993. 11(7): p. 743-749.
97. Swift, P.A., et al., Modest salt reduction reduces blood pressure and urine protein excretion in black hypertensives - A randomized control trial. Hypertension, 2005. 46(2): p. 308-312.
98. Silman, A.J., et al., EVALUATION OF THE EFFECTIVENESS OF A LOW SODIUM DIET IN THE TREATMENT OF MILD TO MODERATE HYPERTENSION. Lancet, 1983. 1(8335): p. 1179-1182.
99. Watt, G.C.M., et al., DIETARY-SODIUM RESTRICTION FOR MILD HYPERTENSION IN GENERAL-PRACTICE. British Medical Journal, 1983. 286(6363): p. 432-436.
100. Watt, G.C.M., et al., DIETARY-SODIUM AND ARTERIAL BLOOD-PRESSURE - EVIDENCE AGAINST GENETIC SUSCEPTIBILITY. British Medical Journal, 1985. 291(6508): p. 1525-1528.
101. Suckling, R., et al., MODEST SALT REDUCTION LOWERS BLOOD PRESSURE AND URINARY ALBUMIN EXCRETION IN IMPAIRED GLUCOSE TOLERANCE AND TYPE 2 DIABETES. Journal of Hypertension, 2010. 28: p. E219-E219.
102. Schorr, U., A. Distler, and A.M. Sharma, Effect of sodium chloride- and sodium bicarbonate-rich mineral water on blood pressure and metabolic parameters in elderly normotensive individuals: A randomized double-blind crossover trial. Journal of Hypertension, 1996. 14(1): p. 131-135.
43
103. Singer, D.R.J., et al., SODIUM RESTRICTION IN HYPERTENSIVE PATIENTS TREATED WITH A CONVERTING-ENZYME-INHIBITOR AND A THIAZIDE. Hypertension, 1991. 17(6): p. 798-803.
104. Appel, L.J., et al., Effects of reduced sodium intake on hypertension control in older individuals - Results from the trial of nonpharmacologic interventions in the elderly (TONE). Archives of Internal Medicine, 2001. 161(5): p. 685-693.
105. Dubbert, P.M., et al., EFFECTS OF DIETARY INSTRUCTION AND SODIUM-EXCRETION FEEDBACK IN HYPERTENSION CLINIC PATIENTS. Behavior Therapy, 1995. 26(4): p. 721-732.
106. Gates, P.E., et al., Dietary sodium restriction rapidly improves large elastic artery compliance in older adults with systolic hypertension. Hypertension, 2004. 44(1): p. 35-41.
107. Mascioli, S., et al., SODIUM-CHLORIDE RAISES BLOOD-PRESSURE IN NORMOTENSIVE SUBJECTS - THE STUDY OF SODIUM AND BLOOD-PRESSURE. Hypertension, 1991. 17(1): p. I21-I26.
108. Maxwell, M.H., et al., BP CHANGES IN OBESE HYPERTENSIVE SUBJECTS DURING RAPID WEIGHT-LOSS - COMPARISON OF RESTRICTED-UPSILON UNCHANGED SALT INTAKE. Archives of Internal Medicine, 1984. 144(8): p. 1581-1584.
109. McCarron, D.A., et al., Blood pressure and metabolic responses to moderate sodium restriction in isradipine-treated hypertensive patients. American Journal of Hypertension, 1997. 10(1): p. 68-76.
110. Whelton, P.K., et al., THE EFFECTS OF NONPHARMACOLOGIC INTERVENTIONS ON BLOOD-PRESSURE OF PERSONS WITH HIGH NORMAL LEVELS - RESULTS OF THE TRIALS OF HYPERTENSION PREVENTION, PHASE-I. Jama-Journal of the American Medical Association, 1992. 267(9): p. 1213-1220.
111. Whelton, P.K., et al., Effects of weight loss and sodium reduction intervention on blood pressure and hypertension incidence in overweight people with high-normal blood pressure - The trials of hypertension prevention, phase II. Archives of Internal Medicine, 1997. 157(6): p. 657-667.
112. Weir, M.R., et al., Effects of High- and Low-Sodium Diets on Ambulatory Blood Pressure in Patients With Hypertension Receiving Aliskiren. Journal of Cardiovascular Pharmacology and Therapeutics, 2010. 15(4): p. 356-363.
113. van Berge-Landry, H. and G.D. James, Serum electrolyte, serum protein, serum fat and renal responses to a dietary sodium challenge: Allostasis and allostatic load. Annals of Human Biology, 2004. 31(4): p. 477-487.
44

114. Fotherby, M.D. and J.F. Potter, Metabolic and orthostatic blood pressure responses to a low-sodium diet in elderly hypertensives. Journal of Human Hypertension, 1997. 11(6): p. 361-366.
115. Harsha, D.W., et al., Effect of dietary sodium intake on blood lipids - Results from the DASH-Sodium trial. Hypertension, 2004. 43(2): p. 393-398.
116. He, F. and G. MacGregor, Effect of longer-term modest salt reduction on blood pressure. Cochrane Database of Systematic Reviews, 2004(1).
117. European Food Safety Authority, Tolerable Upper Limit Intake Levels for Vitamins and Minerals. 2006.
118. Uenishi, K., et al., Dietary Reference Intakes for Japanese 2010: Macrominerals (vol 59, pg S83, 2013). Journal of Nutritional Science and Vitaminology, 2013. 59(2): p. 159-159.
119. National Health and Medical Research Council, Nutrient Reference Values for Australia and New Zealand. 2006, Department of Health and Ageing.
120. Webster, J., et al., Measuring Australian salt intakes. Published abstract for High Blood Pressure Research Council 2008 Annual Scientific Meeting, November 2008.
121. Keogh, J.B., et al., Foods contributing to sodium intake and urinary sodium excretion in a group of Australian women. Public Health Nutr, 2013. 16(10): p. 1837-42.
122. Land, M.-A., et al., Correlation of salt intake with knowledge, attitudes and behaviours in Australian Adults, in The Future of Cardiovascular Protection, Journal of Hypertension, Editor. 2012: Sydney Conference and Exhibition Centre (30 September – 4 October 2012).
123. Skeaff, S.A., et al., The Impact of Mandatory Fortification of Bread with Iodine, in MPI Technical Paper No: 2013/025. 2013, Ministry of Primary Industries: Wellington.
124. McLean, R., et al. How much sodium are we eating? Estimates of New Zealand population sodium intake from the 2008/2009 Adult Nutrition Survey. in Joint Annual Scientific Meeting of the Nutrition Society of New Zealand and the Nutrition Society of Australia. 2011. Queenstown: Nutrition Society of Australia.
125. Thomson, C.D. and A.J. Colls, Twenty-four Hour Urinary Sodium Excretion in Seven Hundred Residents of Otago and Waikato. 1998, University of Otago: Dunedin.
126. Simpson, F.O., et al., The Milton survey: Part 1, General methods, height, weight and 24-hour excretion of sodium, potassium, calcium, magnesium and creatinine. New Zealand Medical Journal, 1978. 87(613): p. 379-82.
127. Australian Bureau of Statistics, 4364.0.55.007 - Australian Health Survey: Nutrition First Results - Foods and Nutrients, 2011-12. 2014: Canberra.
45
128. Gwynn, J.D., et al., Poor food and nutrient intake among Indigenous and non-Indigenous rural Australian children. Bmc Pediatrics, 2012. 12.
129. Thomson, B.M., Nutritional modelling: distributions of salt intake from processed foods in New Zealand. British Journal of Nutrition, 2009. doi:10.1017/S000711450928901X.
130. Ministry of Health and the University of Auckland, Nutrition and the Burden of Disease: New Zealand 1997-2011. 2003, Ministry of Health Wellington.
131. New Zealand Food Safety Authority, 2003/04 New Zealand Total Diet Survey: Agricultural Compound Residues, Selected Contaminants and Nutrients. 2005, New Zealand Food Safety Authority: Wellington.
132. Gorton, D., N. Jayasinha, and D. Monro, Salt reduction in New Zealand: are we keeping up with Australia. New Zealand Medical Journal, 2010. 123(1313): p. 102-104.
46