augustin vintzileos - university of marylandaugustin vintzileos university of maryland –...
TRANSCRIPT

Enhancing Resilience to Heat Extremes: Forecasting Excessive Heat Events at Subseasonal Lead Times (Week-2 to 4)
Augustin Vintzileos University of Maryland – ESSIC/CICS
and Jon Gottschalck, Mike Halpert, Adam Allgood
NOAA/NWS/NCEP/CPC
This study is supported by NOAA grants: NA15OAR4310081 NA14NES4320003 NA16OAR4310147

Outline: • Defining Heat Events • Monitoring/Forecasting Heat Events • Preliminary forecast verification & multi-model approaches
• Realtime forecasting during summer 2016 • Summary and ongoing work

Heat kills: Excessive Heat results to more fatalities than any other atmospheric hazard:
From 1986 to 2015 the annual mean fatalities over the United States: Heat = 130 Flood = 81 Tornado = 70 Lightning = 48 Hurricane = 46
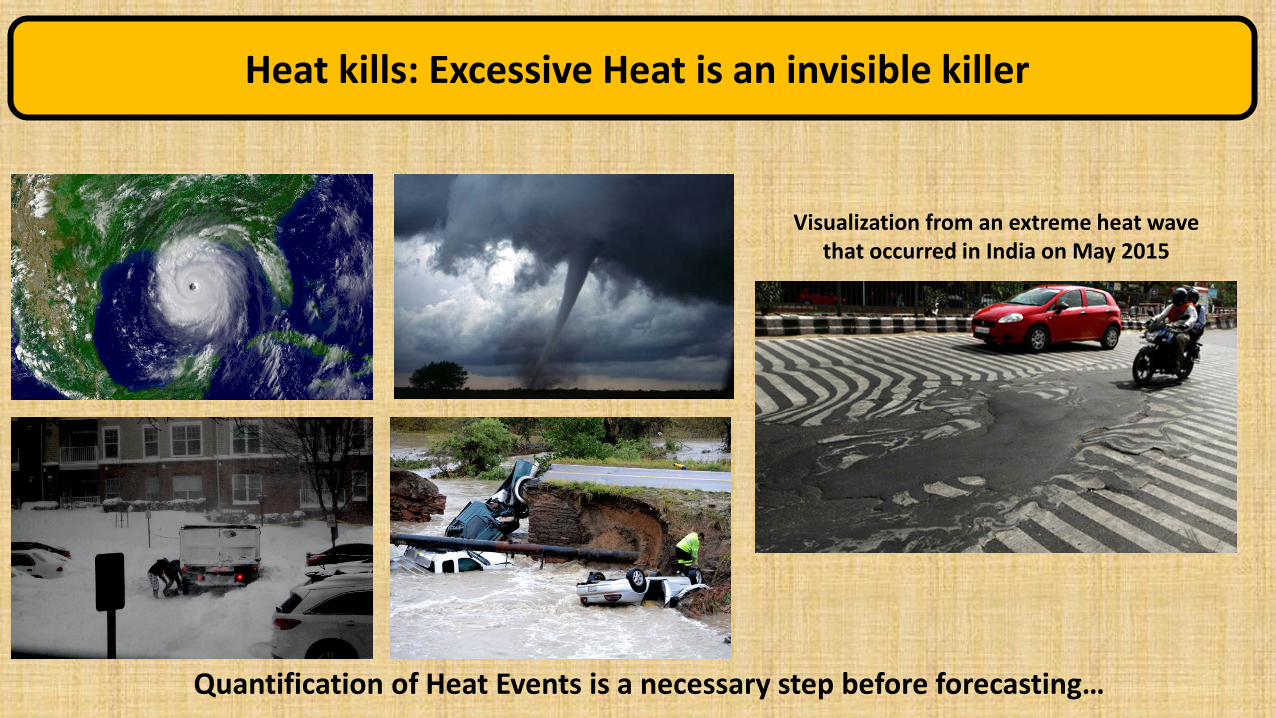
Quantification of Heat Events is a necessary step before forecasting…
Visualization from an extreme heat wave that occurred in India on May 2015
Heat kills: Excessive Heat is an invisible killer

Heat kills: The example of the July 1995 Heat Event
From the NOAA study of the event (published December 1995)
The Corn Belt

The Chicago July 1995 event (METAR from O’Hare airport; mortality courtesy of Sheridan)
Heat Index
Dry Temperature and
Dew point 77°F
119°F
3.5 days 90°F
Abnormal Mortality
Dry temperature anomalies were high but within the 35-40°C range. However the dew point was very elevated
The resulting Heat Index remained over 90°F for over 3 days with maximum reaching 119°F (49°C !!)
Abnormal mortality started increasing at the beginning of the heatwave reaching a maximum 2.5 days after

Excessive Heat Warning URGENT - WEATHER MESSAGE NATIONAL WEATHER SERVICE LAS VEGAS NV 346 AM PDT WED JUN 1 2016 ...EXCESSIVE HEAT WARNING REMAINS IN EFFECT FROM 10 AM PDT /10 AM MST/ FRIDAY TO 8 PM PDT /8 PM MST/ SUNDAY... * TEMPERATURE...HIGHS WILL BE 105 TO 110 IN LAS VEGAS AND FOR MUCH OF THE MOJAVE DESERT...110 TO 117 IN THE COLORADO RIVER VALLEY... AND 115 TO 121 IN DEATH VALLEY. LOWS WILL GENERALLY BE 75 TO 85.
Portland, Oregon 2 consecutive days Max: 95F-105F Min: 55F-65F Excessive Heat Warning URGENT - WEATHER MESSAGE NATIONAL WEATHER SERVICE PORTLAND OR 509 AM PDT THU AUG 18 2016 ...EXCESSIVE HEAT WARNING REMAINS IN EFFECT FROM 2 PM THIS AFTERNOON TO 9 PM PDT SATURDAY • TIMING: THURSDAY AFTERNOON THROUGH
SATURDAY EVENING...WITH FRIDAY BEING THE HOTTEST OF THE THREE DAYS.
* HIGH TEMPERATURE: FROM 95 TO 105. * LOW TEMPERATURE: UPPER 50S TO UPPER 60S.
Las Vegas, Nevada 2 consecutive days Max: 115F-121F Min: 75-85
Heat kills: Heat warnings depend on the geographical location
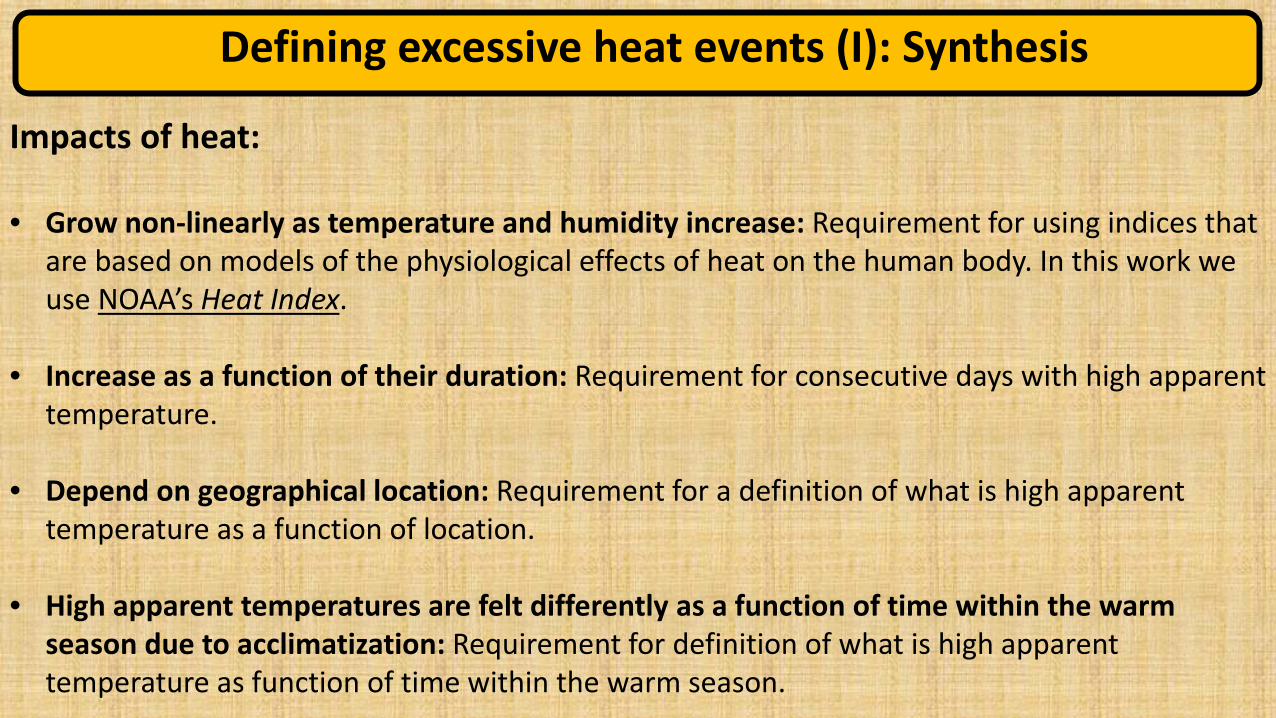
Impacts of heat: • Grow non-linearly as temperature and humidity increase: Requirement for using indices that
are based on models of the physiological effects of heat on the human body. In this work we use NOAA’s Heat Index.
• Increase as a function of their duration: Requirement for consecutive days with high apparent temperature.
• Depend on geographical location: Requirement for a definition of what is high apparent
temperature as a function of location.
• High apparent temperatures are felt differently as a function of time within the warm season due to acclimatization: Requirement for definition of what is high apparent temperature as function of time within the warm season.
Defining excessive heat events (I): Synthesis
Heat event
Normal day
Heat day
Heat day
Heat day
Normal day
Normal day
Normal day
No heat event
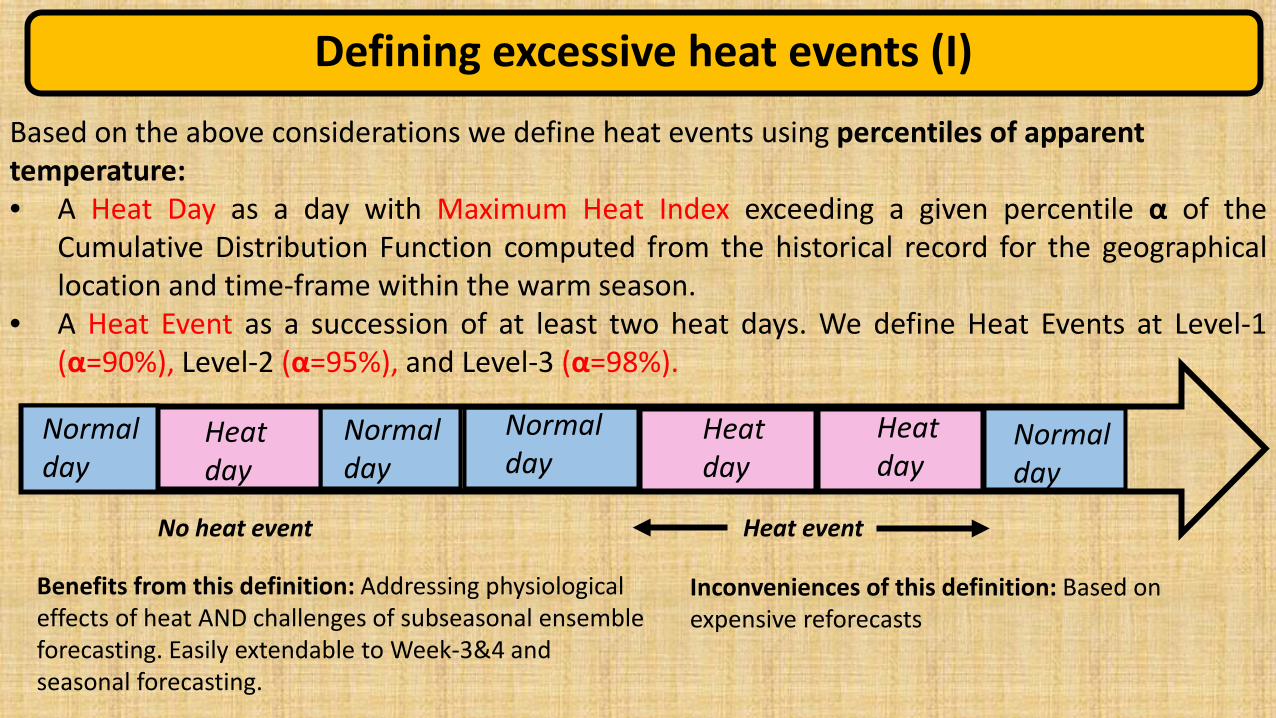
Based on the above considerations we define heat events using percentiles of apparent temperature: • A Heat Day as a day with Maximum Heat Index exceeding a given percentile α of the
Cumulative Distribution Function computed from the historical record for the geographical location and time-frame within the warm season.
• A Heat Event as a succession of at least two heat days. We define Heat Events at Level-1 (α=90%), Level-2 (α=95%), and Level-3 (α=98%).
Defining excessive heat events (I)
Benefits from this definition: Addressing physiological effects of heat AND challenges of subseasonal ensemble forecasting. Easily extendable to Week-3&4 and seasonal forecasting.
Inconveniences of this definition: Based on expensive reforecasts

Weekly Heat Events. For each grid point: • A given week is a Heat Week if it contains at least one Heat Event. • We can define a start day of the heat event within this week • We can define the duration of this heat event.
Example: The July 1995 Heat Event • During the week of 11-17 July 1995 a Level-3 Heat Event (98% -
yellow) was covering an extended area from the Upper Midwest to the Northeast and Mid-Atlantic.
• This heat event progressed from west to east during this week. • The event lasted 5 days (for Level-1 intensity) in the Chicago area.
Defining excessive heat events based on Reanalysis (CDAS)
90%
95%
98%
Occurrence
Start day (90%)
Duration (90%)
Description of the July 1995 Heat Event
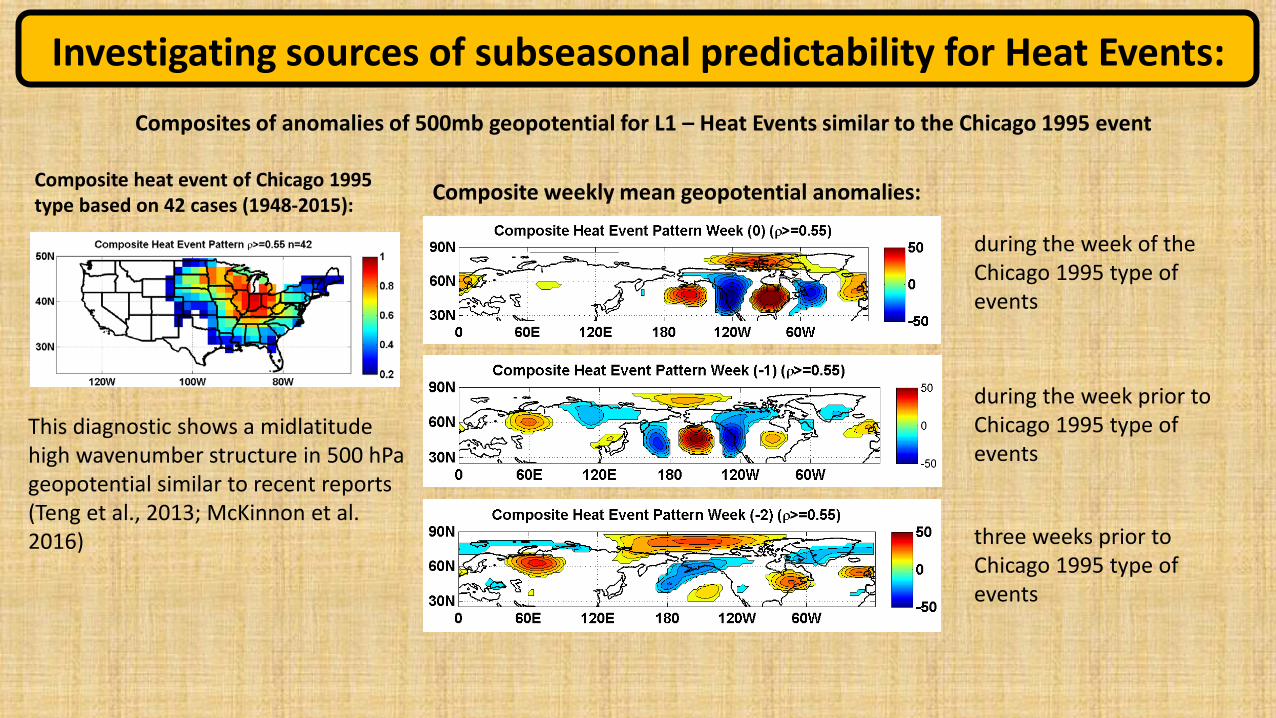
Composite heat event of Chicago 1995 type based on 42 cases (1948-2015):
Investigating sources of subseasonal predictability for Heat Events:
Composite weekly mean geopotential anomalies:
during the week prior to Chicago 1995 type of events
three weeks prior to Chicago 1995 type of events
during the week of the Chicago 1995 type of events
Composites of anomalies of 500mb geopotential for L1 – Heat Events similar to the Chicago 1995 event
This diagnostic shows a midlatitude high wavenumber structure in 500 hPa geopotential similar to recent reports (Teng et al., 2013; McKinnon et al. 2016)
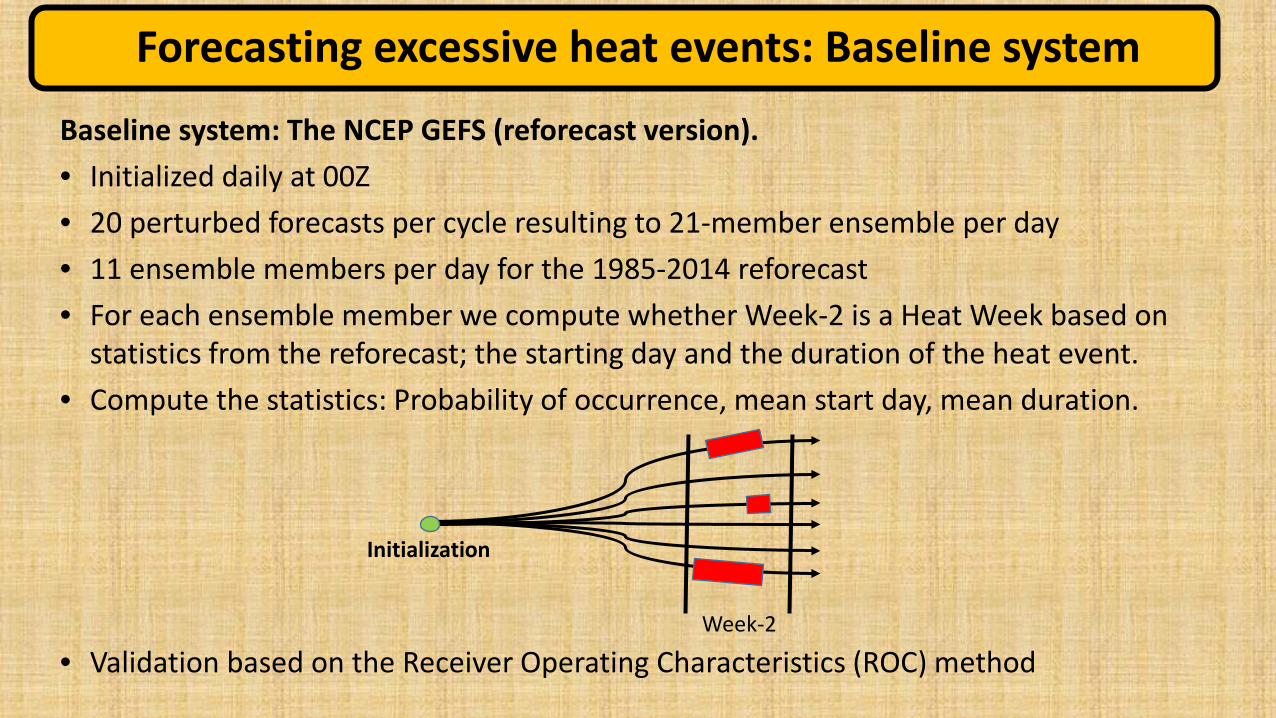
Baseline system: The NCEP GEFS (reforecast version). • Initialized daily at 00Z • 20 perturbed forecasts per cycle resulting to 21-member ensemble per day • 11 ensemble members per day for the 1985-2014 reforecast • For each ensemble member we compute whether Week-2 is a Heat Week based on
statistics from the reforecast; the starting day and the duration of the heat event. • Compute the statistics: Probability of occurrence, mean start day, mean duration.
Forecasting excessive heat events: Baseline system
Week-2
Initialization
• Validation based on the Receiver Operating Characteristics (ROC) method

Multi-model Ensemble forecasts: ROC Area Under Curve for 90% – events Week-3 Week-2 Week~1
Multi-Model Ensemble Forecasting
of Heat Events
GEFS
ECMWF
CFS
GEFS +
ECMWF
ECMWF
ECMWF
CFS
CFS +
ECMWF
No Week-3 GEFS (for the moment)
GEFS
CFS
GEFS
We have not compute AUC for
Week-1
We have not compute AUC for
Week-1

The subseasonal excessive heat outlook (SEHOS) dashboard
During Summer 2016 we were providing daily realtime forecasts to CPC forecasters:
• Anomalous weekly mean maximum heat index • Controllable projection to categorical forecast for two classes (90% and 95%) • Probabilities (calibrated and raw) of occurrence of a heat event within a given week • Climatological value of the heat index for the two classes of heat events during the given week • Date of initiation of the event • Duration of the event
Example: Week-2 ending 27 July 2016
Categorical forecast
Weekly mean heat index anomaly
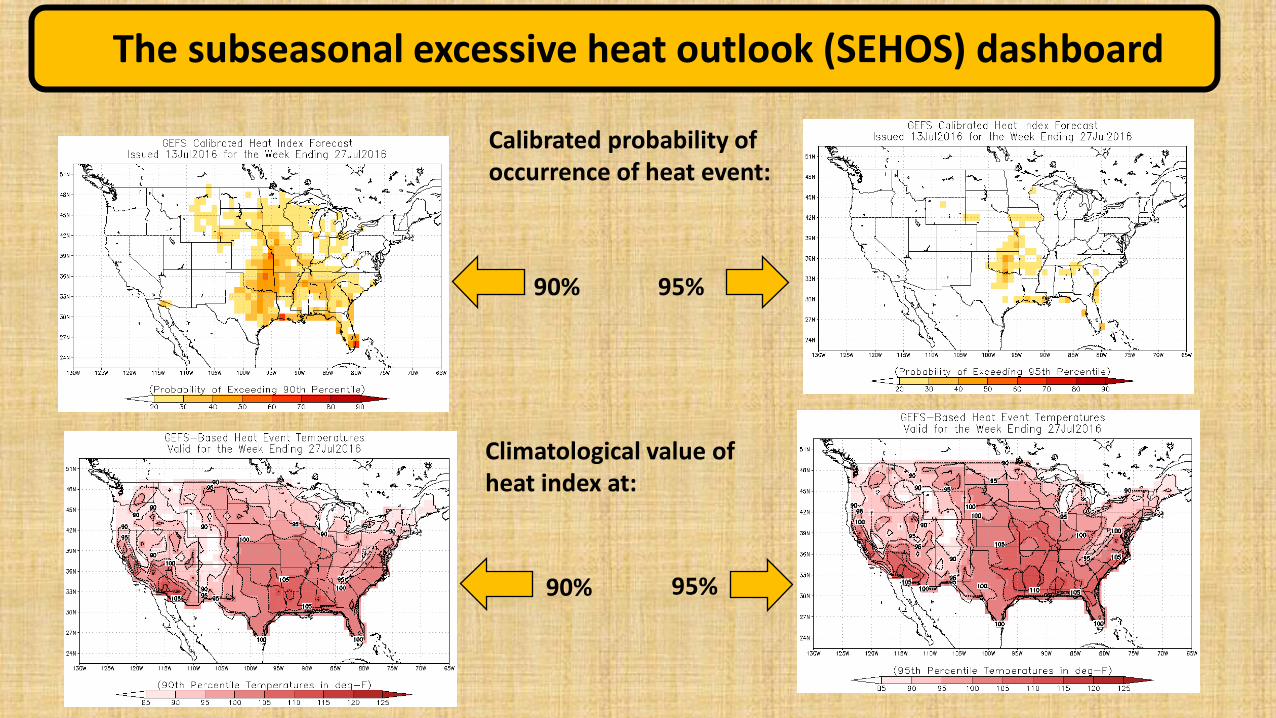
The subseasonal excessive heat outlook (SEHOS) dashboard
Calibrated probability of occurrence of heat event:
90%
95%
Climatological value of heat index at:
90%
95%

The subseasonal excessive heat outlook (SEHOS) dashboard
Initial day of heat event:
90%
95%
Duration of heat event
90%
95%

Summary and R&D directions
• We defined excessive heat events and used them to describe observed heatwaves e.g., Chicago 1995.
• We computed predictive skill of excessive heat events using retrospective forecasts
from the S2S database.
• Excessive heat events are predictable in Week-2 and to a lesser amount in Week-3. Multi-model approaches are promising.
• We conducted daily realtime forecasts accessible to the CPC forecaster during Summer 2016 and currently we are evaluating the forecast skill for each of the observed event.

Understand the physics of heatwaves: • What are the forcing mechanisms for the high wave-
number Rossby waves? • Under what circumstances these waves become
stationary? • What are the mechanisms that dissipate these waves • What are pre-existing conditions at the surface that
can amplify or damp the atmospheric forcing?
Summary and R&D directions
Proposal submitted to the NSF jointly by UMD/ESSIC, GMU/COLA and ODU (leading institution: UMD)

Summary and R&D directions
• Create a comprehensive monitoring system by combining METAR, VTEC warnings/advisories and reanalysis data
• Identify more complex yet still predictable definitions of heat discomfort
VTEC
Summary and R&D directions
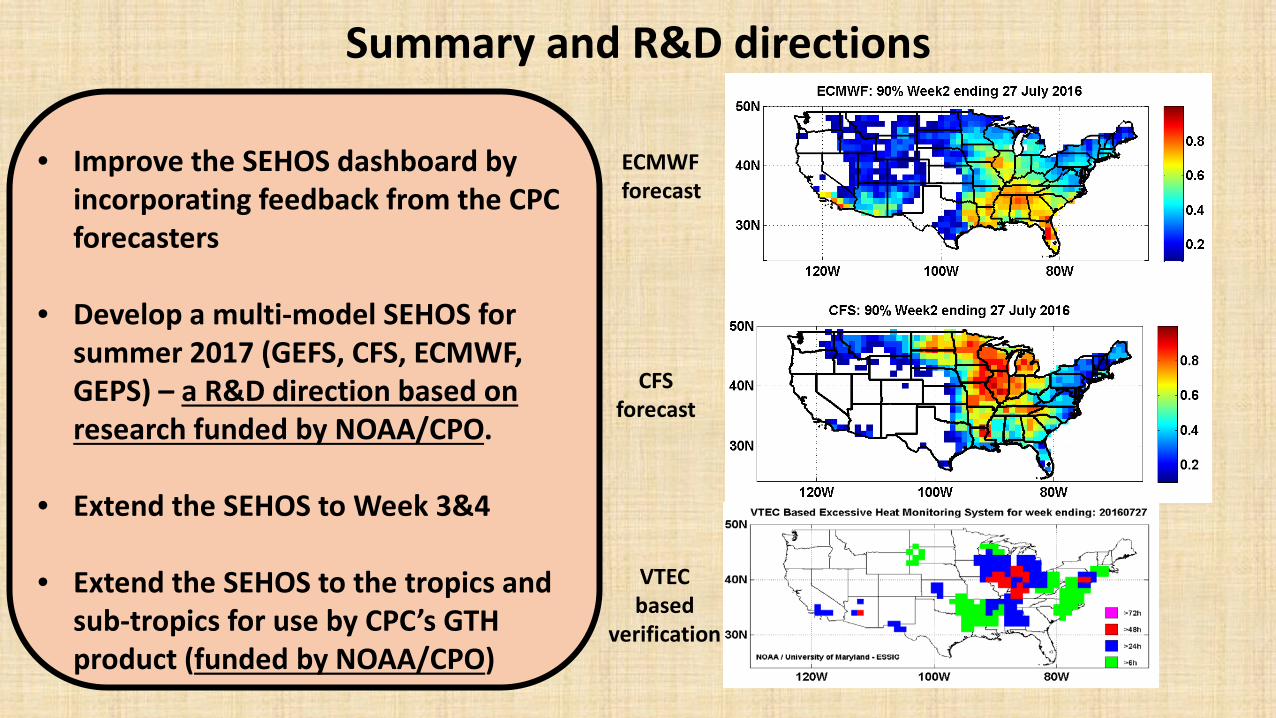
• Improve the SEHOS dashboard by incorporating feedback from the CPC forecasters
• Develop a multi-model SEHOS for summer 2017 (GEFS, CFS, ECMWF, GEPS) – a R&D direction based on research funded by NOAA/CPO.
• Extend the SEHOS to Week 3&4
• Extend the SEHOS to the tropics and
sub-tropics for use by CPC’s GTH product (funded by NOAA/CPO)
ECMWF forecast
CFS forecast
VTEC based
verification

The National Integrated Heat Health Information System (NIHHIS): a) inform research priorities
b) inform decisions with better climate and health information
Climate Prediction Center (CPC): Probabilistic Hazards products Week-2, extending experimentally to Week 3&4
Subseasonal Excessive Heat Outlook (SEHOS):
Regional and International Pilots cultivate an understanding of decision-making contexts

Questions: [email protected]
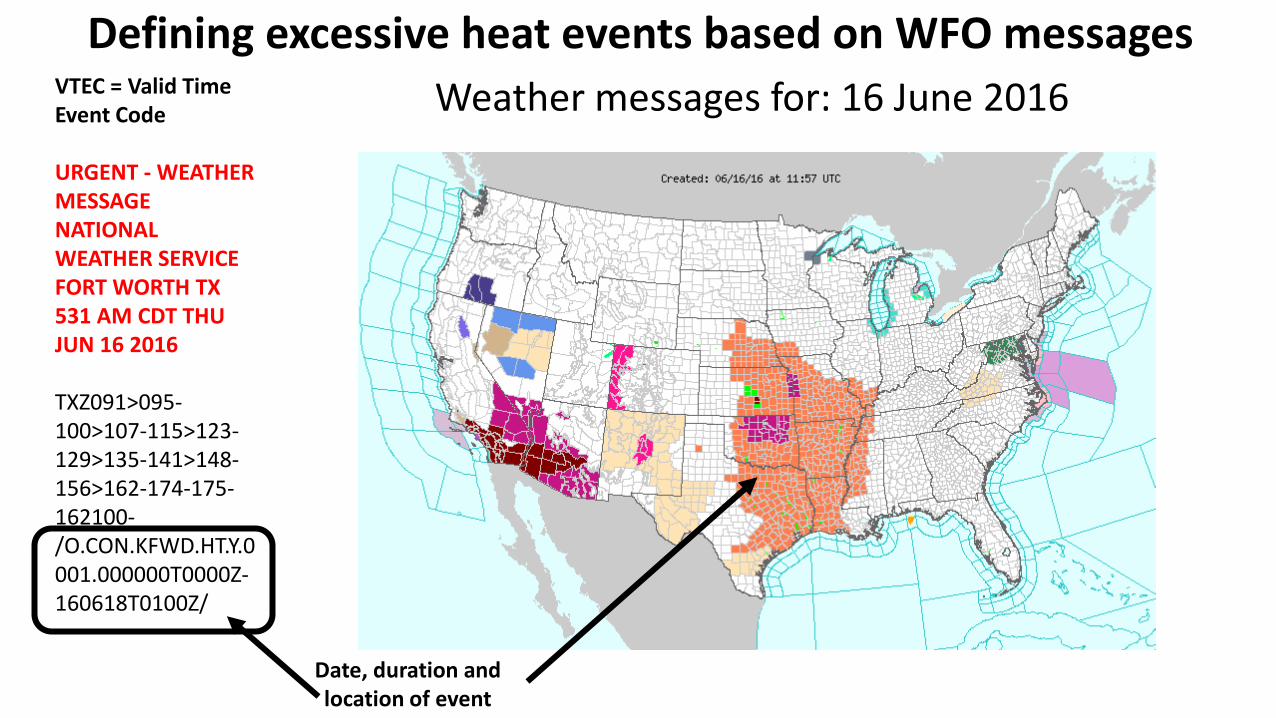
Weather messages for: 16 June 2016 VTEC = Valid Time Event Code URGENT - WEATHER MESSAGE NATIONAL WEATHER SERVICE FORT WORTH TX 531 AM CDT THU JUN 16 2016 TXZ091>095-100>107-115>123-129>135-141>148-156>162-174-175-162100- /O.CON.KFWD.HT.Y.0001.000000T0000Z-160618T0100Z/
Date, duration and location of event
Defining excessive heat events based on WFO messages
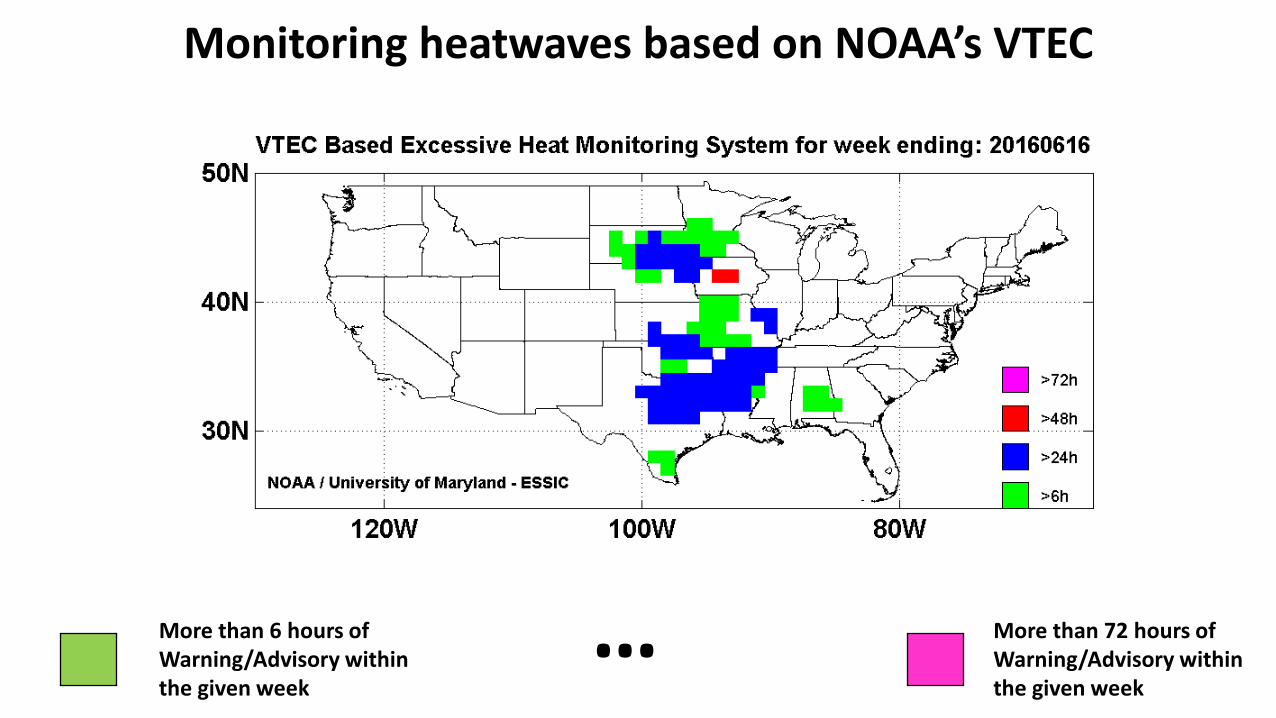
Monitoring heatwaves based on NOAA’s VTEC
More than 6 hours of Warning/Advisory within the given week
More than 72 hours of Warning/Advisory within the given week
…

Week-2 Probability (uncalibrated) for a 90% heat event
VTEC
ECMWF
CFS
GEFS
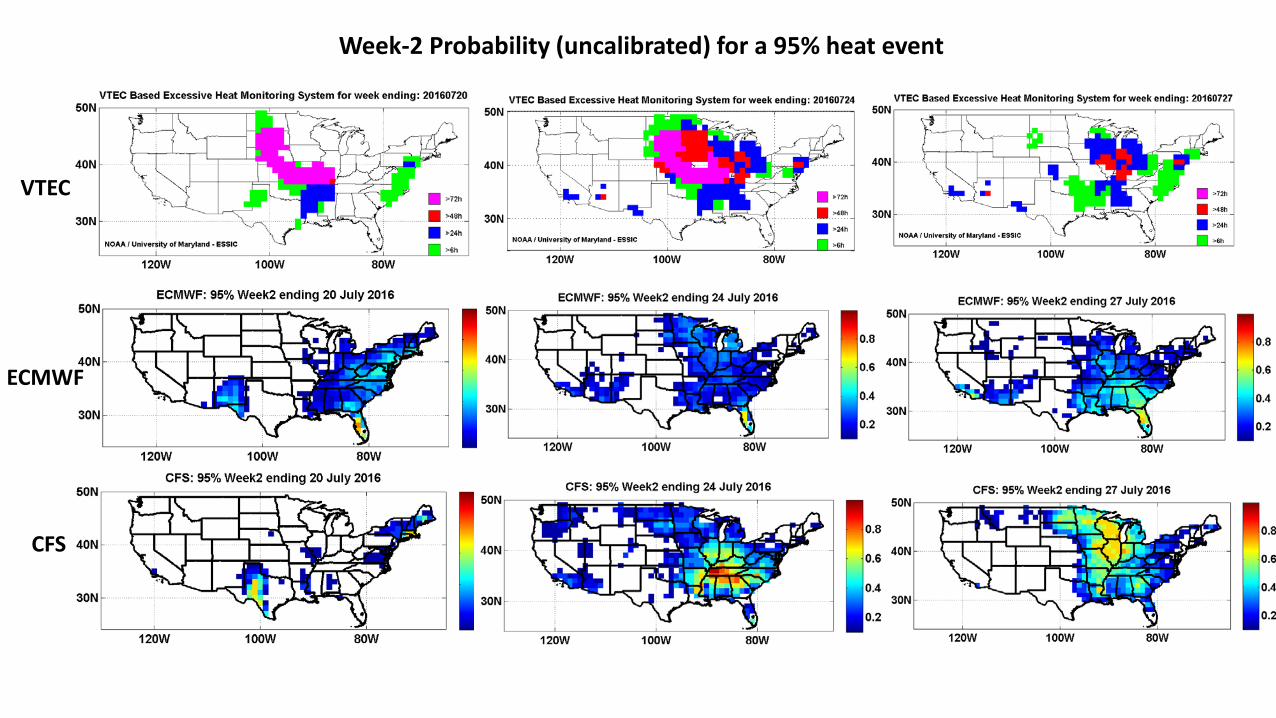
Week-2 Probability (uncalibrated) for a 95% heat event
VTEC
ECMWF
CFS
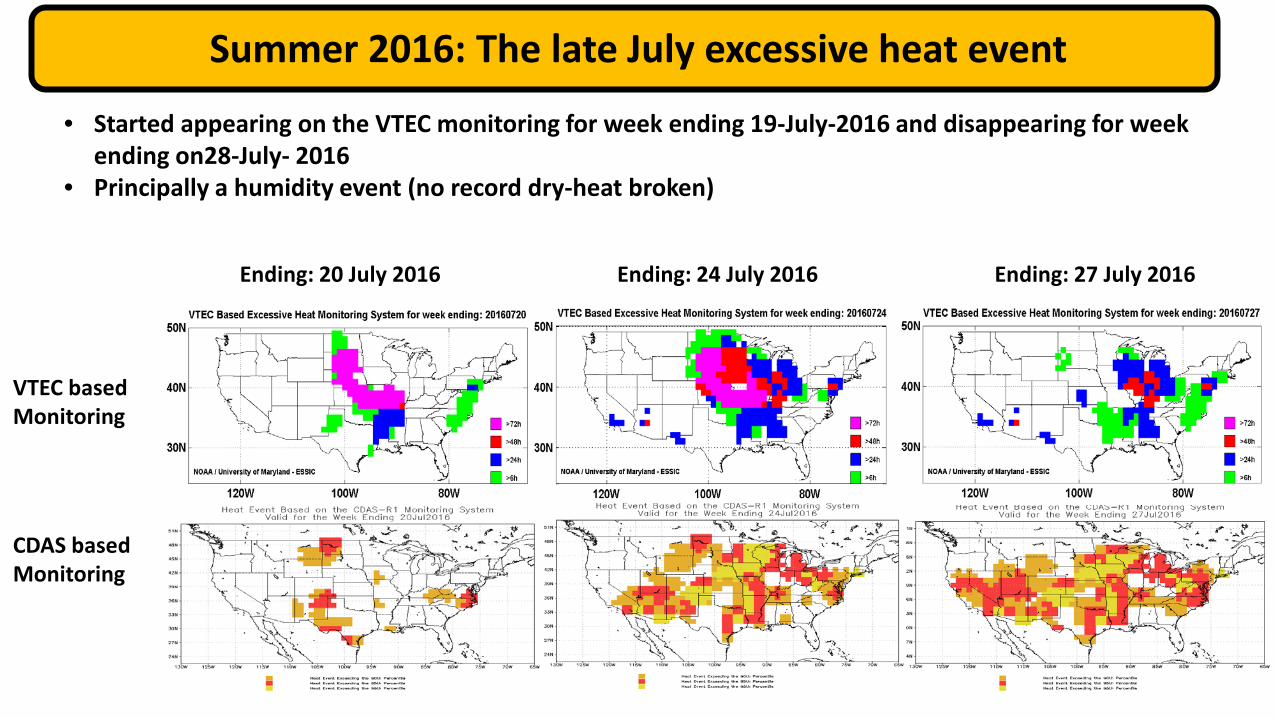
• Started appearing on the VTEC monitoring for week ending 19-July-2016 and disappearing for week ending on28-July- 2016
• Principally a humidity event (no record dry-heat broken)
VTEC based Monitoring
CDAS based Monitoring
Summer 2016: The late July excessive heat event
Ending: 20 July 2016 Ending: 24 July 2016 Ending: 27 July 2016

Heat Exhaustion
Heat Syncope
Heat Stroke
It occurs when the body becomes unable to control its temperature: the body's temperature rises rapidly, the sweating mechanism fails, and the body is unable to cool down. When heat stroke occurs, the body temperature can rise to 106°F or higher within 10 to 15 minutes. Heat stroke can cause death or permanent disability if emergency treatment is not given.
Rhabdomyolysis
Heat Cramps
Heat Rash
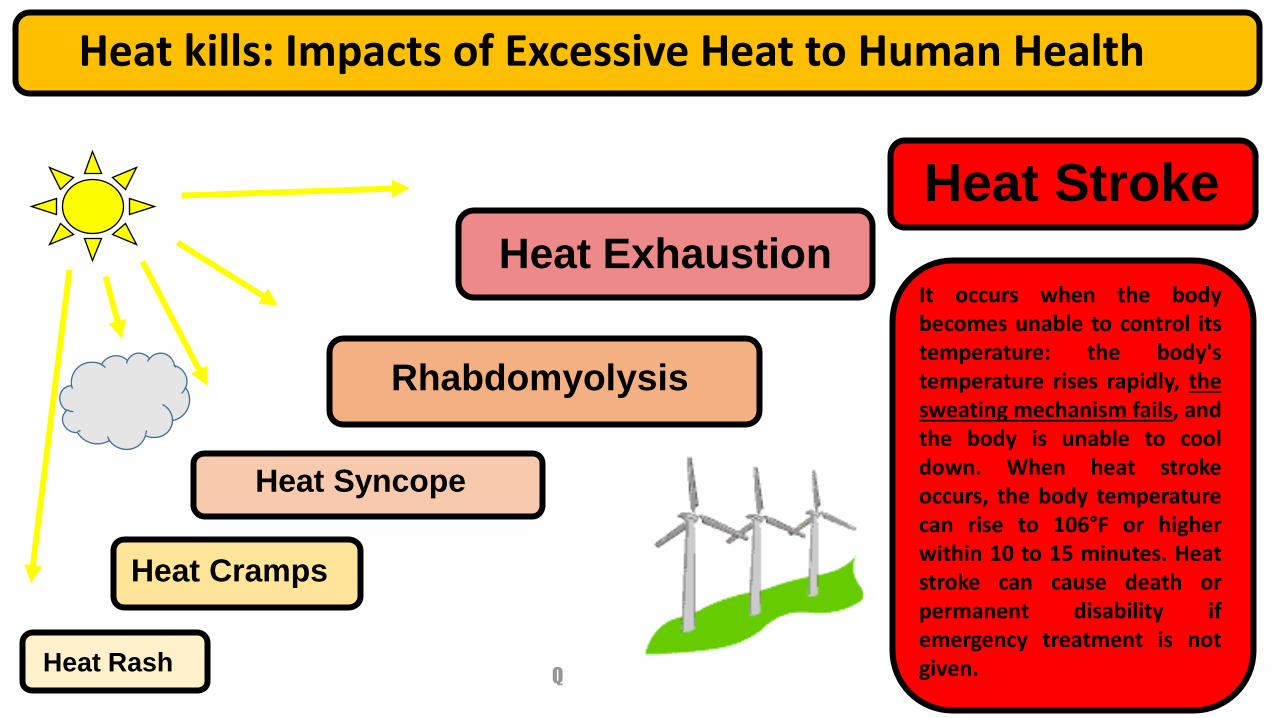
Heat kills: Impacts of Excessive Heat to Human Health

Heat Exhaustion
Heat Syncope
Heat Stroke
It occurs when the body becomes unable to control its temperature: the body's temperature rises rapidly, the sweating mechanism fails, and the body is unable to cool down. When heat stroke occurs, the body temperature can rise to 106°F or higher within 10 to 15 minutes. Heat stroke can cause death or permanent disability if emergency treatment is not given.
Rhabdomyolysis
Heat Cramps
Heat Rash
Heat kills: Impacts of Excessive Heat to Human Health
• Human physiology
• Geographical location
• Urban effect • Preparedness • Age
• Health status
• Socio-economic factors
• Cultural factors