augmenting growth engines - sun pharma pharma annual... · report focuses on the theme of...
TRANSCRIPT

2 0 1 6 - 2 0 1 7
A U G M E N T I N G
G R O W T H
E N G I N E S
R e a c h i n g P e o p l e . T o u c h i n g L i v e s .
SUN PHARMACEUTICAL INDUSTRIES LTD.

CONTENTS02Key Performance Indicators
08Management Discussion and Analysis
80Standalone Financial Statements
03Ten Year Financial Highlights
32Board’s Report
170Consolidated Financial Statements
04Managing Director’s Letter
62Corporate Governance
The cover design of this year’s annual report focuses on the theme of ‘Augmenting Growth Engines’. It takes an abstract approach to illustrating multifaceted connections that come together to drive growth, which is representative of multiple growth engines.
2 0 1 6 - 2 0 1 7
A U G M E N T I N G
G R O W T H
E N G I N E S
R e a c h i n g P e o p l e . T o u c h i n g L i v e s .
SUN PHARMACEUTICAL INDUSTRIES LTD.

FINANCIAL STATEMENTSCORPORATE OVERVIEW 80-27800-00
1A N N UA L R E P O RT 2 0 1 6 - 1 7
01-07 STATUTORY REPORTS 08-79
At Sun Pharma, we have consistently
focused on augmenting the long-term
growth drivers for the Company. As a
part of this approach, we have added
another growth engine to our business -
the specialty business – which is gradually
evolving for us. This is besides our existing
growth engines of the generics and branded
generics businesses.
During the year, we enhanced our R&D
investments for developing complex
generics and specialty products. These
strategic investments will enable us to move
up the pharmaceutical value chain. We are
also investing in enhancing our product
pipeline for emerging markets and other
non-US developed markets.
We also continued to build our specialty
pipeline; and invested in developing the
requisite front-end for the US specialty
business.
We are undergoing a gradual transformation
as we continue to invest in enhancing our
global specialty and complex generics
pipeline. These investments will enable
us to augment long-term growth avenues
for future.
At the same time, we have ensured that our
patients remain at the centre point of all our
strategic initiatives. Our existing business
of generics and branded generics is an
integral part of the solution to lower global
healthcare costs. Our specialty strategy
focuses on improving patient outcomes
either by targeting unmet medical needs or
by enhancing patient convenience through
differentiated dosage forms
WE ARE NOT JUST COMMITTED TO AUGMENTING OUR GROWTH AVENUES, PATIENT CARE REMAINS AT THE CORE OF OUR STRATEGY.

S U N P H A R M A C E U T I C A L I N D U S T R I E S L I M I T E D2
KEY PERFORMANCEINDICATORS (CONSOLIDATED)
TOTAL INCOME (` in Million)
35,0
17
44,8
08
42,1
23
60,8
27
84,9
10 116,
880
166,
326
279,
397
291,
453
322,
016
FY08
FY09
FY10
FY11
FY12
FY13
FY14
FY15
FY16
FY17
R&D INVESTMENTS (` in Million)
2,85
9
3,32
0
2,24
2
3,31
3
4,44
9
7,04
2 10,4
18
19,5
50 23,0
25
23,1
38
FY08
FY09
FY10
FY11
FY12
FY13
FY14
FY15
FY16
FY17
NET PROFIT AFTER MINORITY INTEREST(` in Million)
FY08
FY09
FY10
FY11
FY12
FY13
FY14
FY15
FY16
FY17
15,5
09
18,7
80
13,4
70
18,1
61 26,5
67
29,8
31
31,
415
45,3
94
45,
457
69,
644
FY08
FY09
FY10
FY11
FY12
FY13
FY14
FY15
FY16
FY17
RESERVE & SURPLUS (` in Million)
48,8
79
69,4
14
77,2
54
93,7
98
121,
322
148,
862
183
,178 27
8,00
9 327
,418
363,
997
CARRYING VALUE OF PROPERTY, PLANT & EQUIPMENT AND OTHER INTANGIBLE ASSETS (` in Million)
FY08
FY09
FY10
FY11
FY12
FY13
FY14
FY15
FY16
FY17
10,3
54
14,6
25
15,3
28
25,2
14
29,2
95 45,1
45
49,
827
96,8
48
124,
130
149,
404
* During FY11, each equity share of ` 5/- was split into five equity shares of ` 1/- each. * During FY14, the Company issued bonus shares in the ratio of one equity share of ` 1/- for every share held. * During FY15, the Company’s equity shares have increased to 2,406 Million due to the merger of erstwhile Ranbaxy Laboratories Ltd. (RLL) with the Company,
wherein 0.80 equity share of ` 1 each of the Company have been allotted to the shareholders of RLL for every 1.00 share of ` 5 each held by them.
The Company has adopted Ind-AS accounting standards with effect from 1st April, 2015. Hence, FY16 onwards, the financials are reported as per Ind-AS and are not strictly comparable with previous years. For FY15, balance sheet items are as per Ind-AS.
FY08
FY09
FY10
FY11
FY12
FY13
FY14
FY15
FY16
FY17
ADJUSTED EARNING PER SHARE (POST EXCEPTIONAL ITEMS)* (` per share)
6.4 7.
8
5.6 7.
5
11.0
12.4
13.1
18.9
18.9
29.0

FINANCIAL STATEMENTSCORPORATE OVERVIEW 80-27800-00
3A N N UA L R E P O RT 2 0 1 6 - 1 7
01-07 STATUTORY REPORTS 08-79
TEN YEAR FINANCIAL HIGHLIGHTS
* During FY11, each equity share of ` 5/- was split into five equity shares of ` 1/- each. * During FY14, the Company issued bonus shares in the ratio of one equity share of ` 1/- for every share held. * During FY15, the Company’s equity shares have increased to 2,406 Million due to the merger of erstwhile Ranbaxy Laboratories Ltd. (RLL) with the Company,
wherein 0.80 equity share of ` 1 each of the Company have been allotted to the shareholders of RLL for every 1.00 share of ` 5 each held by them.
The Company has adopted Ind-AS accounting standards with effect from 1st April, 2015. Hence, FY16 onwards, the financials are reported as per Ind-AS and are not strictly comparable with previous years. For FY15, balance sheet items are as per Ind-AS.
CONSOLIDATED ` in Million
Particular FY08 FY09 FY10 FY11 FY12 FY13 FY14 FY15 FY16 FY17
Operating Performance
Revenue from Operations 34,606 43,751 38,086 57,279 80,195 112,999 160,804 273,920 284,870 315,784
Total Income 35,017 44,808 42,123 60,827 84,910 116,880 166,326 279,397 291,453 322,016
Profit for the year (after minority interest)
15,509 18,780 13,470 18,161 26,567 29,831 31,415 45,394 45,457 69,644
R&D Expenditure 2,859 3,320 2,242 3,313 4,449 7,042 10,418 19,550 23,025 23,138
a) Capital 134 222 159 236 362 427 556 1,178 783 1,679
b) Revenue (Excluding Depreciation)
2,725 3,098 2,083 3,077 4,088 6,616 9,862 18,373 22,242 21,459
c) % of Turnover 9% 8% 6% 6% 6% 6% 7% 7% 8% 8%
Financial Position
Equity Share Capital 1,036 1,036 1,036 1,036 1,036 1,036 2,071 2,071 2,407 2,399
Reserve and Surplus 48,879 69,414 77,254 93,798 121,322 148,862 183,178 278,009 327,418 363,997
Property, Plant & Equipment and other Intangible assets (at cost/ deemed cost)
15,960 21,476 23,340 45,473 54,269 75,763 86,505 143,616 187,212 217,315
Carrying value of Property, Plant & Equipment and other Intangible assets
10,354 14,625 15,328 25,214 29,295 45,145 49,827 96,848 124,130 149,404
Investments 6,565 18,595 31,664 26,557 22,129 24,116 27,860 35,028 18,299 11,919
Net Current Assets 33,995 35,485 28,542 58,622 76,749 86,618 126,969 135,488 167,973 150,666
Stock Information
Number of Shares (Million) 207 207 207 1,036 1,036 1,036 2,071 2,071 2,407 2,399
Adjusted Earing per Share (post exceptional items) (In `)*
6.4 7.8 5.6 7.5 11.0 12.4 13.1 18.9 18.9 29.0
Earnings per Share-Basic (In `)* 74.7 87.8 65.2 17.5 25.7 28.8 15.2 18.9 18.9 29.0
Earning per Share-Diluted (In `)*
71.8 87.8 65.2 17.5 25.7 28.8 15.2 18.9 18.9 29.0

S U N P H A R M A C E U T I C A L I N D U S T R I E S L I M I T E D4
Dear Shareholders,
The global pharmaceutical landscape is rapidly changing. There
are both, opportunities and challenges. Opportunities include an
ageing population, leading to growing needs of modern medicines
at affordable cost and evolution of new chemical and biological
approaches towards targeted drug delivery. At the same time,
rising healthcare costs (which force governments to intervene on
pricing), increasing competitive intensity, customer consolidation
and increased focus on value delivered; imply that businesses of
future will need to develop an ability to constantly move up in the
pharmaceutical value chain. This will mandate identifying new
and profitable growth drivers in order to generate consistent
shareholder value.
HIGHLIGHTS OF FY17Our FY17 topline grew by 9% to ` 302 Billion which, was in line
with our annual guidance. In the US, which is a large contributor to
our revenues, we faced increased pricing pressure driven mainly by
MANAGING DIRECTOR’S LETTER
customer consolidation and higher competitive intensity. We also
faced anticipated delays in product approvals at the Halol facility,
driven by the cGMP compliance remediation efforts at the facility.
However, the US performance was partly boosted by the 180-day
exclusivity on generic Imatinib, which expired in July 2016. Overall,
we recorded 2% growth in the US for the year.
Our subsidiary Taro recorded 8% decline in overall revenues for the
year. This decline was mainly driven by a difficult pricing environment
in the US, resulting from increased competitive intensity and buying
consortium pressures.
We recorded a steady 8% growth in our India formulations business,
while our performance in emerging markets improved, resulting
in 26% growth in revenues. This growth was broad-based across
emerging markets and was driven by improvement in underlying
business supported by stable currencies.
T H E G L O B A L P H A R M A C E U T I C A L L A N D S C A P E I S R A P I D L Y C H A N G I N G . H E N C E , B U S I N E S S E S O F F U T U R E W I L L N E E D T O D E V E L O P A N A B I L I T Y T O C O N S T A N T L Y M O V E U P I N T H E P H A R M A C E U T I C A L V A L U E C H A I N . T H I S W I L L M A N D A T E I D E N T I F Y I N G N E W A N D P R O F I T A B L E G R O W T H D R I V E R S I N O R D E R T O G E N E R A T E C O N S I S T E N T S H A R E H O L D E R V A L U E .

FINANCIAL STATEMENTSCORPORATE OVERVIEW 80-27800-00
5A N N UA L R E P O RT 2 0 1 6 - 1 7
01-07 STATUTORY REPORTS 08-79
Our R&D investments for the year were ` 23 Billion, targeted mainly
at developing complex generics and specialty products. R&D is the
engine, which will drive our journey of moving up the pharmaceutical
value chain. We are also investing in enhancing our product pipeline
for emerging markets and other non-US developed markets.
We continued to build our specialty pipeline during the year and
simultaneously investing in developing the requisite front-end for this
business in the US. We expect this trend to continue in future as well.
BUILDING THE SPECIALTY BUSINESSOver the past few years, we have allocated significant resources
in building the specialty business. Since this business is in an
evolutionary stage, it currently does not generate revenues
commensurate to our investments. Our current profitability is after
taking into account these investments.
Our specialty initiatives target the global market with the US being
one of the important markets. Our strategy entails building a pipeline
of patented products for global markets with a focus on improving
patient outcomes either by targeting unmet medical needs or by
enhancing patient convenience through differentiated dosage forms.
Specialty projects have long-gestation timelines and we have to
cover a long distance in this journey. Our initiatives in this segment
cover the entire value chain, from in-licensing early-to-late stage
clinical candidates, as well as getting access to on-market patented
products. Dermatology, Ophthalmic, Oncology and CNS are the key
segments targeted through these initiatives.
Over the past two years, we have also focused on establishing
the requisite front-end capabilities for our specialty business.
This involves setting up relevant sales force (for promoting these
products to doctors), establishing the required regulatory and
reimbursement teams along with support staff.
SIGNIFICANT RAMP-UP IN SPECIALTY PIPELINEDuring the year, we significantly ramped-up our specialty portfolio.
We enhanced both, our specialty pipeline as well as our on-market
portfolio. Some of the key highlights are:
1. We received approval from USFDA for the New Drug Application
(NDA) related to BromSite™ (bromfenac ophthalmic solution)
0.075%. This product was subsequently commercialised in
November 2016.
2 We also continued our investment in the development and
commercialisation of tildrakizumab, which we had in-licensed from
Merck in 2014. In May 2016, we announced positive results from
the Phase-3 trials of tildrakizumab to treat chronic plaque psoriasis.
Subsequently, in July 2016, we announced a licensing agreement
with Almirall S.A. (Spain) for the development and commercialisation
of tildrakizumab for psoriasis in Europe. In March 2017, Sun Pharma
and Almirall announced the validation of the regulatory filing of
tildrakizumab with the European Medicines Agency (EMA). Post the
close of the year, we announced the acceptance of the regulatory
filing of tildrakizumab by the USFDA. Hence, tildrakizumab is now
awaiting regulatory approval from both the US and Europe.
3. During the year, Sun Pharma announced the launch of
Gemcitabine InfuSMART in Europe. InfuSMART is a technology in
which oncology products are developed in a ready-to-administer
(RTA) bag. With the roll-out of Gemcitabine InfuSMART, Sun Pharma
becomes world’s first pharmaceutical company to manufacture and
launch a licensed RTA oncology product.
4. We also in-licensed ELEPSIA XRTM (Levetiracetam Extended
Release tablets) from Sun Pharma Advanced Research Company
Ltd. (SPARC). ELEPSIA XRTM was approved by the USFDA in March
2015. However, in September 2015, SPARC received a complete
response letter (CRL) from the USFDA rescinding its earlier approval,
citing that the compliance status of the manufacturing facility of the
Company at Halol was not acceptable on the date of approval. We
are currently in the process of de-risking these filings by transferring
them to alternate facilities.
5. In October 2016, Sun Pharma announced the acquisition of
Ocular Technologies (Ocular), which gives us exclusive worldwide
rights to Seciera™ (cyclosporine A, 0.09% ophthalmic solution)
targeted at Dry Eye Disease. Subsequently, we announced successful
Phase-3 confirmatory clinical trial results for Seciera™. Coupled with
Sun Pharma’s existing ophthalmic portfolio consisting of BromSite™,
W E C O N T I N U E T O A L L O C A T E S I G N I F I C A N T R E S O U R C E S I N B U I L D I N G O U R G L O B A L S P E C I A L T Y B U S I N E S S . C U R R E N T L Y , T H I S B U S I N E S S I S I N A N I N V E S T M E N T P H A S E A N D D O E S N O T G E N E R A T E R E V E N U E S C O M M E N S U R A T E T O O U R I N V E S T M E N T S . O U R S P E C I A L T Y S T R A T E G Y E N T A I L S B U I L D I N G A P I P E L I N E O F P A T E N T E D P R O D U C T S F O R G L O B A L M A R K E T S W I T H A F O C U S O N I M P R O V I N G P A T I E N T O U T C O M E S .

S U N P H A R M A C E U T I C A L I N D U S T R I E S L I M I T E D6
Xelpros™ and DexaSite™ this acquisition will enable Sun Pharma to
significantly expand its ophthalmic presence and reach to millions of
patients - globally. We expect to file this product with the USFDA by
Q3FY18.
6. During the year, we also enhanced our specialty oncology
portfolio through the acquisition of a branded oncology product,
Odomzo®, from Novartis. Odomzo® (Sonidegib) was approved by
the USFDA in July 2015. It is a hedgehog pathway inhibitor indicated
for the treatment of adult patients with locally advanced basal cell
carcinoma (laBCC) that has recurred following surgery or radiation
therapy, or those who are not candidates for surgery or radiation
therapy. Odomzo® gives Sun Pharma an opportunity to meaningfully
expand its already established branded dermatology business
and support its expansion into branded oncology with a launched
brand. This acquisition has the potential to leverage and expand the
relationships that the Dusa sales team has with dermatologists that
treat common pre-cancerous skin conditions.
7. During the year, we also entered into an exclusive worldwide
licensing deal to further develop MM-II, a novel pharmaceutical
candidate for the treatment of pain in osteoarthritis. MM-II is a
novel non-opioid product that leverages the physical properties
of proprietary liposomes to lubricate arthritic knee joints, thereby
reducing friction and wear, consequently leading to joint pain
reduction. The product is based on patent-protected technology
licensed by Moebius Medical from the Hebrew University of
Jerusalem, Technion Israel Institute of Technology and Hadassah
Medical Centre.
RANBAXY INTEGRATIONWe are entering the third and the most important year of integration
of Ranbaxy into Sun Pharma. The synergy benefits from this
integration are reflected in our financials in FY17 and we expect
to build further on these synergy benefits in FY18. We continue
to target US$ 300 Million in synergy benefits from this acquisition
by FY18 and are on track to achieve this significant milestone. The
synergy benefits will arise from both revenue and cost synergies and
will be driven by the combined technology capabilities, combined
R&D pipeline and the global product portfolio.
GLOBAL cGMP COMPLIANCEGiven the stringent cGMP requirements of global regulators,
pharmaceutical companies need to focus on 24x7 compliance status.
Ability to successfully adhere to these cGMP standards has become a
key determinant of future for the pharmaceutical industry.
During the year, Sun Pharma made significant progress towards
24x7 cGMP compliance. Many of our facilities underwent successful
audits by multiple regulatory agencies, including the USFDA. At the
same time, remediation work continued at some of the facilities,
which have been impacted by cGMP deviations.
Our Halol facility, which was impacted by cGMP deviations in FY15,
underwent a re-inspection by the USFDA in November 2016. On
completion of the re-inspection, the USFDA issued nine observations
for the facility. While none of these are repeat observations,
compared to those issued for the September 2014 inspection, we will
need to remediate these nine observations also. We are currently in
the process of implementing the requisite remediation steps. New
approvals from this facility will continue to be on hold till we have a
successful re-inspection.
During the year, we also had a re-inspection of the Mohali facility
by the USFDA. Post the completion of the re-inspection, the USFDA
informed Sun Pharma that it will be lifting the import alert imposed
on Sun Pharma’s Mohali manufacturing facility and remove the
facility from the Official Action Initiated (OAI) status. This has
cleared the path for Sun Pharma to supply approved products from
the Mohali facility to the US market, as well as make this facility
available for future filings. The Mohali facility was inherited by Sun
Pharma as part of its acquisition of Ranbaxy Laboratories Ltd. in
2015. The USFDA had acted against the Mohali facility in 2013,
when it ordered the facility to be fully subject to Ranbaxy’s Consent
Decree of permanent injunction. Certain conditions of the Consent
Decree will continue to be applicable to the Mohali facility even
after the lifting of the import alert. This development illustrates Sun
Pharma’s commitment to work closely with the USFDA and strive for
100% cGMP compliance at its manufacturing facilities.
W E A R E E N T E R I N G T H E T H I R D A N D T H E M O S T I M P O R T A N T Y E A R O F I N T E G R A T I O N O F R A N B A X Y I N T O S U N P H A R M A . T H E S Y N E R G Y B E N E F I T S F R O M T H I S I N T E G R A T I O N A R E R E F L E C T E D I N O U R F I N A N C I A L S I N F Y 1 7 A N D W E E X P E C T T O B U I L D F U R T H E R O N T H E S E S Y N E R G Y B E N E F I T S I N F Y 1 8 . W E C O N T I N U E T O T A R G E T U S $ 3 0 0 M I L L I O N I N S Y N E R G Y B E N E F I T S F R O M T H I S A C Q U I S I T I O N B Y F Y 1 8 .

FINANCIAL STATEMENTSCORPORATE OVERVIEW 80-27800-00
7A N N UA L R E P O RT 2 0 1 6 - 1 7
01-07 STATUTORY REPORTS 08-79
JAPAN ENTRYDuring the year, Sun Pharma initiated the process of transferring
marketing authorisations of the 14 brands (acquired from Novartis
in March 2016). The transfer of these brands has commenced in a
phased manner beginning October 2016 onwards. Simultaneously,
Sun Pharma entered into a distribution alliance with Mitsubishi
Tanabe Pharma Corporation (MTPC) for these brands. Under this
alliance, following the transfer of manufacturing and marketing
rights to Sun Pharma, MTPC will market and distribute all 14 brands
as well as provide information on their proper use to healthcare
professionals in Japan. Through this alliance, Sun Pharma can
leverage MTPC’s specialised expertise to create a strong business
foundation in Japan.
ENHANCING PRESENCE IN RUSSIADuring the year, we also enhanced our presence in Russia through
the acquisition of JSC Biosintez, a Russian pharmaceutical
company engaged in manufacture and marketing of pharmaceutical
products in Russia and CIS region for US$ 24 Million. Sun
Pharma also assumed a debt of approximately US$ 36 Million
as part of this transaction. Biosintez focuses on the hospital
segment and had annual revenue of approximately US$ 52
Million for 2015. It has a manufacturing facility in Penza region
with capabilities to manufacture a wide variety of dosage forms,
including pharmaceuticals for injections, blood substitutes,
blood preservatives, ampoules, tablets, ointment, creams, gels,
suppositories, APIs, and so on. This acquisition is consistent with
Sun Pharma’s philosophy to invest in strategic emerging markets.
It provides the Company access to local manufacturing capability
across multiple dosage forms in Russia, enabling it to serve the
Russian pharmaceutical market effectively.
OVERALL OUTLOOKAs we target moving up the pharmaceutical value chain, Sun Pharma
is undergoing a gradual transformation. We need to cross many
milestones in this transformation. Our capable and committed
employees will be key drivers of this transformation.
The short-term outlook continues to be challenging. The US generics
industry is facing rapidly changing market dynamics. Increased
competitive intensity and customer consolidation is leading to
pressure on pricing; while continued delay in approvals from the
Halol facility is also impacting us. Also, we had the benefit of Imatinib
exclusivity in the US in FY17, which has ended in July 2016. In the
Indian market, there is uncertainty amongst the trade channels due
to the GST implementation, although it may be temporary. Given
these factors, growth could be a challenge in FY18 and we expect a
single-digit decline in consolidated revenues for FY18 over FY17.
Our consolidated R&D investments for FY18 will be about 9-10%
of revenues.
Despite these challenges, we continue to invest in enhancing our
global specialty and complex generics pipeline. Investments will
also continue for setting up the requisite front-end capabilities for
our specialty business in the US. These investments may not have
commensurate revenues in FY18, but in the long term, the revenue
from specialty products will justify these investments.
As a shareholder, you have continuously supported our endeavours
over the past many years. As always, we are grateful to you for this
confidence.
Warm regards,
Dilip Shanghvi
Managing Director
Sun Pharmaceutical Industries Ltd.

S U N P H A R M A C E U T I C A L I N D U S T R I E S L I M I T E D8
MANAGEMENT DISCUSSION AND ANALYSIS
GLOBAL PHARMACEUTICAL INDUSTRY1
The global spending on medicines is expected to reach nearly US$ 1.5 Trillion
by 2021. This is an increase of nearly US$ 370 Billion from the 2016 estimated
spending level, representing a CAGR of 4-7%. The two main drivers of this growth
will be introduction of new innovative products in the developed markets and
increased volumes of branded generics in the emerging markets.
The growth of a country’s pharmaceutical industry closely mirrors its general
economic progress. As economies of the world demonstrate widely divergent
growth patterns, industry growth is also different. However, taking a macro
perspective, global pharmaceutical growth depends on worldwide economic
momentum, government healthcare programmes and spending patterns. While
R&D efforts will drive the introduction of new products in the market, challenges
remain. For countries grappling with sluggish economies and limited resources,
funding access to these medicines remains an uphill task.
Each country in the world is facing these challenges and addressing them in its own
way. Overall, generic products will continue to be an integral part of these efforts,
targeted at striking a balance between access to healthcare and ability to fund it.
T H E T W O M A I N D R I V E R S O F O V E R A L L G R O W T H F O R T H E P H A R M A C E U T I C A L I N D U S T R Y W I L L B E I N T R O D U C T I O N O F N E W I N N O V A T I V E P R O D U C T S I N T H E D E V E L O P E D M A R K E T S A N D I N C R E A S E D V O L U M E S O F B R A N D E D G E N E R I C S I N T H E E M E R G I N G M A R K E T S
Chart 1
Constant US$
GLOBAL PHARMACEUTICAL SPENDING AND GROWTH 2011-20211
(US$ Bn)
80
0-9
00
30
0-4
00
35
0-3
80
1,1
05
1,4
55
-1,4
85
2011-20162011 2016-20212016 2021
6.2% CAGR 2011-2016
4-7% CAGR 2016-2021

CORPORATE OVERVIEW FINANCIAL STATEMENTSSTATUTORY REPORTS 01-07 80-27808-79
9A N N UA L R E P O RT 2 0 1 6 - 1 7
Chart 2
GLOBAL SPENDING ON MEDICINES1
(US$ Bn)
0 50 100 150 200 250
Others 230
Antiviral EX-HIV 33
HIV 25
Mental Health 37
Antibiotics and Vaccines 54
Respiratory 54
Cardiovascular 70
Pain 68
AutoImmune 45
Oncology 75
Diabetes 66
SPENDING 2016
0 50 100 150 200 250
Others 360-415
Antiviral EX-HIV 35- 40
HIV 35 - 40
Mental Health 35 - 40
Antibiotics and Vaccines 60 - 70
Respiratory 60 - 70
Cardiovascular 70 - 80
Pain 75 - 90
AutoImmune 75 - 90
Oncology 120 - 135
Diabetes 95 - 110
SPENDING 2021
300 350 400 450
Note: Includes 8 developed and 6 pharmerging countries: U.S., EU5, Japan, Canada, China, Brazil Russia, India, Turkey, Mexico
The key trends for the next five years: The US will continue as the world’s largest pharmaceutical
market.
New innovative products will drive the growth in pharmaceutical spending in developed markets, but will be partly offset by patent expiries. Growth will be driven primarily by oncology, autoimmune and diabetes treatments.
Pharmerging markets will grow faster than developed markets, driven mainly by rising income levels, increased healthcare awareness, government policies directed at achieving universal healthcare and increasing incidence of chronic ailments.
Innovation in specialty medicines will drive the share of global specialty spending from 30% in 2016 to 35% in 2021. This increase will be driven by the acceptance of new breakthrough medicines.
The specialty segment will be a key focus area for payers and they are likely to focus on lowering healthcare costs and the therapeutic value offered by such specialty medicines. The US and Western Europe will be the key drivers of specialty medicines.
Regions 20162011-16
CAGR2021
2016 -2021
CAGR
Developed 749 5% 975-1,005 4-7%
Pharmerging 243 10% 315-345 6-9 %
Other markets 112 4% 130-160 3-6%
Globalpharmaceuticalmarket
1,105 6% 1,455-1,485 4-7%
Table 1
GLOBAL PHARMACEUTICAL SPENDING1 (US$ Bn)
R&D Centre

S U N P H A R M A C E U T I C A L I N D U S T R I E S L I M I T E D1 0
GLOBAL GENERICS1
The global generics market consists of both non-branded and
branded generics. Branded generics in emerging markets will be the
key drivers of growth for the overall generics market. This growth
will be driven by many macroeconomic factors like rising per capita
incomes, growing healthcare awareness, increasing medical insurance
penetration and higher incidence of chronic ailments. The efforts of
governments in emerging markets to achieve universal healthcare are
also expected to drive the growth of branded generics.
The global demand for non-branded generic drugs will continue to
grow as governments, payors and consumers pursue avenues to
reduce healthcare costs, mainly in the developed economies.
Chart 3
ESTIMATED GLOBAL MEDICINE SPENDING BY PRODUCT TYPE IN 20211
GLOBAL SPENDING
US$ 1,455- 1,485 Bn
DEVELOPED MARKETS
US$ 975- 1,005 Bn
PHARMERGING MARKETS
US$ 315- 345 Bn
REST OF WORLD
US$ 130- 160 Bn
Original brands Generics
Branded Generics Other products
56%
69%
22%
51%
42%
5%
14%
22%
14%
8%
27%
14%
12%
12%
22%
10%
Chart 4
Non-Branded Generics
Branded Generics
GLOBAL GENERIC MARKET SIZE2
(US$ Bn)
2 0 1 3
2 0 1 6
2 0 1 8
34%
66%
80155
33%67%
92191
41%
59%
6999
US$ 235 Bn
US$ 283 Bn
US$ 168 Bn

CORPORATE OVERVIEW FINANCIAL STATEMENTSSTATUTORY REPORTS 01-07 80-27808-79
1 1A N N UA L R E P O RT 2 0 1 6 - 1 7
Growth drivers of global pharmaceutical industry2, 3
Changing demographic pattern
Ageing population and growing life expectancy will remain a long-
term growth driver for global pharmaceutical consumption. The
combination of population ageing and increased life expectancy — up
from an estimated 72.3 years in 2014 to 73.3 years in 2019 — will
take the number of people aged 65-plus to over 604 Million, or 10.8%
of the total global population. This number is anticipated to be even
higher in Western Europe (nearly 21%) and Japan (28%).
Factors that have contributed to enhanced life expectancy are
declining infant mortality, enhanced living conditions, improved
sanitation, better prevention of communicable diseases, and growing
access to healthcare. Increased life expectancy, coupled with
other macroeconomic factors (rising per capita incomes, growing
healthcare awareness, enhanced medical insurance penetration) will
remain key growth drivers for the pharmaceutical industry.
Prevalence of chronic diseases
The spread of chronic diseases is having serious health repercussions
in both developed and emerging countries. Sedentary lifestyles,
urbanisation and changing food habits are leading to higher
incidence of chronic diseases - globally. Obesity, cardiovascular
diseases, hypertension, and diabetes are now causing widespread
health problems. These trends will continue to challenge public
health systems to meet increasing demand for drugs and treatments.
Accessibility and affordability
Access to modern healthcare continues to be a challenge in many
parts of the developing and underdeveloped economies. Given the
low per capita income in many developing countries, affordability
also remains a challenge. Many governments, as response to these
challenges are expanding their public or private healthcare coverage.
At the same time, they are deepening it to reduce out-of-pocket
spending. The trend towards the adoption of universal healthcare
continues. The vision of achieving universal healthcare in the
developing world will only be fulfilled if governments focus on higher
spending on healthcare, while ensuring that drugs remain affordable
to the population at large.
Outlook
The global spending on medicines is estimated to grow at 4-7%
CAGR between 2016 and 2021, to reach approximately US$ 1.5
Trillion. Pharmaceutical spending growth in developed markets,
will be driven by oncology, autoimmune and diabetes treatments.
Developed market spending growth will be driven by original brands
but will be partly constrained by patent expiries and the cost and
access controls instituted by payors. Growth in pharmerging markets
will continue to be fuelled by branded-generic and pure generic
products.
Spending on specialty medicines set to rise
The development of specialty medicines is consistently increasing.
The share of global spending on specialty drugs will continue to rise
from about 30% in 2016 to about 35% by 2021. This spending on
specialty medicines will be mainly driven by the US and Western
European markets.
Chart 5
DRIVERS OF PHARMACEUTICAL SPENDING - 2016-20211
(US$ Bn)
2016 Brand Loss ofexclusivity
Generic* PharmergingMarkets
OtherMarkets**
2021
1,105
318 17087
11021 1,455-1,485
Developed Markets

S U N P H A R M A C E U T I C A L I N D U S T R I E S L I M I T E D1 2
Chart 6
Western Europe
Pharmaceutical spending in the top five European markets (Germany,
France, Italy, Spain and the UK) is expected to grow at around 1-4%
CAGR. Overall spending in these markets is estimated to increase
from US$ 152 Billion in 2016 to US$ 170-200 Billion in 2021. This
sluggish progress reflects efforts made by governments to control
healthcare spending, owing to budget constraints and muted
economic growth in the region. Besides, there is uncertainty on the
impact of Brexit and its influence on the pharmaceutical market.
Developed marketsPharmaceutical spending in developed markets is estimated to grow
at 4-7% CAGR from US$ 749 Billion in 2016 to US$ 975-1,005
Billion by 2021. The US will remain the most important market and a
key driver of this growth among developed markets.
Country 20162011-16
CAGR2021
2016 -2021
CAGR
U.S. 462 6.9% 645-675 6-9%
EU5 152 3.9% 170-200 1-4%
Germany 43 4.4% 49-59 2-5%
France 32 0.7% 33-37 (-1)-2%
Italy 29 5.2% 34-38 1-4%
U.K. 27 6.7% 34-38 4-7%
Spain 21 3.2% 23-27 1-4%
Japan 90 2.0% 90-94 (-1)-2%
Canada 19 3.0% 27-31 2-5%
South Korea 13 2.9% 14-18 3-6%
Australia 13 6.3% 13-16 0-3%
Developed Markets
749 5.4% 975-1,005 4-7%
Table 2
DEVELOPED MARKETS - PHARMACEUTICAL SPENDING1
(US$ Bn)
USA
The US pharmaceutical market growth is estimated to grow by 6-9%
CAGR from US$ 462 Billion in 2016 to US$ 645-675 Billion in 2021.
Innovative specialty products will be the key driver of this growth.
Overall, the increase in branded product sales is likely to be partly
constrained by patent expiries and low-cost generics. Cumulative
patent expires in the US is estimated at US$ 144 Billion over the
2017-2021 period, including expiration of patents on biologics.
Japan
Japan’s pharmaceutical spending stood at approximately US$ 90
Billion in 2016. It is estimated to grow at a sluggish pace during
2016-2021 to reach US$ 90-94 Billion by 2021. The government’s
focus on pricing has resulted in the low growth trajectory of the
market. Moreover, the Japanese government has been advocating
the use of low-cost generics to control overall pharmaceutical
spending in the country. Over the past few years, the country has
implemented regulations to encourage the use of generics. This,
coupled with the periodic price cuts announced by the government,
is likely to limit the overall growth of the Japanese market. However,
given the government’s favourable stance towards generics, their
volumes are likely to keep growing over the next few years.
Constant US$
EU5 PHARMACEUTICAL SPENDING1
(US$ Bn)
152170-200
1-4% CAGR
2016 2021
Chart 7
Constant US$
US PHARMACEUTICAL SPENDING1
(US$ Bn)
462
645-6756-9% CAGR
2016 2021

CORPORATE OVERVIEW FINANCIAL STATEMENTSSTATUTORY REPORTS 01-07 80-27808-79
1 3A N N UA L R E P O RT 2 0 1 6 - 1 7
Chart 8
Constant US$
Overall growth in pharmerging markets will be mainly driven by the
Tier II and Tier III markets. India and Brazil are expected to be key
contributors to this growth, with the Chinese growth slowing down.
The main drivers of growth in pharmerging markets include: 1. Rising per capita incomes enable higher spending on healthcare.
2. Increasing insurance coverage.
3. Growing initiatives by various governments towards achieving universal healthcare, resulting in higher allocation of government spending on healthcare.
4. Growing health awareness.
5. Rising incidences of chronic ailments and lifestyle diseases.
Global consumer healthcare industry6,7
The global consumer healthcare (GCH) market grew by 4.3% in 2016
to reach US$ 122 Billion. The US and China continue to be the largest
GCH markets and together account for 44% of the global share.
Among emerging markets, Brazil, Russia and India account for almost
9% of the global market. In 2016, these markets grew faster than the
global average with Brazil growing at 8.8%, Russia at 11.3% and India
at 8.2%.
Growing healthcare awareness is driving the demand in the GCH
market. Vitamins, cough and cold, and allergy account for over 50%
of spending in the market. The increasing use of online resources
to access healthcare information has empowered people to seek
various available treatments. This is leading to self-medication and
driving market momentum.
Region/
Country 2016
2011-16
CAGR2021
2016 -2021
CAGR
China 117 12% 140-170 5-8%
Tier 2 Markets
56 11% 75-85 8-11%
Brazil 27 11% 32-36 7-10%
Russia 12 11% 14-18 5-8%
India 17 13% 26-30 10-13%
Tier 3 Markets
62 7% 82-86 6-9%
Pharmerging Markets
243 10% 315-345 6-9%
(Pharmerging markets: China, Brazil, Russia, India, Venezuela, Poland, Argentina, Turkey, Mexico, Vietnam, South Africa, Thailand, Indonesia, Romania, Egypt, Pakistan, Ukraine, Algeria, Colombia, Nigeria, Saudi Arabia and Russia)
Table 3
PHARMERGING MARKETS PHARMACEUTICAL SPENDING1
(US$ Bn)
Pharmerging markets Pharmerging markets’ pharmaceutical spending stood at around
US$ 243 Billion in 2016. It is estimated to grow at 6-9% CAGR during
2016-21 to reach US$ 315-345 Billion by 2021.
PHARMERGING MARKETS PHARMACEUTICAL SPENDING1
(US$ Bn)
243
315-3456-9% CAGR
2016 2021
Analytical Laboratory

S U N P H A R M A C E U T I C A L I N D U S T R I E S L I M I T E D1 4
Active Pharmaceutical Ingredients (API)4
The global active pharmaceutical ingredients (API) market is
estimated to reach US$ 214 Billion by 2021, compared to US$ 158
Billion in 2016, representing a CAGR of 6.3%. Rising prevalence of
oncology ailments and chronic diseases are steering the growth of
the API market. At the same time, technological advancements in API
manufacturing is also contributing to market momentum. Besides,
the growing importance of generics and rapidly increasing geriatric
healthcare are propelling the market forward.
In addition, an increase in abbreviated new drug applications (ANDA)
and rising uptake of biopharmaceuticals will bolster this growth.
However, factors such as stringent regulatory requirements and
unfavourable drug price control policies across various countries
may restrain the market progress. Growing demand for innovative
therapeutics for autoimmune diseases treatment and increase in
USFDA approvals for new molecular entities are further expanding
the demand for APIs.
INDIAN PHARMACEUTICAL MARKET8
India’s pharmaceutical market ranks third in the world in terms of
volume and 11th in terms of value. At US$ 17.4 Billion, the market
in India accounted for 1.6% share of the global market in 2016. It is
expected to grow at a CAGR of 10-13% to US$ 26-30 Billion by 2021.
The overall penetration of modern medicines is quite low in India.
The per capita spending on pharmaceuticals in India is one of the
lowest among emerging markets. Compared to the emerging market
average per capita spend of about US$ 117 per year, the spending
in India is approximately US$ 15-25 per year. Affordability, access
1Increase in disposable income
2Growing health insurance market
3Growth of population
4Rising prevalence of chronic diseases
5Improvement in medical facilities
6Rise in healthcare awareness
INDIAN PHARMA MARKET -
KEY GROWTH DRIVERS
and awareness are the prime factors, which determine demand for
pharmaceutical products in the Indian market.
Other factors like rising per capita income, improving access to
healthcare facilities, and higher government spending on healthcare
drive market demand. Moreover, increasing insurance penetration,
more healthcare awareness and enhanced investments for treating
chronic ailments serve as key growth drivers.
Chart 9
1,955
776 739577 513
295117
25
GLOBAL PER CAPITA PHARMACEUTICAL SPENDING IN 20211
(US$)
US
Can
ada
Jap
an
EU
5
Au
stra
lia
Ind
ia
Sou
th K
ore
a
Em
ergi
ng
Mar
kets
2,000
1,500
1,000
500
0

CORPORATE OVERVIEW FINANCIAL STATEMENTSSTATUTORY REPORTS 01-07 80-27808-79
1 5A N N UA L R E P O RT 2 0 1 6 - 1 7
SUN PHARMACEUTICAL INDUSTRIES LIMITED (SUN PHARMA)Sun Pharma is the world’s fourth largest specialty generic
pharmaceutical company. It is India’s top pharmaceutical company.
A vertically integrated business, economies of scale and an extremely
skilled team enable it to deliver well-timed quality products at
affordable prices. Sun Pharma provides high-quality medicines
trusted by customers and patients in over 150 countries. Its global
presence is supported by 42 manufacturing facilities spread across
six continents, research and development (R&D) centres across
the world and a multi-cultural workforce comprising over 50
nationalities. Sun Pharma fosters excellence through innovation
supported by strong R&D capabilities of about 2,000 scientists and
R&D investments of over 8% of annual revenues.
In India, the Company enjoys leadership across 11 different classes
of doctors with 30 brands featuring among top 300 pharmaceutical
brands. Sun Pharma’s global footprint covers the U.S., emerging
markets, Western Europe, Japan, Canada, Israel, Australia and New
Zealand. Its Global Consumer Healthcare (GCH) business is ranked
among the Top 10 across four global markets. Its API business
footprint is strengthened through 14 world-class API manufacturing
facilities around the world.
OUR BUSINESS MODELGrowing and sustaining our prominence across markets, therapeutic segments and products.
US$ 4.5 BnGlobal revenue as on March 31, 2017
>150Markets served globally
>2,000 Products marketed
42Manufacturing facilities across six continents
>30,000Employee worldwide
GROWTH STREAMSUS Formulations 4th largest generics company in the US with a strong ANDA
pipeline (157 ANDAs awaiting approval). Largest Indian pharma company in the US.
Presence in generics and specialty segments with more than 420 approved products.
Emerging Markets Among the largest Indian pharma company in emerging markets. Presence in over 100 countries across Africa, Americas, Asia and
Eastern & Central Europe. Key focus markets – Brazil, Mexico, Russia, Romania, South Africa,
and complementary and affiliated markets.
India Branded Generics No. 1 pharma company in India with 8.6% market share and 30
brands in the country’s top 300 brands. No.1 ranked with 11 classes of doctor categories. Leading position in high growth chronic therapies.
Western Europe, Canada, Japan, A&NZ & Others
Expanding presence in Europe. Presence across majority of markets in Western Europe, Canada,
Japan and A&NZ. Product portfolio includes differentiated offerings for hospitals,
injectables and generics for retail market.
GROWTH STRATEGIESCreate Sustainable Revenue Streams
Enhance share of specialty business globally. Achieve differentiation by focusing on technically complex
products. Focus on key markets to achieve critical mass Speed to market. Ensure sustained compliance with global regulatory standards.
Balance Profitability & Investments for Future Increasing contribution of specialty and complex products. Future investments directed towards differentiated products.
Business Development Use acquisitions to bridge critical capability gaps. Focus on access to products, technology, market presence. Ensure acquisitions yield high return on investment. Focus on payback timelines
Cost Leadership Vertically integrated operations. Optimise operational costs.

S U N P H A R M A C E U T I C A L I N D U S T R I E S L I M I T E D1 6
Table 6Key acquisitions and joint ventures (JV)
Year Deals Country Rationale
2016 Acquired global rights for Seciera and Odomzo
Global Markets Enhances specialty pipeline
2016 Acquired Biosintez Russia Local manufacturing capability to enhance presence in Russian market
2016 Licensing agreement with Almirall fortildrakizumab for Psoriasis
Europe Strengthening the distribution of tildrakizumab in Europe
2016 Acquired 14 brands from Novartis Japan Entry into Japan
2016 Distribution agreement with AstraZeneca
India Distribution services agreement in India for brand ‘Oxra’ & ‘Oxramet’® (brands of dipagliflozin, used for diabetes treatment)
2015 Acquisition of InSite Vision USA Strengthens branded ophthalmic portfolio in U.S.
2015 Acquisition of GSK’s Opiates Business Global Markets Vertical integration for controlled substances business
2015 Distribution agreement with AstraZeneca
India Distribution services agreement in India for brand ‘Axcer’® (brand of ticagrelor, used for the treatment of acute coronary syndrome)
2015 Sun Pharma – Ranbaxy Merger Global Markets Strengthens the position as the 5th largest Global Specialty Generic pharma company and No.1 pharma company in India with strong positioning in emerging markets
2014 In-licensing agreement with Merck fortildrakizumab - a biologic for psoriasis
Global Markets Strengthened the specialty product pipeline
2014 Acquired Pharmalucence USA Sterile injectable capacity in the US, supported by strong R&D capabilities
2013 Formation of Sun-Intrexon JV Global Markets Strengthen ocular specialty pipeline
2013 Acquired URL’s generic business USA Added 107 products to the US portfolio
2012 Acquired DUSA Pharma, Inc. USA Access to branded derma product
2010 Acquired Taro PharmaceuticalIndustries Ltd.
Israel Dermatology and topical product manufacturing plant at Israel and Canada
2008 Acquired Chattem Chemicals, Inc. Tennessee, USA Import registration with DEA, API Plant approved by DEA in Tennessee, USA
2005 Assets of Able LabsFormulation plant in Bryan
New Jersey, USA Ohio, USA
Dosage form plant (NJ, USA) and IP Dosage form plant (Ohio, USA)
1997 Acquired Caraco Detroit, USA Entry into the US market
API Plant

CORPORATE OVERVIEW FINANCIAL STATEMENTSSTATUTORY REPORTS 01-07 80-27808-79
1 7A N N UA L R E P O RT 2 0 1 6 - 1 7
Key performance indicators
GROSS SALES(` Billion)
FY17
FY16
303
279
EBITDA*(` Billion)
FY17
FY16
88
76
NET PROFIT AFTER MINORITY INTEREST(` Billion)
FY17
FY16
70
45
ADJUSTED EARNING PER SHARE (Post exceptional items)(` Per Share)
FY17
FY16
29.0
18.9
BOOK VALUE PER SHARE(` Per Share)
FY17
FY16
153
137
MARKET CAPITALISATION(US$ Billion)
FY17
FY16
26
30
NET WORTH(` Billion)
FY17
FY16
366
330
(` Billion)
FY17
FY16
217
187
BUSINESS-WISE REVENUE SHARE
US Business
Indian Branded Generics BusinessEmerging Markets
Western Europe, Canada, A&NZ & Other MarketsActive Pharmaceutical Ingredients (API) and Others
45%
26%
15%
9%
5%
FY17
BUSINESS MIX
InternationalIndia
74%
26%
FY17
*EBITDA = Gross Sales - (Cost of Material Consumed + Purchase of stock-in-trade + Change in inventories of Finished Goods, Work-in Progress andStock-in-Trade + Employee Benefits Expense + Other Expenses)
PROPERTY, PLANT & EQUIPMENT AND OTHER INTANGIBLE ASSETS (AT COST/ DEEMED COST)

S U N P H A R M A C E U T I C A L I N D U S T R I E S L I M I T E D1 8
Operational highlights, FY17Significant ramp-up in specialty pipeline
The year under review was eventful for Sun Pharma’s specialty
initiatives. The Company significantly enhanced its global specialty
pipeline through acquisitions and partnerships as well as made
substantial progress in successfully completing clinical trials for key
products. Some of the key highlights of the specialty initiatives for
the year were:
Global speciality portfolio
In April 2016, the Company received approval from USFDA for
its New Drug Application (NDA) related to BromSite™ (bromfenac
ophthalmic solution) 0.075%. BromSite™ is the first non-steroidal
anti-inflammatory drug (NSAID) approved by the USFDA to prevent
pain and treat inflammation in the eye for patients undergoing
cataract surgery; other NSAIDs in this class are currently indicated
for the treatment of inflammation and reduction of pain. BromSite™
is the first bromfenac ophthalmic solution formulated in DuraSite™,
a polymer-based formulation that can be used to improve
solubility, absorption, bioavailability, and residence time, compared
to conventional topical therapies. Sun Pharma, subsequently
commercialised BromSite™ in the US market in November 2016.
This was the Company’s first branded specialty ophthalmic product
launch in the US.
In May 2016, Sun Pharma announced positive results of two
pivotal Phase-3 clinical trials of tildrakizumab in patients with
moderate-to-severe plaque psoriasis. The co-primary efficacy
endpoints of the placebo controlled studies were: the proportion
of participants with Psoriasis Area Sensitivity Index 75 (PASI 75)
response at week 12, compared to placebo and the proportion of
participants with a Physician’s Global Assessment (PGA) score of
clear or minimal with at least a 2-grade reduction from baseline
at week 12, compared to placebo. The overall safety profile of
tildrakizumab in both Phase-3 clinical trials was consistent with the
safety data observed in previously reported studies. The second
study also included an etanercept comparator arm, with a key
secondary endpoint comparing tildrakizumab and etanercept on
PASI 75 and PGA. tildrakizumab 200mg was superior to etanercept
on both PASI 75 and PGA endpoints at week 12, while the 100 mg
dose showed superiority to etanercept on PASI 75 only.
Subsequently, in July 2016, Sun Pharma announced a licensing
agreement with Almirall S.A. (Spain) for the development and
commercialisation of tildrakizumab for psoriasis in Europe. Under
terms of this licence agreement, Almirall paid Sun Pharma an initial
upfront payment of US$ 50 Million. Moreover, Sun Pharma will
also be eligible to receive development and regulatory milestone
payments and, additionally, sales milestone payments and royalties
on net sales. Almirall will be able to lead European studies, and
participate in larger global clinical studies for psoriasis indication
subject to the terms of Sun Pharma – Merck agreements, as well as
certain cost sharing agreements. Sun Pharma will continue to lead
development of tildrakizumab for other indications, where Almirall
will have the right of first negotiation for certain indications
in Europe.
Post this licensing agreement, in March 2017, Sun Pharma
and Almirall announced the validation of the regulatory filing of
tildrakizumab with the European Medicines Agency (EMA). This filing
was done by Almirall with EMA. Post the close of the financial year,
in May 2017, Sun Pharma announced the acceptance of the Biologics
License Application (BLA) by the USFDA. Hence, tildrakizumab has
been filed in both, the US and Europe and is awaiting regulatory
approval.
In July 2016, Sun Pharma announced the launch of Gemcitabine
InfuSMART in Europe. InfuSMART is a technology in which
oncology products are developed in a ready-to-administer (RTA)
bag. Until now, compounding of oncology products was done at
compounding centres or in hospital pharmacies, an extra step before
the medicine could be administered to patients. With the roll-out
of Gemcitabine InfuSMART, Sun Pharma becomes world’s first
pharmaceutical company to manufacture and launch a licensed RTA
oncology product. The InfuSMART concept involves dose banding
practice. This means, through agreement between prescribers and
pharmacists, standardised doses of intravenous cytotoxic drugs
are used for ranges (or “bands”) of doses calculated for individual
patients. More InfuSMART oncology products are currently in Sun
Pharma’s pipeline to be rolled out in future.
In July 2016, Sun Pharma in-licensed ELEPSIA XRTM
(Levetiracetam Extended Release tablets) from Sun Pharma
Advanced Research Company Ltd. (SPARC). As per the licensing
agreement, SPARC licensed ELEPSIA XRTM to Sun Pharma for the
US market for an up-front payment of US$10 Million plus milestones
and royalties on sales. ELEPSIA XRTM was approved by the USFDA
in March 2015. However, in September 2015, SPARC received
a complete response letter (CRL) from the USFDA rescinding its
earlier approval, citing that the compliance status of the Halol
manufacturing facility of Sun Pharma was not acceptable on the date
of approval. Sun Pharma has undertaken a detailed remediation at
Halol for restoring cGMP compliance status for the site.
Products commercialised
Products at filing stage
BLA awaiting approval
Products under development
4
3
1
2

CORPORATE OVERVIEW FINANCIAL STATEMENTSSTATUTORY REPORTS 01-07 80-27808-79
1 9A N N UA L R E P O RT 2 0 1 6 - 1 7
In October 2016, Sun Pharma announced the acquisition of Ocular
Technologies (Ocular), a portfolio company of Auven Therapeutics
(Auven). Ocular owns exclusive, worldwide rights to Seciera™
(cyclosporine A, 0.09% ophthalmic solution). Sun Pharma paid Auven
US$ 40 Million upfront, plus Auven will be eligible for contingent
development milestones and sales milestones, as well as tiered
royalty on sales of Seciera™ as consideration for this acquisition.
At the time of the acquisition, Seciera™ was undergoing a Phase-3
confirmatory clinical trial for the treatment of Dry Eye Disease.
The Dry Eye Disease is an inflammatory ocular disease affecting
approximately 16 million people in the United States alone. Seciera™
is a patented, novel, proprietary formulation of cyclosporine A
0.09%. It is a clear, preservative-free, aqueous solution. Coupled with
Sun Pharma’s existing ophthalmic portfolio consisting of BromSite™,
DexaSite™ and Xelpros™, this acquisition will enable Sun Pharma to
significantly expand its ophthalmic presence and reach to millions of
patients - globally.
Subsequently, in January 2017, Sun Pharma announced successful
Phase-3 confirmatory clinical trial results for Seciera™. In this 12
week, multicentre, randomised, double-masked, vehicle controlled
Phase-3 confirmatory study, 744 dry eye patients were treated,
either with Seciera™ or its vehicle. After 12 weeks of treatment,
as compared to vehicle, Seciera™ showed statistically significant
improvement in the primary end point, Schirmer’s score (a
measurement of tear production) (p<0.0001). The demonstration of
efficacy by Seciera™ at 12 weeks is earlier than other drugs approved
for dry eye in the same class. Additionally, several key secondary
endpoints showed statistically significant improvements compared
to vehicle with some showing an even earlier onset of action. Adverse
events reported in the trial were mild to moderate in nature and
similar to other approved drugs in the category. Subsequently, Sun
Pharma had a pre-NDA meeting with the USFDA and the filing of this
NDA is targeted for Q3FY18.
In December 2016, Sun Pharma announced the acquisition of a
branded oncology product, Odomzo®, from Novartis, for an upfront
payment of US$ 175 Million and additional milestone payments.
Odomzo® (Sonidegib) was approved by the USFDA in July 2015.
It is a hedgehog pathway inhibitor indicated for the treatment of
adult patients with locally advanced basal cell carcinoma (laBCC)
that has recurred following surgery or radiation therapy, or those
who are not candidates for surgery or radiation therapy. For this
class of drug, a significant number of prescribers are dermatologists
and rests are oncologists. Clinical data from the BOLT trial for
Odomzo® had shown continued anti-tumor activity for more
than 26 months in patients treated with Odomzo® with no new
safety concerns. At the 30-month follow-up, patients with locally
advanced BCC had an overall response rate (ORR) as per central
review of 56% with Odomzo® 200 mg. The most frequent grade
3 and 4 adverse reactions occurring in more than 2% of patients
were fatigue, decreased weight and muscle spasms. Odomzo® gives
Sun Pharma an opportunity to meaningfully expand its already
established branded dermatology business and support its expansion
into branded oncology with a launched brand. This acquisition has
the potential to leverage and expand the relationships that the
Dusa sales team has with dermatologists that treat common pre-
cancerous skin conditions.
In December 2016, Sun Pharma entered into an exclusive
worldwide licensing deal to further develop MM-II, a novel
pharmaceutical candidate for the treatment of pain in osteoarthritis.
MM-II is a novel non-opioid product that leverages the physical
properties of proprietary liposomes to lubricate arthritic knee joints,
thereby reducing friction and wear, consequently leading to joint
pain reduction. MM-II is an intra-articular bio-lubricant injection,
which is being developed to provide symptomatic relief of mild-
to-moderate osteoarthritis pain. The product is based on patent-
protected technology licensed by Moebius Medical from the Hebrew
University of Jerusalem, Technion Israel Institute of Technology and
Hadassah Medical Centre.
Progress on cGMP compliance
During the year, Sun Pharma made significant progress towards 24x7
cGMP compliance. Many of its facilities underwent successful audits
by multiple regulatory agencies, including the USFDA. At the same
time, remediation work continued at some of the facilities, which
have been impacted by cGMP deviations. Key highlights were:
In November 2016, Sun Pharma’s Halol facility underwent a
re-inspection by the USFDA as a follow-up to the warning letter
issued to the facility in December 2015. The USFDA pointed out
nine deviations post the re-inspection, none of which were repeat
deviation from the previous time. The Company has filed its response
to these deviations within the stipulated timelines and is in the
process of implementing remediation measures to address these
deviations. Sun Pharma is unlikely to receive any new approvals from
the Halol facility till it is re-certified by the USFDA.
In March 2017, the USFDA informed Sun Pharma that it will be
lifting the Import Alert imposed on Sun Pharma’s Mohali (Punjab)
manufacturing facility and remove the facility from the Official
Action Initiated (OAI) status. This action has cleared the path for
Sun Pharma to supply approved products from the Mohali facility to
the US market, subject to normal USFDA regulatory requirements,
as well as make this facility available for future filings. The Mohali
facility was inherited by Sun Pharma as part of its acquisition of
Ranbaxy Laboratories Ltd. in 2015. The USFDA had acted against
the Mohali facility in 2013, when it ordered the facility to be fully
subjected to Ranbaxy’s Consent Decree of permanent injunction.
Certain conditions of the Consent Decree will continue to be
applicable to the Mohali facility. This development illustrates Sun
Pharma’s commitment to work closely with the USFDA and strive for
100% cGMP compliance at its manufacturing facilities.

S U N P H A R M A C E U T I C A L I N D U S T R I E S L I M I T E D2 0
Japan entry
Towards the end of FY16, Sun Pharma had taken an important
step towards establishing its presence in Japan through the
acquisition of 14 established prescription brands from Novartis AG
and Novartis Pharma AG for a consideration of US$ 293 Million. In
FY17, Sun Pharma initiated the process of transferring the marketing
authorisations of these brands from Novartis to itself. The transfer
of these brands has commenced in a phased manner beginning
October 2016 onwards. Simultaneously, Sun Pharma entered into
a distribution alliance with Mitsubishi Tanabe Pharma Corporation
(MTPC) for these brands. Under this alliance, following the transfer
of manufacturing and marketing rights to Sun Pharma, MTPC will
market and distribute all 14 brands as well as provide information on
their proper use to healthcare professionals in Japan. Through this
alliance, Sun Pharma can leverage MTPC’s specialised expertise to
create a strong business foundation in Japan.
Enhancing presence in Russia
In November 2016, Sun Pharma enhanced its presence in Russia
through the acquisition of 85.1% of JSC Biosintez, a Russian
pharmaceutical company engaged in manufacture and marketing
of pharmaceutical products in Russia and CIS region for US$ 24
Million. Sun Pharma also assumed a debt of approximately US$ 36
Million as part of this transaction. Biosintez focuses on the hospital
segment and had an annual revenue of approximately US$ 52
Million for 2015. It has a manufacturing facility in Penza region with
capabilities to manufacture a wide variety of dosage forms, including
pharmaceuticals for injections, blood substitutes, blood preservatives,
ampoules, tablets, ointment, creams, gels, suppositories and APIs.
This acquisition is consistent with Sun Pharma’s philosophy to invest
in strategic emerging markets. It provides the Company access to
local manufacturing capability across multiple dosage forms in Russia,
enabling it to serve the Russian pharmaceutical market effectively.
Buyback of shares
In June 2016, Sun Pharma’s Board of Directors approved the
buyback of 7.5 Million equity shares at a price of ` 900 per share. The
buyback was undertaken by the Company to return surplus funds to
the equity shareholders and thereby, enhancing the overall returns
to shareholders. This buyback was completed in October 2016,
resulting in return of ` 6.75 Billion to shareholders, including the
promoters of the Company.
Outlook Sun Pharma has embarked on various initiatives, globally, to drive
sustainable growth and profitability, and to enhance long-term
shareholder value.
Investing in specialty
Sun Pharma has invested significant resources in enhancing its global
specialty pipeline. These investments currently do not generate
commensurate revenue and cash flows, as a substantial portion of
the specialty pipeline is yet to be commercialised. The Company
is focusing on enhancing the share of specialty/branded business
and targeting differentiated product offerings. Dedicated teams
for the branded ophthalmic, dermatology, oncology and CNS are
being strengthened. A dedicated team for tildrakizumab has also
been formed. The Company simultaneously continues to explore
opportunities to expand its global specialty pipeline.
cGMP compliance
Ensuring 24x7 cGMP compliance is a top priority for Sun Pharma
and gets substantial attention from the top management. Over the
past two years, significant investments have been made in enhancing
systems, processes and talent to meet the stringent requirements
of global regulators, including the USFDA. As a part of this process
and to address the issues raised in the December 2015 warning
API Plant

CORPORATE OVERVIEW FINANCIAL STATEMENTSSTATUTORY REPORTS 01-07 80-27808-79
2 1A N N UA L R E P O RT 2 0 1 6 - 1 7
letter for the Halol facility, Sun Pharma has undertaken various
remedial measures. These remedial measures have resulted in
supply constraints for some of its products. New approvals for the
US from this facility have also been delayed. The Company expects
this situation to continue for some more time till the outstanding
deviations are resolved.
Post the significant remedial efforts undertaken over the past few
years, the USFDA re-inspected Sun Pharma’s Mohali facility in FY17;
indicating lifting of the import alert which was imposed on the facility
some years back.
During FY17, many of the Company facilities underwent audits by
various global regulatory authorities, including the USFDA. These
inspections have been successful, while there are outstanding deviations
at some facilities, which the Company is in the process of resolving.
Ranbaxy integration
Sun Pharma is on track to achieve the US$ 300 Million synergy
benefits in FY18 from the Ranbaxy integration. These synergies
will be driven by a combination of revenue synergies, procurement
synergies, manufacturing rationalisation, productivity improvements
and other cost-management measures. These synergy benefits will
help the Company fund its evolving specialty business. As a part
of the integration process, the Company has been taking steps to
rationalise product portfolios and its global manufacturing presence.
R&D investments
Significant resources are being allocated to R&D to strengthen the
specialty and generic pipeline, including complex generics. Efforts are
being made to develop, file and commercialise niche, low-competition
products to help counter the significant price erosion in the US
generics market. This will mandate increased R&D investments,
including that for the development of the specialty pipeline.
FY18 guidance
FY18 is likely to be a challenging year for Sun Pharma. The US generics
industry is facing rapidly changing market dynamics. Increased
competitive intensity and customer consolidation is leading to
pressure on pricing. Continued delay in approvals from the Halol
facility is also impacting Sun Pharma. Also, the Company had the
benefit of Imatinib exclusivity in US in FY17 which has ended in July
2016. In the Indian market also, there is uncertainty amongst the trade
channels due to GST implementation, although it may be temporary.
Given these factors, growth could be a challenge in FY18 and the
Company expects a single-digit decline in consolidated revenues for
FY18 over FY17.
Despite these challenges, Sun Pharma continues to invest in
enhancing its global specialty and complex generics pipeline.
Investments will also continue for setting up the requisite front-end
capabilities for the specialty business in the US. These investments
may not have commensurate revenues in FY18. The consolidated
R&D investments for FY18 will be about 9-10% of revenues. The
Company expects a gradually increasing tax rate over the next few
years while capex for FY18 is estimated at US$ 350 Million.
Business segment reviewUS BUSINESS
584Cumulative ANDAs filed
Revenue contribution
45%
32%FY12-17 Revenue CAGR
` 137 BnRevenue from division
427Cumulative ANDAs approved
(As on March 31, 2017)
Overview Sun Pharma is the 4th largest specialty generic pharmaceutical
company in the US market with presence across generics, branded
and OTC segments.
Key focus areas include CNS, dermatology, cardiology, oncology
and ophthalmics, among others.
One of the very few companies to have farm-to-market capabilities
for controlled substances.
Sun Pharma’s integrated manufacturing facilities have capability
to manufacture products, both onshore and offshore across a variety
of dosage forms including liquids, creams, gels, sprays, injectables,
tablets, capsules and drug-device combinations.
The Company has a comprehensive basket of 584 ANDAs, 41
NDAs and 1 BLA filed and 427 ANDAs and 36 NDAs approved across
multiple therapies.
As of March 31, 2017, Sun Pharma had 157 ANDAs, 5 NDAs and
1 BLA pending USFDA approval. This pipeline includes a combination
of complex generics, First-to-File opportunities and normal generics,
as well as specialty products.

S U N P H A R M A C E U T I C A L I N D U S T R I E S L I M I T E D2 2
Chart 10
Performance highlights, FY17 Overall US revenues grew by 2% to 137,588 Million in FY17.
The generics market in the US continues to face a challenging pricing
environment driven by customer consolidation and increased competitive
intensity. Besides these challenges, the cGMP issues at Halol facility has
resulted in delaying new product approvals, which has impacted overall
revenues from the US.
Key contributors to revenues include Imatinib Mesylate Tablets
(therapeutic equivalent to Gleevec® for indications approved by
the USFDA). This product enjoyed the benefit of 180-day marketing
exclusivity in the US, which commenced in February 2016 and expired in
July 2016 post which, generic competition has intensified.
Launch of authorised generic versions of Olmesartan and its
combinations in October 2016 was another key revenue contributor. The
launch was pursuant to a distribution and supply agreement between
Sun Pharma and Daiichi Sankyo Inc., which granted Sun Pharma,
exclusive rights to distribute these tablets in the US for a pre-determined
period.
The US revenues for Taro (a 73% subsidiary) declined by 8% for
FY17 driven primarily by a difficult generic pricing environment,
particularly in the US, resulting from more intense competition
among manufacturers, new entrants to the market, buying
consortium pressures, and a higher ANDA approval rate from the
USFDA.
Sun Pharma’s key specialty products in the US, viz. Absorica and
Kerastick also contributed to the top-line growth.
FY17 Acceptance of tildrakizumab filing by the USFDA for the US market (in May 2017)
Acquired Ocular Technologies - gives access to Seciera, a product for treating dry eyes
Launched BromSite in US
Acquired Odomzo - branded oncology product from NovartisFY16 Acquired InSite vision to strengthen the ophthalmic portfolioFY15 Expanded presence in the US with the addition of Ranbaxy’s US businessFY14 Acquired Pharmalucence to get access to sterile injectables capabilityFY13 Acquired DUSA and entered the branded specialty market
Acquired URL’s generic businessFY10 Acquired Taro Pharma and forayed into the dermatology marketFY08 onwards Launched many complex generics and few FTFsFY98-FY10 Enhanced and strengthened the US businessFY98 Entered into the US market by acquiring Caraco
Table 7
US business milestones
ANDA FILINGS 427 ANDA APPROVALS BY THERAPEUTIC AREA
CN
S
Skin
CV
S
Pai
n
Alle
rgy
On
colo
gy
Met
abo
lism
An
tib
ioti
c
Gas
tro
Oth
er
63
10
2
10
3
44
30
21
14
12
10
28
FY
11
25
FY
12
22
FY
13
22
FY
14
27
FY
15
19
FY
16
22
FY
17
27
(As on March 31, 2017)

CORPORATE OVERVIEW FINANCIAL STATEMENTSSTATUTORY REPORTS 01-07 80-27808-79
2 3A N N UA L R E P O RT 2 0 1 6 - 1 7
Chart 11
Outlook and future focus Enhance share of specialty business.
Continue to focus on complex generics and high entry
barrier segments.
Ensure broad product offering to customers across multiple
dosage forms.
Gain critical mass in key therapeutic segments.
Improve service levels for customers through 24x7 cGMP
compliance, product robustness and supply chain consistency.
INDIAN BRANDED GENERIC BUSINESS
No. 1Ranked by prescriptions with 11 different classes of doctors
26%Revenue contribution
22%FY12-17 Revenue CAGR
No. 1Ranked in Indian pharmaceutical industry, with 8.6% market share
` 77 BnRevenue from division
(As on March 31, 2017)
Overview Sun Pharma is India’s largest pharmaceutical company with 8.6%
market share. It is one of leaders in the chronic segment and enjoys
strong positioning in acute segment. It specialises in technically
complex products, offering a comprehensive therapy basket.
The Company owns 30 brands of the top 300 pharmaceutical
brands in India.
It has a well-diversified portfolio with low brand concentration.
The top 10 brands contribute over 18% of India revenues.
Sun Pharma has one of the widest reach to the medical fraternity
in India with a 9,200+ strong sales force reaching around 600,000
doctors.
The sales force has one of the highest productivity among key
players in India.
Performance highlights, FY17 Revenue from Indian business increased by 8% to ` 77,491 Million
in FY17.
This growth was achieved, despite the temporary disruption
caused by demonetisation and a negative price impact of wholesale
price index on products under price control.
THERAPEUTIC REVENUE BREAK-UP9
DermatologyGynaecologyVitamins/Minerals/Nutrients RespiratoryOpthalmologyOthers
CardiologyNeuro-PsychiatryGastroenterologyAnti-InfectivesDiabetologyPain/Analgesics
17%
12%
19%
Market Share 8.6%
9%
11%
5%
7%
2%4%
4%4%
6%
Corporate Office

S U N P H A R M A C E U T I C A L I N D U S T R I E S L I M I T E D2 4
Outlook and future focus The Indian pharmaceutical market offers good long-term potential
driven by increasing per capita income, rising healthcare awareness,
higher incidence of chronic ailments and gradually increasing
insurance coverage.
Government-mandated price controls and other regulatory
changes coupled with fierce competitive intensity will continue to be
key challenges for the industry.
Sun Pharma’s future focus is on improving the productivity of
India business and to maintain leadership position in a severely
competitive market.
The Company is consistently innovating to ensure high brand
equity with doctors.
Efforts are ongoing to enhance product basket through own
development and in-licensing.
EMERGING MARKETS
15%Revenue contribution
100+ countriesPresence across emerging markets
` 45 BnRevenue from division
(As on March 31, 2017)
Overview Sun Pharma is among the leading Indian companies in emerging
markets with an extensive portfolio of branded products and
presence across about 100 countries.
The key focus markets include Brazil, Mexico, Russia, Romania,
South Africa and complementary and affiliated markets.
The Company has local manufacturing assets in eight countries;
thus,facilitating a more meaningful participation in respective
markets.
A 2300+, sales force leverages the opportunities offered by these
markets.
Performance highlights, FY17 Revenue from emerging markets grew by 26% to ` 45,299 Million
in FY17.
The growth is broad-based among emerging markets.
In November 2016, Sun Pharma acquired JSC Biosintez to
enhanceits presence in Russian market. The acquisition gives access
to a local manufacturing facility as well as expands the product
offering for the Russian and CIS markets. Outlook and future focus
Given the favourable macroeconomic parameters, emerging
markets offer good long-term potential.
Evaluate opportunities to enhance presence in key markets.
Sun Pharma’s key focus will be to gain critical mass in key emerging
markets by leveraging its product portfolio and front-end presence in
these markets.
Specialist February 2016 Specialist February 2017
Psychiatrists 1 Psychiatrists 1
Neurologists 1 Neurologists 1
Cardiologists 1 Cardiologists 1
Orthopaedic 1 Orthopaedic 1
Gastroenterologists 1 Gastroenterologists 1
Nephrologists 1 Nephrologists 1
Diabetologists 1 Diabetologists 1
Consulting Physicians 1 Consulting Physicians 1
Dermatologists 1 Dermatologists 1
Urologists 1 Urologists 1
Oncologists 1 Oncologists 1
Ophthalmologits 1 Ophthalmologists 2
Chest Physicians 1 Chest Physicians 2
Table 8
Leadership in prescription rankings10

CORPORATE OVERVIEW FINANCIAL STATEMENTSSTATUTORY REPORTS 01-07 80-27808-79
2 5A N N UA L R E P O RT 2 0 1 6 - 1 7
Efforts are on to develop, file and commercialise more products
across therapeutic baskets to meaningfully participate in this growth
opportunity.
Simultaneously, the Company is focused on improving business
profitability in emerging markets by launching complex products and
reducing presence in low profitable non-core product segments.
REST OF THE WORLD
9%Revenue contribution
` 26 BnRevenue from division
(As on March 31, 2017)
Overview Sun Pharma’s presence in the Rest of the World (RoW) spans
across Western Europe, Japan, Canada, Israel, Australia and New
Zealand.
The product basket consists of injectables, hospital products, as
well as products for the retail market.
The Company made an entry in Japan (in March 2016) through
acquisition of 14 prescription brands from Novartis.
Performance highlights, FY17 Revenues for RoW markets increased by 19% to ` 25,832 Million
in FY17.
During the year, the Company entered into a distribution alliance
with Mitsubishi Tanabe Pharma Corporation (MTPC) for distribution
of 14 brands acquired from Novartis in March 2016. Through this
alliance, Sun Pharma can leverage MTPC’s specialised expertise to
create a strong business foundation in Japan.
Outlook and future focus Ramp up presence in Japan post transfer of Novartis brands to
Sun Pharma.
Improve profitability in developed European markets.
ACTIVE PHARMACEUTICAL INGREDIENTS (API) BUSINESS
5%Revenue contribution
21%FY12-17 Revenue CAGR
14API manufacturing units
291DMF/CEP approvals
428DMF/CEP filings
` 16 BnRevenue from division
As on March 31, 2017
Formulation Plant

S U N P H A R M A C E U T I C A L I N D U S T R I E S L I M I T E D2 6
17Key brands
20+Country presence 300,000+
Outlets in India
Top 10OTC company in three markets
2,500+Sales and distribution representatives in India
67,000+Retail pharmacies internationally
Overview API capability is of strategic importance as it provides cost
competitiveness, speed to market and supply reliability through
backward integration. A significant portion of API production acts as
inputs for the Company’s formulations business.
The Company manufactures over 300 APIs across 14 locations
adding over 20 APIs to the portfolio, annually.
Besides captive consumption, Sun Pharma also supplies APIs to
customers, comprising large generic and innovator companies.
The API manufacturing facilities are in India, Australia, Israel,
Hungary and the US. Performance highlights, FY17
Revenue from APIs and other sources increased by 14% to
`15,979 Million in FY17.
The API revenues include the full benefit of consolidation of
the opiates business (Australia) acquired from GSK last year in
September 2015.
Outlook and future focus Expand API portfolio to enhance the scale and scope of API
operations.
Ensure long-term supply relationships with global customers.
GLOBAL CONSUMER HEALTHCARE BUSINESS
Overview Sun Pharma is among the top 10 consumer healthcare companies
in India, Romania, Nigeria and Myanmar.
Key focus markets comprise India, Russia, Romania, Nigeria, South
Africa and Myanmar, while growth markets include Ukraine, Poland,
Kazakhstan, Thailand and UAE.
Sun Pharma has a dedicated sales force in each of these markets.
The Company has presence across OTC sub-categories like
Vitamins and Minerals, Cold and Flu, Analgesics, Digestive and
Dermatology.
Key highlights, FY17 In October 2016, Sun Pharma launched Revital H Woman’s
‘Healthy Conversations’ initiative in India. This unique initiative aims
to initiate a conversation about women’s health. It was launched
with the objective to encourage women to understand their health
requirements and impact of their health on their families and overall
society. Revital-H Woman’s, Healthy Conversations, will reach out
to women across 20 cities in India. It has created a special digital
platform www.revitalwoman.com to reach over two million women
in three months. Through the, Healthy Conversations, initiative, the
Company encourages women to interact with expert nutritionists to
understand and address their nutritional needs. The product, Revital
H Woman is a combination of 12 Vitamins, 10 Minerals and Ginseng,
which help in keeping women physically active and mentally relaxed
throughout the day. Among other benefits, vitamins and minerals
in Revital H Woman help in maintaining healthy bones, reducing
fatigue, and maintaining healthy hair, skin and nails.
Outlook and future focus5, 6
The Indian Consumer Healthcare market has grown at about 11.8%
CAGR for the past five years.
Globally, emerging markets like Russia, Brazil and China have
grown in higher single digits.
Sun Pharma intends to continue investing in the accelerating
OTC business across key markets through brand building and brand
extensions.
It intends to have a broader presence across OTC sub-categories in
various markets.
The Company is focusing on maintaining leadership in existing
markets by offering innovative solutions to consumers.

CORPORATE OVERVIEW FINANCIAL STATEMENTSSTATUTORY REPORTS 01-07 80-27808-79
2 7A N N UA L R E P O RT 2 0 1 6 - 1 7
R&D INNOVATION ORIENTED APPROACH Sun Pharma has a strong presence in both regulated and emerging
markets. This can be attributed to the Company’s strong pipeline of
generic and branded-generic products. Its research and development
(R&D) capabilities have enabled Sun Pharma to produce key
technology-intensive products, enhancing its presence in international
markets. The Company has a portfolio of about 2,000 products across
the world.
The Company employs about 2,000 research scientists working
in multiple R&D centres equipped with cutting-edge technologies
for research. With their expert knowledge in developing generic
drugs and Active Pharmaceutical Ingredients (APIs), they form the
backbone of the Company’s R&D facility. Further, the team has
the required skills and relevant experience in creating Novel Drug
Delivery Systems (NDDS). Besides, Sun Pharma has been investing
significant resources in developing completely new chemical and
biological drugs for global markets. Currently, the Company has six
such drugs in its pipeline, which are either being developed or are
awaiting regulatory approvals.
Sun Pharma’s generic R&D capabilities have enabled it to
commercialise a diverse range of products, including liposomal
products, auto-injectors, lyophilized injections, nasal sprays, and
controlled release dosage forms. Apart from these, the Company
manufactures orals, liquids, ointments, gels, sprays, and injectables,
among others.
In addition, Sun Pharma has experience in formulation of taste
masking, spray-drying, drug-layering, nano-milling, lyophilization and
other pharmaceutical unit operations.
R&D investments are necessary for a company like Sun Pharma
to maintain sustainable growth and enhance its market presence.
Sun Pharma spent approximately 8% of sales, in FY17, on R&D. It
believes that continuous investments in R&D will influence its overall
performance positively. Going forward, it will help Sun Pharma
differentiate itself by focusing on specialty products and technically
complex products. In pursuit of differentiation, the Company is
focusing on developing non-fringing formulations and development
of specialty products. Additionally, Sun Pharma has a strong
Intellectual Property Rights support team, which enables it to patent
its innovations globally and in developing non-infringing products.
Chart 12
Research and Development Investment
R&D EXPENDITURE
FY11
3.3
FY12
4.4
FY13
7.0
FY14
10
.4
FY15
19
.6
FY16
23
.0
FY17
23
.17
.6%
8.3
%
7.2
%
6.5
%
6.3
%
5.6
%
5.8
%
R&D Investment (` Bn) R&D Investment (% of Sales)
(As of March 31, 2017)
FILINGS AND APPROVALS
File
d5
84
Ap
pro
ved
42
7
ANDA
File
d4
2
Ap
pro
ved
36
NDA/BLA
File
d4
28
Ap
pro
ved
29
1
DMF/CEPF
iled
10
23
Gra
nte
d7
51
PATENTS
` 100 BnCumulative R&D expenditure, over the years, amounts to `100 Billion till date.

S U N P H A R M A C E U T I C A L I N D U S T R I E S L I M I T E D2 8
584Cumulative ANDAs filed
428DMF/CEP cumulativeapplications filed
1,023Total patent applicationssubmitted
27ANDAs filed in FY17
42Cumulative NDA/BLA filed
15DMFs approved in FY17
18ANDAs approved in FY17
36Cumulative NDA/BLA approved
427Cumulative ANDAsapproved
291DMF/CEP cumulativeapplications approved
751Total patents granted
29DMFs filed in FY17
GLOBAL MANUFACTURING CAPABILITIES Sun Pharma owns 42 active manufacturing assets spread across six
continents. India, the US, Brazil, Russia, Canada, Hungary, Israel,
Bangladesh, Mexico, Romania, Ireland, Morocco, Nigeria, South
Africa, Malaysia and Australia host these production units. These
facilities ensure that the Company provides best-in-class products
to patients across 150 countries. The operations are vertically
integrated, which enables maintenance of high quality, low cost and a
quick market entry across geographies.
Sun Pharma’s manufacturing operations are focused on producing
generics, branded generics, speciality, over-the-counter (OTC)
products, anti-retrovirals (ARVs) and Active Pharmaceutical
Ingredients (APIs). The Company also produces intermediates in the
full range of dosage forms, including tablets, capsules, injectables,
ointments, creams and liquids. Besides, it manufactures APIs, for
controlled substances, steroids, peptides and anti-cancers products.
Sun Pharma believes in meticulous following global manufacturing
standards. It’s manufacturing facilities have been certified by
regulatory authorities of USA (FDA), Europe (EMA), the UK (MHRA),
Australia (TGA), South Africa (MCC) and Germany (BfArM).
Additionally, the Company has been certified by ANVISA (Brazil),
WHO (Geneva), KFDA (Korea) and PMDA (Japan). It stresses on
24x7 compliance to cGMP, which is imperative for a global business.
Formulation Plant

CORPORATE OVERVIEW FINANCIAL STATEMENTSSTATUTORY REPORTS 01-07 80-27808-79
2 9A N N UA L R E P O RT 2 0 1 6 - 1 7
28 finished dosage manufacturing sites 14 API manufacturing sites
India: 13 India: 9
US: 4 Australia: 2
One each in Canada, South Africa, Malaysia, Mexico, Hungary, Israel, Bangladesh, Romania, Russia, Egypt and Nigeria
One each in Israel, US and Hungary
Delivery formats Key API Plants
Orals: Tablets/Capsules, Semisolids, Liquids and Suppository The Panoli and Ahmednagar (both in India) has USFDA and European approvals. These are standalone units for peptides, anti-cancer, steroids and sex hormones, among others
Injectables/Sterile: Vials, Ampoules, Pre-filled Syringes, Gels, Lyophilized Units, Dry powder, Eye drops, MDI and Aerosols
The plants in Australia, Hungary and the US (Tennessee) are capable of manufacturing of controlled substances
Topicals: Creams and Ointments
Formulation Plant
API Plant
API and Formulation Plant
Latrobe, Australia
Port Fairy, Australia
Jammu
Paonta
Lagos (Nigeria)
Be-Tabs (South Africa)Baddi
Toansa
MohaliHalol
DahejSilvassa
AnkleshwarPanoli
MalanpurAhmednagarDadraGoa
Maduranthakam
Sikkim Plant (2 units)
GuwahatiKarkhadi
Dewas
Iztapalapa (Mexico)Tennessee
GLOBAL MANUFACTURING FOOTPRINT
Wilmington M.A.Billerica, MA
Ontario (Canada)New Jersey (US)
Cranbury
Giza, (Egypt)Haifa (Israel)
Tiszavasvari (Hungary)
Cluj (Romania)
Bangladesh Plant
Kuala Lumpur (Malaysia)
Penza (Russia)

S U N P H A R M A C E U T I C A L I N D U S T R I E S L I M I T E D3 0 S U N P H A R M A C E U T I C A L I N D U S T R I E S L I M I T E D3 0
MANAGING TALENTBeing a global pharmaceutical company, Sun Pharma attracts diverse
talents from over 50 nationalities. The Company, with its vibrant
work culture, nurtures this assorted talent pool beyond any race,
gender or nationality. While concentrating on building the bench-
strength for future leadership, Sun Pharma offers individuals good
growth opportunities.
With its 30,000+ strong workforce, Sun Pharma engages in several
skill development activities. The Company has various management
programmes for employees to enhance their skills. Additionally,
its knowledge-sharing platforms allow employees to grow
professionally and get future ready.
The management at Sun Pharma believes engaging employees
helps in reduced employee attritions. The Company promotes equal
opportunities for individuals, and values healthy work-life balance.
ADHERENCE TO QUALITYSun Pharma’s commitment to implementing a robust global quality
management system is based on its determination to sustain a
culture of operational excellence, meeting and exceeding the
expectations of all stakeholders, including regulators, patients and
customers. Putting patients first is Sun Pharma’s motto.
The Company’s global Quality Management Team ensures that
every product it manufactures and distributes, complies with all
internationally accepted good practices and standards of quality,
purity, efficacy and safety.
To maintain quality standards, every facility has well-defined
procedures and systems in place. In compliance with the
requirements of the Current Good Manufacturing Practices (cGMP),
WHO, PIC’s and EU GMP, the Company ensures that the operating
procedures meet the very exacting standards of regulators like the
USFDA, EMA, HC, WHO and TGA, among others.
Each site has well-trained personnel for quality control, along with
a regulatory affairs department ensuring strict adherence to quality
systems and procedures. The teams are guided by a Corporate
Quality Unit (CQU). CQU ensures that the latest updates in GMP
are being translated into guidelines, standard operating procedures
(SOPs) and protocols. The teams ensure that these guidelines are
implemented to deliver quality products every time. In addition,
the manufacturing plants are audited by an autonomous Corporate
Compliance Department with a view to ensuring 24 x 7 compliance
and conformance.
During FY17, many of the Company’s facilities underwent audits by
various global regulatory authorities, including the USFDA. These
inspections have been successful, while there were outstanding deviations
at some facilities, which the Company is in the process of resolving.
INTERNAL CONTROL Sun Pharma believes that internal control is a prerequisite of the
principle of Governance and that freedom should be exercised
within a framework of checks and balances. The Company has a
well-established internal control framework, which is designed to
continuously assess the adequacy, effectiveness and efficiency of
financial and operational controls. The management is committed
to ensure an effective internal control environment, commensurate
with the size and complexity of the business, which provides an
assurance on compliance with internal policies, applicable laws,
regulations and protection of resources and assets.
An independent and empowered Global Internal Audit Function
at the corporate level carries out risk-focused audits across all
businesses (both in India and overseas), which actively identifies
areas, where business process controls are ineffective or may
need enhancement. These reviews include financial, operational,
compliance controls and risk mitigation plans. The Audit Committee
of the Board periodically reviews key findings and provides
strategic guidance. The Company’s operating management closely
monitors the internal control environment and ensures that the
recommendations are effectively implemented.
DISCLAIMERStatements in this ‘Management Discussion and Analysis’ describing the Company’s objectives, projections, estimates, expectations, plans or predictions or industry conditions or events are ‘forward-looking statements’ within the meaning of applicable securities laws and regulations. Actual results, performance or achievements could differ materially from those expressed or implied. Important factors that could make a difference to the Company’s operations include global and Indian demand supply conditions, finished goods prices, feedstock availability and prices, competitors’ pricing in the Company’s principal markets, changes in Government regulations, tax regimes, economic conditions within India and the countries within which the Company conducts businesses and other factors, such as litigation and labour unrest or other difficulties. The Company assumes no responsibility to publicly update, amend, modify or revise any forward-looking statements, based on any subsequent development, new information or future events or otherwise except as required by applicable law. Unless the context otherwise requires, all references in this document to ‘we’, ‘us’ or ‘our’ refers to Sun Pharmaceutical Industries Limited and consolidated subsidiaries.
BIBLIOGRAPHY1. IMS Market Prognosis, October 2016
2. Evaluate Pharma (World Preview, September-2016) & Deloitte
(Global Life Science Outlook 2015)
3. Deloitte (Global Life Sciences Outlook 2016)
4. Markets and Markets
5. Euromonitor 2016
6. Nicholas Hall 2015
7. Nicholas Hall 2016
8. IMS, IBEF
9. AIOCD-AWACS MAT March-2017
10. SMSRC Prescription Audit

80Standalone Financial Statements
32Board’s Report
170Consolidated Financial Statements
62Corporate Governance

SUN PHARMACEUTICAL INDUSTRIES L IMITED32
BOARD’S REPORT
Your Directors take pleasure in presenting the Twenty-Fifth Annual Report and Company’s Audited Financial Statements for the financial year ended March 31, 2017.
FINANCIAL RESULTS
(` in Million)
ParticularsStandalone Consolidated
Year ended March 31, 2017
Year ended March 31, 2016
Year ended March 31, 2017
Year ended March 31, 2016
Total – Revenue 78,067.0 78,636.9 315,784.4 284,870.3 Profit Before Tax (324.4) (10,820.6) 90,478.7 65,706.3 Tax Expense:
-Current Tax 25.1 54.5 4,046.4 11,954.1 -Deferred Tax Charge / Credit - - 8,069.3 (2,816.4)
(Loss) / Profit after tax (349.5) (10,875.1) 78,363.0 56,568.6 Profit after Tax before Share in profit / (loss) of associates and non-controlling interests
- - 78,363.0 56,568.6
Share of Profit of Associates / Joint ventures (Net) - - 99.3 14.5 Net Profit after taxes and share of profit / (loss) of associates and joint ventures but before non-controlling interestsTotal Other Comprehensive Income (633.8) (247.9) (14,871.9) 14,353.4 Total Comprehensive Income (983.3) (11,123.0) 63,590.4 70,936.5 Total Comprehensive Income for the period attributable to:
-Owners of the Company (983.3) (11,123.0) 56,306.1 58,251.6 -Non-Controlling Interest 7,284.3 12,684.9
Opening balance in Retained Earnings 126,353.4 146,184.5 251,630.4 216,743.1 Amount available for appropriation (949.6) (11,141.9) 68,933.4 45,109.6 Dividend on Equity Shares (2,406.8) (7,219.5) (2,406.8) (7,219.5) Corporate Dividend tax (74.7) (1,469.7) (490.0 ) (1,469.7) Transfer to various Reserves:
-Capital redemption Reserve (7.5) - (7.5) - -Debenture redemption Reserve - - (1,041.7) (1,041.7) -Capital reserve - - (50.6) (188.9) -Buy-back of equity shares by overseas subsidiary company - - (10,110.3) (302.3) -Legal reserve - - - (0.2) -General reserve - - - -
Closing balance in Retained Earnings 122,914.8 126,353.4 306,456.9 251,630.4
Figures for Financial Year 2015-16 have been restated as per Ind AS and therefore may not be comparable with financials for Financial Year 2015-16 approved by the Directors and disclosed in the Financial Statement of previous year.

33ANNUAL REPORT 2016-17
CORPORATE OVERVIEW FINANCIAL STATEMENTSSTATUTORY REPORTS 01-07 80-27808-79
DIVIDENDYour Directors are pleased to recommend an equity dividend of ` 3.50/-(Rupees Three and Fifty Paise only) per equity share of `1/- each [previous year ` 1/- per equity share of `1/- each] for the year ended March 31, 2017, subject to the approval of the equity shareholders at the ensuing Annual General Meeting.
CHANGES IN CAPITAL STRUCTUREThe changes in the capital structure of the Company during the year under review, are as follows:
i. The Company allotted 62682 equity shares of `1/- each under Sun Employee Stock Option Scheme-2015.
ii. On October 18, 2016, the Company completed Buyback of 7,500,000 (Seventy Five Lakhs) fully paid-up equity shares of ` 1/- each (representing about 0.31% of the total outstanding pre Buyback equity shares of our Company) at a price of ` 900/- (Rupees Nine Hundred only) per equity share for an aggregate amount of ` 6,750,000,000/- (Rupees Six Billion Seven Fifty Million only) from the equity shareholders/beneficial owners holding equity shares as on Record Date i.e. July 15, 2016 on proportionate basis through the tender offer route using mechanism for acquisition of shares through Stock Exchange.
Consequent to above changes, the paid up share capital of the Company decreased to ` 2,399,291,181/- (Rupees Two Billion Three Hundred Ninety-Nine Million Two Hundred Ninety One Thousand One Hundred Eighty-One only) as on March 31, 2017 from ` 2,406,728,499/- (Rupees Two Billion Four Hundred Six Million Seven Hundred Twenty-Eight Thousand Four Hundred Ninety-Nine only).
Further, on May 26, 2017, the Company alloted 3000 equity shares of `1/- each under Sun Employee Stock Option Scheme - 2015 and 12,000 equity shares of `1/- each under Sun Employee Stock Option Plan - 2015.
SCHEME OF ARRANGEMENT FOR AMALGAMATIONDuring the year, the Board of Directors at its meeting held on November 10, 2016 approved the Scheme of Arrangement among Sun Pharma Medisales Private Limited, Ranbaxy Drugs Limited, Gufic Pharma Limited, Vidyut Investments Limited (collectively known as “Transferor Companies”, which are the wholly owned subsidiaries of the Company) and the Company and their respective members and creditors (“Scheme of Arrangement”). The Hon’ble National Company Law Tribunal, at Ahmedabad vide its order dated April 18, 2017, dispensed with convening of meeting of secured creditors of the Company and ordered to convene the meeting
of equity shareholders and unsecured creditors of the Company on June 20, 2017 to approve the Scheme of Arrangement. The appointed date for the said amalgamation is April 1, 2017 or such other date as may be agreed between the Transferor Companies and the Company and approved by the National Company Law Tribunal. Pursuant to Scheme of Arrangement, no consideration shall be paid and no shares of the Company shall be issued and allotted on amalgamation. The Scheme of Arrangement will enable the Company to consolidate and effectively manage the Transferor Companies and the Company in a single entity, which will provide several benefits including synergy, economies of scale, attain efficiencies and cost competitiveness.
EXTRACT OF ANNUAL RETURNThe extract of Annual Return as provided under sub-section (3) of Section 92 of the Companies Act, 2013 (‘the Act’) as prescribed in form MGT-9 is enclosed as “Annexure A” to this Report.
SUBSIDIARIES/ JOINT VENTURES/ ASSOCIATE COMPANIES The statement containing the salient features of the Financial Statements of the Company’s subsidiaries/ joint ventures/ associate companies of the Company is given in Form AOC – 1, which forms a part of this Annual Report.
The highlights of performance of subsidiaries, joint ventures and associate companies and their contribution to the overall performance of the Company during the financial year is given under Annexure A of the Consolidated Financial Statements forming part of this Annual Report.
Details pertaining to companies that became subsidiaries/ joint ventures /associates and those that ceased to be the subsidiaries/ joint ventures/ associates of the Company during the year are provided in Note 39 of the notes to the Consolidated Financial Statements, forming part of this Annual Report.
DIRECTORS & KEY MANAGERIAL PERSONNELMr. Israel Makov and Mr. Sailesh T. Desai, Directors of the Company retire by rotation and being eligible offer themselves for re-appointment at the ensuing Annual General Meeting.
Mr. Kalyanasundaram Subramanian was appointed as an Additional and Whole-time Director of the Company, without remuneration, w.e.f. February 14, 2017 as per the provisions of Section 161(1) of the Act and he shall hold the office upto the date of ensuing Annual General Meeting. The Board recommends appointment of Mr. Kalyanasundaram Subramanian as a Whole-time Director of the Company for a period of 2 (Two) years upto February 13, 2019 without any remuneration, for approval of the members at the ensuing Annual General Meeting.

SUN PHARMACEUTICAL INDUSTRIES L IMITED34
The term of appointment of Mr. Dilip S. Shanghvi as Managing Director will expire on March 31, 2018. He has made significant contribution to overall growth of the Company’s business. Your Directors recommend the re-appointment of Mr. Dilip S. Shanghvi for a further period of five years from April 1, 2018 to March 31, 2023, at remuneration as proposed in the resolution.
Appropriate resolutions for the appointment of the Directors are being placed for your approval at the ensuing Annual General Meeting. Your Directors recommend the appointment of the aforesaid Directors by the Members at the ensuing Annual General Meeting.
Mr. Uday Baldota, Chief Financial Officer of the Company, has resigned as Chief Financial Officer w.e.f. June 19, 2017 to assume office as Chief Executive Officer of Taro Pharmaceutical Industries Limited, a subsidiary of the Company and Mr. C.S. Muralidharan has been appointed as Chief Financial Officer w.e.f June 19, 2017 at the Board Meeting held on May 26, 2017.
DECLARATION BY INDEPENDENT DIRECTORSThe Company has received declarations from all the Independent Directors of the Company confirming that they meet with the criteria of independence as prescribed under sub-section (6) of Section 149 of the Act and as per SEBI (Listing Obligations and Disclosure Requirements) Regulations, 2015 (“Listing Regulations, 2015”).
REMUNERATION POLICY FOR DIRECTORS, KEY MANAGERIAL PERSONNEL AND OTHER EMPLOYEES AND CRITERIA FOR APPOINTMENT OF DIRECTORSFor the purpose of selection of any Director, the Nomination & Remuneration Committee identifies persons of integrity who possess relevant expertise, experience and leadership qualities required for the position. The Committee also ensures that the incumbent fulfills such criteria with regard to qualifications, positive attributes, Independence, age and other criteria as laid down under the Act, Listing Regulations, 2015 or other applicable laws. The Board has, on the recommendation of the Nomination & Remuneration Committee framed a policy on remuneration of Directors & Key Managerial Personnel. The Remuneration Policy of the Company is enclosed as Annexure B to Corporate Governance Report, which forms part to this Report.
FAMILIARISATION PROGRAMME FOR THE INDEPENDENT DIRECTORSIn compliance with the requirements of Regulation 25(7) of the Listing Regulations, 2015, the Company has put in place a Familiarisation Programme for the Independent Directors to familiarise them with the Company, their roles, rights, responsibilities in the Company, nature of the industry in which the Company operates, business model etc. The details of the Familiarisation Programme conducted are available on the website of the Company
www.sunpharma.com and may be accessed through the web link: http://www.sunpharma.com/policies.
NUMBER OF MEETINGS OF THE BOARDThe Board of Directors of the Company met 6 (Six) times during the previous financial year on May 30, 2016; June 23, 2016; August 12, 2016; September 17, 2016; November 10, 2016 and February 14, 2017. The particulars of attendance of the Directors at the said meetings are detailed in the Corporate Governance Report of the Company, which forms a part of this Report. The intervening gap between the Meetings was within the period prescribed under the Act and Listing Regulations, 2015.
EVALUATION OF PERFORMANCE OF THE BOARD, ITS COMMITTEES AND INDIVIDUAL DIRECTORS During the year, the evaluation of the annual performance of individual directors including the Chairman of the Company and Independent Directors, Board and Committees of the Board was carried out under the provisions of the Act and relevant Rules and the Corporate Governance requirements as prescribed under Regulation 17 of Listing Regulations, 2015 and the circular issued by SEBI dated January 5, 2017 with respect to Guidance Note on Board Evaluation. The Nomination and Remuneration Committee had approved the indicative criteria for the evaluation based on the SEBI Guidance Note on Board Evaluation.
The Chairman of the Company interacted with each Director individually, for evaluation of performance of the individual directors. The evaluation for the performance of the Board as a whole and of the Committees were conducted by questionnaires.
In a separate meeting of Independent Directors, performance of Non Independent Directors and performance of the Board as a whole was evaluated. Further, they also evaluated the performance of the Chairman of the Company, taking into account the views of the Executive Directors and Non-executive Directors.
The performance of the Board was evaluated by the Board after seeking inputs from all the Directors on the basis of various criteria such as structure and diversity of the Board, experience of Director, strategy and performance evaluation, secretarial support, evaluation of risk, evaluation of performance of the management and feedback, independence of the management from the Board etc. The performance of the Committees was evaluated by the Board after seeking inputs from the Committee members on the basis of criteria such as mandate and composition, effectiveness of the committee, structure of the committee and meetings, independence of the committee from the Board and contribution to decisions of the Board. The Nomination and Remuneration Committee reviewed the performance of the individual Directors on the basis of the criteria such as knowledge and competency, fulfillment of functions, availability and attendance, initiative integrity contribution and commitment, independence, independent views and judgement etc.

35ANNUAL REPORT 2016-17
CORPORATE OVERVIEW FINANCIAL STATEMENTSSTATUTORY REPORTS 01-07 80-27808-79
HUMAN RESOURCES Your Company recognises that employees are the most valuable resource and endeavors to enable its employees to meet business requirements while meeting their career aspirations. The Human Resource agenda continues to support the business in achieving sustainable and responsible growth by building the right capabilities in the organisation. It continues to focus on progressive employee relations policies and building a high-performance culture with a growth mind-set where employees are engaged, productive and efficient. Globally the Company (including subsidiary and associate companies) has a dedicated human capital of over 30,000 employees at various locations across our Corporate Office, R & D Centers & more than 42 active Manufacturing locations, dedicated Sales Professionals across various geographies. Your Directors would also like to take this opportunity to express their appreciation for the hard work and commitment of the employees of the Company and look forward to their continued contribution. Information as per Section 197 (12) of the Act read with Rule 5(1) of the Companies (Appointment and Remuneration of Managerial Personnel) Rules, 2014 is provided in “Annexure B” to this report. Further, the information pertaining to 5(2) & 5(3) of the Companies (Appointment and Remuneration of Managerial Personnel) Rules, 2014, pertaining to the names and other particulars of employees is available for inspection at the Registered office of the Company during business hours and pursuant to the proviso to Section 136 (1) of the Act, the report and the accounts are being sent to the members excluding this. Any shareholder interested in obtaining a copy of the same may write to the Company Secretary/Compliance Officer at Corporate office or Registered office address of the Company.
DISCLOSURE UNDER THE SEXUAL HARASSMENT OF WOMEN AT WORKPLACE (PREVENTION, PROHIBITION AND REDRESSAL) ACT, 2013 Your Company strongly believes in providing a safe and harassment free workplace for each and every individual working for the Company through various interventions and practices. It is the continuous endeavor of the Management of the Company to create and provide an environment to all its employees that is free from discrimination and harassment including sexual harassment. The Company has adopted a policy on prevention, prohibition and redressal of sexual harassment at workplace in line with the provisions of the Sexual Harassment of Women at Workplace (Prevention, Prohibition and Redressal) Act, 2013 and the Rules thereunder. The Company arranged various interactive awareness workshops in this regard for the employees in the manufacturing sites, R & D set ups & Corporate Office during the financial year. The Company submitted the Annual returns to the local authorities under the above mentioned act . During the financial year ended March 31, 2017, no complaint pertaining to sexual harassment was received by the Company.
AUDITORSStatutory AuditorsThe Company’s Auditor, Messrs. Deloitte Haskins & Sells LLP, Chartered Accountants, (Firm’s Regn No. 117366W/W-100018), were appointed as the Statutory Auditors of the Company for a period of three years at the 22nd Annual General Meeting of the Company, and they shall retire at the conclusion of the ensuring 25th Annual General Meeting of the Company. The Auditors’ Report for the financial year ended March 31, 2017, has been issued with an unmodified opinion, by the Statutory Auditors. The Board of Directors placed on record their appreciation for the retiring auditors.
The Board of Directors of the Company had proposed and recommended the appointment of M/s. S R B C & Co LLP, Chartered Accountants, (Firm Registration No. 324982E/E300003) as the statutory auditors of the Company for a period of 5(Five) years from the conclusion of 25th Annual General Meeting of the Company, upto the conclusion of the 30th Annual General Meeting of the Company, subject to approval of members at the ensuing 25th Annual General Meeting and ratification by members at every Annual General Meeting of the Company. M/s. S R B C & Co LLP, Chartered Accountants, have confirmed their eligibility under Section 141 of the Act and the Rules framed thereunder for the appointment as Auditors of the Company and as required under Regulation 33 of the Listing Regulations, 2015.
Secretarial AuditorPursuant to the provisions of Section 204 of the Companies Act, 2013 and the Companies (Appointment and Remuneration of Managerial Personnel) Rules, 2014, the Company has appointed Messrs C. J. Goswami & Associates, Practicing Company Secretaries, Mumbai to undertake the Secretarial Audit of the Company. The Secretarial Audit Report is annexed herewith as “Annexure C”. The Secretarial Audit Report does not contain any qualification, reservation or adverse remark.
Cost AuditorThe Company has appointed Messrs. Kailash Sankhlecha & Associates, Cost Accountants, Vadodara as Cost Auditor of our Company for conducting Cost Audit in respect of Bulk Drugs & Formulations of your Company for the year 2017-18.
LOANS, GUARANTEES & INVESTMENTSThe particulars of loans, guarantees and investments have been disclosed in the Financial Statements.
RELATED PARTY TRANSACTIONSThe policy on Related Party Transactions as approved by the Board is available on the website of the Company and can be accessed through the web link http://www.sunpharma.com/policies. All contracts/arrangements/transactions entered by the Company

SUN PHARMACEUTICAL INDUSTRIES L IMITED36
during the previous financial year with the related parties were in the ordinary course of business and on arm’s length basis.
The Company has entered into material Related Party Transactions, i.e. transactions exceeding ten percent of the annual consolidated turnover as per the last audited financial statements, during the year with Sun Pharma Laboratories Limited, a wholly owned subsidiary. The transactions entered into between a holding company and its wholly owned subsidiary do not require approval of the shareholders.
The disclosure of Related Party Transactions as required under Section 134(3)(h) of the Act in Form AOC 2 is not applicable for the current year.
AUDIT COMMITTEE COMPOSITIONThe details pertaining to composition of Audit Committee are included in the Corporate Governance Report, which forms a part of this Report.
RISK MANAGEMENTThe Company has developed & implemented an integrated Enterprise Risk Management Framework through which it identifies monitors, mitigates & reports key risks that impacts its ability to meet the strategic objectives. The Board of Directors have constituted a Risk Management Committee which is entrusted with the responsibility of overseeing various strategic, operational and financial risks that the organisation faces, along with the adequacy of mitigation plans to address such risks. There is an overarching Risk Management Policy in place that was reviewed and approved by the Board. The Corporate Governance Report, which forms a part of this Report, contains the details of Risk Management Committee.
INTERNAL FINANCIAL CONTROLSThe Company has in place well defined and adequate internal financial control framework. During the year under review, such controls were tested and no material weaknesses in their design or operations were observed.
CORPORATE SOCIAL RESPONSIBILITYIn compliance with the requirements of Section 135 of the Act read with the Companies (Corporate Social Responsibility Policy) Rules, 2014, the Board of Directors have constituted a Corporate Social Responsibility (CSR) Committee. The details of membership of the Committee & the meetings held are detailed in the Corporate Governance Report, forming part of this Report. The contents of the CSR Policy of the Company as approved by the Board on the recommendation of the CSR Committee is available on the website of the Company and can be accessed through the web link: http://www.sunpharma.com/policies. The average net profits of the Company for last three financial years is negative, therefore the
Company was not required to spend on CSR activities during the previous year. However, the Company has voluntarily spent on CSR activities and the annual report on CSR activities containing details of voluntary expenditure incurred by the Company and brief details on the CSR activities are given in “Annexure D”.
DIVIDEND DISTRIBUTION POLICY In accordance with the Regulation 43A of Listing Regulations, 2015, the Company has formulated Dividend Distribution Policy and the same is annexed herewith as “Annexure E”. The policy is also available on the website of the Company and can be accessed through the web link: http://www.sunpharma.com/policies.
PUBLIC DEPOSITSThe Company has not accepted any deposit from the Public during the year under review, under the provisions of the Act and the rules framed thereunder.
MANAGEMENT DISCUSSION AND ANALYSISThe Management Discussion and Analysis as prescribed under Part B of Schedule V read with Regulation 34 (3) of the Listing Regulations, 2015 is provided in a separate section and forms a part of this Report.
CORPORATE GOVERNANCE REPORTReport on Corporate Governance and Certificate of the Auditors of the Company regarding compliance of the conditions of Corporate Governance as stipulated in Part C of Schedule V of the Listing Regulations, 2015, are enclosed as a separate section and forms a part of this Report.
CONSERVATION OF ENERGY, TECHNOLOGY ABSORPTION AND FOREIGN EXCHANGE EARNINGS AND OUTGOThe information on conservation of energy, technology absorption and foreign exchange earnings and outgo as stipulated under Section 134(3)(m) of the Act read with Rule 8 of The Companies (Accounts) Rules, 2014, is annexed herewith as “Annexure F”.
EMPLOYEES’ STOCK OPTION SCHEMESThe Company has two Employees’ Stock Option Schemes, one through Trust Route and the other by Direct Route, both inherited from erstwhile Ranbaxy Laboratories Limited (“Ranbaxy”). The scheme through Direct Route has been named as Sun Pharma Employee Stock Option Scheme – 2015, and the one through Trust Route as Sun Pharma Employee Stock Option Plan – 2015. Both the schemes were adopted by the Company with certain amendments consequent upon merger of erstwhile Ranbaxy into the Company. The both the Schemes are in compliance with Securities and Exchange Board of India (Share Based Employee Benefits) Regulations, 2014.

37ANNUAL REPORT 2016-17
CORPORATE OVERVIEW FINANCIAL STATEMENTSSTATUTORY REPORTS 01-07 80-27808-79
Disclosures with respect to the Employees’ Stock Option Schemes in compliance with Securities and Exchange Board of India (Share Based Employee Benefits) Regulations, 2014 are available on the Company’s website and can be accessed at: http://www.sunpharma.com/pdflist/all-documents.
SIGNIFICANT AND MATERIAL ORDERS PASSED BY THE REGULATORS OR COURTS OR TRIBUNALSThere are no significant and material orders passed by the regulators or courts or tribunals which impact the going concern status and Company’s operations in future.
WHISTLE BLOWER POLICY/ VIGIL MECHANISMTo create enduring value for all stakeholders and ensure the highest level of honesty, integrity and ethical behaviour in all its operations, the Company has adopted a ‘Global Whistle Blower Policy’ for Sun Pharmaceutical Industries Limited (SPIL) and all its subsidiaries, in addition to the existing Global Code of Conduct that governs the actions of its employees. Further details on vigil mechanism of the Company are provided in the Corporate Governance Report, forming part of this report.
DIRECTORS’ RESPONSIBILITY STATEMENTPursuant to the requirements under Section 134(5) read with Section 134(3)(c) of the Act, with respect to Directors’ Responsibility Statement, it is hereby confirmed that:
a) in the preparation of the annual accounts for the financial year ended March 31, 2017, the applicable accounting standards have been followed and there are no material departures from the same;
b) the Directors have selected such accounting policies and applied them consistently and made judgments and estimates that are reasonable and prudent so as to give a true and fair view of the state of affairs of the Company as at March 31, 2017 and of loss of the Company for the year ended on that date;
c) the Directors have taken proper and sufficient care for the maintenance of adequate accounting records in accordance with the provisions of this Act for safeguarding the assets of the Company and for preventing and detecting fraud and other irregularities;
d) the Directors have prepared the annual accounts on a going concern basis;
e) the Directors have laid down internal financial controls to be followed by the Company and that such internal financial controls are adequate and were operating effectively; and
f) the Directors have devised proper systems to ensure compliance with the provisions of all applicable laws and that such systems were adequate and operating effectively.
CONSOLIDATED ACCOUNTSThe consolidated financial statements for the year ended March 31, 2017 has been prepared in accordance with Indian Accounting Standards (Ind AS) notified under the Companies (Indian Accounting Standards) Rules, 2015 together with the comparative period data as at and for the previous year ended March 31, 2016. Further, the Company has prepared the opening consolidated balance sheet as at April 1, 2015 (the transition date) in accordance with Ind AS.
CREDIT RATINGICRA Ltd. has reaffirmed the highest credit rating of ‘[ICRA] A1+’/‘[ICRA] AAA(Stable)’ for the bank facilities, long term/short term borrowings and commercial paper programs of the Company. Further, CRISIL Ltd. has also reaffirmed the highest credit rating of ‘CRISIL A1+ and CRISIL AAA/Stable’ for short term and long term bank facilities of the Company.
BUSINESS RESPONSIBILITY REPORTINGThe Business Responsibility Report of the Company for the year ended March 31, 2017, in line with Green initiative, is made available on the website of the Company (http://www.sunpharma.com/pdflist/all-documents) and forms part of the Annual Report, and is available at the Registered office / Corporate office of the Company for inspection. A copy of the aforesaid report shall be made available to such of those shareholders who are desirous and interested, upon receipt of a written request from them.
ACKNOWLEDGEMENTSYour Directors wish to thank all stakeholders, employees and business partners, Company’s bankers, medical profession and business associates for their continued support and valuable co-operation.
The Directors also wish to express their gratitude to investors for the faith that they continue to repose in the Company.
For and on behalf of the Board of Directors
Israel Makov Chairman
May 26, 2017Mumbai

SUN PHARMACEUTICAL INDUSTRIES L IMITED38
ANNEXURE - A
FORM MGT-9EXTRACT OF ANNUAL RETURN
as on the financial year ended 31.03.2017Pursuant to Section 92(3) of the Companies Act, 2013 and
Rule 12(1) of the Companies (Management and Administration) Rules, 2014
I. REGISTRATION AND OTHER DETAILS:i) CIN L24230GJ1993PLC019050ii) Registration date March 1, 1993iii) Name of the Company Sun Pharmaceutical Industries Limitediv) Category/ Sub-category of the Company Company Limited By Sharesv) Address of the Registered Office and Contact details SPARC, Tandalja, Vadodara 390020, Gujarat
Contact no of registered office 0265-6615500vi) Whether listed company Yesvii) Name, Address, and Contact details of Registrar and Transfer Agent Link Intime India Private Limited
C 101, 247 Park, L B S Marg, Vikhroli West, Mumbai 400 083 Tel No: +91 22 49186270
II PRINCIPAL BUSINESS ACTIVITY OF THE COMPANY All the business activities contributing 10% or more of the total turnover of the Company:
Sr.no Name and Description of main products/services
NIC code of the Product/ Service
% to total turnover of the Company
1 Pharmaceuticals 210 100%
III PARTICULARS OF HOLDING, SUBSIDIARY AND ASSOCIATE COMPANIES AS ON MARCH 31, 2017
Sr. No Name of the Company Address of the
Company CIN/GLNHolding/
Subsidiary/ Associate
% of shares held
Applicable Section
1 SPIL De Mexico S.A. DE C.V. Mexico N.A. Subsidiary 100.00 2(87)(ii)2 Sun Pharmaceutical (Bangladesh) Limited Bangladesh N.A. Subsidiary 72.50 2(87)(ii)3 Sun Pharma Holdings Mauritius N.A. Subsidiary 100.00 2(87)(ii)4 Sun Pharma DE Mexico S.A. DE C.V. Mexico N.A. Subsidiary 75.00 2(87)(ii)5 Sun Pharmaceutical Peru Sociedad
Anonima CerradaPeru N.A. Subsidiary 99.33 2(87)(ii)
6 OOO “Sun Pharmaceutical Industries” Limited
Russia N.A. Subsidiary 100.00 2(87)(ii)
7 Green Eco Development Centre Limited India U90009GJ2010PLC062892 Subsidiary 100.00 2(87)(ii)8 Sun Pharma DE Venezuela, C.A. Venezuela N.A. Subsidiary 100.00 2(87)(ii)9 Sun Pharma Laboratories Limited India U25200MH1997PLC240268 Subsidiary 100.00 2(87)(ii)

39ANNUAL REPORT 2016-17
CORPORATE OVERVIEW FINANCIAL STATEMENTSSTATUTORY REPORTS 01-07 80-27808-79
Sr. No Name of the Company Address of the
Company CIN/GLNHolding/
Subsidiary/ Associate
% of shares held
Applicable Section
10 Neetnav Real Estate Private Limited India U45200MH2010PTC201611 Subsidiary 100.00 2(87)(ii)11 Skisen Labs Private Limited India U73100MH2005PTC150606 Subsidiary 100.00 2(87)(ii)12 Softdeal Trading Company Private Limited India U51900MH2006PTC159237 Subsidiary 100.00 2(87)(ii)13 Faststone Mercantile Company Private
LimitedIndia U51900MH2006PTC159266 Subsidiary 100.00 2(87)(ii)
14 Realstone Multitrade Private Limited India U51900MH2006PTC158889 Subsidiary 100.00 2(87)(ii)15 Ranbaxy Drugs Limited India U24232GJ1984PLC095288 Subsidiary 100.00 2(87)(ii)16 Vidyut Investments Limited India U67120GJ1988PLC095186 Subsidiary 100.00 2(87)(ii)17 Gufic Pharma Limited India U24231GJ1983PLC006323 Subsidiary 100.00 2(87)(ii)18 Ranbaxy (Malasiya) SDN. BHD. Malasiya N.A. Subsidiary 71.22 2(87)(ii)19 Ranbaxy (Netherlands) B.V. Netherlands N.A. Subsidiary 100.00 2(87)(ii)20 Ranbaxy Nigeria Limited Nigeria N.A. Subsidiary 85.31 2(87)(ii)21 Ranbaxy Pharmacie Generiques France N.A. Subsidiary 100.00 2(87)(ii)22 Sun Pharmaceutical Industries, Inc. USA N.A. Subsidiary 100.00 2(87)(ii)23 Sun Farmaceutica do Brasil Ltda. Brazil N.A. Subsidiary 100.00 2(87)(ii)24 Foundation for Disease Elimination and
Control of IndiaIndia U85190MH2016NPL286097 Subsidiary 100.00 2(87)(ii)
25 Universal Enterprises Private Limited India N.A Subsidiary 100.00 2(87)(ii)26 Office Pharmaceutique Industriel Et
Hospitalier France N.A. Subsidiary 100.00 2(87)(ii)
27 Sun Pharma Global (FZE) UAE N.A. Subsidiary 100.00 2(87)(ii)28 Sun Pharmaceuticals (SA) (Pty) Ltd. South Africa N.A. Subsidiary 100.00 2(87)(ii)29 Sun Laboratories (FZE) UAE N.A. Subsidiary 100.00 2(87)(ii)30 ALKALOIDA Chemical Company Zrt. Hungary N.A. Subsidiary 99.99 2(87)(ii)31 Sun Pharmaceutical Industries (Australia)
Pty Ltd.Australia N.A. Subsidiary 100.00 2(87)(ii)
32 Sun Global Development (FZE) UAE N.A. Subsidiary 100.00 2(87)(ii)33 Sun Pharmaceuticals Korea Ltd. South Korea N.A. Subsidiary 100.00 2(87)(ii)34 Sun Global Canada Pty. Ltd. Canada N.A. Subsidiary 100.00 2(87)(ii)35 Sun Pharma Philippines, Inc. Philippines N.A. Subsidiary 100.00 2(87)(ii)36 Sun Pharma Healthcare (FZE) UAE N.A. Subsidiary 100.00 2(87)(ii)37 Sun Pharma Japan Ltd. Japan N.A. Subsidiary 100.00 2(87)(ii)38 Sun Pharma East Africa Limited Kenya N.A. Subsidiary 100.00 2(87)(ii)39 Caraco Pharmaceuticals Private Limited India U24100MH2012FTC225970 Subsidiary 100.00 2(87)(ii)40 Pharmalucence, Inc. USA N.A. Subsidiary 100.00 2(87)(ii)41 The Taro Development Corporation USA N.A. Subsidiary 100.00 2(87)(ii)42 DUSA Pharmaceuticals, Inc. USA N.A. Subsidiary 100.00 2(87)(ii)43 Chattem Chemicals, Inc. USA N.A. Subsidiary 100.00 2(87)(ii)44 Mutual Pharmaceutical Company, Inc. USA N.A. Subsidiary 100.00 2(87)(ii)45 PI Real Estate Ventures, LLC USA N.A. Subsidiary 100.00 2(87)(ii)46 Morley & Company, Inc. USA N.A. Subsidiary 100.00 2(87)(ii)47 URL PharmPro, LLC USA N.A. Subsidiary 100.00 2(87)(ii)48 Dungan Mutual Associates, LLC USA N.A. Subsidiary 100.00 2(87)(ii)49 Taro Pharmaceutical Industries Ltd. Israel N.A. Subsidiary 72.81 2(87)(ii)

SUN PHARMACEUTICAL INDUSTRIES L IMITED40
Sr. No Name of the Company Address of the
Company CIN/GLNHolding/
Subsidiary/ Associate
% of shares held
Applicable Section
50 Sun Pharmaceuticals UK Limited United Kingdom N.A. Subsidiary 100.00 2(87)(ii)51 Sun Pharmaceuticals France France N.A. Subsidiary 100.00 2(87)(ii)52 Sun Pharmaceutical Industries (Europe) B.V. Netherlands N.A. Subsidiary 100.00 2(87)(ii)53 Sun Pharmaceuticals Germany GmbH Germany N.A. Subsidiary 100.00 2(87)(ii)54 Sun Pharmaceuticals Italia S.R.L. Italy N.A. Subsidiary 100.00 2(87)(ii)55 Aditya Acquisition Company Limited Israel N.A. Subsidiary 100.00 2(87)(ii)56 Alkaloida Sweden AB Sweden N.A. Subsidiary 100.00 2(87)(ii)57 Sun Pharma Switzerland Ltd. Switzerland N.A. Subsidiary 100.00 2(87)(ii)58 Taro Pharmaceuticals North America, Inc. Cayman Islands,
British West Indies
N.A. Subsidiary 72.81 2(87)(ii)
59 Taro Pharmaceuticals U.S.A., Inc. USA N.A. Subsidiary 72.81 2(87)(ii)60 Taro International Limited Israel N.A. Subsidiary 72.81 2(87)(ii)61 Taro Pharmaceuticals Europe B.V. Netherlands N.A. Subsidiary 72.81 2(87)(ii)62 Taro Pharmaceuticals Inc. Canada N.A. Subsidiary 72.81 2(87)(ii)63 3 Skyline LLC USA N.A. Subsidiary 72.81 2(87)(ii)64 One Commerce Drive LLC USA N.A. Subsidiary 72.81 2(87)(ii)65 Taro Pharmaceutical Laboratories Inc. USA N.A. Subsidiary 72.81 2(87)(ii)66 Taro Pharmaceuticals (UK) Limited United Kingdom N.A. Subsidiary 72.81 2(87)(ii)67 Taro Pharmaceuticals India Private Limited India U51397MH2004PTC144179 Subsidiary 72.81 2(87)(ii)68 Taro Pharmaceuticals Ireland Limited Ireland N.A. Subsidiary 72.81 2(87)(ii)69 Taro Pharmaceuticals Canada Ltd. Canada N.A. Subsidiary 72.81 2(87)(ii)70 S. C “Terapia” S.A. Romania N.A. Subsidiary 96.70 2(87)(ii)71 Laboratorios Ranbaxy S.L.U. Spain N.A. Subsidiary 100.00 2(87)(ii)72 AO Ranbaxy (Formerly known as ZAO
Ranbaxy)Russia N.A. Subsidiary 100.00 2(87)(ii)
73 “Ranbaxy Pharmaceuticals Ukraine”LLC Ukrain N.A. Subsidiary 100.00 2(87)(ii)74 Ranbaxy Pharmaceuticals (Pty) Ltd. South Africa N.A. Subsidiary 100.00 2(87)(ii)75 Ranbaxy South Africa Proprietary Limited South Africa N.A. Subsidiary 100.00 2(87)(ii)76 Ranbaxy Holdings (UK) Limited United Kingdom N.A. Subsidiary 100.00 2(87)(ii)77 Ranbaxy Farmaceutica Ltda. Brazil N.A. Subsidiary 100.00 2(87)(ii)78 Ranbaxy (Thailand) Co. Ltd. Thailand N.A. Subsidiary 100.00 2(87)(ii)79 Ranbaxy (Poland) Sp.z.o.o. Poland N.A. Subsidiary 100.00 2(87)(ii)80 Sun Pharmaceutical Industries S.A.C.
(Formerly known as Ranbaxy-PRP (Peru) S.A.C.)
Peru N.A. Subsidiary 100.00 2(87)(ii)
81 Ranbaxy Egypt Limited Egypt N.A. Subsidiary 100.00 2(87)(ii)82 Ranbaxy Italia S.P.A. Italy N.A. Subsidiary 100.00 2(87)(ii)83 Ranbaxy (U.K.) Limited United Kingdom N.A. Subsidiary 100.00 2(87)(ii)84 Sun Pharma ANZ Pty Ltd (Formerly known
as Ranbaxy Australia Pty Limited)Australia N.A. Subsidiary 100.00 2(87)(ii)
85 Ranbaxy Ireland Limited Ireland N.A. Subsidiary 100.00 2(87)(ii)86 Sun Pharmaceuticals Morocco LLC
(Formerly known as Ranbaxy Morrocco LLC)
Morocco N.A. Subsidiary 100.00 2(87)(ii)
87 Ranbaxy Pharmaceuticals Canada Inc. Canada N.A. Subsidiary 100.00 2(87)(ii)88 Basics GmbH Germany N.A. Subsidiary 100.00 2(87)(ii)
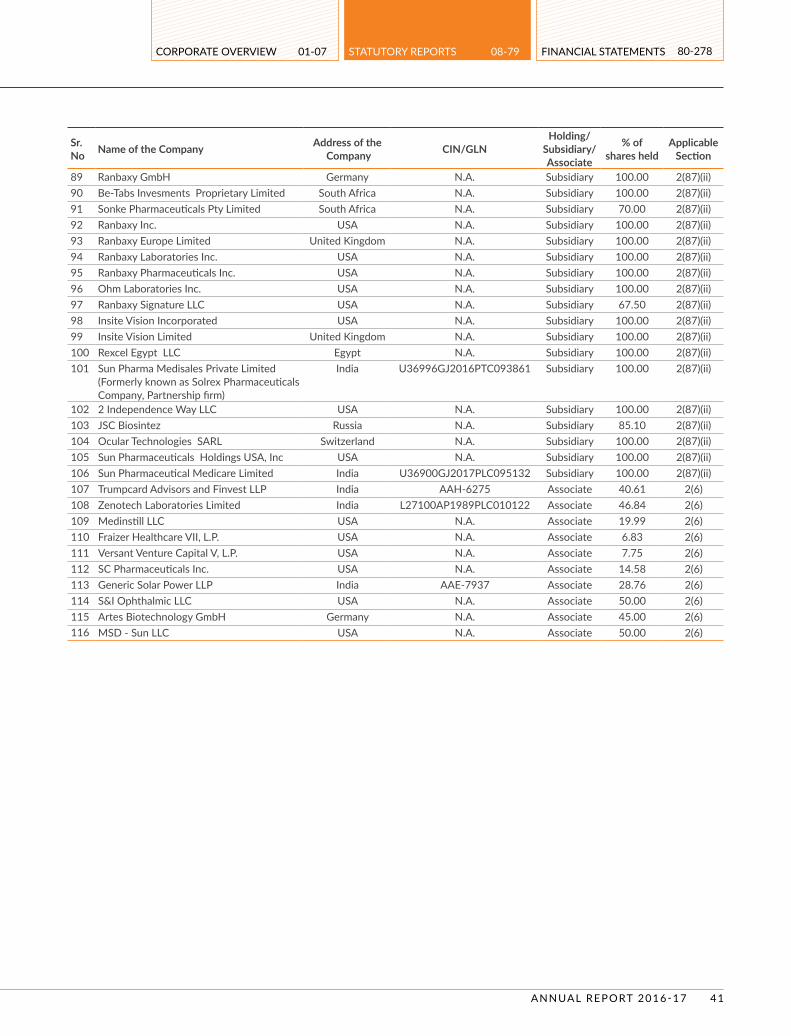
41ANNUAL REPORT 2016-17
CORPORATE OVERVIEW FINANCIAL STATEMENTSSTATUTORY REPORTS 01-07 80-27808-79
Sr. No Name of the Company Address of the
Company CIN/GLNHolding/
Subsidiary/ Associate
% of shares held
Applicable Section
89 Ranbaxy GmbH Germany N.A. Subsidiary 100.00 2(87)(ii)90 Be-Tabs Invesments Proprietary Limited South Africa N.A. Subsidiary 100.00 2(87)(ii)91 Sonke Pharmaceuticals Pty Limited South Africa N.A. Subsidiary 70.00 2(87)(ii)92 Ranbaxy Inc. USA N.A. Subsidiary 100.00 2(87)(ii)93 Ranbaxy Europe Limited United Kingdom N.A. Subsidiary 100.00 2(87)(ii)94 Ranbaxy Laboratories Inc. USA N.A. Subsidiary 100.00 2(87)(ii)95 Ranbaxy Pharmaceuticals Inc. USA N.A. Subsidiary 100.00 2(87)(ii)96 Ohm Laboratories Inc. USA N.A. Subsidiary 100.00 2(87)(ii)97 Ranbaxy Signature LLC USA N.A. Subsidiary 67.50 2(87)(ii)98 Insite Vision Incorporated USA N.A. Subsidiary 100.00 2(87)(ii)99 Insite Vision Limited United Kingdom N.A. Subsidiary 100.00 2(87)(ii)100 Rexcel Egypt LLC Egypt N.A. Subsidiary 100.00 2(87)(ii)101 Sun Pharma Medisales Private Limited
(Formerly known as Solrex Pharmaceuticals Company, Partnership firm)
India U36996GJ2016PTC093861 Subsidiary 100.00 2(87)(ii)
102 2 Independence Way LLC USA N.A. Subsidiary 100.00 2(87)(ii)103 JSC Biosintez Russia N.A. Subsidiary 85.10 2(87)(ii)104 Ocular Technologies SARL Switzerland N.A. Subsidiary 100.00 2(87)(ii)105 Sun Pharmaceuticals Holdings USA, Inc USA N.A. Subsidiary 100.00 2(87)(ii)106 Sun Pharmaceutical Medicare Limited India U36900GJ2017PLC095132 Subsidiary 100.00 2(87)(ii)107 Trumpcard Advisors and Finvest LLP India AAH-6275 Associate 40.61 2(6)108 Zenotech Laboratories Limited India L27100AP1989PLC010122 Associate 46.84 2(6)109 Medinstill LLC USA N.A. Associate 19.99 2(6)110 Fraizer Healthcare VII, L.P. USA N.A. Associate 6.83 2(6)111 Versant Venture Capital V, L.P. USA N.A. Associate 7.75 2(6)112 SC Pharmaceuticals Inc. USA N.A. Associate 14.58 2(6)113 Generic Solar Power LLP India AAE-7937 Associate 28.76 2(6)114 S&I Ophthalmic LLC USA N.A. Associate 50.00 2(6)115 Artes Biotechnology GmbH Germany N.A. Associate 45.00 2(6)116 MSD - Sun LLC USA N.A. Associate 50.00 2(6)

SUN PHARMACEUTICAL INDUSTRIES L IMITED42
IV SHARE HOLDING PATTERN (EQUITY SHARE BREAKUP AS PERCENTAGE OF TOTAL EQUITY )i) Category-wise shareholding
Category of Shareholders No. of Shares held at the beginning of the year No. of Shares held at the end of the year % Change during the year
Demat Physical Total % of Total Shares Demat Physical Total
% of Total
SharesA Promoter*1) Indiana) Individual/HUF 308718612 0 308718612 12.83 293200513 0 293200513 12.22 -0.61b) Central Government/ State
Government0 0 0 0.00 0 0 0 0.00 0.00
c) Bodies Corporate 1013012000 12000 1013024000 42.09 1010366094 12000 1010378094 42.11 0.02d) Financial Institutions/ Bank 0 0 0 0.00 0 0 0 0.00 0.00e) Any other (Trusts) 1280200 0 1280200 0.05 1276774 0 1276774 0.05 0.00Sub total (A ) (1 ) 1323010812 12000 1323022812 54.97 1304843381 12000 1304855381 54.39 -0.592) Foreigna) Individuals (NRIs) 0 0 0 0.00 0 0 0 0.00 0.00b) Other Individuals 0 0 0 0.00 0 0 0 0.00 0.00c) Bodies Corporate 0 0 0 0.00 0 0 0 0.00 0.00d) Financial Institutions/ Bank 0 0 0 0.00 0 0 0 0.00 0.00e) Any other 0 0 0 0.00 0 0 0 0.00 0.00
Sub total (A ) (2) 0 0 0 0.00 0 0 0 0.00 0.00Total shareholding of Promoter* (A)=(A)(1)+(A)(2)
1323010812 12000 1323022812 54.97 1304843381 12000 1304855381 54.39 -0.59
B Public Shareholding1) Institutionsa) Mutual Funds 72206731 2500782 74707513 3.10 126058474 2500782 128559256 5.36 2.25b) Financial Institutions/ Bank 92231531 4218 92235749 3.83 124323024 4218 124327242 5.18 1.35c) Central Government/ State
Government0 0 0 0.00 380 0 380 0.00 0.00
d) Venture Capital Funds 0 0 0 0.00 0 0 0 0.00 0.00e) Insurance Companies 47453661 0 47453661 1.97 37905019 0 37905019 1.58 -0.39f) FIIs 363065665 17943 363083608 15.09 510632630 17943 510650573 21.28 6.20g) Foreign Venture Capital 0 0 0 0.00 0 0 0 0.00 0.00h) Qualified Foreign Investors 0 0 0 0.00 0 0 0 0.00 0.00i) Any other (specify) 1234259 25798 1260057 0.05 1996426 25798 2022224 0.08 0.03
Foreign Bank 1504 23918 25422 0.00 1504 23918 25422 0.00 0.00UTI 1232755 1880 1234635 0.05 1994922 1880 1996802 0.08 0.03
Sub total (B) (1) 576191847 2548741 578740588 24.05 800915953 2548741 803464694 33.49 9.442) Non- Institutionsa) Bodies Corporate 63853210 206057 64059267 2.66 90895027 184797 91079824 3.80 1.13i) Indianii) Overseasb) Individuals 132022880 11922649 143945529 5.98 157930128 11143588 169073716 7.05 1.07i) Individual shareholders holding
nominal share capital upto ` 1 Lakh
112958510 11797649 124756159 5.18 128188202 11018588 139206790 5.80 0.62
ii) Individual shareholders holding nominal share capital in excess of ` 1 Lakh
19064370 125000 19189370 0.80 29741926 125000 29866926 1.24 0.45

43ANNUAL REPORT 2016-17
CORPORATE OVERVIEW FINANCIAL STATEMENTSSTATUTORY REPORTS 01-07 80-27808-79
Note: Change during the year in Shareholding of Promoter*, is due to Buyback of equity shares and re-classification of certain persons from Promoter Group Category to Public Category vide receipt of approval from the National Stock Exchange of India Limited on October 7, 2016 and BSE Limited on October 10, 2016, under Regulation 31A(7) of SEBI (Listing Obligation & Disclosure Requirements) Regulations, 2015.
*includes Promoter Group
i) Category-wise shareholdingCategory of Shareholders No. of Shares held at the beginning of the year No. of Shares held at the end of the year %
Change during the year
Demat Physical Total % of Total Shares Demat Physical Total
% of Total
Sharesc) Qualified Foreign Investors 0 0 0 0.00 0 0 0 0.00 0.00d) Others (specify) 296456469 380453 296836922 12.33 30411920 375280 30787200 1.28 -11.05i) Non Resident Indians(Repat) 3151491 380453 3531944 0.15 4019379 375280 4394659 0.18 0.04ii) Non Resident Indians(Non-
Repat)2005185 0 2005185 0.08 2281621 0 2281621 0.10 0.01
iii) Foreign Companies 813962 0 813962 0.03 813562 0 813562 0.03 0.00iv) Clearing Member 1653586 0 1653586 0.07 1770770 0 1770770 0.07 0.01v) Directors/ Relatives 3794306 0 3794306 0.16 3784017 0 3784017 0.16 0.00vi) Trusts 8902546 0 8902546 0.37 13847725 0 13847725 0.58 0.21vii) Foreign Portfolio Investor
(Corporate)272477175 0 272477175 11.32 0 0 0 0.00 -11.32
viii) Overseas Corporate Bodies 59440 0 59440 0.00 59440 0 59440 0.00 0.00ix) Foreign Nationals 31042 0 31042 0.00 23000 0 23000 0.00 0.00x) Hindu Undivided Family 3567736 0 3567736 0.15 3812406 0 3812406 0.16 0.01Sub total (B) (2) 492332559 12509159 504841718 20.98 279237075 11703665 290940740 12.13 -8.85Total Public shareholding Public Group (B)= (B)(1)+(B)(2)
1068524406 15057900 1083582306 45.03 1080153028 14252406 1094405434 45.62 0.59
C Shares held by Custodian for GDRs & ADRs
0 0 0 0.00 0 0 0 0.00 0.00
Employee Benefit Trust under SEBI(Share based employee benefit)Regulations, 2014
123381 0 123381 0.01 30366 0 30366 0.00 0.00
GRAND TOTAL (A)+(B)+(C ) 2391658599 15069900 2406728499 100.00 2385026775 14264406 2399291181 100.00 0.00
ii) Shareholding of Promoter as on March 31, 2017
Sr No.
Shareholder’s Name Shareholding at the beginning of the year Share holding at the end of the year
No. of Shares % of total Shares of the
Company
%of Shares Pledged /
encumbered to total shares
No. of Shares % of total Shares of the
Company
%of Shares Pledged /
encumbered to total shares
% change in shareholding
during the year
1 Dilip S. Shanghvi 231140480 9.6 0 230285690 9.6 0 0.0 Note: There has been change in the number of shares due to surrender of equity shares pursuant to Buyback of equity shares by the Company on
October 18, 2016.

SUN PHARMACEUTICAL INDUSTRIES L IMITED44
iii) Change in Promoter’s Shareholding ( please specify, if there is no change)
Sr. no
Shareholding at the beginning of the year
Cumulative Shareholding during the year
No. of shares% of total
Shares of the Company
No. of shares% of total
Shares of the Company
1 Dilip S. Shanghvi At the beginning of the year 231140480 9.6 231140480 9.6Date wise Increase / Decrease in Share holding of equity shares
Decrease of 854790 equity shares due to surrender of equity shares in Buyback of equity shares by the Company on October 18, 2016
(854790) 0.0 230285690 9.6
At the end of the year - - 230285690 9.6
iv) Shareholding Pattern of top ten Shareholders (other than Directors, Promoters and Holders of GDRs and ADRs): Sr. no
For Each of the top 10 shareholders
Shareholding at the beginning of the year
Cumulative Shareholding during the year
No. of shares% of total Shares of the Company
No. of shares% of total Shares of the Company
1 Viditi Investment Private Limited
At the beginning of the year 201385320 8.4 201385320 8.4
Date wise Increase / Decrease in Share holding
Decrease due to surrender of equity shares pursuant to Buyback of equity shares by the Company on October 18, 2016
(538958) 0.0 200846362 8.4
At the end of the year - - 200846362 8.42 Tejaskiran Pharmachem
Industries Private Limited
At the beginning of the year 195343760 8.1 195343760 8.1
Date wise Increase / Decrease in Share holding
Decrease due to surrender of equity shares pursuant to Buyback of equity shares by the Company on October 18, 2016
(522789) 0.0 194820971 8.1
At the end of the year - - 194820971 8.13 Family Investment Private
LimitedAt the beginning of the year 182927440 7.6 182927440 7.6
Date wise Increase / Decrease in Share holding
Decrease due to surrender of equity shares pursuant to Buyback of equity shares by the Company on October 18, 2016
(489560) 0.0 182437880 7.6
At the end of the year - - 182437880 7.64 Quality Investments Pvt. Ltd.
At the beginning of the year 182868640 7.6 182868640 7.6
Date wise Increase / Decrease in Share holding
Decrease due to surrender of equity shares pursuant to Buyback of equity shares by the Company on October 18, 2016
(489403) 0.0 182379237 7.6
At the end of the year - - 182379237 7.6

45ANNUAL REPORT 2016-17
CORPORATE OVERVIEW FINANCIAL STATEMENTSSTATUTORY REPORTS 01-07 80-27808-79
Sr. no
For Each of the top 10 shareholders
Shareholding at the beginning of the year
Cumulative Shareholding during the year
No. of shares% of total Shares of the Company
No. of shares% of total Shares of the Company
5 Virtuous Finance Private Limited
At the beginning of the year 97104040 4.0 97104040 4.0
Date wise Increase / Decrease in Share holding
Decrease due to surrender of equity shares pursuant to Buyback of equity shares by the Company on October 18, 2016
(252219) 0.0 96851821 4.0
At the end of the year - - 96851821 4.06 Life Insurance Corporation
of IndiaAt the beginning of the year 68878684 2.9 68878684 2.9
Date wise Increase / Decrease in Share holding
Various dates during the year* 21050467 0.9 89929151 3.8
At the end of the year - - 89929151 3.87 Virtuous Share Investments
Private Limited
At the beginning of the year 83976000 3.5 83976000 3.5
Date wise Increase / Decrease in Share holding
Decrease due to surrender of equity shares pursuant to Buyback of equity shares by the Company on October 18, 2016
(224741) 0.0 83751259 3.5
At the end of the year - - 83751259 3.58 Aditya Medisales Limited At the beginning of the year 40203960 1.7 40203960 1.7
Date wise Increase / Decrease in Share holding
Decrease due to surrender of equity shares pursuant to Buyback of equity shares by the Company on October 18, 2016
(50000) 0.0 40153960 1.7
At the end of the year - - 40153960 1.79 Government of Singapore At the beginning of the year 39779172 1.7 39779172 1.7
Date wise Increase / Decrease in Share holding
Various dates during the year*
4167695 0.2 35611477 1.5
At the end of the year - - 35611477 1.510 Raksha S.Valia At the beginning of the year 33922000 1.4 33922000 1.4
Date wise Increase / Decrease in Share holding
Decrease due to surrender of equity shares pursuant to Buyback of equity shares by the Company on October 18, 2016
(91648) 0.0 33830352 1.4
At the end of the year - - 33830352 1.4
*The trading has taken place on various dates, therefore the change has been shown on consolidated basis.

SUN PHARMACEUTICAL INDUSTRIES L IMITED46
V) SHAREHOLDING OF DIRECTORS AND KEY MANAGERIAL PERSONNEL: (HELD SINGLY OR JOINTLY AS FIRST HOLDER) Sr. no
Name of Director / KMP Shareholding at the beginning of the year
Cumulative Shareholding during the year
No. of shares
% of total Shares of the
Company
No. of shares
% of total Shares of the
Company
1 Israel Makov At the beginning of the year 0 0.0 0 0.0At the end of the year - - 0 0.0
2 Dilip S. Shanghvi At the beginning of the year 231140480 9.6 231140480 9.6Decrease due to surrender of equity shares pursuant to Buyback of equity shares by the Company on October 18, 2016
(854790) 0.0 230285690 9.6
At the end of the year - - 230285690 9.63 Sudhir V. Valia At the beginning of the year 14384000 0.6 14384000 0.6
Decrease due to surrender of equity shares pursuant to Buyback of equity shares by the Company on October 18, 2016
(38981) 0.0 14345019 0.60
At the end of the year - - 14345019 0.64 Sailesh T. Desai At the beginning of the year 3751020 0.2 3751020 0.2
Decrease due to surrender of equity shares pursuant to Buyback of equity shares by the Company on October 18, 2016
(10273) 0.0 3740747 0.2
At the end of the year - - 3740747 0.25 Kalyanasundaram
SubramanianShares held as on 14.02.2017 the date of becoming Director
37 0.0 37 0.0
Sold in March, 2017 (37) 0.0 0 0.0At the end of the year - - 0 0.0
6 S. Mohanchand Dadha At the beginning of the year 16 0.0 16 0.0Transferred as per Partition Deed of HUF on 20.12.2016
(16) 0.0 0 0.0
At the end of the year - - 0 0.07 Hasmukh S. Shah At the beginning of the year 0 0.0 0 0.0
At the end of the year - - 0 0.08 Keki M. Mistry At the beginning of the year 43270 0.0 43270 0.0
At the end of the year - - 43270 0.09 Ashwin S. Dani At the beginning of the year 0 0.0 0 0.0
At the end of the year - - 0 0.010 Rekha Sethi At the beginning of the year 0 0.0 0 0.0
At the end of the year - - 0 0.011 Uday Baldota At the beginning of the year 22700 0.0 22700 0.0
At the end of the year - - 22700 0.012 Sunil R. Ajmera At the beginning of the year 0 0.0 0 0.0
At the end of the year - - 0 0.0
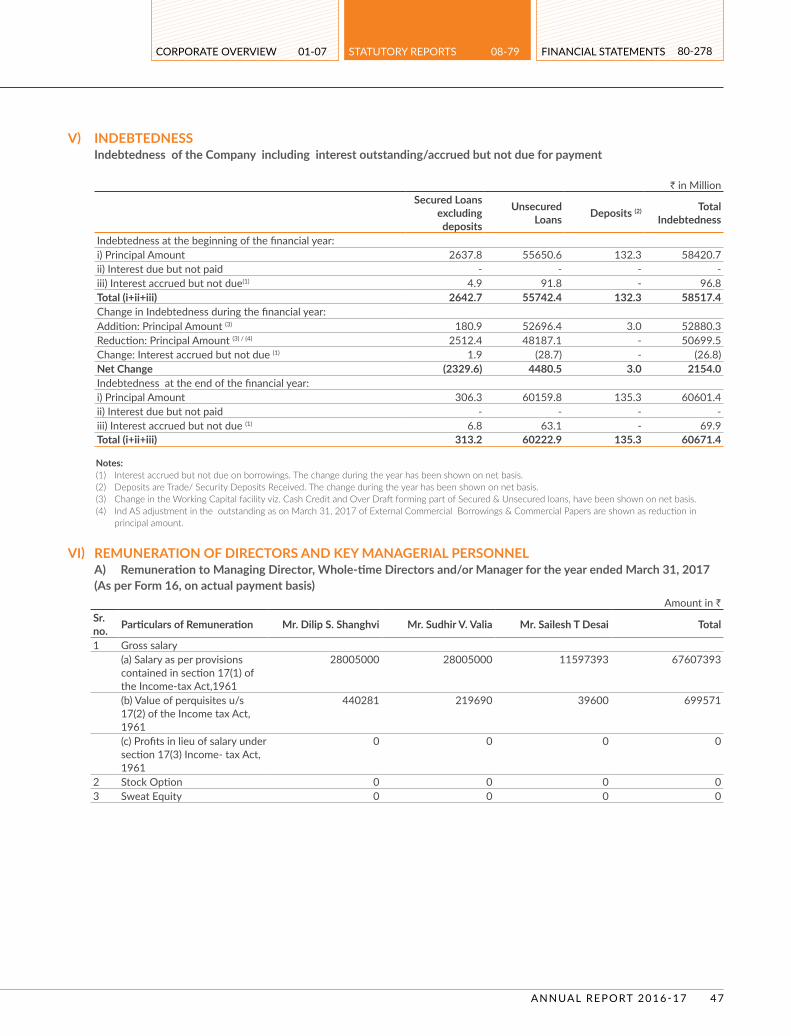
47ANNUAL REPORT 2016-17
CORPORATE OVERVIEW FINANCIAL STATEMENTSSTATUTORY REPORTS 01-07 80-27808-79
V) INDEBTEDNESS Indebtedness of the Company including interest outstanding/accrued but not due for payment
` in Million
Secured Loans excluding deposits
Unsecured Loans Deposits (2) Total
Indebtedness
Indebtedness at the beginning of the financial year:i) Principal Amount 2637.8 55650.6 132.3 58420.7ii) Interest due but not paid - - - -iii) Interest accrued but not due(1) 4.9 91.8 - 96.8Total (i+ii+iii) 2642.7 55742.4 132.3 58517.4Change in Indebtedness during the financial year:Addition: Principal Amount (3) 180.9 52696.4 3.0 52880.3Reduction: Principal Amount (3) / (4) 2512.4 48187.1 - 50699.5Change: Interest accrued but not due (1) 1.9 (28.7) - (26.8)Net Change (2329.6) 4480.5 3.0 2154.0Indebtedness at the end of the financial year:i) Principal Amount 306.3 60159.8 135.3 60601.4ii) Interest due but not paid - - - -iii) Interest accrued but not due (1) 6.8 63.1 - 69.9Total (i+ii+iii) 313.2 60222.9 135.3 60671.4
Notes: (1) Interest accrued but not due on borrowings. The change during the year has been shown on net basis. (2) Deposits are Trade/ Security Deposits Received. The change during the year has been shown on net basis. (3) Change in the Working Capital facility viz. Cash Credit and Over Draft forming part of Secured & Unsecured loans, have been shown on net basis. (4) Ind AS adjustment in the outstanding as on March 31, 2017 of External Commercial Borrowings & Commercial Papers are shown as reduction in
principal amount.
VI) REMUNERATION OF DIRECTORS AND KEY MANAGERIAL PERSONNEL A) Remuneration to Managing Director, Whole-time Directors and/or Manager for the year ended March 31, 2017 (As per Form 16, on actual payment basis)
Amount in `Sr. no. Particulars of Remuneration Mr. Dilip S. Shanghvi Mr. Sudhir V. Valia Mr. Sailesh T Desai Total
1 Gross salary(a) Salary as per provisions contained in section 17(1) of the Income-tax Act,1961
28005000 28005000 11597393 67607393
(b) Value of perquisites u/s 17(2) of the Income tax Act, 1961
440281 219690 39600 699571
(c) Profits in lieu of salary under section 17(3) Income- tax Act, 1961
0 0 0 0
2 Stock Option 0 0 0 03 Sweat Equity 0 0 0 0

SUN PHARMACEUTICAL INDUSTRIES L IMITED48
Amount in `Sr. no. Particulars of Remuneration Mr. Dilip S. Shanghvi Mr. Sudhir V. Valia Mr. Sailesh T Desai Total
4 Commission as a % of profit 0 0 0 05 Others, please specify 0 0 0 0
Total (A)(1) 28445281 28224690 11636993(1) 68306964(1) Remuneration include bonus of 2015-2016 paid in 2016-2017Ceiling as per the Act ` 3.04 Crores as computed as per Part-A, Section II of Schedule V of the Companies Act, 2013
read with MCA circular dated September 12, 2016, based on the effective capital of the last day of financial year preceding the financial year of the respective year of appointment of the Managing Director and Whole-time Directors in view of absence of profits for 2016-17.
Pursuant to the approval of the Shareholders at the 22nd Annual General Meeting (AGM), the Company had applied to the Central Government under Section 197(3) read with Schedule V of the Companies Act, 2013 for approval of maximum limit of remuneration as approved by members for a period of three years with effect from April 1, 2014 to March 31, 2017.
Further at the 24th AGM, the members’ approval was also obtained for revision in the remuneration of the Managing Director and the Whole-time Directors from April 1, 2016 for the remaining period of their respective current term of appointment upto March 31, 2018 / March 31, 2019, as applicable. Consequently during the year, an application/representation for revision in the remuneration of the Managing Director and a Whole-time Director, from April 1, 2016 for the remaining period of their respective current term of appointment upto March 31, 2018 / March 31, 2019, as applicable, has been made by the Company to the Ministry of Corporate Affairs (MCA).
However, the approval granted by the Central Government was for ` 60,00,000 (Rupees Sixty Lakhs only) per annum for a period of three years with effect from April 1, 2014 to March 31, 2017. The Company has made further representation, to the Central Government for reconsidering the approval on additional grounds for which the response from the MCA is awaited.
Further the approval in respect of the foregoing re-representation and application for revision in remuneration from April 1, 2016 for the remaining period of their respective current term of appointment upto March 31, 2018 / March 31, 2019, is also awaited from the MCA. In view of the approval for application of revision in remuneration being awaited, for the year 2016-2017, the Company has paid remuneration within the ceiling limit as mentioned above to the Managing Director and Whole-time Director(s). On receipt of the approval from the Central Government of India, the balance amount of remuneration for the year 2016-17, if any, as per their entitlement, shall be paid to the Managing Director and Whole-time Director(s), as applicable, and the same shall be given effect to in the year in which the approval is received. Excess remuneration, if any, after final approval in respect of the application for revision is received, shall be refunded by the respective Managing Director and Whole-time Directors.
B) Remuneration to other directors for the year ended March 31, 2017: (The remuneration to Non-Executive Directors consists only of sitting fees)
Amount in `
Sr. no. Particulars of Remuneration Name of Directors
Total AmountMr. Keki
MistryMs. Rekha
SethiMr. Hasmukh
Shah
Mr. S Mohanchand
Dadha
Mr. Ashwin Dani
Mr. Israel Makov
Independent Directors1 · Fee for attending board
committee meetings1600000 1300000 1700000 1700000 1000000 0 7300000
· Commission 0 0 0 0 0 0 0· Others, please specify 0 0 0 0 0 0 0Total (1) 1600000 1300000 1700000 1700000 1000000 0 7300000
2 Other Non-ExecutiveDirectors 0 0 0 0 0 1000000 1000000· Fee for attending board committee meetings
0 0 0 0 0 0 0
· Commission 0 0 0 0 0 0 0· Others, please specify 0 0 0 0 0 0 0Total (2) 0 0 0 0 0 1000000 1000000Total (B)=(1+2) 1600000 1300000 1700000 1700000 1000000 1000000 8300000

49ANNUAL REPORT 2016-17
CORPORATE OVERVIEW FINANCIAL STATEMENTSSTATUTORY REPORTS 01-07 80-27808-79
Amount in `
Sr. no. Particulars of Remuneration Name of Directors
Total AmountMr. Keki
MistryMs. Rekha
SethiMr. Hasmukh
Shah
Mr. S Mohanchand
Dadha
Mr. Ashwin Dani
Mr. Israel Makov
Overall Ceiling as per the Act Not applicable since no commission was paid during the year and ` 1,00,000 per Director per Meeting for Sitting fees .
Total Managerial Remuneration (A+B)
76606964
C) Remuneration to Key Managerial Personnel other than MD/Manager/WTD (As per form 16, on actual payment basis) ` in Million
Sr. no. Particulars of Remuneration Key Managerial Personnel
Mr. Sunil Ajmera (Company Secretary)
Mr. Uday Baldota
(Chief Financial Officer)
Total
1 Gross salary(a) Salary as per provisions contained in section 17(1) of the Income-tax Act, 1961
11.72 41.78 53.50
(b) Value of perquisites under section 17(2) of the Income Tax Act, 1961 0.03 0.74 0.77(c) Profits in lieu of salary under section 17(3) of the Income Tax Act, 1961 0 0 0
2 Stock Option 0 0 03 Sweat Equity 0 0 04 Commission as % of profit 0 0 05 Others, please specify 0 0 0
Total 11.75 42.52 54.27
VII PENALTIES / PUNISHMENT/ COMPOUNDING OF OFFENCES:
Type Section of the Companies Act
Brief Description
Details of Penalty / Punishment/ Compounding fees imposed
Authority [RD / NCLT / COURT]
Appeal made, if any (give Details)
A. Company
-NIL-
PenaltyPunishmentCompoundingB. DirectorsPenaltyPunishmentCompoundingC. Other Officers in DefaultPenaltyPunishmentCompounding
For and on behalf of the Board of Directors
Israel Makov Chairman
May 26, 2017Mumbai

SUN PHARMACEUTICAL INDUSTRIES L IMITED50
ANNEXURE - B
INFORMATION REQUIRED UNDER SECTION 197 OF THE ACT READ WITH RULE 5(1) OF THE COMPANIES (APPOINTMENT AND REMUNERATION OF MANAGERIAL PERSONNEL) RULES, 2014.
(i) Ratio of the remuneration of each director to the median remuneration of the employees of the Company for the financial year 2016-17 and the percentage increase in remuneration of each Director, Chief Financial Officer and Company Secretary during the financial year 2016-17:
Name of Director and Key Managerial Personnel Designation
Ratio of remuneration(1) of each Director to
median remuneration of employees
% increase /(decrease) in Remuneration(1) in the Financial Year 2016-2017
Mr.Israel Makov Non-executive Chairman 2.30 11.1%Mr. Dilip S. Shanghvi (2) Managing Director 90.40 15.0%Mr. Sudhir V. Valia (2) Whole-Time Director 90.40 15.0%Mr. Sailesh T. Desai (2) Whole-Time Director 31.89 15.0%Mr. Kalyanasundaram Subramanian(3) Whole-Time Director - Not ApplicableMr. S. Mohanchand Dadha Non-executive, Independent Director 3.91 6.3%Mr. Hasmukh S. Shah Non-executive, Independent Director 3.91 (10.5)%Mr. Keki M. Mistry Non-executive, Independent Director 3.68 45.5%Mr. Ashwin S. Dani Non-executive, Independent Director 2.30 25.0%Ms. Rekha Sethi Non-executive, Independent Director 2.99 18.2%Mr. Uday Baldota(4) Chief Financial Officer Not Applicable 29.0%Mr. Sunil Ajmera(4) Company Secretary Not Applicable 23.3%
(1) Remuneration to Non Executive Directors consists only of sitting fees and is based on the number of meetings attended during the year. No commission was paid to Non-Executive Directors for the year 2016-17.
(2) The details of remuneration for executive Directors given above are calculated as per the remuneration entitled to them as approved by the Board of Directors, within the limited approved by members & subject to the approval of Central Government. However, the actual amount paid during the year as per Form 16 for Mr. Dilip S. Shanghvi is ` 28.5 Million, Mr. Sudhir Valia is ` 28.2 Million and Mr. Sailesh T. Desai is ` 11.6 Million.
(3) Appointed as an Additional and Whole-time Director w.e.f. February 14, 2017 without remuneration since, he is also whole-time Director of Sun Pharma Laboratories Limited (SPLL), the Company’s wholly owned subsidiary and receives remuneration from SPLL.
(4) Remuneration is as per Form 16.
(ii) the percentage increase in the median remuneration of employees in the financial year 2016-17 (Median -2017/Median 2016) : 7.9%(iii) the number of permanent employees on the rolls of the Company as on March 31, 2017: 17516(iv) Average percentile increase already made in the salaries of employees other than the managerial personnel in the last financial year
and its comparison with the percentile increase in the managerial remuneration and justification thereof and point out if there are any exceptional circumstances for increase in the managerial remuneration:
Average percentage increase made in the salaries of employees other than the Key Managerial Personnel in the financial year ending March 31, 2017 was 13.5% and the increase in the Key Managerial Personnel remuneration was 19.4%. The remuneration of Key Managerial Personnel has been decided in line with our overall reward philosophy of paying for performance (individual as well as Company performance) and ensuring market competitiveness.
(v) It is hereby affirmed that the remuneration paid is as per the Remuneration Policy for Directors, Key Managerial Personnel and other Employees.
For and on Behalf of Board of directors
May 26, 2017 Israel Makov Mumbai Chairman

51ANNUAL REPORT 2016-17
CORPORATE OVERVIEW FINANCIAL STATEMENTSSTATUTORY REPORTS 01-07 80-27808-79
ANNEXURE - C
Form No. MR-3SECRETARIAL AUDIT REPORT
FOR THE FINANCIAL YEAR ENDED MARCH 31, 2017. [Pursuant to section 204(1) of the Companies Act, 2013 and rule No. 9 of the Companies
(Appointment and Remuneration of Managerial Personnel) Rules, 2014]
To, The Members, Sun Pharmaceutical Industries Limited, Vadodara, Gujarat.
We have conducted the Secretarial Audit of the compliances of applicable statutory provisions and the adherence to good corporate governance practice by Sun Pharmaceutical Industries Limited (“the Company”). Secretarial Audit was conducted in a manner that provided us a reasonable basis for evaluating the corporate conducts / statutory compliances and expressing our opinion thereon.
Based on our verification of the Company’s books, papers, minute books, forms and returns filed and other records maintained by the Company and also the information provided by the Company, its officers, agents and authorised representatives during the conduct of secretarial audit, we hereby report that in our opinion, the Company has, during the audit period covering the financial year ended on March 31, 2017, complied with the statutory provisions listed hereunder and also that the Company has proper Board-processes and compliance-mechanism in place to the extent, in the manner and subject to the reporting made hereinafter:
We have examined the books, papers, minute books, forms and returns filed and other records maintained by the Company for the financial year ended on March 31, 2017, according to the provisions of:i. The Companies Act, 2013 (the Act) and the rules made
thereunder; ii. The Securities Contracts (Regulation) Act, 1956 (‘SCRA’) and
the rules made thereunder; iii. The Depositories Act, 1996 and the Regulations and Bye-laws
framed thereunder; iv. Foreign Exchange Management Act, 1999 and the rules
and regulations made thereunder to the extent of Foreign Direct Investment, Overseas Direct Investment and External Commercial Borrowings;
v. The following Regulations and Guidelines prescribed under the Securities and Exchange Board of India (“SEBI”) Act, 1992:
a. The Securities and Exchange Board of India (Listing Obligations and Disclosure Requirements) Regulations, 2015;
b. The Securities and Exchange Board of India (Substantial Acquisition of Shares and Takeovers) Regulations, 2011;
c. The Securities and Exchange Board of India (Prohibition of Insider Trading) Regulations, 2015;
d. The Securities and Exchange Board of India (Buyback of Securities) Regulations, 1998;
e. The Securities and Exchange Board of India (Share Based
Employee Benefits) Regulations, 2014; f. The Securities and Exchange Board of India (Issue of
Capital and Disclosure Requirements) Regulations, 2009 – Not applicable to the Company for the year under review;
g. The Securities and Exchange Board of India (Delisting of Equity Shares) Regulations, 2009 – Not applicable to the Company for the year under review;
h. The Securities and Exchange Board of India (Registrars to an Issue and Share Transfer Agents) Regulations, 1993, regarding the Companies Act and dealing with client – Not applicable to the Company;
i. The Securities and Exchange Board of India (Issue and Listing of Debt Securities) Regulations, 2008 - Not applicable to the Company for the year under review;
We have also examined compliance with the applicable clauses of the following: (i) Secretarial Standards with respect to meeting of Board of
Directors (SS-1) and General Meetings (SS-2) issued by The Institute of Company Secretaries of India under the provisions of Companies Act, 2013;
During the period under review, the Company has complied with the provisions of the Act, Rules, Regulations, Guidelines etc. mentioned above.
We further report that, we are unable to express our opinion with regard to remuneration to the Managing Director and Whole-time Director(s) of the Company for the years ended March 31, 2015, March 31, 2016 and March 31, 2017 are higher by ` 496 Lakhs, ` 296 Lakhs and ` 447 Lakhs respectively than the amounts approved by the Central Government of India (Ministry of Corporate Affairs) on an application made by the Company to approve the maximum remuneration as approved by the members of the Company for the three years ended March 31, 2017, in excess of the limits specified under Schedule V to the Act, in case of inadequacy of profits. We have been informed by the Management of the Company that they have re-presented to the office of the Ministry of Corporate Affairs for approval of remuneration within the overall limits approved by the members of the Company for the years ended March 31, 2015 and March 31, 2016, and that for the year ended March 31, 2017, an application for revision in the remuneration, as approved by the members of the Company, has been made to the Ministry of Corporate Affairs. The response in respect of the foregoing re-representation / application for revision are awaited from the Ministry of Corporate Affairs.

SUN PHARMACEUTICAL INDUSTRIES L IMITED52
We further report that:1. The Board of Directors of the Company is duly constituted
with proper balance of Executive Directors, Non-Executive Directors, Independent Directors and Woman Director.
2. Adequate notice of at least seven days was given to all directors to schedule the Board Meetings and Meetings of Committees. Agenda and detailed notes on agenda were sent in advance in adequate time before the meetings and a system exists for Directors for seeking and obtaining further information and clarifications on the agenda items before the meeting and for meaningful participation at the meeting.
3. On verification of minutes, we have not found any dissent/disagreement on any of the agenda items discussed in the Board and Committee meetings from any of the Directors and all the decisions are carried through.
Based on the compliance mechanism established by the Company and on the basis of the Compliance Certificate(s) issued by the Respective Plant Heads/Occupiers of R&D Centres of the Company and taken on records by the Board of Directors at their meeting(s), we are of the opinion that the management has:a) Adequate systems and processes commensurate with its
size and operations, to monitor and ensure compliance with applicable laws, rules, regulations and guidelines;
b) Identified and complied with following laws applicable to the Company:
Drugs and Cosmetics Act, 1940 and rules made thereunder; The Narcotic Drugs & Psychotropics Substances Act, 1985; Factories Act, 1948.
We further report that during the year under review: The Company had bought back 75,00,000 (Seventy-Five
Lakhs Equity Shares of ` 1/- each at a price of ` 900/- (Rupees Nine Hundred only) per Equity Share on a proportionate basis through the tender offer process using Stock Exchange Mechanism.
The Company had allotted 62,682 Equity Shares of ` 1/- each to eligible employees who have exercised their options under Sun Employees Stock Options Scheme – 2015.
For C. J. Goswami & Associates,Practicing Company Secretaries
Chintan J. GoswamiProprietorMembership No. - 33697C. P. No. - 12721Date: May 26, 2017.Place: Mumbai.
This report is to be read with our letter of even date which is annexed as Annexure 1 and forms an integral part of this report.
ANNEXURE 1
To, The Members, Sun Pharmaceutical Industries Limited, Vadodara, Gujarat.
Our report of even date is to be read along with this letter.1. We have followed the audit practices and processes as
were appropriate to obtain reasonable assurance about the correctness of the contents of the Secretarial records. The verification was done on test basis to ensure that correct facts are reflected in secretarial records. We believe that the processes and practices we followed provide a reasonable basis for our opinion.
2. We have not verified the correctness and appropriateness of financial records and Books of Accounts of the Company.
3. Where ever required, we have obtained the Management representation about the compliance of laws, rules and regulations and happening of events etc.
4. The Secretarial Audit report is neither an assurance as to the future viability of the Company nor of the efficacy or effectiveness with which the management has conducted the affairs of the Company.
For C. J. Goswami & Associates,Practicing Company Secretaries
Chintan J. GoswamiProprietorMembership No. - 33697C. P. No. - 12721Date: May 26, 2017.Place: Mumbai.

53ANNUAL REPORT 2016-17
CORPORATE OVERVIEW FINANCIAL STATEMENTSSTATUTORY REPORTS 01-07 80-27808-79
ANNEXURE - D
ANNUAL REPORT ON CORPORATE SOCIAL RESPONSIBILITY (CSR) ACTIVITIES FOR THE FINANCIAL YEAR 2016-17
Details Particulars1. A brief outline of the Company’s CSR policy, including
overview of projects or programmes proposed to be undertaken
The CSR policy of the Company encompasses its philosophy towards Corporate Social Responsibility and lays down the guidelines and mechanism for undertaking socially useful programs for welfare & sustainable development of the community at large. The Company has identified health, education & livelihood, environment protection, water management and disaster relief as the areas where assistance is provided on a need-based and case-to-case basis. Your Company persisted with participation in such activities at the local, grass-root level during the year.
2. Reference to the web-link to the CSR policy and projects or programmes
The CSR policy can be accessed through the web link http://www.sunpharma.com/policies and details on projects and programmes are forming part of this Annual Report
3. Composition of the CSR Committee Mr. Dilip S. Shanghvi : Chairman, Mr. Sudhir V. Valia: Member and Ms. Rekha Sethi: Member
4. Average net profit of the Company for last three financial years
The average net profits of the Company for the last three financial years was negative, due to loss incurred in last preceeding three years
5. Prescribed CSR Expenditure (two percent of the amount as in item four above)
Since, the average net profits of the Company for the last three financial years was negative, the Company was not required to spend on CSR activities during the previous year. However, the Company has voluntarily spent on CSR activities.
6. Details of CSR spend for the financial year a) Total amount spent for the financial year ` 24.09 Million b) Amount unspent, if any Nil c) Manner in which the amount spent during the
financial yearDetails given below:
(` in Million)
Sr. No.
CSR Project or Activity Identified
Sector in which the project is covered
Projects or Programs 1. Local Area or other 2. Specify the State and
District where projects or programs was undertaken
Amount Outlay (Budget)
Project or Programwise
Amount spent on the projects
or programs (Direct
Expenditure)
Cumulative expenditure upto
to the reporting period
Amount spent Directly
or through implementing
agency
1 Mobile Medical Unit (MMU) Programme
Healthcare Halol (Panchmahal, Gujarat), Ahmednagar, (Maharashtra), Mohali (SAS Nagar, Punjab), Dewas (Madhya Pradesh), Toansa (SBS Nagar, Punjab) and Paonta (Sirmour district, Himachal Pradesh)
29.06 15.10 47.90 Implementing Agency
1. Sun Pharma Community Healthcare
Society 2. HelpAge India
2 Healthcare Programme Healthcare Halol (Panchmahal, Gujarat), Madurantakam (Kanchipuram, Tamilnadu), Silvassa (UT of Dadra & Nagar Haveli) and Toansa (SBS Nagar, Punjab)
0.60 0.60 0.60 Directly
3 Educational Programme
Education Ahmednagar (Maharashtra), Ankleswar and Panoli (Bharuch district, Gujarat), Halol (Panchmahal, Gujarat), Madurantakam (Kanchipuram district, Tamilnadu), Silvassa (UT of Dadra & Nagar Haveli) , Toansa (SBS Nagar, Punjab)
3.71 3.71 3.71 Directly

SUN PHARMACEUTICAL INDUSTRIES L IMITED54
CSR ACTIVITIESSun Pharma has taken-up various CSR Projects across plant locations in India for sustainable development of people residing in peripheral areas. Our main objective is to emphasise on social process, quality and ensuring the sustainability, hence our implementation approach is strategic in nature, is more inclined towards the sustainability of the projects, addressing community needs, focussing poorest of the poor, downtrodden, and disadvantaged, BPL and weaker sections of society.
All our CSR endeavours originate from our all-around enunciated Corporate Social Responsibility (CSR) Policy and our CSR program aims to address the immediate and long term needs of the community and focus on where we can have the biggest impact. We regularly listen to subject matter experts and gather feedback from all stakeholders.
At Sun Pharma, our social responsibility programmes mainly focussed upon Health, Education, Drinking water, Environment and Rural Development Projects, which are designed to improve the quality of life of the people. Vision :Sun Pharma CSR policy emphasizes on striving to bring about the holistic development of underserved communities in a sustainable and impactful manner.
1. Health Projects In order to strengthen the health, both physical and mental,
of all individuals in the targeted areas Sun Pharma has undertaken various initiatives in FY17 and made investment of ` 15.1 Million on health projects.
Mobile Medical Unit Programme As its flagship project, Sun Pharma has fully aligned with
Government of India’s ‘National Health Mission’ mechanism for reaching out to rural and remote areas through its Mobile Medical Unit (MMU). It is primary healthcare project that delivers free doorstep health facilities for the marginalised and financially backward section of the society. A full-time committed health van, visits the selected nodal locations at a regular frequency. It is manned by a dedicated team of qualified experienced doctor, pharmacist and special protection officer, who provide medical check-ups, medicines, expert counselling and referral services for free.
The projects is being implemented by the partner organisation Sun Pharma Community Healthcare Society and HelpAge-India, the main objective of the project is
Reduction of infant and maternal mortality rate Promote awareness on HIV / AIDS Improve health of adolescent girls
(` in Million)
Sr. No.
CSR Project or Activity Identified
Sector in which the project is covered
Projects or Programs 1. Local Area or other 2. Specify the State and
District where projects or programs was undertaken
Amount Outlay (Budget)
Project or Programwise
Amount spent on the projects
or programs (Direct
Expenditure)
Cumulative expenditure upto
to the reporting period
Amount spent Directly
or through implementing
agency
4 Sanitation Programme Healthcare Ahmednagar (Maharashtra), Madurantakam (Kanchipuram district, Tamilnadu) and Panoli (Bharuch dsitrict, Gujarat)
1.42 0.79 5.19 Directly
5 Environment Conservation Programme
Environment Panoli (Bharuch district, Gujarat)
0.90 0.92 1.06 Directly
6 Rural Development Rural development Paonta (Sirmour, Himachal Pradesh), Toansa (SBS Nagar, Punjab) and Madurantakam (Kanchipuram district, Tamilnadu)
2.97 2.97 2.97 Directly
Grand Total : 24.09 61.43
The CSR Committee confirms that the implementation and monitoring of CSR Policy, is in compliance with CSR objectives and Policy of the Company.
Note: Please note that the overhead expenditure booked under CSR activities is Nil. .For and on behalf of the Board of Directors
Place : Mumbai DILIP S. SHANGHVI SUDHIR V. VALIADate : May 26, 2017 Chairman - CSR Committee
and Managing Director Member - CSR Committee and
Whole-Time Director

55ANNUAL REPORT 2016-17
CORPORATE OVERVIEW FINANCIAL STATEMENTSSTATUTORY REPORTS 01-07 80-27808-79
Prevention & control of communicable diseases (with a focus on malaria, tuberculosis) and non-communicable / other prevalent diseases
In 2016-17, ` 15.10 Million was invested towards this program covering more than 100 villages across various locations – Halol in Gujarat, Ahmednagar in Maharashtra, Mohali, Toansa in Punjab, Paonta Sahib in Himachal Pradesh and Dewas in Madhya Pradesh. The total numbers of patients treated were 1,14,920. In addition to this 1,09,339 people were also covered under promotive healthcare programme.
Health infrastructure development and Drinking water Projects
The program is operational with the objective of developing up-gradation in health infrastructure together with school drinking water to benefit the community on sustained basis and in priority areas. Also to ensure decent health in school, it is always essential to provide safe drinking water facilities to schools and communities. Sun Pharma team has assessed this problem and under CSR, tried to solve by providing water stations. Also executed several programmes at Halol, Madurantakam, Silvassa and Toansa which has benefited 8,945 beneficiaries with an investment of ` 0.60 Million in FY17.
2. Educational Programme In line with the concept of MHRD’s on ‘model school
development’, various programmes were executed like up-gradation of classroom, schools and also providing proper drinking water facilities at rural schools to create a better aesthetic in schools by creating good ambience and through up-gradation in school infrastructure. Educational programme was implemented at Ahmednagar, Halol, Ankleswar, Madurantakam, Panoli, Silvassa, Toansa and has served 4957 students with total investment of ` 3.71 Million during FY17.
3. Sanitation Project With the aim to contribute the Indian government’s 2019
goal of “Swachha Bharat” and to change the socio economic situation of communities, the Company has decided to make villages free from open defecation practices; Sun Pharma has undertaken activities to promote sanitation across different plant locations in India.
Sun Pharma has also created critical awareness about sanitation schemes, best hygienic practices in 7 villages near to their Ahmednagar, Panoli, Madurantakam and Halol plants to build up their interest towards sanitation.
This programme is implemented by the CSR Department and Implementing agency GVT-Dahod, the aim of this programme was two-pronged:
To construct toilets for the community and thereby provide 100% coverage in villages.
To conduct intensive Information, Education and Communication (IEC) campaign about sanitation with the involvement of PRIs, Co-operatives, ASHAs, Anganwadi workers, Women Groups, Self Help Groups, NGOs etc.
There was an investment of ` 0.79 Million and it benefited 73 households of Ahmednagar, Panoli and Madurantakam and Halol Taluka in the current fiscal.
4. Green Belt Development Tree plantation is one of the effective remedial measures
to control problems of air pollution and desertification, and further to its obvious economic benefits, it effectively addresses several important environmental and sustainable development objectives.
It also improves aesthetics. Keeping these in view for socio-ecological benefits Company has undertaken roadside plantation of 900 samplings at Panoli with the total cost involvement of ` 0.92 Million.
To ensure that the saplings bloom into fully-grown trees transforming the avenue into a green belt, the team also shielded each sapling with a tree guard. This effort will also enliven the surrounding of the community over and above offering ecological benefits.
5. Rural Development Strengthening Public Distribution System With the objective to provide infrastructural services in our
operational villages, Sun Pharma, Madurantakam, has taken up the task of construction of building for public distribution supply, which has benefited 125 households, under this project, Sun Pharma has developed proper storage system as the commodities were wasted often when they shift from one house to another.
Installation of traffic Signals In order to make driver and pedestrians safer and to avoid
several accidents caused by heavy traffic, Sun Pharma has set up traffic signals at rural areas of Madurantakam Taluka - Kanchipuram district. The project was executed under guidance of traffic control authority and is properly designed, located, operated and maintained by the concerned stakeholders and benefiting to local residential community and traveller.
Construction of road divider and drainage line In order to ensure road safety at Paonta and to make area free
from stagnant water at Toansa, road divider at Paonta (Punjab) and drainage at Toansa (Punjab) have been constructed, which is benefiting the nearby communities.
During the current financial year 2016-17, Sun Pharma has invested ` 2.97 Million on aforesaid rural development projects across locations in India.

SUN PHARMACEUTICAL INDUSTRIES L IMITED56
ANNEXURE - E
1. OBJECTIVES AND SCOPE: The Board of Directors (the “Board”) of the Sun Pharmaceutical
Industries Limited (the “Company”) recognises the need to lay down a broad framework for considering decisions by the Board of the Company, with regard to distribution of dividend (including any interim dividend) to its equity shareholders and/ or retaining or plough back of its profits.
The Policy sets out the circumstances and different factors for consideration by the Board at the time of taking such decisions of distribution or of retention of profits, in the interest of providing transparency to the equity shareholders. The Policy is not an ‘alternative’ but a ‘Guide’ to the decision of the Board for recommending dividend, which may be made after taking into consideration all the relevant circumstances enumerated hereunder and such other factors as may be decided as relevant by the Board.
While recommendation of Dividend shall be guided by this Policy, in extraordinary circumstances, the Board shall have complete liberty to recommend dividend in deviation to this policy, if so deemed necessary in the best interests of the Company and its stakeholders.
The Policy reflects the intent of the Company to reward its equity shareholders by sharing a portion of its profits after adjusting for accumulated losses, if any, and also retaining sufficient funds for future growth of the Company. The Company intends to pay, subject to the circumstances and factors enlisted hereon, dividend, which shall be consistent with the performance of the Company over the years.
Subject to the considerations as provided in the Policy, the Board shall determine the dividend payout in a particular year after taking into consideration the operating and financial performance of the Company, the advice of executive management including the CFO, and other relevant factors.
The Policy shall not apply to:
Determination and declaring dividend on preference shares, if any.
2. RELEVANT REGULATIONS The Securities and Exchange Board of India (“SEBI”) vide its
Notification dated July 8, 2016 has amended the SEBI (Listing Obligations and Disclosure Requirements) Regulations, 2015 (the “Listing Regulations”) by inserting Regulation 43A in order
to make it mandatory to have a Dividend Distribution Policy in place by the top five hundred listed companies based on their market capitalisation calculated as on the 31st day of March of every year. The Company, being one of the top five hundred listed Companies in India on the basis of market capitalisation, requires to comply with the requirements of Regulation 43A.
3. EFFECTIVE DATE The Policy shall become effective from the date of its adoption
by the Board i.e. November 10, 2016.
4. CATEGORY OF DIVIDENDS The Board of Directors shall have the power to recommend
final dividend to the equity shareholders for their approval in the Annual General Meeting of the Company. Subject to compliance with the provisions of Companies Act, 2013 including the Rules made thereunder and other relevant regulations, if any, the Board of Directors shall also have the absolute power to declare interim dividend during any financial year out of the surplus in the profit and loss account and out of profits of the financial year in which such interim dividend is sought to be declared, as and when they consider it fit in compliance with Companies Act, 2013 and other relevant regulations. Interim Dividend may be paid in order to supplement the annual dividend or in exceptional circumstances.
5. PAYMENT OF DIVIDEND FROM RESERVES Dividend shall normally be declared from the profit earned by
the Company during the relevant financial year after adjusting for accumulated losses & unabsorbed depreciation, if any and out of the carried forward profits not transferred to any reserves. However, under special circumstances, Dividend may be declared out of the accumulated profits earned by it in previous years and transferred by it to the free reserves, subject to compliance with the requirements of the relevant provisions of the Companies Act, 2013 including the Rules made thereunder.
6. CIRCUMSTANCES TO BE CONSIDERED WHILE DETERMINING DIVIDEND PAY-OUT
The Board shall consider the circumstances provided below before determination of any dividend payout after analyzing the prospective opportunities and threats, viability of the options of dividend payout or retention etc. The decision of dividend payout shall, majorly be based on the aforesaid factors considering the balanced interest of the stakeholders and the business requirements of the Company.
DIVIDEND DISTRIBUTION POLICY

57ANNUAL REPORT 2016-17
CORPORATE OVERVIEW FINANCIAL STATEMENTSSTATUTORY REPORTS 01-07 80-27808-79
Accumulated Losses, if any The profits earned by the Company during any financial
year shall be first utilised to set off the accumulated losses/ unabsorbed depreciation, if any of the Company from the previous financial years.
Operating cash flow of the Company The Board will consider the impact of proposed dividend on
the operating cash flow of the Company and shall satisfy itself of its adequacy before taking a decision on whether to declare dividend or retain its profits.
Transfer to Reserves and other Statutory Requirements
The Board shall examine the implication of relevant statutory requirements including payment of Dividend Distribution Tax, transfer of a certain portion of profits to Reserves etc., if applicable, on the financials of the Company at the time of taking decision with regard to dividend declaration or retention of profit.
Covenants with lenders/ Debenture Trustees, if any The decision of dividend pay-out shall also be subject to
compliance with covenants contained in any agreement entered into by the Company with the Lenders/ Debenture Trustee’s, from time to time, if any.
Prudential & Strategic requirements The Board shall analyse the ongoing and prospective projects
and strategic decisions including need for replacement of capital assets, expansion and modernisation etc., before recommending Dividend Pay-out for any financial year with an object to build a healthy reserve of retained earnings to augment long term strength and to build a pool of internally generated funds to provide long-term resources as well as resource-raising potential for the Company;
Expectations of major stakeholders, including small shareholders
The Board, while considering the decision of dividend pay-out or retention of a certain amount or entire profits and/or out of the accumulated profits of the Company, shall, as far as possible, consider the expectations of the major stakeholders including the small shareholders of the Company who generally expect a regular dividend payout.
7. THE FINANCIAL PARAMETERS THAT SHALL BE CONSIDERED WHILE DECLARING/ RECOMMENDING DIVIDEND;
In addition to the circumstances covered under point 6 above, the Board shall, inter alia, consider the following financial parameters, while taking decisions of a dividend payout during a particular year-
Return on invested capital The efficiency with which the Company uses its capital will
impact the decision of dividend declaration.
Magnitude of earnings of the Company Since dividend is directly linked with the availability of earning
over the long haul, the magnitude of earnings will significantly impact the dividend declaration decisions of the Company.
Cost of borrowings The Board will analyze the requirement of necessary funds
considering the long term or short term projects proposed to be undertaken by the Company and the viability of the options in terms of cost of raising necessary funds from outsiders such as bankers, lending institutions or by issuance of debt securities or plough back its own funds.
Obligations to creditors The Company should be able to repay its debt obligations
without much difficulty over a reasonable period of time. The decision of dividend declaration shall be taken after considering the volume of such obligations and time period of repayment,
Adequacy of profits If during any financial year, the Board determines that the
profits of the Company are inadequate on standalone basis and/or consolidated basis, the Board may decide not to declare dividends for that financial year.
Post dividend Earning Per Share (EPS) The post dividend EPS can have strong impact on the funds of
the Company, thus, impacting the overall operations on day-to-day basis and therefore, affects the profits and can impact the decision for dividend declaration during a particular year.

SUN PHARMACEUTICAL INDUSTRIES L IMITED58
8. FACTORS THAT MAY AFFECT DIVIDEND PAYOUT
Internal Factors - Product/ Project expansion plan The Company’s growth oriented decision to conserve cash in
the Company for future expansion plan impacts shareholders expectation for the long run which shall have to considered by the Board before taking dividend decision.
- General Working capital requirement In addition to the above, the general working capital
requirements within the Company will also impact the decision of dividend declaration.
- Past performance/ reputation of the Company The trend of the performance/ reputation of the Company
that has been during the past years determine the expectation of the shareholders.
External Factors - Macroeconomic conditions Considering the state of economy in the Country, the policy
decisions that may be formulated by the Government and other similar conditions prevailing in the international market which may have a bearing on or affect the business of the Company, during uncertain or recessionary economic and business conditions, the Board may consider retaining a larger part of the profits to have sufficient reserves to absorb unforeseen circumstances.
- Capital Market When the markets are favorable, dividend pay-out can be
liberal. However, in case of unfavorable Capital market conditions, Board may resort to a conservative dividend payout in order to conserve cash outflows.
- Statutory Restrictions The Board will keep in mind any restrictions on payment of
dividends by virtue of any regulation or loan covenant, as may be applicable to the Company at the time of declaration of dividend.
- Tax implications Dividend distribution tax or any tax deduction at source as
required by applicable tax regulations in India, as may be applicable at the time of declaration of dividend shall have bearing on the quantum of Dividend declared by the Company.
9. RANGE OF DIVIDEND PAY-OUT The Company is committed to deliver sustainable value to all
its stakeholders. The Company strives to distribute an optimal and appropriate level of the profits earned by it in its business and investing activity, with the equity shareholders, in the form of dividend. As explained in the earlier part of this Policy, determining the dividend pay-out is dependent upon several factors, both internal to a business and external to it. Taking into consideration the aforementioned factors, the Board shall have absolute discretion to determine & recommend appropriate Dividend pay- out for the relevant financial year.
10. MANNER OF UTILISATION OF RETAINED EARNINGS
The Board may retain its earnings in order to make better utilisation of the available funds and increase the value of the stakeholders in the long run. The retained earnings of the Company may, inter alia, be utilised for the following purposes:
To meet the working capital/ business needs of the Company
To fund the project expansion plans of the Company;
To fund the research expenditures of ongoing research projects specifically those in the advanced development stages
Towards replacement/ up-gradation /modernisation of equipment’s & plants;
Towards investment in long term/ short term strategic joint ventures and/or partnerships and/or subsidiary companies ;
To fund new acquisitions & investments.
Towards diversification of business;
Such other manner as the Board may deem fit from time to time.
11. REVIEW AND AMENDMENT The Board may review and amend or modify this policy in
whole or in part, at any time.

59ANNUAL REPORT 2016-17
CORPORATE OVERVIEW FINANCIAL STATEMENTSSTATUTORY REPORTS 01-07 80-27808-79
ANNEXURE - F
A. CONSERVATION OF ENERGY 1. Steps taken or impact on Conservation
of Energy Reduce electricity cost by employing Open access power
purchase.
Install & use of energy efficient Screw compressor instead of reciprocating compressor
Use of energy Screw Chillier instead of Reciprocating Chillier.
Electricity usages are reduced by confined control on lightings.
Optimised compressed air requirement by installation dedicated compressor with low pressure delivery & by arresting compressed air leakages - installed separate header for air supply to ETP as per their requirement.
Optimised brine requirement by installation dedicated brine machine as per Process requirement.
Operate high pressure pumps of Filtration Unit with open loop VFD to reduce Energy usage.
Improve boiler system efficiency by improving condensate recovery, installation condensate recovery units & by recovering flash steam - Direct purging of steam into hot water system, cleaning & maintenance activity of Solar panel during the year.
Lightings load reduction by installation of LED lightings.
Use of Solar water system for Canteen use.
Reduction of steam production cost by installing Briquette boiler.
Opt TOD base Electricity bill option to get benefit in electricity bill.
Maintain Power Factor near to unity & reduced contract demand.
2. Steps taken by the Company for utilising alternate sources of energy
In following factories biomass briquettes are used instead of conventional fuel.- Ahmednagar, Panoli, Mohali, Silvassa, Dadra, Karkhadi, Dewas, MKM Chennai.
Note:- In year 2016-17 Biomass fired Boiler is installed in Dewas plant
In MKM Chennai – Partially power is used from the wind mills.
3. Capital investment on energy conservation equipments Capital investment of ` 1898 lakh is done on energy
conservation equipments.
B. TECHNOLOGY ABSORPTIONa. Research and Development1. Specific areas in which R&D is carried out by the Company We continue to increase investments for generic and specialty
pharmaceutical research and technology. Additionally, patient friendly formulations for existing molecules which, offer increased convenience to patients are being developed. This research supports our generic business across all the markets we are present in, and ensures we have a healthy pipeline for future growth. It also helps us in enhancing our specialty pipeline for global markets.
At our modern R&D centres, expert scientist teams are engaged in complex developmental research projects in process chemistry and dosage forms, including complex generics based on drug delivery systems. This work across formulations and API supports the short, medium and long term business needs of the Company, in global markets including India.
Projects in formulation development and process chemistry help us introduce a large number of new and novel products in the US, India and rest of the world markets that includes differentiated products with high technology barriers that limits competition and thus helps counter price erosion. Expertise in medicinal/ process chemistry equips us to be integrated right up to the API stage, for important products, advanced intermediates or products where the API is difficult to source. Strong new product development capability is an important part of our strategy, and R&D expertise helps us maintain our leadership position in the Indian and global markets with niche formulations.
The R&D team also works on products that are based on complex drug delivery systems. Complex products
PARTICULARS OF ENERGY CONSERVATION, TECHNOLOGY ABSORPTION AND FOREIGN EXCHANGE EARNINGS AND OUTGO REQUIRED UNDER THE COMPANIES (ACCOUNTS) RULES, 2014

SUN PHARMACEUTICAL INDUSTRIES L IMITED60
like steroids, sex hormones, peptides, carbohydrates immunosuppressant, carbapenems, anticancer, anti-diabetic, cardiovascular and antivirals, which require special skills and technology are developed and scaled up for both API and dosage forms. This complete integration for some products helps to deliver advanced products to the market faster at competitive pricing.
The API process development is focused for developing and transferring commercially viable, non-infringing and patentable novel API technologies. The development grid selection for APIs is based on the difficult-to-make API molecules and also novel polymorphic forms and co-crystals of certain APIs for creating value addition. Other areas of interest include developing differentiated particles size for APIs as per the requirement and green chemistry approaches.
2. Benefits derived as a result of the above R&D In FY17, 77 formulations were developed and filed from
our R&D locations for the Indian and advanced markets and 203 dossiers were submitted for filing in emerging markets. All of these were based on technology developed in-house. Technology for several APIs was commercialised. For some of the important APIs that we already manufacture, processes were streamlined or altered so as to have more energy efficient or cost effective or environment friendly processes. Non-infringing processes were developed to gain early market entry in many regulated markets. A large part of our external API sales is to the regulated markets of US / Europe, and earns valuable foreign exchange, as also a reputation for quality and dependability. The Company’s formulation brands are exported to over 150 international markets. In addition, our subsidiary Taro’s formulation development capability supports the filing and scale up of ANDAs for the US and other markets.
During the year, the Company has filed 106 Drug Master Files across various countries, including US, India and other markets.
The Department of Scientific and Industrial Research, Ministry of Science and Technology of Government of India has granted approval to the in house research and development facilities of the Company under the provision of the Income Tax Act, 1961.
3. Future plan of action We continue to invest in people, capability development,
equipment and infrastructure to compete effectively across
world markets. Our subsidiary Taro is likely to continue to invest in R&D as it ramps up its product pipeline.
4. Expenditure on R&D ` in Million
Year ended March 31, 2017
Year ended March 31, 2016
a) Capital 1,392.3 543.7b) Revenue 9,038.0 9037.9c) Total 10,430.3 9581.6d) Total R&D
expenditure as % of Total Turnover
13.4% 12.2%
b. Technology Absorption, Adaptation and Innovation1. Efforts in brief, made towards technology absorption,
adaptation and innovation The Company continues to invest on R&D, both as revenue
expenses as well as capital expenditure. A large part of the spending is for complex products, specialty and ANDA filings for the US, and API technologies that are complex and may require dedicated manufacturing blocks. Investments have been made in creating research sites, employing scientifically skilled and experienced manpower, adding equipment, sponsored research and in accessing world class consultants to continuously upgrade the research understanding of the scientific team in the technologies and therapy areas of our interest.
There has been thrust on the development of novel technologies like use of green reagents for chemical transformations in API synthesis and ultrasonic crystallisation for achieving required particle size, Capillary flow reactors for continuous process, safety related studies using reaction calorimetry. Product Life cycle management has been undertaken for key products. Backward integration is a key strategic objective and many of our products enjoy the benefit of this backward integration.
Process robustness has been implemented for wide range of products which has resulted in positive outcomes with respect to cost and increase in process capability.
Novel compact dosage forms having differentiation with regards to improved stability and/or reduced pharmacokinetic variability have been developed for India market. Stable liquid

61ANNUAL REPORT 2016-17
CORPORATE OVERVIEW FINANCIAL STATEMENTSSTATUTORY REPORTS 01-07 80-27808-79
oral formulations of labile products are in advanced stages of product development.
2. Benefits derived as a result of the above efforts e.g. product improvement, cost reduction, product development, import substitution
(a) Market leader for several complex products. Offers complete baskets of products under chronic therapeutic classes. Strong pipeline of products for future introduction in India, emerging markets, as well as US and European generic market. Ability to challenge patents in the US market, and earn exclusivity.
(b) Not dependent on imported technology, can make high cost products available at competitive prices by using indigenously developed manufacturing processes and formulation technologies.
(c) Offer technologically advanced differentiated products which are convenient and safe for administration to patients.
(d) We are among the few selected companies that have set up completely integrated manufacturing capability for the production of anticancer, hormones, peptide, immunosuppressant and steroidal drugs.
(e) The Company has benefited from reduction in cost due to import substitution and increased revenue through higher exports.
(f) Clinical studies of important products (specialty, complex and difficult to formulate) have been carried out at our in-house clinical pharmacology units. This has helped to maintain R&D quality and regulatory compliance with significantly reduced cost.
3. Your Company has not imported technology during the last 5 years reckoned from the beginning of the financial year.
C. FOREIGN EXCHANGE EARNINGS AND OUTGO ` in Million
Year ended March 31, 2017
Year ended March 31, 2016
1. Earnings 44,118.1 42,171.02. Outgo 24,484.1 21,582.6
For and on behalf of the Board of Directors
Israel Makov Chairman
May 26, 2017Mumbai

SUN PHARMACEUTICAL INDUSTRIES L IMITED62
CORPORATE GOVERNANCE
In compliance with Regulation 34(3) read with Schedule V of the Securities and Exchange Board of India (Listing Obligations and Disclosure Requirements) Regulations, 2015 (“Listing Regulations, 2015”), the Company submits the Corporate Governance Report for the year ended March 31, 2017.
1. COMPANY’S PHILOSOPHY ON CODE OF CORPORATE GOVERNANCE
Sun Pharmaceutical Industries Limited’s philosophy on Corporate Governance envisages working towards high levels of transparency, accountability, consistent value systems,
delegation across all facets of its operations leading to sharply focused and operationally efficient growth. The Company tries to work by these principles in all its interactions with stakeholders, including shareholders, employees, customers, suppliers and statutory authorities.
Sun Pharmaceutical Industries Limited is committed to learn and adopt the best practices of Corporate Governance.
2. BOARD OF DIRECTORS The present strength of the Board of Directors of your
Company is ten Directors
Composition and category of Directors is as follows:
Category of Directors Name of the Directors Inter-se Relationship between DirectorsNon-Promoter Mr. Israel Makov -Non - Executive and (Chairman)Non - Independent DirectorPromoter Executive Director
Mr. Dilip S. Shanghvi (Managing Director)
Brother-in-law of Mr. Sudhir V. Valia
Non-Promoter Executive Directors Mr. Sudhir V. Valia(Whole-time Director)
Brother-in-law ofMr. Dilip S. Shanghvi
Mr. Sailesh T. Desai(Whole-time Director)
-
Mr. Kalyanasundaram Subramanian*(Whole-time Director)
-
Non -Executive Independent Directors Mr. S. Mohanchand Dadha -Mr. Hasmukh S. Shah -Mr. Keki M. Mistry -Mr. Ashwin S. Dani -Ms. Rekha Sethi -
*Mr. Kalyanasundaram Subramanian was appointed as Additional Director and Whole -time Director of the Company w.e.f. February 14, 2017.
Number of Board Meetings held during the year ended March 31, 2017 and the dates on which held:
Six Board meetings were held during the year. The dates on which the meetings were held during the year ended March 31, 2017 are as follows:
May 30, 2016, June 23, 2016, August 12, 2016, September 17, 2016, November 10, 2016 and February 14, 2017.

63ANNUAL REPORT 2016-17
CORPORATE OVERVIEW FINANCIAL STATEMENTSSTATUTORY REPORTS 01-07 80-27808-79
Attendance of each Director at the Board meetings, last Annual General Meeting (AGM), and number of other Directorships and Chairmanships/Memberships of Committee of each Director, is given below:
Name of the Director Attendance Particulars for the year ended March 31, 2017
*No. of other Directorships and Committee Memberships / Chairmanships as of March 31, 2017
Board Meetings Last AGM held on September 17, 2016
Other Directorships
Committee Memberships**
Committee Chairmanships**
Mr. Israel Makov 6 Yes - - -Mr. Dilip S. Shanghvi 5 Yes 1 - -Mr. Sudhir V. Valia 5 No 4 2 -Mr. Sailesh T. Desai 6 Yes 2 - -Mr. Kalyanasundaram Subramanian 1# Not Applicable 1 - -Mr. S. Mohanchand Dadha 6 Yes 3 1 1Mr. Hasmukh S. Shah 5 Yes 1 - 1Mr. Keki M. Mistry 5 No## 9 4 4Mr. Ashwin S. Dani 4 No 5 2 1Ms. Rekha Sethi 6 Yes 3 1 1
*The above list of other directorships does not include Directorships, Committee Memberships and Committee Chairmanships in Private Limited, Foreign and Section 8 Companies.
** The Committee Memberships and Chairmanships in other Companies include Memberships and Chairmanships of Audit and Stakeholders’ Relationship Committee only.
# Mr. Kalyanasundaram Subramanian was appointed as an Additional Director and a Wholetime Director of the Company w.e.f. February 14, 2017 and therefore entitled to attend only one board meeting.
##Mr. Keki Mistry, Chairman of the Audit Committee and Nomination and Remuneration Committee could not attend the last Annual General Meeting of the Company due to his prior commitments. However, he appointed Mr. Hasmukh Shah, member of the Audit Committee and Ms. Rekha Sethi, member of the Nomination & Remuneration Committee to answer to the shareholders’ queries on his behalf at the Annual General Meeting.
3. CODE OF CONDUCT The Board of Directors has laid down a Global Code of
Conduct for all Board members, and all employees, including the senior management of the Company. All the Directors and senior management have affirmed compliance with the Global Code of Conduct as approved and adopted by the Board of Directors and a declaration to this effect signed by the Managing Director has been annexed as Annexure ‘A’ to the Corporate Governance Report. The code of conduct has been posted on the website of the Company www.sunpharma.com.
4. AUDIT COMMITTEE The Audit Committee of the Company presently comprises
of four independent non-executive Directors viz. Mr. Keki M. Mistry, Mr. S. Mohanchand Dadha, Mr. Ashwin S. Dani and Mr. Hasmukh S. Shah. Mr. Keki M. Mistry is the Chairman of the Committee. The constitution of Audit Committee meets with the requirements as laid down under Section 177 of the Companies Act, 2013 and also of Regulation 18 of the Listing Regulations, 2015. Mr. Sunil R. Ajmera, the Company Secretary of the Company is the Secretary of the Audit Committee.
The terms of reference of the Audit Committee inter alia include: overseeing the Company’s financial reporting process, reviewing the quarterly/half-yearly/annual financial statements, reviewing with the management the financial statements and adequacy of internal audit function,
management letters issued by the statutory auditor, recommending the appointment/re-appointment of statutory auditors and fixation of audit fees, reviewing the significant internal audit findings/related party transactions, reviewing the Management Discussion and Analysis of financial condition and result of operations, scrutiny of inter-corporate loans, review of internal financial control and risk management, review functioning of Whistle Blower/Vigil Mechanism, approval of appointment of CFO, and also statutory compliance issues, etc.
The Committee acts as a link between the management, external and internal auditors and the Board of Directors of the Company.
Executives from the Finance Department, representatives of the Statutory Auditors and Internal Auditors are also invited to attend the Audit Committee Meetings, whenever necessary.
The Committee has discussed with the Statutory and Internal auditors about their audit methodology, audit planning and significant observations/ suggestions made by them.
In addition, the Committee has discharged such other role/ function as envisaged under Regulation 18 of the Listing Regulations, 2015 and the provisions of Section 177 of the Companies Act, 2013.

SUN PHARMACEUTICAL INDUSTRIES L IMITED64
Six Audit Committee Meetings were held during the year ended March 31, 2017. The dates on which the Meetings were held are as follows:
May 14, 2016, May 30, 2016, June 23, 2016, August 12, 2016, November 10, 2016 and February 14, 2017. The attendance of each Member of the Committee is given below:
Name of the Director Chairman / Member of the
Committee
No. of Audit Committee Meetings attended
Mr. Keki M. Mistry Chairman 6Mr. S. Mohanchand Dadha Member 5
Mr. Hasmukh S. Shah Member 5Mr. Ashwin S. Dani Member 5
5. NOMINATION AND REMUNERATION COMMITTEE
The Nomination and Remuneration Committee presently comprises of three Directors viz. Mr. Keki Mistry, Mr. Israel Makov and Ms. Rekha Sethi. Mr. Keki M. Mistry is the Chairman of the Committee. The constitution of the Nomination and Remuneration Committee meets with the requirements of Section 178 of the Companies Act, 2013 as also the requirements laid down in Regulation 19 of the Listing Regulations, 2015. Mr. Sunil R. Ajmera, the Company Secretary of the Company is the Secretary of the Committee.
The terms of reference of the Nomination and Remuneration Committee inter alia include; to determine the Company’s policy on specific remuneration packages for executive directors, to review, recommend and/or approve remuneration to Whole-time Directors, to review and approve the Remuneration Policy of the Company, to formulate criteria for evaluation of Independent Directors and the Board, to devise a policy on Board Diversity, to identify persons who are qualified to become directors and who may be appointed in senior management in accordance with the criteria laid down and recommend to the Board the appointment or removal of such persons and to discharge such other functions and exercise such other powers as may be delegated/ directed by the Board of Directors from time to time.
The Nomination and Remuneration Committee had devised criteria for evaluation of performance of the Directors including Independent Directors. The said criteria provides certain parameters like knowledge, competency, fulfillment of functions, availability and attendance, initiative, integrity, contribution, independent views and judgment, which are in compliance with applicable laws, regulations and guidelines.
Four Nomination and Remuneration Committee Meetings were held during the year ended March 31, 2017. The dates on which the meetings were held are as follows:
May 30, 2016, August 12, 2016, November 10, 2016 and February 14, 2017. The attendance of each Member of the Committee is given below:
Name of the Director Chairman / Member of the
Committee
No. of Nomination
and Remuneration
Committee Meetings attended
Mr. Keki M. Mistry Chairman 4Mr. Israel Makov Member 4Ms. Rekha Sethi Member 4
The Remuneration Policy for Directors, Key Managerial Personnel and other employees of the Company has been annexed as Annexure ‘B’ to the Corporate Governance Report.
6. REMUNERATION OF DIRECTORS The Managing Director’s and Whole-time Directors
remuneration is approved by the Board, as per recommendation of the Nomination and Remuneration Committee within the overall limit fixed by the shareholders at their meetings.
The Non-Executive Directors of the Company are entitled to commission, if and to the extent approved by the Board, of 1% as approved by the members, in addition to the sitting fees of ` 100,000/- payable to the Non-Executive Directors for attending each meeting of the Board and/or of Committee thereof. No commission was paid to Non-Executive Directors for the year 2016-17.

65ANNUAL REPORT 2016-17
CORPORATE OVERVIEW FINANCIAL STATEMENTSSTATUTORY REPORTS 01-07 80-27808-79
The details of Remuneration paid/payable to the Directors of the Company for the year ended March 31, 2017 are given below:-(Amount in `)
Directors Actual Remuneration/Sitting Fees for 2016-17 Salary * Bonus Perquisites** / Benefits Sitting Fees Total
Mr. Dilip S. Shanghvi 2,79,90,000 - 38,14,081 - 3,18,04,081Mr. Sudhir V. Valia 2,79,90,000 - 35,93,490 - 3,15,83,490Mr. Sailesh T. Desai 98,67,000 19,73,400 20,60,561 - 1,39,00,961Mr. Kalsundaram Subramanian - - - - -Mr. Israel Makov - - - 10,00,000 -Mr. S. Mohanchand Dadha - - - 17,00,000 -Mr. Hasmukh S. Shah - - - 17,00,000 -Mr. Keki M. Mistry - - - 16,00,000 -Mr. Ashwin S. Dani - - - 10,00,000 -Ms. Rekha Sethi - - - 13,00,000 -
* Salary includes Special Allowance. ** Perquisites include House Rent Allowance, Leave Travel Assistance, Medical Reimbursement, contribution to Provident Fund and such other perquisites,
payable to Directors.
Besides this, all the Whole-time Directors are also entitled to encashment of leave as per Company policy, and gratuity at the end of tenure, as per the rules of the Company.
Pursuant to the approval of the Shareholders at the 22nd Annual General Meeting, the Company had applied to the Central Government under Section 197(3) read with Schedule V of the Companies Act, 2013 for approval of maximum limit of remuneration as approved by members, in view of inadequacy of profits. The approval granted by the Central Government was for ` 60,00,000 (Rupees Sixty Lakhs only) per annum for a period of three years with effect from April 1, 2014 to March 31, 2017. Pursuant to calculation as per Part-A of Section II of Schedule V of the Companies Act 2013 read with MCA circular dated September 12, 2016, in case of inadequate profits, based on the calculation of effective capital of our Company as on the last day of financial year preceding the financial year of the respective year of appointment of the Managing Director and Whole-time Directors, the Managing Director and Whole-time Directors are eligible for remuneration upto ` 3.04 Crores per annum, each without approval of the Central Government. Accordingly the Company had made several representations to the Central Government to approve the remuneration of the Managing Director and Whole-time Directors upto the aforesaid limit as calculated as per Schedule V. However the Ministry of Corporate Affairs/Central Government reiterated the approval for remuneration of ` 60 Lakhs each per annum for the years from April 1, 2014 to March 31, 2017 for the Managing Director and Whole-time Directors. The Company has made further representation, to
the Central Government for reconsidering the approval on additional grounds for which the response from the MCA is awaited.
Further at the 24th AGM, the members’ approval was also obtained for revision in the remuneration of the Managing Director and the Whole-time Directors from April 1, 2016 for the remaining period of their respective current term of appointment upto March 31, 2018 / March 31, 2019, as applicable. Consequently during the year, an application for revision in the remuneration of the Managing Director and a Whole-time Director, from April 1, 2016 for the remaining period of their respective current term of appointment upto March 31, 2018 / March 31, 2019, as applicable, has been made by the Company to the Ministry of Corporate Affairs. The approval in respect of the foregoing application for revision is awaited from the Ministry of Corporate Affairs
In view of the approval for application of revision in remuneration being awaited, for the year 2016-2017, the Company has paid remuneration within the ceiling limit of ` 3.04 Crores, as mentioned above, to the Managing Director and Whole-time Director(s). On receipt of the approval from the Central Government of India, the balance amount of remuneration for the year 2016-17, if any, as per their entitlement, shall be paid to the Managing Director and Whole-time Director(s), as applicable, and the same shall be given effect to in the year in which the approval is received. Excess remuneration, if any, after final approval in respect of the application for revision is received, shall be refunded by the respective Managing Director and Whole-time Directors.

SUN PHARMACEUTICAL INDUSTRIES L IMITED66
The details of remuneration that the Managing Director and the Whole-time Directors are entitled, the remuneration actually paid to them and the maximum limit of the remuneration as approved by the members are explained below:
Directors Amount of remuneration including contribution to PF
entitled for the year 2016-2017, as approved by the Board within
the limit as approved by the members (excluding Perquisites
such as reimbursement of electricity charges, motor vehicle charges, etc. which shall be taken
at actuals)
Actual Amount Paid/Provided, out of the amount
entitled for the year 2016-2017 (including contribution
to P.F. and Perquisites such as reimbursement of electricity
charges, motor vehicle charges, etc. at actuals)
Amount of Remuneration paid
for 2016-2017, after excluding Contribution to PF which is excluded
for calculation of limit as per Schedule V of the
Companies Act 2013
Maximum Remuneration* p.a.
for the current tenure of appointment as
approved by the Members, subject to approval of the
Central Govt.,
Mr. Dilip Shanghvi** 3,92,93,367 3,18,04,081 2,84,45,281 5,64,00,000Mr. Sudhir Valia 3,92,93,367 3,15,83,490 2,82,24,690 5,64,00,000Mr. Sailesh Desai 1,38,61,361 1,39,00,961 1,27,16,921 1,54,00,000Mr. Kalyansundaram Subramanian has been appointed as an additional and as a Whole-time Director of the Company with effect from February 14, 2017, without any remuneration.
*Company’s contribution to provident fund, and superannuation fund or annuity fund, gratuity payment as per Company’s rules and encashment of leave at the end of his tenure, are not included in the computation of, ceiling on remuneration and perquisites as aforesaid.
**Commission to Managing Director: Subject to availability of profit and at the rate of not more than 1% of the net profit for the year, the Board of Directors will determine the commission payable within the overall ceiling laid as per the Act, as may be applicable from time to time. However no commission is paid to the Managing Director.
Notes: - a) The Agreement with Mr. Dilip S. Shanghvi, Mr. Sudhir V. Valia
and Mr. Sailesh T. Desai, the Executive Directors are for a period of 5 years. Either party to the agreement is entitled to terminate the Agreement by giving to the other party 30 days’ notice in writing. The agreement with Mr. Kalyansundaram Subramanian, Wholetime Director, would be entered into, after the 25th Annual General Meeting of the Company, will be for a period of 2 years wef February 14, 2017, and either party to the agreement would be entitled to terminate the agreement by giving to the other party notice of three months in writing.
b) The Company had formulated two Schemes for grant of stock options to the eligible employees of erstwhile Ranbaxy Laboratories Ltd., pursuant to the Scheme of Arrangement for merger of Ranbaxy Laboratories Ltd., into the Company. None of the Directors are entitled to stock options.
c) There is no separate provision for payment of severance fees to Whole-time Director(s).
d) The remuneration of Whole-time Directors consists only of fixed components.
e) The details of Equity Shares held by Non-Executive Directors as on March 31, 2017:
(Amount in `)
Director No. of Equity Shares held (held singly or jointly as first holder)
Mr. Israel Makov NilMr. S. Mohanchand Dadha NilMr. Hasmukh S. Shah NilMr. Keki M. Mistry 43,270Mr. Ashwin S. Dani NilMs. Rekha Sethi Nil
7. STAKEHOLDERS’ RELATIONSHIP COMMITTEE The Stakeholders’ Relationship Committee presently comprises
of Mr. S. Mohanchand Dadha, Mr. Dilip S. Shanghvi, Mr. Sudhir V. Valia with Mr. Hasmukh S. Shah as the Chairman. The constitution of the Stakeholders’ Relationship Committee meets with the requirements of Section 178 of the Companies Act, 2013 and also of Regulation 20 of the Listing Regulations, 2015. Mr. Sunil R. Ajmera, the Company Secretary of the Company is the Secretary of the Committee. The Board of Directors has delegated the power of approving transfer of securities to M/s. Link Intime India Pvt. Ltd, and/or the Company Secretary of the Company.

67ANNUAL REPORT 2016-17
CORPORATE OVERVIEW FINANCIAL STATEMENTSSTATUTORY REPORTS 01-07 80-27808-79
The terms of reference of the Committee inter alia includes the following: To look into redressal of grievances of shareholders, debenture holders and other security holders of the Company, to consider and resolve grievances of the security holders of the Company including complaints related to transfer of shares, non-receipt of balance sheet, non-receipt of declared dividends, etc, to approve issue of duplicate share certificates and to oversee and review all matters connected with the transfer, transmission and issue of securities, to oversee the performance of the Registrar and Transfer Agents and recommend measures for overall improvement in the quality of investor services, to investigate any activity within its terms of reference, to seek information from share transfer agents, to obtain outside legal or other professional advice and to secure attendance of outsiders with relevant expertise, if it considers necessary and have full access to the information contained in the records of the Company.
The Board has designated severally, Mr. Sunil R. Ajmera, Company Secretary and Mr. Ashok I. Bhuta, Sr. G.M - Secretarial as Compliance Officers.
Four Meetings of the Stakeholders’ Relationship Committee were held during the year ended March 31, 2017. The dates on which Meetings were held are as follows: May 30, 2016, August 12, 2016, November 10, 2016 and February 14, 2017. The attendance of each Member of the Committee is given below:
Name of the Director Chairman / Member of the
Committee
No. of Stakeholders’
Committee Meetings attended
Mr. Hasmukh S. Shah Chairman 3Mr. Sudhir V. Valia Member 4Mr. Dilip S. Shanghvi Member 3Mr. S. Mohanchand Dadha Member 4
Investor Complaints:The total numbers of complaints received and resolved to the satisfaction of shareholders during the year under review were 4.
8. COMMITTEE OF DIRECTORS (ALLOTMENT) The Committee of Directors (Allotment) presently comprises
of Mr. Dilip S. Shanghvi, Mr. Sudhir V. Valia, Mr. Sailesh T. Desai, Mr. S. Mohanchand Dadha and Mr. Hasmukh S. Shah. Mr. Sudhir V. Valia is the Chairman of the Committee and Mr. Sunil R. Ajmera, Company Secretary is the Secretary of the Committee.
Three meetings of the Committee of Directors (Allotment) were held during the year ended March 31, 2017. The dates on which Meetings were held are as follows:
May 2, 2016, November 22, 2016 and February 14, 2017. The attendance of each Member of the Committee is given below.
Name of the Director Chairman / Member of the
Committee
No. of Committee of Directors (Allotment) Meetings attended
Mr. Sudhir V. Valia Chairman 1Mr. Hasmukh S. Shah Member 3Mr. Sailesh T. Desai Member 3Mr. S. Mohanchand Dadha Member 1Mr. Dilip S. Shanghvi Member 3
The Committee of Directors (Allotment) interalia has the following powers: To allot shares pursuant to ESOP Schemes and to issue the equity share certificates to the shareholders holding the shares in physical form, to perform any or all of the acts, deeds, things and matters as may be required in connection with such issue, allotment and Listing of Equity Shares of `1/- each
9. CORPORATE SOCIAL RESPONSIBILITY COMMITTEEThe Corporate Social Responsibility Committee presently comprises of Mr. Sudhir V. Valia, Ms. Rekha Sethi with Mr. Dilip Shanghvi as the Chairman. The constitution of the Corporate Social Responsibility Committee meets the requirements of section 135 of the Companies Act, 2013. Mr. Sunil R. Ajmera, the Company Secretary of the Company is the Secretary of the Committee. The terms of reference of the Corporate Social Responsibility Committee include to formulate and recommend to the Board, a Corporate Social Responsibility Policy, to monitor the Corporate Social Responsibility Policy of the Company from time to time, to recommend the amount of expenditure to be incurred on the activities, to monitor amount spent on the CSR initiatives of the Company as per the CSR policy, to discharge such other functions and exercise such other powers as may be delegated/ directed by the Board of Directors from time to time. The contents of the CSR Policy of the Company can be accessed through the web link: http://www.sunpharma.com/policies.

SUN PHARMACEUTICAL INDUSTRIES L IMITED68
During the year ended March 31, 2017, two meetings of Corporate Social Responsibility Committee were held on May 30, 2016 and February 14, 2017. The attendance of each member of Committee is as follows:
Name of the Director Chairman / Member of the
Committee
No. of Corporate
Social Responsibility
Committee Meetings attended
Mr. Dilip S. Shanghvi Chairman 1Mr. Sudhir V. Valia Member 2Ms. Rekha Sethi Member 2
10. RISK MANAGEMENT COMMITTEEThe Risk Management Committee comprises of Mr. Dilip S. Shanghvi, Managing Director of the Company, Mr. Sudhir V. Valia, Whole time Director of the Company and Mr. Uday Baldota, CFO of the Company. The Chairman of the Committee is Mr. Dilip Shanghvi. The constitution of the Committee meets the requirements of Regulation 21 of the Listing Regulations, 2015. The terms of reference of the committee inter alia include: to formulate and recommend to the Board a Risk Management Plan/Policy, to implement, monitor and review the risk management plan for the Company, to recommend and implement procedures for risk assessment and minimisation, to monitor the Risk Management Policy of the Company from time to time, to discharge such other functions and exercise such other powers as may be delegated/ directed by the Board of Directors from time to time. Mr. Sunil R. Ajmera, the Company Secretary of the Company is the Secretary of the Committee.
During the year ended March 31, 2017, two meetings of Risk Management Committee Meetings were held on November 9, 2016 and February 13, 2017. The attendance of each member of committee is as follows:
Name of the Director Chairman / Member of the
Committee
No. of Risk Management Committee Meetings attended
Mr. Dilip S. Shanghvi Chairman 2Mr. Sudhir V. Valia Member 2Mr. Uday Baldota Member 2
11. SUBSIDIARY COMPANIESIn accordance with Regulation 16 of the Listing Regulations, 2015, Sun Pharma Laboratories Limited is a material Indian subsidiary Company (whose Debt Securities are listed on BSE) whose turnover or net worth (i.e., paid-up capital and free reserves) exceeds 20% of the consolidated turnover or net worth respectively, of the Company and its subsidiaries in the immediately preceding accounting year.
Mr. S. Mohanchand Dadha, and Ms. Rekha Sethi, Independent Directors of the Company are also Directors on the Board of Sun Pharma Laboratories Limited, as per the requirements specified in Regulation 24 of the Listing Regulations, 2015.
The financial statements including investments made by the unlisted subsidiaries were placed before and reviewed by the Audit Committee of the Company.
The Board of Directors of the Company reviewed periodically, the statement of all significant transactions and arrangements entered into by the unlisted subsidiary companies.
Copies of the Minutes of the Board Meetings of the unlisted subsidiary Companies were placed at the Board Meetings of the Company held during the year.
The policy for determining material subsidiaries of the Company is available on the website of the Company and can be accessed at http://www.sunpharma.com/policies.
12. GENERAL BODY MEETINGS (i) Location and time of the last three Annual General Meetings (“AGM”) held are as follows:
Year Meeting Location Date Time2013-2014 Twenty-Second AGM Sir Sayajirao Nagargruh, Akota,
Vadodara- 390 020, GujaratSeptember 27, 2014 12.00 noon
2014-2015 Twenty- Third AGM Prof. Chandravadan C. Mehta Auditorium – General Education Center, Maharaja Sayajirao University of Baroda, Near D. N. Hall, PratapGunj, Vadodara-390002, Gujarat
October 31, 2015 9.45 a.m.
2015 –2016 Twenty- Fourth AGM Sir Sayajirao Nagargruh, Akota, Vadodara-390 020 , Gujarat
September 17, 2016 11.15 a.m.

69ANNUAL REPORT 2016-17
CORPORATE OVERVIEW FINANCIAL STATEMENTSSTATUTORY REPORTS 01-07 80-27808-79
(ii) Special Resolutions passed during the last three Annual General Meetings:
a) At Twenty-Second Annual General Meeting: 1. Approval under Section 186 of the Companies Act, 2013
upto a maximum limit of ` 500 Billion (Rupees Five Hundred Billion only).
2. Approval under Section 180 (1)(c) of the Companies Act, 2013 to borrow money on behalf of the Company upto a maximum limit of ` 500 Billion (Rupees Five Hundred Billion only).
3. Approval for further issue of securities for an aggregate amount (inclusive of such premium as may be fixed on the securities) not exceeding ` 120 Billion (Rupees One Hundred Twenty Billion only)
4. Approval by members of the Company accorded for remuneration paid to Mr. Dilip S. Shanghvi, Managing Director, (DIN:00005588), of the Company for the financial year 2013-14 which is in excess of the limits prescribed under Schedule XIII of the Companies Act, 1956 in view of the absence of profits for the financial year 2013-14.
5. Approval by members of the Company accorded for remuneration paid to Mr. Sudhir V. Valia, Whole-time Director (DIN: 00005561) of the Company for the financial year 2013-14 which is in excess of the limits prescribed under Schedule XIII of the Companies Act, 1956 in view of the absence of profits for financial year 2013-14.
6. Approval by members of the Company accorded for remuneration paid to Mr. Sailesh T. Desai, Whole-time Director, (DIN:00005543), of the Company for the financial year 2013-14 which is in excess of the limits prescribed under Schedule XIII of the Companies Act, 1956 in view of the absence of profits for financial year 2013-14.
7. Approval by members of the Company accorded for Commission paid to the Non-Executive Directors of the Company (other than the Managing Director and/or Whole-time Directors) for the financial year 2013-14 which is in excess of the limits prescribed under Companies Act, 1956 in view of the absence of profits for financial year 2013-14.
8. Approval for the payment of Commission to Non-Executive Directors of the Company for each financial
year over a period of five years from the current financial year ending on 31.03.2015 up to and including financial year of the Company ending on 31.03.2019 to be calculated in accordance with the provisions of Section 198 of the Companies Act, 2013.
9. Approval to Mr. Aalok D. Shanghvi, who is relative of Director to hold office or place of profit under the Company for a period of five years from April 1, 2014, and remuneration (excluding reimbursement of expenses, if any) of `15,000,000/- (Rupees One Crore Fifty Lakhs Only) per annum.
b) At the Twenty-Third Annual General Meeting. 1. Approval for deletion of Clause 135 (bb) of the Articles
of Association of the Company pursuant to Section 14 of the Companies Act, 2013.
2. Approval for further issue of securities for an aggregate amount (inclusive of such premium as may be fixed on the securities) not exceeding ` 120 Billion (Rupees One Hundred Twenty Billion only).
c) At the Twenty-Fourth Annual General Meeting. 1. Approval for re-appointment of Mr. Ashwin Dani (DIN
00009126), as Independent Director of the Company for a further term of 2 years, who would not be liable to retire by rotation in terms of Section 152(6) of Companies Act, 2013.
2. Approval for re-appointment of Mr. Keki M. Mistry (DIN 00008886), as Independent Director of the Company for a further term of 2 years, who would not be liable to retire by rotation in terms of Section 152(6) of Companies Act, 2013.
3. Approval for re-appointment of Mr. Hasmukh Shah (DIN 00152195), as Independent Director of the Company for a further term of 2 years, who would not be liable to retire by rotation in terms of Section 152(6) of Companies Act, 2013.
4. Approval for re-appointment of Ms. Rekha Sethi (DIN 06809515), as Independent Director of the Company for a further term of 5 years, who would not be liable to retire by rotation in terms of Section 152(6) of Companies Act, 2013.
5. Approval for re-appointment of Mr. S Mohanchand Dadha (DIN 00087414), as Independent Director of the Company for a further term of 2 years, who would not be liable to retire by rotation in terms of Section 152(6) of Companies Act, 2013.

SUN PHARMACEUTICAL INDUSTRIES L IMITED70
6. Approval for ratification of the remuneration payable to M/s. Kailash Sankhlecha & Associates, Cost Accountants, as the Cost Auditors of the Company for audit of cost records maintained by the Company for the financial year 2016-17.
7. Approval for increase in maximum limit of remuneration payable to Mr. Dilip Shanghvi, Managing Director, with effect from April 1, 2016 for the remaining period of his present term of appointment upto March 31, 2018, and to consider approval for payment of the aforesaid remuneration as minimum remuneration in case inadequacy or absence of profits.
8. Approval for increase in maximum limit of remuneration to Mr. Sudhir Valia, Whole-time Director, and to consider approval for payment of the aforesaid remuneration as minimum remuneration with effect from April 1, 2016 for the remaining period of his present term of appointment upto March 31, 2019, in case inadequacy or absence.
9. Approval for increase in maximum limit of remuneration to Mr. Sailesh Desai, Whole-time Director, and to consider approval for payment of the aforesaid remuneration as minimum remuneration with effect from April 1, 2016 for the remaining period of his present term of appointment upto March 31, 2019, in case inadequacy or absence of profits.
10. Approval for adoption of new set of Articles of Association of the Company containing regulations/provisions in line with the Companies Act, 2013.
Proposed Resolution to be Conducted through Postal Ballot:As directed by the National Company Law Tribunal (NCLT), the Company has also provided the facility for voting by way of Postal Ballot for the approval of the Scheme of Arrangement among Sun Pharma Medisales Pvt Ltd., Ranbaxy Drugs Ltd., Gufic Pharma Ltd., and Sun Pharmaceutical Industries Ltd., vide Notice dated April 26, 2017 for convening the meeting of the Equity Shareholders and their respective shareholders and creditors
13. DISCLOSURES No transaction of a material nature has been entered into by
the Company with Directors or Management and their relatives, etc. that may have a potential conflict with the interests of the Company. Register of contracts containing transactions, in which directors are interested, is placed before the Board of Directors regularly. The transaction with the related parties as per Ind AS-24, are disclosed in the Annexure “A” attached to the Notes forming part of the Standalone Financial Statements for the year ended March 31, 2017.
There were no instances of non-compliance by the Company on any matters related to the capital markets or penalties, strictures imposed on the Company by the Stock Exchange or SEBI or any statutory authority on any matter related to capital markets, during the last three years.
The Company has laid down procedures to inform Board members about the risk assessment and its minimisation, which is periodically reviewed to ensure that risk control is exercised by the management effectively.
The Board of Directors of the Company has approved a whistle blower policy/vigil mechanism to monitor the actions taken on complaints received under the said policy. This policy also outlines the reporting procedure and investigation mechanism to be followed in case an employee blows the whistle for any wrong-doing in the Company. Employees are given protection in two important areas - confidentiality and against retaliation. It is ensured that employees can raise concerns regarding any violation or potential violation easily and free of any fear of retaliation, provided they have raised the concern in good faith. An Ombudsperson/s has been appointed to receive the complaints through a portal or email or letters who would investigate the complaints with an investigating committee. The final decision would be taken by the Ombudsperson in consultation with the Management and the Audit Committee. The Policy is expected to help to draw the Company’s attention to unethical, inappropriate or incompetent conduct which has or may have detrimental effects either for the organisation or for those affected by its functions. The details of establishment of vigil mechanism are available on the website of the Company. No personnel have been denied access to the Audit Committee.
Details of the familiarisation programme of the independent directors are available on the website of the Company at http://www.sunpharma.com/policies
During the year a separate meeting of the independent directors was held on February 14, 2017 inter-alia to review the performance of non-independent directors and the board as a whole.
The policy on dealing with the related party transactions is available on the website of the Company and can be accessed at http://www.sunpharma.com/policies.
The Company avails professional consultancy services from Makov Associates Ltd, in which Mr. Israel Makov, Non-Executive and Non-Independent Director of the Company is interested. Other than this, there are no pecuniary relationships of the Non-Executive Directors with the Company

71ANNUAL REPORT 2016-17
CORPORATE OVERVIEW FINANCIAL STATEMENTSSTATUTORY REPORTS 01-07 80-27808-79
Details of compliance and Adoption/Non Adoption of the non- mandatory requirements for the year ended March 31, 2017:
(i) The Company complies with all the mandatory requirements specified under Listing Regulations, 2015.
(ii) The Chairman of the Company is a Non-Executive Director. The Company has provided a separate office for the Chairman at the corporate office of the Company and the Chairperson is also allowed reimbursement of expenses incurred in performance of his duties.
(iii) The Company did not sent half-yearly financial results including summary of the significant events in the last six months to the household of each shareholder as the financial results are published in the newspapers having country wise circulation and the same are also posted on the website of the Company and the websites of BSE and NSE.. However, the Company has started sending quarterly results alongwith summary of significant events from the 3rd quarter ended December 31, 2016 to the shareholders whose e-mail IDs are available with the Company. The press release which is widely published is also sent to the shareholders and is also put on the website of the Company.
(iv) The auditors have issued an unmodified opinion of the financial statements of the Company.
(v) The Company has separate position for Chairman and Managing Director
(vi) The Internal Auditor reports their findings to the Audit Committee of the Company.
14. MEANS OF COMMUNICATION Website: The Company’s website www.sunpharma.com
contains a separate dedicated section ‘INVESTORS’ where shareholders’ information is available. The full Annual Report is also available on the website in a user friendly and downloadable form. Apart from this, official news releases, detailed presentations made to media, analysts etc., and the transcript of the conference calls are also displayed on the Company’s website.
Financial Results: The annual, half-yearly and quarterly results are regularly posted by the Company on its website www.sunpharma.com. These are also submitted to the Stock Exchanges in accordance with the listing requirements and published in all English Editions of ‘‘Financial Express’ and Gujarati Edition of ‘Financial Express’ which is published in Ahmedabad. The Company has started sending quarterly
results from the 3rd quarter ended December 31, 2016 to the shareholders whose e-mail IDs are registered with the Company .
Annual Report: Annual Report containing inter alia Audited Annual Accounts, Consolidated Financial Statements, Board’s Report, Auditors’ Report, and other important information is circulated to Members and others entitled thereto. The Management’s Discussion and Analysis Report forms part of the Annual Report.
Chairman’s Communique: The Chairman’s Speech is placed on the website of the Company.
Reminder to Investors: Reminders for unpaid dividend are sent to shareholders as per records every year.
Corporate Filing: Announcements, Quarterly Results, Shareholding Pattern etc. of the Company are regularly filed by the Company with the Stock Exchanges and are available on the website of BSE Ltd. - www.bseindia.com and National Stock Exchange of India Ltd. - www.nseindia.com.
15. GENERAL SHAREHOLDER INFORMATION 15.1 Annual General Meeting:
Date and Time : Tuseday, September 26, 2017 at
10:45 a.m.Venue : Sir Sayajirao Nagargruh, Akota,
Vadodara 390 020, Gujarat
15.2 Financial Calendar (tentative):
Results for quarter ending 30th June,2017 – Second week of August 2017.Results for quarter ending 30th September,2017 – Second week of November 2017.Results for quarter ending 31st December,2017 – Second week of February 2018.Audited Results for year ended 31st March, 2018 – Third or Fourth week of May 2018.
15.3 Details of Book-closure for Equity Shareholders: From Wednesday, September 20, 2017 to Tuesday,
September 26, 2017. (both days inclusive)
15.4 Dividend Payment Date: On or before September 29, 2017
15.5 (i) Listing of Equity Shares on Stock Exchanges At BSE Limited (BSE) and National Stock Exchange of
India Limited (NSE)

SUN PHARMACEUTICAL INDUSTRIES L IMITED72
(ii) Payment of Listing Fee Listing Fees for the financial year 2017 -18 have been
paid to BSE Limited and National Stock Exchange of India Limited, where the Company’s Equity Shares continue to be listed.
15.7 Stock Market Data - Equity Shares of `1/- paid-up value:
BSE Ltd. (BSE) (in `) National Stock Exchange of India Ltd. (NSE) (in `)Month’s High Price Month’s Low Price Month’s High Price Month’s Low Price
April, 2016 840.95 797.00 841.15 797.00 May, 2016 842.05 757.10 842.00 756.00 June, 2016 779.70 710.05 779.35 710.15 July, 2016 839.50 762.00 839.80 762.05 August, 2016 854.50 747.00 854.95 746.60 September, 2016 818.25 732.00 818.50 732.00 October, 2016 772.00 732.00 773.00 732.00 November, 2016 750.00 572.40 749.00 571.90 December, 2016 730.75 608.10 730.95 608.00 January, 2017 656.20 627.20 657.40 627.00 February, 2017 688.80 619.40 689.55 618.40 March, 2017 728.45 671.20 729.05 671.10
(Source: Compiled from data available on BSE and NSE websites)
15.6 Stock Code: Equity Shares(a) Trading Symbol BSE Ltd. (Demat Segment)
SUNPHARMA 524715
Trading Symbol National Stock Exchange (Demat Segment)
SUNPHARMA
(b) Demat ISIN Numbers in NSDL and CDSL for Equity Shares of `1/- each
ISIN No.INE044A01036
15.8 Share price performance in comparison to broad-based indices – BSE Sensex and NSE Nifty.
811763 763
830776 743 748
630710
632679
9,174
8,880
8,561
8,165
Apr
il-16
May
-16
Jun-
16
Jul-1
6
Aug-
16
9009500
9000
8500
8000
7500
7000
800
700
600
500
400
300
200
100
0
Sep-
16
Oct
-16
Mar
-17
Feb-
17
Jan-
17
Dec
-16
Nov
-16
8,225
8,6268,6118,786
8,639
8,2888,160
7,850
688
Closing Price of Sun Pharma’s shares on NSENSE Nifty (Closing)

73ANNUAL REPORT 2016-17
CORPORATE OVERVIEW FINANCIAL STATEMENTSSTATUTORY REPORTS 01-07 80-27808-79
Closing Price of Sun Pharma’s shares on BSEBSE Sensex (Closing)
Apr
il-16
May
-16
Jun-
16
Jul-1
6
Aug-
16
Sep-
16
Oct
-16
Mar
-17
Feb-
17
Jan-
17
Dec
-16
Nov
-16
25,607
26,66827,000
28,05228,452
27,86627,930
26,653 26,626
27,656
28,743
29,621811
763 764830
775743 748
710
630 632
679 688
900
800
700
600
500
400
300
200
100
0
30000
29000
28000
27000
26000
25000
24000
23000
Share price performance relative to BSE Sensex based on share price on March 31, 2017.
% Change inPeriod Sun Pharma Share Price BSE Sensex Sun Pharma relative to SensexYear-on-year -16.08% 16.88% -32.96%2 years -32.73% 5.95% -38.68%3 years 19.94% 32.32% -12.37%5 years 141.51% 70.19% 71.32%10 years 552.47% 126.59% 425.87%
Share price performance relative to Nifty based on share price on March 31, 2017
% Change inPeriod Sun Pharma Share Price NIFTY Sun Pharma relative to NIFTYYear-on-year -16.08% 18.55% -34.63%2 years -32.79% 8.04% -40.83%3 years 19.73% 36.84% -17.11%5 years 141.48% 73.24% 68.24%10 years 551.38% 140.05% 411.33%
(Source: Compiled from data available on BSE and NSE website)
15.9 Registrars & Transfer Agent (Share transfer and communication regarding share certificates, dividends and change of address)
Link Intime India Pvt. Ltd. C 101, 247 Park , L B S Marg, Vikhroli West, Mumbai 400 083E-Mail: [email protected]: 022- 49186000 Fax : 022- 49186060
(Source: Compiled from data available on BSE and NSE websites)

SUN PHARMACEUTICAL INDUSTRIES L IMITED74
15.10 Share Transfer SystemPresently, the share transfers which are received in physical form are processed and transferred by Registrar and Share Transfer Agents and the share certificates are returned within a period of 15 days from the date of receipt, subject to the documents being valid and complete in all respects.
15.11 Distribution of Shareholding as on March 31, 2017No. of equity shares held No. of Accounts Shares of face value `1 each/-
Numbers % to total accounts Number % to total sharesUpto 5000 565380 98.84 94491129 3.945001 - 10000 2865 0.50 20391579 0.8510001 - 20000 2129 0.37 27356859 1.1420001 - 30000 331 0.06 8155772 0.3430001 - 40000 171 0.03 6048830 0.2540001 - 50000 112 0.02 5141237 0.2150001 - 100000 297 0.05 21234831 0.89100001 and above 741 0.13 2216470944 92.38Total 572026 100.00 2399291181 100.00
15.12 Shareholding Pattern as on March 31, 2017 of Equity Shares as per Regulation 31 of the Securities Exchange Board of India (Listing Obligations and Disclosure Requirements) Regulations 2015.
Particulars Percentage No. of SharesA. Indian Promoters and Persons acting in Concert 54.39 1304855381B. Mutual Funds and UTI 5.36 128559256C. Banks/ Financial Institutions and Insurance Companies 6.84 164229063D. Private Corporate Bodies 3.80 91079824E. Indian Public 7.05 169073716F. Directors 0.16 3784017G. NRIs /OCBs 0.19 4454099H. Clearing Members 0.07 1770770I. Trusts 0.58 13847725J. Foreign Portfolio Investor (Corporate) 21.28 510650573K. Foreign National 0.00 23000L. Others 0.29 6963757Total 100.00 2399291181

75ANNUAL REPORT 2016-17
CORPORATE OVERVIEW FINANCIAL STATEMENTSSTATUTORY REPORTS 01-07 80-27808-79
15.13 Dematerialisation of Shares About 99.41% of the outstanding Equity shares have been de-materialised up to March 31, 2017. Trading in Shares of the Company is permitted only in de-materialised form w.e.f. November 29, 1999 as per notification issued by the Securities and Exchange Board of India (SEBI).
Liquidity: Your Company’s equity shares are fairly liquid and are actively traded on National Stock Exchange of India Ltd., (NSE) and The BSE Ltd.(BSE). Relevant data for the average daily turnover for the financial year 2016-17 is given below: BSE BSE NSE BSE + NSEIn no. of share (in Thousands)
424.34 3313.64 3737.98
In value terms (` Millions)
311.03 2506.42 2817.45
(Source: Compiled from data available on BSE and NSE website)
15.14 Outstanding GDRs/ADRs/Warrants or any Convertible instruments, conversion date and likely impact on equity:The Company does not have any outstanding GDRs/ADRs/Warrants/Convertible Instruments as on March 31, 2017.
Outstanding Stock OptionsThe details of Number of Stock Options outstanding as on March 31, 2017 are provided in the Board’s Report.
SHAREHOLDING PATTERN AS ON MARCH 31, 2017 [ % ]
Outstanding Unclaimed SharesThe status of outstanding unclaimed shares in the Unclaimed Share Suspense Account of the Company is as under:-
Particulars No. of ShareholdersNo. of equity shares of `1/- each of Sun
PharmaAggregate number of shareholders and the outstanding shares lying in the Unclaimed Suspense Account as on March 31, 2016
1,118 398,557
Number of shareholders who approached the Company for transfer of shares from the said Unclaimed Suspense Account during the period from April 1, 2016 to March 31, 2017
11 8,818
Number of shareholders to whom shares were transferred from the Unclaimed Suspense Account during the said period.
11 8,818
Aggregate number of shareholders and the outstanding shares lying in the Unclaimed Suspense Account as on March 31, 2017
1,107 389,739*
*The voting rights in respect of these shares shall remain frozen till the claim of the rightful shareholders is approved by the Company.
15.15 Disclosure of commodity price risk and commodity hedging activities The Company is exposed to foreign exchange risks emanating from our business, assets and liabilities denominated in foreign
currency. In order to hedge this risk, the Company proactively uses hedging instruments e.g. forward contracts, options and other simple derivatives from time to time. The Company does not have any significant exposure on commodities directly.
15.16 Plant locations as on March 31, 2017: 1. Survey No.214 and 20, Govt. Industrial Area, Phase-II, Piparia, Silvassa – 396 230, U.T. of D & NH.
2. Plot No.24/2 and No.25, GIDC, Phase- IV, Panoli – 395 116, Dist. Bharuch, Gujarat.
3. A-7 & A-8, MIDC Industrial Area, Ahmednagar – 414 111, Maharashtra.
0.290
54.39
21.28
0.580.07
0.160.197.05
3.8
5.36
6.84
Indian Promoters & Persons Acting in Concert Mutual Funds and UTI Banks/ Financial Institutions and Insurance Companies Private Corporate Bodies Indian Public Directors & Relatives NRIs / OCBs Clearing Members Trusts Foreign Portfolio Investor(Corporate) Foreign National Others

SUN PHARMACEUTICAL INDUSTRIES L IMITED76
15.17 Investor Correspondence
(a) For transfer/dematerialisation of Shares, payment of dividend on Shares, and any other query relating to the shares of the Company
For Shares held in Physical FormLink Intime India Pvt. Ltd. C 101, 247 Park , L B S Marg, Vikhroli West,Mumbai 400 083E-Mail: [email protected]: 022- 49186000 Fax : 022- 49186060For Shares held in Demat FormTo the Depository Participant.
(b) E-mail id designated by the Company for Investor Complaints [email protected]
(c) Any query on Annual Report Mr. Sunil R. Ajmera/ Mr. Ashok I. Bhuta/ Mr. Nimish Desai,Sun House, Plot No. 201 B/1, Western Express Highway, Goregaon-East, Mumbai - 400 063, [email protected]@[email protected]@sunpharma.com
4. Plot No. 4708, GIDC, Ankleshwar – 393 002, Gujarat.
5. Sathammai Village, Karunkuzhi Post, Maduranthakam T.K. Kanchipuram Dist. Tamil Nadu – 603 303.
6. Halol-Baroda Highway, Near Anand Kendra, Halol, Dist. Panchmahal- 389350 Gujarat.
7. Plot No. 817/A, Karkhadi – 391 450, Taluka: Padra, Distt. Vadodara, Gujarat.
8. Survey no. 259/15, Dadra – 396191, U.T. of D. & NH.
9. Plot No. Z/15, Sez-1, Po. Dahej, Taluko vagra, Dist. Bharuch, Gujarat.
10. Village Toansa, P.O. Railmajra Distt. Nawansahar-144533 (Punjab)
11. A-41, Industrial Area, Phase VIII-A, Sahibzada Ajit Singh Nagar, Mohali-160071 (Punjab)
12. Plot No. K - 5,6,7, Ghirongi Industrial Area, Malanpur, Dist. Bhind, M P.
13. Pharma Manufacturing Industrial Area 3 A.B. Road, Dewas-455001, Madhya Pradesh
14. Sy. No. 16, Ekarajapura, Hoskote, Bengaluru (Karnataka),
15. Plot No. B-2 Madkaim Industrial Estate, Ponda, Goa
16. Plot No. 1341 & 1342 EPIP-1, Hill Top Industrial Area, Village Bhatolikalan (Barotiwala), Baddi – 174103 (H.P.)
17. Village & PO Ganguwala, Tehsil Paonta Sahib-173025, Distt. Sirmour (H.P.)
18. Village Batamandi,Tehsil Paonta Sahib-173025, Distt. Sirmour (H.P.).
For and on behalf of the Board
Place : Mumbai Dilip S. Shanghvi Sudhir V. Valia Sailesh T. DesaiDate : May 26, 2017 Managing Director Whole-time Director Whole-time Director

77ANNUAL REPORT 2016-17
CORPORATE OVERVIEW FINANCIAL STATEMENTSSTATUTORY REPORTS 01-07 80-27808-79
ANNEXURE ‘B’
I. NEED FOR THE POLICYA. Business Need: Retaining, attracting and managing quality
talent is of critical importance to the Company’s intellectual property in the knowledge driven global business. This requires a communication by the Company that the organisation cares for its team and values the growth of its team members. This Policy intends to provide clarity & guidance on the remuneration payable to the employees of the Company including Directors & Key managerial Personnel members of senior management and manner or the mechanism in which the Company rewards its team.
B. Legal requirements: Section 178 of the Companies Act, 2013 and the Listing Agreement entered into by the Company with the Stock Exchanges require the Board of Directors (“Board”) of the Company, on recommendation of the Nomination and Remuneration Committee (“NRC”), to formulate a policy, relating to the remuneration for the directors, key management personnel and other employees.
II OBJECTIVES OF THE POLICY A. Retaining, attracting and managing quality talent.
B. Ensuring that the level and composition of remuneration is reasonable and sufficient to attract, retain and motivate the all the employees of the Company at
different levels of the organisation to put in their best efforts run and grow the Company successfully.
C. Ensuring that the relationship of remuneration to performance is clear and meets appropriate performance benchmarks.
D. Ensuring the remuneration to directors, key managerial personnel and senior management is proportionate to the job role & responsibilities and comparable to the industrial standards. Variable Incentive pay, if paid to any employee, should be linked to the performance of such employee and also the Company during such period.
E. Improving the overall performance and value of the Company by optimum use of its human resources.
III. APPLICABILITY This Policy lays down the guiding principle for employment
agreements entered into/ to be entered into after the approval of the Policy and for changes made to existing employment agreements hereafter.
IV. POLICY STATEMENTA. Guiding Principles for remuneration: The Company shall
remunerate all its personnel reasonably and sufficiently as per
REMUNERATION POLICY
ANNEXURE ‘A’ TO CORPORATE GOVERNANCE FOR THE YEAR ENDED MARCH 31, 2017
DECLARATION OF COMPLIANCE WITH CODE OF CONDUCT
I, Dilip S. Shanghvi, Managing Director of Sun Pharmaceutical Industries Limited (“the Company”) hereby declare that, to the best of my information, all the Board Members and Senior Management Personnel of the Company have affirmed their compliance and undertaken to continue to comply with the Code of Conduct laid down by the Board of Directors of the Company.
For Sun Pharmaceutical Industries Ltd.,
Dilip S. Shanghvi Managing Director
Date: May 26, 2017

SUN PHARMACEUTICAL INDUSTRIES L IMITED78
C. Entitlement: The authority to determine the entitlement to various components as aforesaid for each class and designation of personnel shall be as follows:
Designation/Class To be determined byDirector Members on recommendation of
NRC and the Board.
Key Managerial Personnel Board on recommendation of the NRC
Other employees Human Resources Head
V. POLICY DEVIATION The Board/ NRC/ HR Head may deviate from this Policy if
there are specific reasons to do so in an individual case.
VI. CHANGE MANAGEMENT The Board may in consultation with the Nomination and
Remuneration Committee amend or modify this Policy in whole or in part, at any time.
industry benchmarks and standards. The remuneration shall be commensurate to retain and motivate the human resources of the Company. The compensation package will, inter alia, take into account the experience of the personnel, the knowledge & skill required including complexity of his job, work duration and risks associated with the work, and attitude of the worker like, positive outlook, team work, loyalty etc.
B. Components of Remuneration: The following will be the various remuneration components which may be paid to the personnel of the Company based on the designation and class of the personnel.
a. Fixed compensation: The fixed salaries of the Company’s personnel shall be competitive and based on the individual personnel’s responsibilities and performance.
b. Variable compensation: The personnel of the Company may be paid remuneration by way of variable salaries based on their performance evaluation. Such variable salaries should be based on the performance of the individual against his short and long term performance objectives and the performance of the Company.
c. Share based payments: The Board may, on the recommendation of the NRC, issue to certain class of personnel a share and share price related incentive program.
d. Non-monetary benefits: Senior management personnel of the Company may, on a case to case basis, be awarded customary non-monetary benefits such as discounted salary advance / credit facility, rent free accommodation, Company cars with or without chauffer’s, share and share price related incentive, reimbursement of electrify and telephone bills etc.
e. Gratuity/group insurance: Personnel may also be awarded to group insurance and other key man insurance protection. Further as required by the law necessary gratuity shall be paid to the personnel.
f. Commission: The directors may be paid commission if approved by the shareholders. The shareholders may authorise the Board to declare commission to be paid to any director of the Board.

79ANNUAL REPORT 2016-17
CORPORATE OVERVIEW FINANCIAL STATEMENTSSTATUTORY REPORTS 01-07 80-27808-79
Independent Auditor’s Certificate on Corporate Governance
TO THE MEMBERS OFSUN PHARMACEUTICAL INDUSTRIES LIMITED
1. This certificate is issued in accordance with the terms of our engagement letter dated October 18, 2016.
2. We, Deloitte Haskins & Sells LLP, Chartered Accountants, the Statutory Auditors of SUN PHARMACEUTICAL INDUSTRIES LIMITED (“the Company”), have examined the compliance of the conditions of Corporate Governance by the Company, for the year ended on March 31, 2017, as stipulated in regulations 17 to 27 and clauses (b) to (i) of regulation 46(2) and para C and D of Schedule V of the Securities and Exchange Board of India (Listing Obligations and Disclosure Requirements) Regulations, 2015(“the Listing Regulations”).
Managements’ Responsibility3. The compliance of the conditions of Corporate Governance
is the responsibility of the Management. This responsibility includes the design, implementation and maintenance of internal control and procedures to ensure the compliance with the conditions of Corporate Governance stipulated in Listing Regulations.
Auditor’s Responsibility4. Our responsibility is limited to examining the procedures and
implementation thereof, adopted by the Company for ensuring compliance with the conditions of the Corporate Governance. It is neither an audit nor an expression of opinion on the financial statements of the Company.
5. We have examined the books of account and other relevant records and documents maintained by the Company for the purposes of providing reasonable assurance on the compliance with Corporate Governance requirements by the Company.
6. We have carried out an examination of the relevant records of the Company in accordance with the Guidance Note on Certification of Corporate Governance issued by the Institute of the Chartered Accountants of India (“the ICAI”), the
Standards on Auditing specified under Section 143(10) of the Companies Act 2013, in so far as applicable for the purpose of this certificate and as per the Guidance Note on Reports or Certificates for Special Purposes issued by the ICAI which requires that we comply with the ethical requirements of the Code of Ethics issued by the ICAI.
7. We have complied with the relevant applicable requirements of the Standard on Quality Control (SQC) 1, Quality Control for Firms that Perform Audits and Reviews of Historical Financial Information, and Other Assurance and Related Services Engagements.
Opinion8. Based on our examination of the relevant records and
according to the information and explanations provided to us and the representations provided by the Management of the Company, we certify that the Company has complied with the conditions of Corporate Governance as stipulated in regulations 17 to 27 and clauses (b) to (i) of regulation 46(2) and para C and D of Schedule V of the Listing Regulations during the year ended March 31, 2017.
9. We state that such compliance is neither an assurance as to the future viability of the Company nor the efficiency or effectiveness with which the Management has conducted the affairs of the Company.
For DELOITTE HASKINS & SELLS LLPChartered Accountants
(Firm’s Registration No. 117366W / W-100018)
Rajesh K. HiranandaniPartner
(Membership No. 36920)Place: Mumbai
Date: May 26, 2017

S U N P H A R M A C E U T I C A L I N D U S T R I E S L I M I T E D8 0
Report on the Standalone Ind AS Financial StatementsWe have audited the accompanying standalone Ind AS financial statements of Sun Pharmaceutical Industries Limited (“the Company”), which
comprise the Balance Sheet as at 31st March, 2017, and the Statement of Profit and Loss (including Other Comprehensive Income), the Cash
Flow Statement and the Statement of Changes in Equity for the year then ended, and a summary of the significant accounting policies and
other explanatory information.
Management’s Responsibility for the Standalone Ind AS Financial StatementsThe Company’s Board of Directors is responsible for the matters stated in Section 134(5) of the Companies Act, 2013 (“the Act”) with respect
to the preparation of these standalone Ind AS financial statements that give a true and fair view of the financial position, financial performance
including other comprehensive income, cash flows and changes in equity of the Company in accordance with the accounting principles
generally accepted in India, including the Indian Accounting Standards (Ind AS) prescribed under section 133 of the Act.
This responsibility also includes maintenance of adequate accounting records in accordance with the provisions of the Act for safeguarding the
assets of the Company and for preventing and detecting frauds and other irregularities; selection and application of appropriate accounting
policies; making judgments and estimates that are reasonable and prudent; and design, implementation and maintenance of adequate
internal financial controls, that were operating effectively for ensuring the accuracy and completeness of the accounting records, relevant
to the preparation and presentation of the standalone Ind AS financial statements that give a true and fair view and are free from material
misstatement, whether due to fraud or error.
Auditor’s ResponsibilityOur responsibility is to express an opinion on these standalone Ind AS financial statements based on our audit.
In conducting our audit, we have taken into account the provisions of the Act, the accounting and auditing standards and matters which are
required to be included in the audit report under the provisions of the Act and the Rules made thereunder.
We conducted our audit of the standalone Ind AS financial statements in accordance with the Standards on Auditing specified under Section
143(10) of the Act. Those Standards require that we comply with ethical requirements and plan and perform the audit to obtain reasonable
assurance about whether the standalone Ind AS financial statements are free from material misstatement.
An audit involves performing procedures to obtain audit evidence about the amounts and the disclosures in the standalone Ind AS financial
statements. The procedures selected depend on the auditor’s judgment, including the assessment of the risks of material misstatement of
the standalone Ind AS financial statements, whether due to fraud or error. In making those risk assessments, the auditor considers internal
financial control relevant to the Company’s preparation of the standalone Ind AS financial statements that give a true and fair view in order
to design audit procedures that are appropriate in the circumstances. An audit also includes evaluating the appropriateness of the accounting
policies used and the reasonableness of the accounting estimates made by the Company’s Directors, as well as evaluating the overall
presentation of the standalone Ind AS financial statements.
We believe that the audit evidence obtained by us is sufficient and appropriate to provide a basis for our audit opinion on the standalone Ind
AS financial statements.
OpinionIn our opinion and to the best of our information and according to the explanations given to us, the aforesaid standalone Ind AS financial
statements give the information required by the Act in the manner so required and give a true and fair view in conformity with the accounting
principles generally accepted in India, of the state of affairs of the Company as at 31st March, 2017, and its loss, total comprehensive loss, its
cash flows and the changes in equity for the year ended on that date.
INDEPENDENT AUDITOR’S REPORT TO THE MEMBERS OF SUN PHARMACEUTICAL INDUSTRIES LIMITED

8 1A N N UA L R E P O RT 2 0 1 6 - 1 7
CORPORATE OVERVIEW STATUTORY REPORTS FINANCIAL STATEMENTS01-07 08-79 80-278
INDEPENDENT AUDITOR’S REPORT TO THE MEMBERS OF SUN PHARMACEUTICAL INDUSTRIES LIMITED
Emphasis of MatterWe draw attention to Note 59(11) to the standalone Ind AS financial statements. As referred to in the said Note: Remuneration to the
Managing Director and the Whole-time Director(s) of the Company for the years ended 31st March, 2015, 31st March, 2016 and 31st March,
2017 are higher by ` 49.6 Million, ` 29.6 Million and ` 44.7 Million respectively than the amounts approved by the Central Government
of India (Ministry of Corporate Affairs) on applications made by the Company to approve the maximum remuneration as approved by the
members of the Company for the three years ended 31st March, 2017, in excess of the limits specified under Schedule V to the Act, in case
of inadequacy of profits. The Management of the Company have re-represented to the office of the Ministry of Corporate Affairs for approval
of remuneration within the overall limits approved by the members of the Company for the years ended 31st March, 2015 and 31st March,
2016, and for the year ended 31st March, 2017, applications for revision in the remuneration, as approved by the members of the Company,
has been made to the Ministry of Corporate Affairs. The responses in respect of the foregoing re-representation / applications for revision
are awaited from the Ministry of Corporate Affairs.
Our opinion is not modified in respect of this matter.
Other MatterThe transition date opening balance sheet of the Company as at 1st April, 2015 include the financial information of erstwhile Ranbaxy
Laboratories Limited, consequent to its amalgamation into the Company which was effected on 24th March, 2015, with the appointed date of
1st April, 2014 [refer Note 59(4) to the standalone Ind AS financial statements]. The said financial information included in these standalone
Ind AS financial statements are based on financial information previously prepared in accordance with the Companies (Accounting Standards)
Rules, 2006, audited by the other auditors, and have been restated to comply with Ind AS. Adjustments made to the financial information
previously prepared in accordance with the Companies (Accounting Standards) Rules, 2006 to comply with Ind AS have been audited by us.
Our opinion is not modified in respect of this matter.
Report on Other Legal and Regulatory Requirements1. As required by Section 143(3) of the Act, based on our audit we report, to the extent applicable that:
a) We have sought and obtained all the information and explanations which to the best of our knowledge and belief were necessary
for the purposes of our audit.
b) In our opinion, proper books of account as required by law have been kept by the Company so far as it appears from our
examination of those books.
c) The Balance Sheet, the Statement of Profit and Loss including Other Comprehensive Income, the Cash Flow Statement and
Statement of Changes in Equity dealt with by this Report are in agreement with the books of account.
d) In our opinion, the aforesaid standalone Ind AS financial statements comply with the Indian Accounting Standards prescribed
under Section 133 of the Act.
e) On the basis of the written representations received from the directors as on 31st March, 2017 taken on record by the Board of
Directors, none of the directors is disqualified as on 31st March, 2017 from being appointed as a director in terms of Section 164(2)
of the Act.
f) With respect to the adequacy of the internal financial controls over financial reporting of the Company and the operating
effectiveness of such controls, refer to our separate Report in “Annexure A”. Our report expresses an unmodified opinion on the
adequacy and operating effectiveness of the Company’s internal financial controls over financial reporting.

S U N P H A R M A C E U T I C A L I N D U S T R I E S L I M I T E D8 2
g) With respect to the other matters to be included in the Auditor’s Report in accordance with Rule 11 of the Companies (Audit and
Auditors) Rules, 2014, as amended, in our opinion and to the best of our information and according to the explanations given to us:
i. The Company has disclosed the impact of pending litigations on its financial position in its standalone Ind AS financial
statements - Refer Note 40(i) to the standalone Ind AS financial statements.
ii. The Company has made provision, as required under the applicable law or accounting standards, for material foreseeable
losses, if any, on long-term contracts including derivative contracts – Refer Notes 25 and 30 to the standalone Ind AS financial
statements.
iii. There has been no delay in transferring amounts, required to be transferred, to the Investor Education and Protection Fund
by the Company except a sum of ` 13.4 Million, which is held in abeyance due to pending legal cases.
iv. The Company has provided requisite disclosures in Note 56 to the standalone Ind AS financial statements as regards its
holding and dealings in Specified Bank Notes as defined in the Notification S.O. 3407(E) dated 8th November, 2016 of the
Ministry of Finance, during the period from 8th November, 2016 to 30th December, 2016. Based on audit procedures
performed and the representations provided to us by the Management of the Company, we report that the disclosures
are in accordance with the books of account maintained by the Company and as produced to us by the Management of the
Company.
2. As required by the Companies (Auditor’s Report) Order, 2016 (“the Order”) issued by the Central Government in terms of Section
143(11) of the Act, we give in “Annexure B” a statement on the matters specified in paragraphs 3 and 4 of the Order.
For DELOITTE HASKINS & SELLS LLPChartered Accountants
(Firm’s Registration No. 117366W/W-100018)
RAJESH K. HIRANANDANIPlace: Mumbai PartnerDate: 26th May, 2017 (Membership No. 36920)
INDEPENDENT AUDITOR’S REPORT TO THE MEMBERS OF SUN PHARMACEUTICAL INDUSTRIES LIMITED

8 3A N N UA L R E P O RT 2 0 1 6 - 1 7
CORPORATE OVERVIEW STATUTORY REPORTS FINANCIAL STATEMENTS01-07 08-79 80-278
ANNEXURE “A” TO THE INDEPENDENT AUDITOR’S REPORT
(Referred to in paragraph 1(f) under ‘Report on Other Legal and Regulatory Requirements’ section of our report of even date to the Members of Sun Pharmaceutical Industries Limited)
Report on the Internal Financial Controls Over Financial Reporting under Clause (i) of Sub-section 3 of Section 143 of the Companies Act, 2013 (“the Act”)We have audited the internal financial controls over financial reporting of Sun Pharmaceutical Industries Limited (“the Company”) as of 31st
March, 2017 in conjunction with our audit of the standalone Ind AS financial statements of the Company for the year ended on that date.
Management’s Responsibility for Internal Financial ControlsThe Company’s management is responsible for establishing and maintaining internal financial controls based on the internal control over
financial reporting criteria established by the Company considering the essential components of internal control stated in the Guidance
Note on Audit of Internal Financial Controls Over Financial Reporting issued by the Institute of Chartered Accountants of India. These
responsibilities include the design, implementation and maintenance of adequate internal financial controls that were operating effectively
for ensuring the orderly and efficient conduct of its business, including adherence to company’s policies, the safeguarding of its assets, the
prevention and detection of frauds and errors, the accuracy and completeness of the accounting records, and the timely preparation of reliable
financial information, as required under the Act.
Auditor’s ResponsibilityOur responsibility is to express an opinion on the Company’s internal financial controls over financial reporting based on our audit. We
conducted our audit in accordance with the Guidance Note on Audit of Internal Financial Controls Over Financial Reporting issued by
the Institute of Chartered Accountants of India and the Standards on Auditing prescribed under Section 143(10) of the Act, to the extent
applicable to an audit of internal financial controls. Those Standards and the Guidance Note require that we comply with ethical requirements
and plan and perform the audit to obtain reasonable assurance about whether adequate internal financial controls over financial reporting was
established and maintained and if such controls operated effectively in all material respects.
Our audit involves performing procedures to obtain audit evidence about the adequacy of the internal financial controls system over
financial reporting and their operating effectiveness. Our audit of internal financial controls over financial reporting included obtaining
an understanding of internal financial controls over financial reporting, assessing the risk that a material weakness exists, and testing and
evaluating the design and operating effectiveness of internal control based on the assessed risk. The procedures selected depend on the
auditor’s judgement, including the assessment of the risks of material misstatement of the financial statements, whether due to fraud or error.
We believe that the audit evidence we have obtained is sufficient and appropriate to provide a basis for our audit opinion on the Company’s
internal financial controls system over financial reporting.
Meaning of Internal Financial Controls Over Financial ReportingA company’s internal financial control over financial reporting is a process designed to provide reasonable assurance regarding the reliability
of financial reporting and the preparation of financial statements for external purposes in accordance with generally accepted accounting
principles. A company’s internal financial control over financial reporting includes those policies and procedures that (1) pertain to the
maintenance of records that, in reasonable detail, accurately and fairly reflect the transactions and dispositions of the assets of the company;
(2) provide reasonable assurance that transactions are recorded as necessary to permit preparation of financial statements in accordance
with generally accepted accounting principles, and that receipts and expenditures of the company are being made only in accordance with
authorisations of management and directors of the company; and (3) provide reasonable assurance regarding prevention or timely detection
of unauthorised acquisition, use, or disposition of the company’s assets that could have a material effect on the financial statements.

S U N P H A R M A C E U T I C A L I N D U S T R I E S L I M I T E D8 4
Inherent Limitations of Internal Financial Controls Over Financial ReportingBecause of the inherent limitations of internal financial controls over financial reporting, including the possibility of collusion or improper
management override of controls, material misstatements due to error or fraud may occur and not be detected. Also, projections of any
evaluation of the internal financial controls over financial reporting to future periods are subject to the risk that the internal financial control
over financial reporting may become inadequate because of changes in conditions, or that the degree of compliance with the policies or
procedures may deteriorate.
OpinionIn our opinion, to the best of our information and according to the explanations given to us, the Company has, in all material respects, an
adequate internal financial controls system over financial reporting and such internal financial controls over financial reporting were operating
effectively as at 31st March, 2017, based on the internal control over financial reporting criteria established by the Company considering the
essential components of internal control stated in the Guidance Note on Audit of Internal Financial Controls Over Financial Reporting issued
by the Institute of Chartered Accountants of India.
For DELOITTE HASKINS & SELLS LLPChartered Accountants
(Firm’s Registration No. 117366W/W-100018)
RAJESH K. HIRANANDANIPlace: Mumbai PartnerDate: 26th May, 2017 (Membership No. 36920)
ANNEXURE “A” TO THE INDEPENDENT AUDITOR’S REPORT
(Referred to in paragraph 1(f) under ‘Report on Other Legal and Regulatory Requirements’ section of our report of even date to the Members of Sun Pharmaceutical Industries Limited)

8 5A N N UA L R E P O RT 2 0 1 6 - 1 7
CORPORATE OVERVIEW STATUTORY REPORTS FINANCIAL STATEMENTS01-07 08-79 80-278
(i) (a) The Company has maintained proper records showing full particulars, including quantitative details and situation of fixed assets.
(b) The Company has a program of verification of fixed assets to cover all the items in a phased manner over a period of three
years which, in our opinion, is reasonable having regard to the size of the Company and the nature of its assets. Pursuant to the
program, certain fixed assets were physically verified by the Management during the year. According to the information and
explanations given to us, no material discrepancies were noticed on such verification.
(c) According to the information and explanations given to us and the records examined by us and based on the examination of the
registered sale deed / transfer deed / conveyance deed / agreement for sale along with registered power of attorney / consent
terms taken on record by the Honorable Bombay City Civil Court at Bombay / share certificate / other documents evidencing title
provided to us, we report that, the title deeds, comprising all the immovable properties of freehold land and buildings, are held in
the name of the Company as at the balance sheet date, except the following:
Particulars of the freehold land and building
Cost or deemed cost as at 31st
March, 2017 (` in Million)
Carrying amount as at 31st
March, 2017 (` in Million)
Remarks
Freehold land located in Himachal Pradesh admeasuring 645,150 Square metres
76.3 76.3 The title deeds are in the name of Ranbaxy Laboratories Limited, erstwhile company that was merged with the Company under Sections 391 to 394 of the Companies Act, 1956 in terms of the approval of the Honorable High Courts of Gujarat and of Punjab and Haryana.
Freehold land located in Punjab admeasuring 370,527 Square metres
27.2 27.2
Freehold land located in Haryana admeasuring 64,161 Square metres
109.0 109.0
Freehold land located in Madhya Pradesh admeasuring 91,330 Square metres
5.8 5.8
Freehold land located in Karnataka admeasuring 30,362 Square metres
28.3 28.3
Freehold land located in Punjab admeasuring 8,364 Square metres
2.5 2.5 The title of this land is under dispute in respect of which we have been informed by the Management of the Company that they have filed a Special Leave Petition with the Honorable Supreme Court against the order passed by the Honorable High Court of Punjab and Haryana and the matter is under adjudication.
Freehold land located in Chennai admeasuring 71,747 Square metres and building thereon
11.3 10.2 The titles are in the name of Tamilnadu Dadha Pharmaceuticals Limited / Pradeep Drug Company Limited, erstwhile companies that was merged with the Company under Sections 391 to 394 of the Companies Act, 1956 in terms of the approval of the Honorable High Courts of Gujarat and of Tamilnadu / order of the New Delhi Bench of Board of Industrial and Financial Reconstruction respectively.
In respect of a building where the Company is entitled to the right of occupancy and use and disclosed as fixed assets in the standalone
Ind AS financial statements, we report that the agreement / non-convertible preference shares / compulsorily convertible debentures
ANNEXURE “B” TO THE INDEPENDENT AUDITOR’S REPORT(Referred to in paragraph 2 under ‘Report on Other Legal and Regulatory Requirements’ section of our report
of even date to the Members of Sun Pharmaceutical Industries Limited)

S U N P H A R M A C E U T I C A L I N D U S T R I E S L I M I T E D8 6
entitling the right of occupancy and use of building, are in the name of the Company as at the balance sheet date.
In respect of immovable properties of land and buildings that have been taken on lease and disclosed as fixed assets in the standalone
Ind AS financial statements, the lease agreements are in the name of the Company, where the Company is the lessee in the agreement,
except for the following:
Particulars of the leasehold land
Cost or deemed cost as at 31st
March, 2017 (` in Million)
Carrying amount as at 31st
March, 2017 (` in Million)
Remarks
Located in Maharashtra admeasuring 20,000 Square metres.*represents composite consideration for land and building.
* 17.4 16.6 The lease agreements are in the name of Crosslands Research Laboratories Limited which was merged with Ranbaxy Laboratories Limited, erstwhile company that was merged with the Company under Sections 391 to 394 of the Companies Act, 1956 in terms of the approval of the Honorable High Courts of Gujarat and of Punjab and Haryana.
Located in Goa admeasuring 18,450 Square metres
2.7 2.6
Located in Punjab admeasuring 323,866 Square metres
213.2 208.3 The lease agreements are in the name of Ranbaxy Laboratories Limited, erstwhile company that was merged with the Company under Sections 391 to 394 of the Companies Act, 1956 in terms of the approval of the Honorable High Courts of Gujarat and of Punjab and Haryana.
Located in Madhya Pradesh admeasuring 630,552 Square metres
222.4 217.8
Located in Gujarat admeasuring 24,000 Square metres
0.7 0.6 The lease agreement is in the name of Gujarat Lyca Limited, erstwhile company that was merged with the Company under Sections 391 to 394 of the Companies Act, 1956 in terms of the approval of the Honorable High Court of Gujarat.
(ii) As explained to us, the inventories, excluding stocks with some of the third parties, were physically verified during the year by the
Management at reasonable intervals and no material discrepancies were noticed on physical verification. In respect of inventories lying
with third parties, these have substantially been confirmed by them.
(iii) In respect of loans, secured or unsecured, granted by the Company to companies, firms, Limited Liability Partnerships or other parties
covered in the register maintained under Section 189 of the Companies Act, 2013 (“the Act”):
(a) In our opinion and according to the information given to us, the terms and conditions of the grant of such loan is, in our opinion,
prima facie, not prejudicial to the interest of the Company.
(b) In respect of loans granted to a wholly owned subsidiary, where the aggregate amount involved is ` 4.8 Million (including interest
accrued), the repayments or receipts of principal amounts and interest, where due during the year, have been regular as per
stipulations and in respect of loans granted to an associate, there is no repayment or receipt of the principal amount of ` 512.0
Million and the interest thereon of ` 214.9 Million, which are overdue as per the stipulations.
ANNEXURE “B” TO THE INDEPENDENT AUDITOR’S REPORT(Referred to in paragraph 2 under ‘Report on Other Legal and Regulatory Requirements’ section of our report
of even date to the Members of Sun Pharmaceutical Industries Limited)

8 7A N N UA L R E P O RT 2 0 1 6 - 1 7
CORPORATE OVERVIEW STATUTORY REPORTS FINANCIAL STATEMENTS01-07 08-79 80-278
(c) There is no overdue amount remaining outstanding as at the balance sheet date except in respect of amounts of ` 512.0 Million
and ` 199.1 Million of principal and interest respectively, aggregating to ` 711.1 Million, given to an associate, which has been
overdue for more than 90 days, where there is no evidence of reasonable steps having been taken for the recovery of the
principal outstanding or interest receivable. As represented by the Management of the Company, the Company is evaluating
various options to recover its dues in respect of the principal amount and interest.
Refer Note 59(1) to the standalone Ind AS financial statements.
(iv) In our opinion and according to the information and explanations given to us, the Company has complied with the provisions of Section
186 of the Act in respect of grant of loans, making investments and providing guarantees and securities, as applicable. During the year,
the Company has not granted any loans covered under Section 185 of the Act.
(v) In our opinion and according to the information and explanations given to us, the Company has not accepted any deposit from
the public in accordance with the provisions of Sections 73 to 76 or any other relevant provisions of the Act and the rules framed
thereunder and hence reporting under clause (v) of paragraph 3 of the Order is not applicable.
(vi) The maintenance of cost records has been specified by the Central Government under sub-section (1) of Section 148 of the Act. We have
broadly reviewed the cost records maintained by the Company pursuant to the Companies (Cost Records and Audit) Rules, 2014, as amended,
prescribed by the Central Government under sub-section (1) of Section 148 of the Act, and are of the opinion that, prima facie, the prescribed
cost records have been made and maintained. We have, however, not made a detailed examination of the cost records with a view to
determine whether they are accurate or complete.
(vii) According to the information and explanations given to us, in respect of statutory dues:
(a) The Company has generally been regular in depositing undisputed statutory dues, including Provident Fund, Employees’ State
Insurance, Income-tax, Sales Tax, Service Tax, Customs Duty, Excise Duty, Value added Tax, Cess and other material statutory dues
applicable to it with the appropriate authorities, though there have been slight delays in few cases.
(b) There were no undisputed amounts payable in respect of Provident Fund, Employees’ State Insurance, Income-tax, Sales Tax,
Service Tax, Customs Duty, Excise Duty, Value added Tax, Cess and other material statutory dues in arrears as at 31st March,
2017 for a period of more than six months from the date they became payable.
(c) Details of dues of Income-tax, Sales Tax, Service Tax, Customs Duty, Excise Duty and Value added Tax which have not been
deposited as at 31st March, 2017 on account of disputes, are given below:
ANNEXURE “B” TO THE INDEPENDENT AUDITOR’S REPORT(Referred to in paragraph 2 under ‘Report on Other Legal and Regulatory Requirements’ section of our report
of even date to the Members of Sun Pharmaceutical Industries Limited)

S U N P H A R M A C E U T I C A L I N D U S T R I E S L I M I T E D8 8
Name of Statute Nature of Dues Forum where dispute is
pending Period to which the amount relatesAmount involved
(` in Million)#
Amount paid / adjusted under
protest (` in Million)
Income Tax Act, 1961
Income Tax, Interest and Penalty
Commissioner (Appeals) 2003-04, 2005-06, 2006-07, 2010-11 and 2012-13
2,617.2 3,923.6
Income Tax Appellate Tribunal (ITAT)
1995-96 and 2007-08 to 2011-12 27,193.9 11,828.5
Sales Tax Act/ VAT (Various States)
Sales Tax, Interest and Penalty
Assistant / Additional / Senior Joint Commissioner
1999-00, 2000-01, 2003-04, 2004-05, 2013-14 and 2014-15
24.8 2.1
Appellate Authority 1998-99, 2008-09, 2012-13 to 2014-15
7.2 3.1
Tribunal 1998-99 to 2003-04, 2008-09 and 2014-15
6.1 2.3
High Court 1999-00, 2001-02 to 2003-04 and 2005-06 to 2010-11
53.2 6.4
Entry Tax Madhya Pradesh Commercial Tax Appellate Board
2009-10 2.5 -
The Central Excise Act, 1944
Service Tax Customs, Excise and Service Tax Appellate Tribunal (CESTAT), Delhi
2006 to 2015 49.7 6.8
Customs Act, 1962
Customs Duty, Penalty and Interest
Commissioner (Appeals) 2014-15 13.8 10.8
CESTAT 2015-16 118.7 -
The Central Excise Act, 1944
Excise Duty, Interest and Penalty
Settlement Commission 2000-01 4.2 -
Commissioner(Appeals)
2001-02 to 2015-16 50.2 5.3
Tribunal 2002-03 to 2014-15 1,783.6 449.5
High Court 2002-03 to 2014-15 70.9 9.7
# Net of amount paid / adjusted under protest
(viii) In our opinion and according to the information and explanations given to us, the Company has not defaulted in the repayment of loans
or borrowings to financial institutions, banks and government. The Company has not issued any debentures.
(ix) In our opinion and according to the information and explanations given to us, money raised by way of the term loans have been applied
by the Company during the year for the purposes for which they were raised. The Company has not raised money by way of initial
public offer, further public offer (including debt instruments) during the year.
(x) To the best of our knowledge and according to the information and explanations given to us, no fraud by the Company and no material
fraud on the Company by its officers or employees has been noticed or reported during the year.
ANNEXURE “B” TO THE INDEPENDENT AUDITOR’S REPORT(Referred to in paragraph 2 under ‘Report on Other Legal and Regulatory Requirements’ section of our report
of even date to the Members of Sun Pharmaceutical Industries Limited)

8 9A N N UA L R E P O RT 2 0 1 6 - 1 7
CORPORATE OVERVIEW STATUTORY REPORTS FINANCIAL STATEMENTS01-07 08-79 80-278
(xi) In our opinion and according to the information and explanations given to us, the Company has paid managerial remuneration in excess
of the limits and approvals prescribed under Section 197 read with Schedule V to the Act, to the following managerial personnel:
Managerial Position
Excess amount of remuneration
paid (` in Million)
Financial year ended
Treatment of the excess remuneration in the respective year standalone financial statements
Steps taken by the Company for securing refund
Managing Director 22.9 31st March, 2015
Charged to the Statement of Profit and Loss
We have been informed by the Management of the Company that they have re-represented to the office of the Ministry of Corporate Affairs for approval of remuneration within the overall limits approved by the members of the Company for the years ended 31st March, 2015 and 31st March, 2016, and that for the year ended 31st March, 2017, applications for revision in the remuneration, as approved by the members of the Company, has been made to the Ministry of Corporate Affairs. The responses in respect of the foregoing re-representation / applications for revision are awaited from the Ministry of Corporate Affairs. Refer Note 59(11) to the standalone Ind AS financial statements.
12.3 31st March, 2016
Charged to the Statement of Profit and Loss
22.5 31st March, 2017
Charged to the Statement of Profit and Loss
Whole time Director(s)
26.7 31st March, 2015
Charged to the Statement of Profit and Loss
17.3 31st March, 2016
Charged to the Statement of Profit and Loss
22.2 31st March, 2017
Charged to the Statement of Profit and Loss
(xii) The Company is not a Nidhi Company and hence reporting under clause (xii) of paragraph 3 of the Order is not applicable.
(xiii) In our opinion and according to the information and explanations given to us, the Company is in compliance with Sections 177 and 188
of the Act, where applicable, for all transactions with the related parties identified by the Management of the Company, and the details
of related party transactions have been disclosed in the standalone Ind AS financial statements as required by the applicable accounting
standards.
(xiv) During the year, the Company has not made any preferential allotment or private placement of shares or fully or partly convertible
debentures and hence reporting under clause (xiv) of paragraph 3 of the Order is not applicable to the Company.
(xv) In our opinion and according to the information and explanations given to us, during the year, the Company has not entered into any
non-cash transactions with its directors or directors of its subsidiary or associate company or persons connected with them and hence
provisions of Section 192 of the Act are not applicable.
(xvi) The Company is not required to be registered under Section 45-IA of the Reserve Bank of India Act, 1934.
For DELOITTE HASKINS & SELLS LLPChartered Accountants
(Firm’s Registration No. 117366W/W-100018)
RAJESH K. HIRANANDANIPlace: Mumbai PartnerDate: 26th May, 2017 (Membership No. 36920)
ANNEXURE “B” TO THE INDEPENDENT AUDITOR’S REPORT(Referred to in paragraph 2 under ‘Report on Other Legal and Regulatory Requirements’ section of our report
of even date to the Members of Sun Pharmaceutical Industries Limited)

S U N P H A R M A C E U T I C A L I N D U S T R I E S L I M I T E D9 0
` in Million
Notes As at As at As at
March 31, 2017 March 31, 2016 April 01, 2015ASSETS(1) Non-current assets
(a) Property, plant and equipment 3 38,319.4 35,163.4 31,187.3
(b) Capital work-in-progress 10,533.2 7,654.0 10,863.2
(c) Intangible assets 4 484.6 582.8 699.8
(d) Intangible assets under development 453.9 23.3 42.7
(e) Investments in the nature of equity in subsidiaries 5 192,442.4 222,445.2 257,025.7
(f) Investments in the nature of equity in associates 6 - 21.2 21.2
(g) Financial assets
(i) Investments 7 1,067.8 514.9 898.7
(ii) Loans 8 48.5 108.1 160.5
(iii) Other financial assets 9 990.0 1,818.7 1,435.8
(h) Deferred tax assets (Net) 10 7,517.0 7,517.0 7,517.0
(i) Income tax assets (Net) 11 17,826.3 10,062.5 6,589.7
(j) Other non-current assets 12 4,100.6 3,590.9 4,242.2
Total non-current assets 273,783.7 289,502.0 320,683.8
(2) Current assets
(a) Inventories 13 22,866.2 21,321.5 21,892.5
(b) Financial assets
(i) Investments 14 400.1 735.6 850.7
(ii) Trade receivables 15 27,256.7 19,978.1 17,915.1
(iii) Cash and cash equivalents 16 1,507.8 1,543.4 1,932.0
(iv) Bank balances other than (iii) above 17 130.3 147.7 2,232.6
(v) Loans 18 138.2 187.0 708.4
(vi) Other financial assets 19 671.8 215.9 1,183.7
(c) Other current assets 20 10,727.5 9,033.4 7,502.9
Total current assets 63,698.6 53,162.6 54,217.9
TOTAL ASSETS 337,482.3 342,664.6 374,901.7
STANDALONE BALANCE SHEET AS AT MARCH 31, 2017

9 1A N N UA L R E P O RT 2 0 1 6 - 1 7
CORPORATE OVERVIEW STATUTORY REPORTS FINANCIAL STATEMENTS01-07 08-79 80-278
` in Million
Notes As at As at As at
March 31, 2017 March 31, 2016 April 01, 2015EQUITY AND LIABILITIESEquity
(a) Equity share capital 21 2,399.3 2,406.6 2,071.2
(b) Share suspense account 59 (4) - - 334.8
(c) Other equity 22 206,315.8 216,500.4 236,123.2
Total equity 208,715.1 218,907.0 238,529.2
Liabilities
(1) Non-current liabilities
(a) Financial liabilities
(i) Borrowings 23 7,606.4 19,228.4 11,653.6
(ii) Other financial liabilities 24 6.8 4.9 215.9
(b) Provisions 25 11,328.3 18,251.3 22,790.5
Total non-current liabilities 18,941.5 37,484.6 34,660.0
(2) Current liabilities
(a) Financial liabilities
(i) Borrowings 26 40,540.4 37,337.2 42,375.6
(ii) Trade payables 27 20,942.0 17,724.5 15,767.7
(iii) Other financial liabilities 28 28,135.4 17,793.0 34,291.4
(b) Other current liabilities 29 1,738.0 1,622.2 2,240.0
(c) Provisions 30 18,469.9 11,796.1 7,037.8
Total current liabilities 109,825.7 86,273.0 101,712.5
Total liabilities 128,767.2 123,757.6 136,372.5
TOTAL EQUITY AND LIABILITIES 337,482.3 342,664.6 374,901.7
See accompanying notes 1 to 59 to the standalone financial statements
In terms of our report attached
For DELOITTE HASKINS & SELLS LLP For and on behalf of the Board of Directors of Chartered Accountants Sun Pharmaceutical Industries Limited
RAJESH K. HIRANANDANI DILIP S. SHANGHVIPartner Managing DirectorMumbai, May 26, 2017
UDAY V. BALDOTA SUDHIR V. VALIAChief Financial Officer Wholetime Director
SUNIL R. AJMERA SAILESH T. DESAICompany Secretary Wholetime Director
Mumbai, May 26, 2017
STANDALONE BALANCE SHEET AS AT MARCH 31, 2017

S U N P H A R M A C E U T I C A L I N D U S T R I E S L I M I T E D9 2
` in Million
Notes Year ended Year ended
March 31, 2017 March 31, 2016(I) Revenue from operations 31 78,067.0 78,636.9 (II) Other income 32 5,144.1 4,450.9
(III) Total income (I + II) 83,211.1 83,087.8 (IV) Expenses Cost of materials consumed 33 22,845.2 18,383.1 Purchases of stock-in-trade 12,365.0 11,700.0 Changes in inventories of finished goods, stock-in-trade and work-in-progress 34 (1,627.9) (143.8) Employee benefits expense 35 14,861.7 14,766.9 Finance costs 36 2,235.6 5,741.0 Depreciation and amortisation expense 3 & 4 4,185.6 4,642.5 Other expenses 37 28,670.3 38,117.4
Total expenses (IV) 83,535.5 93,207.1 (V) Loss before exceptional item and tax (III - IV) (324.4) (10,119.3)(VI) Exceptional item 59 (3) - (701.3)(VII) Loss before tax (V + VI) (324.4) (10,820.6)(VIII) Tax expense - current tax 39 25.1 54.5 (IX) Loss for the year (VII - VIII) (349.5) (10,875.1)(X) Other comprehensive income A) Itemsthatwillnotbereclassifiedtoprofitorloss a. Remeasurements of the defined benefit plans (600.1) (266.8) b. Equity instruments through other comprehensive income (7.1) 18.9 Total - (A) (607.2) (247.9) B) Itemsthatmaybereclassifiedtoprofitorloss Effective portion of gains and loss on designated portion of hedging
instruments in a cash flow hedge - (B) (26.6) -
Total other comprehensive income (A+B) (633.8) (247.9)
(XI) Total comprehensive income for the year (IX+X) (983.3) (11,123.0)
Earnings per equity share (face value per equity share - ` 1) 47Basic (in `) (0.1) (4.5)Diluted (in `) (0.1) (4.5)
See accompanying notes 1 to 59 to the standalone financial statements
STANDALONE STATEMENT OF PROFIT AND LOSS FOR THE YEAR ENDED MARCH 31, 2017
In terms of our report attached
For DELOITTE HASKINS & SELLS LLP For and on behalf of the Board of Directors of Chartered Accountants Sun Pharmaceutical Industries Limited
RAJESH K. HIRANANDANI DILIP S. SHANGHVIPartner Managing DirectorMumbai, May 26, 2017
UDAY V. BALDOTA SUDHIR V. VALIAChief Financial Officer Wholetime Director
SUNIL R. AJMERA SAILESH T. DESAICompany Secretary Wholetime Director
Mumbai, May 26, 2017

9 3A N N UA L R E P O RT 2 0 1 6 - 1 7
CORPORATE OVERVIEW STATUTORY REPORTS FINANCIAL STATEMENTS01-07 08-79 80-278
STA
TEM
ENT
OF
CH
ANG
ES IN
EQ
UIT
Y F
OR
TH
E Y
EA
R E
ND
ED
MA
RC
H 3
1, 2
017
` in M
illion
Equit
y sh
are
capit
al
Share
susp
ense
ac
coun
t [R
efer
Not
e 59
(4)]
Oth
er eq
uity
Tota
l Sh
are
appli
catio
n mo
ney p
endin
g all
otme
nt
Res
erve
s and
surp
lus
Oth
er co
mpre
hens
ive
incom
e (OC
I)
Cap
ital
rese
rve
Secu
rities
pr
emium
re
serv
e
Deb
entu
re
rede
mptio
n re
serv
e
Share
optio
ns
outst
andin
g ac
coun
t
Ama
lgama
tion
rese
rve
Cap
ital
rede
mptio
n re
serv
e
Gen
eral
rese
rve
Ret
ained
ea
rning
s
Equit
y ins
trume
nt
thro
ugh O
CI
Effec
tive
porti
on of
ca
sh flo
w he
dges
Ba
lanc
e as
at A
pril
01, 2
015
2,0
71.2
3
34.8
1
49.0
3
6,66
0.0
18,
220.
3 7
50.0
8
2.1
43.
8 -
34,0
29.3
1
46,1
84.5
4
.2
- 2
38,5
29.2
Lo
ss fo
r the
yea
r -
- -
- -
- -
- -
- (1
0,87
5.1)
- -
(10,
875.
1)O
ther
com
preh
ensi
ve in
com
e fo
r the
yea
r -
- -
- -
- -
- -
- *(
266.
8) 1
8.9
- (2
47.9
)To
tal c
ompr
ehen
sive
inco
me
for t
he y
ear
- -
- -
- -
- -
- -
(11,
141.
9) 1
8.9
- (1
1,12
3.0)
Paym
ent o
f div
iden
d -
- -
- -
- -
- -
- (7
,219
.5)
- -
(7,2
19.5
)Co
rpor
ate
divi
dend
tax
- -
- -
- -
- -
- -
(1,4
69.7
) -
- (1
,469
.7)
Reco
gniti
on o
f sha
re-b
ased
pay
men
ts to
em
ploy
ees
- -
- -
- -
98.
8 -
- -
- -
- 9
8.8
Issu
e of
equ
ity sh
ares
0.6
-
(142
.3)
- 2
32.9
-
- -
- -
- -
- 9
1.2
Issu
e of e
quity
shar
es pu
rsua
nt to
the s
chem
e of a
mal
gam
atio
n [Re
fer N
ote 5
9 (4
)] 3
34.8
(3
34.8
) -
- -
- -
- -
- -
- -
- Tr
ansf
er fr
om d
eben
ture
rede
mpt
ion
rese
rve
on re
paym
ent o
f deb
entu
res
- -
- -
- (7
50.0
) -
- -
750
.0
- -
- -
Tran
sfer
on
exer
cise
of s
hare
opt
ions
- -
- -
132
.0
- (1
32.0
) -
- -
- -
- -
Bala
nce
as a
t Mar
ch 3
1, 2
016
2,4
06.6
-
6.7
3
6,66
0.0
18,
585.
2 -
48.
9 4
3.8
- 3
4,77
9.3
126
,353
.4
23.
1 -
218
,907
.0
Loss
for t
he y
ear
- -
- -
- -
- -
- -
(349
.5)
- -
(349
.5)
Oth
er co
mpr
ehen
sive
inco
me
for t
he y
ear
- -
- -
- -
- -
- -
*(60
0.1)
(7.1
) (2
6.6)
(633
.8)
Tota
l com
preh
ensi
ve in
com
e fo
r the
yea
r -
- -
- -
- -
- -
- (9
49.6
) (7
.1)
(26.
6) (9
83.3
)Pa
ymen
t of d
ivid
end
- -
- -
- -
- -
- -
(2,4
06.8
) -
- (2
,406
.8)
Corp
orat
e di
vide
nd ta
x -
- -
- -
- -
- -
- (7
4.7)
- -
(74.
7)Re
cogn
ition
of s
hare
-bas
ed p
aym
ents
to e
mpl
oyee
s -
- -
- -
- 3
2.3
- -
- -
- -
32.
3 Is
sue
of e
quity
shar
es 0
.2
- (6
.7)
- 3
1.3
- -
- -
- -
- -
24.
8 Bu
y-ba
ck o
f equ
ity sh
ares
[Ref
er N
ote
59 (1
3)]
(7.5
) -
- -
(6,7
42.5
) -
- -
- -
- -
- (6
,750
.0)
Expe
nditu
re o
n bu
y-ba
ck o
f equ
ity sh
ares
- -
- -
(34.
2) -
- -
- -
- -
- (3
4.2)
Tran
sfer
to ca
pita
l red
empt
ion
rese
rve
on b
uy-b
ack
of e
quity
shar
es -
- -
- -
- -
- 7
.5
- (7
.5)
- -
- Tr
ansf
er o
n ex
erci
se o
f sha
re o
ptio
ns -
- -
- 5
4.8
- (5
4.8)
- -
- -
- -
- Ba
lanc
e as
at M
arch
31,
201
7 2
,399
.3
- #0
.0
36,
660.
0 1
1,89
4.6
- 2
6.4
43.
8 7
.5
34,
779.
3 1
22,9
14.8
1
6.0
(26.
6) 2
08,7
15.1
* R
epre
sen
ts r
emea
sure
men
ts o
f defi
ned
ben
efit
pla
ns
# (M
arch
31
, 20
17
: ` 7
,17
7)
See
acco
mp
anyi
ng
no
tes
1 t
o 5
9 t
o t
he
stan
dal
on
e fi
nan
cial
sta
tem
ents
In t
erm
s o
f ou
r re
po
rt a
ttac
hed
For
DE
LOIT
TE
HA
SKIN
S &
SE
LLS
LLP
For
and
on
beh
alf o
f th
e B
oar
d o
f Dir
ecto
rs o
f C
har
tere
d A
cco
un
tan
tsSu
n P
har
mac
euti
cal I
nd
ust
ries
Lim
ited
RA
JESH
K. H
IRA
NA
ND
AN
ID
ILIP
S. S
HA
NG
HV
IP
artn
erM
anag
ing
Dir
ecto
rM
um
bai
, May
26
, 20
17
UD
AY
V. B
ALD
OTA
SUD
HIR
V. V
ALI
AC
hie
f Fin
anci
al O
ffice
rW
ho
leti
me
Dir
ecto
r
SUN
IL R
. AJM
ER
ASA
ILE
SH T
. DE
SAI
Co
mp
any
Secr
etar
yW
ho
leti
me
Dir
ecto
r
Mu
mb
ai, M
ay 2
6, 2
01
7

S U N P H A R M A C E U T I C A L I N D U S T R I E S L I M I T E D9 4
` in Million Year ended Year ended
March 31, 2017 March 31, 2016A. Cashflowfromoperatingactivities Loss before tax (324.4) (10,820.6) Adjustments for: Depreciation and amortisation expense 4,185.6 4,642.5 Impairment of property, plant and equipment and intangible assets (disclosed as an exceptional item) - 701.3 Loss on sale/write off of property, plant and equipment and intangible assets, net 110.2 82.3 Finance costs 2,235.6 5,741.0 Interest income (229.3) (362.4) Dividend income (2,040.7) (394.5) Net gain arising on financial assets measured at fair value through profit or loss (16.1) (5.7) Gain on sale of financial assets measured at fair value through profit or loss (186.0) (178.2) Gain on sale of investment in subsidiary (2,307.8) (3,242.2) Gain on sale of investment in associate (120.3) - Provision / write off for doubtful trade receivables / advances 38.5 1,232.1 Sundry balances written back, net (25.4) (50.0) Expense recognised in respect of share based payments to employees 30.8 90.6 Impairment of non-current investment in associate [` Nil (Previous year ` 16,380)] - 0.0 Provision in respect of losses of a subsidiary 165.4 122.9 Net unrealised foreign exchange gain (2,387.3) (726.3) Operating loss before working capital changes (871.2) (3,167.2) Movements in working capital: (Increase)/ decrease in inventories (1,544.7) 570.9 Increase in trade receivables (6,802.7) (3,049.6) Increase in other assets (1,815.4) (1,681.8) Increase in trade payables 3,378.9 1,761.4 Increase/ (decrease) in other liabilities 7.0 (1,167.4) Decrease in provisions (802.5) (2,283.9) Cash used in operations (8,450.6) (9,017.6) Income tax paid (net of refund) (7,788.9) (3,527.3) Net cash used in operating activities (A) (16,239.5) (12,544.9)B. Cashflowfrominvestingactivities Payments for purchase of property, plant and equipment (including capital work-in-progress, intangible assets
and intangible assets under development) (10,879.0) (5,639.4)
Proceeds from disposal of property, plant and equipment and intangible assets 70.1 144.5 Loans / Inter corporate deposits Given to a subsidiary company (0.4) - Received back / matured from Subsidiary companies 4.8 0.4 Others - 251.5 Purchase of investments Subsidiary companies (6.1) (163.5) Associate [` Nil (Previous year ` 16,380)] - 0.0 Others (176,388.7) (131,969.1) Proceeds from sale / redemption of investments Subsidiary companies 32,318.4 38,468.5 Associate 141.5 - Others 176,366.3 132,268.1 Bank balances not considered as cash and cash equivalents Fixed deposits placed - (30.1) Fixed deposits matured 13.7 2,116.8 Margin money placed - (0.2) Interest received 165.8 550.0
STANDALONE CASH FLOW STATEMENT FOR THE YEAR ENDED MARCH 31, 2017

9 5A N N UA L R E P O RT 2 0 1 6 - 1 7
CORPORATE OVERVIEW STATUTORY REPORTS FINANCIAL STATEMENTS01-07 08-79 80-278
` in Million Year ended Year ended
March 31, 2017 March 31, 2016 Dividend received from Subsidiary companies 2,040.7 394.3 Others ` 20,000 0.0 0.2Net cash generated by investing activities (B) 23,847.1 36,392.0C. Cashflowfromfinancingactivities Proceeds from issue of equity shares on exercise of stock options / share application money received 24.8 91.3 Proceeds from borrowings Subsidiary company 9,200.0 35,480.0 Others 53,590.4 72,231.3 Repayment of borrowings Subsidiary company (17,219.9) (27,545.7) Others (42,431.5) (89,805.8) Payment for buy-back of equity shares (6,750.0) - Payment for share buy-back expenses (34.2) - Net decrease in working capital demand loans - (1,800.0) Finance costs (includes borrowing costs capitalised) (1,435.5) (3,644.9) Dividend paid (2,399.2) (7,216.8) Tax on dividend (74.7) (1,469.7)Netcashusedinfinancingactivities(C) (7,529.8) (23,680.3)Net increase in cash and cash equivalents (A+B+C) 77.8 166.8 Cash and cash equivalents at the beginning of the year 1,380.5 1,208.5 Effect of exchange differences on restatement of foreign currency cash and cash equivalents (8.6) 5.2Cash and cash equivalents at the end of the year 1,449.7 1,380.5
Note:
` in Million As at
March 31, 2017 As at
March 31, 2016Cash and cash equivalents comprises ofBalances with banks In current accounts 1,497.2 1,534.1Cheques on hand 4.2 3.8Cash on hand 6.4 5.5Cash and cash equivalents (Refer Note 16) 1,507.8 1,543.4Less:- cash credit facilities included under loans repayable on demand in note 26 58.1 162.9Cash and cash equivalents in cash flow statement 1,449.7 1,380.5
See accompanying notes 1 to 59 to the standalone financial statements
In terms of our report attached
For DELOITTE HASKINS & SELLS LLP For and on behalf of the Board of Directors of Chartered Accountants Sun Pharmaceutical Industries Limited
RAJESH K. HIRANANDANI DILIP S. SHANGHVIPartner Managing DirectorMumbai, May 26, 2017
UDAY V. BALDOTA SUDHIR V. VALIAChief Financial Officer Wholetime Director
SUNIL R. AJMERA SAILESH T. DESAICompany Secretary Wholetime Director
Mumbai, May 26, 2017
STANDALONE CASH FLOW STATEMENT FOR THE YEAR ENDED MARCH 31, 2017
S U N P H A R M A C E U T I C A L I N D U S T R I E S L I M I T E D9 6
NOTES TO THE STANDALONE FINANCIAL STATEMENTS FOR THE YEAR ENDED MARCH 31, 2017
1. General information Sun Pharmaceutical Industries Limited (“the Company”) is a
public limited company incorporated and domiciled in India and
has its listing on the BSE Limited and National Stock Exchange
of India Limited. The addresses of its registered office and
principal place of business are disclosed in the introduction
to the annual report. The Company is in the business of
manufacturing, producing, developing and marketing a
wide range of branded and generic formulations and Active
Pharmaceutical Ingredients (APIs). The Company has various
manufacturing locations spread across the country with trading
and other incidental and related activities extending to the
global markets.
2. Significantaccountingpolicies2.1 Statement of compliance These financial statements are separate financial statements
of the Company (also called standalone financial statements).
The Company has prepared financial statements for the year
ended March 31, 2017 in accordance with Indian Accounting
Standards (Ind AS) notified under the Companies (Indian
Accounting Standards) Rules, 2015 (as amended) together
with the comparative period data as at and for the year ended
March 31, 2016. Further, the Company has prepared the
opening balance sheet as at April 01, 2015 (the transition date)
in accordance with Ind AS.
For all the periods up to the year ended March 31, 2016, the
Company had prepared its financial statements in accordance
with the requirements of previous GAAP, which includes
Standards notified under the Companies (Accounting
Standards) Rules, 2006 (as amended).
These are the Company’s first Ind AS financial statements.
Refer Note 52 for the details of first-time adoption exemptions
availed by the Company.
2.2 Basis of preparation and presentation These financial statements for the year ended March 31, 2017
are the first financial statements, the Company has prepared in
accordance with Ind AS.
The financial statements have been prepared on the historical
cost basis, except for: (i) certain financial instruments that are
measured at fair values at the end of each reporting period;
(ii) Non-current assets classified as held for sale which are
measured at the lower of their carrying amount and fair value
less costs to sell; and (iii) defined benefit plans – plan assets
that are measured at fair values at the end of each reporting
period, as explained in the accounting policies below.
Historical cost is generally based on the fair value of the
consideration given in exchange for goods and services.
Fair value is the price that would be received to sell an asset
or paid to transfer a liability in an orderly transaction between
market participants at the measurement date, regardless of
whether that price is directly observable or estimated using
another valuation technique. In estimating the fair value of
an asset or a liability, the Company takes into account the
characteristics of the asset or liability if market participants
would take those characteristics into account when pricing
the asset or liability at the measurement date. Fair value for
measurement and/or disclosure purposes in these financial
statements is determined on such a basis, except for share-
based payment transactions that are within the scope of Ind
AS 102, leasing transactions that are within the scope of Ind AS
17, and measurements that have some similarities to fair value
but are not fair value, such as net realisable value in Ind AS 2 or
value in use in Ind AS 36.
In addition, for financial reporting purposes, fair value
measurements are categorised into Level 1, 2, or 3 based on the
degree to which the inputs to the fair value measurements are
observable and the significance of the inputs to the fair value
measurement in its entirety, which are described as follows:
Level 1 inputs are quoted prices (unadjusted) in active
markets for identical assets or liabilities that the entity
can access at the measurement date;
Level 2 inputs are inputs, other than quoted prices
included within Level 1, that are observable for the asset
or liability, either directly or indirectly; and
Level 3 inputs are unobservable inputs for the asset or
liability.
The Company has consistently applied the following accounting
policies to all periods presented in these financial statements.

CORPORATE OVERVIEW STATUTORY REPORTS FINANCIAL STATEMENTS01-07 08-79 80-278
9 7A N N UA L R E P O RT 2 0 1 6 - 1 7
NOTES TO THE STANDALONE FINANCIAL STATEMENTS FOR THE YEAR ENDED MARCH 31, 2017
a. Operating Cycle
Based on the nature of products / activities of the
Company and the normal time between acquisition of
assets and their realisation in cash or cash equivalents,
the Company has determined its operating cycle as
twelve months for the purpose of classifications of its
assets and liabilities as current and non-current.
b. Foreign currency
On initial recognition, transactions in currencies other
than the Company’s functional currency (foreign
currencies) are translated at exchange rates at the dates
of the transactions. Monetary assets and liabilities
denominated in foreign currencies at the reporting
date are translated into the functional currency at the
exchange rate at that date exchange differences arising
on the settlement of monetary items or on translating
monetary items at rates different from those at which
they were translated on initial recognition during the
period or in previous period are recognised in profit or
loss in the period in which they arise except for:
exchange differences on foreign currency
borrowings relating to assets under construction
for future productive use, which are included in
the cost of those assets when they are regarded as
an adjustment to interest costs on those foreign
currency borrowings.
exchange differences on transactions entered into
in order to hedge certain foreign currency risks (see
note 2.2.i below for hedging accounting policies).
Non-monetary items that are measured in terms of
historical cost in a foreign currency are not retranslated.
c. Segment Reporting
Operating segments are reported in a manner consistent
with the internal reporting provided to the chief
operating decision maker. The chief operating decision
maker of the Company is responsible for allocating
resources and assessing performance of the operating
segments and accordingly is identified as the chief
operating decision maker.
d. Property, plant and equipment
Items of property, plant and equipment are stated in
balance sheet at cost less accumulated depreciation and
accumulated impairment losses, if any. Freehold land is
not depreciated.
Properties in the course of construction for production,
supply or administrative purposes are carried at cost,
less any recognised impairment loss. Cost includes
professional fees and, for qualifying assets, borrowing
costs capitalised in accordance with the Company’s
accounting policy. Such properties are classified to
the appropriate categories of property, plant and
equipment when completed and ready for intended use.
Depreciation of these assets, on the same basis as other
property assets, commences when the assets are ready
for their intended use.
When parts of an item of property, plant and equipment
have different useful lives, they are accounted for as
separate items (major components) of property, plant and
equipment.
An item of property, plant and equipment is derecognised
upon disposal or when no future economic benefits are
expected to arise from the continued use of the asset.
Any gain or loss arising on the disposal or retirement of
an item of property, plant and equipment is determined
as the difference between the sales proceeds and the
carrying amount of property, plant and equipment and is
recognised in profit or loss.
Items of property, plant and equipment acquired through
exchange of non-monetary assets are measured at fair
value, unless the exchange transaction lacks commercial
substance or the fair value of either the asset received or
asset given up is not reliably measurable, in which case
the acquired asset is measured at the carrying amount of
the asset given up.
Depreciation is recognised so as to write off the cost
of assets (other than freehold land and Capital work-
in-progress) less their residual values on straight-line
method over their useful lives as indicated in Part C

S U N P H A R M A C E U T I C A L I N D U S T R I E S L I M I T E D9 8
NOTES TO THE STANDALONE FINANCIAL STATEMENTS FOR THE YEAR ENDED MARCH 31, 2017
of Schedule II of the Companies Act, 2013. Leasehold
improvements are depreciated over period of the lease
agreement or the useful life, whichever is shorter.
Depreciation methods, useful lives and residual values
are reviewed at the end of each reporting period, with
the effect of any changes in estimate accounted for on a
prospective basis.
The estimated useful lives are as follows:
Asset Category No. of YearsLeasehold land 60-99
Factory Buildings 30
Buildings other than Factory Buildings 60
Buildings given under operating lease 30
Plant and equipment 3-20
Plant and equipment given under operating lease
15
Vehicles 5-10
Office equipment 2-5
Furniture and fixtures 10
Software for internal use, which is primarily acquired
from third-party vendors and which is an integral part
of a tangible asset, including consultancy charges for
implementing the software, is capitalised as part of the
related tangible asset. Subsequent costs associated with
maintaining such software are recognised as expense as
incurred. The capitalised costs are amortised over the
lower of the estimated useful life of the software and the
remaining useful life of the tangible fixed asset.
e. Intangible assets
Intangible assets that are acquired by the Company and
that have finite useful lives are measured at cost less
accumulated amortisation and accumulated impairment
losses, if any. Subsequent expenditures are capitalised
only when they increase the future economic benefits
embodied in the specific asset to which they relate.
Research and development Expenditure on research activities undertaken with the
prospect of gaining new scientific or technical knowledge
and understanding are recognised as an expense when
incurred. Development activities involve a plan or design
for the production of new or substantially improved
products and processes. An internally-generated
intangible asset arising from development is recognised if
and only if all of the following have been demonstrated:
development costs can be measured reliably;
the product or process is technically and
commercially feasible;
future economic benefits are probable; and
the Company intends to and has sufficient
resources to complete development and to use or
sell the asset.
The expenditure to be capitalised include the cost
of materials and other costs directly attributable
to preparing the asset for its intended use. Other
development expenditure is recognised in profit or loss as
incurred.
Payments to third parties that generally take the form
of up-front payments and milestones for in-licensed
products, compounds and intellectual property are
capitalised since the probability of expected future
economic benefits criterion is always considered to be
satisfied for separately acquired intangible assets.
Acquired research and development intangible assets
which are under development, are recognised as In-
Process Research and Development assets (“IPR&D”).
IPR&D assets are not amortised, but evaluated for
potential impairment on an annual basis or when there
are indications that the carrying value may not be
recoverable. Any impairment charge on such IPR&D
assets is recognised in profit or loss. Intangible assets
relating to products under development, other intangible
assets not available for use and intangible assets having
indefinite useful life are tested for impairment annually,
or more frequently when there is an indication that the
assets may be impaired. All other intangible assets are
tested for impairment when there are indications that the
carrying value may not be recoverable.
The consideration for acquisition of intangible asset
which is based on reaching specific milestone that
are dependent on the Company’s future activity is
CORPORATE OVERVIEW STATUTORY REPORTS FINANCIAL STATEMENTS01-07 08-79 80-278
9 9A N N UA L R E P O RT 2 0 1 6 - 1 7
NOTES TO THE STANDALONE FINANCIAL STATEMENTS FOR THE YEAR ENDED MARCH 31, 2017
recognised only when the activity requiring the payment
is performed.
Amortisation is recognised on a straight-line basis over
the estimated useful lives of intangible assets. Intangible
assets that are not available for use are amortised from
the date they are available for use.
The estimated useful lives for Product related intangibles
and Other intangibles ranges from 5 to 20 years.
The estimated useful life and the amortisation method
for intangible assets with a finite useful life are reviewed
at the end of each reporting period, with the effect of any
changes in estimate being accounted for on a prospective
basis.
The estimated useful life and amortisation method are
reviewed at the end of each reporting period, with the
effect of any changes in estimate being accounted for on
a prospective basis.
De-recognitionofintangibleassets Intangible assets are de-recognised either on their
disposal or where no future economic benefits are
expected from their use. Gain or loss arising on such
de-recognition is recognised in profit or loss, and are
measured as the difference between the net disposal
proceeds, if any, and the carrying amount of respective
intangible assets as on the date of de-recognition.
For transition to Ind AS, the Company has elected to
continue with the carrying value of all of its intangible
assets recognised as of April 01, 2015 i.e. transition date,
measured as per the previous GAAP and use that carrying
value as its deemed cost as of the transition date.
f. Investments in the nature of equity in subsidiaries
and associates
The Company has elected to recognise its investments
in equity instruments in subsidiaries and associates at
cost in the separate financial statements in accordance
with the option available in Ind AS 27, ‘Separate Financial
Statements’. Impairment policy applicable on such
investments is explained in Note 2.2.g.
g. Impairmentofnon-financialassets
The carrying amounts of the Company’s tangible and
intangible assets are reviewed at each reporting date to
determine whether there is any indication of impairment.
If any such indication exists, then the asset’s recoverable
amount is estimated in order to determine the extent of
the impairment loss, if any.
The recoverable amount of an asset or cash-generating
unit (as defined below) is the greater of its value in use
and its fair value less costs to sell. In assessing value
in use, the estimated future cash flows are discounted
to their present value using a pre-tax discount rate
that reflects current market assessments of the time
value of money and the risks specific to the asset or the
cash-generating unit for which the estimates of future
cash flows have not been adjusted. For the purpose of
impairment testing, assets are grouped together into the
smallest group of assets that generates cash inflows from
continuing use that are largely independent of the cash
inflows of other assets or groups of assets (the “cash-
generating unit”).
An impairment loss is recognised in the profit or loss
if the estimated recoverable amount of an asset or its
cash generating unit is lower than its carrying amount.
Impairment losses recognised in respect of cash-
generating units are allocated to reduce the carrying
amount of the other assets in the unit on a pro-rata basis.
In respect of other asset, impairment losses recognised
in prior periods are assessed at each reporting date
for any indications that the loss has decreased or no
longer exists. An impairment loss is reversed if there
has been a change in the estimates used to determine
the recoverable amount. An impairment loss is reversed
only to the extent that the asset’s carrying amount does
not exceed the carrying amount that would have been
determined, net of depreciation or amortisation, if no
impairment loss had been recognised.
h. Non-current assets held for sale
Non-current assets and disposal groups are classified as
held for sale if their carrying amount will be recovered
principally through a sale transaction rather than
through continuing use. This condition is regarded as

S U N P H A R M A C E U T I C A L I N D U S T R I E S L I M I T E D1 0 0
NOTES TO THE STANDALONE FINANCIAL STATEMENTS FOR THE YEAR ENDED MARCH 31, 2017
met only when the asset (or disposal group) is available
for immediate sale in its present condition subject
only to terms that are usual and customary for sales
of such asset (or disposal group) and its sale is highly
probable. Management must be committed to the sale,
which should be expected to qualify for recognition
as a completed sale within one year from the date of
classification.
Non-current assets (and disposal groups) classified as
held for sale are measured at the lower of their carrying
amount and fair value less costs to sell. Non-current
assets are not depreciated or amortised.
i. Financial instruments
A financial instrument is any contract that gives rise to
a financial asset of one entity and a financial liability or
equity instrument of another entity.
Financial assets Initial recognition and measurement
All financial assets are recognised initially at fair value
plus, in the case of financial assets not recorded at fair
value through profit or loss, transaction costs that are
attributable to the acquisition of the financial asset.
Purchases or sales of financial assets that require delivery
of assets within a time frame established by regulation or
convention in the market place (regular way trades) are
recognised on the trade date.
Subsequent measurement
For purposes of subsequent measurement, financial
assets are classified in four categories:
Debt instruments at amortised cost
Debt instruments at fair value through other
comprehensive income (FVTOCI)
Debt instruments and equity instruments at fair
value through profit or loss (FVTPL)
Equity instruments measured at fair value through
other comprehensive income (FVTOCI)
Debtinstrumentsatamortisedcost A ‘debt instrument’ is measured at the amortised cost if
both the following conditions are met:
a) The asset is held within a business model whose
objective is to hold assets for collecting contractual
cash flows, and
b) Contractual terms of the asset give rise on specified
dates to cash flows that are solely payments of
principal and interest (SPPI) on the principal
amount outstanding.
After initial measurement, such financial assets are
subsequently measured at amortised cost using the
effective interest rate (EIR) method. Amortised cost
is calculated by taking into account any discount or
premium on acquisition and fees or costs that are an
integral part of the EIR. The EIR amortisation is included
in Other Income in the profit or loss. The losses arising
from impairment are recognised in the profit or loss.
DebtinstrumentatFVTOCI A ‘debt instrument’ is measured as at FVTOCI if both of
the following criteria are met:
a) The objective of the business model is achieved
both by collecting contractual cash flows and selling
the financial assets, and
b) The contractual terms of the instrument give rise
on specified dates to cash flows that are SPPI on the
principal amount outstanding.
Debt instruments included within the FVTOCI category
are measured initially as well as at each reporting date
at fair value. Fair value movements are recognised in
the other comprehensive income (OCI). However, the
Company recognises interest income, impairment losses
& reversals and foreign exchange gain or loss in the profit
or loss. On derecognition of the asset, cumulative gain
or loss previously recognised in OCI is reclassified from
the equity to profit or loss. Interest earned whilst holding
FVTOCI debt instrument is reported as interest income
using the EIR method.

CORPORATE OVERVIEW STATUTORY REPORTS FINANCIAL STATEMENTS01-07 08-79 80-278
1 0 1A N N UA L R E P O RT 2 0 1 6 - 1 7
NOTES TO THE STANDALONE FINANCIAL STATEMENTS FOR THE YEAR ENDED MARCH 31, 2017
DebtinstrumentatFVTPL FVTPL is a residual category for debt instruments. Any
debt instrument, which does not meet the criteria for
categorisation as at amortised cost or as FVTOCI, is
classified as at FVTPL.
In addition, the Company may elect to designate a debt
instrument, which otherwise meets amortised cost or
FVTOCI criteria, as at FVTPL. However, such election
is allowed only if doing so reduces or eliminates a
measurement or recognition inconsistency (referred to as
‘accounting mismatch’).
Equityinstruments All equity instruments in scope of Ind AS 109 are
measured at fair value. Equity instruments which are held
for trading are classified as at FVTPL. For all other equity
instruments, the Company may make an irrevocable
election to present subsequent changes in the fair
value in OCI. The Company makes such election on an
instrument-by-instrument basis. The classification is
made on initial recognition and is irrevocable.
If the Company decides to classify an equity instrument
as at FVTOCI, then all fair value changes on the
instrument, including foreign exchange gain or loss and
excluding dividends, are recognised in the OCI. There is
no recycling of the amounts from OCI to profit or loss,
even on sale of investment. However, the Company may
transfer the cumulative gain or loss within equity.
Equity instruments included within the FVTPL category
are measured at fair value with all changes recognised in
the profit or loss.
Derecognition A financial asset (or, where applicable, a part of a financial
asset or part of a group of similar financial assets) is
primarily derecognised (i.e. removed from the Company’s
balance sheet) when:
The contractual rights to receive cash flows from
the asset have expired, or
The Company has transferred its rights to receive
contractual cash flows from the asset or has
assumed an obligation to pay the received cash
flows in full without material delay to a third party
under a ‘pass-through’ arrangement; and either (a)
the Company has transferred substantially all the
risks and rewards of the asset, or (b) the Company
has neither transferred nor retained substantially
all the risks and rewards of the asset, but has
transferred control of the asset.
When the Company has transferred its rights to receive
cash flows from an asset or has entered into a pass-
through arrangement, it evaluates if and to what extent
it has retained the risks and rewards of ownership. When
it has neither transferred nor retained substantially all
of the risks and rewards of the asset, nor transferred
control of the asset, the Company continues to recognise
the transferred asset to the extent of the Company’s
continuing involvement. In that case, the Company also
recognises an associated liability. The transferred asset
and the associated liability are measured on a basis that
reflects the rights and obligations that the Company has
retained.
On derecognition of a financial asset in its entirety, the
difference between the asset’s carrying amount and the
sum of the consideration received and receivable and the
cumulative gain or loss that had been recognised in OCI
and accumulated in equity is recognised in profit or loss if
such gain or loss would have otherwise been recognised
in profit or loss on disposal of that financial asset.
Impairmentoffinancialassets In accordance with Ind AS 109, the Company applies
expected credit loss (ECL) model for measurement and
recognition of impairment loss on the following financial
assets and credit risk exposure:
a) Financial assets that are debt instruments, and are
measured at amortised cost
b) Financial assets that are debt instruments and are
measured as at FVTOCI
c) Lease receivables under Ind AS 17
d) Trade receivables or any contractual right to
receive cash or another financial asset
e) Loan commitments which are not measured as at
FVTPL

S U N P H A R M A C E U T I C A L I N D U S T R I E S L I M I T E D1 0 2
NOTES TO THE STANDALONE FINANCIAL STATEMENTS FOR THE YEAR ENDED MARCH 31, 2017
f) Financial guarantee contracts which are not
measured as at FVTPL
The Company follows ‘simplified approach’ for
recognition of impairment loss allowance on trade
receivables or any contractual right to receive cash or
another financial asset.
The application of simplified approach does not require
the Company to track changes in credit risk. Rather,
it recognises impairment loss allowance based on
lifetime ECLs at each reporting date, right from its initial
recognition. As a practical expedient, the Company uses a
provision matrix to determine impairment loss allowance
on portfolio of its trade receivables. The provision matrix
is based on its historically observed default rates over
the expected life of the trade receivables and is adjusted
for forward-looking estimates. At every reporting date,
the historical observed default rates are updated and
changes in the forward-looking estimates are analysed.
Financialliabilitiesandequityinstruments Classificationasdebtorequity Debt and equity instruments issued by the Company
are classified as either financial liabilities or as equity
in accordance with the substance of the contractual
arrangements and the definitions of a financial liability
and an equity instrument.
Equityinstruments An equity instrument is any contract that evidences a
residual interest in the assets of an entity after deducting
all of its liabilities. Equity instruments issued by the
Company are recognised at the proceeds received, net of
direct issue costs.
Repurchase of the Company’s own equity instruments
is recognised and deducted directly in equity. No gain
or loss is recognised in profit or loss on the purchase,
sale, issue or cancellation of the Company’s own equity
instruments.
Compoundfinancialinstruments The component parts of compound financial instruments
(convertible notes) issued by the Company are classified
separately as financial liabilities and equity in accordance
with the substance of the contractual arrangements
and the definitions of a financial liability and an equity
instrument.
Initialrecognitionandmeasurement All financial liabilities are recognised initially at fair value
and, in the case of loans and borrowings and payables, net
of directly attributable transaction costs.
Subsequentmeasurement All financial liabilities are subsequently measured at
amortised cost using the effective interest method or at
FVTPL.
Financialliabilitiesatfairvaluethroughprofitorloss Financial liabilities are classified as at FVTPL when the
financial liability is held for trading or is designated upon
initial recognition as at fair value through profit or loss.
Financial liabilities are classified as held for trading if they
are incurred principally for the purpose of repurchasing
in the near term or on initial recognition it is part of a
portfolio of identified financial instruments that the
Company manages together and has a recent actual
pattern of short-term profit-taking. This category also
includes derivative entered into by the Company that are
not designated and effective as hedging instruments in
hedge relationships as defined by Ind AS 109. Gains or
losses on liabilities held for trading are recognised in the
profit or loss.
Financial liabilities designated upon initial recognition at
fair value through profit or loss are designated as such
at the initial date of recognition, and only if the criteria
in Ind AS 109 are satisfied. For non-held-for-trading
financial liabilities designated as at FVTPL, fair value
gains/ losses attributable to changes in own credit risk
are recognised in OCI, unless the recognition of the
effects of changes in the liability’s credit risk in OCI
would create or enlarge an accounting mismatch in profit
or loss, in which case these effects of changes in credit
risk are recognised in profit or loss. These gains/ loss are
not subsequently transferred to profit or loss. All other
changes in fair value of such liability are recognised in the
statement of profit or loss.

CORPORATE OVERVIEW STATUTORY REPORTS FINANCIAL STATEMENTS01-07 08-79 80-278
1 0 3A N N UA L R E P O RT 2 0 1 6 - 1 7
NOTES TO THE STANDALONE FINANCIAL STATEMENTS FOR THE YEAR ENDED MARCH 31, 2017
Financialliabilitiessubsequentlymeasuredatamortisedcost
Financial liabilities that are not held-for-trading and are
not designated as at FVTPL are measured at amortised
cost in subsequent accounting periods. The carrying
amounts of financial liabilities that are subsequently
measured at amortised cost are determined based on
the effective interest rate (EIR) method. Interest expense
that is not capitalised as part of costs of an asset is
included in the ‘Finance costs’ line item in the profit or
loss.
After initial recognition, such financial liabilities are
subsequently measured at amortised cost using the
EIR method. Amortised cost is calculated by taking into
account any discount or premium on acquisition and
fees or costs that are an integral part of the EIR. The EIR
amortisation is included as finance costs in the profit or
loss.
Financialguaranteecontracts Financial guarantee contracts are those contracts that
require a payment to be made to reimburse the holder
for a loss it incurs because the specified debtor fails to
make a payment when due in accordance with the terms
of a debt instrument. Financial guarantee contracts are
recognised initially as a liability at fair value and if not
designated as at FVTPL, are subsequently measured at
the higher of the amount of loss allowance determined
as per impairment requirements of Ind AS 109 and the
amount initially recognised less cumulative amount of
income recognised.
Derecognition A financial liability is derecognised when the obligation
under the liability is discharged or cancelled or expires.
When an existing financial liability is replaced by another
from the same lender on substantially different terms,
or the terms of an existing liability are substantially
modified, such an exchange or modification is treated
as the derecognition of the original liability and the
recognition of a new liability. The difference between the
carrying amount of the financial liability derecognised
and the consideration paid and payable is recognised in
profit or loss.
Embeddedderivatives Derivatives embedded in non-derivative host contracts
that are not financial assets within the scope of Ind
AS 109 are accounted for as separate derivatives and
recorded at fair value if their economic characteristics
and risks are not closely related to those of the host
contracts and the host contracts are not held for trading
or designated at fair value though profit or loss. These
embedded derivatives are measured at fair value with
changes in fair value recognised in profit or loss, unless
designated as effective hedging instruments.
Reclassificationoffinancialassets The Company determines classification of financial
assets and liabilities on initial recognition. After initial
recognition, no reclassification is made for financial
assets which are equity instruments and financial
liabilities. For financial assets which are debt instruments,
a reclassification is made only if there is a change in the
business model for managing those assets. Changes to
the business model are expected to be infrequent. The
Company’s senior management determines change in the
business model as a result of external or internal changes
which are significant to the Company’s operations. Such
changes are evident to external parties. A change in
the business model occurs when the Company either
begins or ceases to perform an activity that is significant
to its operations. If the Company reclassifies financial
assets, it applies the reclassification prospectively from
the reclassification date which is the first day of the
immediately next reporting period following the change
in business model. The Company does not restate any
previously recognised gains, losses (including impairment
gains or losses) or interest.
Derivativefinancialinstrumentsandhedgeaccounting Initial recognition and subsequent measurement
The Company uses derivative financial instruments,
such as forward currency contracts, full currency swap,
options and interest rate swaps to hedge its foreign
currency risks and interest rate risks respectively. Such
derivative financial instruments are initially recognised
at fair value on the date on which a derivative contract
is entered into and are subsequently re-measured at fair
value at the end of each reporting period. Derivatives are

S U N P H A R M A C E U T I C A L I N D U S T R I E S L I M I T E D1 0 4
NOTES TO THE STANDALONE FINANCIAL STATEMENTS FOR THE YEAR ENDED MARCH 31, 2017
carried as financial assets when the fair value is positive
and as financial liabilities when the fair value is negative.
Any gains or losses arising from changes in the fair value
of derivatives are taken directly to profit or loss, except
for the effective portion of cash flow hedges, which is
recognised in OCI and later reclassified to profit or loss
when the hedge item affects profit or loss or treated
as basis adjustment if a hedged forecast transaction
subsequently results in the recognition of a non-financial
asset or non-financial liability.
Forthepurposeofhedgeaccounting,hedgesareclassi-fiedas:
Fair value hedges when hedging the exposure to
changes in the fair value of a recognised asset or
liability or an unrecognised firm commitment.
Cash flow hedges when hedging the exposure to
variability in cash flows that is either attributable to
a particular risk associated with a recognised asset
or liability or a highly probable forecast transaction
or the foreign currency risk in an unrecognised firm
commitment
At the inception of a hedge relationship, the Company
formally designates and documents the hedge
relationship to which the Company wishes to apply
hedge accounting and the risk management objective and
strategy for undertaking the hedge. The documentation
includes the Company’s risk management objective and
strategy for undertaking hedge, the hedging/economic
relationship, the hedged item or transaction, the nature
of the risk being hedged, hedge ratio and how the entity
will assess the effectiveness of changes in the hedging
instrument’s fair value in offsetting the exposure to
changes in the hedged item’s fair value or cash flows
attributable to the hedged risk. Such hedges are expected
to be highly effective in achieving offsetting changes in
fair value or cash flows and are assessed on an ongoing
basis to determine that they actually have been highly
effective throughout the financial reporting periods for
which they were designated.
Hedges that meet the strict criteria for hedge accounting
are accounted for, as described below:
(i) Fairvaluehedges Changes in fair value of the designated portion of
derivatives that qualify as fair value hedges are
recognised in profit or loss immediately, together
with any changes in the fair value of the hedged
asset or liability that are attributable to the hedged
risk.
(ii) Cashflowhedges The effective portion of changes in the fair value
of the hedging instrument is recognised in OCI in
the cash flow hedge reserve, while any ineffective
portion is recognised immediately in profit or loss.
The Company uses forward currency contracts
as hedges of its exposure to foreign currency risk
in forecast transactions and firm commitments.
Amounts recognised as OCI are transferred
to profit or loss when the hedged transaction
affects profit or loss, such as when a forecast sale
occurs. When the hedged item is the cost of a
non-financial asset or non-financial liability, the
amounts recognised as OCI are transferred to the
initial carrying amount of the non-financial asset or
liability.
If the hedging instrument expires or is sold,
terminated or exercised or if its designation as a
hedge is revoked, or when the hedge no longer
meets the criteria for hedge accounting, any
cumulative gain or loss previously recognised in
OCI remains separately in equity until the forecast
transaction occurs or the foreign currency firm
commitment is met. When a forecast transaction
is no longer expected to occur, the gain or loss
accumulated in equity is recognised immediately in
profit or loss.
Treasuryshares The Company has created an Employee Benefit
Trust (EBT) for providing share-based payment to its
employees. The Company uses EBT as a vehicle for
distributing shares to employees under the employee
remuneration schemes. The Company treats EBT as its
extension and shares held by EBT are treated as treasury
shares.

CORPORATE OVERVIEW STATUTORY REPORTS FINANCIAL STATEMENTS01-07 08-79 80-278
1 0 5A N N UA L R E P O RT 2 0 1 6 - 1 7
NOTES TO THE STANDALONE FINANCIAL STATEMENTS FOR THE YEAR ENDED MARCH 31, 2017
Own equity instruments that are reacquired (treasury
shares) are deducted from equity. No gain or loss is
recognised in profit or loss on the purchase, sale, issue or
cancellation of the Company’s own equity instruments.
Consideration paid or received shall be recognised
directly in equity.
DividenddistributiontoequityholdersoftheCompany The Company recognises a liability to make dividend
distributions to equity holders of the Company when the
distribution is authorised and the distribution is no longer
at the discretion of the Company. As per the corporate
laws in India, a distribution is authorised when it is
approved by the shareholders. A corresponding amount
is recognised directly in equity.
j. Leases
A lease that transfers substantially all the risks and
rewards incidental to ownership to the lessee is classified
as a finance lease. All other leases are classified as
operating leases.
Companyasalessee Finance leases are capitalised at the commencement of
the lease at the inception date fair value of the leased
property or, if lower, at the present value of the minimum
lease payments. The corresponding liability to the
lessor is included in the balance sheet as a finance lease
obligation. Lease payments are apportioned between
finance charges and reduction of the lease liability so as
to achieve a constant rate of interest on the remaining
balance of the liability. Finance charges are recognised
in profit or loss as finance costs, unless they are directly
attributable to qualifying assets, in which case they are
capitalised in accordance with the Company’s general
policy on the borrowing costs. Contingent rentals are
recognised as expenses in the periods in which they are
incurred.
Operating lease payments are generally recognised as
an expense in the profit or loss on a straight-line basis
over the lease term. Where the rentals are structured
solely to increase in line with expected general inflation
to compensate for the lessor’s expected inflationary cost
increases, such increases are recognised in the year in
which such benefits accrue. Contingent rentals arising
under operating leases are also recognised as expenses in
the periods in which they are incurred.
Companyasalessor Rental income from operating lease is generally
recognised on a straight-line basis over the term of the
relevant lease. Where the rentals are structured solely
to increase in line with expected general inflation to
compensate for the Company’s expected inflationary cost
increases, such increases are recognised in the year in
which such benefits accrue. Initial direct costs incurred in
negotiating and arranging an operating lease are added to
the carrying amount of the leased asset and recognised
over the lease term on the same basis as rental income.
Contingent rents are recognised as revenue in the period
in which they are earned.
Amounts due from lessees under finance leases are
recorded as receivables at the Company’s net investment
in the leases. Finance lease income is allocated to
accounting periods so as to reflect a constant periodic
rate of return on the Company’s net investment
outstanding in respect of the leases.
k. Inventories
Inventories consisting of raw materials and packing
materials, work-in-progress, stock-in-trade and finished
goods are measured at the lower of cost and net
realisable value. The cost of all categories of inventories
is based on the weighted average method. Cost of raw
materials and packing materials and stock-in-trade
comprises cost of purchases. Cost of work-in-progress
and finished goods comprises direct material, direct
labour and an appropriate proportion of variable and
fixed overhead expenditure, the latter being allocated
on the basis of normal operating capacity. Cost of
inventories also include all other costs incurred in
bringing the inventories to their present location and
condition.
Net realisable value is the estimated selling price in the
ordinary course of business, less the estimated costs of
completion and costs necessary to make the sale.

S U N P H A R M A C E U T I C A L I N D U S T R I E S L I M I T E D1 0 6
NOTES TO THE STANDALONE FINANCIAL STATEMENTS FOR THE YEAR ENDED MARCH 31, 2017
l. Cash and cash equivalents
Cash and cash equivalent in the balance sheet comprise
cash at banks and on hand and short-term deposits with
an original maturity of three months or less, which are
subject to an insignificant risk of changes in value.
For the purpose of the statement of cash flows, cash and
cash equivalents consist of cash and short-term deposits,
as defined above, net of outstanding bank overdrafts as
they are considered an integral part of the Company’s
cash management.
m. Provisions, contingent liabilities and contingent
assets
Provisions are recognised when the Company has a
present obligation (legal or constructive) as a result of
past event, it is probable that an outflow of resources
embodying economic benefits will be required to settle
the obligation and a reliable estimate can be made of
the amount of obligation. If the effect of the time value
of money is material, provisions are determined by
discounting the expected future cash flows at a pre-tax
rate that reflects current market assessments of the
time value of money and the risks specific to the liability.
Where discounting is used, the increase in the provision
due to the passage of time is recognised as a finance cost.
Restructuring A provision for restructuring is recognised when the
Company has a detailed formal restructuring plan and
has raised a valid expectation in those affected that it will
carry out the restructuring by starting to implement the
plan or announcing its main features to those affected
by it. The measurement of a restructuring provision
includes only the direct expenditure arising from the
restructuring, which are those amounts that are both
necessarily entailed by the restructuring and not
associated with the ongoing activities of the entity.
Onerouscontracts Present obligations arising under onerous contracts
are recognised and measured as provisions. An onerous
contract is considered to exist where the Company has a
contract under which the unavoidable costs of meeting
the obligations under the contract exceed the economic
benefit expected to be received from the contract.
Contingentliabilitiesandcontingentassets Contingent liability is disclosed for,
(i) Possible obligations which will be confirmed only by
future events not wholly within the control of the
Company, or
(ii) Present obligations arising from past events where
it is not probable that an outflow of resources will
be required to settle the obligation or a reliable
estimate of the amount of the obligation cannot be
made.
Contingent Assets are not recognised in the financial
statements.
n. Revenue
Revenue from sale of goods include excise duty and is
measured at the fair value of the consideration received
or receivable. Revenue is net of returns, sales tax,
chargebacks, rebates and other similar allowances.
Saleofgoods Revenue from sale of goods is recognised when the
significant risks and rewards of ownership have been
transferred to the buyer, usually on delivery of goods,
it is probable that the economic benefit will flow the
Company, the associated costs and possible return
of goods can be estimated reliably, there is neither
continuing management involvement to the degree
usually associated with ownership nor effective control
over the goods sold and the amount of revenue can be
measured reliably.
Provisions for chargeback, rebates, discounts and
medicaid payments are estimated and provided for in the
year of sales and recorded as reduction of revenue.
SalesReturns The Company accounts for sales returns accrual by
recording an allowance for sales returns concurrent
with the recognition of revenue at the time of a product
sale. This allowance is based on the Company’s estimate
of expected sales returns. With respect to established
products, the Company considers its historical experience
of sales returns, levels of inventory in the distribution
channel, estimated shelf life, product discontinuances,

CORPORATE OVERVIEW STATUTORY REPORTS FINANCIAL STATEMENTS01-07 08-79 80-278
1 0 7A N N UA L R E P O RT 2 0 1 6 - 1 7
NOTES TO THE STANDALONE FINANCIAL STATEMENTS FOR THE YEAR ENDED MARCH 31, 2017
price changes of competitive products, and the
introduction of competitive new products, to the extent
each of these factors impact the Company’s business
and markets. With respect to new products introduced
by the Company, such products have historically been
either extensions of an existing line of product where
the Company has historical experience or in therapeutic
categories where established products exist and are sold
either by the Company or the Company’s competitors.
RenderingofServices Revenue from services rendered is recognised in the
profit or loss as the underlying services are performed.
Upfront non-refundable payments received are deferred
and recognised as revenue over the expected period over
which the related services are expected to be performed.
Royalties Royalty revenue is recognised on an accrual basis in
accordance with the substance of the relevant agreement
(provided that it is probable that economic benefits will
flow to the Company and the amount of revenue can be
measured reliably). Royalty arrangements that are based
on production, sales and other measures are recognised
by reference to the underlying arrangement.
Dividend and interest income Dividend income is recognised when the Company’s right
to receive the payment is established, which is generally
when shareholders approve the dividend.
Interest income from a financial asset is recognised when
it is probable that the economic benefits will flow to the
Company and the amount of income can be measured
reliably. Interest income is accrued on a time basis,
by reference to the principal outstanding and at the
effective interest rate applicable, which is the rate that
exactly discounts estimated future cash receipts through
the expected life of the financial asset to that asset’s net
carrying amount on initial recognition.
o. Government grants
The Company recognises government grants only
when there is reasonable assurance that the conditions
attached to them will be complied with, and the grants
will be received. When the grant relates to an expense
item, it is recognised as income on a systematic basis
over the periods that the related costs, for which it is
intended to compensate, are expensed. When the grant
relates to an asset, it is recognised as deferred revenue
in the balance sheet and transferred to profit or loss on
a systematic basis over the expected useful life of the
related asset.
p. Employeebenefits
Definedbenefitplans The liability in respect of defined benefit plans is
calculated using the projected unit credit method with
actuarial valuations being carried out at the end of each
annual reporting period. The present value of the defined
benefit obligation is determined by discounting the
estimated future cash outflows by reference to market
yields at the end of the reporting period on government
bonds. The currency and term of the government bonds
shall be consistent with the currency and estimated term
of the post-employment benefit obligations. The current
service cost of the defined benefit plan, recognised in
the profit or loss as employee benefits expense, reflects
the increase in the defined benefit obligation resulting
from employee service in the current year, benefit
changes, curtailments and settlements. Past service
costs are recognised in profit or loss in the period of
a plan amendment. The net interest cost is calculated
by applying the discount rate to the net balance of the
defined benefit obligation and the fair value of plan
assets. This cost is included in employee benefit expense
in profit or loss. Actuarial gains and losses arising
from experience adjustments and changes in actuarial
assumptions are charged or credited to OCI in the
period in which they arise and is reflected immediately in
retained earnings and is not reclassified to profit or loss.
Terminationbenefits Termination benefits are recognised as an expense at
the earlier of the date when the Company can no longer
withdraw the offer of those benefits and when the
entity recognises costs for a restructuring that is within
the scope of Ind AS 37 and involves the payment of
termination benefits.
Short-termandOtherlong-termemployeebenefits A liability is recognised for benefits accruing to

S U N P H A R M A C E U T I C A L I N D U S T R I E S L I M I T E D1 0 8
NOTES TO THE STANDALONE FINANCIAL STATEMENTS FOR THE YEAR ENDED MARCH 31, 2017
employees in respect of wages and salaries, and casual
leave in the period the related service is rendered at the
undiscounted amount of the benefits expected to be paid
in exchange for that service.
The Company’s net obligation in respect of other long
term employee benefits is the amount of future benefit
that employees have earned in return for their service
in the current and previous periods. That benefit is
discounted to determine its present value.
Definedcontributionplans The Company’s contributions to defined contribution
plans are recognised as an expense as and when the
services are received from the employees entitling them
to the contributions.
Share-basedpaymentarrangements The grant date fair value of options granted to
employees is recognised as an employee expense, with a
corresponding increase in equity, on a straight line basis,
over the vesting period, based on the Company’s estimate
of equity instruments that will eventually vest. At the
end of each reporting period, the Company revises its
estimate of the number of equity instruments expected
to vest. The impact of the revision of the original
estimates, if any, is recognised in profit or loss such that
the cumulative expense reflects the revised estimate,
with a corresponding adjustment to the equity-settled
employee benefits reserve.
For cash-settled share-based payments, a liability is
recognised for the goods or services acquired, measured
initially at the fair value of the liability. At the end of
each reporting period until the liability is settled, and
at the date of settlement, the fair value of the liability is
remeasured, with any changes in fair value recognised in
profit or loss for the year.
q. Income tax
Income tax expense consists of current and deferred tax.
Income tax expense is recognised in profit or loss except
to the extent that it relates to items recognised in OCI or
directly in equity, in which case it is recognised in OCI or
directly in equity respectively. Current tax is the expected
tax payable on the taxable profit for the year, using tax
rates enacted or substantively enacted by the end of
the reporting period, and any adjustment to tax payable
in respect of previous years. Current tax assets and tax
liabilities are offset where the Company has a legally
enforceable right to offset and intends either to settle on
a net basis, or to realise the asset and settle the liability
simultaneously.
Deferred tax is recognised on temporary differences
between the carrying amounts of assets and liabilities in
the financial statements and the corresponding tax bases
used in the computation of taxable profit.
Deferred tax is measured at the tax rates that are
expected to be applied to the temporary differences
when they reverse, based on the laws that have been
enacted or substantively enacted by the end of the
reporting period. Deferred tax assets and liabilities are
offset if there is a legally enforceable right to set off
corresponding current tax assets against current tax
liabilities and the deferred tax assets and deferred tax
liabilities relate to income taxes levied by the same tax
authority on the Company
A deferred tax asset is recognised to the extent that it
is probable that future taxable profits will be available
against which the temporary difference can be utilised.
Deferred tax assets are reviewed at each reporting date
and are reduced to the extent that it is no longer probable
that the related tax benefit will be realised. Withholding
tax arising out of payment of dividends to shareholders
under the Indian Income tax regulations is not considered
as tax expense for the Company and all such taxes are
recognised in the statement of changes in equity as part
of the associated dividend payment.
Minimum Alternate Tax (‘MAT’) credit is recognised as
deferred tax asset only when and to the extent there is
convincing evidence that the Company will pay normal
income tax during the period for which the MAT credit
can be carried forward for set-off against the normal tax
liability. MAT credit recognised as an asset is reviewed at
each Balance Sheet date and written down to the extent
the aforesaid convincing evidence no longer exists.

CORPORATE OVERVIEW STATUTORY REPORTS FINANCIAL STATEMENTS01-07 08-79 80-278
1 0 9A N N UA L R E P O RT 2 0 1 6 - 1 7
NOTES TO THE STANDALONE FINANCIAL STATEMENTS FOR THE YEAR ENDED MARCH 31, 2017
r. Earnings per share
The Company presents basic and diluted earnings per
share (“EPS”) data for its equity shares. Basic EPS is
calculated by dividing the profit or loss attributable to
equity shareholders of the Company by the weighted
average number of equity shares outstanding during
the period. Diluted EPS is determined by adjusting the
profit or loss attributable to equity shareholders and the
weighted average number of equity shares outstanding
for the effects of all dilutive potential ordinary shares,
which includes all stock options granted to employees.
The number of equity shares and potentially dilutive
equity shares are adjusted retrospectively for all periods
presented for any share splits and bonus shares issues
including for changes effected prior to the approval of the
financial statements by the Board of Directors.
s. Recent Accounting pronouncements
Standardsissuedbutnotyeteffective In March 2017, the Ministry of Corporate Affairs
issued the Companies (Indian Accounting Standards)
(Amendments) Rules, 2017, notifying amendment to
Ind AS 7, ‘Statement of cash flows’. This amendment is
in accordance with the recent amendments made by
International Accounting Standards Board (IASB) to IAS
7, ‘Statement of cash flows’. The amendment is applicable
to the Company from April 01, 2017.
The amendments to Ind AS 7 requires the entities
to provide disclosures that enable users of financial
statements to evaluate changes in liabilities arising from
financing activities, including both changes arising from
cash flows and non-cash changes, suggesting inclusion
of a reconciliation between the opening and closing
balances in the Balance Sheet for liabilities arising from
financing activities, to meet the disclosure requirement.
The Company is evaluating the requirements of the
amendment and the effect on the financial statements is
being evaluated.

S U N P H A R M A C E U T I C A L I N D U S T R I E S L I M I T E D1 1 0
NOTES TO THE STANDALONE FINANCIAL STATEMENTS FOR THE YEAR ENDED MARCH 31, 2017
Note 3
PROPERTY, PLANT AND EQUIPMENT Following are the changes in the carrying value of property, plant and equipment
` in Million
Freehold land
Leasehold land
Buildings Buildings -
leased # Plant and
equipment
Plant and equipment -
leased #
Furniture and fixtures
Vehicles Office
equipment Total
At cost or deemed costAs at April 01, 2015 530.9 562.4 8,605.9 16.9 19,955.9 19.4 643.0 466.2 386.7 31,187.3
Additions 10.2 - 2,475.5 - 6,516.1 - 165.7 68.8 84.7 9,321.0
Disposals - - (9.7) - (132.7) (19.4) (3.4) (105.0) (6.4) (276.6)
As at March 31, 2016 541.1 562.4 11,071.7 16.9 26,339.3 - 805.3 430.0 465.0 40,231.7
Additions 370.3 - 1,054.8 - 5,621.9 - 51.4 108.1 134.9 7,341.4
Disposals - - - - (258.9) - (15.5) (84.2) (12.4) (371.0)
As at March 31, 2017 911.4 562.4 12,126.5 16.9 31,702.3 - 841.2 453.9 587.5 47,202.1
Accumulated depreciation and impairment
As at April 01, 2015 - - - - - - - - - -
Depreciation expense - 6.9 442.6 0.5 3,603.1 1.2 139.6 101.4 124.9 4,420.2
Impairment losses recognised in profit or loss @
- - 218.6 - 473.5 - 5.4 0.7 2.4 700.6
Eliminated on disposals of assets
- - (0.1) - (37.3) (1.2) (0.8) (12.3) (0.8) (52.5)
As at March 31, 2016 - 6.9 661.1 0.5 4,039.3 - 144.2 89.8 126.5 5,068.3
Depreciation expense - 6.9 368.2 0.5 3,284.8 - 129.7 95.9 121.2 4,007.2
Eliminated on disposals of assets
- - - - (148.7) - (5.3) (35.1) (3.7) (192.8)
As at March 31, 2017 - 13.8 1,029.3 1.0 7,175.4 - 268.6 150.6 244.0 8,882.7
Carrying amountAs at April 01, 2015 530.9 562.4 8,605.9 16.9 19,955.9 19.4 643.0 466.2 386.7 31,187.3
As at March 31, 2016 541.1 555.5 10,410.6 16.4 22,300.0 - 661.1 340.2 338.5 35,163.4
As at March 31, 2017 911.4 548.6 11,097.2 15.9 24,526.9 - 572.6 303.3 343.5 38,319.4
Footnotes (i) Borrowing cost capitalised during the year Nil (March 31, 2016 : ` 62.1 Million).(ii) Buildings include ` 8,620 (As at March 31, 2016 : ` 8,620 ; As at April 01, 2015 : ` 8,620) towards cost of shares in a co-operative housing society and
also includes ` 1.1 Million (As at March 31, 2016 : ` 1.1 Million; As at April 01, 2015 : ` 1.1 Million) and ` 1,133.0 Million (As at March 31, 2016 : ` 1,133.0 Million; As at April 01, 2015 : ` 1,133.0 Million) towards cost of non-convertible preference shares of face value of ` 10/- each and compulsorily convertible debentures of face value of ` 10,000/- each respectively in a company entitling the right of occupancy and use of premises.
(iii) For details of assets pledged as security refer Note 51.(iv) Freehold land includes land valued at ` 25.5 Million (As at March 31, 2016 : ` 25.5 Million, As at April 01, 2015 : ` 25.5 Million) pending registration in the
name of the Company.(v) The aggregate depreciation has been included under depreciation and amortisation expense in the Statement of Profit and Loss.(vi) The Company has elected to measure all its property, plant and equipment at the previous GAAP carrying amount at the date of transition to Ind AS. Refer
Note 52.@ Refer Note 59 (3)# Refer Note 49

CORPORATE OVERVIEW STATUTORY REPORTS FINANCIAL STATEMENTS01-07 08-79 80-278
1 1 1A N N UA L R E P O RT 2 0 1 6 - 1 7
NOTES TO THE STANDALONE FINANCIAL STATEMENTS FOR THE YEAR ENDED MARCH 31, 2017
Note 4
INTANGIBLE ASSETS Other than internally generatedFollowing are the changes in the carrying value of intangible assets
` in Million
Computer Software
Product related intangibles Total
At cost or deemed costAs at April 01, 2015 591.8 108.0 699.8
Additions 67.5 41.2 108.7
Disposals (3.2) - (3.2)
As at March 31, 2016 656.1 149.2 805.3
Additions 73.1 8.6 81.7
Disposals (9.8) - (9.8)
As at March 31, 2017 719.4 157.8 877.2
Accumulated amortisation and impairmentAs at April 01, 2015 - - -
Amortisation expense 193.4 28.9 222.3
Impairment losses recognised in profit or loss @ 0.7 - 0.7
Eliminated on disposals of assets (0.5) - (0.5)
As at March 31, 2016 193.6 28.9 222.5
Amortisation expense 157.0 21.4 178.4
Eliminated on disposals of assets (8.3) - (8.3)
As at March 31, 2017 342.3 50.3 392.6
Carrying amount
As at April 01, 2015 591.8 108.0 699.8
As at March 31, 2016 462.5 120.3 582.8
As at March 31, 2017 377.1 107.5 484.6
Footnotes (i) The aggregate amortisation has been included under depreciation and amortisation expense in the Statement of Profit and Loss. (ii) The Company has elected to measure all its Intangible assets at the previous GAAP carrying amount at the date of transition to Ind AS. Refer Note 52.@ Refer Note 59 (3)

S U N P H A R M A C E U T I C A L I N D U S T R I E S L I M I T E D1 1 2
NOTES TO THE STANDALONE FINANCIAL STATEMENTS FOR THE YEAR ENDED MARCH 31, 2017
Note 5
INVESTMENTS IN THE NATURE OF EQUITY IN SUBSIDIARIES (NON-CURRENT) As at As at As at
March 31, 2017 March 31, 2016 April 01, 2015Quantity ` in Million Quantity ` in Million Quantity ` in Million
Equity instruments - Unquoted (At cost less impairment in value of investments, if any)
Sun Pharmaceutical Industries, Inc.
Common shares of no par value 8,387,666 304.2 8,387,666 304.2 8,387,666 304.2
SUN Farmaceutica do Brasil Ltda
Quota of Capital Stock of Real 1 each fully paid
4,019 18.3 4,019 18.3 4,019 18.3
Sun Pharma De Mexico, S.A. DE C.V.
Common Shares of no Face Value
750 3.3 750 3.3 750 3.3
Sun Pharmaceutical (Bangladesh) Limited
Ordinary Shares of 100 Takas each fully paid
434,469 36.5 434,469 36.5 434,469 36.5
Share Application Money 31.6 31.6 31.6
Sun Pharmaceutical Peru S.A.C.
Ordinary Shares of Soles 10 each fully paid
149 0.0 149 0.0 149 0.0
[` 21,734 (March 31, 2016: ` 21,734; April 01, 2015: ` 21,734)]
SPIL DE Mexico S.A. DE CV
Nominative and free Shares of 500 Mexican Pesos each fully paid
100 0.2 100 0.2 100 0.2
OOO “Sun Pharmaceutical Industries” Limited
Par value rouble stock fully paid - 8.8 - 8.8 - 8.8
5,250,000 Rouble (March 31, 2016: 5,250,000 Rouble; April 01, 2015: 5,250,000 Rouble)
Green Eco Development Centre Limited
Shares of ` 10 each fully paid 700,000 7.0 100,000 1.0 100,000 1.0
Sun Pharma De Venezuela, C.A.
Shares of Bolivars (Bs.F.) 100 each, Bolivars (Bs.F.) 50 per share paid
1,000 0.5 1,000 0.5 1,000 0.5
Sun Pharma Laboratories Limited
Shares of ` 10 each fully paid 50,000 1.5 50,000 1.5 50,000 1.5
Faststone Mercantile Company Private Limited
Shares of ` 10 each fully paid 10,000 0.1 10,000 0.1 10,000 0.1

CORPORATE OVERVIEW STATUTORY REPORTS FINANCIAL STATEMENTS01-07 08-79 80-278
1 1 3A N N UA L R E P O RT 2 0 1 6 - 1 7
NOTES TO THE STANDALONE FINANCIAL STATEMENTS FOR THE YEAR ENDED MARCH 31, 2017
As at As at As atMarch 31, 2017 March 31, 2016 April 01, 2015
Quantity ` in Million Quantity ` in Million Quantity ` in Million Foundation for Disease Elimination
and Control of India Shares of ` 10 each fully paid 10,000 0.1 - - - - Neetnav Real Estate Private Limited Shares of ` 10 each fully paid 10,000 0.1 10,000 0.1 10,000 0.1 Realstone Multitrade Private Limited Shares of ` 10 each fully paid 10,000 0.1 10,000 0.1 10,000 0.1 Skisen Labs Private Limited Shares of ` 10 each fully paid 16,360,000 163.6 16,360,000 163.6 10,000 0.1 Softdeal Trading Company Private
Limited Shares of ` 10 each fully paid 10,000 0.1 10,000 0.1 10,000 0.1 Sun Pharma Holdings Shares of USD 1 each fully paid 855,199,716 54,031.5 855,199,716 54,031.5 855,199,716 54,031.5 Share Application Money - - 3.1 Vidyut Investments Limited Shares of ` 10 each fully paid 25,008,400 250.1 25,008,400 250.1 25,008,400 250.1 Less: Impairment in value of
investment (239.0) (239.0) (239.0)
11.1 11.1 11.1 Ranbaxy Drugs Limited Shares of ` 10 each fully paid 3,100,020 31.0 3,100,020 31.0 3,100,020 31.0 Gufic Pharma Limited Shares of ` 100 each fully paid 4,900 535.2 4,900 535.2 4,900 535.2 Ranbaxy (Netherlands) B.V. Ordinary Shares of Euro 100
each fully paid 5,473,340 39,877.3 5,473,340 39,875.8 5,473,340 39,868.0
Ranbaxy Pharmacie Generiques SAS Ordinary Shares of Euro 1 each
fully paid 24,117,250 4,709.1 24,117,250 4,709.1 24,117,250 4,709.1
Less: Impairment in value of investment
(4,709.1) (4,709.1) (4,709.1)
- - - Ranbaxy Malaysia Sdn. Bhd. Ordinary Shares of RM 1 each
fully paid 3,189,248 37.0 3,189,248 37.0 3,189,248 36.9
Ranbaxy Nigeria Limited Ordinary Shares of Naira 1
each fully paid 13,070,648 8.6 13,070,648 8.5 13,070,648 8.3
95,107.7 95,100.0 94,931.5Preference shares - Unquoted (At cost) Sun Pharma Holdings 5% Optionally Convertible
Preference Shares USD 1 each fully paid
1,540,593,148 97,334.7 2,015,593,148 127,345.2 2,565,593,148 162,094.2
192,442.4 222,445.2 257,025.7 Aggregate amount of investments before impairment
197,390.5 227,393.3 261,973.8
Aggregate amount of impairment in value of investments
4,948.1 4,948.1 4,948.1

S U N P H A R M A C E U T I C A L I N D U S T R I E S L I M I T E D1 1 4
NOTES TO THE STANDALONE FINANCIAL STATEMENTS FOR THE YEAR ENDED MARCH 31, 2017
Note 6
INVESTMENTS IN THE NATURE OF EQUITY IN ASSOCIATES (NON-CURRENT) As at As at As at
March 31, 2017 March 31, 2016 April 01, 2015Quantity ` in Million Quantity ` in Million Quantity ` in Million
Equity instruments - (At cost less impairment in value of investments, if any)Quoted
Zenotech Laboratories Limited *
Shares of ` 10 each fully paid 16,128,078 2,463.5 16,128,078 2,463.5 16,127,293 2,463.5
Less: Impairment in value of investment (2,463.5) (2,463.5) (2,463.5)
- - -
Unquoted
Daiichi Sankyo (Thailand) Limited
Ordinary Shares of Bahts 100 each fully paid - - 206,670 21.2 206,670 21.2
- 21.2 21.2
Market value of quoted investment 570.1 541.9 729.8
* The shares of this entity are thinly traded and therefore, market price has not been considered for the purpose of assessment of impairment in the value of its non-current investment in Zenotech Laboratories Limited.
Note 7
INVESTMENTS (NON-CURRENT) As at As at As at
March 31, 2017 March 31, 2016 April 01, 2015Quantity ` in Million Quantity ` in Million Quantity ` in Million
Investments in subsidiaries
Preference shares - Unquoted
Sun Pharma Laboratories Limited
10% Non-Convertible, Non-Cumulative Redeemable Preference Shares of ` 100 each fully paid
4,000,000 400.0 4,000,000 400.0 4,000,000 400.0
Ranbaxy Drugs Limited
10% Non-Convertible Redeemable Preference Shares of ` 10 each fully paid.
250 0.0 250 0.0 250 0.0
` 2,500 [March 31, 2016: ` 2,500; April 01, 2015: ` 2,500]
Alkaloida Chemical Company Zrt.
2% Redeemable Preference Shares of $ 15 each fully paid at a premium of $ 35 per share
- - - - 150,000 402.6
400.0 400.0 802.6
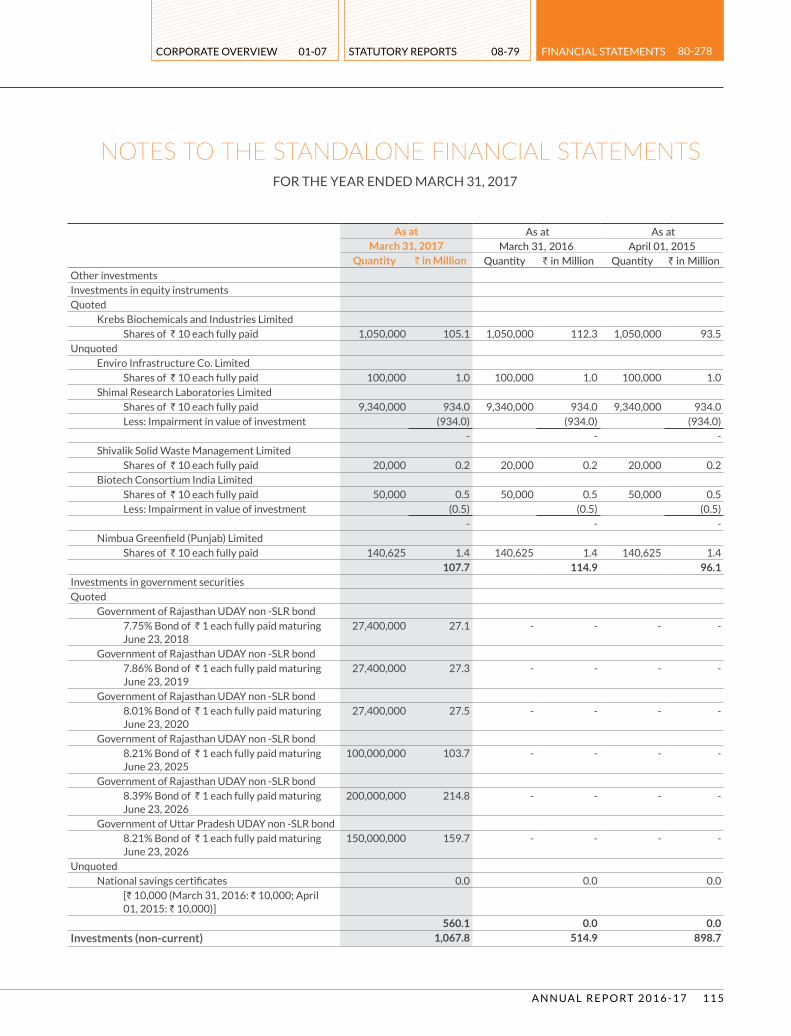
CORPORATE OVERVIEW STATUTORY REPORTS FINANCIAL STATEMENTS01-07 08-79 80-278
1 1 5A N N UA L R E P O RT 2 0 1 6 - 1 7
NOTES TO THE STANDALONE FINANCIAL STATEMENTS FOR THE YEAR ENDED MARCH 31, 2017
As at As at As atMarch 31, 2017 March 31, 2016 April 01, 2015
Quantity ` in Million Quantity ` in Million Quantity ` in MillionOther investmentsInvestments in equity instrumentsQuoted Krebs Biochemicals and Industries Limited Shares of ` 10 each fully paid 1,050,000 105.1 1,050,000 112.3 1,050,000 93.5 Unquoted Enviro Infrastructure Co. Limited Shares of ` 10 each fully paid 100,000 1.0 100,000 1.0 100,000 1.0 Shimal Research Laboratories Limited Shares of ` 10 each fully paid 9,340,000 934.0 9,340,000 934.0 9,340,000 934.0 Less: Impairment in value of investment (934.0) (934.0) (934.0)
- - - Shivalik Solid Waste Management Limited Shares of ` 10 each fully paid 20,000 0.2 20,000 0.2 20,000 0.2 Biotech Consortium India Limited Shares of ` 10 each fully paid 50,000 0.5 50,000 0.5 50,000 0.5 Less: Impairment in value of investment (0.5) (0.5) (0.5)
- - - Nimbua Greenfield (Punjab) Limited Shares of ` 10 each fully paid 140,625 1.4 140,625 1.4 140,625 1.4
107.7 114.9 96.1 Investments in government securities Quoted Government of Rajasthan UDAY non -SLR bond 7.75% Bond of ` 1 each fully paid maturing
June 23, 2018 27,400,000 27.1 - - - -
Government of Rajasthan UDAY non -SLR bond 7.86% Bond of ` 1 each fully paid maturing
June 23, 2019 27,400,000 27.3 - - - -
Government of Rajasthan UDAY non -SLR bond 8.01% Bond of ` 1 each fully paid maturing
June 23, 2020 27,400,000 27.5 - - - -
Government of Rajasthan UDAY non -SLR bond 8.21% Bond of ` 1 each fully paid maturing
June 23, 2025 100,000,000 103.7 - - - -
Government of Rajasthan UDAY non -SLR bond 8.39% Bond of ` 1 each fully paid maturing
June 23, 2026 200,000,000 214.8 - - - -
Government of Uttar Pradesh UDAY non -SLR bond 8.21% Bond of ` 1 each fully paid maturing
June 23, 2026 150,000,000 159.7 - - - -
Unquoted National savings certificates 0.0 0.0 0.0 [` 10,000 (March 31, 2016: ` 10,000; April
01, 2015: ` 10,000)] 560.1 0.0 0.0
Investments (non-current) 1,067.8 514.9 898.7

S U N P H A R M A C E U T I C A L I N D U S T R I E S L I M I T E D1 1 6
NOTES TO THE STANDALONE FINANCIAL STATEMENTS FOR THE YEAR ENDED MARCH 31, 2017
As at As at As atMarch 31, 2017 March 31, 2016 April 01, 2015
Quantity ` in Million Quantity ` in Million Quantity ` in MillionAggregate book value (carrying value) of quoted investments
665.2 112.3 93.5
Aggregate amount of quoted investments at market value
665.2 112.3 93.5
Aggregate amount of unquoted investments before impairment
1,337.1 1,337.1 1,739.7
Aggregate amount of impairment in value of investments 934.5 934.5 934.5
Note 8
LOANS (NON-CURRENT) ` in Million
As at As at As atMarch 31, 2017 March 31, 2016 April 01, 2015
Loans to employees / others
Secured, considered good 16.0 23.0 40.3
Unsecured, considered good 32.5 80.7 115.8
Loans to related parties (Refer Note 53 & 54)
Unsecured, considered good - 4.4 4.4
48.5 108.1 160.5
Note 9
OTHER FINANCIAL ASSETS (NON-CURRENT) ` in Million
As at As at As atMarch 31, 2017 March 31, 2016 April 01, 2015
Deposits - Pledged with Government Authorities 1.0 1.0 1.0
Security deposits 377.5 375.5 423.3
Derivatives not designated as hedges 611.5 1,442.2 1,011.5
990.0 1,818.7 1,435.8

CORPORATE OVERVIEW STATUTORY REPORTS FINANCIAL STATEMENTS01-07 08-79 80-278
1 1 7A N N UA L R E P O RT 2 0 1 6 - 1 7
NOTES TO THE STANDALONE FINANCIAL STATEMENTS FOR THE YEAR ENDED MARCH 31, 2017
Note 10
DEFERRED TAX ASSETS (NET) ` in Million
Opening balance
April 01, 2015 Recognised in
profit or loss Closing balance March 31, 2016
Deferred tax (liabilities) / assets in relation to:Difference between written down value of property, plant and equipment and capital work-in-progress as per books of accounts and income tax
(3,794.9) 437.9 (3,357.0)
Difference in carrying value and tax base of financial assets and liabilities (286.5) (32.9) (319.4)Other liabilities (177.1) (6.0) (183.1)Allowance for doubtful debts and advances 381.8 362.4 744.2 Expenses claimed for tax purpose on payment basis 434.5 (57.3) 377.2 Unabsorbed depreciation / carried forward losses 3,128.3 (697.1) 2,431.2 Other assets 313.9 (7.0) 306.9
- - -MAT credit entitlement 7,517.0 - 7,517.0
7,517.0 - 7,517.0
` in Million
Opening balance
April 01, 2016 Recognised in
profit or loss Closing balance March 31, 2017
Deferred tax (liabilities) / assets in relation to:Difference between written down value of property, plant and equipment and capital work-in-progress as per books of accounts and income tax
(3,357.0) (968.1) (4,325.1)
Difference in carrying value and tax base of financial assets and liabilities (319.4) 319.4 - Other liabilities (183.1) 173.9 (9.2)Allowance for doubtful debts and advances 744.2 (1.0) 743.2 Expenses claimed for tax purpose on payment basis 377.2 424.5 801.7 Unabsorbed depreciation / carried forward losses 2,431.2 65.9 2,497.1 Other assets 306.9 (14.6) 292.3
- - -MAT credit entitlement 7,517.0 - 7,517.0
7,517.0 - 7,517.0
` in Million As at As at As at
March 31, 2017 March 31, 2016 April 01, 2015Deductible temporary differences, unused tax losses and unused tax credits for which no deferred tax assets have been recognised are attributable to the following : Tax losses 78,498.4 67,846.5 52,222.5 Tax losses (Capital in nature) 757.1 757.1 757.1 Unabsorbed depreciation 24,900.1 19,897.1 15,259.9 Unused tax credits (MAT credit entitlement) 2,874.3 3,497.3 3,689.5 Deductible temporary differences 25,892.5 28,057.5 27,089.5
132,922.4 120,055.5 99,018.5The unused tax credits will expire from financial year 2017-18 to financial year 2023-24 and unused tax losses will expire from financial year 2017-18 to financial year 2025-26.

S U N P H A R M A C E U T I C A L I N D U S T R I E S L I M I T E D1 1 8
NOTES TO THE STANDALONE FINANCIAL STATEMENTS FOR THE YEAR ENDED MARCH 31, 2017
Note 11
INCOME TAX ASSETS (NET) (NON-CURRENT) ` in Million
As at As at As atMarch 31, 2017 March 31, 2016 April 01, 2015
Advance income tax [Net of provisions ` 10,894.5 Million (March 31, 2016 : ` 10,894.5 Million; April 01, 2015 : ` 10,894.5 Million)]
17,826.3 10,062.5 6,589.7
17,826.3 10,062.5 6,589.7
Note 12
OTHER NON-CURRENT ASSETS ` in Million
As at As at As atMarch 31, 2017 March 31, 2016 April 01, 2015
Capital advances 2,918.3 2,467.4 2,827.6
Prepaid expenses 16.3 28.8 11.5
Balances with government authorities 1,154.0 1,070.0 1,368.6
Other assets 12.0 24.7 34.5
4,100.6 3,590.9 4,242.2
Note 13
INVENTORIES ` in Million
As at As at As atMarch 31, 2017 March 31, 2016 April 01, 2015
Lower of cost and net realisable value
Raw materials and packing materials 7,020.0 7,041.7 8,117.5
Goods in transit 298.0 602.3 323.4
7,318.0 7,644.0 8,440.9
Work-in-progress 8,403.4 7,229.3 7,567.1
Finished goods 6,053.2 5,621.2 4,191.4
Stock-in-trade 462.1 379.3 1,326.7
Goods in transit - 61.0 61.8
462.1 440.3 1,388.5
Stores, spares and other materials 629.5 386.7 304.6
22,866.2 21,321.5 21,892.5
(i) Inventory write downs are accounted, considering the nature of inventory, ageing, liquidation plan and net realisable value. Write downs of inventories amounted to ` 7,863.9 Million (March 31, 2016: ` 7,503 Million; April 01, 2015: ` 7,007.1 Million). The changes in write downs are recognised as an expense in the statement of profit and loss.
(ii) For details of inventories pledged as security refer Note 51.(iii) The cost of inventories recognised as an expense is disclosed in Notes 33, 34 and 37 and as purchases of stock-in-trade in the statement of profit and loss.

CORPORATE OVERVIEW STATUTORY REPORTS FINANCIAL STATEMENTS01-07 08-79 80-278
1 1 9A N N UA L R E P O RT 2 0 1 6 - 1 7
NOTES TO THE STANDALONE FINANCIAL STATEMENTS FOR THE YEAR ENDED MARCH 31, 2017
Note 14
INVESTMENTS (CURRENT)
As at As at As atMarch 31, 2017 March 31, 2016 April 01, 2015
Quantity ` in Million Quantity ` in Million Quantity ` in MillionInvestments in mutual funds
Unquoted *
ICICI Prudential Mutual Fund-ICICI Prudential Money Market Fund-Direct Plan Growth
Units of ` 100 each fully paid - - - - 1,810,104 350.2
ICICI Prudential Mutual Fund-ICICI Prudential Liquid - Direct Plan - Growth
Units of ` 100 each fully paid 1,662,199 400.1 - - - -
Pramerica Mutual Fund-Pramerica Liquid Fund-Direct Plan-Growth Option fully paid
Units of ` 1000 each fully paid - - - - 335,039 500.5
400.1 - 850.7
Investments in commercial paper
Unquoted
Housing Development Finance Corporation Limited
Commerical paper of ` 500,000 units fully paid
- - 1,000 491.0 - -
JM Financial Products Ltd
Commerical paper of ` 500,000 units fully paid
- - 500 244.6 - -
- 735.6 -
400.1 735.6 850.7
* Investments in mutual funds have been fair valued at closing net asset value (NAV).
Note 15
TRADE RECEIVABLES ` in Million
As at As at As atMarch 31, 2017 March 31, 2016 April 01, 2015
Unsecured
Considered good 27,256.7 19,978.1 17,915.1
Considered doubtful 1,209.7 1,304.5 580.9
28,466.4 21,282.6 18,496.0
Less : Allowance for doutful debts (expected credit loss allowance) (1,209.7) (1,304.5) (580.9)
27,256.7 19,978.1 17,915.1

S U N P H A R M A C E U T I C A L I N D U S T R I E S L I M I T E D1 2 0
NOTES TO THE STANDALONE FINANCIAL STATEMENTS FOR THE YEAR ENDED MARCH 31, 2017
Note 16
CASH AND CASH EQUIVALENTS ` in Million
As at As at As atMarch 31, 2017 March 31, 2016 April 01, 2015
Balances with banks
In current accounts 1,497.2 1,534.1 1,870.4
In deposit accounts with original maturity less than 3 months - - 13.7
Cheques on hand 4.2 3.8 40.0
Cash on hand 6.4 5.5 7.9
1,507.8 1,543.4 1,932.0
Note 17
BANK BALANCES OTHER THAN DISCLOSED IN NOTE 16 ABOVE ` in Million
As at As at As atMarch 31, 2017 March 31, 2016 April 01, 2015
Deposit accounts 0.8 14.5 2,104.0
Earmarked balances with banks
Unpaid Dividend Accounts 59.3 63.0 58.6
Balances held as margin money or security against guarantees and other commitments (*)
70.2 70.2 70.0
130.3 147.7 2,232.6
* having original maturity of more than 12 months.
Note 18
LOANS (CURRENT)` in Million
As at As at As atMarch 31, 2017 March 31, 2016 April 01, 2015
Loans to employees / others
Secured, considered good 4.0 4.6 13.6
Unsecured, considered good 134.2 182.4 456.4
Considered doubtful 4.5 4.5 4.5
Less : Allowance for doubtful loans (4.5) (4.5) (4.5)
Loans to related parties (Refer Note 53 & 54 )
Unsecured, considered good - - 238.4
Considered doubtful 512.0 512.0 274.0
Less : Allowance for doubtful loans (512.0) (512.0) (274.0)
138.2 187.0 708.4

CORPORATE OVERVIEW STATUTORY REPORTS FINANCIAL STATEMENTS01-07 08-79 80-278
1 2 1A N N UA L R E P O RT 2 0 1 6 - 1 7
NOTES TO THE STANDALONE FINANCIAL STATEMENTS FOR THE YEAR ENDED MARCH 31, 2017
Note 19
OTHER FINANCIAL ASSETS (CURRENT)` in Million
As at As at As atMarch 31, 2017 March 31, 2016 April 01, 2015
Interest accrued Considered good 0.1 - 114.4 Considered doubtful 214.9 151.5 - Less : Allowance for doubtful (214.9) (151.5) -
0.1 - 114.4 Insurance claim receivables 1.6 6.4 6.6 Security deposits 35.3 70.2 60.6 Other receivables 40.5 46.9 69.4 Derivatives not designated as hedges 594.3 92.4 932.7
671.8 215.9 1,183.7
Note 20
OTHER CURRENT ASSETS` in Million
As at As at As atMarch 31, 2017 March 31, 2016 April 01, 2015
Export incentives receivable 2,159.1 1,936.4 1,500.3
Prepaid expenses 327.4 200.3 526.7
Advances for supply of goods and services
Considered good 1,930.2 1,131.6 856.5
Considered doubtful 206.3 184.2 185.1
Less : Allowance for doubtful (206.3) (184.2) (185.1)
1,930.2 1,131.6 856.5
Balances with government authorities 6,278.6 5,758.1 4,530.7
Other assets 32.2 7.0 88.7
10,727.5 9,033.4 7,502.9

S U N P H A R M A C E U T I C A L I N D U S T R I E S L I M I T E D1 2 2
NOTES TO THE STANDALONE FINANCIAL STATEMENTS FOR THE YEAR ENDED MARCH 31, 2017
Note 21
EQUITY SHARE CAPITAL
As at As at As atMarch 31, 2017 March 31, 2016 April 01, 2015
Number of shares
` in Million Number of
shares ` in Million Number of shares ` in Million
AuthorisedEquity shares of ` 1 each 5,990,000,000 5,990.0 5,990,000,000 5,990.0 5,990,000,000 5,990.0
Cumulative preference shares of ` 100 each
100,000 10.0 100,000 10.0 100,000 10.0
5,990,100,000 6,000.0 5,990,100,000 6,000.0 5,990,100,000 6,000.0
Issued, subscribed and fully paid upEquity shares of ` 1 each 2,399,260,815 2,399.3 2,406,605,118 2,406.6 2,071,163,910 2,071.2
2,399,260,815 2,399.3 2,406,605,118 2,406.6 2,071,163,910 2,071.2
As at As at March 31, 2017 March 31, 2016
Number of shares
` in Million Number of
shares ` in Million
Reconciliation of the number of equity shares and amount outstanding at the beginning and at the end of reporting period (As at April 01, 2015, excluding share suspense account)
Opening balance 2,406,605,118 2,406.6 2,071,163,910 2,071.2
Add : shares allotted pursuant to the scheme of amalgamation [Refer Note 59(4)]
- - 334,770,248 334.8
Add : shares allotted to employees on exercise of employee stock option (excluding shares held by ESOP trust)
155,697 0.2 670,960 0.6
Less : buy-back of shares [Refer Note 59 (13)] (7,500,000) (7.5) - -
Closing balance 2,399,260,815 2,399.3 2,406,605,118 2,406.6
The movement of equity shares issued to ESOP Trust at face value is as follows: (As at April 01, 2015, excluding share suspense account)
Opening balance 123,381 0.1 - -
Add : shares allotted pursuant to the scheme of amalgamation [Refer Note 59(4)]
- - 186,516 0.2
Add : shares allotted to the ESOP Trust - - 160,000 0.1
Less : shares allotted by ESOP Trust on exercise of employee stock option
(93,015) (0.1) (223,135) (0.2)
Closing balance (March 31, 2017: ` 30,366) 30,366 0.0 123,381 0.1

CORPORATE OVERVIEW STATUTORY REPORTS FINANCIAL STATEMENTS01-07 08-79 80-278
1 2 3A N N UA L R E P O RT 2 0 1 6 - 1 7
NOTES TO THE STANDALONE FINANCIAL STATEMENTS FOR THE YEAR ENDED MARCH 31, 2017
Equity shares held by each shareholder holding more than 5 percent equity shares (As at April 01, 2015, excluding share suspense account) in the Company are as follows:
As at As at As atMarch 31, 2017 March 31, 2016 April 01, 2015
Number of shares
% of holding
Number of shares
% of holding
Number of shares
% of holding
Dilip Shantilal Shanghvi 230,285,690 9.6 231,140,480 9.6 231,140,480 11.2 Viditi Investment Pvt. Ltd. 200,846,362 8.4 201,385,320 8.4 201,385,320 9.7 Tejaskiran Pharmachem Industries Pvt. Ltd. 194,820,971 8.1 195,343,760 8.1 195,343,760 9.4 Family Investment Pvt. Ltd. 182,437,880 7.6 182,927,440 7.6 182,927,440 8.8 Quality Investments Pvt. Ltd. 182,379,237 7.6 182,868,640 7.6 182,868,640 8.8
(i) 1,035,581,955 (upto March 31, 2016: 1,035,581,955; upto April 01, 2015: 1,035,581,955) equity shares of ` 1 each have been allotted as
fully paid up bonus shares during the period of five years immediately preceding the date at which the Balance Sheet is prepared.
(ii) 334,956,764 (upto March 31, 2016: 334,956,764; upto April 01, 2015: Nil) equity shares of ` 1 each have been allotted, pursuant to
scheme of amalgamation, without payment being received in cash during the period of five years immediately preceding the date at
which the Balance Sheet is prepared. [Refer Note 59(4)]
(iii) 7,500,000 (upto March 31, 2016: Nil, upto April 01, 2015: Nil) equity shares of ` 1 each have been bought back during the period of
five years immediately preceding the date at which the Balance Sheet is prepared. The shares bought back in the current year were
cancelled immediately. [Refer Note 59 (13)]
(iv) Rights, Preference and Restrictions attached to equity shares: The Equity Shares of the Company, having par value of ` 1 per share, rank
pari passu in all respects including voting rights and entitlement to dividend.
(v) Refer Note 50 for number of employee stock options against which equity shares are to be issued by the Company / ESOP Trust upon
vesting and exercise of those stock options.
Note 22
OTHER EQUITY` in Million
As at As at As atMarch 31, 2017 March 31, 2016 April 01, 2015
Refer statement of changes in equity for detailed movement in other equity balanceA) Share application money pending allotment (March 31, 2017: ` 7,177)
[Refer Note 59 (12)]0.0 6.7 149.0
B) Reserve and surplus Capital reserve 36,660.0 36,660.0 36,660.0 Securities premium reserve 11,894.6 18,585.2 18,220.3 Debenture redemption reserve - - 750.0 Share options outstanding account 26.4 48.9 82.1 Amalgamation reserve 43.8 43.8 43.8 Capital redemption reserve 7.5 - - General reserve 34,779.3 34,779.3 34,029.3 Retained earnings 122,914.8 126,353.4 146,184.5
206,326.4 216,470.6 235,970.0 C) Items of other comprehensive income (OCI)
Equity instrument through OCI 16.0 23.1 4.2 Effective portion of cash flow hedges (26.6) - -
(10.6) 23.1 4.2 206,315.8 216,500.4 236,123.2

S U N P H A R M A C E U T I C A L I N D U S T R I E S L I M I T E D1 2 4
NOTES TO THE STANDALONE FINANCIAL STATEMENTS FOR THE YEAR ENDED MARCH 31, 2017
Nature and purpose of each reserve Capital reserve - During amalgamation / merger / acquisition, the excess of net assets taken, over the consideration paid, if any, is treated as capital reserve. Securities premium reserve - The amount received in excess of face value of the equity shares is recognised in Securities Premium Reserve. In case of equity-settled share based payment transactions, the difference between fair value on grant date and nominal value of share is accounted as securities premium reserve. This reserve is utilised in accordance with the provisions of the Companies Act 2013. Debenture redemption reserve - The Company is required to create a debenture redemption reserve out of the profits which is available for payment of dividend. This reserve was transferred to general reserve on redemption of debentures. Share options outstanding account - The fair value of the equity settled share based payment transactions is recognised to share options outstanding account. Amaglamation reserve - The reserve was created pursuant to scheme of amalgamation in earlier years. Capital redemption reserve - The Company has recognised Capital Redemption Reserve on buy-back of equity shares from its retained earnings. The amount in Capital Redemption Reserve is equal to nominal amount of the equity shares bought back. General reserve - The reserve arises on transfer portion of the net profit pursuant to the earlier provisions of Companies Act 1956. Mandatory transfer to general reserve is not required under the Companies Act 2013. Equity instrument through OCI - The Company has elected to recognise changes in the fair value of certain investment in equity instrument in other comprehensive income. This amount will be reclassified to retained earnings on derecognition of equity instrument. Effective portion of cash flow hedges - The cash flow hedging reserve represents the cumulative effective portion of gains or losses arising on changes in fair value of designated portion of hedging instruments entered into for cash flow hedges. The cumulative gain or loss arising on the changes of the fair value of the designated portion of the hedging instruments that are recognised and accumulated under the cash flow hedge reserve will be reclassified to profit or loss only when the hedged transaction affects the profit or loss, or included as a basis adjustment to the non-financial hedged item.
Note 23
BORROWINGS (NON-CURRENT) ` in Million
As at As at As atMarch 31, 2017 March 31, 2016 April 01, 2015
Term loan from department of biotechnology (Refer Note 51)
Secured 108.2 77.3 77.3
Term loans from banks (Refer Note 51)
Unsecured 7,498.2 19,151.1 11,576.3
7,606.4 19,228.4 11,653.6
Note 24
OTHER FINANCIAL LIABILITIES (NON-CURRENT) ` in Million
As at As at As atMarch 31, 2017 March 31, 2016 April 01, 2015
Interest accrued 6.8 4.9 3.4
Derivatives not designated as hedge - - 212.5
6.8 4.9 215.9

CORPORATE OVERVIEW STATUTORY REPORTS FINANCIAL STATEMENTS01-07 08-79 80-278
1 2 5A N N UA L R E P O RT 2 0 1 6 - 1 7
NOTES TO THE STANDALONE FINANCIAL STATEMENTS FOR THE YEAR ENDED MARCH 31, 2017
Note 25
PROVISIONS (NON-CURRENT) ` in Million
As at As at As atMarch 31, 2017 March 31, 2016 April 01, 2015
Employee benefits (Refer Note 48) 2,443.8 1,659.5 1,610.6
Others (Refer Note 55) 8,884.5 16,591.8 21,179.9
11,328.3 18,251.3 22,790.5
Note 26
BORROWINGS (CURRENT) ` in Million
As at As at As atMarch 31, 2017 March 31, 2016 April 01, 2015
Loans repayable on demand
From Banks
Secured (Refer Note 51) 198.1 2,560.5 2,739.0
Unsecured 25,021.5 26,756.8 27,223.4
Loans from related party
Loans repayable on demand (Unsecured) - 8,019.9 65.7
Other loans
Commercial paper (Unsecured) 15,320.8 - 12,347.5
40,540.4 37,337.2 42,375.6
Note 27
TRADE PAYABLES ` in Million
As at As at As atMarch 31, 2017 March 31, 2016 April 01, 2015
Dues to micro and small enterprises (Refer Note 46) 116.7 87.4 94.0
Others 20,825.3 17,637.1 15,673.7
20,942.0 17,724.5 15,767.7

S U N P H A R M A C E U T I C A L I N D U S T R I E S L I M I T E D1 2 6
NOTES TO THE STANDALONE FINANCIAL STATEMENTS FOR THE YEAR ENDED MARCH 31, 2017
Note 28
OTHER FINANCIAL LIABILITIES (CURRENT) ` in Million
As at As at As atMarch 31, 2017 March 31, 2016 April 01, 2015
Current maturities of long-term debt (Refer Note 51) 12,319.3 1,722.8 13,838.7
Interest accrued 63.1 91.8 221.7
Unpaid dividends 76.7 72.8 65.7
Security deposits 135.3 132.3 140.3
Payables on purchase of property, plant and equipment 1,143.3 838.5 699.1
Product settlement, claims, recall charges and trade commitments 14,298.5 14,674.5 14,276.4
Derivatives not designated as hedge 72.6 216.1 4,869.6
Derivatives designated as hedge 26.6 - -
Others - 44.2 179.9
28,135.4 17,793.0 34,291.4
Note 29
OTHER CURRENT LIABILITIES ` in Million
As at As at As atMarch 31, 2017 March 31, 2016 April 01, 2015
Statutory remittances 1,385.4 1,339.0 1,196.4
Advance from customers 348.7 275.4 1,035.8
Others 3.9 7.8 7.8
1,738.0 1,622.2 2,240.0
Note 30
PROVISIONS (CURRENT) ` in Million
As at As at As atMarch 31, 2017 March 31, 2016 April 01, 2015
Employee benefits (Refer Note 48) 754.8 611.5 404.6
Provision in respect of losses of a subsidiary 1,602.6 1,569.8 1,286.6
Others (Refer Note 55) 16,112.5 9,614.8 5,346.6
18,469.9 11,796.1 7,037.8
Note 31
REVENUE FROM OPERATIONS ` in Million
Year ended Year ended March 31, 2017 March 31, 2016
Sale of products (including excise duty) 75,237.9 72,540.9
Other operating revenues 2,829.1 6,096.0
78,067.0 78,636.9

CORPORATE OVERVIEW STATUTORY REPORTS FINANCIAL STATEMENTS01-07 08-79 80-278
1 2 7A N N UA L R E P O RT 2 0 1 6 - 1 7
NOTES TO THE STANDALONE FINANCIAL STATEMENTS FOR THE YEAR ENDED MARCH 31, 2017
Note 32
OTHER INCOME ` in Million
Year ended Year ended March 31, 2017 March 31, 2016
Interest income on :
Bank deposits at amortised cost 0.7 41.1
Loans at amortised cost 89.4 99.6
Investments in debt instruments at amortised cost 2.9 11.6
Investments in debt instruments at fair value through other comprehensive income 6.6 -
Other financial assets carried at amortised cost 107.7 133.2
Others 22.0 76.9
229.3 362.4
Dividend income on investments
Subsidiary 2,040.7 394.3
Others (March 31, 2017: ` 20,000) 0.0 0.2
2,040.7 394.5
Net gain arising on financial assets measured at fair value through profit or loss 16.1 5.7
Gain on sale of financial assets measured at fair value through profit or loss 186.0 178.2
Gain on sale of investment in subsidiary 2,307.8 3,242.2
Gain on sale of investment in associate 120.3 -
Sundry balances written back, net 25.4 50.0
Insurance claims 24.8 31.4
Lease rental and hire charges 188.8 182.6
Miscellaneous income 4.9 3.9
5,144.1 4,450.9
Note 33
COST OF MATERIALS CONSUMED ` in Million
Year ended Year ended March 31, 2017 March 31, 2016
Raw materials and packing materials
Inventories at the beginning of the year 7,644.0 8,440.9
Purchases during the year 22,519.2 17,586.2
Inventories at the end of the year (7,318.0) (7,644.0)
22,845.2 18,383.1

S U N P H A R M A C E U T I C A L I N D U S T R I E S L I M I T E D1 2 8
NOTES TO THE STANDALONE FINANCIAL STATEMENTS FOR THE YEAR ENDED MARCH 31, 2017
Note 34
CHANGES IN INVENTORIES OF FINISHED GOODS, STOCK-IN-TRADE AND WORK-IN-PROGRESS
` in Million Year ended Year ended
March 31, 2017 March 31, 2016Inventories at the beginning of the year 13,290.8 13,147.0
Inventories at the end of the year (14,918.7) (13,290.8)
(1,627.9) (143.8)
Note 35
EMPLOYEE BENEFITS EXPENSE ` in Million
Year ended Year ended March 31, 2017 March 31, 2016
Salaries and wages 13,663.2 13,092.8
Contribution to provident and other funds 819.3 1,028.2
Share based payments to employees 30.8 90.6
Staff welfare expenses 348.4 555.3
14,861.7 14,766.9
Note 36
FINANCE COSTS ` in Million
Year ended Year ended March 31, 2017 March 31, 2016
Interest expense for financial liabilities carried at amortised cost 1,013.6 2,898.7
Interest expense others 4.4 66.2
Exchange differences regarded as an adjustment to borrowing costs 779.8 2,238.1
Unwinding of discounts on provisions 437.8 538.0
2,235.6 5,741.0

CORPORATE OVERVIEW STATUTORY REPORTS FINANCIAL STATEMENTS01-07 08-79 80-278
1 2 9A N N UA L R E P O RT 2 0 1 6 - 1 7
NOTES TO THE STANDALONE FINANCIAL STATEMENTS FOR THE YEAR ENDED MARCH 31, 2017
Note 37
OTHER EXPENSES ` in Million
Year ended Year ended March 31, 2017 March 31, 2016
Consumption of materials, stores and spare parts 4,278.7 4,230.7
Conversion and other manufacturing charges 2,276.2 1,984.9
Power and fuel 3,451.7 3,704.8
Rent 221.1 393.1
Rates and taxes 1,078.8 866.1
Insurance 419.8 454.1
Selling and distribution 4,555.8 4,535.0
Commission on sales 472.4 441.4
Repairs and maintenance 2,110.8 2,172.3
Printing and stationery 325.7 297.5
Travelling and conveyance 1,755.6 1,754.2
Freight outward and handling charges 1,601.3 2,032.2
Communication 262.4 324.9
Provision / write off for doubtful trade receivables / advances 38.5 1,232.1
Professional, legal and consultancy 3,810.9 6,309.1
Excise duty on sales 1,092.4 1,304.3
Donations 15.8 26.8
Loss on sale/write off of property, plant and equipment, net 110.2 82.3
(Decrease) / increase of excise duty on inventories (49.4) 138.4
Net (gain) / loss on foreign currency transactions [includes exchange gain of ` 132.6 million (Previous year exchange loss of ` 160.3 Million) in respect of provision for losses of a subsidiary]
(1,745.7) 2,752.2
Payments to auditors (net of input credit, where applicable)
For audit [includes Nil (Previous year ` 0.7 Million) in respect of previous year] 24.8 22.9
For other services 11.0 25.3
Reimbursement of expenses 0.4 0.6
Impairment of non-current investment in associate (March 31, 2016: ` 16,380) - 0.0
Provision in respect of losses of a subsidiary 165.4 122.9
Miscellaneous expenses 2,385.7 2,909.3
28,670.3 38,117.4

S U N P H A R M A C E U T I C A L I N D U S T R I E S L I M I T E D1 3 0
NOTES TO THE STANDALONE FINANCIAL STATEMENTS FOR THE YEAR ENDED MARCH 31, 2017
Note 38
RESEARCH AND DEVELOPMENT EXPENDITURE INCLUDED IN THE STATEMENT OF PROFIT AND LOSS ` in Million
Year ended Year ended March 31, 2017 March 31, 2016
Salaries and wages 2,848.1 2,699.3
Contribution to provident and other funds 135.1 161.9
Staff welfare expenses 46.7 71.3
Consumption of materials, stores and spare parts 2,815.9 2,747.5
Power and fuel 342.8 378.9
Rent 54.9 96.9
Rates and taxes 241.7 128.0
Insurance 37.3 39.3
Repairs and maintenance 468.0 451.0
Printing and stationery 31.1 30.2
Travelling and conveyance 132.8 138.7
Communication 40.6 53.8
Professional, legal and consultancy 1,196.1 1,464.6
Loss on sale/write off of property, plant and equipment, net (0.4) 0.6
Miscellaneous expenses 647.3 575.9
9,038.0 9,037.9
Less :
Net interest income 0.1 2.1
Receipts from research activities 747.0 1,271.7
Miscellaneous income 9.2 13.9
8,281.7 7,750.2
Note 39
TAX RECONCILIATION` in Million
Year ended Year ended March 31, 2017 March 31, 2016
Reconciliation of tax expenseProfit/(loss) before tax (324.4) (10,820.6)
Enacted income tax rate (%) applicable to the Company # 34.608% 34.608%
Income tax credit calculated at enacted income tax rate (112.3) (3,744.8)
Effect of income that is exempt from tax (1,505.8) (1,258.6)
Effect of expenses that are not deductible 77.7 358.8
Effect of incremental deduction on account of research and development and other allowances (2,959.5) (2,438.3)
Investment allowance u/s 32AC of Income Tax Act, 1961 (234.5) (259.4)
Withholding tax in respect of income earned outside India 25.1 54.5
Effect of unused tax losses and tax offsets not recognised as deferred tax assets 4,734.4 7,342.3
Income tax expense recognised in profit or loss 25.1 54.5
# The tax rate used for reconciliation above is the corporate tax rate of 34.608% at which the Company is liable to pay tax on taxable income under the Indian Tax Law.

CORPORATE OVERVIEW STATUTORY REPORTS FINANCIAL STATEMENTS01-07 08-79 80-278
1 3 1A N N UA L R E P O RT 2 0 1 6 - 1 7
NOTES TO THE STANDALONE FINANCIAL STATEMENTS FOR THE YEAR ENDED MARCH 31, 2017
Note 40
CONTINGENT LIABILITIES AND COMMITMENTS (TO THE EXTENT NOT PROVIDED FOR)
` in Million As at As at As at
March 31, 2017 March 31, 2016 April 01, 2015i Contingent liabilities
a Claims against the Company not acknowledged as debts 355.0 149.4 127.1
b Liabilities disputed - appeals filed with respect to :
Income tax on account of disallowances / additions 45,998.3 19,026.8 11,087.7
Sales tax on account of rebate / classification 45.7 38.8 37.9
Excise duty on account of valuation / cenvat credit 1,102.2 1,016.1 164.5
ESIC contribution on account of applicability 132.8 0.2 0.2
Service tax on certain services performed outside India under reverse charge basis
- - 156.0
Drug Price Equalisation Account [DPEA] on account of demand towards unintended benefit, enjoyed by the Company
3,488.2 3,326.4 3,248.0
Demand by JDGFT for import duty with respect to import alleged to be in excess of entitlement as per the advanced license scheme
16.7 15.4 15.4
Fine imposed for anti-competitive settlement agreement by European Commission
715.4 773.0 689.1
Octroi demand on account of rate difference 171.0 171.0 171.0
Other matters - state electricity board, Punjab Land Preservation Act related matters etc.
67.5 88.3 136.3
Legal ProceedingsThe Company and / or its subsidiaries are involved in various legal proceedings including product liability, contracts, employment claims, anti-trust and other regulatory matters relating to conduct of its business. The Company records a provision in the financial statements to the extent that it concludes that a liability is probable and estimable based on the status of these cases, advice of the counsel, management assessment of the likely damages etc. The Company carries product liability insurance / is contractually indemnified by the manufacturer, for an amount it believes is sufficient for its needs. In respect of other claims, the Company believes, these claims do not constitute material litigation matters and with its meritorious defences the ultimate disposition of these matters are not expected to have material adverse effect on its Financial Statements.
c Others :
Trade commitments - - 530.6
Letter of comfort on behalf of subsidiaries, to the extent of limits - - 2873.1
Footnote:
Future cash outflows in respect of the above matters are determinable only on receipt of judgements / decisions pending at various forums / authorities.
ii Commitmentsa Estimated amount of contracts remaining to be executed on capital
account [net of advances]. 4,235.4 3,098.8 2,535.8
b Uncalled liability on partly paid investments 0.5 0.5 0.5
c For derivatives related commitments refer Note 45
d For non-cancellable lease related commitments refer Note 49
e Letters of credit for imports 2,312.0 740.2 1,020.5
iii Guarantees given by the bankers on behalf of the Company 1,961.3 502.1 435.9

S U N P H A R M A C E U T I C A L I N D U S T R I E S L I M I T E D1 3 2
NOTES TO THE STANDALONE FINANCIAL STATEMENTS FOR THE YEAR ENDED MARCH 31, 2017
Note 41
RESEARCH AND DEVELOPMENT EXPENDITURE` in Million
Year ended Year ended March 31, 2017 March 31, 2016
Revenue, net (excluding depreciation) (Refer Note 38) 8,281.7 7,750.2
Capital 1,392.3 543.7
Total 9,674.0 8,293.9
Note 42
CATEGORIES OF FINANCIAL INSTRUMENTS ` in Million
As at March 31, 2017
Fair value throughprofit
or loss
Fair value through other
comprehensive income
Amortised cost
Financial assets Investments Equity instruments / bonds - quoted - 665.2 - Equity instruments / Preference shares / Mutual fund - unquoted 802.7 - - Government securities - unquoted (` 10,000) - - 0.0 Loans to employees / others - - 186.7 Deposits Account - Pledged with Government Authorities - - 1.0 Security deposits - - 412.8 Trade receivables - - 27,256.7 Cash and cash equivalents - - 1,507.8 Bank balances other than above - - 130.3 Interest accrued - - 0.1 Insurance claim receivables - - 1.6 Other receivables - - 40.5 Mandatorily measured : Derivatives not designated as hedges 1,205.8 - -
2,008.5 665.2 29,537.5 Financial liabilities Borrowings - - 60,466.1 Interest accrued - - 69.9 Trade payables - - 20,942.0 Unpaid dividends - - 76.7 Security deposits - - 135.3 Payables on purchase of property, plant and equipment - - 1,143.3 Product settlement, claims, recall charges and trade commitments - - 14,298.5 Derivatives designated as hedges 26.6 - - Mandatorily measured :
Derivatives not designated as hedges 72.6 - - 99.2 - 97,131.8

CORPORATE OVERVIEW STATUTORY REPORTS FINANCIAL STATEMENTS01-07 08-79 80-278
1 3 3A N N UA L R E P O RT 2 0 1 6 - 1 7
NOTES TO THE STANDALONE FINANCIAL STATEMENTS FOR THE YEAR ENDED MARCH 31, 2017
` in MillionAs at March 31, 2016
Fair value through profit
or loss
Fair value through other
comprehensive income
Amortised cost
Financial assets Investments Equity instruments / bonds - quoted - 112.3 - Equity instruments / Preference shares / Mutual fund - unquoted 402.6 - - Government securities - unquoted (` 10,000) - - 0.0 Commercial paper - unquoted - - 735.6 Loans to related parties - - 4.4 Loans to employees / others - - 290.7 Deposits Account - Pledged with Government Authorities - - 1.0 Security deposits - - 445.7 Trade receivables - - 19,978.1 Cash and cash equivalents - - 1,543.4 Bank balances other than above - - 147.7 Insurance claim receivables - - 6.4 Other receivables - - 46.9 Mandatorily measured : Derivatives not designated as hedges 1,534.6 - -
1,937.2 112.3 23,199.9 Financial liabilities Borrowings - - 58,288.4 Interest accrued - - 96.7 Trade payables - - 17,724.5 Unpaid dividends - - 72.8 Security deposits - - 132.3 Payables on purchase of property, plant and equipment - - 838.5 Product settlement, claims, recall charges and trade commitments - - 14,674.5 Others - - 44.2 Mandatorily measured : Derivatives not designated as hedges 216.1 - -
216.1 - 91,871.9
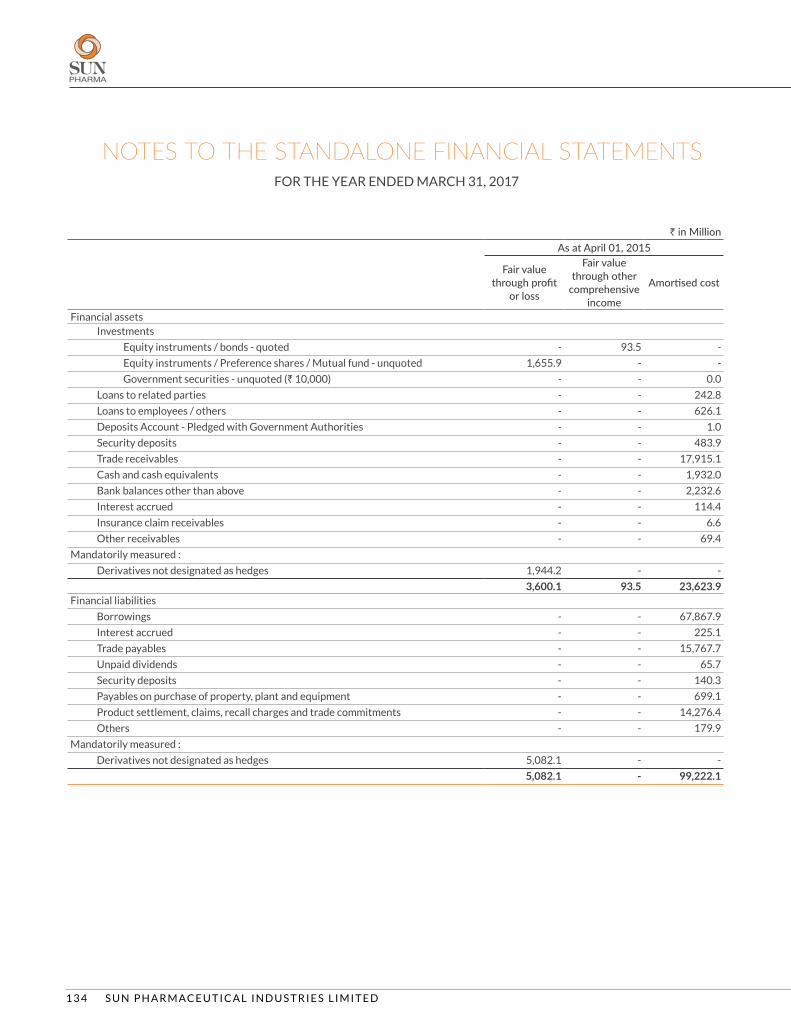
S U N P H A R M A C E U T I C A L I N D U S T R I E S L I M I T E D1 3 4
NOTES TO THE STANDALONE FINANCIAL STATEMENTS FOR THE YEAR ENDED MARCH 31, 2017
` in MillionAs at April 01, 2015
Fair value through profit
or loss
Fair value through other
comprehensive income
Amortised cost
Financial assets Investments
Equity instruments / bonds - quoted - 93.5 -
Equity instruments / Preference shares / Mutual fund - unquoted 1,655.9 - -
Government securities - unquoted (` 10,000) - - 0.0
Loans to related parties - - 242.8
Loans to employees / others - - 626.1
Deposits Account - Pledged with Government Authorities - - 1.0
Security deposits - - 483.9
Trade receivables - - 17,915.1
Cash and cash equivalents - - 1,932.0
Bank balances other than above - - 2,232.6
Interest accrued - - 114.4
Insurance claim receivables - - 6.6
Other receivables - - 69.4
Mandatorily measured :
Derivatives not designated as hedges 1,944.2 - -
3,600.1 93.5 23,623.9Financial liabilities
Borrowings - - 67,867.9
Interest accrued - - 225.1
Trade payables - - 15,767.7
Unpaid dividends - - 65.7
Security deposits - - 140.3
Payables on purchase of property, plant and equipment - - 699.1
Product settlement, claims, recall charges and trade commitments - - 14,276.4
Others - - 179.9
Mandatorily measured :
Derivatives not designated as hedges 5,082.1 - -
5,082.1 - 99,222.1

CORPORATE OVERVIEW STATUTORY REPORTS FINANCIAL STATEMENTS01-07 08-79 80-278
1 3 5A N N UA L R E P O RT 2 0 1 6 - 1 7
NOTES TO THE STANDALONE FINANCIAL STATEMENTS FOR THE YEAR ENDED MARCH 31, 2017
Note 43
FAIR VALUE HIERARCHY ` in Million
As at March 31, 2017
Level 1 Level 2 Level 3Financial assets and liabilities measured at fair value on a recurring basis at the end of each reporting period Financial assets
Investments in equity - quoted # 105.1 - -
Investments in equity - unquoted - - 2.6
Investments in government securities 560.1 - -
Investments in preference shares - - 400.0
Mutual funds 400.1 - -
Derivatives not designated as hedges - 1,205.8 -
1,065.3 1,205.8 402.6
Financial liabilities
Derivatives not designated as hedges - 72.6 -
Derivatives designated as hedges - 26.6 -
- 99.2 -
` in MillionAs at March 31, 2016
Level 1 Level 2 Level 3Financial assets and liabilities measured at fair value on a recurring basis at the end of each reporting period
Financial assets
Investments in equity - quoted # 112.3 - -
Investments in equity - unquoted - - 2.6
Investments in preference shares - - 400.0
Derivatives not designated as hedges - 1534.6 -
112.3 1,534.6 402.6
Financial liabilities
Derivatives not designated as hedges - 216.1 -
- 216.1 -
` in MillionAs at April 01, 2015
Level 1 Level 2 Level 3Financial assets and liabilities measured at fair value on a recurring basis at the end of each reporting period
Financial assets
Investments in equity - quoted # 93.5 - -
Investments in equity - unquoted - - 2.6
Investments in preference shares - - 802.6

S U N P H A R M A C E U T I C A L I N D U S T R I E S L I M I T E D1 3 6
NOTES TO THE STANDALONE FINANCIAL STATEMENTS FOR THE YEAR ENDED MARCH 31, 2017
` in MillionAs at April 01, 2015
Level 1 Level 2 Level 3 Mutual funds 850.7 - -
Derivatives not designated as hedges - 1,944.2 -
944.2 1,944.2 805.2
Financial liabilities
Derivative not designated as hedge - 5,082.1 -
- 5,082.1 -
Level 1 inputs are quoted prices (unadjusted) in active markets for identical assets or liabilities that the entity can access at the measurement
date.
Level 2 inputs are inputs, other than quoted prices included within Level 1, that are observable for the asset or liability, either directly or
indirectly.
Level 3 inputs are unobservable inputs for the asset or liability.
The investments included in Level 3 of fair value hierarchy have been valued using the cost approach to arrive at their fair value. The cost of
unquoted investments approximates the fair value because there is wide range of possible fair value measurements and the costs represents
estimate of fair value within that range.
# These investments in equity instruments are not held for trading. Instead, they are held for medium or long-term strategic purpose. Upon
the application of Ind AS 109, the Company has chosen to designate these investments in equity instruments as at fair value through other
comprehensive income as the management believes that this provides a more meaningful presentation for medium or long-term strategic
investments, than reflecting changes in fair value immediately in profit or loss.
There were no transfers between Level 1 and 2 in the periods.
The management considers that the carrying amount of financial assets and financial liabilities carried as amortised cost approximates their
fair value.
Reconciliation of Level 3 fair value measurements
` in Million Year ended Year ended
March 31, 2017 March 31, 2016Unlisted shares valued at fair value
Balance at the beginning of the year 402.6 805.2
Purchases - -
Issues - -
Disposal / settlements - (402.6)
Balance at the end of the year 402.6 402.6

CORPORATE OVERVIEW STATUTORY REPORTS FINANCIAL STATEMENTS01-07 08-79 80-278
1 3 7A N N UA L R E P O RT 2 0 1 6 - 1 7
NOTES TO THE STANDALONE FINANCIAL STATEMENTS FOR THE YEAR ENDED MARCH 31, 2017
Note 44
CAPITAL MANAGEMENT
The Company’s capital management objectives are:
- to ensure the Company’s ability to continue as a going concern; and
- to provide an adequate return to shareholders through optimisation of debts and equity balance.
The Company monitors capital on the basis of the carrying amount of debt less cash and cash equivalents as presented on the face of the
financial statements. The Company’s objective for capital management is to maintain an optimum overall financial structure.
(i) Debt equity ratio
` in Million As at As at As at
March 31, 2017 March 31, 2016 April 01, 2015Debt (includes non-current, current borrowings and current maturities of long term debt)
60,466.1 58,288.4 67,867.9
Less : cash and cash equivalents 1,507.8 1,543.4 1,932.0
Net debt 58,958.3 56,745.0 65,935.9
Total equity 208,715.1 218,907.0 238,529.2
Net debt to total equity ratio 28.2% 25.9% 27.6%
(ii) Dividend on equity shares paid during the year
` in Million Year ended Year ended
March 31, 2017 March 31, 2016Dividend on equity shares
Final dividend for the year ended March 31, 2016 of ` 1.0 (previous year for year ended March 31, 2015 ` 3.0) per fully paid share
2,406.8 7,219.5
Dividend distribution tax on above 74.7 1,469.7
Dividends not recognised at the end of the reporting period
The Board of Directors at its meeting held on May 26, 2017 have recommended payment of final dividend of ` 3.5 per share of face value of ` 1 each for the year ended March 31, 2017. The same amounts to ` 8,397.6 Million.This proposed dividend is subject to the approval of shareholders in the ensuing annual general meeting and hence not recognised as liability.
Note 45
FINANCIAL RISK MANAGEMENT
The Company’s activities expose it to a variety of financial risks, including market risk, credit risk and liquidity risk. The Company’s risk
management assessment and policies and processes are established to identify and analyze the risks faced by the Company, to set
appropriate risk limits and controls, and to monitor such risks and compliance with the same. Risk assessment and management policies and
processes are reviewed regularly to reflect changes in market conditions and the Company’s activities.
Credit risk Credit risk is the risk of financial loss to the Company if a customer or counterparty to a financial instrument fails to meet its contractual
obligations, and arises principally from the Company’s receivables from customers, loans and investments. Credit risk is managed through

S U N P H A R M A C E U T I C A L I N D U S T R I E S L I M I T E D1 3 8
NOTES TO THE STANDALONE FINANCIAL STATEMENTS FOR THE YEAR ENDED MARCH 31, 2017
credit approvals, establishing credit limits and continuously monitoring the creditworthiness of counterparty to which the Company grants
credit terms in the normal course of business.
Investments
The Company limits its exposure to credit risk by generally investing in liquid securities and only with counterparties that have a good
credit rating. The Company does not expect any losses from non-performance by these counter-parties, and does not have any significant
concentration of exposures to specific industry sectors or specific country risks.
Trade receivables
The Company has used expected credit loss (ECL) model for assessing the impairment loss. For the purpose, the Company uses a provision
matrix to compute the expected credit loss amount. The provision matrix takes into account external and internal risk factors and historical
data of credit losses from various customers.
` in Million As at As at As at
March 31, 2017 March 31, 2016 April 01, 2015Financial assets for which loss allowances is measured using the expected credit loss
Trade receivables
less than 180 days 21,052.2 16,775.5 15,059.8 180 - 365 days 3,555.6 2,335.8 1,506.7 beyond 365 days 3,858.6 2,171.3 1,929.5Total 28,466.4 21,282.6 18,496.0
` in Million Year ended Year ended
March 31, 2017 March 31, 2016Movement in the expected credit loss allowance on trade receivables
Balance at the beginning of the year 1,304.5 580.9
Addition 72.6 728.0
Write - offs - -
Recoveries (167.4) (4.4)
Balance at the end of the year 1,209.7 1,304.5
Liquidity riskLiquidity risk is the risk that the Company will not be able to meet its financial obligations as they become due. The Company manages its
liquidity risk by ensuring, as far as possible, that it will always have sufficient liquidity to meet its liabilities when due, under both normal and
stressed conditions, without incurring unacceptable losses or risk to the Company’s reputation.
The Company has unutilised working capital lines from banks of ` 32,128.0 Million as on March 31, 2017, ` 27,718.7 Million as on March 31,
2016, ` 30,177.9 Million as on April 01, 2015

CORPORATE OVERVIEW STATUTORY REPORTS FINANCIAL STATEMENTS01-07 08-79 80-278
1 3 9A N N UA L R E P O RT 2 0 1 6 - 1 7
NOTES TO THE STANDALONE FINANCIAL STATEMENTS FOR THE YEAR ENDED MARCH 31, 2017
The table below provides details regarding the contractual maturities of significant financial liabilities :
` in Million
Less than 1 year
1 - 3 yearsMore than 3
yearsAs at
March 31, 2017
Non derivative
Borrowings 53,042.1 7,555.7 75.7 60,673.5
Trade payables 20,942.0 - - 20,942.0
Other financial liabilities 15,816.1 6.8 - 15,822.9
89,800.2 7,562.5 75.7 97,438.4
Derivative
Forward exchange contracts 99.2 - - 99.2
99.2 - - 99.2
` in Million
Less than 1 year 1 - 3 years More than 3
yearsAs at
March 31, 2016Non derivative
Borrowings 39,060.0 19,246.3 46.4 58,352.7
Trade payables 17,724.5 - - 17,724.5
Other financial liabilities 16,070.2 4.9 - 16,075.1
72,854.7 19,251.2 46.4 92,152.3
Derivative
Forward exchange contracts 160.7 - - 160.7
Currency options 55.4 - - 55.4
216.1 - - 216.1
` in Million
Less than 1 year 1 - 3 years More than 3
yearsAs at
April 01, 2015Non derivative
Borrowings 56,403.7 11,641.4 61.8 68,106.9
Trade payables 15,767.7 - - 15,767.7
Other financial liabilities 20,452.7 3.4 - 20,456.1
92,624.1 11,644.8 61.8 104,330.7
Derivative
Forward exchange contracts 4,869.6 212.5 - 5,082.1
4,869.6 212.5 - 5,082.1
Market risk Market risk is the risk of loss of future earnings, fair values or future cash flows that may result from adverse changes in market rates and
prices (such as interest rates, foreign currency exchange rates and commodity prices) or in the price of market risk-sensitive instruments as
a result of such adverse changes in market rates and prices. Market risk is attributable to all market risk-sensitive financial instruments, all
foreign currency receivables and payables and all short term and long-term debt. The Company is exposed to market risk primarily related
to foreign exchange rate risk, interest rate risk and the market value of its investments. Thus, the Company’s exposure to market risk is a
function of investing and borrowing activities and revenue generating and operating activities in foreign currencies.

S U N P H A R M A C E U T I C A L I N D U S T R I E S L I M I T E D1 4 0
NOTES TO THE STANDALONE FINANCIAL STATEMENTS FOR THE YEAR ENDED MARCH 31, 2017
Foreign exchange risk
The Company’s foreign exchange risk arises from its foreign operations, foreign currency revenues and expenses, (primarily in US Dollars,
Euros, South African Rand and Russian Rouble) and foreign currency borrowings (primarily in US Dollars). As a result, if the value of the
Indian rupee appreciates relative to these foreign currencies, the Company’s revenues and expenses measured in Indian rupees may decrease
or increase and vice-versa. The exchange rate between the Indian rupee and these foreign currencies have changed substantially in recent
periods and may continue to fluctuate substantially in the future. Consequently, the Company uses both derivative and non-derivative
financial instruments, such as foreign exchange forward contracts, option contracts, currency swap contracts and foreign currency financial
liabilities, to mitigate the risk of changes in foreign currency exchange rates in respect of its highly probable forecasted transactions and
recognized assets and liabilities.
a)Significantforeigncurrencyriskexposurerelatingtotradereceivables,cashandcashequivalents,borrowingsandtradepayables` in Million
As atMarch 31, 2017
US Dollars EuroRussian Rouble
South African
RandOthers Total
Financial assetsTrade receivables 11,804.4 1,918.4 1,723.5 5,046.2 1,117.9 21,610.4 Cash and cash equivalents 909.6 37.3 18.0 - 11.7 976.6
12,714.0 1,955.7 1,741.5 5,046.2 1,129.6 22,587.0 Financial liabilities
Borrowings 37,356.5 - - - - 37,356.5 Trade payables 4,828.8 882.5 0.3 161.4 270.1 6,143.1 Product settlement, claims, recall charges and trade commitments
14,298.5 - - - - 14,298.5
56,483.8 882.5 0.3 161.4 270.1 57,798.1
` in MillionAs at
March 31, 2016
US Dollars Euro Russian Rouble
South African Rand Others Total
Financial assets
Trade receivables 10,164.3 1,620.1 1,194.1 2,087.2 986.3 16,052.0
Cash and cash equivalents 1,179.4 69.1 26.0 - 23.2 1,297.7
11,343.7 1,689.2 1,220.1 2,087.2 1,009.5 17,349.7
Financial liabilities
Borrowings 50,092.6 - - - - 50,092.6
Trade payables 5,132.4 1,250.5 2.6 149.1 464.1 6,998.7
Product settlement, claims, recall charges and trade commitments
14,674.5 - - - - 14,674.5
69,899.5 1,250.5 2.6 149.1 464.1 71,765.8

CORPORATE OVERVIEW STATUTORY REPORTS FINANCIAL STATEMENTS01-07 08-79 80-278
1 4 1A N N UA L R E P O RT 2 0 1 6 - 1 7
NOTES TO THE STANDALONE FINANCIAL STATEMENTS FOR THE YEAR ENDED MARCH 31, 2017
` in MillionAs at
April 01, 2015
US Dollars Euro Russian Rouble
South African Rand Others Total
Financial assets
Trade receivables 10,786.1 1,159.9 1,240.4 579.8 739.4 14,505.6
Cash and cash equivalents 400.4 13.2 70.2 - 53.2 537.0
11,186.5 1,173.1 1,310.6 579.8 792.6 15,042.6
Financial liabilities
Borrowings 45,435.4 - - - - 45,435.4
Trade payables 1,752.8 471.2 63.4 1.1 259.5 2,548.0
Product settlement, claims, recall charges and trade commitments
14,276.4 - - - - 14,276.4
61,464.6 471.2 63.4 1.1 259.5 62,259.8
b) Sensitivity For the years ended March 31, 2017, March 31, 2016 and April 01, 2015, every 5% strengthening in the exchange rate between the
Indian rupee and the respective currencies for the above mentioned financial assets/liabilities would decrease the Company’s loss and
increase the Company’s equity by approximately ` 1,760.6 Million, ` 2,720.8 Million and ` 2,360.9 Million respectively. A 5% weakening
of the Indian rupee and the respective currencies would lead to an equal but opposite effect.
In management’s opinion, the sensitivity analysis is unrepresentative of the inherent foreign exchange risk because the exposure at the
end of the reporting period does not reflect the exposure during the year.
c) Derivativecontracts The Company is exposed to exchange rate risk that arises from its foreign exchange revenues and expenses, primarily in US Dollars,
Euros, South African Rand and Russian Rouble, and foreign currency debt in primarily in US Dollars. The Company uses foreign currency
forward contracts, foreign currency option contracts and currency swap contracts (collectively, “derivatives”) to mitigate its risk of
changes in foreign currency exchange rates. The counterparty for these contracts is generally a bank or a financial institution.
Hedges of highly probable forecasted transactions
The Company designates its derivative contracts that hedge foreign exchange risk associated with its highly probable forecasted
transactions as cash flow hedges and measures them at fair value. The effective portion of such cash flow hedges is recorded as in other
comprehensive income, and re-classified in the income statement as revenue in the period corresponding to the occurrence of the
forecasted transactions. The ineffective portion of such cash flow hedges is immediately recorded in the statement of profit and loss.
In respect of the aforesaid hedges of highly probable forecasted transactions, the Company has recorded a loss of ` 26.6 Million for the
year ended March 31, 2017 and ` Nil for the year ended March 31, 2016 in other comprehensive income. The Company also recorded
hedges as a component of revenue, loss of ` 521.5 Million for the year ended March 31, 2017 and ` Nil for the year ended March 31,
2016 on occurrence of forecasted sale transaction.
Changes in the fair value of forward contracts and option contracts that economically hedge monetary assets and liabilities in foreign
currencies, and for which no hedge accounting is applied, are recognised in the statement of profit and loss. The changes in fair value
of the forward contracts and option contracts, as well as the foreign exchange gains and losses relating to the monetary items, are
recognised in the statement of profit and loss.

S U N P H A R M A C E U T I C A L I N D U S T R I E S L I M I T E D1 4 2
NOTES TO THE STANDALONE FINANCIAL STATEMENTS FOR THE YEAR ENDED MARCH 31, 2017
The following table gives details in respect of the notional amount of outstanding foreign exchange derivative contracts -
Amount in MillionCurrency Buy / Sell Cross As at As at As at
Currency March 31, 2017 March 31, 2016 April 01, 2015Derivatives designated as hedges Forward contracts ZAR Sell USD $ 22.0 - -Derivatives not designated as hedges Forward contracts USD Sell INR - $ 140.0 $ 350.0 Forward contracts USD Buy INR $ 22.5 $ 14.0 $ 170.0 Forward contracts AUD Sell USD $ 1.3 - - Forward contracts RUB Sell USD $ 12.0 - - Currency cum interest rate swaps USD Buy INR $ 50.0 $ 50.0 $ 100.0 Currency options USD Buy INR $ 100.0 $ 100.0 $ 100.0 Currency options * USD Buy INR - $ 1.0 $ 71.0 Interest rate swaps USD Buy INR $ 150.0 $ 40.0 - Currency swaps USD Buy INR - - $ 30.0 Forward contracts ZAR Sell INR - - ZAR 42.5
* structured options @ 2 to 2.5 times
Interest rate risk The Company has loan facilities on floating interest rate, which exposes the Company to risk of changes in interest rates. The Company’s
Treasury Department monitors the interest rate movement and manages the interest rate risk by evaluating interest rate swaps etc. based on
the market / risk perception.
For the years ended March 31, 2017 and March 31, 2016, every 50 basis point decrease in the floating interest rate component applicable
to its loans and borrowings would decrease the Company’s loss by approximately ` 160.5 Million and ` 221.5 Million respectively. A 50 basis
point increase in floating interest rate would have led to an equal but opposite effect.
Commodity rate risk Exposure to market risk with respect to commodity prices primarily arises from the Company’s purchases and sales of active pharmaceutical
ingredients, including the raw material components for such active pharmaceutical ingredients. These are commodity products, whose prices
may fluctuate significantly over short periods of time. The prices of the Company’s raw materials generally fluctuate in line with commodity
cycles, although the prices of raw materials used in the Company’s active pharmaceutical ingredients business are generally more volatile.
Cost of raw materials forms the largest portion of the Company’s cost of revenues. Commodity price risk exposure is evaluated and managed
through operating procedures and sourcing policies. As of March 31, 2017, the Company had not entered into any material derivative
contracts to hedge exposure to fluctuations in commodity prices.

CORPORATE OVERVIEW STATUTORY REPORTS FINANCIAL STATEMENTS01-07 08-79 80-278
1 4 3A N N UA L R E P O RT 2 0 1 6 - 1 7
NOTES TO THE STANDALONE FINANCIAL STATEMENTS FOR THE YEAR ENDED MARCH 31, 2017
Note 46
DISCLOSURES UNDER THE MICRO, SMALL AND MEDIUM ENTERPRISES DEVELOPMENT ACT, 2006The information regarding Micro and Small Enterprises has been determined to the extent such parties have been identified on the basis of
information available with the Company. This has been relied upon by the auditors.
` in Million As at As at As at
March 31, 2017 March 31, 2016 April 01, 2015Principal amount remaining unpaid to any supplier as at the end of the accounting year
116.7
(Interest - Nil)
87.4
(Interest - Nil)
94.0
(Interest - Nil)
Interest due thereon remaining unpaid to any supplier as at the end of the accounting year
- - -
The amount of interest paid along with the amounts of the payment made to the supplier beyond the appointed day
- - -
The amount of interest due and payable for the year - - -
The amount of interest accrued and remaining unpaid at the end of the accounting year
- - -
The amount of further interest due and payable even in the succeeding year, until such date when the interest dues as above are actually paid
- - -
116.7 87.4 94.0
Note 47
EARNINGS PER SHARE Year ended Year ended
March 31, 2017 March 31, 2016Loss for the year (` in Million)- used as numerator for calculating earnings per share (349.5) (10,875.1)
Weighted average number of shares used in computing basic earnings per share 2,403,319,673 2,406,379,179
Add : Dilution effect of employee stock option 203,455 1,059,730
Weighted average number of shares used in computing diluted earnings per share 2,403,523,128 2,407,438,909
Nominal value per share (in `) 1 1
Basic earnings per share (in `) (0.1) (4.5)
Diluted earnings per share (in `) (0.1 ) (4.5)
Since the Company has loss for the year and in the previous year, the impact of employee stock option is anti dilutive. Therefore the basic
and diluted earnings per share are the same.

S U N P H A R M A C E U T I C A L I N D U S T R I E S L I M I T E D1 4 4
NOTES TO THE STANDALONE FINANCIAL STATEMENTS FOR THE YEAR ENDED MARCH 31, 2017
Note 48
EMPLOYEE BENEFIT PLANS DefinedcontributionplanContributions are made to Regional Provident Fund (RPF), Family Pension Fund, Employees State Insurance Scheme (ESIC) and other Funds
which covers all regular employees. While both the employees and the Company make predetermined contributions to the Provident Fund
and ESIC, contribution to the Family Pension Fund and other Statutory Funds are made only by the Company. The contributions are normally
based on a certain percentage of the employee’s salary. Amount recognised as expense in respect of these defined contribution plans,
aggregate to ` 608.1 Million (Previous year ` 587.9 Million).
` in Million Year ended Year ended
March 31, 2017 March 31, 2016Contribution to Provident Fund and Family Pension Fund 507.3 474.7
Contribution to Superannuation Fund 74.9 90.3
Contribution to ESIC and Employees Deposit Linked Insurance (EDLI) 25.8 22.8
Contribution to Labour Welfare Fund 0.1 0.1
The Company has an obligation towards provident fund with respect to certain employees upto March 31, 2015 which was recognised as
defined benefit plan. From the previous year the contribution for the same is made to RPF and the Company does not have any obligation apart
from such contribution. Accordingly, from previous year, the provident fund is recognised as defined contribution plan.
Definedbenefitplana) Gratuity
In respect of Gratuity, a defined benefit plan, contributions are made to LIC’s Recognised Group Gratuity Fund Scheme. It is governed by the
Payment of Gratuity Act, 1972. Under the Gratuity Act, employees are entitled to specific benefit at the time of retirement or termination of
the employment on completion of five years or death while in employment. The level of benefit provided depends on the member’s length of
service and salary at the time of retirement/termination age. Provision for Gratuity is based on actuarial valuation done by an independent
actuary as at the year end. Each year, the Company reviews the level of funding in gratuity fund. The Company decides its contribution based
on the results of its annual review. The Company aims to keep annual contributions relatively stable at a level such that the fund assets meets
the requirements of gratuity payments in short to medium term.
b) Pension fund
The Company has an obligation towards pension, a defined benefit retirement plan, with respect to certain employees, who had already retired
before March 01, 2013, will continue to receive the pension as per the pension plan.
These plans typically expose the Company to actuarial risks such as: investment risk, interest rate risk, longevity risk and salary risk.
i) Investment risk - The present value of the defined benefit plan liability is calculated using a discount rate determined by reference to the
market yields on government bonds denominated in Indian Rupees. If the actual return on plan asset is below this rate, it will create a plan
deficit. However, the risk is partially mitigated by investment in LIC managed fund.
ii) Interest rate risk - A decrease in the bond interest rate will increase the plan liability. However, this will be partially offset by an increase in
the return on the plan’s debt investments.
iii) Longevity risk - The present value of the defined benefit plan liability is calculated by reference to the best estimate of the mortality of plan
participants both during and after their employment. An increase in the life expectancy of the plan participants will increase the plan’s liability.
iv) Salary risk - The present value of the defined benefit plan liability is calculated by reference to the future salaries of plan participants. As
such, an increase in the salary of the plan participants will increase the plan’s liability.

CORPORATE OVERVIEW STATUTORY REPORTS FINANCIAL STATEMENTS01-07 08-79 80-278
1 4 5A N N UA L R E P O RT 2 0 1 6 - 1 7
NOTES TO THE STANDALONE FINANCIAL STATEMENTS FOR THE YEAR ENDED MARCH 31, 2017
OtherlongtermbenefitplanActuarial Valuation for Compensated Absences is done as at the year end and the provision is made as per Company rules with corresponding
charge to the Statement of Profit and Loss amounting to ` 331.0 Million (Previous Year ` 313.8 Million) and it covers all regular employees.
Major drivers in actuarial assumptions, typically, are years of service and employee compensation.
Obligation in respect of defined benefit plan and other long term employee benefit plans are actuarially determined as at the year end using
the ‘Projected Unit Credit’ method. Gains and losses on changes in actuarial assumptions relating to defined benefit obligation are recognised
in other comprehensive income whereas gains and losses in respect of other long term employee benefit plans are recognised in the Statement
of Profit and Loss.
` in MillionYear ended
March 31, 2017Year ended
March 31, 2016
Pension Fund (Unfunded)
Provident Fund
(Funded)
Gratuity (Funded)
Pension Fund (Unfunded)
Provident Fund
(Funded)
Gratuity (Funded)
Expense recognised in the statement of profit and loss (Refer Note 35)
Current service cost - - 179.2 - - 166.0Interest cost 70.2 592.6 163.7 76.6 347.6 139.5Expected return on plan assets - (598.5) (130.4) - (385.5) (122.8)Recognition of unrecognised liabilities of earlier years
- - - - 3.7 -
Excess of planned assets over commitments not recognised in financial statements
- 5.9 - - 34.2 -
Expense charged to the statement of profit and loss
70.2 - 212.5 76.6 - 182.7
Remeasurement of defined benefit obligation recognised in other comprehensive income
Actuarial loss / (gain) on defined benefit obligation
56.2 - 560.0 (39.7) - 316.0
Actuarial gain on plan assets - - (16.1) - - (9.5)Expense/(income) charged to other comprehensive income
56.2 - 543.9 (39.7) - 306.5
Reconciliation of defined-benefit obligations Obligation as at the beginning of the year 930.7 4,598.6 2,169.0 981.8 4,810.2 1,779.0 Current service cost - - 179.2 - - 166.0 Interest cost 70.2 592.6 163.7 76.6 347.6 139.5 Obligations transferred - 1.8 - - 28.9 -Benefits paid (87.6) (507.6) (197.0) (88.0) (588.1) (231.5)
Obligation transferred to regional provident fund, net of accumulated unrecognised gains
- (4,685.4) - - - -
Actuarial (gains)/losses on obligations - due to change in demographic assumptions
- - 61.8 - - (8.7)
- due to change in financial assumptions 54.5 - 398.6 31.0 - 203.8 - due to experience 1.7 - 99.6 (70.7) - 120.9 Obligation as at the year end 969.5 - 2,874.9 930.7 4,598.6 2,169.0

S U N P H A R M A C E U T I C A L I N D U S T R I E S L I M I T E D1 4 6
NOTES TO THE STANDALONE FINANCIAL STATEMENTS FOR THE YEAR ENDED MARCH 31, 2017
` in Million
As at March 31, 2017 As at March 31, 2016Provident Fund
(Funded)Gratuity (Funded)
Provident Fund (Funded)
Gratuity (Funded)
Reconciliation of liability/(asset) recognised in the Balance sheetPresent value of commitments (as per Actuarial Valuation) - 2,874.9 4,598.6 2,169.0 Fair value of plan assets - (1,913.9) (4,632.8) (1,728.0)Excess of planned assets over commitments not recognised - - (34.2) - Net liability recognised in the financial statement - 961.0 - 441.0
Reconciliation of plan assets Plan assets as at the beginning of the year 4,632.8 1,728.0 4,806.5 1,569.3Expected return 598.5 130.4 385.5 122.8Plan assets transferred 1.8 - 28.9 - Actuarial gain - 16.1 - 9.5Employer’s Contribution during the year - 236.4 - 257.9Benefits paid (507.6) (197.0) (588.1) (231.5)Funds transferred to regional provident fund (4,725.5) - - -Plan assets as at the year end - 1,913.9 4,632.8 1,728.0
` in Million
Year endedMarch 31, 2017
Year endedMarch 31, 2016
Pension Fund (Unfunded)
Gratuity (Funded)
Pension Fund (Unfunded)
Gratuity (Funded)
Provident Fund (Funded)*
Discount rate 6.81% 6.81% 7.54% In range of 7.54% to 7.56%
7.54%
Expected return on plan assets N.A. 6.81% N.A. In range of 7.54% to 7.56%
8.80%
Expected rate of salary increase N.A. 14.50% N.A. 10.00% N.A.
Interest rate guarantee N.A. N.A. N.A. N.A. 8.80%
Mortality Indian Assured Lives Mortality
(2006-08)
Indian Assured Lives Mortality
(2006-08)
Indian Assured Lives Mortality
(2006-08)
Indian Assured Lives Mortality
(2006-08)
Indian Assured Lives Mortality
(2006-08)Withdrawal N.A. 13.50% N.A. 8.00% 15% - 18%
Retirement Age (years) N.A. 60 N.A. 60 60
* During the year, the Company managed Provident fund balance has been transferred to Regional Provident Fund Authority.

CORPORATE OVERVIEW STATUTORY REPORTS FINANCIAL STATEMENTS01-07 08-79 80-278
1 4 7A N N UA L R E P O RT 2 0 1 6 - 1 7
NOTES TO THE STANDALONE FINANCIAL STATEMENTS FOR THE YEAR ENDED MARCH 31, 2017
` in Million
Year endedMarch 31, 2017
Year endedMarch 31, 2016
Pension Fund (Unfunded)
Gratuity (Funded)
Pension Fund (Unfunded)
Gratuity (Funded)
Sensitivity Analysis:
Impact on defined benefit obligation
Delta effect of +1% change in discount rate (73.2) (167.7) (67.6) (103.2)
Delta effect of -1% change in discount rate 86.0 189.7 79.0 115.6
Delta effect of +1% change in salary escalation rate - 174.6 - 111.8
Delta effect of -1% change in salary escalation rate - (158.4) - (101.9)
Delta effect of +1% change in rate of employee turnover - (71.6) - (18.1)
Delta effect of -1% change in rate of employee turnover - 80.3 - 19.9
Maturity analysis of projected benefit obligation
31-Mar-18 87.4 401.2 101.9 415.5
31-Mar-19 100.4 253.8 118.1 252.4
31-Mar-20 115.3 282.0 137.0 267.4
31-Mar-21 132.5 283.2 158.8 290.9
31-Mar-22 152.1 281.0 184.1 305.9
Thereafter 174.8 1,276.5 213.4 1,527.0
The major categories of plan assets are as under
Central government securities - 20.9 - 25.9
Bonds and securities of public sector / financial institutions - 69.3 - 156.3
Insurer managed funds (Funded with LIC, break-up not available) - 1,801.5 - 1,537.2
Surplus fund lying uninvested - 22.2 - 8.6
The contribution expected to be made by the Company for gratuity, during financial year ending March 31, 2018 is ` 372.9 Million (Previous year ` 314.1 Million)

S U N P H A R M A C E U T I C A L I N D U S T R I E S L I M I T E D1 4 8
NOTES TO THE STANDALONE FINANCIAL STATEMENTS FOR THE YEAR ENDED MARCH 31, 2017
Note 49
LEASES
(a) The Company has given certain premises and plant and equipment under operating lease or leave and license agreements. These are
generally not non-cancellable and periods range between 11 months to 10 years under leave and licence / lease and are renewable by mutual
consent on mutually agreeable terms. The Company has received refundable interest free security deposits where applicable in accordance
with the agreed terms. (b) The Company has obtained certain premises for its business operations (including furniture and fittings, therein
as applicable) under operating lease or leave and license agreements. These are generally not non-cancellable and periods range between 11
months to 10 years under leave and licence, or longer for other lease and are renewable by mutual consent on mutually agreeable terms. The
Company has given refundable interest free security deposits in accordance with the agreed terms. These refundable security deposits have
been valued at amortised cost under relevant Ind AS (c) Lease receipts / payments are recognised in the statement of profit and loss under
“Lease rental and hire charges” & “Rent” in Note 32 and 37 respectively. (d) The future minimum lease payments in respect of assets taken on
non-cancellable operating leases are as under -
` in Million As at As at As at
March 31, 2017 March 31, 2016 April 01, 2015Not later than one year 17.1 62.2 64.0
Laterthanoneyearandnotlaterthanfiveyears - 18.2 91.4
Laterthanfiveyears - - 6.3
17.1 80.4 161.7
Note 50
EMPLOYEE SHARE-BASED PAYMENT PLANSErstwhile Ranbaxy Laboratories Limited (RLL) had Employee Stock Option Schemes (“ESOSs”) namely, Employees Stock Option Scheme -II
(ESOS-II), Employees Stock Option Scheme 2005 (ESOS 2005) and Employees Stock Option Plan 2011 (ESOP 2011) for the grant of stock
options to the eligible employees and Directors of the Erstwhile RLL and its subsidiaries. ESOS-II had been discontinued from 17th January,
2015. The ESOSs are administered by the Compensation Committee (“Committee”). Options are granted at the discretion of the Committee to
selected employees depending upon certain criterion. Each option comprises one underlying equity share.
ESOS 2005 provided that the grant price of options would be the latest available closing price on the stock exchange on which the shares of
the erstwhile RLL were listed, prior to the date of the meeting of the Committee in which the options were granted. If the shares are listed on
more than one stock exchange, then the stock exchange where there was highest trading volume on the said date were considered. The options
vested evenly over a period of five years from the date of grant. Options lapse, if they are not exercised prior to the expiry date, which was ten
years from the date of grant.
ESOP 2011 provided that the grant price of options would be the face value of the equity share i.e. ` 5 per share. The options vested evenly
over a period of three years from the date of grant. Options lapse, if they were not exercised prior to the expiry date, which was three months
from the date of the vesting. An ESOP Trust had been formed to administer ESOP 2011. Shares issued to the ESOP Trust were allocated to
the eligible employees upon exercise of stock options from time to time.
The Shareholders’ Committee of Erstwhile RLL had approved issuance of options under the ESOS’s as per details given below:
Date of approval Scheme Original No. of options approved25 June 2003 ESOS-II 4,000,000 30 June 2005 ESOS 2005 4,000,000 09 May 2011 ESOP 2011 3,000,000

CORPORATE OVERVIEW STATUTORY REPORTS FINANCIAL STATEMENTS01-07 08-79 80-278
1 4 9A N N UA L R E P O RT 2 0 1 6 - 1 7
NOTES TO THE STANDALONE FINANCIAL STATEMENTS FOR THE YEAR ENDED MARCH 31, 2017
In accordance with the above approval of issuance of options, stock options have been granted from time to time.
The stock options outstanding as on June 30, 2005 are proportionately adjusted in view of the sub-division of equity shares of the Erstwhile
RLL from the face value of ` 10 each into 2 equity shares of ` 5 each
Pursuant to the Scheme of Amalgamation, Sun Pharmaceutical Industries Limited (‘transferee company’) formulated two Employee Stock
Option Schemes, namely, (i) SUN Employee Stock Option Scheme-2015 (SUN-ESOS 2015) to administer ESOS 2005 (ii) SUN Employee
Stock Option Plan-2015 (SUN-ESOP 2015) to administer ESOP 2011. These scheme provide that the number of transferee options issued
shall equal to the product of number of transferor options outstanding on effectiveness of Scheme multiplied by the Share exchange ratio
(0.80) and each transferee option shall have an exercise price per equity share equal to transferor option exercise price per equity share
divided by the share exchange ratio (0.80) and fractions rounded off to the next higher whole number. The terms and conditions of ESOS,
of transferee company are not less favourable than those of ESOSs of erstwhile RLL. No new grants shall be made under these schemes and
these schemes shall operate only for the purpose of administering the exercise of options already granted / vested on an employee pursuant
to SUN-ESOS 2015 and SUN-ESOP 2015.
The movement of the options (post split) granted under SUN-ESOS 2015
March 31, 2017
Stock options (numbers)
Range of exercise prices (`)
Weighted-average exercise prices (`)
Weighted-average remaining
contractual life (years)
Outstanding at the commencement of the year 610,739 270.0-703.0 480.9 2.5 Exercised during the year $ (62,682) 270.0-562.5 500.1 - Lapsed during the year (146,379) 270.0-562.5 521.7 - Outstanding at the end of the year * 401,678 270.0-562.5 462.9 1.9 Exercisable at the end of the year * 401,678 270.0-562.5 462.9 1.9
* Includes options exercised, pending allotment$ Weighted average share price on the date of exercise ` 690.23
March 31, 2016
Stock options (numbers)
Range of exercise prices (`)
Weighted-average exercise prices (`)
Weighted-average remaining
contractual life (years)
Outstanding at the commencement of the yearNumber of options – post-merger of Erstwhile RLL with the transferee company
1,169,545 270.0-703.0 496.0 3.3
No. of options on Account of rounding off of the fraction to the next higher whole number as per the merger Scheme
41 270.0-703.0 496.0 3.3
Total Number of options outstanding 1,169,586 270.0-703.0 496.0 3.3 Exercised during the year# (447,825) 270.0-703.0 518.9 Lapsed during the year (111,022) 270.0-703.0 479.9 Outstanding at the end of the year^ 610,739 270.0-703.0 480.9 2.5 Exercisable at the end of the year^ 610,739 270.0-703.0 480.9
^ Includes options exercised, pending allotment# Weighted average share price on the date of exercise ` 823.63

S U N P H A R M A C E U T I C A L I N D U S T R I E S L I M I T E D1 5 0
NOTES TO THE STANDALONE FINANCIAL STATEMENTS FOR THE YEAR ENDED MARCH 31, 2017
The movement of the options (post split) granted under SUN-ESOP 2015 for the current year is
March 31, 2017
Stock options (numbers)
Exercise price (`)Weighted-average
exercise prices (`)
Weighted-average remaining
contractual life (years)
Outstanding at the commencement of the year 169,913 6.3 6.3 1.1 Forfeited during the year (11,179) 6.3 6.3 Exercised during the year# (93,015) 6.3 6.3 Lapsed during the year (13,435) 6.3 6.3 Outstanding, end of the year* 52,284 6.3 6.3 0.4 Exercisable at the end of the year* 941 6.3 6.3
* Includes options exercised, pending allotment# Weighted average share price on the date of exercise ` 802.00
March 31, 2016
Stock options (numbers) Exercise price (`) Weighted-average
exercise prices (`)
Weighted-average remaining
contractual life (years)
Outstanding at the commencement of the yearNumber of options – post-merger of Erstwhile RLL with the transferee company
449,430 6.3 6.3 1.7
No. of options on Account of rounding off of the fraction to the next higher whole number as per the merger Scheme
1,368 6.3 6.3 0.9
No of options of certain overseas employees 4,968 6.3 6.3 0.9 Total Number of options outstanding 455,766 6.3 6.3 0.9
Forfeited during the year (43,326) 6.3 6.3 Exercised during the year # ^ (224,201) 6.3 6.3 Lapsed during the year (18,326) 6.3 6.3 Outstanding, end of the year 169,913 6.3 6.3 1.1 Exercisable at the end of the year $ 40,259 6.3 6.3 0.2
$ Include options exercised, pending allotment.
# Shares allotted by the ESOP Trust against the options exercised including 1,066 shares equivalent to 1,333 shares issued by Erstwhile RLL prior to 10th April, 2015.
^ Weighted average share price on the date of exercise ` 848.68
During the current year, the Company has recorded a Stock-based employee compensation expense of ` 30.8 Million (March 31, 2016: ` 90.6 Million). The amount has been determined under a fair value method wherein the grant date fair value of the options was calculated by using Black Scholes pricing model.

CORPORATE OVERVIEW STATUTORY REPORTS FINANCIAL STATEMENTS01-07 08-79 80-278
1 5 1A N N UA L R E P O RT 2 0 1 6 - 1 7
NOTES TO THE STANDALONE FINANCIAL STATEMENTS FOR THE YEAR ENDED MARCH 31, 2017
The following table summarizes the assumptions used in calculating
the grant date fair value for instrument granted in the year ended
March 31, 2015: @@
Particulars Year ended 31 March, 2015Grant Date 08-May-14Dividend yield 0.43%Expected life of options from the date(s) of grant
1.25, 2.25 and 3.25 years
Risk free interest rate 8.57% (1.25 years)8.65% (2.25 years)8.71% (3.25 years)
Expected volatility 40.47%Grant date fair value ` 462.39 (1.25 years)
` 460.79 (2.25 years)` 459.16 (3.25 years)
@@ Assumptions used are as applicable at the date of grant in the context of erstwhile RLL
The Black –Scholes option-pricing model was developed for estimating fair value of trade options that have no vesting restrictions and are fully transferable. Since options pricing models require use of subjective assumptions, changes therein can materially affect fair value of the options. The options pricing models do not necessary provide a reliable measurable of fair value of options. The volatility in the share price is based on volatility of historical stock price of the erstwhile RLL for last 60 months.
Note 51
BORROWINGS
(A) Details of long term borrowings and current maturities of long term debt (included under other current financialliabilities)
(I) Unsecured External Commercial Borrowings (ECBs) has 6
loans aggregating of USD 256 Million (March 31, 2016 : USD
266 Million, April 01, 2015 : USD 288 Million) equivalent
to ` 16,602.9 Million (March 31, 2016 : ` 17,625.2 Million,
April 01, 2015 : ` 18,001.4 Million) [(included in long term
borrowings
` 7,523.2 Million (March 31, 2016 : ` 15,902.4 Million, April
01, 2015 : ` 11,625.9 Million) and in current maturity of
long term debt ` 9,079.7 Million (March 31, 2016 : ` 1,722.8
Million, April 01, 2015 : ` 6,375.5 Million))]. For the ECB loans
outstanding as at March 31, 2017, the terms of repayment for
borrowings are as follows:
(a) USD Nil (March 31, 2016 : USD Nil, April 01, 2015 : USD
50 Million) equivalent to ` Nil (March 31, 2016 : ` Nil,
April 01, 2015 : ` 3,125.2 Million). The loan was taken
on August 12, 2010. The outstanding amount has been
repaid in previous year.
(b) USD Nil (March 31, 2016 : USD Nil, April 01, 2015 : USD
30 Million) equivalent to ` Nil (March 31, 2016 : ` Nil,
April 01, 2015 : ` 1,875.2 Million). The loan was taken on
September 9, 2010. The outstanding amount has been
repaid in previous year.
(c) USD 10 Million (March 31, 2016 : USD 20 Million, April
01, 2015 : USD 30 Million) equivalent to ` 648.6 Million
(March 31, 2016 : ` 1,325.2 Million, April 01, 2015 :
` 1,875.2 Million). The loan was taken on June 30, 2011
and is repayable in 3 equal installments of USD 10 Million
each at the end of 4th year, 5th year and 6th year. Second
installment of USD 10 Million has been repaid in current
year and first installment of USD 10 Million was repaid
in previous year. The last installment is due on June 30,
2017.
(d) USD 50 Million (March 31, 2016 : USD 50 Million, April
01, 2015 : USD 50 Million) equivalent to ` 3,242.8
Million (March 31, 2016 : ` 3,313.0 Million, April 01,
2015 :
` 3,125.2 Million). The loan was taken on September 20,
2012 and is repayable on September 19, 2017.
(e) USD 100 Million (March 31, 2016 : USD 100 Million,
April 01, 2015 : USD 100 Million) equivalent to ` 6,485.5
Million (March 31, 2016 : ` 6,626.0 Million, April 01,
2015: ` 6,250.5 Million). The loan was taken on June 4,
2013 and is repayable on June 3, 2018.
(f) USD Nil (March 31, 2016 : USD 16 Million, April 01,
2015 : USD 28 Million) equivalent to ` Nil (March 31,
2016 :
` 1,060.2 Million, April 01, 2015 : ` 1,750.1 Million).
Loan of USD 40 Million was taken on March 25, 2011
and was repayable in 3 installments viz., 30% each of the
drawn amount at the end of 4th year and 5th year and
40% of the drawn amount at the end of the 6th year.
The last installment of USD 16 Million has been repaid
in current year. First and Second installment of USD 12
Million each has been repaid in previous years.

S U N P H A R M A C E U T I C A L I N D U S T R I E S L I M I T E D1 5 2
NOTES TO THE STANDALONE FINANCIAL STATEMENTS FOR THE YEAR ENDED MARCH 31, 2017
(g) USD 50 Million (March 31, 2016 : USD 50 Million, April 01,
2015 : USD Nil) equivalent to 3,242.8 Million (March 31,
2016 : 3,313.0 Million, April 01, 2015 : Nil). The loan was
taken on August 11, 2015 and is repayable on
August 11, 2017.
(h) USD 30 Million (March 31, 2016 : USD 30 Million, April
01, 2015 : USD Nil) equivalent to ` 1,945.7 Million
(March 31, 2016 : ` 1,987.8 Million, April 01, 2015 :
` Nil). The loan was taken on September 09, 2015 and is
repayable on September 08, 2017.
(i) USD 16 Million (March 31, 2016 : USD Nil, April 01,
2015 : USD Nil) equivalent to ` 1,037.7 Million (March
31, 2016 : ` Nil, April 01, 2015 : ` Nil). The loan was
taken on March 24, 2017 and is repayable on March 22,
2019.
(II) Unsecured Loan under Foreign Currency Non Resident (FCNR
B) Scheme of USD 50 Million (March 31, 2016 : USD 50 Million,
April 01, 2015 : USD Nil) equivalent to ` 3,242.8 Million (March
31, 2016 : ` 3,313.0 Million, April 01, 2015 : ` Nil). The loan was
taken on August 19, 2015 and is repayable on August 18, 2017.
(III) Redeemable non-convertible debentures of ` Nil (March 31,
2016 : ` Nil, April 01, 2015 : ` 5,000.0 Million) issued on
November 23, 2012 for a period of 36 months at a coupon
rate of 9.20% p.a. Such debentures were secured by a pari-
passu first ranking charge on the Company’s specified fixed
assets so as to provide a fixed asset cover of 1.25x and were
listed on the National Stock Exchange. The loan was taken on
November 23, 2012 and has been repaid in previous year.
(IV) Unsecured term loan of ` Nil (March 31, 2016 : ` Nil, April 01,
2015 : ` 2,500.0 Million) has been repaid in previous year.
(V) Secured term loan from department of biotechnology of
` 108.2 Million (March 31, 2016 : ` 77.3 Million, April 01, 2015
: ` 77.3 Million) has been secured by hypothecation of assets
and goods of the Company. The loan is repayable in 10 equal
half yearly installments commencing from December 26, 2018,
last installment is due on June 26, 2023.
The Company has not defaulted on repayment of loan and interest
payment thereon during the year.
(B) Details of securities for Short term Borrowings are as follows:
First charge has been created on a pari-passu basis, by
hypothecation of inventories and receivables, both present
and future.
Note 52
FIRST TIME IND AS ADOPTION RECONCILIATION
Explanation to transition to Ind AS Ind AS 101 -“First-time Adoption of Indian Accounting Standards”
requires that all Ind AS and interpretations that are issued and
effective for the first Ind AS financial statements which is for the year
ended March 31, 2017 for the Company, be applied retrospectively
and consistently for all financial years presented, except for the
Company has availed certain exemptions and complied with the
mandatory exceptions provided in Ind AS 101, as described below.
The Company has recognised all assets and liabilities whose
recognition is required by Ind AS and has not recognised items of
assets or liabilities which are not permitted by Ind AS, reclassified
items from previous GAAP to Ind AS as required under Ind AS and
applied Ind AS in measurement of recognised assets and liabilities.
Set out below are the Ind AS 101 optional exemptions availed as
applicable and mandatory exceptions applied in the transition from
previous GAAP to Ind AS.
Derecognitionoffinancialassetsandfinancialliabilities The Company has applied the derecognition requirements of
financial assets and financial liabilities prospectively for transactions
occurring on or after the transition date.
Hedge accountingAt the date of transition to Ind AS, the Company has measured all
derivatives at fair value through profit or loss and eliminated all
deferred losses and gains arising on derivatives that were reported in
accordance with previous GAAP assets or liabilities.
ClassificationandmeasurementoffinancialassetsThe Company has assessed conditions for classification of the
financial assets on the basis of the facts and circumstances that were
exist on the date of transition to Ind AS.
Determining whether an arrangement contains a lease The Company has applied Appendix C of Ind AS 17 “Determining

CORPORATE OVERVIEW STATUTORY REPORTS FINANCIAL STATEMENTS01-07 08-79 80-278
1 5 3A N N UA L R E P O RT 2 0 1 6 - 1 7
NOTES TO THE STANDALONE FINANCIAL STATEMENTS FOR THE YEAR ENDED MARCH 31, 2017
whether an Arrangement contains a Lease” to determine whether an
arrangement existing at the transition date contains a lease on the
basis of facts and circumstances existing at that date
Deemed cost of property, plant and equipment and intangible assets On transition to Ind AS, the Company has elected to continue with
the carrying value of all of its property, plant and equipment and
intangible assets recognised as at April 01, 2015 measured as per the
previous GAAP and use that carrying value as the deemed cost of the
property, plant and equipment and intangible assets.
DesignationofpreviouslyrecognisedfinancialinstrumentsInd AS 101 allows an entity to designate investments in equity
instruments at FVOCI on the basis of the facts and circumstances as
at the date of transition to Ind AS. The Company has elected to apply
this exemption for its investments in certain equity instruments.
CompoundfinancialinstrumentsUnder Ind AS 32, the Company should split compound financial
instruments into separate equity and liability components. Ind AS 101
provides that if the liability component is no longer outstanding at the
date of transition, a first-time adopter does not have to separate it from
the component instrument. The Company has elected to apply this
exemption for its compound financial instruments.
Fairvaluemeasurementoffinancialassetsandfinancialliabilities at initial recognition The Company has applied the requirements in paragraph B5.1.2A (b)
of Ind AS 109 prospectively to transactions entered into on or after
the date of transition to Ind AS. This exemption has been availed by
the Company.
Non - current assets held for sale and discontinued operations Ind As 105 requires that asset classified as non - current as per Ind
AS 1 are not reclassified as current assets until they meet criteria
to be classified as held for sale. The adopter can opt to either value
those assets at carrying amount or fair value less cost of sale at the
transition date and record any difference between such amount
and carrying value directly to retained earnings. The Company has
applied for this exemption.
Business Combinations Ind AS 101 provides the option to apply Ind AS 103 prospectively
from the transition date or from a specific date prior to the transition
date. This provides relief from full retrospective application that
would require restatement of all business combinations prior to the
transition date.
The Company elected to apply Ind AS 103 prospectively to business
combinations occurring after its transition date. Business combinations
occurring prior to the transition date have not been restated.
Share-based payment transactionsAs per previous GAAP, the Company had applied the fair value
recognition and measurement principles similar to those prescribed
under Ind AS 102 for all options granted before the Transition Date.
Consequently, this exemption was not required to be applied.
Excise dutyUnder the previous GAAP, excise duty was netted off against sale of
products. However, under Ind AS, excise duty is included in sale of
products and is separately presented as expense in the statement of
profit and loss.
` in Million Footnote No. As at As at
March 31, 2016 April 01, 2015Reconciliation of total equityTotal equity as per previous GAAP * 214,830.9 227,713.7
Add / (less) : Adjustments for GAAP differences
Effect of measuring derivative instruments at fair value through profit or loss a 923.2 824.6
Discount / (unwinding of discount) on provisions b 753.7 1,222.1
Recognition of intangible assets not eligible for recognition under Previous GAAP c 30.1 -
Adjustment for proposed dividend (including corporate dividend tax) d 2,481.5 8,689.2
Provision for expected credit losses e (190.5) (113.9)
Other Ind AS adjustments f 78.1 193.5
Total equity as per Ind AS 218,907.0 238,529.2

S U N P H A R M A C E U T I C A L I N D U S T R I E S L I M I T E D1 5 4
NOTES TO THE STANDALONE FINANCIAL STATEMENTS FOR THE YEAR ENDED MARCH 31, 2017
` in Million
Previous GAAP
Effect of transition to
Ind AS (Refer footnote g)
Ind AS
Year ended March 31, 2016Reconciliation of cash flowNet cash flows from operating activities (12,444.5) (100.4) (12,544.9)Net cash flows from investing activities 36,301.9 90.1 36,392.0Net cash flows from financing activities (24,251.2) 570.9 (23,680.3)Net increase / (decrease) in cash and cash equivalents (393.8) 560.6 166.8
* Equity as per previous GAAP includes Share capital, Share suspense account, Reserves and Surplus
Notes on reconciliations between previous GAAP and Ind AS
a) Derivativeinstrumentsatfairvaluethroughprofitorloss Under previous GAAP, derivative instruments entered into for hedging the foreign currency fluctuation risk were accounted for on the
principles of prudence. Pursuant to this, losses, if any, on Mark to Market basis, were recognised and gains were not recognised. Under
Ind AS, gains on derivative instruments have been measured at fair value through profit or loss and gains or losses are recognised in the
statement of profit and loss.
b) Discounting / (unwinding of discount) of provisions Under Ind AS, long term provisions are to be measured at present value at the date of transition.
c) Separately acquired intangible assets Under Ind AS, separately acquired intangible assets shall be capitalised which were not eligible for capitalisation under previous GAAP.
d) Proposed dividend (including dividend distribution tax) Under Ind AS, dividend to holders of equity instruments is recognised as a liability in the period in which the obligation to pay is
established. Under previous GAAP, dividend proposed was recorded as a provision in the period to which it relates.
` in Million Footnote No. Year ended
March 31, 2016Reconciliation of total comprehensive incomeNet profit as per previous GAAP (10,733.6)
Effect of measuring derivative instruments at fair value through profit or loss a 99.4
Effect of measuring investments at fair value through profit or loss a (0.7)
Discount / (unwinding of discount) on provisions b (468.3)
Remeasurement of defined benefit obligation recognised in OCI under Ind AS f 266.8
Recognition of intangible assets not eligible for recognition under Previous GAAP c 30.1
Provision for expected credit losses e (76.7)
Other Ind AS adjustments 7.9
NetprofitasperIndAS (10,875.1)
Other comprehensive income (247.9)
Total comprehensive income as per Ind AS (11,123.0)

CORPORATE OVERVIEW STATUTORY REPORTS FINANCIAL STATEMENTS01-07 08-79 80-278
1 5 5A N N UA L R E P O RT 2 0 1 6 - 1 7
NOTES TO THE STANDALONE FINANCIAL STATEMENTS FOR THE YEAR ENDED MARCH 31, 2017
e) Expected credit loss Under previous GAAP, the Group had created provision for doubtful debts based on specific amount for incurred losses. Under Ind AS,
the allowance for doubtful debts has been determined based on expected credit loss model.
f) Employeebenefits Under previous GAAP, actuarial gains and losses were recognised in statement of profit and loss. Under Ind AS, the actuarial gains and
losses form part of remeasurement of net defined benefit liability / asset which is recognised in other comprehensive income in the
respective periods.
g) Effect of transition to Ind AS on Standalone Cash Flow Statement for the year ended March 31, 2016 Net increase in cash and cash equivalents represents movement in cash credit facilities considered as a component of cash and cash
equivalents under Ind AS which as per previous GAAP, was considered as financing activity. Other Ind AS adjustments are either non cash
adjustments or are regrouping among the cash flows from operating, investing and financing activities and has no impact on the net cash
flow for the year ended 31st March, 2016 as compared with the previous GAAP.
Note 53
RELATED PARTY DISCLOSURES AS PER (IND AS 24) ANNEXURE “A”
Note 54
LOANS / ADVANCES GIVEN TO SUBSIDIARIES AND ASSOCIATES` in Million
As at March 31, 2017
Maximum balance
March 31, 2017
As at March 31, 2016
Maximum balance
March 31, 2016
As at April 01, 2015
Loans / Advances outstanding from Subsidiaries Green Eco Development Centre Ltd - 4.8 4.4 4.4 4.4 Neetnav Real Estate Private Limited - - - 0.4 0.4 Ranbaxy Drugs Limited - - - 25.6 25.6Loans / Advances outstanding from an Associate Loans Interest bearing with specified payment
schedule: Zenotech Laboratories Limited,
India * - 726.9 - 663.5 -
Considered good - - - - 326.8 Considered doubtful 726.9 - 663.5 - 274.0 Less: Provision for doubtful
loans / advances 726.9 - 663.5 - 274.0
- - 326.8
* Includes interest accrued on loans amounting to ` 214.9 Million in March 31, 2017, ` 151.5 Million in March 31, 2016 and ` 88.8 million in April 01, 2015.
These loans have been granted to the above entities for the purpose of their business.

S U N P H A R M A C E U T I C A L I N D U S T R I E S L I M I T E D1 5 6
NOTES TO THE STANDALONE FINANCIAL STATEMENTS FOR THE YEAR ENDED MARCH 31, 2017
Note 55
In respect of any present obligation as a result of past event that could lead to a probable outflow of resources, provisions has been made,
which would be required to settle the obligation. The said provisions are made as per the best estimate of the management and disclosure as
per Ind AS 37 - “Provisions, Contingent Liabilities and Contingent Assets” has been given below :
` in MillionAs at
March 31, 2017As at
March 31, 2016Product and
Sales related*Consultancy
chargesTotal
Product and Sales related*
Consultancy charges Total
At the commencement of the year 26,206.6 - 26,206.6 26,018.4 508.1 26,526.5Add: Provision for the year 840.0 - 840.0 829.2 - 829.2Add: Unwinding of discounts on provisions 437.8 - 437.8 538.0 - 538.0Add / (less): Foreign currency exchange fluctuation
(486.8) - (486.8) 1,319.0 - 1,319.0
Less: Utilisation / settlement (2,000.6) - (2,000.6) (2,498.0) (508.1) (3,006.1)At the end of the year 24,997.0 - 24,997.0 26,206.6 - 26,206.6
(*) includes provision for trade commitments, discounts, rebates, price reduction and product returns
Note 56
DETAILS OF SPECIFIED BANK NOTES HELD AND TRANSACTED DURING THE PERIOD NOVEMBER 08, 2016 AND DECEMBER 30, 2016 IS AS UNDER:
All amounts in absolute `
Specified bank notes * Others Total
Cash in hand as on November 08, 2016 2,275,500 4,274,623 6,550,123
Permitted receipts during November 08, 2016 and December 30, 2016 - 13,536,545 13,536,545
Permitted payments during November 08, 2016 and December 30, 2016 - (11,919,675) (11,919,675)
Amount deposited in banks (2,275,500) - (2,275,500)
Cash in hand as on December 30, 2016 - 5,891,493 5,891,493
* Specified bank notes are currency notes of ` 500 and ` 1000 discontinued vide notification S.O. 3407(E) dated November 08, 2016
Note 57
Expenditure related to Corporate Social Responsibility as per Section 135 of the Companies Act, 2013 read with Schedule VII thereof:
` 24.1 Million (Previous Year ` 116.5 Million).
Note 58
USE OF ESTIMATES AND JUDGEMENTSThe preparation of the Company’s financial statements requires the management to make judgements, estimates and assumptions that
affect the reported amounts of revenues, expenses, assets and liabilities, and the accompanying disclosures, and the disclosure of contingent
liabilities. Actual results may differ from these estimates.
Estimates and underlying assumptions are reviewed on an ongoing basis. Revisions to accounting estimates are recognised in the period in
which the estimates are revised and in any future periods affected. In particular, information about significant areas of estimation uncertainty
and critical judgments in applying accounting policies that have the most significant effect on the amounts recognised in the financial
statements is included in the following notes:

CORPORATE OVERVIEW STATUTORY REPORTS FINANCIAL STATEMENTS01-07 08-79 80-278
1 5 7A N N UA L R E P O RT 2 0 1 6 - 1 7
NOTES TO THE STANDALONE FINANCIAL STATEMENTS FOR THE YEAR ENDED MARCH 31, 2017
1 Fair value measurement of Financial Instruments
When the fair values of financials assets and financial liabilities
recorded in the financial statements cannot be measured
based on quoted prices in active markets, their fair value is
measured using valuation techniques which involve various
judgements and assumptions.
2 Useful lives of property, plant and equipment and intangible
assets
Property, plant and equipment and intangible assets
represent a significant proportion of the asset base of the
Company. The charge in respect of periodic depreciation and
amortisation is derived after determining an estimate of an
asset’s expected useful life and the expected residual value
at the end of its life. The useful lives and residual values of
Company’s assets are determined by the management at the
time the asset is acquired and reviewed periodically, including
at each financial year end. The lives are based on historical
experience with similar assets as well as anticipation of
future events, which may impact their life, such as changes in
technical or commercial obsolescence arising from changes
or improvements in production or from a change in market
demand of the product or service output of the asset.
3 Assets and obligations relating to employee benefits
The employment benefit obligations depends on a number of
factors that are determined on an actuarial basis using a number
of assumptions. The assumptions used in determining the net
cost/ (income) include the discount rate, inflation and mortality
assumptions. Any changes in these assumptions will impact upon
the carrying amount of employment benefit obligations.
4 Tax expense [Refer Note 2(q)]
The Company’s tax jurisdiction is India. Significant judgements
are involved in determining the provision for income taxes,
if any, including amount expected to be paid/recovered for
uncertain tax positions. Further, significant judgement is
exercised to ascertain amount of deferred tax asset (DTA)
that could be recognised based on the probability that future
taxable profits will be available against which DTA can be
utilized and amount of temporary difference in which DTA can
not be recognised on want of probable taxable profits.
5 Provisions [Refer Note 2(m)]
6 Write down in value of inventories (Refer Note 13)
7 Contingencies (Refer Note 40)
Note 59
1 Consequent to the amalgamation of erstwhile Ranbaxy
Laboratories Limited (RLL) into the Company as referred in
Note 59(4), Zenotech Laboratories Limited (‘Zenotech’) had
become an associate of the Company. The erstwhile RLL had
granted certain loans to Zenotech which were outstanding and
inherited by the Company. The Company has not granted any
further loans to Zenotech post effective date of amalgamation
i.e. March 24, 2015. The balance of this inherited outstanding
loan is ` 512.0 Million. The Company is in process of evaluating
various options in relation to recovery of the outstanding loans
and interest thereon of ` 214.9 Million (March 31, 2016 :
` 151.5 Million, April 01, 2015 : ` 88.8 Million).
2 Intangible assets consisting of trademarks, designs, technical
knowhow, non-compete fees and other intangible assets
are available to the Company in perpetuity. The amortisable
amount of intangible assets is arrived at based on the
management’s best estimates of useful lives of such assets
after due consideration as regards their expected usage, the
product life cycles, technical and technological obsolescence,
market demand for products, competition and their expected
future benefits to the Company.
3 Exceptional item for previous year represents charge
on account of impairment of certain Property, Plant and
Equipment and Intangible assets. This charge had arisen on
account of the integration and optimization exercise being
carried out for certain manufacturing facilities. The recoverable
amount of the said assets is its value in use which is determined
for a period of less than one year.
4 Pursuant to the Scheme of Arrangement u/s 391 to 394 of
the Companies Act 1956 for amalgamation of erstwhile RLL
with the Company as sanctioned by the Hon’ble High Court
of Gujarat and Hon’ble High Court of Punjab and Haryana on
March 24, 2015 (effective date) all the assets, liabilities and
reserves of erstwhile RLL were transferred to and vested in
the Company with effect from April 1, 2014, the appointed

S U N P H A R M A C E U T I C A L I N D U S T R I E S L I M I T E D1 5 8
NOTES TO THE STANDALONE FINANCIAL STATEMENTS FOR THE YEAR ENDED MARCH 31, 2017
date. Erstwhile RLL along with its subsidiaries and associates
was operating as an integrated international pharmaceutical
organisation with business encompassing the entire value
chain in the production, marketing and distribution of
pharmaceutical products. The scheme was accordingly been
given effect to in the financial statements for the year ended
March 31, 2015.
On April 10, 2015, in terms of the Scheme of Arrangement
0.80 equity share of ` 1 each (Number of Shares 334,956,764
including 186,516 Shares held by ESOP trust) of the Company
has been allotted to the shareholders of erstwhile RLL for
every 1 share of ` 5 each (Number of Shares 418,695,955
including 233,146 shares held by ESOP trust) held by them
in the share capital of erstwhile RLL, after cancellation of
6,967,542 shares of erstwhile RLL. An amount of ` 1,792.4
Million being the excess of share capital of erstwhile RLL
over the amount recorded as the share capital (which was
outstanding to be issued by the Company as on April 1, 2015
and disclosed as Share Suspense Account) was credited to
Capital Reserve.
5 Out of a MAT credit entitlement of ` 8,222.7 Million which
was written down by the erstwhile RLL during the quarter
ended December 31, 2014, an amount of ` 7,517.0 Million
was recognised by the Company in the year ended March
31, 2015, on a reassessment by the Management, based on
convincing evidence that the combined amalgamated entity
would pay normal income tax during the specified period and
would therefore be able to utilize the MAT credit entitlement
so recognised.
6 Since the US-FDA import alert at Karkhadi facility in March
2014, the Company remained fully committed to implement
all corrective measures to address the observations made by
the US-FDA with the help of third party consultant. Substantial
progress has been made at the Karkhadi facility in terms of
completing the action items to address the observations made
by the US-FDA in its warning letter issued in May 2014. The
Company is continuing to work closely and co-operatively with
the US-FDA to resolve the matter. The contribution of this
facility to Company’s revenues is not significant.
7 The US-FDA, on January 23, 2014, had prohibited using API
manufactured at Toansa facility for manufacture of finished
drug products intended for distribution in the U.S. market.
Consequentially, the Toansa manufacturing facility was subject
to certain provisions of the consent decree of permanent
injunction entered in January 2012 by erstwhile Ranbaxy
Laboratories Ltd (which was merged with Sun Pharmaceutical
Industries Ltd in March 2015). In addition, the Department of
Justice of the USA (‘US DOJ’), United States Attorney’s Office
for the District of New Jersey had also issued an administrative
subpoena dated March 13, 2014 seeking information primarily
related to Toansa manufacturing facility for which a Form
483 containing findings of the US-FDA was issued in January
2014. The Company is continuing to fully cooperate and is in
dialogue with the US DOJ, and continuing to provide requisite
information.
8 In December 2015, the US-FDA issued a warning letter to the
manufacturing facility at Halol. Subsequently, a re-inspection
was carried out by the US-FDA in November 2016. At the
conclusion of the inspection, FDA issued a Form 483 with
nine observations. The Company has submitted its response
documenting the corrective measures to resolve the 483
observations. The Company is providing regular updates to US-
FDA on the progress of the corrective actions. The Company is
continuing to manufacture and distribute products to the U.S
from Halol facility and at the same time working closely and
co-operatively with the US-FDA to resolve the matter.
9 In September 2013, the US-FDA had put the Mohali facility
under import alert and was also subjected to certain provisions
of the consent decree of permanent injunction entered in
January 2012 by erstwhile Ranbaxy Laboratories Ltd (which
was merged with Sun Pharmaceutical Industries Ltd in
March 2015). In November 2016, the US-FDA conducted
a re-inspection of the Mohali facility post the completion
of remediation work at the facility. As a result of this re-
inspection, in March 2017, the US-FDA lifted the import alert
and indicated that the facility was in compliance with the
requirements of cGMP provisions mentioned in the consent
decree. The Mohali facility will continue to remain under
consent decree under certain other provisions of the decree
for a fixed period of time to demonstrate sustainable cGMP
compliance.
10 In accordance with Ind AS 108 “Operating Segments”, segment
information has been given in the consolidated Ind AS financial
statements, and therefore, no separate disclosure on segment
information is given in these financial statements.

CORPORATE OVERVIEW STATUTORY REPORTS FINANCIAL STATEMENTS01-07 08-79 80-278
1 5 9A N N UA L R E P O RT 2 0 1 6 - 1 7
NOTES TO THE STANDALONE FINANCIAL STATEMENTS FOR THE YEAR ENDED MARCH 31, 2017
11 Remuneration to the Managing Director and the Whole-time
Director(s) of the Company for the years ended March 31,
2015, March 31, 2016 and March 31, 2017 are higher by
` 49.6 Million, ` 29.6 Million and ` 44.7 Million respectively
than the amounts approved by the Central Government of
India (Ministry of Corporate Affairs) on applications made
by the Company to approve the maximum remuneration
as approved by the members of the Company for the three
years ended March 31, 2017, in excess of the limits specified
under Schedule V to the Companies Act, 2013, in case of
inadequacy of profits. The Company has re-represented to
the office of the Ministry of Corporate Affairs (MCA) for
approval of remuneration within the overall limits approved
by the members of the Company for the years ended March
31, 2015 and March 31, 2016, and that for the year ended
March 31, 2017, applications for revision in the remuneration,
as approved by the members of the Company, has been made
to the MCA. The responses in respect of the foregoing re-
representation / applications for revision are awaited from
the MCA. On receipt of the requisite approvals, the balance
amount of remuneration for the aforesaid years, if any, as per
their entitlement, shall be paid to the Managing Director and
the Whole-time Director(s), as applicable, and the same shall
be given effect to in the year in which the approval is received.
Excess remuneration, if any, after final approval in respect of
the re-representation/applications for revision is received,
shall be refunded by the respective Managing Director and the
Whole-time Director(s).
12 As at March 31, 2017, the Company has received an amount
of ` 0.0 Million (` 7,177) towards share application money
for 1,148 equity shares of the Company. The Company
will allot these equity shares during the next financial year.
The Company has sufficient authorised capital to cover the
allotment of these shares. Pending allotment of shares, the
amounts are maintained in a designated bank account and are
not available for use by the Company.
13 The Company completed buy-back of 7,500,000 equity shares
of ` 1 each (representing 0.31% of total pre buy-back paid up
equity capital) on October 18, 2016, from the shareholders
on a proportionate basis by way of a tender offer at a price of
` 900 per equity share for an aggregate amount of ` 67,500
Lakhs in accordance with the provisions of the Companies Act,
2013 and the SEBI (Buy Back of Securities) Regulations,
1998. This buy-back of equity shares was approved by the
Board of Directors of the Company at its meeting held on
June 23, 2016.

S U N P H A R M A C E U T I C A L I N D U S T R I E S L I M I T E D1 6 0
NOTES TO THE STANDALONE FINANCIAL STATEMENTS FOR THE YEAR ENDED MARCH 31, 2017
Ind AS- 24 - “ RELATED PARTY DISCLOSURES “ ANNEXURE “A”Country of Incorporation
Proportion of ownership interest for the year ended
March 31, 2017
March 31, 2016
April 01, 2015
Names of related parties where control exists and description of relationshipsa Subsidiaries
DirectSubsidiariesGreen Eco Development Centre Limited India 100.00% 100.00% 100.00%
Sun Pharmaceutical (Bangladesh) Limited Bangladesh 72.50% 72.50% 72.50%
Sun Pharmaceutical Industries, Inc. United States of America 100.00% 100.00% 100.00%
Sun Farmaceutica Do Brasil Ltda. Brazil 100.00% 100.00% 100.00%
Sun Pharma De Mexico S.A. DE C.V. Mexico 75.00% 75.00% 75.00%
SPIL De Mexico S.A. DE C.V. Mexico 100.00% 100.00% 100.00%
Sun Pharmaceutical Peru S.A.C. Peru 99.33% 99.33% 99.33%
OOO "Sun Pharmaceutical Industries" Limited Russia 100.00% 100.00% 99.00%
Sun Pharma De Venezuela, C.A. Venezuela 100.00% 100.00% 100.00%
Sun Pharma Laboratories Limited India 100.00% 100.00% 100.00%
Faststone Mercantile Company Private Limited India 100.00% 100.00% 100.00%
Neetnav Real Estate Private Limited India 100.00% 100.00% 100.00%
Realstone Multitrade Private Limited India 100.00% 100.00% 100.00%
Skisen Labs Private Limited India 100.00% 100.00% 100.00%
Sun Pharma Holdings Mauritius 99.99% 99.99% 99.99%
Softdeal Trading Company Private Limited India 100.00% 100.00% 100.00%
Ranbaxy Pharmacie Generiques France 100.00% 100.00% 100.00%
Ranbaxy Drugs Limited India 100.00% 100.00% 100.00%
Vidyut Investments Limited India 100.00% 100.00% 100.00%
Gufic Pharma Limited India 100.00% 100.00% 100.00%
Ranbaxy (Malaysia) Sdn. Bhd. Malaysia 71.22% 71.22% 71.22%
Ranbaxy Nigeria Limited Nigeria 85.31% 85.31% 85.31%
Ranbaxy (Netherlands) B.V. Netherlands 100.00% 100.00% 100.00%
Foundation for Disease Elimination and Control of India (Refer Footnote 1)
India 100.00% - -
StepdownSubsidiariesCaraco Pharma Inc. (Refer Footnote 2) United States of America - 100.00% 100.00%
Chattem Chemicals Inc. United States of America 100.00% 100.00% 100.00%
The Taro Development Corporation United States of America 100.00% 100.00% 100.00%
Alkaloida Chemical Company Zrt. Hungary 99.99% 99.99% 99.99%
Sun Pharmaceuticals UK Limited United Kingdom 100.00% 100.00% 100.00%
Sun Pharmaceutical Industries (Australia) Pty Limited Australia 100.00% 100.00% 100.00%
Aditya Acquisition Company Ltd. Israel 100.00% 100.00% 100.00%
Sun Pharmaceutical Industries (Europe) B.V. Netherlands 100.00% 100.00% 100.00%
Sun Pharmaceuticals Italia S.R.L. Italy 100.00% 100.00% 100.00%
Sun Pharmaceuticals Spain, S.L.U. (Refer Footnote 3) Spain 100.00% 100.00% 100.00%
Sun Pharmaceuticals Germany GmbH Germany 100.00% 100.00% 100.00%

CORPORATE OVERVIEW STATUTORY REPORTS FINANCIAL STATEMENTS01-07 08-79 80-278
1 6 1A N N UA L R E P O RT 2 0 1 6 - 1 7
NOTES TO THE STANDALONE FINANCIAL STATEMENTS FOR THE YEAR ENDED MARCH 31, 2017
Country of Incorporation
Proportion of ownership interest for the year ended
March 31, 2017
March 31, 2016
April 01, 2015
Sun Pharmaceuticals France France 100.00% 100.00% 100.00%
Sun Pharma Global FZE United Arab Emirates 100.00% 100.00% 100.00%
Sun Pharmaceuticals (SA) (Pty) Ltd. South Africa 100.00% 100.00% 100.00%
Sun Global Canada Pty. Ltd. Canada 100.00% 100.00% 100.00%
Sun Pharma Philippines, Inc. Philippines 100.00% 100.00% 100.00%
Sun Pharmaceuticals Korea Ltd. Korea 100.00% 100.00% 100.00%
Sun Global Development FZE United Arab Emirates 100.00% 100.00% 100.00%
Caraco Pharmaceuticals Private Limited India 100.00% 100.00% 100.00%
Sun Pharma Japan Ltd. Japan 100.00% 100.00% 100.00%
Sun Pharma Healthcare FZE United Arab Emirates 100.00% 100.00% 100.00%
Morley & Company, Inc. United States of America 100.00% 100.00% 100.00%
Sun Laboratories FZE United Arab Emirates 100.00% 100.00% 100.00%
Taro Pharmaceutical Industries Ltd. (TARO) (Refer Footnote 17) Israel 72.81% 68.98% 68.87%
Taro Pharmaceuticals Inc. Canada 72.81% 68.98% 68.87%
Taro Pharmaceuticals U.S.A., Inc. United States of America 72.81% 68.98% 68.87%
Taro Pharmaceuticals North America, Inc. Cayman Islands, British West Indies
72.81% 68.98% 68.87%
Taro Pharmaceuticals Europe B.V. Netherlands 72.81% 68.98% 68.87%
Taro Pharmaceuticals Ireland Limited Ireland 72.81% 68.98% 68.87%
Taro International Ltd. Israel 72.81% 68.98% 68.87%
Taro Pharmaceuticals (UK) Limited United Kingdom 72.81% 68.98% 68.87%
Taro Hungary Intellectual Property Licensing Limited Liability Company (Refer Footnote 3)
Hungary 72.81% 68.98% 68.87%
3 Skyline LLC United States of America 72.81% 68.98% 68.87%
One Commerce Drive LLC United States of America 72.81% 68.98% 68.87%
Taro Pharmaceutical Laboratories Inc United States of America 72.81% 68.98% 68.87%
Taro Pharmaceuticals Canada, Ltd. Canada 72.81% 68.98% 68.87%
Taro Pharmaceutical India Private Limited (Refer Footnote 6) India 72.81% 68.98% 68.87%
Alkaloida Sweden AB Sweden 100.00% 100.00% 100.00%
Dusa Pharmaceuticals, Inc. United States of America 100.00% 100.00% 100.00%
Dusa Pharmaceuticals New York, Inc. (Refer Footnote 3) United States of America 100.00% 100.00% 100.00%
Sirius Laboratories Inc (Refer Footnote 3) United States of America 100.00% 100.00% 100.00%
URL Pharma, Inc (Refer Footnote 7) United States of America - 100.00% 100.00%
AR Scientific, Inc (Refer Footnote 8) United States of America - 100.00% 100.00%
Mutual Pharmaceutical Company Inc. United States of America 100.00% 100.00% 100.00%
United Research Laboratories, Limited (Refer Footnote 8) United States of America - 100.00% 100.00%
Dungan Mutual Associates, LLC United States of America 100.00% 100.00% 100.00%
URL PharmPro, LLC United States of America 100.00% 100.00% 100.00%
2 Independence Way LLC United States of America 100.00% 100.00% -
Thallion Pharmaceutical Inc., (Refer Footnote 9) United States of America 100.00% - -
Universal Enterprises Private Limited India 100.00% 100.00% 100.00%
Sun Pharma Switzerland Limited Switzerland 100.00% 100.00% 100.00%
Silverstreet Developers LLP (Refer Footnote 5) India - 100.00% 100.00%

S U N P H A R M A C E U T I C A L I N D U S T R I E S L I M I T E D1 6 2
NOTES TO THE STANDALONE FINANCIAL STATEMENTS FOR THE YEAR ENDED MARCH 31, 2017
Country of Incorporation
Proportion of ownership interest for the year ended
March 31, 2017
March 31, 2016
April 01, 2015
Sun Pharma East Africa Limited (Refer Footnote 10) Kenya 100.00% 100.00% 100.00%
Pharmalucence, Inc. (Refer Footnote 10) United States of America 100.00% 100.00% 100.00%
PI Real Estate Ventures, LLC (Refer Footnote 10) United States of America 100.00% 100.00% 100.00%
Sun Pharma ANZ Pty Ltd (formerly known as Ranbaxy Australia Pty Ltd)
Australia 100.00% 100.00% 100.00%
Ranbaxy Belgium N.V. (Refer Footnote 11) Belgium - 100.00% 100.00%
Ranbaxy Farmaceutica Ltda. Brazil 100.00% 100.00% 100.00%
Ranbaxy Pharmaceuticals Canada Inc. Canada 100.00% 100.00% 100.00%
Ranbaxy Egypt LLC Egypt 100.00% 100.00% 100.00%
Rexcel Egypt LLC Egypt 100.00% 100.00% 100.00%
Office Pharmaceutique Industriel Et Hospitalier France 100.00% 100.00% 100.00%
Basics GmbH Germany 100.00% 100.00% 100.00%
Ranbaxy GmbH Germany 100.00% 100.00% 100.00%
Ranbaxy Ireland Limited Ireland 100.00% 100.00% 100.00%
Ranbaxy Italia S.P.A. Italy 100.00% 100.00% 100.00%
Sun Pharmaceutical Industries S.A.C. (formerly known as Ranbaxy - PRP (Peru) S.A.C.)
Peru 100.00% 100.00% 100.00%
Ranbaxy (Poland) Sp. Z o.o. Poland 100.00% 100.00% 100.00%
Ranbaxy Portugal - Com E Desenvolv DeProd Farmaceuticos Unipessoal Lda (Refer Footnote 11)
Portugal - 100.00% 100.00%
S.C Terapia S.A. Romania 96.70% 96.70% 96.70%
AO Ranbaxy (formerly known as ZAO Ranbaxy) Russia 100.00% 100.00% 100.00%
Ranbaxy South Africa Proprietary Limited South Africa 100.00% 100.00% 100.00%
Ranbaxy Pharmaceutical Proprietary Limited South Africa 100.00% 100.00% 100.00%
Be-Tabs Investments Proprietary Limited South Africa 100.00% 100.00% 100.00%
Sonke Pharmaceuticals Proprietary Limited South Africa 70.00% 70.00% 70.00%
Laboratorios Ranbaxy, S.L.U. Spain 100.00% 100.00% 100.00%
Ranbaxy (U.K.) Limited United Kingdom 100.00% 100.00% 100.00%
Ranbaxy Holdings (U.K.) Limited United Kingdom 100.00% 100.00% 100.00%
Ranbaxy Europe Limited United Kingdom 100.00% 100.00% 100.00%
Ranbaxy Inc. United States of America 100.00% 100.00% 100.00%
Ranbaxy Pharmaceuticals, Inc. United States of America 100.00% 100.00% 100.00%
Ranbaxy (Thailand) Company Limited Thailand 100.00% 100.00% 100.00%
Ohm Laboratories, Inc. United States of America 100.00% 100.00% 100.00%
Ranbaxy Laboratories, Inc. United States of America 100.00% 100.00% 100.00%
Ranbaxy Signature LLC United States of America 67.50% 67.50% 67.50%
Sun Pharmaceuticals Morocco LLC (formerly known as Ranbaxy Morocco LLC)
Morocco 100.00% 100.00% 100.00%
"Ranbaxy Pharmaceuticals Ukraine" LLC Ukraine 100.00% 100.00% 100.00%
Perryton Wind Power LLC (Refer Footnote 3 and 12) United States of America 100.00% 100.00% -
Insite Vision Incorporated (Refer Footnote 12) United States of America 100.00% 100.00% -
Insite Vision Ltd. (Refer Footnote 12) United Kingdom 100.00% 100.00% -
Thea Acquisition Corporation (Refer Footnote 12 and 13) United States of America - 100.00% -
Zalicus Pharmaceuticals Limited (Refer Footnote 12 and 14) Canada - 100.00% -

CORPORATE OVERVIEW STATUTORY REPORTS FINANCIAL STATEMENTS01-07 08-79 80-278
1 6 3A N N UA L R E P O RT 2 0 1 6 - 1 7
NOTES TO THE STANDALONE FINANCIAL STATEMENTS FOR THE YEAR ENDED MARCH 31, 2017
Country of Incorporation
Proportion of ownership interest for the year ended
March 31, 2017
March 31, 2016
April 01, 2015
Sun Pharma Medisales Pvt Ltd. (formerly known as Solrex Pharmaceuticals Company) (Refer Footnote 16)
India 100.00% - -
Sun Pharmaceutical Medicare Limited (Refer Footnote 1) India 100.00% - -
Ocular Technologies SARL (Refer Footnote 1) Switzerland 100.00% - -
JSC Biosintez (Refer Footnote 1) Russia 85.10% - -
Sun Pharmaceuticals Holdings USA, INC (Refer Footnote 1) United States of America 100.00% - -
Namesofrelatedpartieswheretherearetransactionsanddescriptionofrelationships
b Joint Ventures
S & I Ophthalmic LLC United States of America 50.00% 50.00% 50.00%
c Associates
Zenotech Laboratories Limited India 46.84% 46.84% 46.84%
Daiichi Sankyo (Thailand) Ltd. (Refer Footnote 15) Thailand 26.90% 26.90% 26.90%
d Key Managerial Personnel
Dilip S. Shanghvi Managing Director
Sudhir V. Valia Executive Director
Sailesh T. Desai Executive Director
Israel Makov Chairman and Non- Executive Director
Kalyansundaram Subramanian (w.e.f. February 14, 2017) Executive Director
S. Mohanchand Dadha Non- Executive Director
Hasmukh S. Shah Non- Executive Director
Keki M. Mistry Non- Executive Director
Ashwin S. Dani Non- Executive Director
Rekha Sethi Non- Executive Director
e Relatives of Key Managerial Personnel
Aalok Shanghvi
Vidhi Shanghvi
f Enterprise under control of Key Managerial Personnel or their relativesMakov Associates Ltd
g EnterpriseundersignificantInfluenceofKeyManagerialPersonnel or their relativesSun Pharma Advanced Research Company Ltd
Sun Petrochemicals Pvt Ltd
PV Power Technologies Pvt. Ltd.
Footnote1 Incorporated / Acquired during the year.
2 Merged with Sun Pharmaceutical Industries, Inc.
3 Dissolved / Liquidated during the year.
4 Merged with Sun Pharma Global FZE.
5 Investment sold during the previous year.
6 Taro Pharmaceutical India Private Limited is under liquidation.
7 Merged into Mutual Pharmaceutical Company, Inc. during the previous year .

S U N P H A R M A C E U T I C A L I N D U S T R I E S L I M I T E D1 6 4
NOTES TO THE STANDALONE FINANCIAL STATEMENTS FOR THE YEAR ENDED MARCH 31, 2017
8 Merged into URL Pharma Inc. during the previous year.
9 Thallion Pharmaceutical Inc., was acquired and merged with Taro Pharmaceuticals Inc. during the year.
10 Incorporated / Acquired during the year ended March 31, 2015.
11 Dissolved / Liquidated during the previous year.
12 Incorporated / Acquired during the previous year.
13 Thea Acquisition Corporation has been merged with Insite Vision Incorporated during the previous year.
14 Acquired and subsequently amalgamated in Taro Pharmaceuticals Inc. in the previous year.
15 Daiichi Sankyo (Thailand) Ltd.’s shares were sold during the year.
16 During the year Solrex Pharmaceuticals Company, a partnership firm has been converted into company which is known as Sun Pharma Medisales Private Limited.
17 Holds voting power of 81.87% (beneficial ownership 72.81%) [March 31, 2016 79.32% (beneficial ownership 68.98%)] [April 01, 2015 79.24% (beneficial ownership 68.87%)].

CORPORATE OVERVIEW STATUTORY REPORTS FINANCIAL STATEMENTS01-07 08-79 80-278
1 6 5A N N UA L R E P O RT 2 0 1 6 - 1 7
NOTES TO THE STANDALONE FINANCIAL STATEMENTS FOR THE YEAR ENDED MARCH 31, 2017
Ind AS- 24 - “ RELATED PARTY DISCLOSURES “ ANNEXURE “A”Detail of related party transaction during the year ended March 31, 2017:
` in Million
Particulars March 31, 2017 March 31, 2016Purchase of goods 2,592.8 2,100.1
Subsidiaries 2,564.6 2,078.4
Associates 12.9 20.6
Enterprise under significant influence of key managerial personnel or their relatives 15.3 1.1
Purchase of Property, Plant and Equipment 299.6 4.5
Subsidiaries 299.6 0.5
Enterprise under significant influence of key managerial personnel or their relatives - 4.0
Sale of goods 26,332.2 23,393.0
Subsidiaries 26,276.1 23,042.6
Associates 38.8 340.4
Enterprise under significant influence of key managerial personnel or their relatives 17.3 10.0
Sale of Property, Plant and Equipment 20.1 86.7
Subsidiaries 20.1 86.3
Enterprise under significant influence of key managerial personnel or their relatives - 0.4
Receiving of Service 1,386.2 2,000.2
Subsidiaries 1,073.0 1,609.9
Enterprise under control of key managerial personnel or their relatives 141.6 390.3
Enterprise under significant influence of key managerial personnel or their relatives 171.6 -
Reimbursement of Expenses Paid 1,154.3 1,104.0
Subsidiaries 1,136.6 1,101.2
Associates 2.8 -
Key managerial personnel (` 45,815) 0.0 -
Enterprise under significant influence of key managerial personnel or their relatives 14.9 2.8
Rendering of Service 860.3 1,365.2
Subsidiaries 712.5 1,132.5
Joint Ventures 11.6 0.1
Enterprise under significant influence of key managerial personnel or their relatives 136.2 232.6
Reimbursement of Expenses Received 204.1 189.4
Subsidiaries 162.6 147.8
Enterprise under significant influence of key managerial personnel or their relatives 41.5 41.6
Finance (including investment and equity contributions) 7.7 171.6
Subsidiaries 7.7 171.6
Purchase of Investment in an Associate - 0.0
Associates (March 31, 2016 ` 16,380) - 0.0
Loans / Deposit given 0.4 -
Subsidiaries 0.4
Loans received back 4.8 0.4
Subsidiaries 4.8 0.4
Redemption of Preference Shares in Subsidiary - 473.9
Subsidiaries - 473.9

S U N P H A R M A C E U T I C A L I N D U S T R I E S L I M I T E D1 6 6
NOTES TO THE STANDALONE FINANCIAL STATEMENTS FOR THE YEAR ENDED MARCH 31, 2017
` in Million
Particulars March 31, 2017 March 31, 2016Sales of Investment in Sun Pharma Holding 32,318.4 37,994.6
Subsidiaries 32,318.4 37,994.6
Loan Taken 9,200.0 35,480.0
Subsidiaries 9,200.0 35,480.0
Loan Repaid 17,219.9 27,545.7
Subsidiaries 17,219.9 27,545.7
Dividend Income on Preference Shares 40.0 394.3
Subsidiaries 40.0 394.3
Dividend Income on Equity Shares 2,000.7 -
Subsidiaries 2,000.7 -
Interest Income 70.4 69.9
Subsidiaries ( ` 24,066) 0.0 -
Associates 70.4 69.9
Interest Expense 116.4 1,188.8
Subsidiaries 116.4 1,188.8
Rent Income 23.5 25.2
Subsidiaries 19.3 23.8
Enterprise under significant influence of key managerial personnel or their relatives 4.2 1.4
Rent expense 2.2 9.6
Subsidiaries 2.2 9.6
Provision for doubtful Loans and Interest accrued and due on Loans 63.4 389.5
Associates 63.4 389.5
Provision in respect of losses of a subsidiary 165.4 122.9
Subsidiaries 165.4 122.9
Remuneration 90.6 63.8
Key Managerial Personnel [Refer Note 59 (11)] 77.3 50.8
Relatives of Key Managerial Personnel 13.3 13.0
Director's Sitting Fees 8.3 7.4
Withdrawal of letters of comfort given on behalf of subsidiaries - 2,873.1
Subsidiaries - 2,873.1

CORPORATE OVERVIEW STATUTORY REPORTS FINANCIAL STATEMENTS01-07 08-79 80-278
1 6 7A N N UA L R E P O RT 2 0 1 6 - 1 7
NOTES TO THE STANDALONE FINANCIAL STATEMENTS FOR THE YEAR ENDED MARCH 31, 2017
Balance Outstanding as at the end of the year
` in Million
Particulars March 31, 2017 March 31, 2016 April 01, 2015Receivables 11,140.2 9,103.9 6,359.4 Subsidiaries 10,673.7 8,966.6 6,335.1 Joint Ventures - 0.9 1.3 Associates - 1.8 - Enterprise under significant influence of key managerial personnel or their
relatives 466.5 134.6 23.0
Payable 15,000.5 16,614.0 14,613.1 Subsidiaries 14,412.2 16,581.2 14,419.6 Associates 137.7 - 6.4 Key managerial personnel 4.2 5.4 19.5 Relatives of key managerial personnel 0.6 2.4 1.2 Enterprise under control of key managerial personnel or their relatives 63.0 25.0 166.4 Enterprise under significant influence of key managerial personnel or their
relatives 382.8 - -
Loan Taken - 8,020.0 - Subsidiaries - 8,020.0 -Loan Given - 4.4 331.6 Subsidiaries - 4.4 4.8 Associates * - - 326.8Deposit Given 62.5 62.5 62.5 Subsidiaries 62.5 62.5 62.5
* Net of Provision for doubtful loans and interest accrued and due thereon of ` 726.9 Million [ March 31, 2016 : ` 663.5 Million ; April 01, 2015 ` 274.0 Million] (Refer Note 54)
Key Managerial Personnel who are under the employment of the Company are entitled to post employment benefits and other long term employee benefits recognised as per Ind AS 19 - ‘Employee Benefits’ in the financial statements. As these employee benefits are lump sum amounts provided on the basis of actuarial valuation, the same is not included above and there is no Share-based payments to key managerial personnel of company.

S U N P H A R M A C E U T I C A L I N D U S T R I E S L I M I T E D1 6 8
NOTES TO THE STANDALONE FINANCIAL STATEMENTS FOR THE YEAR ENDED MARCH 31, 2017
Disclosure in respect of material transaction with related parties during the year.
` in Million
Particulars March 31, 2017 March 31, 2016Purchase of goods
Sun Pharma Medisales Private Limited (Formerly known as Solrex Pharmaceuticals Company) 1,174.5 1,207.2
Sun Pharma Laboratories Limited 563.1 689.5
Purchase of Property, Plant and Equipment
Sun Pharma Laboratories Limited 283.8 0.5
Sun Pharma Advanced Research Company Ltd - 4.0
Sale of goods
Be-Tabs Pharmaceuticals (Pty) Ltd. 4,157.3 -
Sun Pharma Global (FZE) 3,337.5 3,311.7
Sale of Property, Plant and Equipment
Sun Pharma Laboratories Limited 13.0 65.8
Sun Pharma Medisales Private Limited (Formerly known as Solrex Pharmaceuticals Company) 6.7 15.8
Receiving of Service
Sun Pharma Laboratories Limited 269.2 104.8
Reimbursement of Expenses Paid
Sun Pharmaceutical Industries, Inc. 539.6 320.7
Sun Pharmaceutical Industries (Europe) B.V. 343.9 159.9
Rendering of Service
Sun Pharma Laboratories Limited 431.2 424.0
Reimbursement of Expenses Received
Sun Pharma Global (FZE) 99.2 130.6
Sun Pharmaceutical Industries (Europe) B.V. 53.7 -
Sun Pharma Advanced Research Company Ltd 41.5 41.6
Finance (including investment and equity contributions)
Green Eco Development Centre Limited 6.0 -
Ranbaxy (Netherlands) B.V. 1.5 7.8
Skisen Labs Private Limited - 163.5
Purchase of Investment in an Associate
Zenotech Laboratories Limited (March 31, 2016 ` 16,380) - 0.0
Loans given / Deposit
Green Eco Development Centre Limited 0.4 -
Loans received back
Green Eco Development Centre Limited 4.8 -
Neetnav Real Estate Private Limited - 0.4
Redemption of Preference Shares in Subsidiary
Alkaloida Chemical Company Zrt. - 473.9
Sales of Investment in Sun Pharma Holding
Sun Pharma Laboratories Limited 32,318.4 37,994.6
Loan Taken
Sun Pharma Laboratories Limited 9,200.0 35,480.0
Loan Repaid
Sun Pharma Laboratories Limited 17,219.9 27,480.0

CORPORATE OVERVIEW STATUTORY REPORTS FINANCIAL STATEMENTS01-07 08-79 80-278
1 6 9A N N UA L R E P O RT 2 0 1 6 - 1 7
NOTES TO THE STANDALONE FINANCIAL STATEMENTS FOR THE YEAR ENDED MARCH 31, 2017
` in Million
Particulars March 31, 2017 March 31, 2016Dividend Income on Preference Shares
Sun Pharma Laboratories Limited 40.0 -
Alkaloida Chemical Company Zrt. - 394.3
Dividend Income on Equity Shares
Sun Pharma Laboratories Limited 2,000.0 -
Interest Income
Zenotech Laboratories Limited 70.4 69.9
Interest Expense
Sun Pharma Laboratories Limited 116.4 1,187.9
Rent Income
Sun Pharma Laboratories Limited 19.3 23.8
Rent expense
Sun Pharma Medisales Private Limited (Formerly known as Solrex Pharmaceuticals Company) 1.5 8.9
Neetnav Real Estate Private Limited 0.7 0.7
Provision for doubtful Loans and Interest accrued and due on Loans
Zenotech Laboratories Limited 63.4 389.5
Provision in respect of losses of a subsidiary
Ranbaxy Pharmacie Generiques SAS 165.4 122.9
Remuneration
Key Managerial Personnel
Dilip S. Shanghvi @ 31.8 19.3
Sailesh T. Desai 31.6 12.1
Sudhir V. Valia # 13.9 19.4
Relatives of Key Managerial Personnel
Aalok D. Shanghvi 12.1 12.1
Director's Sitting Fees
Hasmukh S. Shah 1.7 1.9
S. Mohanchand Dadha 1.7 1.6
Withdrawal of letters of comfort given on behalf of subsidiaries
Ranbaxy Nigeria Limited - 576.3
Ranbaxy Malaysia Sdn. Bhd. - 556.2
@ Net of Refund of ` Nil ( March 31, 2016 ` 1.1 Million) in respect of excess remuneration paid for financial year 2013 -14.# Net of Refund of ` Nil ( March 31, 2016 ` 1.0 Million) in respect of excess remuneration paid for financial year 2013 -14.

SUN PHARMACEUTICAL INDUSTRIES L IMITED170
TO THE MEMBERS OF SUN PHARMACEUTICAL INDUSTRIES LIMITED
Report on the Consolidated Ind AS Financial StatementsWe have audited the accompanying consolidated Ind AS financial statements of Sun Pharmaceutical Industries Limited (hereinafter referred to as "the Parent") and its subsidiaries (the Parent and its subsidiaries together referred to as "the Group"), its associates and its joint ventures, comprising the Consolidated Balance Sheet as at 31st March, 2017, the Consolidated Statement of Profit and Loss including other comprehensive income, the Consolidated Cash Flow Statement, the Consolidated Statement of Changes in Equity, for the year then ended, and a summary of the significant accounting policies and other explanatory information (hereinafter referred to as "the consolidated Ind AS financial statements").
Management's Responsibility for the Consolidated Ind AS Financial StatementsThe Parent's Board of Directors is responsible for the preparation of these consolidated Ind AS financial statements in terms of the requirements of the Companies Act, 2013 (hereinafter referred to as "the Act") that give a true and fair view of the consolidated financial position, consolidated financial performance including other comprehensive income, consolidated cash flows and statement of changes in equity of the Group including its associates and its joint ventures in accordance with the accounting principles generally accepted in India, including the Indian Accounting Standards (Ind AS) prescribed under Section 133 of the Act. The respective Board of Directors of the companies included in the Group and of its associates and of its joint ventures are responsible for maintenance of adequate accounting records in accordance with the provisions of the Act for safeguarding the assets of the Group and its associates and its joint ventures and for preventing and detecting frauds and other irregularities; the selection and application of appropriate accounting policies; making judgments and estimates that are reasonable and prudent; and the design, implementation and maintenance of adequate internal financial controls, that were operating effectively for ensuring the accuracy and completeness of the accounting records, relevant to the preparation and presentation of the financial statements that give a true and fair view and are free from material misstatement, whether due to fraud or error, which have been used for the purpose of preparation of the consolidated Ind AS financial statements by the Directors of the Parent, as aforesaid.
Auditor's ResponsibilityOur responsibility is to express an opinion on these consolidated Ind AS financial statements based on our audit. In conducting our audit, we have taken into account the provisions of the Act, the accounting and auditing standards and matters which are required to be included in the audit report under the provisions of the Act and the Rules made thereunder.
We conducted our audit in accordance with the Standards on Auditing specified under Section 143(10) of the Act. Those Standards require that we comply with ethical requirements and plan and perform the audit to obtain reasonable assurance about whether the consolidated Ind AS financial statements are free from material misstatement.
An audit involves performing procedures to obtain audit evidence about the amounts and the disclosures in the consolidated Ind AS financial statements. The procedures selected depend on the auditor's judgment, including the assessment of the risks of material misstatement of the consolidated Ind AS financial statements, whether due to fraud or error. In making those risk assessments, the auditor considers internal financial control relevant to the Parent's preparation of the consolidated Ind AS financial statements that give a true and fair view in order to design audit procedures that are appropriate in the circumstances. An audit also includes evaluating the appropriateness of the accounting policies used and the reasonableness of the accounting estimates made by the Parent's Board of Directors, as well as evaluating the overall presentation of the consolidated Ind AS financial statements.
We believe that the audit evidence obtained by us and the audit evidence obtained by the other auditors in terms of their reports referred to in sub-paragraph (a) of the Other Matters paragraph below, is sufficient and appropriate to provide a basis for our audit opinion on the consolidated Ind AS financial statements.
INDEPENDENT AUDITOR’S REPORT

171ANNUAL REPORT 2016-17
CORPORATE OVERVIEW STATUTORY REPORTS FINANCIAL STATEMENTS01-07 08-79 80-278
INDEPENDENT AUDITOR’S REPORT
OpinionIn our opinion and to the best of our information and according to the explanations given to us and based on the consideration of reports of the other auditors on separate financial statements/ financial information of the subsidiaries, associates and joint ventures referred to below in the Other Matters paragraph, the aforesaid consolidated Ind AS financial statements give the information required by the Act in the manner so required and give a true and fair view in conformity with the accounting principles generally accepted in India, of the consolidated state of affairs of the Group, its associates and its joint ventures as at 31st March, 2017, and their consolidated profit, consolidated total comprehensive income, consolidated cash flows and consolidated statement of changes in equity for the year ended on that date.
Emphasis of MatterWe draw attention to Note 64 to the consolidated Ind AS financial statements. As referred to in the said Note: Remuneration to the Managing Director and the Whole-time Director(s) of the Parent for the years ended 31st March, 2015, 31st March, 2016 and 31st March, 2017 are higher by ` 49.6 Million, ` 29.6 Million and ` 44.7 Million respectively than the amounts approved by the Central Government of India (Ministry of Corporate Affairs) on applications made by the Parent to approve the maximum remuneration as approved by the members of the Parent for the three years ended 31st March, 2017, in excess of the limits specified under Schedule V to the Act, in case of inadequacy of profits. The Management of the Parent have re-represented to the office of the Ministry of Corporate Affairs for approval of remuneration within the overall limits approved by the members of the Parent for the years ended 31st March, 2015 and 31st March, 2016, and for the year ended 31st March, 2017, applications for revision in the remuneration, as approved by the members of the Parent, has been made to the Ministry of Corporate Affairs. The responses in respect of the foregoing re-representation / applications for revision are awaited from the Ministry of Corporate Affairs.
Our opinion is not modified in respect of this matter.Other Matters(a) We did not audit the financial statements / financial information of 79 subsidiaries, whose financial statements / financial information
reflect total assets of ` 561,913.2 Million as at 31st March, 2017, total revenues of ` 242,491.8 Million and net cash inflows amounting to ` 6,209.1 Million for the year ended on that date, as considered in the consolidated Ind AS financial statements. The consolidated Ind AS financial statements also include the Group's share of net profit of ` 99.3 Million for the year ended 31st March, 2017, as considered in the consolidated Ind AS financial statements, in respect of 5 associates and 2 joint ventures, whose financial statements / financial information have not been audited by us. The above figures are before giving effect to consolidation adjustments.
These financial statements / financial information have been audited by other auditors whose reports have been furnished to us and our opinion on the consolidated Ind AS financial statements, in so far as it relates to the amounts and disclosures included in respect of these subsidiaries, associates and joint ventures, and our report in terms of sub-section (3) of Section 143 of the Act, in so far as it relates to the aforesaid subsidiaries, associates and joint ventures is based solely on the reports of the other auditors.
(b) We did not audit the financial statements / financial information of 31 subsidiaries, whose financial statements / financial information reflect total assets of ` 248,997.4 Million as at 31st March, 2017, total revenues of ` 12,831.5 Million and net cash outflows amounting to ` 231.1 Million for the year ended on that date, as considered in the consolidated Ind AS financial statements. The above figures are before giving effect to consolidation adjustments. The consolidated Ind AS financial statements also include the Group's share of profit after tax of ` Nil for the year ended 31st March, 2017, as considered in the consolidated Ind AS financial statements, in respect of 3 associates and 2 joint ventures, whose financial statements / financial information have not been audited.
These financial statements / financial information are unaudited and have been furnished to us by the Management of the Parent and our opinion on the consolidated Ind AS financial statements, in so far as it relates to the amounts and disclosures included in respect of these subsidiaries, associates and joint ventures, is based solely on such unaudited financial statements / financial information. In our opinion and according to the information and explanations given to us by the Management of the Parent, these financial statements / financial information are not material to the Group.

SUN PHARMACEUTICAL INDUSTRIES L IMITED172
(c) The comparative financial information for the year ended 31st March, 2016 and the transition date opening balance sheet as at 1st April, 2015 in respect of 71 subsidiaries, 4 associates and 2 joint ventures included in this consolidated Ind AS financial statements prepared in accordance with the Ind AS have been audited by other auditors and have been relied upon by us.
(d) The transition date opening balance sheet of the Parent as at 1st April, 2015 include the financial information of erstwhile Ranbaxy Laboratories Limited, consequent to its amalgamation into the Parent which was effected on 24th March, 2015, with the appointed date of 1st April, 2014 [refer Note 66 to the consolidated Ind AS financial statements]. The said financial information included in these consolidated Ind AS financial statements are based on financial information previously prepared in accordance with the Companies (Accounting Standards) Rules, 2006, audited by the other auditors, and have been restated to comply with Ind AS. Adjustments made to the financial information previously prepared in accordance with the Companies (Accounting Standards) Rules, 2006 to comply with Ind AS have been audited by us.
Our opinion on the consolidated Ind AS financial statements above, and our report on Other Legal and Regulatory Requirements below, is not modified in respect of the above matters with respect to our reliance on the work done and the reports of the other auditors and the financial statements / financial information certified by the Management of the Parent.
Report on Other Legal and Regulatory RequirementsAs required by Section 143(3) of the Act, based on our audit and on the consideration of the reports of the other auditors on separate financial statements and the other financial information of subsidiaries, associates and joint venture companies, referred in the Other Matters paragraph above, we report, to the extent applicable, that:
(a) We have sought and obtained all the information and explanations which to the best of our knowledge and belief were necessary for the purposes of our audit of the aforesaid consolidated Ind AS financial statements.
(b) In our opinion, proper books of account as required by law relating to preparation of the aforesaid consolidated Ind AS financial statements have been kept so far as it appears from our examination of those books and the reports of the other auditors.
(c) The Consolidated Balance Sheet, the Consolidated Statement of Profit and Loss (including Other Comprehensive Income), the Consolidated Cash Flow Statement and the Consolidated Statement of Changes in Equity dealt with by this report are in agreement with the relevant books of account maintained for the purpose of preparation of the consolidated Ind AS financial statements.
(d) In our opinion, the aforesaid consolidated Ind AS financial statements comply with the Indian Accounting Standards prescribed under Section 133 of the Act.
(e) On the basis of the written representations received from the directors of the Parent as on 31st March, 2017 taken on record by the Board of Directors of the Parent and the reports of the statutory auditors of its subsidiary companies and an associate company, incorporated in India, none of the directors of the Group companies and its associate company incorporated in India is disqualified as on 31st March, 2017 from being appointed as a director in terms of Section 164 (2) of the Act.
(f) With respect to the adequacy of the internal financial controls over financial reporting and the operating effectiveness of such controls, refer to our separate Report in “Annexure A”, which is based on the auditors’ reports of the Parent, subsidiary companies and an associate company, incorporated in India. Our report expresses an unmodified opinion on the adequacy and operating effectiveness of the internal financial controls over financial reporting of the Parent, subsidiary companies and an associate company, incorporated in India.
(g) With respect to the other matters to be included in the Auditor's Report in accordance with Rule 11 of the Companies (Audit and Auditor's) Rules, 2014, as amended, in our opinion and to the best of our information and according to the explanations given to us:
INDEPENDENT AUDITOR’S REPORT

173ANNUAL REPORT 2016-17
CORPORATE OVERVIEW STATUTORY REPORTS FINANCIAL STATEMENTS01-07 08-79 80-278
i. The consolidated Ind AS financial statements disclose the impact of pending litigations on the consolidated financial position of the Group, its associates and joint ventures – Refer Note 40A to the consolidated Ind AS financial statements.
ii. Provision has been made in the consolidated Ind AS financial statements, as required under the applicable law or accounting standards, for material foreseeable losses, if any, on long-term contracts including derivative contracts - Refer Notes 23 and 29 to the consolidated Ind AS financial statements in respect of such items as it relates to the Group. The associates and jointly ventures did not have any long-term contracts including derivative contracts.
iii. There has been no delay in transferring amounts required to be transferred, to the Investor Education and Protection Fund by the Parent and its subsidiary companies and an associate company, incorporated in India, except a sum of ` 13.4 Million, which is held in abeyance by the Parent due to pending legal cases.
iv. The Parent has provided requisite disclosures in Note 71 to the consolidated Ind AS financial statements as regards the holding and dealings in Specified Bank Notes as defined in the Notification S.O. 3407(E) dated 8th November, 2016 of the Ministry of Finance, during the period from 8th November, 2016 to 30th December, 2016 in respect of the Parent, subsidiaries and an associate, incorporated in India. Based on the audit procedures performed, the representations provided to us by the Management of the Parent and based on the consideration of reports of the other auditors, referred to in the Other Matters paragraph above, we report that the disclosures are in accordance with the relevant books of accounts maintained by the Parent, subsidiaries and an associate, incorporated in India, for the purpose of preparation of the consolidated Ind AS financial statements.
For DELOITTE HASKINS & SELLS LLP Chartered Accountants
(Firm’s Registration No. 117366W/W-100018)
RAJESH K. HIRANANDANI Place: Mumbai Partner Date: 26th May, 2017 (Membership No. 36920)
INDEPENDENT AUDITOR’S REPORT

SUN PHARMACEUTICAL INDUSTRIES L IMITED174
In conjunction with our audit of the consolidated Ind AS financial statements of the Company as of and for the year ended 31st March, 2017, we have audited the internal financial controls over financial reporting of SUN PHARMACEUTICAL INDUSTRIES LIMITED (hereinafter referred to as “the Parent”) and its subsidiary companies and its associate company, which are companies incorporated in India, as of that date.
Management’s Responsibility for Internal Financial ControlsThe respective Board of Directors of the Parent, its subsidiary companies and its associate company, which are companies incorporated in India, are responsible for establishing and maintaining internal financial controls based on the internal control over financial reporting criteria established by the respective Companies considering the essential components of internal control stated in the Guidance Note on Audit of Internal Financial Controls Over Financial Reporting issued by the Institute of Chartered Accountants of India. These responsibilities include the design, implementation and maintenance of adequate internal financial controls that were operating effectively for ensuring the orderly and efficient conduct of its business, including adherence to the respective company’s policies, the safeguarding of its assets, the prevention and detection of frauds and errors, the accuracy and completeness of the accounting records, and the timely preparation of reliable financial information, as required under the Act.
Auditor’s ResponsibilityOur responsibility is to express an opinion on the internal financial controls over financial reporting of the Parent, its subsidiary companies and its associate company, which are companies incorporated in India, based on our audit. We conducted our audit in accordance with the Guidance Note on Audit of Internal Financial Controls Over Financial Reporting issued by the Institute of Chartered Accountants of India and the Standards on Auditing, prescribed under Section 143(10) of the Act, to the extent applicable to an audit of internal financial controls. Those Standards and the Guidance Note require that we comply with ethical requirements and plan and perform the audit to obtain reasonable assurance about whether adequate internal financial controls over financial reporting was established and maintained and if such controls operated effectively in all material respects.
Our audit involves performing procedures to obtain audit evidence about the adequacy of the internal financial controls system over financial reporting and their operating effectiveness. Our audit of internal financial controls over financial reporting included obtaining an understanding of internal financial controls over financial reporting, assessing the risk that a material weakness exists, and testing and evaluating the design and operating effectiveness of internal control based on the assessed risk. The procedures selected depend on the auditor’s judgement, including the assessment of the risks of material misstatement of the financial statements, whether due to fraud or error.
We believe that the audit evidence we have obtained and the audit evidence obtained by the other auditors of the subsidiary companies and the associate company, which are companies incorporated in India, in terms of their reports referred to in the Other Matter paragraph below, is sufficient and appropriate to provide a basis for our audit opinion on the internal financial controls system over financial reporting of the Parent, its subsidiary companies and its associate company, which are companies incorporated in India.
Meaning of Internal Financial Controls Over Financial ReportingA company's internal financial control over financial reporting is a process designed to provide reasonable assurance regarding the reliability of financial reporting and the preparation of financial statements for external purposes in accordance with generally accepted accounting principles. A company's internal financial control over financial reporting includes those policies and procedures that (1) pertain to the maintenance of records that, in reasonable detail, accurately and fairly reflect the transactions and dispositions of the assets of the company; (2) provide reasonable assurance that transactions are recorded as necessary to permit preparation of financial statements in accordance with generally accepted accounting principles, and that receipts and expenditures of the company are being made only in accordance with authorisations of management and directors of the company; and (3) provide reasonable assurance regarding prevention or timely detection of unauthorised acquisition, use, or disposition of the company's assets that could have a material effect on the financial statements.
ANNEXURE “A” TO THE INDEPENDENT AUDITOR’S REPORT
(Referred to in paragraph (f) under ‘Report on Other Legal and Regulatory Requirements’ section of our report of even date to the Members of Sun Pharmaceutical Industries Limited)
Report on Internal Financial Controls Over Financial Reporting Under Clause (I) of Sub-section 3 of section 143 of the Companies Act, 2013 ( “the Act”)

175ANNUAL REPORT 2016-17
CORPORATE OVERVIEW STATUTORY REPORTS FINANCIAL STATEMENTS01-07 08-79 80-278
Inherent Limitations of Internal Financial Controls Over Financial ReportingBecause of the inherent limitations of internal financial controls over financial reporting, including the possibility of collusion or improper management override of controls, material misstatements due to error or fraud may occur and not be detected. Also, projections of any evaluation of the internal financial controls over financial reporting to future periods are subject to the risk that the internal financial control over financial reporting may become inadequate because of changes in conditions, or that the degree of compliance with the policies or procedures may deteriorate.
OpinionIn our opinion to the best of our information and according to the explanations given to us and based on the consideration of the reports of the other auditors referred to in the Other Matter paragraph below, the Parent, its subsidiary companies and its associate company, which are companies incorporated in India, have, in all material respects, an adequate internal financial controls system over financial reporting and such internal financial controls over financial reporting were operating effectively as at 31st March, 2017, based on the internal control over financial reporting criteria established by the respective companies considering the essential components of internal control stated in the Guidance Note on Audit of Internal Financial Controls Over Financial Reporting issued by the Institute of Chartered Accountants of India.
Other MatterOur aforesaid report under Section 143(3)(i) of the Act on the adequacy and operating effectiveness of the internal financial controls over financial reporting insofar as it relates to 14 subsidiary companies (excluding a subsidiary company under liquidation) and an associate company, which are companies incorporated in India, is based solely on the reports of the auditors of such companies incorporated in India.
Our opinion is not modified in respect of this matter.
For DELOITTE HASKINS & SELLS LLP Chartered Accountants
(Firm’s Registration No. 117366W/W-100018)
RAJESH K. HIRANANDANI Place: Mumbai Partner Date: 26th May, 2017 (Membership No. 36920)
ANNEXURE “A” TO THE INDEPENDENT AUDITOR’S REPORT
(Referred to in paragraph (f) under ‘Report on Other Legal and Regulatory Requirements’ section of our report of even date to the Members of Sun Pharmaceutical Industries Limited)
Report on Internal Financial Controls Over Financial Reporting Under Clause (I) of Sub-section 3 of section 143 of the Companies Act, 2013 ( “the Act”)

SUN PHARMACEUTICAL INDUSTRIES L IMITED176
CONSOLIDATED BALANCE SHEET AS AT MARCH 31, 2017
` in Million
Notes As at As at As at
March 31, 2017 March 31, 2016 April 01, 2015ASSETS(1) Non-current assets
(a) Property, plant and equipment 3a 84,952.9 75,831.4 70,000.7 (b) Capital work-in-progress 15,647.6 12,034.6 15,317.7 (c) Goodwill (Net) 48 55,362.2 56,347.4 54,845.9 (d) Other intangible assets 3b 36,436.6 26,543.7 6,461.3 (e) Intangible assets under development 12,366.2 9,719.9 5,068.4 (f) Investments in associates 4 4,605.4 3,008.8 2,175.7 (g) Investments in joint ventures 5 429.5 655.0 418.0 (h) Financial assets
(i) Investments 6 4,575.1 7,496.9 10,772.1 (ii) Loans 7 698.1 1,073.2 1,830.1 (iii) Other financial assets 8 6,452.2 9,809.9 1,583.4
(i) Deferred tax assets (Net) 51 24,928.2 31,489.9 27,172.1 (j) Income tax assets (Net) 9 31,250.1 15,726.2 11,238.8 (k) Other non-current assets 10 6,861.8 6,152.8 5,934.2
Total non-current assets 284,565.9 255,889.7 212,818.4 (2) Current Assets
(a) Inventories 11 68,328.1 64,225.4 56,668.9 (b) Financial assets
(i) Investments 12 2,308.8 7,138.1 21,662.2 (ii) Trade receivables 13 72,026.1 67,756.6 50,927.5 (iii) Cash and cash equivalents 14 86,628.0 80,751.4 72,645.9 (iv) Bank balances other than (iii) above 15 64,780.4 51,065.1 37,124.8 (v) Loans 16 10,190.8 10,715.5 10,481.6 (vi) Other financial assets 17 2,258.5 890.8 26,751.9
(c) Other current assets 18 22,949.9 16,798.2 12,519.4 329,470.6 299,341.1 288,782.2
Assets classified as held for sale 73 65.9 71.9 - Total current assets 329,536.5 299,413.0 288,782.2
TOTAL ASSETS 614,102.4 555,302.7 501,600.6 EQUITY AND LIABILITIESEquity
(a) Equity share capital 19 2,399.3 2,406.6 2,071.2 (b) Share suspense account 66 - - 334.8 (c) Other equity 20 363,997.4 327,418.2 278,008.5
Equity attributable to the owners of the Company 366,396.7 329,824.8 280,414.5

177ANNUAL REPORT 2016-17
CORPORATE OVERVIEW STATUTORY REPORTS FINANCIAL STATEMENTS01-07 08-79 80-278
CONSOLIDATED BALANCE SHEET AS AT MARCH 31, 2017
` in Million
Notes As at As at As at
March 31, 2017 March 31, 2016 April 01, 2015Non-controlling interests 37,908.6 40,852.5 28,511.9 Total equity 404,305.3 370,677.3 308,926.4 Liabilities(1) Non-current liabilities
(a) Financial liabilities(i) Borrowings 21 14,360.8 31,103.0 13,597.7 (ii) Trade payables - - 10.2 (iii) Other financial liabilities 22 1,048.0 1,842.2 1,816.7
(b) Provisions 23 12,111.1 18,958.6 23,074.5 (c) Deferred tax liabilities (Net) 51 3,147.9 1,027.7 751.4 (d) Other non-current liabilities 24 259.1 254.3 129.8
Total non-current liabilities 30,926.9 53,185.8 39,380.3 (2) Current liabilities
(a) Financial liabilities(i) Borrowings 25 66,549.2 52,061.2 62,126.7 (ii) Trade payables 26 43,953.9 35,829.2 32,430.3 (iii) Other financial liabilities 27 22,116.3 6,873.3 24,137.4
(b) Other current liabilities 28 4,620.5 4,469.4 4,237.8 (c) Provisions 29 40,159.1 29,734.4 24,447.0 (d) Current tax liabilities (Net) 30 1,471.2 2,472.1 5,914.7
Total current liabilities 178,870.2 131,439.6 153,293.9 Total liabilities 209,797.1 184,625.4 192,674.2 TOTAL EQUITY AND LIABILITIES 614,102.4 555,302.7 501,600.6
See accompanying notes 1 to 80 to the consolidated financial statements
In terms of our report attached For and on behalf of the Board of Directors of Sun Pharmaceutical Industries Limited
For DELOITTE HASKINS & SELLS LLPChartered Accountants
RAJESH K. HIRANANDANI UDAY V. BALDOTA DILIP S. SHANGHVI SUDHIR V. VALIAPartner Chief Financial Officer Managing Director Wholetime DirectorMumbai, May 26, 2017
SUNIL R. AJMERA SAILESH T. DESAICompany Secretary Wholetime Director
Mumbai, May 26, 2017
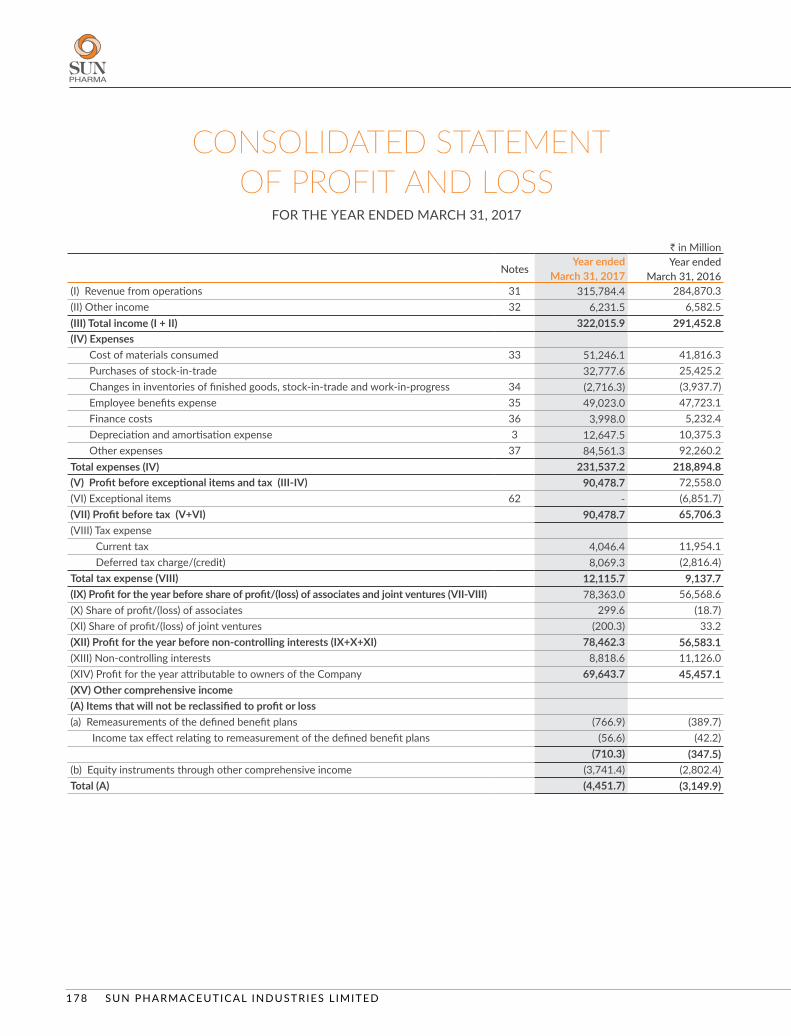
SUN PHARMACEUTICAL INDUSTRIES L IMITED178
` in Million
Notes Year ended Year ended
March 31, 2017 March 31, 2016(I) Revenue from operations 31 315,784.4 284,870.3 (II) Other income 32 6,231.5 6,582.5 (III) Total income (I + II) 322,015.9 291,452.8 (IV) Expenses
Cost of materials consumed 33 51,246.1 41,816.3 Purchases of stock-in-trade 32,777.6 25,425.2 Changes in inventories of finished goods, stock-in-trade and work-in-progress 34 (2,716.3) (3,937.7)Employee benefits expense 35 49,023.0 47,723.1 Finance costs 36 3,998.0 5,232.4 Depreciation and amortisation expense 3 12,647.5 10,375.3 Other expenses 37 84,561.3 92,260.2
Total expenses (IV) 231,537.2 218,894.8 (V) Profit before exceptional items and tax (III-IV) 90,478.7 72,558.0 (VI) Exceptional items 62 - (6,851.7)(VII) Profit before tax (V+VI) 90,478.7 65,706.3 (VIII) Tax expense
Current tax 4,046.4 11,954.1 Deferred tax charge/(credit) 8,069.3 (2,816.4)
Total tax expense (VIII) 12,115.7 9,137.7 (IX) Profit for the year before share of profit/(loss) of associates and joint ventures (VII-VIII) 78,363.0 56,568.6 (X) Share of profit/(loss) of associates 299.6 (18.7)(XI) Share of profit/(loss) of joint ventures (200.3) 33.2 (XII) Profit for the year before non-controlling interests (IX+X+XI) 78,462.3 56,583.1 (XIII) Non-controlling interests 8,818.6 11,126.0(XIV) Profit for the year attributable to owners of the Company 69,643.7 45,457.1(XV) Other comprehensive income(A) Items that will not be reclassified to profit or loss(a) Remeasurements of the defined benefit plans (766.9) (389.7) Income tax effect relating to remeasurement of the defined benefit plans (56.6) (42.2)
(710.3) (347.5)(b) Equity instruments through other comprehensive income (3,741.4) (2,802.4)Total (A) (4,451.7) (3,149.9)
CONSOLIDATED STATEMENT OF PROFIT AND LOSS
FOR THE YEAR ENDED MARCH 31, 2017

179ANNUAL REPORT 2016-17
CORPORATE OVERVIEW STATUTORY REPORTS FINANCIAL STATEMENTS01-07 08-79 80-278
In terms of our report attached For and on behalf of the Board of Directors of Sun Pharmaceutical Industries Limited
For DELOITTE HASKINS & SELLS LLPChartered Accountants
RAJESH K. HIRANANDANI UDAY V. BALDOTA DILIP S. SHANGHVI SUDHIR V. VALIAPartner Chief Financial Officer Managing Director Wholetime DirectorMumbai, May 26, 2017
SUNIL R. AJMERA SAILESH T. DESAICompany Secretary Wholetime Director
Mumbai, May 26, 2017
` in Million
Notes Year ended Year ended
March 31, 2017 March 31, 2016(B) Items that may be reclassified to profit or loss(a) Debt instruments through other comprehensive income (4.7) 1.3 (b) Effective portion of gains and loss on designated portion of hedging instruments in a
cash flow hedge 46.2 -
(c) Exchange differences in translating the financial statements of a foreign operations (10,461.7) 17,502.0 Total (B) (10,420.2) 17,503.3 (XV) Total other comprehensive income (A+B) (14,871.9) 14,353.4 (XVI) Total comprehensive income for the year (XII+XV) 63,590.4 70,936.5Other Comprehensive Income for the year attributable to:- Owners of the Company (13,337.6) 12,794.5 - Non-controlling interests (1,534.3) 1,558.9Total Comprehensive income for the year attributable to:- Owners of the Company 56,306.1 58,251.6 - Non-controlling interests 7,284.3 12,684.9 Earnings per equity share (face value per equity share - ` 1) 52Basic ( in `) 29.0 18.9 Diluted ( in `) 29.0 18.9
See accompanying notes 1 to 80 to the consolidated financial statements
CONSOLIDATED STATEMENT OF PROFIT AND LOSS
FOR THE YEAR ENDED MARCH 31, 2017

SUN PHARMACEUTICAL INDUSTRIES L IMITED180
` in
Mill
ion
Equ
ity
shar
e ca
pita
l
Sha
re
susp
ense
ac
coun
t [R
efer
N
ote
(66)
]
R
eser
ve a
nd s
urpl
us
Sha
re
appl
icati
on
mon
ey
pend
ing
allo
tmen
t
Cap
ital
rese
rve
Sec
uriti
es
prem
ium
re
serv
e
Deb
entu
re
rede
mpti
on
rese
rve
Sha
re
optio
n ou
tsta
ndin
g ac
coun
t
Reva
luati
on
Surp
lus
Am
alga
mati
on
rese
rve
Cap
ital
rede
mpti
on
rese
rve
Leg
al
rese
rve
Gen
eral
re
serv
e R
etai
ned
earn
ings
Bala
nce
as a
t Apr
il 1,
201
52,
071.
2 3
34.8
1
49.0
2
68.0
1
8,22
0.3
750
.0
82.
1 3
9.8
43.
8 -
0.9
3
4,82
8.0
216
,743
.1
Profi
t for
the
year
- -
- -
- -
- -
- -
- -
45,4
57.1
Exch
ange
diff
eren
ce a
risin
g on
tran
slatio
n of
fore
ign
oper
ation
s -
--
--
--
--
--
--
Oth
er c
ompr
ehen
sive
inco
me
for t
he y
ear,
net o
f inc
ome
tax
- -
- -
- -
- -
- -
- -
*(34
7.5)
Tota
l com
preh
ensi
ve in
com
e fo
r the
yea
r-
--
--
--
--
--
-45
,109
.6Pa
ymen
t of d
ivid
ends
- -
- -
- -
- -
- -
- -
(7,2
19.5
)Co
rpor
ate
divi
dend
tax
- -
- -
- -
- -
- -
- -
(1,4
69.7
)Re
cogn
ition
of s
hare
-bas
ed p
aym
ents
to
empl
oyee
s -
- -
- -
- 9
8.8
- -
- -
- -
Issu
e of
equ
ity s
hare
s 0
.6
- (1
42.3
) -
232
.9
- -
- -
- -
- -
Issu
e of
equ
ity s
hare
s pu
rsua
nt to
the
sche
me
of a
mal
gam
ation
(Ref
er n
ote
66)
334
.8
(334
.8)
- -
- -
- -
- -
- -
-
Tran
sfer
on
exer
cise
of s
hare
opti
ons
- -
- -
132
.0
- (1
32.0
) -
- -
- -
- Tr
ansf
er fr
om d
eben
ture
rede
mpti
on
rese
rve
on re
paym
ent o
f deb
entu
res
- -
- -
- (7
50.0
) -
- -
- -
750
.0
-
Tran
sfer
red
from
Sur
plus
in C
onso
lidat
ed
Stat
emen
t of P
rofit
and
Los
s -
- -
- -
1,0
41.7
-
- -
- -
- (1
,041
.7)
Util
ised
durin
g th
e ye
ar -
- -
- -
- -
(39.
8) -
- -
- -
Buy-
back
of e
quity
shar
es b
y su
bsid
iary
co
mpa
ny -
- -
- -
- -
- -
- -
- (3
02.3
)
Tran
sfer
red
to C
apita
l Res
erve
from
Co
nsol
idat
ed S
tate
men
t of P
rofit
and
Lo
ss a
s pe
r the
Loc
al L
aw o
f an
over
seas
su
bsid
iary
- -
- 1
88.9
-
- -
- -
- -
- (1
88.9
)
Tran
sfer
red
from
Sur
plus
in C
onso
lidat
ed
Stat
emen
t of P
rofit
and
Los
s as
per
the
Loca
l Law
of a
n ov
erse
as s
ubsid
iary
- -
- -
- -
- -
- -
0.2
-
(0.2
)
Bala
nce
as a
t Mar
ch 3
1, 2
016
2,4
06.6
-
6.7
4
56.9
1
8,58
5.2
1,0
41.7
4
8.9
- 4
3.8
- 1
.1
35,
578.
0 25
1,63
0.4
Profi
t for
the
year
- -
- -
- -
- -
- -
- -
69,6
43.7
Ex
chan
ge d
iffer
ence
aris
ing
on tr
ansla
tion
of fo
reig
n op
erati
ons
- -
- -
- -
- -
- -
- -
-
Oth
er c
ompr
ehen
sive
inco
me
for t
he y
ear,
net o
f inc
ome
tax
- -
- -
- -
- -
- -
- -
*(71
0.3)
Tota
l com
preh
ensi
ve in
com
e fo
r the
yea
r -
- -
- -
- -
- -
- -
- 68
,933
.4
Paym
ent o
f div
iden
ds -
- -
- -
- -
- -
- -
- (2
,406
.8)
Corp
orat
e di
vide
nd ta
x -
- -
- -
- -
- -
- -
- (4
90.0
)Re
cogn
ition
of s
hare
-bas
ed p
aym
ents
to
empl
oyee
s -
- -
- -
- 3
2.3
- -
- -
- -
Issu
e of
equ
ity s
hare
s0.
2 -
(6.7
) -
31.
3 -
- -
- -
- -
- Bu
y-ba
ck o
f equ
ity s
hare
s (R
efer
not
e 65
) (7
.5)
- -
- (6
,742
.5)
- -
- -
- -
- -
Expe
nditu
re o
n bu
y-ba
ck o
f equ
ity s
hare
s -
- -
- (3
4.2)
- -
- -
- -
- -
Buy-
back
of e
quity
sha
res
by o
vers
eas
subs
idia
ry c
ompa
ny -
- -
- -
- -
- -
- -
- (1
0,11
0.3)
Tran
sfer
to c
apita
l red
empti
on re
serv
e on
bu
y-ba
ck o
f equ
ity s
hare
s -
- -
- -
- -
- -
7.5
-
- (7
.5)
Tran
sfer
red
from
Sur
plus
in C
onso
lidat
ed
Stat
emen
t of P
rofit
and
Los
s -
- -
- -
1,0
41.7
-
- -
- -
- (1
,041
.7)
Addi
tiona
l non
-con
trol
ling
inte
rest
aris
ing
on th
e ac
quisi
tion
of JS
C Bi
osin
tez
(Ref
er
note
78)
- -
- -
- -
- -
- -
--
-
Tran
sfer
red
from
Sur
plus
in C
onso
lidat
ed
Stat
emen
t of P
rofit
and
Los
s as
per
the
Loca
l Law
of a
n ov
erse
as s
ubsid
iary
- -
- 5
0.6
- -
- -
- -
- -
(50.
6)
Tran
sfer
on
exer
cise
of s
hare
opti
ons
- -
- -
54.
8 -
(54.
8) -
- -
- -
- Ba
lanc
e as
at M
arch
31,
201
7 2
,399
.3
- # 0
.0 5
07.5
1
1,89
4.6
2,0
83.4
2
6.4
- 4
3.8
7.5
1
.1
35,
578.
0 3
06,4
56.9
*R
epre
sent
s re
mea
sure
men
ts o
f the
defi
ned
plan
s #
(Mar
ch 3
1, 2
017:
` 7
177)
CONSOLIDATED STATEMENTOF CHANGES IN EQUITY
FOR THE YEAR ENDED MARCH 31, 2017

181ANNUAL REPORT 2016-17
CORPORATE OVERVIEW STATUTORY REPORTS FINANCIAL STATEMENTS01-07 08-79 80-278
` in
Mill
ion
Oth
er c
ompr
ehen
sive
inco
me
(OCI
) Att
ribut
able
to
ow
ners
of
par
ent
com
pany
Non
-co
ntro
lling
in
tere
sts
TO
TAL
Deb
t in
stru
men
t th
roug
h O
CI
Equ
ity
inst
rum
ent
thro
ugh
OCI
For
eign
cu
rren
cy
tran
slatio
n re
serv
e
Effe
ctive
po
rtion
of c
ash
flow
hed
ges
Bala
nce
as a
t Apr
il 1,
201
5 -
6,8
83.5
-
- 2
80,4
14.5
2
8,51
1.9
308
,926
.4
Profi
t for
the
year
- -
- -
45,
457.
1 1
1,12
6.0
56,
583.
1 Ex
chan
ge d
iffer
ence
aris
ing
on tr
ansla
tion
of fo
reig
n op
erati
ons
- -
15,9
43.1
- 15
,943
.1 1
,558
.9
17,5
02.0
Oth
er c
ompr
ehen
sive
inco
me
for t
he y
ear,
net o
f inc
ome
tax
1.3
(2
,802
.4)
- -
(3,1
48.6
)-
(3,1
48.6
)
Tota
l com
preh
ensi
ve in
com
e fo
r the
yea
r 1
.3
(2,8
02.4
)15
,943
.1 -
58,2
51.6
12,6
84.9
709,
936.
5 Pa
ymen
t of d
ivid
ends
- -
- -
(7,2
19.5
)(2
5.7)
(7,2
45.2
)Co
rpor
ate
divi
dend
tax
- -
- -
(1,4
69.7
) -
(1,4
69.7
)Re
cogn
ition
of s
hare
-bas
ed p
aym
ents
to e
mpl
oyee
s -
- -
- 9
8.8
- 98
.8
Issu
e of
equ
ity s
hare
s -
- -
- 9
1.2
- 91
.2
Issu
e of
equ
ity s
hare
s pu
rsua
nt to
the
sche
me
of a
mal
gam
ation
(Ref
er n
ote
66)
- -
- -
- -
- Tr
ansf
er o
n ex
erci
se o
f sha
re o
ption
s -
- -
- -
- -
Tran
sfer
red
from
deb
entu
res
rede
mpti
on re
serv
e on
repa
ymen
t of d
eben
ture
s -
- -
- -
- -
Tran
sfer
red
from
Sur
plus
in C
onso
lidat
ed S
tate
men
t of P
rofit
and
Los
s -
- -
- -
- -
Util
ised
durin
g th
e ye
ar -
- -
- (3
9.8)
- (3
9.8)
Buy-
back
of e
quity
sha
res
by s
ubsid
iary
com
pany
- -
- -
(302
.3)
(318
.6)
(620
.9)
Tran
sfer
red
to C
apita
l Res
erve
from
Con
solid
ated
Sta
tem
ent o
f Pro
fit a
nd
Loss
as
per t
he L
ocal
Law
of a
n ov
erse
as s
ubsid
iary
- -
- -
- -
-
Tran
sfer
red
from
Sur
plus
in C
onso
lidat
ed S
tate
men
t of P
rofit
and
Los
s as
per
the
Lo
cal L
aw o
f an
over
seas
sub
sidia
ry -
- -
- -
- -
Bala
nce
as a
t Mar
ch 3
1, 2
016
1.3
4
,081
.1
15,
943.
1 -
329,
824.
8 40
,852
.5
370,
677.
3 Pr
ofit f
or th
e ye
ar -
- -
- 6
9,64
3.7
8,8
18.6
78
,462
.3
Exch
ange
diff
eren
ce a
risin
g on
tran
slatio
n of
fore
ign
oper
ation
s -
- (8
,927
.4)
- (8
,927
.4)
(1,5
34.3
)(1
0,46
1.7)
Oth
er c
ompr
ehen
sive
inco
me
for t
he y
ear,
net o
f inc
ome
tax
(4.7
) (3
,741
.4)
- 4
6.2
(4,4
10.2
)-
(4,4
10.2
)To
tal c
ompr
ehen
sive
inco
me
for t
he y
ear
(4.7
) (3
,741
.4)
(8,9
27.4
)46
.2
56,3
06.1
7,
284.
3 63
,590
.4Pa
ymen
t of d
ivid
ends
- -
- -
(2,4
06.8
)(3
0.4)
(2,4
37.2
)Co
rpor
ate
divi
dend
tax
- -
- -
(490
.0)
- (4
90.0
)Re
cogn
ition
of s
hare
-bas
ed p
aym
ents
to e
mpl
oyee
s -
- -
- 3
2.3
- 3
2.3
Issu
e of
equ
ity s
hare
s -
- -
- 2
4.8
- 2
4.8
Buy-
back
of e
quity
sha
res
(Ref
er n
ote
65)
- -
- -
(6,7
50.0
) -
(6,7
50.0
)Ex
pend
iture
on
buy-
back
of e
quity
sha
res
- -
- -
(34.
2) -
(34.
2)Bu
y-ba
ck o
f equ
ity s
hare
s by
ove
rsea
s su
bsid
iary
com
pany
- -
- -
(10,
110.
3)
(1
0,44
7.5)
(20,
557.
8)Tr
ansf
er to
cap
ital r
edem
ption
rese
rve
on b
uy-b
ack
of e
quity
sha
res
- -
- -
- -
- Tr
ansf
erre
d fr
om S
urpl
us in
Con
solid
ated
Sta
tem
ent o
f Pro
fit a
nd L
oss
- -
- -
- -
- Ad
ditio
nal n
on-c
ontr
ollin
g in
tere
st a
risin
g on
the
acqu
isitio
n of
JSC
Bios
inte
z (R
efer
not
e 78
) -
- -
- -
249.
724
9.7
Tran
sfer
red
from
Sur
plus
in C
onso
lidat
ed S
tate
men
t of P
rofit
and
Los
s as
per
the
Lo
cal L
aw o
f an
over
seas
sub
sidia
ry -
- -
- -
- -
Tran
sfer
on
exer
cise
of s
hare
opti
ons
- -
- -
- -
- Ba
lanc
e as
at M
arch
31,
201
7(3
.4)
339.
7 7,
015.
7 46
.2
366,
396.
7 37
,908
.6
404,
305.
3
See
acco
mpa
nyin
g no
tes
1 to
80
to th
e C
onso
lidat
ed F
inan
cial
Sta
tem
ents
In te
rms
of o
ur re
port
att
ache
dFo
r and
on
beha
lf of
the
Boar
d of
Dire
ctor
s of
Su
n Ph
arm
aceu
tical
Indu
strie
s Lim
ited
For D
ELO
ITTE
HA
SKIN
S &
SEL
LS L
LPCh
arte
red
Acco
unta
nts
RAJE
SH K
. HIR
AN
AN
DA
NI
UD
AY V
. BA
LDO
TAD
ILIP
S. S
HA
NG
HV
ISU
DH
IR V
. VA
LIA
Part
ner
Chie
f Fin
anci
al O
ffice
rM
anag
ing
Dire
ctor
Who
letim
e D
irect
orM
umba
i, M
ay 2
6, 2
017
SUN
IL R
. AJM
ERA
SAIL
ESH
T. D
ESA
ICo
mpa
ny S
ecre
tary
Who
letim
e D
irect
orM
umba
i, M
ay 2
6, 2
017
CONSOLIDATED STATEMENTOF CHANGES IN EQUITY
FOR THE YEAR ENDED MARCH 31, 2017

SUN PHARMACEUTICAL INDUSTRIES L IMITED182
` in Million Year ended Year ended
March 31, 2017 March 31, 2016 A. Cash flow from operating activitiesProfit Before Tax 90,478.7 65,706.3 Adjustments for:
Depreciation and amortisation expense 12,647.5 10,375.3 Impairment of property, plant and equipment and other intangible assets (including amount considered in exceptional items in previous year)
203.6 4,981.1
Impairment of goodwill (including amount considered in exceptional items in previous year) - 1,942.3 (Gain) /loss on sale / write off of property, plant and equipment and other intangible assets, net (including amount considered in exceptional items)
108.8 (400.4)
Finance costs 3,998.0 5,232.4 Interest income (3,711.7) (3,572.2)Dividend income (420.5) (502.9)Net gain arising on financial assets measured at fair value through profit or loss (72.2) (353.3)Gain on sale of financial assets measured at fair value through profit or loss (479.3) (528.0)Gain on disposal of an associate entity (201.3) - Provision / write off for doubtful trade receivables / advances 341.8 1,602.1 Sundry balances written back (618.5) (175.2)Expense recognised in respect of share based payments to employees 32.3 98.8 Impairment of non-current investment in an associate [` Nil (Previous year ` 16,380)] - 0.0 Impairment of investments 6.8 166.8 Effect of exchange rate changes (6,828.6) (297.6)
Operating profit before working capital changes 95,485.4 84,275.5 Movements in working capital:
(Increase) in inventories (3,449.9) (1,667.4)(Increase) in trade receivables (2,934.5) (18,102.7)(Increase) / decrease in other assets (6,464.2) 20,922.4 Increase in trade payables 7,354.5 3,624.8 Decrease in other liabilities (1,530.7) (1,023.0)Increase / (decrease) in provisions 2,932.7 (1,286.4)
Cash generated from operations 91,393.3 86,743.2 Income tax paid (net of refund) (20,571.2) (19,884.6)
Net cash from operating activities (A) 70,822.1 66,858.6 B. Cash flow from investing activitiesPayments for purchase of property, plant and equipment (including capital-work-in-progress, other intangible assets and intangible assets under development)
(36,928.6) (34,035.2)
Proceeds from disposal of property, plant and equipment and other intangible assets 1,024.7 706.0 Loans / Inter corporate deposits
Given / placed (6,504.6) (5,045.7)Received back / matured 6,796.8 5,120.3
Purchase of investments [including associate and joint venture ` 1,543.6 Million (Previous year ` 1,071.6 Million)]
(388,310.4) (401,217.2)
Proceeds from sale of investments 391,943.9 416,414.1 Bank balances not considered as cash and cash equivalents
Fixed deposits / margin money placed (67,586.6) (66,025.5)Fixed deposits / margin money matured 55,224.3 46,731.2
Net cash outflow on acquisition of subsidiaries / business units (Refer note 78) (1,671.8) (10,255.5)Interest received 3,365.2 3,378.7 Receipt of rental on assets given under finance lease 10.6 10.0
CONSOLIDATED CASH FLOW STATEMENT FOR THE YEAR ENDED MARCH 31, 2017

183ANNUAL REPORT 2016-17
CORPORATE OVERVIEW STATUTORY REPORTS FINANCIAL STATEMENTS01-07 08-79 80-278
CONSOLIDATED CASH FLOW STATEMENT FOR THE YEAR ENDED MARCH 31, 2017
` in Million Year ended Year ended
March 31, 2017 March 31, 2016 Dividend received 420.5 502.9 Net cash used in investing activities (B) (42,216.0) (43,715.9)C. Cash flow from financing activities
Proceeds from borrowings 53,639.5 82,945.3 Repayment of borrowings (45,268.2) (90,764.9)Payment for buy-back of equity shares of parent and buy-back of equity shares held by non-controlling interests of subsidiary
(27,307.8) (469.5)
Dividend payment to non-controlling interests (30.4) (25.7)Payment for share buy-back expenses (34.2) - Net increase in working capital demand loans 2,349.9 1,038.6 Proceeds from issue of equity shares on exercise of stock options / share application money received 24.8 91.3 Finance costs (includes borrowing costs capitalised) (3,338.3) (3,013.9)Dividend paid (2,399.2) (7,216.8)Tax on dividend (490.0) (1,469.7)
Net cash used in financing activities (C) (22,853.9) (18,885.3)Net increase in cash and cash equivalents (A+B+C) 5,752.2 4,257.4
Cash and cash equivalents at the beginning of the year 80,316.9 71,834.9 Effect of exchange differences on restatement of foreign currency cash and cash equivalents 354.5 4,224.6
Cash and cash equivalents at the end of the year 86,423.6 80,316.9
Notes: ` in MillionAs at
March 31, 2017As at
March 31, 2016(a) Cash and cash equivalents comprises of
Balances with banksIn current accounts 49,192.3 53,731.0 In deposit accounts with original maturity less than 3 months 35,576.1 26,858.8
Cheques, drafts on hand 1,813.9 143.6 Cash on hand 45.7 18.0 Cash and cash equivalents (Refer note 14) 86,628.0 80,751.4 Less:- cash credit facilities included under loans repayable on demand in note 25 204.4 434.5 Cash and cash equivalents in cash flow statement 86,423.6 80,316.9
(b) For non cash transactions - refer note 67See accompanying notes 1 to 80 to the consolidated financial statements
In terms of our report attached For and on behalf of the Board of Directors of Sun Pharmaceutical Industries Limited
For DELOITTE HASKINS & SELLS LLPChartered Accountants
RAJESH K. HIRANANDANI UDAY V. BALDOTA DILIP S. SHANGHVI SUDHIR V. VALIAPartner Chief Financial Officer Managing Director Wholetime DirectorMumbai, May 26, 2017
SUNIL R. AJMERA SAILESH T. DESAICompany Secretary Wholetime Director
Mumbai, May 26, 2017

SUN PHARMACEUTICAL INDUSTRIES L IMITED184
NOTES TO THE CONSOLIDATED FINANCIAL STATEMENTS
FOR THE YEAR ENDED MARCH 31, 2017
1. General information Sun Pharmaceutical Industries Limited (“the Parent Company”)
is a public limited company incorporated and domiciled in India and has its listing on the BSE Limited and National Stock Exchange of India Limited. The addresses of its registered office and principal place of business are disclosed in the introduction to the annual report. The Company is in the business of manufacturing, developing and marketing a wide range of branded and generic formulations and Active Pharmaceutical Ingredients (APIs). The Parent Company and its subsidiaries (hereinafter referred to as “the Company” or “the Group”) have manufacturing locations spread across the world with trading and other incidental and related activities extending to the global markets.
2. Significant accounting policies2.1 Statement of compliance The Group has prepared its consolidated financial statements
for the year ended March 31, 2017 in accordance with Indian Accounting Standards (Ind AS) notified under the Companies (Indian Accounting Standards) Rules, 2015 (as amended) together with the comparative period data as at and for the year ended March 31, 2016. Further, the Group has prepared the opening consolidated balance sheet as at April 01, 2015 (the transition date) in accordance with Ind AS.
For all the periods up to the year ended March 31, 2016, the Group had prepared its financial statements in accordance with the requirements of previous GAAP, which includes Standards notified under the Companies (Accounting Standards) Rules, 2006 (as amended).
These are the Group’s first Ind AS financial statements. Refer Note 76 for the details of first-time adoption exemptions availed by the Group.
2.2 Basis of preparation and presentation These financial statements for the year ended March 31, 2017
are the first financial statements, the Group has prepared in accordance with Ind AS.
The consolidated financial statements have been prepared on the historical cost basis, except for: (i) certain financial instruments that are measured at fair values at the end of each reporting period; (ii) Non-current assets classified as held for
sale which are measured at the lower of their carrying amount and fair value less costs to sell; and (iii) defined benefit plans – plan assets that are measured at fair values at the end of each reporting period, as explained in the accounting policies below.
Historical cost is generally based on the fair value of the consideration given in exchange for goods and services.
Fair value is the price that would be received to sell an asset or paid to transfer a liability in an orderly transaction between market participants at the measurement date, regardless of whether that price is directly observable or estimated using another valuation technique. In estimating the fair value of an asset or a liability, the Group takes into account the characteristics of the asset or liability if market participants would take those characteristics into account when pricing the asset or liability at the measurement date. Fair value for measurement and/or disclosure purposes in these consolidated financial statements is determined on such a basis, except for share-based payment transactions that are within the scope of Ind AS 102, leasing transactions that are within the scope of Ind AS 17, and measurements that have some similarities to fair value but are not fair value, such as net realisable value in Ind AS 2 or value in use in Ind AS 36.
In addition, for financial reporting purposes, fair value measurements are categorised into Level 1, 2, or 3 based on the degree to which the inputs to the fair value measurements are observable and the significance of the inputs to the fair value measurement in its entirety, which are described as follows:
Level 1 inputs are quoted prices (unadjusted) in active markets for identical assets or liabilities that the entity can access at the measurement date;
Level 2 inputs are inputs, other than quoted prices included within Level 1, that are observable for the asset or liability, either directly or indirectly; and
Level 3 inputs are unobservable inputs for the asset or liability.
The Group has consistently applied the following accounting policies to all periods presented in these consolidated financial statements.

185ANNUAL REPORT 2016-17
NOTES TO THE CONSOLIDATED FINANCIAL STATEMENTS
FOR THE YEAR ENDED MARCH 31, 2017
CORPORATE OVERVIEW STATUTORY REPORTS FINANCIAL STATEMENTS01-07 08-79 80-278
a. Basis of consolidation The consolidated financial statements comprise the
financial statements of the Parent Company, and its subsidiaries as disclosed in Note 39. Control exists when the parent has power over the entity, is exposed, or has rights, to variable returns from its involvement with the entity and has the ability to affect those returns by using its power over the entity. Power is demonstrated through existing rights that give the ability to direct relevant activities, those which significantly affect the entity’s returns. Subsidiaries are consolidated from the date control commences until the date control ceases.
Profit or loss and each component of other comprehensive income are attributed to the owners of the Company and to the non-controlling interests. Total comprehensive income of subsidiaries is attributed to the owners of the Company and to the non-controlling interests even if this results in the non-controlling interests having a deficit balance.
The financial statements of the Group companies are consolidated on a line-by-line basis and intra-Group balances, transactions including unrealised gain / loss from such transactions and cash flows relating to transactions between members of the Group are eliminated upon consolidation. These financial statements are prepared by applying uniform accounting policies in use at the Group.
ChangesintheGroup’sownershipinterestsinexistingsubsidiaries
Changes in the Group’s ownership interests in subsidiaries that do not result in the Group losing control over the subsidiaries are accounted for as equity transactions. The carrying amounts of the Group’s interests and the non-controlling interests are adjusted to reflect the changes in their relative interests in the subsidiaries. Any difference between the amount by which the non-controlling interests are adjusted and the fair value of the consideration paid or received is recognised directly in equity and attributed to owners of the Company.
When the Group loses control of a subsidiary, a gain or loss is recognised in profit or loss and is calculated as the difference between (i) the aggregate of the fair value of the
consideration received and the fair value of any retained interest and (ii) the previous carrying amount of the assets (including goodwill), and liabilities of the subsidiary and any non-controlling interests. All amounts previously recognised in other comprehensive income in relation to that subsidiary are accounted for as if the Group had directly disposed off the related assets or liabilities of the subsidiary (i.e. reclassified to profit or loss or transferred to another category of equity as specified/ permitted by applicable Ind AS). The fair value of any investment retained in the former subsidiary at the date when control is lost is regarded as the fair value on initial recognition for subsequent accounting under Ind AS 109, or, when applicable, the cost on initial recognition of an investment in an associate or a joint venture.
Investments in Associates and Joint Ventures Associates are those entities over which the Group has
significant influence. Significant influence is the power to participate in the financial and operating policy decisions of the entities but is not control or joint control of those policies.
A joint venture is a joint arrangement whereby the parties that have joint control of the arrangement have rights to the net assets of the joint arrangement. Joint control is the contractually agreed sharing of control of an arrangement, which exists only when decisions about the relevant activities require unanimous consent of the parties sharing control.
The results and assets and liabilities of associates or joint ventures are incorporated in these consolidated financial statements using the equity method of accounting, except when the investment, or a portion thereof, is classified as held for sale, in which case it is accounted for in accordance with Ind AS 105. Under the equity method, an investment in an associate or a joint venture is initially recognised in the consolidated balance sheet at cost and adjusted thereafter to recognise the Group’s share of the profit or loss and other comprehensive income of the associate or joint venture. Distributions received from an associate or a joint venture reduce the carrying amount of the investment. The carrying value of the Group’s investment includes goodwill identified on acquisition,

SUN PHARMACEUTICAL INDUSTRIES L IMITED186
NOTES TO THE CONSOLIDATED FINANCIAL STATEMENTS
FOR THE YEAR ENDED MARCH 31, 2017
net of any accumulated impairment losses. When the Group’s share of losses of an associate or a joint venture exceeds its interest in that associate or joint venture, the carrying amount of that interest (including any long-term investments) is reduced to zero and the recognition of further losses is discontinued except to the extent that the Group has obligations or has made payments on behalf of the associate or joint venture.
An investment in an associate or a joint venture is accounted for using the equity method from the date on which the investee becomes an associate or a joint venture and discontinues from the date when the investment ceases to be an associate or a joint venture, or when the investment is classified as held for sale.
The difference between the carrying amount of the associate or joint venture at the date the equity method was discontinued, and the fair value of any retained interest and any proceeds from disposing of a part interest in the associate or joint venture is included in the determination of the gain or loss on disposal of the associate or joint venture. In addition, the Group accounts for all amounts previously recognised in other comprehensive income in relation to that associate or joint venture on the same basis as would be required if that associate or joint venture had directly disposed off the related assets or liabilities.
When a Group entity transacts with an associate or a joint venture of the Group, profits and losses resulting from the transactions with the associate or joint venture are recognised in the Group’s consolidated financial statements only to the extent of interests in the associate or joint venture that are not related to the Group.
b. Operating Cycle Based on the nature of products / activities of the
Company and the normal time between acquisition of assets and their realisation in cash or cash equivalents, the Company has determined its operating cycle as twelve months for the purpose of classifications of its assets and liabilities as current and non-current.
c. Business combinations The Group uses the acquisition method of accounting
to account for business combinations that occurred on or after April 01, 2015. The acquisition date is generally the date on which control is transferred to the acquirer. Judgment is applied in determining the acquisition date and determining whether control is transferred from one party to another. Control exists when the Group is exposed to, or has rights to, variable returns from its involvement with the entity and has the ability to affect those returns through power over the entity. In assessing control, potential voting rights are considered only if the rights are substantive. The Group measures goodwill as of the applicable acquisition date at the fair value of the consideration transferred, including the recognised amount of any non-controlling interest in the acquiree and the fair value of the acquirer’s previously held equity interest in the acquiree (if any), less the net recognised amount of the identifiable assets acquired and liabilities assumed. When the fair value of the net identifiable assets acquired and liabilities assumed exceeds the consideration transferred, a bargain purchase gain is recognised immediately in the OCI and accumulates the same in equity as Capital Reserve where there exists clear evidence of the underlying reasons for classifying the business combination as a bargain purchase else the gain is directly recognised in equity as Capital Reserve. Consideration transferred includes the fair values of the assets transferred, liabilities incurred by the Group to the previous owners of the acquiree, and equity interests issued by the Group. Consideration transferred also includes the fair value of any contingent consideration. Changes in the fair value of the contingent consideration that qualify as measurement period adjustments are adjusted retrospectively, with corresponding adjustments against goodwill or capital reserve, as the case maybe. The subsequent accounting for changes in the fair value of the contingent consideration that do not qualify as measurement period adjustments depends on how the contingent consideration is classified. Contingent consideration that is classified as equity is not remeasured at subsequent reporting dates and its subsequent settlement is accounted for within equity. Contingent consideration that is classified as an asset or a liability is

187ANNUAL REPORT 2016-17
NOTES TO THE CONSOLIDATED FINANCIAL STATEMENTS
FOR THE YEAR ENDED MARCH 31, 2017
CORPORATE OVERVIEW STATUTORY REPORTS FINANCIAL STATEMENTS01-07 08-79 80-278
remeasured at fair value at subsequent reporting dates with the corresponding gain or loss being recognised in profit or loss. Consideration transferred does not include amounts related to settlement of pre-existing relationships.
A contingent liability of the acquiree is assumed in a business combination only if such a liability represents a present obligation and arises from a past event, and its fair value can be measured reliably. On an acquisition-by-acquisition basis, the Group recognises any non-controlling interest in the acquiree either at fair value or at the non-controlling interest’s proportionate share of the acquiree’s identifiable net assets. Transaction costs that the Group incurs in connection with a business combination, such as finder’s fees, legal fees, due diligence fees and other professional and consulting fees, are expensed as incurred.
If the initial accounting for a business combination is incomplete by the end of the reporting period in which the combination occurs, the Group reports provisional amounts for the items for which the accounting is incomplete. Those provisional amounts are adjusted during the measurement period (see above), or additional assets or liabilities are recognised, to reflect new information obtained about facts and circumstances that existed at the acquisition date that, if known, would have affected the amounts recognised at that date.
d. Foreign currency Foreigncurrencytransactions In preparing the financial statements of each individual
Group entity, transactions in currencies other than the entity’s functional currency (foreign currencies) are translated at exchange rates at the dates of the transactions. Monetary assets and liabilities denominated in foreign currencies at the reporting date are translated into the functional currency at the exchange rate at that date Exchange differences arising on the settlement of monetary items or on translating monetary items at rates different from those at which they were translated on initial recognition during the period or in previous period are recognised in profit or loss in the period in which they arise except for:
exchange differences on foreign currency borrowings relating to assets under construction for future productive use, which are included in the cost of those assets when they are regarded as an adjustment to interest costs on those foreign currency borrowings.
exchange differences on transactions entered into in order to hedge certain foreign currency risks (see note 2.2.j). below for hedging accounting policies.
exchange differences on monetary items receivable from or payable to a foreign operation for which settlement is neither planned nor likely to occur (therefore forming part of the net investment in the foreign operation), which are recognised initially in other comprehensive income and reclassified from equity to profit or loss on repayment of the monetary items.
Non-monetary items that are measured in terms of historical cost in a foreign currency are not retranslated.
Foreignoperations For the purposes of presenting these consolidated
financial statements, the assets and liabilities of Group’s foreign operations, are translated to the Indian Rupees at exchange rates at the end of each reporting period. The income and expenses of such foreign operations are translated at the average exchange rates for the period. Resulting foreign currency differences are recognised in other comprehensive income/(loss) and presented within equity as part of Foreign Currency Translation Reserve (and attributed to non-controlling interests as appropriate). When a foreign operation is disposed off, the relevant amount in the Foreign Currency Translation Reserve is reclassified to profit or loss.
In addition, in relation to a partial disposal of a subsidiary that includes a foreign operation that does not result in the Group losing control over the subsidiary, the proportionate share of accumulated exchange differences are re-attributed to non-controlling interests and are not recognised in profit or loss. For all other partial disposals

SUN PHARMACEUTICAL INDUSTRIES L IMITED188
NOTES TO THE CONSOLIDATED FINANCIAL STATEMENTS
FOR THE YEAR ENDED MARCH 31, 2017
(i.e. partial disposals of associates or joint arrangements that do not result in the Group losing significant influence or joint control), the proportionate share of the accumulated exchange differences is reclassified to profit or loss.
Goodwill and fair value adjustments to identifiable assets acquired and liabilities assumed through acquisition of a foreign operation are treated as assets and liabilities of the foreign operation and translated at the rate of exchange prevailing at the end of each reporting period. Exchange differences arising are recognised in other comprehensive income.
e. Segment Reporting Operating segments are reported in a manner consistent
with the internal reporting provided to the chief operating decision maker. The chief operating decision maker of the Company is responsible for allocating resources and assessing performance of the operating segments and accordingly is identified as the chief operating decision maker.
f. Property, plant and equipment Items of property, plant and equipment are stated in
consolidated balance sheet at cost less accumulated depreciation and accumulated impairment losses, if any. Freehold land is not depreciated.
Properties in the course of construction for production, supply or administrative purposes are carried at cost, less any recognised impairment loss. Cost includes professional fees and, for qualifying assets, borrowing costs capitalised in accordance with the Group’s accounting policy. Such properties are classified to the appropriate categories of property, plant and equipment when completed and ready for intended use. Depreciation of these assets, on the same basis as other property assets, commences when the assets are ready for their intended use.
When parts of an item of property, plant and equipment have different useful lives, they are accounted for as separate items (major components) of property, plant and equipment.
An item of property, plant and equipment is derecognised upon disposal or when no future economic benefits are expected to arise from the continued use of the asset. Any gain or loss arising on the disposal or retirement of an item of property, plant and equipment is determined as the difference between the sales proceeds and the carrying amount of property, plant and equipment and is recognised in profit or loss.
Items of property, plant and equipment acquired through exchange of non-monetary assets are measured at fair value, unless the exchange transaction lacks commercial substance or the fair value of either the asset received or asset given up is not reliably measurable, in which case the acquired asset is measured at the carrying amount of the asset given up.
Depreciation is recognised so as to write off the cost of assets (other than freehold land and Capital work-in-progress) less their residual values on straight-line method over their useful lives as indicated in Part C of Schedule II of the Companies Act, 2013. Leasehold improvements are depreciated over period of the lease agreement or the useful life, whichever is shorter. Depreciation methods, useful lives and residual values are reviewed at the end of each reporting period, with the effect of any changes in estimate accounted for on a prospective basis.
The estimated useful lives are as follows:Asset Category No. of YearsLeasehold land 50-196Leasehold improvements 3-10Buildings 5-100Buildings taken under finance lease 10-40Buildings given under operating lease 30Plant and equipment 3-25Plant and equipment given under operating lease
2-15
Vehicles 3-15Office equipment 2-21Furniture and fixtures 2-17
Software for internal use, which is primarily acquired from third-party vendors and which is an integral part of a tangible asset, including consultancy charges for implementing the software, is capitalised as part of the

189ANNUAL REPORT 2016-17
NOTES TO THE CONSOLIDATED FINANCIAL STATEMENTS
FOR THE YEAR ENDED MARCH 31, 2017
CORPORATE OVERVIEW STATUTORY REPORTS FINANCIAL STATEMENTS01-07 08-79 80-278
related tangible asset. Subsequent costs associated with maintaining such software are recognised as expense as incurred. The capitalised costs are amortised over the lower of the estimated useful life of the software and the remaining useful life of the tangible fixed asset.
g. Goodwill and other intangible assets Goodwill Goodwill represents the excess of consideration
transferred, together with the amount of non-controlling interest in the acquiree, over the fair value of the Group’s share of identifiable net assets acquired. Goodwill is measured at cost less accumulated impairment losses. A cash-generating unit to which goodwill has been allocated is tested for impairment annually, or more frequently when there is an indication that the unit may be impaired. The goodwill acquired in a business combination is, for the purpose of impairment testing, allocated to cash-generating units that are expected to benefit from the synergies of the combination. Any impairment loss for goodwill is recognised directly in profit or loss. An impairment loss recognised for goodwill is not reversed in subsequent periods.
On disposal of a cash-generating unit to which goodwill is allocated, the goodwill associated with the disposed cash-generating unit is included in the carrying amount of the cash-generating unit when determining the gain or loss on disposal.
Other intangible assets Other intangible assets that are acquired by the Group
and that have finite useful lives are measured at cost less accumulated amortisation and accumulated impairment losses, if any. Subsequent expenditures are capitalised only when they increase the future economic benefits embodied in the specific asset to which they relate. Intangible assets with indefinite useful lives that are acquired separately are carried at cost less accumulated impairment losses.
Research and development Expenditure on research activities undertaken with the
prospect of gaining new scientific or technical knowledge and understanding are recognised as an expense when
incurred. Development activities involve a plan or design for the production of new or substantially improved products and processes. An internally-generated intangible asset arising from development is recognised if and only if all of the following have been demonstrated:
development costs can be measured reliably;
the product or process is technically and commercially feasible;
future economic benefits are probable; and
the Group intends to and has sufficient resources to complete development and to use or sell the asset.
The expenditure to be capitalised include the cost of materials and other costs directly attributable to preparing the asset for its intended use. Other development expenditure is recognised in profit or loss as incurred.
Payments to third parties that generally take the form of up-front payments and milestones for in-licensed products, compounds and intellectual property are capitalised since the probability of expected future economic benefits criterion is always considered to be satisfied for separately acquired intangible assets.
Acquired research and development intangible assets which are under development, are recognised as In-Process Research and Development assets (“IPR&D”). IPR&D assets are not amortised, but evaluated for potential impairment on an annual basis or when there are indications that the carrying value may not be recoverable. Any impairment charge on such IPR&D assets is recognised in profit or loss. Intangible assets relating to products under development, other intangible assets not available for use and intangible assets having indefinite useful life are tested for impairment annually, or more frequently when there is an indication that the assets may be impaired. All other intangible assets are tested for impairment when there are indications that the carrying value may not be recoverable.

SUN PHARMACEUTICAL INDUSTRIES L IMITED190
NOTES TO THE CONSOLIDATED FINANCIAL STATEMENTS
FOR THE YEAR ENDED MARCH 31, 2017
The consideration for acquisition of intangible asset which is based on reaching specific milestone that are dependent on the Group’s future activity is recognised only when the activity requiring the payment is performed.
Amortisation is recognised on a straight-line basis over the estimated useful lives of intangible assets. Intangible assets that are not available for use are amortised from the date they are available for use.
The estimated useful lives for Product related intangibles and Other intangibles ranges from 5 to 20 years.
The estimated useful life and the amortisation method for intangible assets with a finite useful life are reviewed at the end of each reporting period, with the effect of any changes in estimate being accounted for on a prospective basis.
The estimated useful life and amortisation method are reviewed at the end of each reporting period, with the effect of any changes in estimate being accounted for on a prospective basis.
De-recognitionofintangibleassets Intangible assets are de-recognised either on their disposal
or where no future economic benefits are expected from their use. Gain or loss arising on such de-recognition is recognised in profit or loss, and are measured as the difference between the net disposal proceeds, if any, and the carrying amount of respective intangible assets as on the date of de-recognition.
For transition to Ind AS, the Group has elected to continue with the carrying value of all of its intangible assets recognised as of April 01, 2015 i.e. transition date, measured as per the previous GAAP and use that carrying value as its deemed cost as of the transition date.
h. Impairment of non-financial assets other than goodwill The carrying amounts of the Group’s tangible and
intangible assets are reviewed at each reporting date to determine whether there is any indication of impairment. If any such indication exists, then the asset’s recoverable
amount is estimated in order to determine the extent of the impairment loss, if any.
The recoverable amount of an asset or cash-generating unit (as defined below) is the greater of its value in use and its fair value less costs to sell. In assessing value in use, the estimated future cash flows are discounted to their present value using a pre-tax discount rate that reflects current market assessments of the time value of money and the risks specific to the asset or the cash-generating unit for which the estimates of future cash flows have not been adjusted. For the purpose of impairment testing, assets are grouped together into the smallest group of assets that generates cash inflows from continuing use that are largely independent of the cash inflows of other assets or groups of assets (the “cash-generating unit”).
An impairment loss is recognised in the profit or loss if the estimated recoverable amount of an asset or its cash generating unit is lower than its carrying amount. Impairment losses recognised in respect of cash-generating units are allocated first to reduce the carrying amount of any goodwill allocated to the units and then to reduce the carrying amount of the other assets in the unit on a pro-rata basis.
In respect of assets other than goodwill, impairment losses recognised in prior periods are assessed at each reporting date for any indications that the loss has decreased or no longer exists. An impairment loss is reversed if there has been a change in the estimates used to determine the recoverable amount. An impairment loss is reversed only to the extent that the asset’s carrying amount does not exceed the carrying amount that would have been determined, net of depreciation or amortisation, if no impairment loss had been recognised.
i. Non-current assets held for sale Non-current assets and disposal groups are classified as
held for sale if their carrying amount will be recovered principally through a sale transaction rather than through continuing use. This condition is regarded as met only when the asset (or disposal group) is available for immediate sale in its present condition subject only to terms that are usual and customary for sales of such
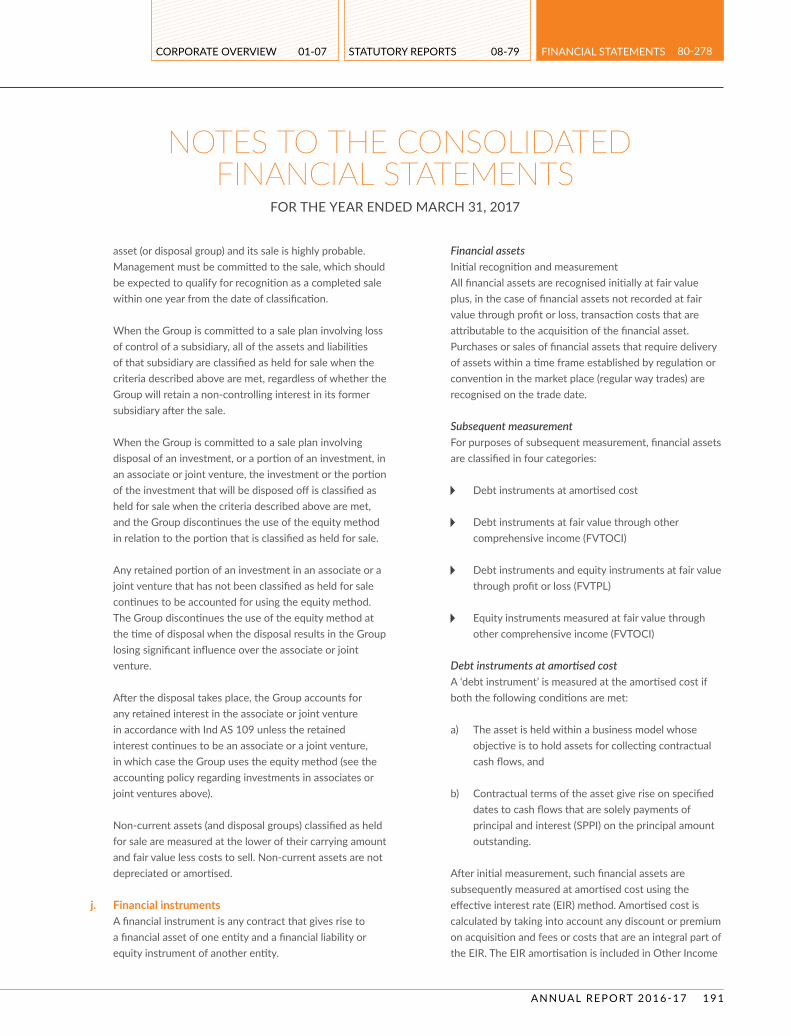
191ANNUAL REPORT 2016-17
NOTES TO THE CONSOLIDATED FINANCIAL STATEMENTS
FOR THE YEAR ENDED MARCH 31, 2017
CORPORATE OVERVIEW STATUTORY REPORTS FINANCIAL STATEMENTS01-07 08-79 80-278
asset (or disposal group) and its sale is highly probable. Management must be committed to the sale, which should be expected to qualify for recognition as a completed sale within one year from the date of classification.
When the Group is committed to a sale plan involving loss of control of a subsidiary, all of the assets and liabilities of that subsidiary are classified as held for sale when the criteria described above are met, regardless of whether the Group will retain a non-controlling interest in its former subsidiary after the sale.
When the Group is committed to a sale plan involving disposal of an investment, or a portion of an investment, in an associate or joint venture, the investment or the portion of the investment that will be disposed off is classified as held for sale when the criteria described above are met, and the Group discontinues the use of the equity method in relation to the portion that is classified as held for sale.
Any retained portion of an investment in an associate or a joint venture that has not been classified as held for sale continues to be accounted for using the equity method. The Group discontinues the use of the equity method at the time of disposal when the disposal results in the Group losing significant influence over the associate or joint venture.
After the disposal takes place, the Group accounts for any retained interest in the associate or joint venture in accordance with Ind AS 109 unless the retained interest continues to be an associate or a joint venture, in which case the Group uses the equity method (see the accounting policy regarding investments in associates or joint ventures above).
Non-current assets (and disposal groups) classified as held for sale are measured at the lower of their carrying amount and fair value less costs to sell. Non-current assets are not depreciated or amortised.
j. Financial instruments A financial instrument is any contract that gives rise to
a financial asset of one entity and a financial liability or equity instrument of another entity.
Financial assets Initial recognition and measurement All financial assets are recognised initially at fair value
plus, in the case of financial assets not recorded at fair value through profit or loss, transaction costs that are attributable to the acquisition of the financial asset. Purchases or sales of financial assets that require delivery of assets within a time frame established by regulation or convention in the market place (regular way trades) are recognised on the trade date.
Subsequent measurement For purposes of subsequent measurement, financial assets
are classified in four categories:
Debt instruments at amortised cost
Debt instruments at fair value through other comprehensive income (FVTOCI)
Debt instruments and equity instruments at fair value through profit or loss (FVTPL)
Equity instruments measured at fair value through other comprehensive income (FVTOCI)
Debtinstrumentsatamortisedcost A ‘debt instrument’ is measured at the amortised cost if
both the following conditions are met:
a) The asset is held within a business model whose objective is to hold assets for collecting contractual cash flows, and
b) Contractual terms of the asset give rise on specified dates to cash flows that are solely payments of principal and interest (SPPI) on the principal amount outstanding.
After initial measurement, such financial assets are subsequently measured at amortised cost using the effective interest rate (EIR) method. Amortised cost is calculated by taking into account any discount or premium on acquisition and fees or costs that are an integral part of the EIR. The EIR amortisation is included in Other Income

SUN PHARMACEUTICAL INDUSTRIES L IMITED192
NOTES TO THE CONSOLIDATED FINANCIAL STATEMENTS
FOR THE YEAR ENDED MARCH 31, 2017
in the profit or loss. The losses arising from impairment are recognised in the profit or loss.
Debt instrument at FVTOCI A ‘debt instrument’ is measured as at FVTOCI if both of
the following criteria are met:
a) The objective of the business model is achieved both by collecting contractual cash flows and selling the financial assets, and
b) The contractual terms of the instrument give rise on specified dates to cash flows that are SPPI on the principal amount outstanding.
Debt instruments included within the FVTOCI category are measured initially as well as at each reporting date at fair value. Fair value movements are recognised in the other comprehensive income (OCI). However, the Group recognises interest income, impairment losses & reversals and foreign exchange gain or loss in the profit or loss. On derecognition of the asset, cumulative gain or loss previously recognised in OCI is reclassified from the equity to profit or loss. Interest earned whilst holding FVTOCI debt instrument is reported as interest income using the EIR method.
Debt instrument at FVTPL FVTPL is a residual category for debt instruments. Any
debt instrument, which does not meet the criteria for categorisation as at amortised cost or as FVTOCI, is classified as at FVTPL.
In addition, the Group may elect to designate a debt instrument, which otherwise meets amortised cost or FVTOCI criteria, as at FVTPL. However, such election is allowed only if doing so reduces or eliminates a measurement or recognition inconsistency (referred to as ‘accounting mismatch’).
Equity instruments All equity instruments in scope of Ind AS 109 are
measured at fair value. Equity instruments which are held for trading and contingent consideration recognised by an acquirer in a business combination to which Ind
AS103 applies are classified as at FVTPL. For all other equity instruments, the Group may make an irrevocable election to present subsequent changes in the fair value in OCI. The Group makes such election on an instrument-by-instrument basis. The classification is made on initial recognition and is irrevocable.
If the Group decides to classify an equity instrument as at FVTOCI, then all fair value changes on the instrument, including foreign exchange gain or loss and excluding dividends, are recognised in the OCI. There is no recycling of the amounts from OCI to profit or loss, even on sale of investment. However, the Group may transfer the cumulative gain or loss within equity.
Equity instruments included within the FVTPL category are measured at fair value with all changes recognised in the profit or loss.
Derecognition A financial asset (or, where applicable, a part of a financial
asset or part of a group of similar financial assets) is primarily derecognised (i.e. removed from the Group’s consolidated balance sheet) when:
The contractual rights to receive cash flows from the asset have expired, or
The Group has transferred its rights to receive contractual cash flows from the asset or has assumed an obligation to pay the received cash flows in full without material delay to a third party under a ‘pass-through’ arrangement; and either (a) the Group has transferred substantially all the risks and rewards of the asset, or (b) the Group has neither transferred nor retained substantially all the risks and rewards of the asset, but has transferred control of the asset.
When the Group has transferred its rights to receive cash flows from an asset or has entered into a pass-through arrangement, it evaluates if and to what extent it has retained the risks and rewards of ownership. When it has neither transferred nor retained substantially all of the risks and rewards of the asset, nor transferred control of the asset, the Group continues to recognise the

193ANNUAL REPORT 2016-17
NOTES TO THE CONSOLIDATED FINANCIAL STATEMENTS
FOR THE YEAR ENDED MARCH 31, 2017
CORPORATE OVERVIEW STATUTORY REPORTS FINANCIAL STATEMENTS01-07 08-79 80-278
transferred asset to the extent of the Group’s continuing involvement. In that case, the Group also recognises an associated liability. The transferred asset and the associated liability are measured on a basis that reflects the rights and obligations that the Group has retained.
On derecognition of a financial asset in its entirety, the difference between the asset’s carrying amount and the sum of the consideration received and receivable and the cumulative gain or loss that had been recognised in OCI and accumulated in equity is recognised in profit or loss if such gain or loss would have otherwise been recognised in profit or loss on disposal of that financial asset.
Impairmentoffinancialassets In accordance with Ind AS 109, the Group applies
expected credit loss (ECL) model for measurement and recognition of impairment loss on the following financial assets and credit risk exposure:
a) Financial assets that are debt instruments, and are measured at amortised cost
b) Financial assets that are debt instruments and are measured as at FVTOCI
c) Lease receivables under Ind AS 17
d) Trade receivables or any contractual right to receive cash or another financial asset
e) Loan commitments which are not measured as at FVTPL
f) Financial guarantee contracts which are not measured as at FVTPL
The Group follows ‘simplified approach’ for recognition of impairment loss allowance on trade receivables or any contractual right to receive cash or another financial asset.
The application of simplified approach does not require the Group to track changes in credit risk. Rather, it recognises impairment loss allowance based on lifetime ECLs at each reporting date, right from its initial
recognition. As a practical expedient, the Group uses a provision matrix to determine impairment loss allowance on portfolio of its trade receivables. The provision matrix is based on its historically observed default rates over the expected life of the trade receivables and is adjusted for forward-looking estimates. At every reporting date, the historical observed default rates are updated and changes in the forward-looking estimates are analysed.
Financialliabilitiesandequityinstruments Classification as debt or equity Debt and equity instruments issued by a Group entity
are classified as either financial liabilities or as equity in accordance with the substance of the contractual arrangements and the definitions of a financial liability and an equity instrument.
Equity instruments An equity instrument is any contract that evidences a
residual interest in the assets of an entity after deducting all of its liabilities. Equity instruments issued by a Group entity are recognised at the proceeds received, net of direct issue costs.
Repurchase of the Parent Company’s own equity instruments is recognised and deducted directly in equity. No gain or loss is recognised in profit or loss on the purchase, sale, issue or cancellation of the Parent Company’s own equity instruments.
Compoundfinancialinstruments The component parts of compound financial instruments
(convertible notes) issued by the Group are classified separately as financial liabilities and equity in accordance with the substance of the contractual arrangements and the definitions of a financial liability and an equity instrument.
Initialrecognitionandmeasurement All financial liabilities are recognised initially at fair value
and, in the case of loans and borrowings and payables, net of directly attributable transaction costs.
Subsequent measurement All financial liabilities are subsequently measured at

SUN PHARMACEUTICAL INDUSTRIES L IMITED194
NOTES TO THE CONSOLIDATED FINANCIAL STATEMENTS
FOR THE YEAR ENDED MARCH 31, 2017
amortised cost using the effective interest method or at FVTPL.
Financialliabilitiesatfairvaluethroughprofitorloss Financial liabilities are classified as at FVTPL when
the financial liability is either contingent consideration recognised by the Group as an acquirer in a business combination to which Ind AS 103 applies or is held for trading or is designated upon initial recognition as at fair value through profit or loss. Financial liabilities are classified as held for trading if they are incurred principally for the purpose of repurchasing in the near term or on initial recognition it is part of a portfolio of identified financial instruments that the Group manages together and has a recent actual pattern of short-term profit-taking. This category also includes derivative entered into by the Group that are not designated and effective as hedging instruments in hedge relationships as defined by Ind AS 109. Gains or losses on liabilities held for trading are recognised in the profit or loss.
Financial liabilities designated upon initial recognition at fair value through profit or loss are designated as such at the initial date of recognition, and only if the criteria in Ind AS 109 are satisfied. For non-held-for-trading financial liabilities designated as at FVTPL, fair value gains/ losses attributable to changes in own credit risk are recognised in OCI, unless the recognition of the effects of changes in the liability’s credit risk in OCI would create or enlarge an accounting mismatch in profit or loss, in which case these effects of changes in credit risk are recognised in profit or loss. These gains/ loss are not subsequently transferred to profit or loss. All other changes in fair value of such liability are recognised in the consolidated statement of profit or loss.
Financialliabilitiessubsequentlymeasuredatamortisedcost Financial liabilities that are not held-for-trading and are
not designated as at FVTPL are measured at amortised cost in subsequent accounting periods. The carrying amounts of financial liabilities that are subsequently measured at amortised cost are determined based on the effective interest rate (EIR) method. Interest expense that is not capitalised as part of costs of an asset is included in the ‘Finance costs’ line item in the profit or loss.
After initial recognition, such financial liabilities are subsequently measured at amortised cost using the EIR method. Amortised cost is calculated by taking into account any discount or premium on acquisition and fees or costs that are an integral part of the EIR. The EIR amortisation is included as finance costs in the profit or loss.
Financial guarantee contracts Financial guarantee contracts are those contracts that
require a payment to be made to reimburse the holder for a loss it incurs because the specified debtor fails to make a payment when due in accordance with the terms of a debt instrument. Financial guarantee contracts are recognised initially as a liability at fair value and if not designated as at FVTPL, are subsequently measured at the higher of the amount of loss allowance determined as per impairment requirements of Ind AS 109 and the amount initially recognised less cumulative amount of income recognised.
Derecognition A financial liability is derecognised when the obligation
under the liability is discharged or cancelled or expires. When an existing financial liability is replaced by another from the same lender on substantially different terms, or the terms of an existing liability are substantially modified, such an exchange or modification is treated as the derecognition of the original liability and the recognition of a new liability. The difference between the carrying amount of the financial liability derecognised and the consideration paid and payable is recognised in profit or loss.
Embeddedderivatives Derivatives embedded in non-derivative host contracts
that are not financial assets within the scope of Ind AS 109 are accounted for as separate derivatives and recorded at fair value if their economic characteristics and risks are not closely related to those of the host contracts and the host contracts are not held for trading or designated at fair value though profit or loss. These embedded derivatives are measured at fair value with changes in fair value recognised in profit or loss, unless designated as effective hedging instruments.

195ANNUAL REPORT 2016-17
NOTES TO THE CONSOLIDATED FINANCIAL STATEMENTS
FOR THE YEAR ENDED MARCH 31, 2017
CORPORATE OVERVIEW STATUTORY REPORTS FINANCIAL STATEMENTS01-07 08-79 80-278
Reclassificationoffinancialassets The Group determines classification of financial assets and
liabilities on initial recognition. After initial recognition, no reclassification is made for financial assets which are equity instruments and financial liabilities. For financial assets which are debt instruments, a reclassification is made only if there is a change in the business model for managing those assets. Changes to the business model are expected to be infrequent. The Group’s senior management determines change in the business model as a result of external or internal changes which are significant to the Group’s operations. Such changes are evident to external parties. A change in the business model occurs when the Group either begins or ceases to perform an activity that is significant to its operations. If the Group reclassifies financial assets, it applies the reclassification prospectively from the reclassification date which is the first day of the immediately next reporting period following the change in business model. The Group does not restate any previously recognised gains, losses (including impairment gains or losses) or interest.
Derivativefinancialinstrumentsandhedgeaccounting Initial recognition and subsequent measurement The Group uses derivative financial instruments, such as
forward currency contracts, full currency swap, options and interest rate swaps to hedge its foreign currency risks and interest rate risks respectively. Such derivative financial instruments are initially recognised at fair value on the date on which a derivative contract is entered into and are subsequently re-measured at fair value at the end of each reporting period. Derivatives are carried as financial assets when the fair value is positive and as financial liabilities when the fair value is negative.
Any gains or losses arising from changes in the fair value of derivatives are taken directly to profit or loss, except for the effective portion of cash flow hedges, which is recognised in OCI and later reclassified to profit or loss when the hedge item affects profit or loss or treated as basis adjustment if a hedged forecast transaction subsequently results in the recognition of a non-financial asset or non-financial liability.
For the purpose of hedge accounting, hedges are classified as:
Fair value hedges when hedging the exposure to changes in the fair value of a recognised asset or liability or an unrecognised firm commitment.
Cash flow hedges when hedging the exposure to variability in cash flows that is either attributable to a particular risk associated with a recognised asset or liability or a highly probable forecast transaction or the foreign currency risk in an unrecognised firm commitment
Hedges of a net investment in a foreign operation
At the inception of a hedge relationship, the Group formally designates and documents the hedge relationship to which the Group wishes to apply hedge accounting and the risk management objective and strategy for undertaking the hedge. The documentation includes the Group’s risk management objective and strategy for undertaking hedge, the hedging/economic relationship, the hedged item or transaction, the nature of the risk being hedged, hedge ratio and how the entity will assess the effectiveness of changes in the hedging instrument’s fair value in offsetting the exposure to changes in the hedged item’s fair value or cash flows attributable to the hedged risk. Such hedges are expected to be highly effective in achieving offsetting changes in fair value or cash flows and are assessed on an ongoing basis to determine that they actually have been highly effective throughout the financial reporting periods for which they were designated.
Hedges that meet the strict criteria for hedge accounting are accounted for, as described below:
(i) Fair value hedges Changes in fair value of the designated portion
of derivatives that qualify as fair value hedges are recognised in profit or loss immediately, together with any changes in the fair value of the hedged asset or liability that are attributable to the hedged risk.

SUN PHARMACEUTICAL INDUSTRIES L IMITED196
NOTES TO THE CONSOLIDATED FINANCIAL STATEMENTS
FOR THE YEAR ENDED MARCH 31, 2017
(ii) Cash flow hedges The effective portion of changes in the fair value
of the hedging instrument is recognised in OCI in the cash flow hedge reserve, while any ineffective portion is recognised immediately in profit or loss. The Group uses forward currency contracts as hedges of its exposure to foreign currency risk in forecast transactions and firm commitments. Amounts recognised as OCI are transferred to profit or loss when the hedged transaction affects profit or loss, such as when a forecast sale occurs. When the hedged item is the cost of a non-financial asset or non-financial liability, the amounts recognised as OCI are transferred to the initial carrying amount of the non-financial asset or liability.
If the hedging instrument expires or is sold, terminated or exercised or if its designation as a hedge is revoked, or when the hedge no longer meets the criteria for hedge accounting, any cumulative gain or loss previously recognised in OCI remains separately in equity until the forecast transaction occurs or the foreign currency firm commitment is met. When a forecast transaction is no longer expected to occur, the gain or loss accumulated in equity is recognised immediately in profit or loss.
Treasury shares The Group has created an Employee Benefit Trust (EBT)
for providing share-based payment to its employees. The Group uses EBT as a vehicle for distributing shares to employees under the employee remuneration schemes. The Group treats EBT as its extension and shares held by EBT are treated as treasury shares.
Own equity instruments that are reacquired (treasury shares) are deducted from equity. No gain or loss is recognised in profit or loss on the purchase, sale, issue or cancellation of the Group’s own equity instruments. Consideration paid or received shall be recognised directly in equity.
Dividend distribution to equity holders of the parent
The Parent Company recognises a liability to make dividend distributions to equity holders of the parent
when the distribution is authorised and the distribution is no longer at the discretion of the Parent Company. As per the corporate laws in India, a distribution is authorised when it is approved by the shareholders. A corresponding amount is recognised directly in equity.
k. Leases A lease that transfers substantially all the risks and
rewards incidental to ownership to the lessee is classified as a finance lease. All other leases are classified as operating leases.
Group as a lessee Finance leases are capitalised at the commencement of
the lease at the inception date fair value of the leased property or, if lower, at the present value of the minimum lease payments. The corresponding liability to the lessor is included in the consolidated balance sheet as a finance lease obligation. Lease payments are apportioned between finance charges and reduction of the lease liability so as to achieve a constant rate of interest on the remaining balance of the liability. Finance charges are recognised in profit or loss as finance costs, unless they are directly attributable to qualifying assets, in which case they are capitalised in accordance with the Group’s general policy on the borrowing costs. Contingent rentals are recognised as expenses in the periods in which they are incurred.
Operating lease payments are generally recognised as an expense in the profit or loss on a straight-line basis over the lease term. Where the rentals are structured solely to increase in line with expected general inflation to compensate for the lessor’s expected inflationary cost increases, such increases are recognised in the year in which such benefits accrue. Contingent rentals arising under operating leases are also recognised as expenses in the periods in which they are incurred.
Group as a lessor Rental income from operating lease is generally recognised
on a straight-line basis over the term of the relevant lease. Where the rentals are structured solely to increase in line with expected general inflation to compensate for the Group’s expected inflationary cost increases, such increases are recognised in the year in which such benefits

197ANNUAL REPORT 2016-17
NOTES TO THE CONSOLIDATED FINANCIAL STATEMENTS
FOR THE YEAR ENDED MARCH 31, 2017
CORPORATE OVERVIEW STATUTORY REPORTS FINANCIAL STATEMENTS01-07 08-79 80-278
accrue. Initial direct costs incurred in negotiating and arranging an operating lease are added to the carrying amount of the leased asset and recognised over the lease term on the same basis as rental income. Contingent rents are recognised as revenue in the period in which they are earned.
Amounts due from lessees under finance leases are recorded as receivables at the Group’s net investment in the leases. Finance lease income is allocated to accounting periods so as to reflect a constant periodic rate of return on the Group’s net investment outstanding in respect of the leases.
l. Inventories Inventories consisting of raw materials and packing
materials, work-in-progress, stock-in-trade and finished goods are measured at the lower of cost and net realisable value. The cost of all categories of inventories is based on the weighted average method. Cost of raw materials and packing materials and stock-in-trade comprises cost of purchases. Cost of work-in-progress and finished goods comprises direct material, direct labour and an appropriate proportion of variable and fixed overhead expenditure, the latter being allocated on the basis of normal operating capacity. Cost of inventories also include all other costs incurred in bringing the inventories to their present location and condition.
Net realisable value is the estimated selling price in the ordinary course of business, less the estimated costs of completion and costs necessary to make the sale.
m. Cash and cash equivalents Cash and cash equivalent in the balance sheet comprise
cash at banks and on hand and short-term deposits with an original maturity of three months or less, which are subject to an insignificant risk of changes in value.
For the purpose of the consolidated statement of cash flows, cash and cash equivalents consist of cash and short-term deposits, as defined above, net of outstanding bank overdrafts as they are considered an integral part of the Group’s cash management.
n. Provisions, contingent liabilities and contingent assets Provisions are recognised when the Group has a present
obligation (legal or constructive) as a result of past event, it is probable that an outflow of resources embodying economic benefits will be required to settle the obligation and a reliable estimate can be made of the amount of obligation. If the effect of the time value of money is material, provisions are determined by discounting the expected future cash flows at a pre-tax rate that reflects current market assessments of the time value of money and the risks specific to the liability. Where discounting is used, the increase in the provision due to the passage of time is recognised as a finance cost.
Restructuring A provision for restructuring is recognised when the Group
has a detailed formal restructuring plan and has raised a valid expectation in those affected that it will carry out the restructuring by starting to implement the plan or announcing its main features to those affected by it. The measurement of a restructuring provision includes only the direct expenditure arising from the restructuring, which are those amounts that are both necessarily entailed by the restructuring and not associated with the ongoing activities of the entity.
Onerous contracts Present obligations arising under onerous contracts are
recognised and measured as provisions. An onerous contract is considered to exist where the Group has a contract under which the unavoidable costs of meeting the obligations under the contract exceed the economic benefit expected to be received from the contract.
Contingentliabilitiesandcontingentassets Contingent liability is disclosed for, (i) Possible obligations which will be confirmed only by
future events not wholly within the control of the Company, or
(ii) Present obligations arising from past events where it is not probable that an outflow of resources will be required to settle the obligation or a reliable estimate of the amount of the obligation cannot be made.

SUN PHARMACEUTICAL INDUSTRIES L IMITED198
NOTES TO THE CONSOLIDATED FINANCIAL STATEMENTS
FOR THE YEAR ENDED MARCH 31, 2017
Contingent Assets are not recognised in the financial statements.
o. Revenue Revenue from sale of goods include excise duty and is
measured at the fair value of the consideration received or receivable. Revenue is net of returns, sales tax, chargebacks, rebates and other similar allowances.
Saleofgoods Revenue from sale of goods is recognised when the
significant risks and rewards of ownership have been transferred to the buyer, usually on delivery of goods, it is probable that the economic benefit will flow to the Group, the associated costs and possible return of goods can be estimated reliably, there is neither continuing management involvement to the degree usually associated with ownership nor effective control over the goods sold and the amount of revenue can be measured reliably.
Provisions for chargeback, rebates, discounts and medicaid payments are estimated and provided for in the year of sales and recorded as reduction of revenue.
Sales Returns The Company accounts for sales returns accrual by
recording an allowance for sales returns concurrent with the recognition of revenue at the time of a product sale. This allowance is based on the Company’s estimate of expected sales returns. With respect to established products, the Company considers its historical experience of sales returns, levels of inventory in the distribution channel, estimated shelf life, product discontinuances, price changes of competitive products, and the introduction of competitive new products, to the extent each of these factors impact the Company’s business and markets. With respect to new products introduced by the Company, such products have historically been either extensions of an existing line of product where the Company has historical experience or in therapeutic categories where established products exist and are sold either by the Company or the Company’s competitors.
RenderingofServices Revenue from services rendered is recognised in the
consolidated statement profit and loss as the underlying services are performed. Upfront non-refundable payments received are deferred and recognised as revenue over the expected period over which the related services are expected to be performed.
Royalties Royalty revenue is recognised on an accrual basis in
accordance with the substance of the relevant agreement (provided that it is probable that economic benefits will flow to the Group and the amount of revenue can be measured reliably). Royalty arrangements that are based on production, sales and other measures are recognised by reference to the underlying arrangement.
Dividend and interest income Dividend income is recognised when the Group’s right
to receive the payment is established, which is generally when shareholders approve the dividend.
Interest income from a financial asset is recognised when it is probable that the economic benefits will flow to the Group and the amount of income can be measured reliably. Interest income is accrued on a time basis, by reference to the principal outstanding and at the effective interest rate applicable, which is the rate that exactly discounts estimated future cash receipts through the expected life of the financial asset to that asset’s net carrying amount on initial recognition.
p. Government grants The Group recognises government grants only when there
is reasonable assurance that the conditions attached to them will be complied with, and the grants will be received. When the grant relates to an expense item, it is recognised as income on a systematic basis over the periods that the related costs, for which it is intended to compensate, are expensed. When the grant relates to an asset, it is recognised as deferred revenue in the consolidated balance sheet and transferred to profit or loss on a systematic basis over the expected useful life of the related asset.
199ANNUAL REPORT 2016-17
NOTES TO THE CONSOLIDATED FINANCIAL STATEMENTS
FOR THE YEAR ENDED MARCH 31, 2017
CORPORATE OVERVIEW STATUTORY REPORTS FINANCIAL STATEMENTS01-07 08-79 80-278
q. Employee benefits Definedbenefitplans The liability in respect of defined benefit plans is calculated
using the projected unit credit method with actuarial valuations being carried out at the end of each annual reporting period. The present value of the defined benefit obligation is determined by discounting the estimated future cash outflows by reference to market yields at the end of the reporting period on government bonds. The currency and term of the government bonds shall be consistent with the currency and estimated term of the post-employment benefit obligations. The current service cost of the defined benefit plan, recognised in the profit or loss as employee benefits expense, reflects the increase in the defined benefit obligation resulting from employee service in the current year, benefit changes, curtailments and settlements. Past service costs are recognised in profit or loss in the period of a plan amendment. The net interest cost is calculated by applying the discount rate to the net balance of the defined benefit obligation and the fair value of plan assets. This cost is included in employee benefit expense in profit or loss. Actuarial gains and losses arising from experience adjustments and changes in actuarial assumptions are charged or credited to OCI in the period in which they arise and is reflected immediately in retained earnings and is not reclassified to profit or loss.
Terminationbenefits Termination benefits are recognised as an expense at the
earlier of the date when the Group can no longer withdraw the offer of those benefits and when the entity recognises costs for a restructuring that is within the scope of Ind AS 37 and involves the payment of termination benefits.
Short-termandOtherlong-termemployeebenefits A liability is recognised for benefits accruing to employees
in respect of wages and salaries, and casual leave in the period the related service is rendered at the undiscounted amount of the benefits expected to be paid in exchange for that service.
The Group’s net obligation in respect of other long term employee benefits is the amount of future benefit that employees have earned in return for their service in the
current and previous periods. That benefit is discounted to determine its present value.
Definedcontributionplans The Group’s contributions to defined contribution plans
are recognised as an expense as and when the services are received from the employees entitling them to the contributions.
Share-based payment arrangements The grant date fair value of options granted to
employees is recognised as an employee expense, with a corresponding increase in equity, on a straight line basis, over the vesting period, based on the Group’s estimate of equity instruments that will eventually vest. At the end of each reporting period, the Group revises its estimate of the number of equity instruments expected to vest. The impact of the revision of the original estimates, if any, is recognised in profit or loss such that the cumulative expense reflects the revised estimate, with a corresponding adjustment to the equity-settled employee benefits reserve.
For cash-settled share-based payments, a liability is recognised for the goods or services acquired, measured initially at the fair value of the liability. At the end of each reporting period until the liability is settled, and at the date of settlement, the fair value of the liability is remeasured, with any changes in fair value recognised in profit or loss for the year.
r. Income tax Income tax expense consists of current and deferred tax.
Income tax expense is recognised in profit or loss except to the extent that it relates to items recognised in OCI or directly in equity, in which case it is recognised in OCI or directly in equity respectively. Current tax is the expected tax payable on the taxable profit for the year, using tax rates enacted or substantively enacted by the end of the reporting period, and any adjustment to tax payable in respect of previous years. Current tax assets and tax liabilities are offset where the Company has a legally enforceable right to offset and intends either to settle on a net basis, or to realise the asset and settle the liability simultaneously.

SUN PHARMACEUTICAL INDUSTRIES L IMITED200
NOTES TO THE CONSOLIDATED FINANCIAL STATEMENTS
FOR THE YEAR ENDED MARCH 31, 2017
Deferred tax is recognised on temporary differences between the carrying amounts of assets and liabilities in the consolidated financial statements and the corresponding tax bases used in the computation of taxable profit. Deferred tax is not recognised for the temporary differences that arise on the initial recognition of assets or liabilities in a transaction that is not a business combination and that affects neither accounting nor taxable profits and taxable temporary differences arising upon the initial recognition of goodwill.
Deferred tax is measured at the tax rates that are expected to be applied to the temporary differences when they reverse, based on the laws that have been enacted or substantively enacted by the end of the reporting period. Deferred tax assets and liabilities are offset if there is a legally enforceable right to set off corresponding current tax assets against current tax liabilities and the deferred tax assets and deferred tax liabilities relate to income taxes levied by the same tax authority on the Company.
A deferred tax asset is recognised to the extent that it is probable that future taxable profits will be available against which the temporary difference can be utilised. Deferred tax assets are reviewed at each reporting date and are reduced to the extent that it is no longer probable that the related tax benefit will be realised. Withholding tax arising out of payment of dividends to shareholders under the Indian Income tax regulations is not considered as tax expense for the Company and all such taxes are recognised in the statement of changes in equity as part of the associated dividend payment.
Minimum Alternate Tax (‘MAT’) credit is recognised as deferred tax asset only when and to the extent there is convincing evidence that the Company will pay normal income tax during the period for which the MAT credit can be carried forward for set-off against the normal tax liability. MAT credit recognised as an asset is reviewed at each Balance Sheet date and written down to the extent the aforesaid convincing evidence no longer exists.
s. Earnings per share The Parent Company presents basic and diluted earnings
per share (“EPS”) data for its equity shares. Basic EPS is calculated by dividing the profit or loss attributable to equity shareholders of the Parent Company by the weighted average number of equity shares outstanding during the period. Diluted EPS is determined by adjusting the profit or loss attributable to equity shareholders and the weighted average number of equity shares outstanding for the effects of all dilutive potential ordinary shares, which includes all stock options granted to employees.
The number of equity shares and potentially dilutive equity shares are adjusted retrospectively for all periods presented for any share splits and bonus shares issues including for changes effected prior to the approval of the financial statements by the Board of Directors.
t. Recent Accounting pronouncements Standardsissuedbutnotyeteffective In March 2017, the Ministry of Corporate Affairs
issued the Companies (Indian Accounting Standards) (Amendments) Rules, 2017, notifying amendment to Ind AS 7, ‘Statement of cash flows’. This amendment is in accordance with the recent amendments made by International Accounting Standards Board (IASB) to IAS 7, ‘Statement of cash flows’. The amendment is applicable to the Company from April 01, 2017.
The amendments to Ind AS 7 requires the entities to provide disclosures that enable users of financial statements to evaluate changes in liabilities arising from financing activities, including both changes arising from cash flows and non-cash changes, suggesting inclusion of a reconciliation between the opening and closing balances in the Balance Sheet for liabilities arising from financing activities, to meet the disclosure requirement.
The Company is evaluating the requirements of the amendment and the effect on the financial statements is being evaluated.

201ANNUAL REPORT 2016-17
NOTES TO THE CONSOLIDATED FINANCIAL STATEMENTS
FOR THE YEAR ENDED MARCH 31, 2017
CORPORATE OVERVIEW STATUTORY REPORTS FINANCIAL STATEMENTS01-07 08-79 80-278
Note 3a
PROPERTY, PLANT AND EQUIPMENTFollowing are the changes in the carrying value of property, plant and equipment
` in MillionFreehold
landLeasehold
landBuildings Buildings
taken under
finance lease*
Leasehold improvement
on building
Buildings given under
operating lease *
Plant and equipment
Plant and equipment
given under
operating lease *
Furniture and
fixtures
Furniture and
fixtures given under
operating lease *
Vehicles Office equipment
Total
At cost / deemed costAs at April 01, 2015 2,098.5 1,827.5 36,513.0 758.4 175.9 205.5 57,004.1 39.9 2,796.0 0.6 1,135.5 1,062.4 103,617.3 Consolidation Adjustments
71.8 66.9 1,351.4 78.6 12.5 11.3 1,983.1 1.2 101.7 - (4.3) 31.9 3,706.1
Taken over on acquisition ^
83.5 - 429.1 30.0 - - 2,019.7 - 24.2 - 11.3 0.1 2,597.9
Additions 76.7 - 4,486.7 734.6 66.4 - 9,465.6 - 321.1 - 154.6 232.5 15,538.2 Disposals (61.0) - (731.6) - (0.9) - (1,317.6) (19.4) (111.2) - (158.4) (26.9) (2,427.0)As at March 31, 2016 2,269.5 1,894.4 42,048.6 1,601.6 253.9 216.8 69,154.9 21.7 3,131.8 0.6 1,138.7 1,300.0 123,032.5 Consolidation Adjustments
(73.6) (48.2) (739.6) (34.2) (5.4) (7.7) (1,193.8) (0.9) (98.7) (0.2) (48.9) (43.6) (2,294.8)
Taken over on acquisition ^
524.1 - 1,566.4 - - - 2,001.4 - 28.2 - 28.5 6.9 4,155.5
Additions 403.6 - 4,553.2 - - 94.3 10,502.5 - 652.4 - 189.2 452.4 16,847.6 Disposals (220.7) - (2,124.9) - - - (4,922.1) - (227.7) - (232.8) (18.4) (7,746.6)As at March 31, 2017 2,902.9 1,846.2 45,303.7 1,567.4 248.5 303.4 75,542.9 20.8 3,486.0 0.4 1,074.7 1,697.3 133,994.2 Accumulated depreciation and impairmentAs at April 01, 2015 - 180.7 6,877.6 746.4 22.2 34.3 23,406.2 17.3 1,525.3 0.6 354.0 452.0 33,616.6 Consolidation Adjustments
0.9 11.6 454.0 45.9 1.3 2.1 1,086.4 1.1 80.3 - 8.5 26.5 1,718.6
Depreciation expense - 23.6 1,376.6 78.1 15.2 0.5 6,338.5 3.1 309.0 - 208.4 217.6 8,570.6 Impairment losses recognised in consolidated statement of profit and loss
23.5 - 2,921.8 - - - 1,982.5 - 16.3 - 3.3 5.9 4,953.3
Eliminated on disposals of assets
- - (557.0) - (0.4) - (921.7) (1.2) (106.0) - (53.1) (18.6) (1,658.0)
As at March 31, 2016 24.4 215.9 11,073.0 870.4 38.3 36.9 31,891.9 20.3 1,824.9 0.6 521.1 683.4 47,201.1 Consolidation Adjustments
(1.9) (16.9) (210.9) (21.5) (0.9) (1.9) (719.5) (0.9) (54.6) (0.2) (38.1) (30.6) (1,097.9)
Depreciation expense - 23.9 1,295.8 83.5 3.6 33.1 6,309.5 0.8 312.8 - 189.4 269.7 8,522.1 Impairment losses recognised in consolidated statement of profit and loss
- 13.2 97.4 - - - 93.0 - - - - - 203.6
Eliminated on disposals of assets
- - (1,266.7) - - - (4,173.5) - (202.4) - (137.8) (7.2) (5,787.6)
As at March 31, 2017 22.5 236.1 10,988.6 932.4 41.0 68.1 33,401.4 20.2 1,880.7 0.4 534.6 915.3 49,041.3 Carrying amountAs at April 01, 2015 2,098.5 1,646.8 29,635.4 12.0 153.7 171.2 33,597.9 22.6 1,270.7 - 781.5 610.4 70,000.7 As at March 31, 2016 2,245.1 1,678.5 30,975.6 731.2 215.6 179.9 37,263.0 1.4 1,306.9 - 617.6 616.6 75,831.4 As at March 31, 2017 2,880.4 1,610.1 34,315.1 635.0 207.5 235.3 42,141.5 0.6 1,605.3 - 540.1 782.0 84,952.9

SUN PHARMACEUTICAL INDUSTRIES L IMITED202
NOTES TO THE CONSOLIDATED FINANCIAL STATEMENTS
FOR THE YEAR ENDED MARCH 31, 2017
Note 3b
OTHER INTANGIBLE ASSETSOther than internally generatedFollowing are the changes in the carrying value of intangible assets
` in Million
Computer Software
Trademarks, Designs and Other Intangible
Assets
Total
At cost or deemed costAs at April 01, 2015 1,197.8 18,415.1 19,612.9 Consolidation Adjustments 32.4 872.4 904.8 Taken over on acquisition ^ - 373.7 373.7 Additions 134.1 21,508.0 21,642.1 Disposals (5.9) (103.4) (109.3)As at March 31, 2016 1,358.4 41,065.8 42,424.2 Consolidation Adjustments (16.1) (1,461.4) (1,477.5)Taken over on acquisition ^ - 3.5 3.5 Additions 99.1 15,041.3 15,140.4 Eliminated on disposals of assets (25.8) (757.0) (782.8)As at March 31, 2017 1,415.6 53,892.2 55,307.8 Accumulated amortisation and impairmentAs at April 01, 2015 399.0 12,752.6 13,151.6 Consolidation Adjustments 20.8 915.8 936.6 Amortisation expense 282.2 1,522.5 1,804.7 Impairment losses recognised in consolidated statement of profit and loss (also included in exceptional items)
3.1 64.5 67.6
Eliminated on disposals of assets (3.2) (76.8) (80.0)As at March 31, 2016 701.9 15,178.6 15,880.5 Consolidation Adjustments (12.1) (579.8) (591.9)Amortisation expense 237.6 3,887.8 4,125.4 Eliminated on disposals of assets (15.1) (527.7) (542.8)As at March 31, 2017 912.3 17,958.9 18,871.2 Carrying amountAs at April 01, 2015 798.8 5,662.5 6,461.3 As at March 31, 2016 656.5 25,887.2 26,543.7 As at March 31, 2017 503.3 35,933.3 36,436.6
Footnotes :
(a) Buildings include ` 8,620 (As at March 31, 2016: ` 8,620 ; As at April 01, 2015: ` 8,620) towards cost of shares in a co-operative housing society. (b) Impairment losses for the year ended March 31, 2016 includes ` 39.8 Million is utilised from Revaluation Reserve. (c) Freehold land includes land valued at ` 25.5 Million (Previous Year ` 25.5 Million) pending registration in the name of the Parent Company. (d) Excludes Fixed Assets Held for Sale (Refer Note 73). (e) Deletions / Adjustments during the previous year includes refund received from authorities in respect of dismantling charges. (f) Borrowing cost capitalised during the year ` 110.3 Million (Previous Year ` 162.1 Million) * Refer Note 55 ^ Refer Note 78

203ANNUAL REPORT 2016-17
NOTES TO THE CONSOLIDATED FINANCIAL STATEMENTS
FOR THE YEAR ENDED MARCH 31, 2017
CORPORATE OVERVIEW STATUTORY REPORTS FINANCIAL STATEMENTS01-07 08-79 80-278
Note 4
INVESTMENTS IN ASSOCIATES (NON-CURRENT)(carrying amount determined using equity method of accounting)
` in Million
As at March 31, 2017
As at March 31, 2016
As atApril 01, 2015
Quantity Amount Quantity Amount Quantity AmountUnquoted, fully paidInvestments in equity instruments
Medinstill LLC 1,999 1,110.2 1,999 1,302.8 1,999 1,249.4 Daiichi Sankyo (Thailand) Limited Ordinary Shares of Baht 100 each fully paid
- - 206,670 444.5 206,670 440.4
scPharmaceuticals Inc. - 794.4 - - - - Investments in limited partnership
Fraizer Healthcare VII, L.P. - 1,436.9 - 733.0 - 304.4 Versant Venture Capital V, L.P. - 951.4 - 528.5 - 181.5
Investments in limited liability partnershipTrumpcard Advisors & Finvest LLP - 312.5 - - - - Generic Solar Power LLP [` 28,760 (As at March 31, 2016: ` 28,760)]
- 0.0 - 0.0 - -
Quoted, fully paid Investments in equity instruments (At cost, less impairment in value of investments)
Zenotech Laboratories Limited * Shares of ` 10 each fully paid
16,128,078 2,463.5 16,128,078 2,463.5 16,127,293 2,463.5
Less: Impairment in value of investment (2,463.5) (2,463.5) (2,463.5) 4,605.4 3,008.8 2,175.7
Aggregate carrying value of unquoted investments 4,605.4 3,008.8 2,175.7 Aggregate book value (carrying value)of quoted investments
2,463.5 2,463.5 2,463.5
Market value of quoted investment 570.1 541.9 729.8Aggregate amount of impairment in value of investments in associate
2,463.5 2,463.5 2,463.5
* The shares of this entity are thinly traded and therefore, market price has not been considered for the purpose of assessment of impairment in the value of its non-current investment.

SUN PHARMACEUTICAL INDUSTRIES L IMITED204
NOTES TO THE CONSOLIDATED FINANCIAL STATEMENTS
FOR THE YEAR ENDED MARCH 31, 2017
Note 5
INVESTMENTS IN JOINT VENTURES (NON-CURRENT)(carrying amount determined using equity method of accounting)
` in Million As at As at As at
March 31, 2017 March 31, 2016 April 01, 2015Quantity Amount Quantity Amount Quantity Amount
Unquoted, fully paidInvestments in equity instruments
MSD-Sun, LLC 10,564 0.7 10,564 0.7 10,564 0.7 S&I Ophthalmic LLC - 183.9 - 383.4 - 176.8 Artes Biotechnology GmbH 15,853 244.9 15,853 270.9 15,853 240.5
429.5 655.0 418.0 Aggregate carrying value of unquoted investments 429.5 655.0 418.0
Note 6
NON-CURRENT FINANCIAL INVESTMENTS` in Million
As at As at As atMarch 31, 2017 March 31, 2016 April 01, 2015
Quantity Amount Quantity Amount Quantity AmountIn equity instrumentsQuoted
Impax Laboratories Inc., Shares of USD 0.01 each fully paid
2,868,623 2,353.4 2,868,623 6,086.3 2,868,623 8,403.3
Krebs Biochemicals and Industries Limited Shares of ` 10 each fully paid
1,050,000 105.1 1,050,000 112.3 1,050,000 93.5
Perrigo Company plc - - 408 3.5 408 4.3 Teva Pharmaceutical Industries Ltd - - 80 0.3 80 0.3 Rekah Pharmaceutical Industries Ltd - - 20 0.0 20 0.0
UnquotedEnviro Infrastructure Co. Limited Shares of ` 10 each fully paid
100,000 1.0 100,000 1.0 100,000 1.0
Shivalik Solid Waste Management Limited Shares of ` 10 each fully paid
20,000 0.2 20,000 0.2 20,000 0.2
Nimbua Greenfield (Punjab) Limited Shares of ` 10 each fully paid
140,625 1.4 140,625 1.4 140,625 1.4
Shimal Research Laboratories Limited Shares of ` 10 each fully paid
9,340,000 934.0 9,340,000 934.0 9,340,000 934.0
Less: Impairment in value of investment (934.0) (934.0) (934.0)Biotech Consortium India Limited Shares of ` 10 each fully paid
50,000 0.5 50,000 0.5 50,000 0.5
Less: Impairment in value of investment (0.5) (0.5) (0.5)Silverstreet Development LLP [` 28,317 (As at March 31, 2016: ` 29,829)]
- 0.0 - 0.0 - -
Reanal Finomvegyszergyar Zrt. (Reanal Ltd) - 167.0 - 170.6 - 161.0 Less: Impairment in value of investment (167.0) (163.8) -

205ANNUAL REPORT 2016-17
NOTES TO THE CONSOLIDATED FINANCIAL STATEMENTS
FOR THE YEAR ENDED MARCH 31, 2017
CORPORATE OVERVIEW STATUTORY REPORTS FINANCIAL STATEMENTS01-07 08-79 80-278
` in Million As at As at As at
March 31, 2017 March 31, 2016 April 01, 2015Quantity Amount Quantity Amount Quantity Amount
Enceladus Pharmaceuticals BV, Netherlands - 290.6 - 296.8 - 280.0
In government securitiesQuoted
Government of Rajasthan UDAY non -SLR bond 7.75% Bond of ` 1 each fully paid maturing June 23, 2018
27,400,000 27.1 - - - -
Government of Rajasthan UDAY non -SLR bond 7.86% Bond of ` 1 each fully paid maturing June 23, 2019
27,400,000 27.3 - - - -
Government of Rajasthan UDAY non -SLR bond 8.01% Bond of ` 1 each fully paid maturing June 23, 2020
27,400,000 27.5 - - - -
Government of Rajasthan UDAY non -SLR bond 8.21% Bond of ` 1 each fully paid maturing June 23, 2025
100,000,000 103.7 - - - -
Government of Rajasthan UDAY non -SLR bond 8.39% Bond of ` 1 each fully paid maturing June 23, 2026
200,000,000 214.8 - - - -
Government of Uttar Pradesh UDAY non -SLR bond 8.21% Bond of ` 1 each fully paid maturing June 23, 2026
150,000,000 159.7 - - - -
UnquotedNational Savings Certificates [` 10,000 (March 31, 2016: ` 10,000, April 01, 2015: ` 10,000)]
- 0.0 - 0.0 - 0.0
In debentures/bondsQuoted
9.9% Non-convertible Debentures of ` 1,000,000 each fully paid of Housing Development Finance Corporation Ltd maturing on December 23, 2018
250 259.4 250 257.8 250 262.2
8.2% Bonds of ` 1,000 each fully paid of National Highways Authority of India maturing on January 25, 2022
61,809 66.7 61,809 65.3 61,809 63.6
8.2% Bonds of ` 1,000 each fully paid of Power Finance Corporation Ltd (Series I) maturing on February 1, 2022
142,393 153.6 142,393 150.4 142,393 146.6
8/8.15% Bonds of ` 1,000 each fully paid of Indian Railway Finance Corporation Ltd maturing on February 23, 2022
163,131 175.1 163,131 170.9 163,131 166.4
9.55% Debentures of ` 1,000,000 each fully paid of Canara Bank (Perpetual Bonds ) maturing on March 5, 2025
- - - - 500.0 499.7
10.75% Bonds of ` 1,000,000 each fully paid of IDBI Bank Ltd - OMNI (2014-15-Series II) Tier I Perpetual Bonds maturing on October 17, 2024
- - - - 500.0 536.5
Unquoted0% Optionally Fully Convertible Debentures of ` 100 each fully paid of Sun Speciality Chemicals Pvt Ltd
- - 1,156,500 106.0 1,156,500 97.1
Other investmentsUnquoted
Frazier Healthcare LS VIII - 96.2 - 3.3 - - 5AM Ventures IV, L.P. - 307.3 - 184.9 - 55.0 Atlas Venture Fund - 205.0 - 49.7 - -
4,575.1 7,496.9 10,772.1
Aggregate book value (carrying value) of quoted investments 3,673.4 6,846.8 10,176.4Aggregate amount of quoted investments at market value 3,673.4 6,846.8 10,176.4 Aggregate amount of unquoted investments before impairment 2,003.2 1,748.4 1,530.2 Aggregate amount of impairment in value of investments 1,101.5 1,098.3 934.5

SUN PHARMACEUTICAL INDUSTRIES L IMITED206
NOTES TO THE CONSOLIDATED FINANCIAL STATEMENTS
FOR THE YEAR ENDED MARCH 31, 2017
Note 7
LOANS (NON-CURRENT)` in Million
As at As at As atMarch 31, 2017 March 31, 2016 April 01, 2015
Receivable on account of assets given under finance lease - secured, considered good (Refer note 55)
- 378.7 389.3
Loans to employees/othersSecured, considered good 20.4 - 40.3 Unsecured, considered good 677.7 694.5 1,400.5 Doubtful 0.8 2.7 1.9 Less: Allowance for bad and doubtful loans (0.8) (2.7) (1.9)
698.1 1,073.2 1,830.1
Note 8
OTHER FINANCIAL ASSETS (NON-CURRENT)` in Million
As at As at As atMarch 31, 2017 March 31, 2016 April 01, 2015
Bank deposits with more than 12 months maturity 4,589.2 7,631.4 - Interest accrued on investment - - 48.9 Security deposits 462.0 390.8 441.2 Derivatives designated and effective in hedge accounting relationships 67.1 - - Derivatives not designated as hedges 627.7 1,442.2 1,011.5 Others 706.2* 345.5* 81.8
6,452.2 9,809.9 1,583.4 * includes receivable towards sale of manufacturing facility
Note 9
INCOME TAX ASSET (NET) [NON-CURRENT]` in Million
As at As at As atMarch 31, 2017 March 31, 2016 April 01, 2015
Advance income tax (net of provisions) 31,250.1 15,726.2 11,238.8 31,250.1 15,726.2 11,238.8

207ANNUAL REPORT 2016-17
NOTES TO THE CONSOLIDATED FINANCIAL STATEMENTS
FOR THE YEAR ENDED MARCH 31, 2017
CORPORATE OVERVIEW STATUTORY REPORTS FINANCIAL STATEMENTS01-07 08-79 80-278
Note 10
OTHER NON-CURRENT ASSETS` in Million
As at As at As atMarch 31, 2017 March 31, 2016 April 01, 2015
Capital advances 3,971.7 4,181.3 3,770.5 Prepaid expenses 91.1 87.6 47.0 Balances with government authorities 2,058.5 1,080.0 1,382.8 Advance for supply of goods and services 722.8 777.2 698.1 Other assets 17.7 26.7 35.8
6,861.8 6,152.8 5,934.2
Note 11
INVENTORIES` in Million
As at As at As atMarch 31, 2017 March 31, 2016 April 01, 2015
Lower of cost and net realisable valueRaw materials and packing materials 21,212.3 19,428.8 18,159.7 Goods in transit 598.7 1,067.0 604.0
21,811.0 20,495.8 18,763.7 Work-in-Progress 15,467.2 13,003.5 12,228.6 Finished Goods 24,986.8 24,076.6 19,436.2 Stock-in-trade 4,614.3 5,400.7 5,183.5 Goods in transit 94.7 305.7 283.2
4,709.0 5,706.4 5,466.7 Stores, spares and other materials 1,350.9 940.7 772.4 Goods in transit 3.2 2.4 1.3
1,354.1 943.1 773.7 68,328.1 64,225.4 56,668.9
(i) Inventory write downs are accounted, considering the nature of inventory, ageing, liquidation plan and net realisable value. Write downs of inventories amounted to ` 9,174.9 Million (March 31, 2016: ` 8,253.8 Million; April 01, 2015: ` 7,482.6 Million). The changes in write downs are recognised as an expense in the consolidated statement of profit and loss.
(ii) For details of inventories pledged as security refer note 69.
(iii) The cost of inventories recognised as an expense is disclosed in Notes 33, 34 and 37 and as purchases of stock-in-trade in the consolidated statement of profit and loss.

SUN PHARMACEUTICAL INDUSTRIES L IMITED208
NOTES TO THE CONSOLIDATED FINANCIAL STATEMENTS
FOR THE YEAR ENDED MARCH 31, 2017
Note 12
INVESTMENTS (CURRENT) ` in Million
As at As at As atMarch 31, 2017 March 31, 2016 April 01, 2015
Quantity Amount Quantity Amount Quantity Amount(Fully paid up)QuotedIn equity instruments
FS INVT CORP COM 22,316 14.2 14,659 9.1 - 3.8 In bonds/debenturesQuoted
0% 750 Debentures of IDFC of ` 1,000,000 maturing on April 9, 2015
- - - - 750 743.6
9.7% 250 Secured Non Convertible Redeemable Debentures of Housing Development Finance Corporation Ltd of ` 1,000,000 maturing on December 23, 2018
- - - - 250 252.5
I Shares New York Amt Free Muni 6,032 43.1 3,863 28.8 3,066 21.5 SPDR Ser TR Barclays Long - 2.0 - 1.9 - 1.9 Investment in bonds (Various small value investments) - 170.8 - 197.0 - 188.9
In Mutual funds*Unquoted Unit of ` 10 each fully paid
DHFL Pramercia - Insta Cash Plus Fund - Direct Plan - Growth 14,561 3.1 181,124 35.7 - - JP Morgan India -Liquid Fund - Growth Plan - - - - 2,671,655 48.5 DSP Merrill Lynch Mutual Fund - DSP BlackRock FMP -Series 161 - 12M-Dir-Growth
- - - - 20,000,000 217.9
Deutsche Mutual Fund-DWS Fixed Maturity Plan Series 63-Regular Plan-Growth
- - - - 15,000,000 163.7
Deutsche Mutual Fund - DWS Interval Fund - Annual Plan Series 1 Direct - Growth
- - - - 18,416,715 213.0
ICICI Prudential Mutual Fund-ICICI Prudential FMP Series 73-391 Days Plan G Direct Plan Cumulative
- - - - 25,000,000 275.3
ICICI Prudential Mutual Fund - ICICI Prudential FMP Series 73 - 369 Days Plan T Direct Plan Cumulative
- - - - 20,000,000 218.5
ICICI Prudential Mutual Fund - ICICI Prudential FMP Series 74 - 367 Days Plan D Direct Plan Cumulative
- - - - 40,000,000 434.5
ICICI Prudential Mutual Fund - ICICI Prudential FMP Series 74 - 368 Days Plan J Direct Plan Cumulative
- - - - 20,000,000 216.0
ICICI Prudential Mutual Fund - ICICI Prudential FMP Series 74 - 369 Days Plan K Direct Plan Cumulative
- - - - 15,000,000 161.5
ICICI Prudential Mutual Fund - ICICI Prudential FMP Series 74-370 Days Plan S Direct Plan Cumulative
- - - - 20,000,000 214.2
ICICI Prudential Mutual Fund - ICICI Prudential FMP Series 74 - 369 Days Plan B Direct Plan Cumulative
- - - - 30,000,000 325.9
Kotak Mutual Fund-Kotak FMP Series 145 Direct-Growth
- - - - 35,000,000 385.5
Kotak Mutual Fund - Kotak FMP Series 155 Direct-Growth
- - - - 25,000,000 273.0

209ANNUAL REPORT 2016-17
NOTES TO THE CONSOLIDATED FINANCIAL STATEMENTS
FOR THE YEAR ENDED MARCH 31, 2017
CORPORATE OVERVIEW STATUTORY REPORTS FINANCIAL STATEMENTS01-07 08-79 80-278
` in Million As at As at As at
March 31, 2017 March 31, 2016 April 01, 2015Quantity Amount Quantity Amount Quantity Amount
Kotak Mutual Fund - Kotak FMP Series 156 Direct - Growth
- - - - 25,000,000 272.5
Kotak Mutual Fund - Kotak FMP Series 157 Direct - Growth
- - - - 20,000,000 217.7
Kotak Mutual Fund - Kotak FMP Series 158 Direct
- - - - 20,000,000 217.4
L&T Mutual Fund-L&T FMP Series 10- Plan T - Growth
- - - - 25,000,000 272.9
Reliance Mutual Fund-Reliance Yearly Interval Fund -Series 1-Direct Plan-Growth Plan
- - 22,980,898 304.3 22,980,898 278.4
Reliance Mutual Fund - Reliance Fixed Horizon Fund - XXVI - Series 9 - Direct Plan Growth Plan
- - - - 50,000,000 545.4
Reliance Mutual Fund - Reliance Yearly Interval Fund - Series 6 -Direct Growth Plan
- - - - 45,929,287 544.9
Reliance Mutual Fund - Reliance Fixed Horizon Fund-XXVI-Series-20-Direct Plan-Growth Plan
- - - - 25,000,000 270.1
Reliance Mutual Fund - Reliance Yearly Interval Fund-Series 8-Direct Plan Growth Plan
- - - - 18,423,501 214.2
Reliance Mutual Fund - Reliance Fixed Horizon Fund-XXVI-Series-31-Direct Plan-Growth Plan
- - - - 30,000,000 320.9
Reliance Mutual Fund - Reliance Yearly Interval Fund - Series 9 - Direct Plan Growth Plan
- - - - 18,395,541 213.3
Reliance Mutual Fund - Reliance Fixed Horizon Fund -XXVI-Series 12-Direct Plan Growth Plan
- - - - 25,000,000 272.6
Religare Invesco Mutual Fund - Religare Invesco FMP Serie 23-Plan O (370 Days) - Direct Plan Growth
- - - - 20,000,000 213.3
Religare Invesco Mutual Fund - Religare Invesco FMP Series 23-Plan H (370 Days)-Direct Plan Growth
- - - - 10,000,000 109.0
Religare Invesco Mutual Fund - Religare Invesco FMP Series 23-Plan L (370 Days)-Direct Plan Growth
- - - - 21,000,000 227.8
Religare Aegon Mutual Fund - Religare Invesco FMP Series 23-Plan N (367 Days)-Direct Plan Growth
- - - - 20,000,000 214.3
Unit of ` 100 each fully paidICICI Prudential Mutual Fund-ICICI Prudential Liquid - Direct Plan - Growth
1,662,199 400.1 - - - -
ICICI Prudential Mutual Fund-ICICI Prudential Money Market Fund - Direct Plan - Growth
- - - - 6,825,507 1,320.7
Pramerica Mutual Fund-Pramerica Liquid Fund-Direct Plan-Growth Option fully paid
- - - - 335,039 500.5
Unit of ` 1000 each fully paidAxis Mutual Fund - Axis Liquid Fund-Direct Growth 110,943 200.1 - - - - Axis Mutual Fund - Axis Liquid Fund- Direct Plan Growth-CFDG
- - - - 483,934 750.7
BNP Paribas Mutual Fund- BNP Paribas Overnight Fund-Direct Plan Growth Option
- - 214,785 500.5 348,489 750.6
Baroda Pioneer Mutual Fund -Baroda Pioneer Liquid Fund Plan B-Growth
213,966 400.1 863,209 1,502.5 467,631 750.7
DSP BlackRock Mutual Fund-DSP BlackRock Liquidity Fund-Direct Plan-Growth
107,519 250.1 - - 249,960 500.5

SUN PHARMACEUTICAL INDUSTRIES L IMITED210
NOTES TO THE CONSOLIDATED FINANCIAL STATEMENTS
FOR THE YEAR ENDED MARCH 31, 2017
` in Million As at As at As at
March 31, 2017 March 31, 2016 April 01, 2015Quantity Amount Quantity Amount Quantity Amount
Indiabulls Mutual Fund-Indiabulls Liquid Fund-Direct Plan Growth
- - 508,251 750.7 367,372 500.2
Kotak Mutual Fund-Kotak Liquid Scheme Plan A-Direct Plan-Growth
- - - - 88,128 250.3
Kotak Mutual Fund-Kotak Floater Short Term - Direct Plan - Growth
187,362 500.1 334,131 830.8 - -
LIC Mutual Fund-LIC MF Liquid Fund - Direct - Growth 110,235 325.1 - - - - Principal Mutual Fund-Principal Cash Management Fund-Direct Plan Growth
- - - - 735,345 1,001.0
Reliance Mutual Fund-Reliance Liquid Fund - Cash Plan - Direct Growth Plan
- - 716,594 1,752.4 2,239,411 5,048.2
SBI Mutual Fund-SBI Magnum Insta Cash Fund-Direct Plan-Growth
- - - - 323,324 1,000.1
In commercial paperUnquoted
Housing Development Finance Corporation Limited Units of Face Value of ` 500,000 each
- - 1,000 491.0 - -
JM Financial Products Ltd Units of Face Value ` 500,000 each
- - 500 244.6 - -
Barclays Investment & Loans (India) Ltd- 90D CP May 5, 2016; Units of Face Value of ` 500,000 each
- - 1,000 488.8 - -
Barclays Investment & Loans (India) Ltd- 193D CP 04SP15 Units of Face Value of ` 500,000 each
- - - - 600 285.7
JM Financial Products Ltd- 180D CP 17AG15 Units of Face Value of ` 500,000 each
- - - - 500 238.6
2,308.8 7,138.1 21,662.2
* Investments in mutual funds have been fair valued at closing net asset value (NAV).
Aggregate book value (carrying value) of quoted investments
230.1 236.8 1,212.2
Aggregate amount of quoted investments at market value 230.1 236.8 1,212.2 Aggregate amount of unquoted investments before impairment
2,078.7 6,901.3 20,450.0
Aggregate amount of impairment in value of investments - - -

211ANNUAL REPORT 2016-17
NOTES TO THE CONSOLIDATED FINANCIAL STATEMENTS
FOR THE YEAR ENDED MARCH 31, 2017
CORPORATE OVERVIEW STATUTORY REPORTS FINANCIAL STATEMENTS01-07 08-79 80-278
Note 13
TRADE RECEIVABLES ` in Million
As at As at As atMarch 31, 2017 March 31, 2016 April 01, 2015
UnsecuredConsidered good 72,026.1 67,756.6 50,927.5 Doubtful 2,109.9 1,955.7 1,395.6
74,136.0 69,712.3 52,323.1 Less: Allowance for doubtful debts (expected credit loss allowance) (2,109.9) (1,955.7) (1,395.6)
72,026.1 67,756.6 50,927.5
Note 14
CASH AND CASH EQUIVALENTS` in Million
As at As at As atMarch 31, 2017 March 31, 2016 April 01, 2015
Balance with BanksIn current accounts 49,192.3 53,731.0 57,564.2 In deposit accounts with original maturity less than 3 months 35,576.1 26,858.8 14,896.4
Cheques, drafts on hand 1,813.9 143.6 164.4 Cash on hand 45.7 18.0 20.9
86,628.0 80,751.4 72,645.9
Note 15
BANK BALANCES OTHER THAN DISCLOSED IN NOTE 14 ABOVE` in Million
As at As at As atMarch 31, 2017 March 31, 2016 April 01, 2015
Deposit accounts (*) 64,573.9 50,904.8 36,957.8 Earmarked balances with banks
Unpaid dividend accounts 59.3 63.0 58.5 Balances held as margin money or security against guarantees and other commitments (*)
147.2 97.3 108.5
64,780.4 51,065.1 37,124.8 (*) Other bank balances include deposits amounting to ` 25,700.8 Million (March 31, 2016: ` 46,848.6 Million; April 01, 2015: ` 28,052.4 Million) and margin
monies amounting to ` 70.2 Million (March 31, 2016: ` 97.3 Million; April 01, 2015: ` 96.1 Million) which have an original maturity of more than 12 months.

SUN PHARMACEUTICAL INDUSTRIES L IMITED212
NOTES TO THE CONSOLIDATED FINANCIAL STATEMENTS
FOR THE YEAR ENDED MARCH 31, 2017
Note 16
LOANS (CURRENT)` in Million
As at As at As atMarch 31, 2017 March 31, 2016 April 01, 2015
Receivable on account of assets under finance lease - secured, considered good (Refer note 55)
- 10.6 10.0
Loans to related parties (Refer notes 49 and 70)Unsecured, considered good 454.0 - 238.0Doubtful 512.0 512.0 274.0 Less: allowance for doubtful loans (512.0) (512.0) (274.0)
454.0 - 238.0Loans to employees/others
Secured, considered good 8.7 409.0 3,360.6 Unsecured, considered good 9,728.1 10,295.9 6,873.0Doubtful 4.5 4.5 4.5 Less: allowance for doubtful Loans (4.5) (4.5) (4.5)
9,736.8 10,704.9 10,233.6 10,190.8 10,715.5 10,481.6
Note 17
OTHER FINANCIAL ASSETS (CURRENT) ` in Million
As at As at As atMarch 31, 2017 March 31, 2016 April 01, 2015
Interest accrued on investments/balances with banks 599.9 284.4 90.8 Interest accrued and due on loans (Refer notes 70)
Considered good 0.2 4.9 88.8 Doubtful 214.9 151.5 - Less: allowance for doubtful interest accrued and due on loans (214.9) (151.5) -
0.2 4.9 88.8 Security deposits 70.9 177.8 130.1 Derivatives not designated as hedges 627.7 92.4 934.7 Other* 959.8 331.3 25,507.5
2,258.5 890.8 26,751.9* As at March 31, 2017 and as at March 31, 2016 includes receivable towards sale of assets/manufacturing facilities. As at April 01, 2015 includes receivable from a third party, which has agreed to bear damages paid by a subsidiary on account of patent infringement in consideration of the Group agreeing to sell them pharmaceutical products at a negotiated discounted price for a specified period.
Note 18
OTHER CURRENT ASSETS ` in Million
As at As at As atMarch 31, 2017 March 31, 2016 April 01, 2015
Export incentives receivable 2,159.2 1,936.4 1,500.4 Prepaid expenses 2,601.6 2,537.3 2,537.4 Advances for supply of goods and services 9,023.1 4,422.7 1,828.9 Balances with government authorities 8,997.8 7,855.3 6,537.4 Other 168.2 46.5 115.3
22,949.9 16,798.2 12,519.4

213ANNUAL REPORT 2016-17
NOTES TO THE CONSOLIDATED FINANCIAL STATEMENTS
FOR THE YEAR ENDED MARCH 31, 2017
CORPORATE OVERVIEW STATUTORY REPORTS FINANCIAL STATEMENTS01-07 08-79 80-278
Note 19
EQUITY SHARE CAPITAL
As at As at As atMarch 31, 2017 March 31, 2016 April 01, 2015
Number of shares ` in Million Number of
shares ` in Million Number of shares ` in Million
AuthorisedEquity shares of ` 1 each 5,990,000,000 5,990.0 5,990,000,000 5,990.0 5,990,000,000 5,990.0 Cumulative preference shares of ` 100 each 100,000 10.0 100,000 10.0 100,000 10.0
5,990,100,000 6,000.0 5,990,100,000 6,000.0 5,990,100,000 6,000.0 Issued, subscribed and fully paid up
Equity shares of ` 1 each (Refer note 42) 2,399,260,815 2,399.3 2,406,605,118 2,406.6 2,071,163,910 2,071.2 2,399,260,815 2,399.3 2,406,605,118 2,406.6 2,071,163,910 2,071.2
Note 20
OTHER EQUITY(Refer consolidated statement of changes in Equity for detailed movement in other equity balances)
` in Million
As at As at As at
March 31, 2017 March 31, 2016 April 01, 2015A) Share application money pending allotment March 31, 2017: ` 7,177) [Refer Note 58 (b)]
0.0 6.7 149.0
B) Reserve and surplusCapital reserve 507.5 456.9 268.0 Securities premium reserve 11,894.6 18,585.2 18,220.3 Debenture redemption reserve 2,083.4 1,041.7 750.0 Share options outstanding account 26.4 48.9 82.1 Revaluation reserve - - 39.8 Amalgamation reserve 43.8 43.8 43.8 Capital redemption reserve 7.5 - - Legal reserve 1.1 1.1 0.9 General reserve 35,578.0 35,578.0 34,828.0 Retained earnings 306,456.9 251,630.4 216,743.1
C) Items of other comprehensive income (OCI)Debt instrument through other comprehensive income (3.4) 1.3 - Equity instrument through other comprehensive income 339.7 4,081.1 6,883.5 Foreign currency translation reserve 7,015.7 15,943.1 - Effective portion of cash flow hedges 46.2 - -
Total reserves and surplus 363,997.4 327,418.2 278,008.5
Nature and purpose of each reserveCapital reserve - During amalgamation / merger / acquisition, the excess of net assets taken, over the consideration paid, if any, is treated as capital reserve.
Securities premium reserve - The amount received in excess of face value of the equity shares is recognised in Securities Premium Reserve. In case of equity-settled share based payment transactions, the difference between fair value on grant date and nominal value of share is accounted as securities premium reserve. This reserve is utilised in accordance with the provisions of the Companies Act, 2013.

SUN PHARMACEUTICAL INDUSTRIES L IMITED214
NOTES TO THE CONSOLIDATED FINANCIAL STATEMENTS
FOR THE YEAR ENDED MARCH 31, 2017
Debenture redemption reserve - The Company is required to create a debenture redemption reserve out of the profits which is available for payment of dividend. This reserve was transferred to general reserve on redemption of debentures.
Share option outstanding account - The fair value of the equity settled share based payment transactions is recognised to share option outstanding account.
Revaluation reserve - Revaluation reserve is utilised in accordance with provisions of the Companies Act 2013.
Amalgamation reserve - The reserve was created pursuant to scheme of amalgamation in earlier years.
Capital redemption reserve - The Company has recognised capital redemption reserve on buyback of equity shares from its retained earnings. The amount in Capital Redemption Reserve is equal to nominal amount of the equity shares bought back.
Legal reserve - The reserve has been created by an overseas subsidiary in compliance with requirements of local laws.
General Reserve - The reserve arises on transfer portion of the net profit pursuant to the earlier provisions of Companies Act 1956. Mandatory transfer to general reserve is not required under the Companies Act, 2013.
Debt instrument through OCI - The Company has elected to recognise changes in the fair value of certain investment in debt instrument in other comprehensive income. This amount will be reclassified to retained earnings on derecognition of debt instrument.
Equity instrument through OCI - The Company has elected to recognise changes in the fair value of certain investment in equity instrument in other comprehensive income. This amount will be reclassified to retained earnings on derecognition of equity instrument.
Foreign currency translation reserve - Exchange differences relating to the translation of the results and net assets of the Group’s foreign operations from their functional currencies to the Group’s presentation currency (i.e. `) are recognised directly in the other comprehensive income and accumulated in foreign currency translation reserve. Exchange difference in the foreign currency translation reserve are reclassified to profit or loss on the disposal of the foreign operation.
Effective portion of cash flow hedges -The cash flow hedging reserve represents the cumulative effective portion of gains or losses arising on changes in fair value of designated portion of hedging instruments entered into for cash flow hedges. The cumulative gain or loss arising on the changes of the fair value of the designated portion of the hedging instruments that are recognised and accumulated under the cash flow hedge reserve will be reclassified to profit or loss only when the hedged transaction affects the profit or loss, or included as a basis adjustment to the non-financial hedged item.

215ANNUAL REPORT 2016-17
NOTES TO THE CONSOLIDATED FINANCIAL STATEMENTS
FOR THE YEAR ENDED MARCH 31, 2017
CORPORATE OVERVIEW STATUTORY REPORTS FINANCIAL STATEMENTS01-07 08-79 80-278
Note 21
BORROWINGS (NON-CURRENT) [Refer note 68]` in Million
As at As at As at
March 31, 2017 March 31, 2016 April 01, 2015Redeemable non-convertible debentures
Unsecured 5,000.0 10,000.0 - Term loans - - -
From banksSecured - - 327.4 Unsecured 8,583.4 20,309.9 12,677.7
From Department of BiotechnologySecured 108.2 77.3 77.3
From other partiesUnsecured - - 513.1
Long-term maturity of finance lease obligations 662.5 715.8 2.2Deferred payment liabilities 6.7 - -
14,360.8 31,103.0 13,597.7
Note 22
OTHER FINANCIAL LIABILITIES (NON-CURRENT)` in Million
As at As at As at
March 31, 2017 March 31, 2016 April 01, 2015Trade/security deposits received - 212.7 219.7 Interest accrued - 4.9 3.4 Derivatives not designated as hedge - - 253.5 Other financial liabilities* 1,048.0 1,624.6 1,340.1
1,048.0 1,842.2 1,816.7
* includes contractual and expected milestone obligation
Note 23
PROVISIONS (NON-CURRENT)` in Million
As at As at As at
March 31, 2017 March 31, 2016 April 01, 2015Employee benefits (Refer note 56) 3,146.3 2,353.9 1,894.6 Others (Refer note 61) 8,964.8 16,604.7 21,179.9
12,111.1 18,958.6 23,074.5

SUN PHARMACEUTICAL INDUSTRIES L IMITED216
NOTES TO THE CONSOLIDATED FINANCIAL STATEMENTS
FOR THE YEAR ENDED MARCH 31, 2017
Note 24
OTHER NON-CURRENT LIABILITIES` in Million
As at As at As at
March 31, 2017 March 31, 2016 April 01, 2015Advances from customer 6.2 - - Deferred government grants (Refer note 72) 137.9 166.5 129.8 Deferred revenue 105.7 87.8 - Others 9.3 - -
259.1 254.3 129.8
Note 25
BORROWINGS (CURRENT)` in Million
As at As at As at
March 31, 2017 March 31, 2016 April 01, 2015Loans repayable on demand
From banksSecured (Refer note 69) 198.1 2,560.5 2,739.0 Unsecured 47,046.5 48,040.8 46,808.1
From othersUnsecured 1,001.4 - -
Other loansFrom banks
Secured [Refer note 69] - 204.5 232.1 Unsecured - 1,255.4 -
Commercial paperUnsecured 18,303.2 - 12,347.5
66,549.2 52,061.2 62,126.7
Note 26
TRADE PAYABLES` in Million
As at As at As at
March 31, 2017 March 31, 2016 April 01, 2015Dues to micro and small enterprises 123.8 111.4 109.6 Others 43,830.1 35,717.8 32,320.7
43,953.9 35,829.2 32,430.3

217ANNUAL REPORT 2016-17
NOTES TO THE CONSOLIDATED FINANCIAL STATEMENTS
FOR THE YEAR ENDED MARCH 31, 2017
CORPORATE OVERVIEW STATUTORY REPORTS FINANCIAL STATEMENTS01-07 08-79 80-278
Note 27
OTHER FINANCIAL LIABILITIES (CURRENT)` in Million
As at As at As at
March 31, 2017 March 31, 2016 April 01, 2015Current maturities of long-term debt (Refer note 68) 17,368.2 1,770.7 13,975.8 Current maturities of finance lease obligations (Refer note 68) 39.5 32.7 21.9 Interest accrued 384.1 439.2 320.3 Unpaid dividends 76.6 72.8 65.7 Security deposits 179.4 17.7 15.8 Payables on purchase of property, plant and equipment 1,940.7 2,086.3 1,226.8 Derivatives designated as hedge 26.6 - - Derivatives not designated as hedge 217.4 216.1 5,322.6 Others* 1,883.8 2,237.8 3,188.5
22,116.3 6,873.3 24,137.4 * includes claims, recall charges, contractual and expected milestone obligations, trade and other commitments.
Note 28
OTHER CURRENT LIABILITIES` in Million
As at As at As at
March 31, 2017 March 31, 2016 April 01, 2015Statutory remittances 3,082.7 3,583.5 3,258.5 Advance from customers 1,205.8 719.1 370.0 Deferred revenue 13.4 - 6.6 Deferred government grants (Refer note 72) 12.6 - - Others 306.0 166.8 602.7
4,620.5 4,469.4 4,237.8
Note 29
PROVISIONS (CURRENT)` in Million
As at As at As at
March 31, 2017 March 31, 2016 April 01, 2015Employee benefits (Refer note 56) 2,220.3 1,631.5 1,717.2 Others (Refer note 61) 37,938.8 28,102.9 22,729.8
40,159.1 29,734.4 24,447.0
Note 30
CURRENT TAX LIABILITIES (NET)` in Million
As at As at As at
March 31, 2017 March 31, 2016 April 01, 2015Provision for income tax [Net of advance income tax] 1,471.2 2,472.1 5,914.7
1,471.2 2,472.1 5,914.7

SUN PHARMACEUTICAL INDUSTRIES L IMITED218
NOTES TO THE CONSOLIDATED FINANCIAL STATEMENTS
FOR THE YEAR ENDED MARCH 31, 2017
Note 31
REVENUE FROM OPERATIONS ` in Million
Year ended Year ended March 31, 2017 March 31, 2016
Sale of products (including excise duty) 302,642.3 278,880.7 Other operating revenues 13,142.1 5,989.6
315,784.4 284,870.3
Note 32
OTHER INCOME` in Million
Year ended Year ended March 31, 2017 March 31, 2016
Interest Income on:Bank deposits at amortised cost 1,602.3 1,263.3 Loans and advances at amortised cost 769.3 1,048.2 Investments carried at amortised cost 73.4 119.8 Investments in debt instruments at fair value through other comprehensive income 61.0 -Investments carried at fair value through profit or loss 9.7 5.1 Other financial assets carried at amortised cost 852.7 913.7 Financial guarantee given measured at fair value through profit or loss 2.5 2.0 Others 340.8 220.1
3,711.7 3,572.2 Dividend income on investments 420.5 502.9 Gain on sale of financial assets measured at fair value through profit or loss 479.3 528.0 Net gain arising on financial assets measured at fair value through profit or loss 72.2 353.3 Gain on disposal of property, plant and equipment and other intangible assets 18.7 591.7 Sundry balances written back 618.5 175.2 Insurance claims 134.4 284.7 Lease rental and hire charges 249.4 243.9 Income from government grants 20.9 - Gain on disposal of an associate entity 201.3 - Miscellaneous income 304.6 330.6
6,231.5 6,582.5
Note 33
COST OF MATERIALS CONSUMED` in Million
Year ended Year ended March 31, 2017 March 31, 2016
Raw and packing materialsInventories at the beginning of the year 20,495.8 18,763.7 Inventories acquired on acquisition (Refer note 78) 171.0 3,724.3 Purchases during the year 52,565.2 40,276.5 Foreign currency translation difference (174.9) (452.4)Inventories at the end of the year (21,811.0) (20,495.8)
51,246.1 41,816.3

219ANNUAL REPORT 2016-17
NOTES TO THE CONSOLIDATED FINANCIAL STATEMENTS
FOR THE YEAR ENDED MARCH 31, 2017
CORPORATE OVERVIEW STATUTORY REPORTS FINANCIAL STATEMENTS01-07 08-79 80-278
Note 34
CHANGES IN INVENTORIES OF FINISHED GOODS, STOCK-IN-TRADE AND WORK-IN-PROGRESS` in Million
Year ended Year ended March 31, 2017 March 31, 2016
Inventories at the beginning of the year 42,786.5 37,131.5 Foreign currency translation difference (339.8) 1,717.3 Inventories at the end of the year (45,163.0) (42,786.5)
(2,716.3) (3,937.7)
Note 35
EMPLOYEE BENEFITS EXPENSE` in Million
Year ended Year ended March 31, 2017 March 31, 2016
Salaries and wages 43,229.1 40,115.5 Contribution to provident and other funds 3,001.0 3,854.5 Share based payments to employees 32.3 98.8 Staff welfare expenses 2,760.6 3,654.3
49,023.0 47,723.1
Note 36
FINANCE COSTS ` in Million
Year ended Year ended March 31, 2017 March 31, 2016
Interest expense for financial liabilities carried at amortised cost 2,854.6 2,424.7 Interest expense others 10.9 68.3Exchange differences regarded as an adjustment to borrowing costs 694.7 2,201.4 Unwinding of discounts on provisions 437.8 538.0
3,998.0 5,232.4

SUN PHARMACEUTICAL INDUSTRIES L IMITED220
NOTES TO THE CONSOLIDATED FINANCIAL STATEMENTS
FOR THE YEAR ENDED MARCH 31, 2017
Note 37
OTHER EXPENSES` in Million
Year ended Year ended March 31, 2017 March 31, 2016
Consumption of materials, stores and spare parts 6,531.0 5,633.7 Conversion and other manufacturing charges 6,408.8 4,407.1 Power and fuel 5,250.9 5,454.4 Rent 1,237.8 1,329.6 Rates and taxes 3,022.3 2,659.2 Insurance 1,068.2 1,253.0 Selling and distribution 20,736.5 17,266.1 Commission on sale 1,130.0 1,462.6 Repairs and maintenance 4,097.0 4,145.1 Printing and stationery 859.7 761.6 Travelling and conveyance 5,250.1 3,671.3 Freight outward and handling charges 3,339.9 3,894.8 Communication 726.1 774.3 Provision/write off for doubtful trade receivables/advances 341.8 1,602.1 Professional, legal and consultancy 14,642.6 18,862.0 Donations 32.1 173.9 Loss on sale/write off of property, plant and equipment 127.5 155.8 Net (gain) / loss on foreign currency transactions (3,730.7) 2,925.0 Excise duty on sales 2,703.0 3,784.2 (Decrease)/increase of excise duty on inventories (5.2) 115.4 Payment to auditors (net of input credit, where applicable)
For audit [includes Nil (Previous year ` 0.7 Million) in respect of previous year] 170.4 193.3 For taxation matters 5.7 16.6 For other services 52.1 46.7 Reimbursement of expenses 4.7 0.9
Impairment of investments 6.8 166.8 Impairment of non-current investment in an associate [` Nil (Previous Year ` 16,380)] - 0.0 Impairment of property, plant and equipment and other intangible assets 203.6 511.2 Miscellaneous expenses 10,348.6 10,993.5
84,561.3 92,260.2

221ANNUAL REPORT 2016-17
NOTES TO THE CONSOLIDATED FINANCIAL STATEMENTS
FOR THE YEAR ENDED MARCH 31, 2017
CORPORATE OVERVIEW STATUTORY REPORTS FINANCIAL STATEMENTS01-07 08-79 80-278
Note 38
RESEARCH AND DEVELOPMENT EXPENDITURE INCLUDED IN THE CONSOLIDATED STATEMENT OF PROFIT AND LOSS
` in Million Year ended Year ended
March 31, 2017 March 31, 2016Salaries and wages 5,270.2 4,872.2 Contribution to provident and other funds 406.3 441.7 Staff welfare expenses 228.0 368.6 Consumption of materials, stores and spare parts 3,976.2 3,443.1 Power and fuel 366.3 347.8 Rates and taxes 318.0 104.0 Rent 92.9 136.9 Insurance 41.1 39.1 Repairs and maintenance 583.2 549.8 Printing and stationery 40.2 37.9 Travelling and conveyance 209.6 319.5 Communication 57.1 80.9 Professional, legal and consultancy 7,939.4 9,933.4 Loss on sale/write off of property, plant and equipment, Net (0.4) 0.6 Miscellaneous expenses 1,930.4 1,566.9
21,458.5 22,242.4 Less:Interest Income 2.0 2.1 Miscellaneous income 9.2 13.9 Receipts from Research activities 423.0 938.6
434.2 954.6 21,024.3 21,287.8
Note 39
a) List of entities included in the Consolidated Financial Statements is as under:Name of Subsidiaries Country of Incorporation Proportion of ownership interest for the year ended
March 31, 2017 March 31, 2016 April 01, 2015Parent CompanySun Pharmaceutical Industries LimitedDirect Subsidiaries
1 Green Eco Development Centre Limited India 100.00% 100.00% 100.00%2 Sun Pharmaceutical (Bangladesh) Limited Bangladesh 72.50% 72.50% 72.50%3 Sun Pharmaceutical Industries, Inc. United States of America 100.00% 100.00% 100.00%4 Sun Farmaceutica do Brasil Ltda. Brazil 100.00% 100.00% 100.00%5 Sun Pharma De Mexico S.A. DE C.V. Mexico 75.00% 75.00% 75.00%6 SPIL De Mexico S.A. DE C.V. Mexico 100.00% 100.00% 100.00%7 Sun Pharmaceutical Peru S.A.C. Peru 99.33% 99.33% 99.33%8 OOO "Sun Pharmaceutical Industries" Limited Russia 100.00% 100.00% 99.00%9 Sun Pharma De Venezuela, C.A. Venezuela 100.00% 100.00% 100.00%10 Sun Pharma Laboratories Limited India 100.00% 100.00% 100.00%11 Faststone Mercantile Company Private Limited India 100.00% 100.00% 100.00%12 Neetnav Real Estate Private Limited India 100.00% 100.00% 100.00%13 Realstone Multitrade Private Limited India 100.00% 100.00% 100.00%14 Skisen Labs Private Limited India 100.00% 100.00% 100.00%15 Sun Pharma Holdings Mauritius 100.00% 100.00% 100.00%

SUN PHARMACEUTICAL INDUSTRIES L IMITED222
NOTES TO THE CONSOLIDATED FINANCIAL STATEMENTS
FOR THE YEAR ENDED MARCH 31, 2017
a) List of entities included in the Consolidated Financial Statements is as under:Name of Subsidiaries Country of Incorporation Proportion of ownership interest for the year ended
March 31, 2017 March 31, 2016 April 01, 201516 Softdeal Trading Company Private Limited India 100.00% 100.00% 100.00%17 Ranbaxy Pharmacie Generiques France 100.00% 100.00% 100.00%18 Ranbaxy Drugs Limited India 100.00% 100.00% 100.00%19 Vidyut Investments Limited India 100.00% 100.00% 100.00%20 Gufic Pharma Limited India 100.00% 100.00% 100.00%21 Ranbaxy (Malaysia) Sdn. Bhd. Malaysia 71.22% 71.22% 71.22%22 Ranbaxy Nigeria Limited Nigeria 85.31% 85.31% 85.31%23 Ranbaxy (Netherlands) B.V. Netherlands 100.00% 100.00% 100.00%24 Foundation for Disease Elimination
and Control of IndiaIndia 100.00% - -
Step down Subsidiaries25 Caraco Pharma Inc. United States of America - 100.00%
(see note f)100.00%
26 Chattem Chemicals Inc. United States of America 100.00% 100.00% 100.00%27 The Taro Development Corporation United States of America 100.00% 100.00% 100.00%28 Alkaloida Chemical Company Zrt. Hungary 99.99% 99.99% 99.99%29 Sun Pharmaceuticals UK Limited United Kingdom 100.00% 100.00% 100.00%30 Sun Pharmaceutical Industries (Australia) Pty
LimitedAustralia 100.00% 100.00% 100.00%
31 Aditya Acquisition Company Ltd. Israel 100.00% 100.00% 100.00%32 Sun Pharmaceutical Industries (Europe) B.V. Netherlands 100.00% 100.00% 100.00%33 Sun Pharmaceuticals Italia S.R.L. Italy 100.00% 100.00% 100.00%34 Sun Pharmaceuticals Spain, S.L.U. Spain 100.00%
(see note g)100.00% 100.00%
35 Sun Pharmaceuticals Germany GmbH Germany 100.00% 100.00% 100.00%36 Sun Pharmaceuticals France France 100.00% 100.00% 100.00%37 Sun Pharma Global FZE United Arab Emirates 100.00% 100.00% 100.00%38 Sun Pharmaceuticals (SA) (Pty) Ltd. South Africa 100.00% 100.00% 100.00%39 Sun Global Canada Pty. Ltd. Canada 100.00% 100.00% 100.00%40 Sun Pharma Philippines, Inc. Philippines 100.00% 100.00% 100.00%41 Sun Pharmaceuticals Korea Ltd. Korea 100.00% 100.00% 100.00%42 Sun Global Development FZE United Arab Emirates 100.00% 100.00% 100.00%43 Caraco Pharmaceuticals Private Limited India 100.00% 100.00% 100.00%44 Sun Pharma Japan Ltd. Japan 100.00% 100.00% 100.00%45 Sun Pharma Healthcare FZE United Arab Emirates 100.00% 100.00% 100.00%46 Morley & Company, Inc. United States of America 100.00% 100.00% 100.00%47 Sun Laboratories FZE United Arab Emirates 100.00% 100.00% 100.00%48 Taro Pharmaceutical Industries Ltd. (TARO) Israel (See note b) 72.81% 68.98% 68.87%49 Taro Pharmaceuticals Inc. Canada 72.81% 68.98% 68.87%50 Taro Pharmaceuticals U.S.A., Inc. United States of America 72.81% 68.98% 68.87%51 Taro Pharmaceuticals North America, Inc. Cayman Islands, British
West Indies72.81% 68.98% 68.87%
52 Taro Pharmaceuticals Europe B.V. Netherlands 72.81% 68.98% 68.87%53 Taro Pharmaceuticals Ireland Limited Ireland 72.81% 68.98% 68.87%54 Taro International Ltd. Israel 72.81% 68.98% 68.87%55 Taro Pharmaceuticals (UK) Limited United Kingdom 72.81% 68.98% 68.87%

223ANNUAL REPORT 2016-17
NOTES TO THE CONSOLIDATED FINANCIAL STATEMENTS
FOR THE YEAR ENDED MARCH 31, 2017
CORPORATE OVERVIEW STATUTORY REPORTS FINANCIAL STATEMENTS01-07 08-79 80-278
a) List of entities included in the Consolidated Financial Statements is as under:Name of Subsidiaries Country of Incorporation Proportion of ownership interest for the year ended
March 31, 2017 March 31, 2016 April 01, 201556 Taro Hungary Intellectual Property Licensing
Limited Liability Company Hungary 72.81%
(see note h)68.98% 68.87%
57 3 Skyline LLC United States of America 72.81% 68.98% 68.87%58 One Commerce Drive LLC United States of America 72.81% 68.98% 68.87%59 Taro Pharmaceutical Laboratories Inc United States of America 72.81% 68.98% 68.87%60 Taro Pharmaceuticals Canada, Ltd. Canada 72.81% 68.98% 68.87%61 Taro Pharmaceutical India Private Limited India (see note i) 72.81% 68.98% 68.87%62 Alkaloida Sweden AB Sweden 100.00% 100.00% 100.00%63 Dusa Pharmaceuticals, Inc. United States of America 100.00% 100.00% 100.00%64 Dusa Pharmaceuticals New York, Inc. United States of America 100.00%
(see note j)100.00% 100.00%
65 Sirius Laboratories Inc United States of America 100.00% (see note k)
100.00% 100.00%
66 URL Pharma, Inc United States of America - 100.00% (see note l)
100.00%
67 AR Scientific, Inc United States of America - 100.00% (see note m)
100.00%
68 Mutual Pharmaceutical Company Inc. United States of America 100.00% 100.00% 100.00%69 United Research Laboratories, Limited United States of America - 100.00%
(see note n)100.00%
70 Dungan Mutual Associates, LLC United States of America 100.00% 100.00% 100.00%71 URL PharmPro, LLC United States of America 100.00% 100.00% 100.00%72 2 Independence Way LLC United States of America 100.00% 100.00% -73 Thallion Pharmaceutical Inc., United States of America 100.00% - -74 Universal Enterprises Private Limited India 100.00% 100.00% 100.00%75 Sun Pharma Switzerland Limited Switzerland 100.00% 100.00% 100.00%76 Silverstreet Developers LLP India - 100.00%
(see note p)100.00%
77 Sun Pharma East Africa Limited Kenya 100.00% 100.00% 100.00%78 Pharmalucence, Inc. United States of America 100.00% 100.00% 100.00%79 PI Real Estate Ventures, LLC United States of America 100.00% 100.00% 100.00%80 Sun Pharma ANZ Pty Ltd (Formerly known as
Ranbaxy Australia Pty Ltd)Australia 100.00% 100.00% 100.00%
81 Ranbaxy Belgium N.V. Belgium - 100.00% (see note q)
100.00%
82 Ranbaxy Farmaceutica Ltda. Brazil 100.00% 100.00% 100.00%83 Ranbaxy Pharmaceuticals Canada Inc. Canada 100.00% 100.00% 100.00%84 Ranbaxy Egypt LLC Egypt 100.00% 100.00% 100.00%85 Rexcel Egypt LLC Egypt 100.00% 100.00% 100.00%86 Office Pharmaceutique Industriel Et Hospitalier France 100.00% 100.00% 100.00%87 Basics GmbH Germany 100.00% 100.00% 100.00%88 Ranbaxy GmbH Germany 100.00% 100.00% 100.00%89 Ranbaxy Ireland Limited Ireland 100.00% 100.00% 100.00%90 Ranbaxy Italia S.P.A. Italy 100.00% 100.00% 100.00%91 Sun Pharmaceutical Industries S.A.C. (Formerly
known as Ranbaxy - PRP (Peru) S.A.C.)Peru 100.00% 100.00% 100.00%
92 Ranbaxy (Poland) Sp. Z o.o. Poland 100.00% 100.00% 100.00%93 Ranbaxy Portugal - Com E Desenvolv DeProd
Farmaceuticos Unipessoal LdaPortugal - 100.00%
(see note r)100.00%

SUN PHARMACEUTICAL INDUSTRIES L IMITED224
NOTES TO THE CONSOLIDATED FINANCIAL STATEMENTS
FOR THE YEAR ENDED MARCH 31, 2017
a) List of entities included in the Consolidated Financial Statements is as under:Name of Subsidiaries Country of Incorporation Proportion of ownership interest for the year ended
March 31, 2017 March 31, 2016 April 01, 201594 S.C Terapia S.A. Romania 96.70% 96.70% 96.70%95 AO Ranbaxy (Formerly known as ZAO Ranbaxy) Russia 100.00% 100.00% 100.00%96 Ranbaxy South Africa Proprietary Limited South Africa 100.00% 100.00% 100.00%97 Ranbaxy Pharmaceutical Proprietary Limited South Africa 100.00% 100.00% 100.00%98 Be-Tabs Investments Proprietary Limited South Africa 100.00% 100.00% 100.00%99 Sonke Pharmaceuticals Proprietary Limited South Africa 70.00% 70.00% 70.00%100 Laboratorios Ranbaxy, S.L.U. Spain 100.00% 100.00% 100.00%101 Ranbaxy (U.K.) Limited United Kingdom 100.00% 100.00% 100.00%102 Ranbaxy Holdings (U.K.) Limited United Kingdom 100.00% 100.00% 100.00%103 Ranbaxy Europe Limited United Kingdom 100.00% 100.00% 100.00%104 Ranbaxy Inc. United States of America 100.00% 100.00% 100.00%105 Ranbaxy Pharmaceuticals, Inc. United States of America 100.00% 100.00% 100.00%106 Ranbaxy (Thailand) Company Limited Thailand 100.00% 100.00% 100.00%107 Ohm Laboratories, Inc. United States of America 100.00% 100.00% 100.00%108 Ranbaxy Laboratories, Inc. United States of America 100.00% 100.00% 100.00%109 Ranbaxy Signature LLC United States of America 67.50% 67.50% 67.50%110 Sun Pharmaceuticals Morocco LLC (Formerly
known as Ranbaxy Morocco LLC) Morocco 100.00% 100.00% 100.00%
111 "Ranbaxy Pharmaceuticals Ukraine" LLC Ukraine 100.00% 100.00% 100.00%112 Perryton Wind Power LLC United States of America 100.00%
(see note s)100.00% -
113 Insite Vision Incorporated United States of America 100.00% 100.00% -114 Insite Vision Ltd. United Kingdom 100.00% 100.00% -115 Thea Acquisition Corporation United States of America - 100.00%
(see note t)-
116 Zalicus Pharmaceuticals Limited Canada - 100.00% (see note u)
-
117 Ocular Technologies SARL Switzerland 100.00% - -118 Sun Pharmaceutical Medicare Limited India 100.00% - -
119 JSC Biosintez Russia 85.10% - -120 Sun Pharmaceuticals Holdings USA, INC United States of America 100.00% - -121 Sun Pharma Medisales Private Limited
(Formerly known as Solrex Pharmaceuticals Company)
India 100.00% (see note v)
- -
Name of Partnership Firm122 Sun Pharma Medisales Private Limited
(Formerly known as Solrex Pharmaceuticals Company)
India - 100.00% (see note v)
100.00%
Name of Joint Venture Entities123 MSD - Sun LLC United States of America 50.00%
(see note w)50.00% 50.00%
124 S & I Ophthalmic LLC United States of America 50.00% 50.00% 50.00%125 Artes Biotechnology GmbH Germany 45.00% 45.00% 45.00%

225ANNUAL REPORT 2016-17
NOTES TO THE CONSOLIDATED FINANCIAL STATEMENTS
FOR THE YEAR ENDED MARCH 31, 2017
CORPORATE OVERVIEW STATUTORY REPORTS FINANCIAL STATEMENTS01-07 08-79 80-278
a) List of entities included in the Consolidated Financial Statements is as under:Name of Subsidiaries Country of Incorporation Proportion of ownership interest for the year ended
March 31, 2017 March 31, 2016 April 01, 2015Name of Subsidiary of Joint Venture Entity126 MSD - Sun FZ LLC United Arab Emirates 50.00%
(see note x)50.00% 50.00%
Name of Associates127 Zenotech Laboratories Limited India 46.84% 46.84% 46.84%128 Daiichi Sankyo (Thailand) Ltd. Thailand 26.90%
(see note y)26.90% 26.90%
129 Medinstill LLC United States of America 19.99% 19.99% 19.99%130 Fraizer Healthcare VII, L.P. United States of America 6.83% 6.83% 6.83%131 Versant Venture Capital V, L.P. United States of America 7.75% 7.75% 7.75%132 Generic Solar Power LLP India 28.76% 28.76% -133 scPharmaceuticals Inc. United States of America 14.58% - -134 Trumpcard Advisors and Finvest LLP India 40.61% - -
b Following are the details of the Group’s holding in Taro: March 31, 2017 March 31, 2016 April 01, 2015Voting power 81.87% 79.32% 79.24%Beneficial ownership 72.81% 68.98% 68.87%
c In respect of entities at Sr. Nos. 4 to 8, 95, 111, 113, 114, 117, 119 and 125 the reporting date is as of December 31, 2016 and different from the reporting date of the Parent Company. Adjustments have been made for significant transactions of these subsidiaries for the periods from January 01, 2016 to March 31, 2016 and January 01, 2017 to March 31, 2017, on the basis of their management accounts for the said periods.
d Entities at Sr. No. 24, 73, 117, 118, 119, 120, 133 and 134 have been incorporated / acquired during the year ended March 31, 2017.e Foundation for Disease Elimination and Control of India (FDEC), a wholly owned subsidiary incorporated in India on September 21, 2016
by the Company as part of its Corporate Social Responsibility (CSR) initiative. FDEC has entered into an MOU with Indian Council of Medical Research (ICMR) and Madhya Pradesh State Government to undertake the Mandla Malaria Elimination Demonstration Project with a goal to eliminate Malaria in the state. FDEC is a Section 8 company not considered for consolidation since it can apply its income for charitable purposes only and can raise funds/contribution independently.
f With effect from August 20, 2015, Caraco Pharma Inc., has been merged with Sun Pharmaceutical Industries, Inc.g With effect from March 02, 2017, Sun Pharmaceuticals Spain, S.L.U. has been liquidated. h With effect from February 16, 2017, Taro Hungary Intellectual Property Licensing Limited Liability Company has been liquidated. i Taro Pharmaceutical India Private Limited is under liquidation.j With effect from August 16, 2016 Dusa Pharmaceuticals New York, Inc. has been dissolved.k With effect from February 22, 2017 Sirius Laboratories Inc has been dissolved. l With effect from April 01, 2015, URL Pharma Inc., has merged into Mutual Pharmaceutical Company, Inc.m With effect from April 01, 2015, AR Scientific Inc. have merged into URL Pharma Inc. n With effect from April 01, 2015, United Research Laboratories Limited, have merged into URL Pharma Inc.o With effect from March 16, 2017, Thallion Pharmaceutical Inc. was acquired and merged with Taro Pharmaceuticals Inc. p During the previous year, the Company has sold its investment in Silverstreet Developers LLP with effect from April 01, 2015.q With effect from March 01, 2016, Ranbaxy Belgium N.V. has been liquidated. r With effect from June 30, 2015 Ranbaxy Portugal - Com E Desenvolv DeProd Farmaceuticos Unipessoal Lda has been liquidated.s With effect from April 07, 2016 Perryton Wind Power LLC has been liquidated.t With effect from November 02, 2015, Thea Acquisition Corporation has been merged with Insite Vision Incorporated.

SUN PHARMACEUTICAL INDUSTRIES L IMITED226
NOTES TO THE CONSOLIDATED FINANCIAL STATEMENTS
FOR THE YEAR ENDED MARCH 31, 2017
u Zalicus Pharmaceuticals Limited was acquired during the previous year and subsequently amalgamated in Taro Pharmaceuticals Inc., on October 05, 2015.
v During the year, Solrex Pharmaceuticals Company, a partnership firm has been converted into company which is known as Sun Pharma Medisales Private Limited.
w MSD - Sun LLC is under liquidation.x MSD-Sun FZ LLC has been deregistered with effect from September 14, 2015 having deregistration certificate dated December 25, 2016.y Daiichi Sankyo (Thailand) Ltd.’s shares were sold as per agreement dated May 13, 2016.z Significant Accounting Policies and other Notes to these Consolidated Financial Statements are intended to serve as a means of
informative disclosure and a guide for better understanding of the consolidated position of the Group. Recognising this purpose, the Group has disclosed only such policies and notes from the individual financial statements which fairly represent the needed disclosures. Lack of homogeneity and other similar considerations made it desirable to exclude some of them, which in the opinion of the management, could be better viewed when referred from the individual financial statements.
aa Disclosures mandated by the Companies Act, 2013 Schedule III Part II by way of additional information is given in Annexure A.
Note 40
CONTINGENT LIABILITIES (TO THE EXTENT NOT PROVIDED FOR)` in Million
As at As at As at
March 31, 2017 March 31, 2016 April 01, 2015A) Contingent Liabilities I) Claims against the Group not acknowledged as debts 1,147.6 1,127.5 1,021.3 II) Liabilities Disputed - Appeals filed with respect to :
Income Tax on account of Disallowances / Additions 56,712.6 30,915.7 26,706.7 Sales Tax on account of Rebate / Classification 45.7 38.8 37.9 Excise Duty on account of Valuation / Cenvat Credit 4,548.1 2,025.3 624.3 Environment cess 23.3 23.3 23.3 ESIC Contribution on account of applicability 132.8 0.2 0.2 Service tax on certain services performed outside India under reverse charge basis
- - 156.0
Drug Price Equalisation Account [DPEA] on account of demand towards unintended benefit, enjoyed by the Group
3,488.2 3,326.4 3,248.0
Demand by JDGFT, import duty with respect to import alleged to be in excess of entitlement as per the Advanced Licence Scheme
16.7 15.4 15.4
Fine imposed for anti-competitive settlement agreement by European Commission
715.4 773.0 689.1
Octroi demand on account of rate difference 171.0 171.0 171.0 Alleged breach of social security code contested by French subsidiary (maximum penalty amount)
- - 124.8
Other matters-employee /worker related cases, State Electricity Board, Punjab Land Preservation Act related matters etc.
126.0 284.4 302.7

227ANNUAL REPORT 2016-17
NOTES TO THE CONSOLIDATED FINANCIAL STATEMENTS
FOR THE YEAR ENDED MARCH 31, 2017
CORPORATE OVERVIEW STATUTORY REPORTS FINANCIAL STATEMENTS01-07 08-79 80-278
III) LEGAL PROCEEDINGS The Parent Company and / or its subsidiaries are involved in various legal proceedings including product liability, contracts, employment
claims, anti-trust and other regulatory matters relating to conduct of its business. The respective company records a provision in the financial statements to the extent that it concludes that a liability is probable and estimable based on the status of these cases, advice of the counsel, management assessment of the likely damages etc. The Group carries product liability insurance / is contractually indemni-fied by the manufacturer, for an amount it believes is sufficient for its needs. In respect of other claims, the Group believes, these claims do not constitute material litigation matters and with its meritorious defences the ultimate disposition of these matters are not expected to have material adverse effect on its Financial Statements.
` in Million
As at As at As at
March 31, 2017 March 31, 2016 April 01, 2015IV) Trade commitments - - 530.6
Footnote:Future cash outflows in respect of the above matters are determinable only on receipt of judgements / decisions pending at various forums / authorities.
B) Guarantees Given by the bankers on behalf of the Group 2,250.5 819.1 776.9
Note 41
COMMITMENTS (TO THE EXTENT NOT PROVIDED FOR)` in Million
Commitments As at As at As at
March 31, 2017 March 31, 2016 April 01, 2015I) Estimated amount of contracts remaining to be executed on capital
account (net of advances) 6,089.7 9,085.0 7,828.3
II) Derivative related commitments - forward foreign exchange contracts [Refer note 47(C)]
III) Lease related commitments [Refer notes 55]IV) Investment related commitments 1,715.2 246.6 2,894.4 V) Letters of credit for imports 2,362.0 1,855.9 1,489.2
Note 42
DISCLOSURES RELATING TO SHARE CAPITALi Rights, Preferences and Restrictions attached to Equity Shares The Equity Shares of the Parent Company, having par value of ` 1 per share, rank pari passu in all respects including voting rights and
entitlement to dividend.
ii Reconciliation of the number of shares and amount outstanding at the beginning and at the end of reporting period (As at April 01, 2015 excluding share suspense account):
As at As at March 31, 2017 March 31, 2016
Number of shares ` in Million Number of
shares ` in Million
Equity shares of ` 1 eachOpening Balance 2,406,605,118 2,406.6 2,071,163,910 2,071.2 Add: Shares allotted during the year pursuant to the scheme of Amalgamation (Refer note 66)
- - 334,770,248 334.8
Add : Shares allotted to employees on exercise of employee stock options [excluding shares held by ESOP trust (Refer note 58)]
155,697 0.2 670,960 0.6

SUN PHARMACEUTICAL INDUSTRIES L IMITED228
NOTES TO THE CONSOLIDATED FINANCIAL STATEMENTS
FOR THE YEAR ENDED MARCH 31, 2017
As at As at March 31, 2017 March 31, 2016
Number of shares ` in Million Number of
shares ` in Million
Less: Buy-back of shares (Refer note 65) (7,500,000) (7.5) - - Closing Balance 2,399,260,815 2,399.3 2,406,605,118 2,406.6
iii The movement of shares issued to ESOP Trust at face value is as follows (As at April 01, 2015 excluding share suspense account):
As at As at March 31, 2017 March 31, 2016
Equity shares of ` 1 each Number of shares ` in Million Number of
shares ` in Million
Opening balance 123,381 0.1 - -Add: Shares allotted during the year pursuant to scheme of amalgamation (Refer note 66)
- - 186,516 0.2
Add: Shares allotted to the ESOP trust - - 160,000 0.1 Less: shares allotted by ESOP trust on exercise of employee stock option (93,015) (0.1) (223,135) (0.2)Closing balance (March 31, 2017: ` 30,366) 30,366 0.0 123,381 0.1
iv 1,035,581,955 (upto March 31, 2016: 1,035,581,955; upto April 01, 2015: 1,035,581,955) equity shares of ` 1 each have been allotted as fully paid up bonus shares during the period of five years immediately preceding the date at which the Balance Sheet is prepared.
v 334,956,764 (upto March 31, 2016: 334,956,764; April 01, 2015: Nil) equity shares of ` 1 each have been allotted, pursuant to scheme of amalgamation, without payment being received in cash during the period of five years immediately preceding the date at which the Balance Sheet is prepared. (Refer note 66)
vi Refer note 58 for number of employee stock options against which equity shares are to be issued by the Parent Company / ESOP Trust upon vesting and exercise of those stock options.
vii 7,500,000 (upto March 31, 2016: Nil, upto April 01, 2015: Nil) equity shares of ` 1 each have been bought back during the period of five years immediately preceding the date at which the Balance Sheet is prepared. The shares bought back in the current year were cancelled immediately. (Refer note 65)
viii Equity Shares held by each shareholder holding more than 5 percent Equity Shares (As at April 01, 2015 excluding Share Suspense Account) in the Parent Company are as follows:
Name of Shareholders As at March 31, 2017 As at March 31, 2016 As at April 01, 2015
Number of shares held
% of Holding
Number of shares held
% of Holding
Number of shares held
% of Holding
Dilip Shantilal Shanghvi 230,285,690 9.6 231,140,480 9.6 231,140,480 11.2 Viditi Investment Pvt. Ltd. 200,846,362 8.4 201,385,320 8.4 201,385,320 9.7 Tejaskiran Pharmachem Industries Pvt. Ltd. 194,820,971 8.1 195,343,760 8.1 195,343,760 9.4 Family Investment Pvt. Ltd. 182,437,880 7.6 182,927,440 7.6 182,927,440 8.8 Quality Investments Pvt. Ltd. 182,379,237 7.6 182,868,640 7.6 182,868,640 8.8

229ANNUAL REPORT 2016-17
NOTES TO THE CONSOLIDATED FINANCIAL STATEMENTS
FOR THE YEAR ENDED MARCH 31, 2017
CORPORATE OVERVIEW STATUTORY REPORTS FINANCIAL STATEMENTS01-07 08-79 80-278
Note 43
RESEARCH AND DEVELOPMENT EXPENDITURE` in Million
Year ended Year ended
March 31, 2017 March 31, 2016Revenue, net (Excluding Depreciation) [Refer Note 38] 21,024.3 21,287.8Capital 1,679.3 782.6 Total 22,703.6 22,070.4
Note 44
CATEGORIES OF FINANCIAL INSTRUMENTS` in Million
As at March 31, 2017
Fair value through profit or loss
Fair value through other
comprehensive income
Amortised cost
Financial assetsInvestments
Equity instruments - quoted - 2,472.7 - Equity instruments - unquoted 293.2 - - Bonds/debentures - quoted - 870.7 - Government securities - quoted - 560.1 - Government securities - unquoted (` 10,000) - - 0.0 Mutual Funds - unquoted 2,078.7 - - Others - unquoted 608.5 - -
Loans to related parties - - 454.0 Loans to employees/others - - 10,434.9 Trade receivables - - 72,026.1 Bank deposits with more than 12 months maturity - - 4,589.2 Security deposits - - 532.9 Cash and cash equivalents - - 86,628.0 Bank balances other than Cash and cash equivalents - - 64,780.4 Interest accrued on investments / balances with banks - - 599.9 Interest accrued on investments loans - - 0.2 Derivatives designated as hedges - 67.1 - Other financial assets - - 1,666.0
Mandatorily measured :Derivatives not designated as hedges 1,255.4 - -
Total 4,235.8 3,970.6 241,711.6

SUN PHARMACEUTICAL INDUSTRIES L IMITED230
NOTES TO THE CONSOLIDATED FINANCIAL STATEMENTS
FOR THE YEAR ENDED MARCH 31, 2017
` in MillionAs at March 31, 2017
Fair value through profit or loss
Fair value through other
comprehensive income
Amortised cost
Financial liabilitiesBorrowings - - 80,910.0 Current maturities of long-term debt and finance lease obligations - - 17,407.7 Trade payables - - 43,953.9 Interest accrued but not due on borrowings - - 384.1 Unpaid dividends - - 76.6 Trade/security deposits - - 179.4 Payable on purchase of property, plant and equipment - - 1,940.7 Derivatives designated as hedges - 26.6 - Other financial liabilities - - 2,931.8
Mandatorily measured :Derivatives not designated as hedges 217.4 - -
Total 217.4 26.6 147,784.2
` in MillionAs at March 31, 2016
Fair value through profit or loss
Fair value through other
comprehensive income
Amortised cost
Financial assetsInvestments
Equity instruments - quoted 3.8 # 6,207.7 - Equity instruments - unquoted 306.2 - - Bonds/debentures - quoted - 872.1 - Bonds/debentures - unquoted - - 106.0 Government securities - unquoted (` 10,000) - - 0.0 Mutual Funds - unquoted 5,676.9 - - Commercial paper - unquoted - - 1,224.4 Others - unquoted 237.9 - -
Receivable on account of assets under finance lease - - 389.3 Loans to employees/others - - 11,399.4 Trade receivables - - 67,756.6 Bank deposits with more than 12 months maturity - - 7,631.4 Security deposits - - 568.6 Cash and cash equivalents - - 80,751.4 Bank balances other than cash and cash equivalents - - 51,065.1 Interest accrued on investments / balances with banks - - 284.4 Interest accrued on loans - - 4.9 Other financial assets - - 676.8
Mandatorily measured :Derivatives not designated as hedges 1,534.6 - -
Total 7,759.4 7,079.8 221,858.3 # Pertains to investment in equity instruments of Impax Laboratories Inc., Krebs Biochemicals and Industries Limited and FS INVT CORP COM.

231ANNUAL REPORT 2016-17
NOTES TO THE CONSOLIDATED FINANCIAL STATEMENTS
FOR THE YEAR ENDED MARCH 31, 2017
CORPORATE OVERVIEW STATUTORY REPORTS FINANCIAL STATEMENTS01-07 08-79 80-278
` in MillionAs at March 31, 2016
Fair value through profit or loss
Fair value through other
comprehensive income
Amortised cost
Financial liabilitiesBorrowings - - 83,164.2 Current maturities of long-term debt and finance lease obligations - - 1,803.4 Trade payables - - 35,829.2 Interest accrued but not due on borrowings - - 444.1 Unpaid dividends - - 72.8 Trade/security deposits - - 230.4 Payable on purchase of property, plant and equipment - - 2,086.3 Other financial liabilities - - 3,862.4
Mandatorily measured :Derivatives not designated as hedges 216.1 - -
Total 216.1 - 127,492.8
` in MillionAs at April 01, 2015
Fair value through profit or loss
Fair value through other
comprehensive income
Amortised cost
Financial assetsInvestments
Equity instruments - quoted 4.6 # 8,500.6 - Equity instruments - unquoted 443.6 - - Bonds/debentures - quoted - 2,883.4 - Bonds/debentures - unquoted - - 97.1 Government securities - unquoted (` 10,000) - - 0.0 Mutual Funds - unquoted 19,925.7 - - Commercial paper - unquoted - - 524.3 Others - unquoted 55.0 - -
Receivable on account of assets under finance lease - - 399.3 Loans to related parties - - 238.0 Loans to employees/others - - 11,674.4 Trade receivables - - 50,927.5 Cash and cash equivalents - - 72,645.9 Bank balances other than Cash and cash equivalents - - 37,124.8 Interest accrued on investments / balances with banks - - 139.7 Interest accrued and due on loans - - 88.8 Other financial assets - - 25,589.3 Security deposits - - 571.3
Mandatorily measured :Derivatives not designated as hedges 1,946.2 - -
Total 22,375.1 11,384.0 200,020.4 # Pertains to investment in equity instruments of Impax Laboratories Inc., Krebs Biochemicals and Industries Limited and FS INVT CORP COM.

SUN PHARMACEUTICAL INDUSTRIES L IMITED232
NOTES TO THE CONSOLIDATED FINANCIAL STATEMENTS
FOR THE YEAR ENDED MARCH 31, 2017
` in MillionAs at April 01, 2015
Fair value through profit or loss
Fair value through other
comprehensive income
Amortised cost
Financial liabilitiesBorrowings - - 75,724.4 Trade payables - - 32,440.5 Current maturities of long-term debt and finance lease obligations - - 13,997.7 Interest accrued but not due on borrowings - - 323.7 Unpaid dividends - - 65.7 Trade/security deposits - - 235.5 Payable on purchase of property, plant and equipment - - 1,226.8 Other financial liabilities - - 4,528.6
Mandatorily measured :Derivatives not designated as hedges 5,576.1 - -
Total 5,576.1 - 128,542.9
Note 45
FAIR VALUE HIERARCHY` in Million
As at March 31, 2017Level 1 Level 2 Level 3
Financial assets and liabilities measured at fair value-recurring fair value measurementsFinancial assetsInvestments
Equity instruments - quoted 2,472.7 - - Equity instruments - unquoted - - 293.2Bonds / debentures - quoted 870.7 - - Government securities - quoted 560.1 - - Mutual funds - unquoted 2,078.7 - - Others - unquoted - - 608.5
Derivatives not designated as hedges - 1,255.4 - Derivatives designated as hedges - 67.1 -
5,982.2 1,322.5 901.7Financial liabilities
Derivative not designated as hedges - 217.4 - Derivatives designated as hedges - 26.6 -
- 244.0 -

233ANNUAL REPORT 2016-17
NOTES TO THE CONSOLIDATED FINANCIAL STATEMENTS
FOR THE YEAR ENDED MARCH 31, 2017
CORPORATE OVERVIEW STATUTORY REPORTS FINANCIAL STATEMENTS01-07 08-79 80-278
` in MillionAs at March 31, 2016
Level 1 Level 2 Level 3Financial assets and liabilities measured at fair value-recurring fair value measurements
Financial assetsInvestments
Equity instruments - quoted 6,211.5 - - Equity instruments - unquoted - - 306.2 Bonds / debentures - quoted 872.1 - - Mutual funds - unquoted 5,676.9 - - Others - unquoted - - 237.9
Derivatives not designated as hedges - 1,534.6 - 12,760.5 1,534.6 544.1
Financial liabilitiesDerivative not designated as hedges - 216.1 -
- 216.1 -
` in MillionAs at April 01, 2015
Level 1 Level 2 Level 3Financial assets and liabilities measured at fair value-recurring fair value measurements
Financial assetsInvestments
Equity instruments - quoted 8,505.2 - - Equity instruments - unquoted - - 443.6 Bonds / debentures - quoted 2,883.4 - - Mutual funds - unquoted 19,925.7 - - Others - unquoted - - 55.0
Derivatives not designated as hedges - 1,946.2 - 31,314.3 1,946.2 498.6
Financial liabilitiesDerivative not designated as hedges - 5,576.1 -
- 5,576.1 -
Level 1 inputs are quoted prices (unadjusted) in active markets for identical assets or liabilities that the entity can access at the measurement date.
Level 2 inputs are inputs, other than quoted prices included within Level 1, that are observable for the asset or liability, either directly or indirectly.
Level 3 inputs are unobservable inputs for the asset or liability.
The investments included in Level 3 of fair value hierarchy have been valued using the cost approach to arrive at their fair value. The cost of unquoted investments approximates the fair value because there is wide range of possible fair value measurements and the costs represents estimate of fair value within that range.

SUN PHARMACEUTICAL INDUSTRIES L IMITED234
NOTES TO THE CONSOLIDATED FINANCIAL STATEMENTS
FOR THE YEAR ENDED MARCH 31, 2017
The investments which are fair valued through other comprehensive income, are not held for trading. Instead, they are held for medium or long-term strategic purpose. Upon the application of Ind AS 109, the Group has chosen to designate these investments in equity instruments as at fair value through other comprehensive income as the management believe that this provides a more meaningful presentation for medium or long-term strategic investments, than reflecting changes in fair value immediately in consolidated statement of profit and loss. There were no transfers between Level 1 and 2 in the period.
The management considers that the carrying amount of financial assets and financial liabilities carried as amortised cost approximates their fair value.
Reconciliation of Level 3 fair value measurements` in Million
Year ended Year ended March 31, 2017 March 31, 2016
Unlisted shares valued at fair value Balance at the beginning of the year 544.1 498.6
Purchases 462.8 179.5Foreign currency translation difference (98.4) 29.8Disposal / settlements (6.8) (163.8)
Balance at the end of the year 901.7 544.1
Note 46
CAPITAL MANAGEMENT
a) The Group’s capital management objectives are: - to ensure the Group’s ability to continue as a going concern; and - to provide an adequate return to shareholders through optimisation of debts and equity balance. The Group monitors capital on the basis of the carrying amount of debt less cash and cash equivalents as presented on the face of the consolidated financial statements. The Group’s objective for capital management is to maintain an optimum overall financial structure.
` in Million As at As at As at
March 31, 2017 March 31, 2016 April 01, 2015Debt (includes non-current borrowings, current borrowings, current maturities of finance lease obligations and current maturities of long term debt)
98,317.7 84,967.6 89,722.1
Less: cash and cash equivalents 86,628.0 80,751.4 72,645.9 Net debt 11,689.7 4,216.2 17,076.2 Total equity 404,305.3 370,677.3 308,926.4 Net debt to total equity ratio 2.9% 1.1% 5.5%

235ANNUAL REPORT 2016-17
NOTES TO THE CONSOLIDATED FINANCIAL STATEMENTS
FOR THE YEAR ENDED MARCH 31, 2017
CORPORATE OVERVIEW STATUTORY REPORTS FINANCIAL STATEMENTS01-07 08-79 80-278
b) Dividend on Equity shares paid during the year` in Million
March 31, 2017 March 31, 2016Dividend on equity sharesFinal dividend for the year ended March 31, 2016 of ` 1.0 (Previous year for year ended March 31, 2015: ` 3.0) per fully paid share
2,406.8 7,219.5
Dividend distribution tax on above 490.0 1469.7Dividends not recognised at the end of the reporting periodThe Board of Directors at its meeting held on May 26, 2017 have recommended payment of final dividend of ` 3.5 per share of face value of ` 1 each for the year ended March 31, 2017. The same amounts to ` 8,397.6 Million.
This proposed dividend is subject to the approval of shareholders in the ensuing annual general meeting and hence not recognised as liability.
Note 47
FINANCIAL RISK MANAGEMENT
The Group’s activities expose it to a variety of financial risks, including market risk, credit risk and liquidity risk. The Group’s risk management assessment and policies and processes are established to identify and analyse the risks faced by the Group, to set appropriate risk limits and controls, and to monitor such risks and compliance with the same. Risk assessment and management policies and processes are reviewed regularly to reflect changes in market conditions and the Group’s activities.
Credit riskCredit risk is the risk of financial loss to the Group, if a customer or counterparty to a financial instrument fails to meet its contractual obligations and arises principally from the Group’s receivables from customers, loans and investments. Credit risk is managed through credit approvals, establishing credit limits and continuously monitoring the creditworthiness of counterparty to which the Group grants credit terms in the normal course of business.
InvestmentsThe Group limits its exposure to credit risk by generally investing in liquid securities and only with counterparties that have a good credit rating. The Group does not expect any losses from non-performance by these counter-parties, and does not have any significant concentration of exposures to specific industry sectors or specific country risks.
Trade receivablesThe Group has used expected credit loss (ECL) model for assessing the impairment loss. For this purpose, the Group uses a provision matrix to compute the expected credit loss amount. The provision matrix takes into account external and internal risk factors and historical data of credit losses from various customers.
` in Million
As at March 31, 2017
As at March 31, 2016
As at April 01, 2015
Financial assets for which loss allowances is measured using the expected credit loss Trade receivables
less than 180 days 69,889.0 65,351.3 48,763.9 180 - 365 days 1,729.0 1,671.5 1,204.2 beyond 365 days 2,518.0 2,689.5 2,355.0
Total 74,136.0 69,712.3 52,323.1

SUN PHARMACEUTICAL INDUSTRIES L IMITED236
NOTES TO THE CONSOLIDATED FINANCIAL STATEMENTS
FOR THE YEAR ENDED MARCH 31, 2017
` in Million Year ended Year ended
March 31, 2017 March 31, 2016Movement in the expected credit loss allowance on Trade receivablesBalance at the beginning of the year 1,955.7 1,395.6
Addition 318.1 1,528.3 Recoveries (163.9) (968.2)
Balance at the end of the year 2,109.9 1,955.7
Liquidity riskLiquidity risk is the risk that the Group will not be able to meet its financial obligations as they become due. The Group manages its liquidity risk by ensuring, as far as possible, that it will always have sufficient liquidity to meet its liabilities when due, under both normal and stressed conditions, without incurring unacceptable losses or risk to the Group’s reputation.
The Group had unutilised credit limit/undrawn borrowing facilities from banks of ` 62,162.2 Million as on March 31, 2017, ` 32,401.2 Million as on March 31, 2016, ` 33,533.8 Million as on April 01, 2015.
The table below provides details regarding the contractual maturities of undiscounted significant financial liabilities as at March 31, 2017:
` in Million
Less than 1 year 1 - 3 years More than 3
yearsTotal As at
March 31, 2017Non derivative
Borrowings 84,178.8 12,881.4 1,482.4 98,542.6 Trade payables 43,953.9 - - 43,953.9 Other financial liabilities 4,464.6 1,048.0 - 5,512.6
132,597.3 13,929.4 1,482.4 148,009.1 Derivatives 244.0 - - 244.0
The table below provides details regarding the contractual maturities of undiscounted significant financial liabilities as at March 31, 2016:` in Million
Less than 1 year 1 - 3 years More than 3
yearsTotal As at
March 31, 2016Non derivative
Borrowings 53,891.0 29,527.0 1,613.7 85,031.7 Trade payables 35,829.2 - - 35,829.2 Other financial liabilities 4,853.8 1,842.2 - 6,696.0
94,574.0 31,369.2 1,613.7 127,556.9 Derivative 216.1 - - 216.1

237ANNUAL REPORT 2016-17
NOTES TO THE CONSOLIDATED FINANCIAL STATEMENTS
FOR THE YEAR ENDED MARCH 31, 2017
CORPORATE OVERVIEW STATUTORY REPORTS FINANCIAL STATEMENTS01-07 08-79 80-278
The table below provides details regarding the contractual maturities of undiscounted significant financial liabilities as at April 01, 2015:
` in Million
Less than 1 year 1 - 3 years More than 3
yearsTotal As at
April 01, 2015Non derivative
Borrowings 76,314.0 12,588.9 1,058.4 89,961.3 Trade payables 32,430.3 10.2 - 32,440.5 Other financial liabilities 4,817.1 1,563.2 - 6,380.3
113,561.4 14,162.3 1,058.4 128,782.1 Derivatives 5,322.6 253.5 - 5,576.1
Market risk Market risk is the risk of loss of future earnings, fair values or future cash flows that may result from adverse changes in market rates and prices (such as interest rates, foreign currency exchange rates and commodity prices) or in the price of market risk-sensitive instruments as a result of such adverse changes in market rates and prices. Market risk is attributable to all market risk-sensitive financial instruments, all foreign currency receivables and payables and all short term and long-term debt. The Group is exposed to market risk primarily related to foreign exchange rate risk, interest rate risk and the market value of its investments. Thus, the Group’s exposure to market risk is a function of investing and borrowing activities and revenue generating and operating activities in foreign currencies.
Foreign exchange riskThe Group’s foreign exchange risk arises from its foreign operations, foreign currency revenues and expenses, (primarily in US Dollar, Euro, South African Rand and Russian Rouble) and foreign currency borrowings (primarily in US Dollar). As a result, if the value of the Indian Rupee appreciates relative to these foreign currencies, the Group’s revenues and expenses measured in Indian Rupees may decrease or increase and vice-versa. The exchange rate between the Indian rupee and these foreign currencies has changed substantially in recent periods and may continue to fluctuate substantially in the future. Consequently, the Group uses both derivative and non-derivative financial instruments, such as foreign exchange forward contracts, option contracts, currency swap contracts and foreign currency financial liabilities, to mitigate the risk of changes in foreign currency exchange rates in respect of its highly probable forecasted transactions and recognised assets and liabilities.
a) Significant foreign currency risk exposure relating to trade receivables, cash and cash equivalents, borrowings and trade payables` in Million
As atMarch 31, 2017
US Dollar Euro Russian Rouble
South African Rand
Japanese Yen Total
Trade receivables 12,797.0 1,994.9 1,727.1 5,034.1 8.3 21,561.4Cash and cash equivalents 1,135.6 822.8 352.3 - 449.2 2,759.9
13,932.6 2,817.7 2,079.4 5,034.1 457.5 24,321.3Borrowings 38,296.9 - - - - 38,296.9 Trade payables 4,990.1 1,386.1 0.3 161.4 298.1 6,836.0
43,287.0 1,386.1 0.3 161.4 298.1 45,132.9

SUN PHARMACEUTICAL INDUSTRIES L IMITED238
NOTES TO THE CONSOLIDATED FINANCIAL STATEMENTS
FOR THE YEAR ENDED MARCH 31, 2017
` in MillionAs at
March 31, 2016
US Dollar Euro Russian Rouble
South African Rand
Japanese Yen Total
Trade receivables 12,033.9 2,063.9 1,191.0 2,086.9 - 17,375.7 Cash and cash equivalents 1,256.2 883.1 26.0 - - 2,165.3
13,290.1 2,947.0 1,217.0 2,086.9 - 19,541.0 Borrowings 49,030.4 - - - - 49,030.4 Trade payables 4,235.9 1,592.0 3.0 161.6 4.9 5,997.4
53,266.3 1,592.0 3.0 161.6 4.9 55,027.8
` in MillionAs at
April 01, 2015
US Dollar Euro Russian Rouble
South African Rand
Japanese Yen Total
Trade receivables 10,937.2 1,350.8 1,237.5 362.5 7.4 13,895.4 Cash and cash equivalents 450.5 617.8 258.3 0.1 - 1,326.7
11,387.7 1,968.6 1,495.8 362.6 7.4 15,222.1 Borrowings 47,149.6 - - - - 47,149.6 Trade payables 2,233.4 2,041.2 69.2 1.0 3.0 4,347.8
49,383.0 2,041.2 69.2 1.0 3.0 51,497.4
b) Sensitivity For the years ended March 31, 2017, March 31, 2016 and April 01, 2015, every 5% strengthening in the exchange rate between the
Indian Rupee and the respective major currencies for the above mentioned financial assets/liabilities would increase Group’s profit and equity by approximately ` 1,054.5 Million, ` 1,774.3 Million and ` 1,813.8 Million respectively. A 5% weakening of the Indian Rupee and the respective major currencies would lead to an equal but opposite effect.
In management’s opinion, the sensitivity analysis is unrepresentative of the inherent foreign exchange risk because the exposure at the end of the reporting period does not reflect the exposure during the year.
c) Derivative contracts The Group is exposed to exchange rate risk that arises from its foreign exchange revenues and expenses, primarily in US Dollar, Euro,
South African Rand and Russian Rouble, and foreign currency debt in primarily in US Dollar. The Group uses foreign currency forward contracts, foreign currency option contracts and currency swap contracts (collectively, “derivatives”) to mitigate its risk of changes in foreign currency exchange rates. The counterparty for these contracts is generally a bank or a financial institution.
Hedges of highly probable forecasted transactions
The Group designates its derivative contracts that hedge foreign exchange risk associated with its highly probable forecasted transactions as cash flow hedges and measures them at fair value. The effective portion of such cash flow hedges is recorded as in other comprehensive income, and re-classified in the income statement as revenue in the period corresponding to the occurrence of the forecasted transactions. The ineffective portion of such cash flow hedges is immediately recorded in the consolidated statement of profit and loss.
In respect of the aforesaid hedges of highly probable forecasted transactions, the Group has recorded a loss of ` 46.2 Million for year ended March 31, 2017 and ` Nil for year ended March 31, 2016 in other comprehensive income. The Group also recorded as

239ANNUAL REPORT 2016-17
NOTES TO THE CONSOLIDATED FINANCIAL STATEMENTS
FOR THE YEAR ENDED MARCH 31, 2017
CORPORATE OVERVIEW STATUTORY REPORTS FINANCIAL STATEMENTS01-07 08-79 80-278
a component of revenue, loss of ` 559.7 Million for year ended March 31, 2017 and ` Nil for year ended March 31, 2016 due to occurrence of forecasted sale transaction.
Changes in the fair value of forward contracts and option contracts that economically hedge monetary assets and liabilities in foreign currencies, and for which no hedge accounting is applied, are recognised in consolidated statement of the profit and loss account. The changes in fair value of the forward contracts and option contracts, as well as the foreign exchange gains and losses relating to the monetary items, are recognised in consolidated statement of the profit and loss.
The following table gives details in respect of the notional amount of outstanding foreign exchange derivative contracts:Amount in Million
Currency Buy / Sell Cross As at As at As atCurrency March 31, 2017 March 31, 2016 April 01, 2015
Derivatives designated as hedgesForward contracts ZAR Sell USD USD 22.0 - - Forward contracts USD Buy JPY USD 19.5 - -
Derivatives not designated as hedgesForward contracts USD Sell INR - USD 140.0 USD 350.0 Forward contracts USD Buy INR USD 22.5 USD 14.0 USD 170.0 Forward contracts AUD Sell USD USD 1.3 - - Forward contracts RUB Sell USD USD 12.0 - - Currency cum interest rate swaps USD Buy INR USD 50.0 USD 50.0 USD 100.0 Currency options USD Buy INR USD 100.0 USD 100.0 USD 100.0 Currency options* USD Sell INR - USD 1.0 USD 71.0 Interest rate swaps USD Buy INR USD 150.0 USD 40.0 - Interest rate swaps USD Sell USD - - USD 6.7 Forward contracts PLN Sell RON - - PLN 1.7 Forward contracts RUB Sell RON - - RUB 62.6 Currency swaps USD Buy INR - - USD 30.0 Forward contracts USD Sell NIS USD 0.7 - USD 26.1 Forward contracts USD Sell CAD USD 2.1 - USD 24.9 Forward contracts ZAR Sell INR - - ZAR 42.5 Forward contracts USD Sell HUF USD 5.9 - -
* Structured options @ 2 to 2.5 timesInterest rate riskThe Group has loan facilities on floating interest rate, which exposes the Group to risk of changes in interest rates. The Parent Company’s Treasury Department monitors the interest rate movement and manages the interest rate risk by evaluating interest rate swaps etc. based on the market / risk perception.
For the year ended March 31, 2017 and March 31, 2016, every 50 basis point decrease in the floating interest rate component applicable to its loans and borrowings would increase the Group’s profit before tax by approximately ` 196.2 Million and ` 257.8 Million respectively. A 50 basis point increase in floating interest rate would have led to an equal but opposite effect.
Commodity rate riskExposure to market risk with respect to commodity prices primarily arises from the Group’s purchases and sales of active pharmaceutical ingredients, including the raw material components for such active pharmaceutical ingredients. These are commodity products, whose prices may fluctuate significantly over short periods of time. The prices of the Group’s raw materials generally fluctuate in line with commodity cycles, although the prices of raw materials used in the Group’s active pharmaceutical ingredients business are generally more volatile. Cost of raw materials forms the largest portion of the Group’s cost of revenues. Commodity price risk exposure is evaluated and managed through operating procedures and sourcing policies. As of March 31, 2017, the Group had not entered into any material derivative contracts to hedge exposure to fluctuations in commodity prices.

SUN PHARMACEUTICAL INDUSTRIES L IMITED240
NOTES TO THE CONSOLIDATED FINANCIAL STATEMENTS
FOR THE YEAR ENDED MARCH 31, 2017
Note 48
GOODWILL (NET):Goodwill acquired in business combination is allocated, at acquisition, to the Cash Generating Units (CGUs) that are expected to benefit from that business combination. The carrying amount of goodwill has been allocated as follows:(i) Goodwill in respect of:
` in Million
As at As at As at
March 31, 2017 March 31, 2016 April 01, 2015Sun Pharmaceutical Industries, Inc. 23,273.5 23,729.6 22,683.2 Sun Farmaceutica do Brasil Ltda. 425.3 430.4 427.4 Sun Pharma Japan Ltd. 119.0 119.8 127.2 Taro Pharmaceutical Industries Ltd. 12,295.6 12,556.5 11,849.6 Ranbaxy Pharmaceutical Proprietary Limited - - 1,331.4 S.C Terapia S.A. 17,295.8 17,699.3 16,681.1 Ranbaxy Ireland Limited - - 117.0 Ranbaxy Farmaceutica Ltda. 358.9 366.6 345.9 Basics GmbH 311.9 338.7 301.1 Ranbaxy Pharmaceuticals, Inc. 290.0 296.5 281.3 Insite Vision Incorporated 435.3 445.0 - Ranbaxy Italia S.p.A - - 239.3 Sun Pharma Medisales Private Limited (Formerly known as Solrex Pharmaceuticals Company)
1,208.0 1,208.0 1,208.0
Ranbaxy South Africa Proprietary Limited 3.4 3.1 3.5 JSC Biosintez 112.6 - - Sun Pharmaceuticals Medicare Limited 1.0 - - Gufic Pharma Limited 469.4 469.4 469.4
Total (A) 56,599.7 57,662.9 56,065.4 Less: Capital Reserve in respect of :
Alkaloida Chemical Company Zrt. 1,152.5 1,229.2 1,149.5 Ranbaxy Nigeria Limited 1.4 1.5 1.4 Ranbaxy Drugs Limited 27.5 27.5 27.5 Ranbaxy Malaysia Sdn. Bhd. 56.1 57.3 41.0
Total (B) 1,237.5 1,315.5 1,219.5 Total (A-B) 55,362.2 56,347.4 54,845.9
(ii) Below is the reconciliation of the carrying amount of goodwill:` in Million
As at As at
March 31, 2017 March 31, 2016Opening balance 56,347.4 54,845.9 Add: Due to acquisitions during the year 113.6 688.7Less: Impairment/write off (Refer note 62) - (1,942.3)Add/ (Less): Foreign currency translation difference (1,098.8) 2,755.1 Closing balance 55,362.2 56,347.4
The carrying amount of goodwill are stated above. The recoverable amounts have been determined based on value in use calculations which uses cash flow projections covering generally a period of five years (which are based on key assumptions such as margins, expected growth rates based on past experience and Management’s expectations/ extrapolation of normal increase/ steady terminal growth rate) and appropriate discount rates that reflects current market assessments of time value of money and risks specific to these investments. The cash flow projections included estimates for five years developed using internal forecasts and terminal growth rate thereafter. The planning horizon reflects the assumptions for short to mid-term market developments. The average growth rate used in extrapolating cash flows beyond the planning period ranged from 1% to 2% for the year ended March 31, 2017, March 31, 2016 and April 01, 2015. Discount rate

241ANNUAL REPORT 2016-17
NOTES TO THE CONSOLIDATED FINANCIAL STATEMENTS
FOR THE YEAR ENDED MARCH 31, 2017
CORPORATE OVERVIEW STATUTORY REPORTS FINANCIAL STATEMENTS01-07 08-79 80-278
reflects the current market assessment of the risks specific to a CGU or group of CGUs. The discount rate is estimated on the weighted average cost of capital for respective CGU or group of CGUs. Discount rate used ranged from 4% to 11.9% for the year ended March 31, 2017, March 31, 2016 and April 01, 2015. The management believes that any reasonable possible change in key assumptions on which recoverable amount is based is not expected to cause the aggregate carrying amount to exceed the aggregate recoverable amount of the cash generating unit. However, based on the impairment assessment, the Management has determined that in respect of certain subsidiaries, an impairment loss considering the above criteria/ factors aggregating to ` Nil (March 31, 2016: ` 1,942.3 Million) in the value of goodwill has been recognised.
Note 49
RELATED PARTY DISCLOSURES (IND AS-24) AS PER ANNEXURE ‘B’
Note 50
INCOME TAXES
Tax Reconciliation` in Million
Reconciliation of tax expense Year ended March 31, 2017
Year ended March 31, 2016
Profit before tax 90,478.7 65,706.3Enacted income tax rate in India (%) 34.608% 34.608%Income tax expense calculated at enacted corporate tax rate 31,312.9 22,739.6Effect of income that is exempt from tax (8,605.7) (6,395.7)Effect of expenses that are not deductible in determining taxable profit 152.3 448.2Incremental deduction allowed on account of research and development costs (4,927.9) (4,901.0)Investment allowance deduction (295.1) (265.1)Effect of income which is taxed at special rates 25.1 54.5Effect of unused tax losses and tax offsets not recognised as deferred tax assets 5,193.2 5,164.4Effect of difference between Indian and foreign tax rates and non taxable subsidiaries (12,658.7) (9,608.1)Effect of deferred tax expense on undistributed profits 415.3 415.3Tax payable under MAT 2,100.0 -Others (595.7) 1,485.6Income tax expense recognised in consolidated statement of profit and loss 12,115.7 9,137.7

SUN PHARMACEUTICAL INDUSTRIES L IMITED242
NOTES TO THE CONSOLIDATED FINANCIAL STATEMENTS
FOR THE YEAR ENDED MARCH 31, 2017
Note 51
DEFERRED TAXi) DEFERRED TAX ASSETS (Net)
` in MillionOpening
balance April 01, 2015
Movement during the
Year *
Closing balance March
31, 2016 Deferred Tax Asset
Expenses claimed for tax purpose on payment basis 9,756.7 3,086.8 12,843.5 Unabsorbed depreciation/carry forward losses 4,019.2 389.3 4,408.5 Inventory and other related items 5,327.6 814.8 6,142.4 Intangible assets 3,282.9 (328.2) 2,954.7 Others 1,263.3 299.0 1,562.3
23,649.7 4,261.7 27,911.4 MAT Credit Entitlement 7,517.0 - 7,517.0
31,166.7 4,261.7 35,428.4 Less : Deferred Tax Liabilities
Difference between written down value of property plant and equipment and capital work-in-progress as per books of accounts and income tax
3,299.9 (53.3) 3,246.6
Others 694.7 (2.8) 691.9 3,994.6 (56.1) 3,938.5
27,172.1 4,317.8 31,489.9
DEFERRED TAX ASSETS (Net)
` in Million Opening
balance April 01, 2016
Movement during the
Year *
Closing balance March
31, 2017 Deferred Tax Assets
Expenses claimed for tax purpose on payment basis 12,843.5 (4,851.9) 7,991.6 Unabsorbed depreciation / carried forward losses 4,408.5 1,623.0 6,031.5 Inventory and other related items 6,142.4 (2,572.8) 3,569.6 Intangible assets 2,954.7 (103.7) 2,851.0 Others 1,562.3 (110.1) 1,452.2
27,911.4 (6,015.5) 21,895.9 MAT Credit Entitlement 7,517.0 - 7,517.0
35,428.4 (6,015.5) 29,412.9 Less : Deferred Tax Liabilities
Difference between written down value of property plant and equipment and capital work-in-progress as per books of accounts and income tax
3,246.6 1,060.3 4,306.9
Others 691.9 (514.1) 177.8 3,938.5 546.2 4,484.7
31,489.9 (6,561.7) 24,928.2

243ANNUAL REPORT 2016-17
NOTES TO THE CONSOLIDATED FINANCIAL STATEMENTS
FOR THE YEAR ENDED MARCH 31, 2017
CORPORATE OVERVIEW STATUTORY REPORTS FINANCIAL STATEMENTS01-07 08-79 80-278
ii) DEFERRED TAX LIABILITIES (Net)` in Million
Opening balance April
01, 2015
Movement during the
Year*
Closing balance March
31, 2016 Deferred Tax Liabilities
Difference between written down value of property plant and equipment and capital work-in-progress as per books of accounts and income tax and others
814.8 (27.7) 787.1
Undistributed profits - 415.3 415.3 814.8 387.6 1,202.4
Less : Deferred Tax AssetsExpenses claimed for tax purpose on payment basis 62.5 64.0 126.5 Others 0.9 47.3 48.2
63.4 111.3 174.7 751.4 276.3 1,027.7
DEFERRED TAX LIABILITIES (Net)` in Million
Opening balance April
01, 2016
Movement during the
Year*
Closing balance March
31, 2017 Deferred Tax Liabilities
Difference between written down value of property plant and equipment and capital work-in-progress as per books of accounts and income tax and others
787.1 2,891.6 3,678.7
Undistributed profits 415.3 (415.3) - 1,202.4 2,476.3 3,678.7
Less : Deferred Tax AssetsExpenses claimed for tax purpose on payment basis 126.5 342.9 469.4 Others 48.2 13.2 61.4
174.7 356.1 530.8 1,027.7 2,120.2 3,147.9
* Movement during the year includes foreign currency translation difference amounting to ` 1,182.9 Million (gain) and ` 669.2 Million (loss) for the year ended March 31, 2016 and March 31, 2017 respectively and deferred tax on remeasurements of defined benefit plans amounting to ` 42.2 Million and ` 98.8 Million for the year ended March 31, 2016 and March 31, 2017 respectively, recognised in OCI.
iii) Deductible temporary differences, unused tax losses and unused tax credits for which no deferred tax assets have been recognised are attributable to the following:
` in Million
As at March 31, 2017
As at March 31, 2016
As at April 01, 2015
Tax losses 81,776.7 71,500.9 56,604.9Unabsorbed depreciation 24,900.1 19,897.1 15,259.9Unused tax credits (including MAT credit entitlement) 8,178.9 6,853.5 6,639.0Deductible temporary differences 25,892.5 28,057.5 27,089.5
140,748.2 126,309.0 105,593.3The unused tax credits will expire from financial year 2017-18 to financial year 2023-24 and unused tax losses expiry ranges from financial year 2017-18 to 2032-33. In case of certain overseas subsidiaries which have tax losses and unused tax credits, the amount is not material and there is no expiry period for tax losses and unused tax credits.

SUN PHARMACEUTICAL INDUSTRIES L IMITED244
NOTES TO THE CONSOLIDATED FINANCIAL STATEMENTS
FOR THE YEAR ENDED MARCH 31, 2017
Note 52
EARNINGS PER SHARE Year ended Year ended
March 31, 2017 March 31, 2016Profit for the year (` in Million) - used as numerator for calculating earnings per share 69,643.7 45,457.1 Weighted Average number of shares used in computing basic earnings per share 2,403,319,673 2,406,379,179 Add: Dilution effect of employee stock options 203,455 1,059,730 Weighted average number of shares used in computing diluted earnings per share 2,403,523,128 2,407,438,909 Nominal value per share (in `) 1 1Basic Earnings Per Share (in `) 29.0 18.9 Diluted Earnings Per Share (in `) 29.0 18.9
Note 53
SEGMENT REPORTING
The Chief Operating Decision Maker (‘CODM’) evaluates the Group’s performance and allocates resources based on an analysis of various performance indicators by reportable segments. The Group’s reportable segments are as follows: 1. India 2. United States 3. Emerging Markets 4. Rest of the World The reportable segments derives their revenues from the sale of pharmaceuticals products (generics, speciality, API, etc.) . The CODM reviews revenue as the performance indicator. The measurement of each segment’s revenues, expenses and assets is consistent with the accounting policies that are used in preparation of the Group’s consolidated financial statements.
` in Million Year ended Year ended
March 31, 2017 March 31, 2016Revenue by GeographyIndia 80,610.1 77,844.6 United States of America 138,823.6 136,724.7 Emerging markets 49,074.2 39,075.5 Rest of world 34,134.4 25,235.9
302,642.3 278,880.7
In view of the interwoven / intermix nature of business and manufacturing facility, other segmental information is not ascertainable.
Concentration of Revenues from two customers of the Group were 35.7% and 30.9% of total revenue for the year ended March 31, 2017 and March 31, 2016 respectively.
Note 54
Other intangible assets consisting of trademarks, designs, technical knowhow, licences, non-compete fees and other intangible assets are stated at cost of acquisition based on their agreements. The amortisable amount of intangible assets is arrived at, based on the management’s best estimates of useful lives of such assets after due consideration as regards their expected usage, the product life cycles, technical and technological obsolescence, market demand for products, competition and their expected future benefits to the Group.

245ANNUAL REPORT 2016-17
NOTES TO THE CONSOLIDATED FINANCIAL STATEMENTS
FOR THE YEAR ENDED MARCH 31, 2017
CORPORATE OVERVIEW STATUTORY REPORTS FINANCIAL STATEMENTS01-07 08-79 80-278
Note 55
LEASES (a) The Group has given certain premises and Plant and Machinery under operating lease or leave and license agreements. These are
generally not non-cancellable and periods range between 11 months to 10 years under leave and license / lease and are renewable by mutual consent on mutually agreeable terms. The Group has received refundable interest free security deposits, where applicable, in accordance with agreed terms.
(b) The Group has obtained certain premises for its business operations (including furniture and fittings, therein as applicable) under operating lease or leave and license agreements. These are generally not non-cancellable and range between 11 months to 10 years under leave and licenses, or longer for other lease and are renewable by mutual consent on mutually agreeable terms. The Group has given refundable interest free security deposits in accordance with the agreed terms. These refundable security deposits have been valued at amortised cost under relevant Ind AS.
(c) Lease receipts/payments are recognised in the consolidated statement of profit and loss under “Lease Rental and Hire Charges” and “Rent” in Note 32 and Note 37.
` in Million Year ended Year ended
March 31, 2017 March 31, 2016(d) Operating lease(i) Group as lesseeThe future minimum lease payments under non-cancellable operating leasenot later than one year 386.2 596.3 later than one year and not later than five years 648.1 840.1 later than five years 203.3 209.2 (ii) Group as lessorThe future minimum lease payments under non-cancellable operating leasenot later than one year 133.5 28.0 later than one year and not later than five years 532.9 107.9 later than five years 58.3 67.6
(e) Finance lease(i) Group as lesseeThe future minimum lease payments under non-cancellable finance leasenot later than one year 134.5 134.6 later than one year and not later than five years 433.2 569.5 later than five years 494.6 654.5 Less: Unearned Finance Charges 360.3 610.1 Present value of minimum lease payments payablenot later than one year 39.5 32.7 later than one year and not later than five years 265.4 223.7 later than five years 397.1 492.1 (ii) Group as lessorThe future minimum lease payments under non-cancellable finance leasenot later than one year - 46.8 later than one year and not later than five years - 165.8 later than five years - 716.2 Less: Unearned Finance Income - 539.5 Present value of minimum lease payments receivablenot later than one year - 10.6 later than one year and not later than five years - 28.3 later than five years - 350.4

SUN PHARMACEUTICAL INDUSTRIES L IMITED246
NOTES TO THE CONSOLIDATED FINANCIAL STATEMENTS
FOR THE YEAR ENDED MARCH 31, 2017
Note 56
EMPLOYEE BENEFITSDefined contribution planContributions are made to Regional Provident Fund (RPF), Family Pension Fund, Employee State Insurance Corporation (ESIC) and other Funds which covers all regular employees of the parent and Indian subsidiaries. While both the employees and parent and Indian subsidiaries make predetermined contributions to the Provident Fund and ESIC, contribution to the Family Pension Fund and other statutory funds are made only by the parent and Indian subsidiaries. The contributions are normally based on a certain percentage of the employee’s salary. Amount recognised as expense in respect of these defined contribution plans, aggregate to ` 773.2 Million (Previous Year ` 730.0 Million).
` in Million Year ended Year ended
March 31, 2017 March 31, 2016Contribution to Provident Fund and Family Pension Fund 668.8 613.3Contribution to Superannuation Fund 74.9 90.3Contribution to ESIC and Employees Deposit Linked Insurance (EDLI) 29.3 26.3Contribution to Labour Welfare Fund 0.2 0.1
The Parent and Indian subsidiaries has an obligation towards provident fund with respect to certain employees upto March 31, 2015 which was recognised as defined benefit plan. From the previous year the contribution for the same is made to RPF and the Parent and Indian subsidiaries does not have any obligation apart from such contribution. Accordingly, from previous year, the provident fund is recognised as defined contribution plan.
Defined benefit plana) Gratuity In respect of Gratuity, a defined benefit plan, contributions are made to LIC’s Recognised Group Gratuity Fund Scheme. It is governed
by the Payment of Gratuity Act, 1972. Under the Gratuity Act, employees are entitled to specific benefit at the time of retirement or termination of the employment on completion of five years or death while in employment. The level of benefit provided depends on the member’s length of service and salary at the time of retirement/termination age. Provision for Gratuity is based on actuarial valuation done by an independent actuary as at the year end. Each year, the Parent and Indian subsidiaries reviews the level of funding in gratuity fund. The Parent and Indian subsidiaries decides its contribution based on the results of its annual review. The Parent and Indian subsidiaries aims to keep annual contributions relatively stable at a level such that the fund assets meets the requirements of gratuity payments in short to medium term.
b) Pension fund The Parent and Indian subsidiaries has an obligation towards pension, a defined benefit retirement plan, with respect to certain
employees, who had already retired before March 01, 2013, will continue to receive the pension as per the pension plan.
These plans typically expose the Parent and Indian subsidiaries to actuarial risks such as: investment risk, interest rate risk, longevity risk and salary risk.
i) Investment risk - The present value of the defined benefit plan liability is calculated using a discount rate determined by reference to the market yields on government bonds denominated in Indian Rupees. If the actual return on plan asset is below this rate, it will create a plan deficit. However, the risk is partially mitigated by investment in LIC managed fund.
ii) Interest rate risk - A decrease in the bond interest rate will increase the plan liability. However, this will be partially offset by an increase in the return on the plan’s debt investments.

247ANNUAL REPORT 2016-17
NOTES TO THE CONSOLIDATED FINANCIAL STATEMENTS
FOR THE YEAR ENDED MARCH 31, 2017
CORPORATE OVERVIEW STATUTORY REPORTS FINANCIAL STATEMENTS01-07 08-79 80-278
iii) Longevity risk - The present value of the defined benefit plan liability is calculated by reference to the best estimate of the mortality of plan participants both during and after their employment. An increase in the life expectancy of the plan participants will increase the plan’s liability.
iv) Salary risk - The present value of the defined benefit plan liability is calculated by reference to the future salaries of plan participants. As such, an increase in the salary of the plan participants will increase the plan’s liability.
Other long term benefit planActuarial Valuation for Compensated Absences is done as at the year end and the provision is made as per the Parent and Indian subsidiaries rules with corresponding charge to the Consolidated Statement of Profit and Loss amounting to ` 499.3 Million (Previous Year ` 465.2 Million) and it covers all regular employees. Major drivers in actuarial assumptions, typically, are years of service and employee compensation.
Obligation in respect of defined benefit plan and other long term employee benefit plans are actuarially determined as at the year end using the ‘Projected Unit Credit’ method. Gains and losses on changes in actuarial assumptions relating to defined benefit obligation are recognised in other comprehensive income whereas gains and losses in respect of other long term employee benefit plans are recognised in the consolidated statement of profit and loss.
` in MillionYear ended March 31, 2017 Year ended March 31, 2016
Pension Fund (Unfunded)
Provident Fund (Funded)
Gratuity (Funded)
Pension Fund (Unfunded)
Provident Fund (Funded)
Gratuity (Funded)
Expense recognised in the consolidated statement of profit and loss (Refer note 35)
Current service cost - - 242.4 - - 211.4 Interest cost 70.2 592.6 204.5 76.6 347.6 168.3 Expected return on plan assets - (598.5) (160.9) - (385.5) (146.5) Recognition of unrecognised liabilities of earlier years
- - - - 3.7 -
Excess of planned assets over commitments not recognised in Financial statements
- 5.9 - - 34.2 -
Expense charged to the consolidated statement of profit and loss
70.2 - 286.0 76.6 - 233.2
Remeasurement of defined benefit obligation recognised in other comprehensive income
Actuarial loss / (gain) on defined benefit obligation 56.2 - 726.4 (39.7) - 439.6 Return on plan assets - - (18.0) - - (11.3)Expense/(income) charged to other comprehensive income
56.2 - 708.4 (39.7) - 428.3
Reconciliation of defined-benefit obligations Obligations as at the beginning of the year 930.7 4,598.6 2,708.4 981.8 4,810.2 2,142.1 Current service cost - - 242.4 - - 211.4 Interest cost 70.2 592.6 204.5 76.6 347.6 168.3 Liability transferred in/ Acquisitions - - 17.4 - - - Obligations transferred - 1.8 - - 28.9 - Benefits paid (87.6) (507.6) (227.2) (88.0) (588.1) (253.0)Obligation transferred to regional provident fund, net of accumulated unrecognised gains
- (4,685.4) - - - -
Actuarial (Gains)/Losses on obligationsdue to change in demographic assumptions - - 16.4 - - (14.6)due to change in financial assumptions 54.5 - 623.3 31.0 - 299.3 due to experience 1.7 - 86.7 (70.7) - 154.9 Obligation as at the year end 969.5 - 3,671.9 930.7 4,598.6 2,708.4

SUN PHARMACEUTICAL INDUSTRIES L IMITED248
NOTES TO THE CONSOLIDATED FINANCIAL STATEMENTS
FOR THE YEAR ENDED MARCH 31, 2017
` in MillionMarch 31, 2017 March 31, 2016
Provident Fund
(Funded)
Gratuity (Funded)
Provident Fund
(Funded)
Gratuity (Funded)
Reconciliation of liability/(asset) recognised in the consolidated balance sheet
Present value of commitments (as per Actuarial Valuation) - 3,671.9 4,598.6 2,708.4 Fair value of plan assets - (2,348.7) (4,632.8) (2,131.2)Excess of planned assets over commitments not recognised - - (34.2) - Net liability recognised in the consolidated balance sheet - 1,323.2 - 577.2
Reconciliation of plan assets Plan assets as at the beginning of the year 4,632.8 2,131.2 4,806.5 1,867.6 Expected return 598.5 160.9 385.5 146.5 Assets transferred in/ Acquisitions - 17.4 - - Plan assets transferred 1.8 - 28.9 - Actuarial gain - 18.0 - 11.3 Employer's Contribution during the year - 248.4 - 358.8 Employees' Contributions during the year - - - - Benefits paid (507.6) (227.2) (588.1) (253.0)Funds transferred to regional provident fund (4,725.5) - - - Plan assets as at the year end - 2,348.7 4,632.8 2,131.2
Year ended March 31, 2017 Year ended March 31, 2016Pension Fund
(Unfunded)Gratuity(Funded)
Pension Fund (Unfunded)
Gratuity(Funded)
Provident Fund(Funded)*
Discount rate 6.81% In range of 6.81% to 7.74%
7.54% In range of 7.54% to 7.56%
7.54%
Expected return on plan assets
N.A. In range of 6.81% to 7.74%
N.A. In range of 7.54% to 7.56%
8.80%
Expected rate of salary increase
N.A. In range of 7.00% to 14.50%
N.A. 10.00% N.A.
Interest rate guarantee N.A. N.A. N.A. N.A. 8.80%Mortality Indian Assured Lives
Mortality (2006-08)Indian Assured Lives Mortality (2006-08)
Indian Assured Lives Mortality (2006-08)
Indian Assured Lives Morality (2006-08)
Indian Assured Lives Mortality (2006-08)
Withdrawal N.A. In range of 1.00% to 13.50%
N.A. 8.00% 15% - 18%
Retirement Age (years) N.A. 58 to 60 N.A. 58 to 60 60
* During the year, the Provident fund balance which was managed by Parent has been transferred to Regional Provident Fund authority.

249ANNUAL REPORT 2016-17
NOTES TO THE CONSOLIDATED FINANCIAL STATEMENTS
FOR THE YEAR ENDED MARCH 31, 2017
CORPORATE OVERVIEW STATUTORY REPORTS FINANCIAL STATEMENTS01-07 08-79 80-278
` in MillionYear ended March 31, 2017 Year ended March 31, 2016Pension Fund
(Unfunded)Gratuity (Funded)
Pension Fund (Unfunded)
Gratuity (Funded)
Sensitivity Analysis:Impact on defined benefit obligation - 796.9 - 539.4 Delta effect of +1% change in discount rate (73.2) (226.5) (67.6) (147.5)Delta effect of -1% change in discount rate 86.0 257.8 79.0 167.4 Delta effect of +1% change in salary escalation rate - 237.5 - 161.9 Delta effect of -1% change in salary escalation rate - (214.1) - (145.6)Delta effect of +1% change in rate of employee turnover - (98.2) - (27.6)Delta effect of -1% change in rate of employee turnover - 110.7 - 30.7 Maturity analysis of projected benefit obligation
31-Mar-18 87.4 466.6 101.9 415.5 31-Mar-19 100.4 320.2 118.1 252.4 31-Mar-20 115.3 353.9 137.0 267.4 31-Mar-21 132.5 352.3 158.8 290.9 31-Mar-22 152.1 353.2 184.1 305.9 Thereafter 174.8 1,601.0 213.4 1,527.0
The major categories of plan assets are as under:Central government securities - 20.9 - 25.9 Bonds and securities of public sector / financial institutions - 69.3 - 156.3 Insurer managed funds (Funded with LIC, break-up not available) - 2,236.3 - 1,940.4 Surplus fund lying uninvested - 22.2 - 8.6
The contribution expected to be made by the Parent and Indian subsidiaries for gratuity, during financial year ending March 31, 2018 is ` 483.1 Million (Previous year ` 413.0 Million).
Note 57
Taro Pharmaceutical Industries Ltd and its Israeli subsidiaries are required to make severance or pension payments to dismissed employees and to employees terminating employment under certain other circumstances. Deposits are made with a pension fund or other insurance plans to secure pension and severance rights for the employees in Israel.
Note 58
EMPLOYEE SHARE-BASED PAYMENT PLANSa) Erstwhile Ranbaxy Laboratories Limited (RLL) had Employee Stock Option Schemes (“ESOSs”) namely, Employees Stock Option Scheme
-II (ESOS-II), Employees Stock Option Scheme 2005 (ESOS 2005) and Employees Stock Option Plan 2011 (ESOP 2011) for the grant of stock options to the eligible employees and Directors of the Erstwhile RLL and its subsidiaries. ESOS-II had been discontinued from January 17, 2015. The ESOSs is administered by the Compensation Committee (“Committee”). Options are granted at the discretion of the Committee to selected employees depending upon certain criterion. Each option comprises one underlying equity share.
ESOS 2005 provided that the grant price of options would be the latest available closing price on the stock exchange on which the shares of the erstwhile RLL were listed, prior to the date of the meeting of the Committee in which the options were granted. If the shares are listed on more than one stock exchange, then the stock exchange where there is highest trading volume on the said date shall be considered. The options vested evenly over a period of five years from the date of grant. Options lapse, if they are not exercised prior to the expiry date, which was ten years from the date of grant.

SUN PHARMACEUTICAL INDUSTRIES L IMITED250
NOTES TO THE CONSOLIDATED FINANCIAL STATEMENTS
FOR THE YEAR ENDED MARCH 31, 2017
ESOP 2011 provided that the grant price of options would be the face value of the equity share i.e. ` 5 per share. The options vested evenly over a period of three years from the date of grant. Options lapse, if they were not exercised prior to the expiry date, which was three months from the date of the vesting. An ESOP Trust had been formed to administer ESOP 2011. Shares issued to the ESOP Trust were allocated to the eligible employees upon exercise of stock options from time to time.
The Shareholders’ Committee of erstwhile RLL had approved issuance of options under the ESOS’s as per details given below:Date of approval Scheme Original No. of options approvedJune 25, 2003 ESOS-II 4,000,000 June 30, 2005 ESOS 2005 4,000,000 May 9, 2011 ESOP 2011 3,000,000
In accordance with the above approval of issuance of options, stock options have been granted from time to time.
The stock options outstanding as on June 30, 2005 are proportionately adjusted in view of the sub-division of equity shares of the Erstwhile RLL from the face value of ` 10 each into 2 equity shares of ` 5 each.
Pursuant to the Scheme of Amalgamation, Sun Pharmaceutical Industries Limited (‘transferee company’) formulated two Employee Stock Option Schemes, namely, (i) SUN Employee Stock Option Scheme-2015 (SUN-ESOS 2015) to administer ESOS 2005 (ii) SUN Employee Stock Option Plan-2015 (SUN-ESOP 2015) to administer ESOP 2011. These scheme provide that the number of transferee options issued shall equal to the product of number of transferor options outstanding on effectiveness of Scheme multiplied by the Share exchange ratio (0.80) and each transferee option shall have an exercise price per equity share equal to transferor option exercise price per equity shares divided by the share exchange ratio (0.80) and fractions rounded off to the next higher whole number. The terms and conditions of ESOS, of transferee company are not less favourable than those of ESOSs of erstwhile RLL. No new grants shall be made under these schemes and these schemes shall operate only for the purpose of administering the exercise of options already granted / vested on an employee pursuant to SUN-ESOS 2015 and SUN-ESOP 2015.
The movement of the options (post split) granted under SUN-ESOS 2015March 31, 2017
Stock options (numbers)
Range of exercise prices (`)
Weighted-average exercise prices (`)
Weighted-average remaining
contractual life (years)
Outstanding at the commencement of the year 610,739 270.0-703.0 480.9 2.5 Exercised during the year $ (62,682) 270.0-562.5 500.1 - Lapsed during the year (146,379) 270.0-562.5 521.7 - Outstanding at the end of the year * 401,678 270.0-562.5 462.9 1.9 Exercisable at the end of the year * 401,678 270.0-562.5 462.9 1.9
* Includes options exercised, pending allotment$ Weighted average share price on the date of exercise ` 690.23

251ANNUAL REPORT 2016-17
NOTES TO THE CONSOLIDATED FINANCIAL STATEMENTS
FOR THE YEAR ENDED MARCH 31, 2017
CORPORATE OVERVIEW STATUTORY REPORTS FINANCIAL STATEMENTS01-07 08-79 80-278
The movement of the options (post split) granted under SUN-ESOS 2015 March 31, 2016
Stock options (numbers)
Range of exercise prices (`)
Weighted-average exercise prices (`)
Weighted-average remaining contractual
life (years)Outstanding at the commencement of the yearNumber of options – post-merger of Erstwhile RLL with the transferee company
1,169,545 270.0-703.0 496.0 3.3
No. of options on Account of rounding off of the fraction to the next higher whole number as per the merger Scheme
41 270.0-703.0 496.0 3.3
Total Number of options outstanding 1,169,586 270.0-703.0 496.0 3.3 Exercised during the year $ (447,825) 270.0-703.0 518.9 - Lapsed during the year (111,022) 270.0-703.0 479.9 - Outstanding at the end of the year * 610,739 270.0-703.0 480.9 2.5 Exercisable at the end of the year * 610,739 270.0-703.0 480.9 -
* Includes options exercised, pending allotment$ Weighted average share price on the date of exercise ` 823.63
The movement of the options (post split) granted under SUN-ESOP 2015 for the current year is given below:March 31, 2017
Stock options (numbers) Exercise prices (`) Weighted-average
exercise prices (`)
Weighted-average remaining
contractual life (years)
Outstanding at the commencement of the year 169,913 6.3 6.3 1.1 Forfeited during the year (11,179) 6.3 6.3 - Exercised during the year# (93,015) 6.3 6.3 - Lapsed during the year (13,435) 6.3 6.3 - Outstanding, end of the year * 52,284 6.3 6.3 0.4 Exercisable at the end of the year * 941 6.3 6.3 -
* Includes options exercised, pending allotment# Weighted average share price on the date of exercise ` 802.00
March 31, 2016
Stock options (numbers) Exercise prices (`)
Weighted-average exercise
prices (`)
Weighted-average remaining
contractual life (years)
Outstanding at the commencement of the yearNumber of options – post-merger of Erstwhile RLL with the transferee company
449,430 6.3 6.3 1.7
No. of options on Account of rounding off of the fraction to the next higher whole number as per the merger Scheme
1,368 6.3 6.3 0.9
No of options of certain overseas employees 4,968 6.3 6.3 0.9Total Number of options outstanding 455,766 6.3 6.3 0.9
Forfeited during the year (43,326) 6.3 6.3 - Exercised during the year # ^ (224,201) 6.3 6.3 - Lapsed during the year (18,326) 6.3 6.3 - Outstanding, end of the year 169,913 6.3 6.3 1.1Exercisable at the end of the year $ 40,259 6.3 6.3 0.2
$ Include options exercised, pending allotment. # Shares allotted by the ESOP Trust against the options exercised including 1,066 shares equivalent to 1,333 shares issued by Erstwhile RLL prior to April 10, 2015.^ Weighted average share price on the date of exercise ` 848.68.

SUN PHARMACEUTICAL INDUSTRIES L IMITED252
NOTES TO THE CONSOLIDATED FINANCIAL STATEMENTS
FOR THE YEAR ENDED MARCH 31, 2017
During the current year, the Parent Company has recorded a Stock-based employee compensation expense of ` 32.3 Million (Previous Year ` 98.8 Million). The amount has been determined under a fair value method wherein the grant date fair value of the options was calculated by using Black Scholes pricing model.
The following table summarizes the assumptions used in calculating the grant date fair value for instrument granted in the year ended March 31, 2015: @@Particulars Year ended March 31, 2015Grant Date May 08, 2014Dividend yield 0.43%Expected life of options from the date(s) of grant 1.25, 2.25 and 3.25 yearsRisk free interest rate 8.57% (1.25 years)
8.65% (2.25 years)8.71% (3.25 years)
Expected volatility 40.47%Grant date fair value ` 462.39 (1.25 years)
` 460.79 (2.25 years)` 459.16 (3.25 years)
@@ Assumptions used are as applicable at the date of grant in the context of erstwhile RLL.
The Black –Scholes option-pricing model was developed for estimating fair value of trade options that have no vesting restrictions and are fully transferable. Since options pricing models require use of subjective assumptions, changes therein can materiality affect fair value of the options. The options pricing models do not necessary provide a reliable measurable of fair value of options. The volatility in the share price is based on volatility of historical stock price of the erstwhile RLL for last 60 months.
(b) As at March 31, 2017, the Parent Company has received an amount of ` 0.0 Million (` 7,177) towards share application money towards 1,148 equity shares of the Parent Company. The Parent Company will allot these equity shares during the next financial year. The Parent Company has sufficient authorised capital to cover the allotment of these shares. Pending allotment of shares, the amounts are maintained in a designated bank account and are not available for use by the Parent Company.
As at March 31, 2016, the Parent Company has received an amount of ` 6.7 Million towards share application money towards 13,780 equity shares of the Parent Company [As at April 01, 2015 ` 149.0 Million towards 280,474 equity shares (no. of shares post merger)] at a premium of ` 6.7 Million (As at April 01 , 2015: ` 148.7 Million). The Parent Company has alloted these equity shares during the next financial year. The Parent Company has sufficient authorised capital to cover the allotment of these shares. Pending allotment of shares, the amounts are maintained in a designated bank account and are not available for use by the Parent Company.
Note 59
Expenditure related to Corporate Social Responsibility as per Section 135 of the Companies Act, 2013 read with Schedule VII thereof: ` 96.1 Million (Previous Year ` 171.0 Million).
Note 60
The Group does not have any material associates or joint ventures warranting a disclosure in respect of individual associates or joint ventures. The Group’s share of other comprehensive income is ` Nil (March 31, 2016: ` Nil) in respect of such associates and joint ventures. The unrecognised share of loss of ` Nil (March 31, 2016: ` Nil) in respect of such associates and joint ventures.

253ANNUAL REPORT 2016-17
NOTES TO THE CONSOLIDATED FINANCIAL STATEMENTS
FOR THE YEAR ENDED MARCH 31, 2017
CORPORATE OVERVIEW STATUTORY REPORTS FINANCIAL STATEMENTS01-07 08-79 80-278
Note 61
In respect of any present obligation as a result of a past event that could lead to a probable outflow of resources, provision has been made, which would be required to settle the obligation. The said provisions are made as per the best estimate of the management and disclosure as per Ind AS 37 - “Provisions, Contingent Liabilities and Contingent Assets” has been given below:
` in MillionAs at March 31, 2017 As at March 31, 2016
Product and Sales related*
Consultancy charges Total Product and
Sales related *Consultancy
charges Total
Opening balance 44,707.6 - 44,707.6 42,725.1 1,184.6 43,909.7 Add: Provision for the year 18,905.5 - 18,905.5 11,758.5 - 11,758.5 Add: Unwinding of discount on provisions 437.8 - 437.8 538.0 - 538.0Less: Utilisation/Settlement (15,852.3) - (15,852.3) (12,830.2) (1,184.6) (14,014.8)Add/ (Less): Foreign currency translation difference
(1,295.0) - (1,295.0) 2,516.2 - 2,516.2
Closing balance 46,903.6 - 46,903.6 44,707.6 - 44,707.6 * Includes provision for Trade commitments, discounts, rebates, price reduction, product returns, medicaids and contingency provision.
Note 62
Exceptional item for previous year represents charge on account of impairment of certain property, plant and equipment and intangible assets and other related costs and write down of the carrying value of goodwill. This charge had arisen on account of the integration and optimisation exercise being carried out for certain manufacturing facilities. The recoverable amount of the said assets is its value in use which is determined for a period of less than one year.
Note 63
a) Since the US-FDA import alert at Karkhadi facility in March 2014, the Company remained fully committed to implement all corrective measures to address the observations made by the US-FDA with the help of third party consultant. Substantial progress has been made at the Karkhadi facility in terms of completing the action items to address the observations made by the US-FDA in its warning letter issued in May 2014. The Company is continuing to work closely and co-operatively with the US-FDA to resolve the matter. The contribution of this facility to Company’s revenues is not significant.
b) The US-FDA, on January 23, 2014, had prohibited using API manufactured at Toansa facility for manufacture of finished drug products intended for distribution in the U.S. market. Consequentially, the Toansa manufacturing facility was subject to certain provisions of the consent decree of permanent injunction entered in January 2012 by erstwhile Ranbaxy Laboratories Ltd (which was merged with Sun Pharmaceutical Industries Ltd in March 2015). In addition, the Department of Justice of the USA (‘US DOJ’), United States Attorney’s Office for the District of New Jersey had also issued an administrative subpoena dated March 13, 2014 seeking information primarily related to Toansa manufacturing facility for which a Form 483 containing findings of the US-FDA was issued in January 2014. The Company is continuing to fully cooperate and is in dialogue with the US DOJ, and continuing to provide requisite information.
c) In December 2015, the US-FDA issued a warning letter to the manufacturing facility at Halol. Subsequently, a re-inspection was carried out by the US-FDA in November 2016. At the conclusion of the inspection, FDA issued a Form 483 with nine observations. The Company has submitted its response documenting the corrective measures to resolve the 483 observations. The Company is providing regular updates to US-FDA on the progress of the corrective actions. The Company is continuing to manufacture and distribute products to the U.S from Halol facility and at the same time working closely and cooperatively with the US-FDA to resolve the matter.

SUN PHARMACEUTICAL INDUSTRIES L IMITED254
NOTES TO THE CONSOLIDATED FINANCIAL STATEMENTS
FOR THE YEAR ENDED MARCH 31, 2017
d) In September 2013, the US-FDA had put the Mohali facility under import alert and was also subjected to certain provisions of the consent decree of permanent injunction entered in January 2012 by erstwhile Ranbaxy Laboratories Ltd (which was merged with Sun Pharmaceutical Industries Ltd in March 2015). In November 2016, the US-FDA conducted a re-inspection of the Mohali facility post the completion of remediation work at the facility. As a result of this re-inspection, in March 2017, the US-FDA lifted the import alert and indicated that the facility was in compliance with the requirements of cGMP provisions mentioned in the consent decree. The Mohali facility will continue to remain under consent decree under certain other provisions of the decree for a fixed period of time to demonstrate sustainable cGMP compliance.
Note 64
Remuneration to the Managing Director and the Whole-time Director(s) of the Parent Company for the years ended March 31, 2015, March 31, 2016 and March 31, 2017 are higher by ` 49.6 Million, ` 29.6 Million and ` 44.7 Million respectively than the amounts approved by the Central Government of India (Ministry of Corporate Affairs) on applications made by the Parent Company to approve the maximum remuneration as approved by the members of the Company for the three years ended March 31, 2017, in excess of the limits specified under Schedule V to the Companies Act, 2013, in case of inadequacy of profits. The Parent Company has re-represented to the office of the Ministry of Corporate Affairs (MCA) for approval of remuneration within the overall limits approved by the members of the Parent Company for the years ended March 31, 2015 and March 31, 2016, and that for the year ended March 31, 2017, applications for revision in the remuneration, as approved by the members of the Parent Company, has been made to the MCA. The responses in respect of the foregoing re-representation / applications for revision are awaited from the MCA. On receipt of the requisite approvals, the balance amount of remuneration for the aforesaid years, if any, as per their entitlement, shall be paid to the Managing Director and the Whole-time Director(s), as applicable, and the same shall be given effect to in the year in which the approval is received. Excess remuneration, if any, after final approval in respect of the re-representation/applications for revision is received, shall be refunded by the respective Managing Director and the Whole-time Director(s).
Note 65
The Parent Company completed buy-back of 7,500,000 equity shares of ` 1 each (representing 0.31% of total pre buy-back paid up equity capital) on October 18, 2016, from the shareholders on a proportionate basis by way of a tender offer at a price of ` 900 per equity share for an aggregate amount of ` 6,750.0 Million in accordance with the provisions of the Companies Act, 2013 and the SEBI (Buy Back of Securities) Regulations, 1998. This buy-back of equity shares was approved by the Board of Directors of the Parent Company at its meeting held on June 23, 2016.
Note 66
Pursuant to the Scheme of Arrangement u/s 391 to 394 of the Companies Act, 1956 for amalgamation of erstwhile RLL with the Parent Company as sanctioned by the Hon’ble High Court of Gujarat and Hon’ble High Court of Punjab and Haryana on March 24, 2015 (effective date) all the assets, liabilities and reserves of erstwhile RLL were transferred to and vested in the Parent Company with effect from April 01, 2014, the appointed date. Erstwhile RLL along with its subsidiaries and associates was operating as an integrated international pharmaceutical organisation with business encompassing the entire value chain in the production, marketing and distribution of pharmaceutical products. The scheme was accordingly been given effect to in the Consolidated Financial Statements for the year ended March 31, 2015. On April 10, 2015, in terms of the Scheme of Arrangement 0.8 equity share of ` 1 each (Number of Shares 334,956,764 including 186,516 Shares held by ESOP trust) of the Parent Company has been allotted to the shareholders of erstwhile RLL for every 1 share of ` 5 each (Number of Shares 418,695,955 including 233,146 shares held by ESOP trust) held by them in the share capital of erstwhile RLL, after cancellation of 6,967,542 shares of erstwhile RLL. These shares were considered for the purpose of calculation of earnings per share appropriately. The net effect of ` 982.5 Million being the difference between the amount recorded as share capital, the amount of the share capital of erstwhile RLL and cancellation of shares of erstwhile RLL has been reduced from Reserves.
Note 67
Pursuant to the declaration executed by the Sun Pharma Laboratories Limited (SPLL), a wholly owned subsidiary, in favour of Trumpcard Advisors and Finvest LLP (‘Donee’) on March 31, 2017, the power

255ANNUAL REPORT 2016-17
NOTES TO THE CONSOLIDATED FINANCIAL STATEMENTS
FOR THE YEAR ENDED MARCH 31, 2017
CORPORATE OVERVIEW STATUTORY REPORTS FINANCIAL STATEMENTS01-07 08-79 80-278
undertaking of SPLL (‘Donor’) has been gifted to Trumpcard Advisors and Finvest LLP. Accordingly, on and with effect from the close of business hours on March 31, 2017, all the assets, movable and immovable, tangible and intangible, along with the liabilities pertaining to the power undertaking stand transferred to and vested in Trumpcard Advisors and Finvest LLP as a going concern without consideration. For this purpose, the net book value on gift of power undertaking has been added to the cost of investment of the SPLL in Vintage Power Generation LLP, being the partner of the Donee.
Note 68
DETAILS OF LONG TERM BORROWINGS AND CURRENT MATURITIES OF LONG TERM DEBT AND FINANCE LEASE OBLIGATIONS [INCLUDED UNDER OTHER FINANCIAL LIABILITIES (CURRENT)]
A Secured Term Loan from banks: (I) Long term loan of ` Nil (March 31, 2016: ` Nil, April 01,
2015: USD 5.9 Million - ` 368.0 Million) [Included in long term borrowings ` Nil (March 31, 2016: ` Nil, April 01, 2015 ` 311.0 Million) and ` Nil (March 31, 2016: ` Nil, April 01, 2015: ` 57.0 Million) in current maturities of long term debt] which was repayable by October 2020 has been repaid during the year ended March 31, 2016. The loan was secured by building situated at New York, USA.
(II) Loan of ` Nil (March 31, 2016: ` Nil, April 01, 2015 BRL 0.8 Million - ` 16.4 Million) included in long term borrowings ` Nil (March 31, 2016: ` Nil, April 01, 2015 ` 16.4 Million) which was repayable by December 2016 has been repaid during the year ended March 31, 2016. The loan was secured by land and factory building situated at Goiania, Brazil.
B Secured Term Loan from Other Parties: Secured term loan from department of biotechnology of
` 108.2 Million (March 31, 2016: ` 77.3 Million, April 01, 2015: ` 77.3 Million) has been secured by hypothecation of assets and goods of the Parent Company. The loan is repayable in 10 equal half yearly installments commencing from December 26, 2018, last installment is due on June 26, 2023.
C Lease obligations of ` 702.0 Million (March 31, 2016: ` 748.5 Million, April 01, 2015: ` 24.1 Million) [included in non-current
borrowing March 31, 2017: ` 662.5 Million (March 31, 2016: ` 715.8 Million, April 01, 2015: ` 2.2 Million) and March 31, 2017: ` 39.5 Million (March 31, 2016: ` 32.7 Million and April 01, 2015: ` 21.9 Million) in current maturities of long term finance lease obligations] repayable by FY 2019-2025 is secured against assets taken on finance lease.
D Unsecured Term Loan from banks: (i) Loan of USD 17.5 Million equivalent to ` 1,134.2 Million
(March 31, 2016: USD 18.2 Million equivalent ` 1,206.7 Million, April 01, 2015: USD 18.9 Million equivalent ` 1,181.6 Million) [Included in non-current borrowing March 31, 2017: ` 1,085.2 Million (March 31, 2016: ` 1,158.8 Million, April 01, 2015: ` 1,138.3 Million) and March 31, 2017: ` 49.0 Million (March 31, 2016: ` 47.9 Million, April 01, 2015: ` 43.3 Million) in current maturities of long term debt], which is repayable in varying amounts by June 2033. The loan is collateralized by substantially all the assets of Pharmalucence Inc.
(ii) External Commercial Borrowings (ECBs) has 6 loans aggregating of USD 256 Million (March 31, 2016: USD 266 Million, April 01, 2015: USD 288 Million) equivalent to ` 16,602.9 Million (March 31, 2016: ` 17,625.2 Million, April 01, 2015: ` 18,001.4 Million) [(included in long term borrowings ` 7,523.2 Million (March 31, 2016: ` 15,902.4 Million, April 01, 2015: ` 11,625.9 Million) and in current maturities of long term debt ` 9,079.7 Million (March 31, 2016: ` 1,722.8 Million, April 01, 2015: ` 6,375.5 Million))]. For the ECB loans outstanding as at March 31, 2017, the terms of repayment for borrowings are as follows:
a) USD Nil (March 31, 2016: USD Nil, April 01, 2015: USD 50 Million) equivalent to ` Nil (March 31, 2016: ` Nil, April 01, 2015: ` 3,125.2 Million). The loan was taken on August 12, 2010. The outstanding amount has been repaid during the year ended March 31, 2016.
b) USD Nil (March 31, 2016: USD Nil, April 01, 2015: USD 30 Million) equivalent to ` Nil (March 31, 2016: ` Nil, April 01, 2015: ` 1,875.2 Million). The loan was taken on September 9, 2010. The outstanding amount has been repaid during the year ended March 31, 2016.

SUN PHARMACEUTICAL INDUSTRIES L IMITED256
NOTES TO THE CONSOLIDATED FINANCIAL STATEMENTS
FOR THE YEAR ENDED MARCH 31, 2017
c) USD 10 Million (March 31, 2016: USD 20 Million, April 01, 2015: USD 30 Million) equivalent to ` 648.6 Million (March 31, 2016: ` 1,325.2 Million, April 01, 2015: ` 1,875.2 Million). The loan was taken on June 30, 2011 and is repayable in 3 equal installments of USD 10 Million each at the end of 4th year, 5th year and 6th year. Second installment of USD 10 Million has been repaid in current year and first installment of USD 10 Million was repaid during the year ended March 31, 2016. The last installment is due on June 30, 2017.
d) USD 50 Million (March 31, 2016: USD 50 Million, April 01, 2015: USD 50 Million) equivalent to ` 3,242.8 Million (March 31, 2016: ` 3,313.0 Million, April 01, 2015: ` 3,125.2 Million). The loan was taken on September 20, 2012 and is repayable on September 19, 2017.
e) USD 100 Million (March 31, 2016: USD 100 Million, April 01, 2015: USD 100 Million) equivalent to ` 6,485.5 Million (March 31, 2016: ` 6,626.0 Million, April 01, 2015: ` 6,250.5 Million). The loan was taken on June 04, 2013 and is repayable on June 03, 2018.
f) USD Nil (March 31, 2016: USD 16 Million, April 01, 2015: USD 28 Million) equivalent to ` Nil (March 31, 2016: ` 1,060.2 Million, April 01, 2015: ` 1,750.1 Million). Loan of USD 40 Million was taken on March 25, 2011 and was repayable in 3 installments viz., 30% each of the drawn amount at the end of 4th year and 5th year and 40% of the drawn amount at the end of the 6th year. The last installment of USD 16 Million has been repaid in current year. First and Second installment of USD 12 Million each has been repaid in previous years.
g) USD 50 Million (March 31, 2016: USD 50 Million, April 01, 2015: USD Nil) equivalent to ` 3,242.8 Million (March 31, 2016: ` 3,313.0 Million, April 01, 2015: ` Nil) The loan was taken on August 11, 2015 and is repayable on August 11, 2017.
h) USD 30 Million (March 31, 2016: USD 30 Million, April 01, 2015: USD Nil) equivalent to ` 1,945.7 Million (March 31, 2016: ` 1,987.8 Million, April 01, 2015: ` Nil) The loan was taken on September 09, 2015 and is repayable on September 08, 2017.
i) USD 16 Million (March 31, 2016 : USD Nil, April 01, 2015: USD Nil) equivalent to ` 1,037.7 Million (March 31, 2016: ` Nil, April 01, 2015: ` Nil). The loan was taken on March 24, 2017 and is repayable on March 22, 2019.
(iii) Loan under Foreign Currency Non Resident (FCNR B) Scheme of USD 50.0 Million (March 31, 2016: USD 50 Million, April 01, 2015: USD Nil) equivalent to ` 3,242.8 Million (March 31, 2016: ` 3,313.0 Million, April 01, 2015: ` Nil). The loan was taken on August 19, 2015 and is repayable on August 18, 2017.
E Unsecured Debentures: 10,000.0 Million (March 31, 2016: ` 10,000 Million; April
01, 2015: ` Nil) Rated unsecured listed redeemable non-convertible debentures at a coupon rate of 7.94% p.a. were issued by Sun Pharma Laboratories Limited (“SPLL” - the Wholly owned subsidiary) on December 23, 2015. Following are the details:
Particulars Face Value (`)Redemption
Amount (` in Million)
Date of Redemption
Rated Unsecured Listed Redeemable 5,000 Non-Convertible Debentures Series 2 1,000,000 5,000.0 March 22, 2019Rated Unsecured Listed Redeemable 5,000 Non-Convertible Debentures Series 1 1,000,000 5,000.0 December 22, 2017
F Unsecured Term Loan from Other Parties: Unsecured loan from other parties amounting to ` Nil (March 31, 2016: ` Nil, April 01, 2015: ` 513.1 Million) of which ` Nil (March 31,
2016: ` Nil, April 01, 2015: ` 497.6 Million) was repayable after August 2016 on demand and balance of ` Nil (March 31, 2016: ` Nil, April 01, 2015: ` 15.5 Million) was repayable after March 2016 on demand. The above loans has been repaid during the year ended March 31, 2016.

257ANNUAL REPORT 2016-17
NOTES TO THE CONSOLIDATED FINANCIAL STATEMENTS
FOR THE YEAR ENDED MARCH 31, 2017
CORPORATE OVERVIEW STATUTORY REPORTS FINANCIAL STATEMENTS01-07 08-79 80-278
G Term Loan from banks and Debentures (included under current maturities of long term borrowing): (i) Redeemable non-convertible debentures of ` Nil (March 31, 2016: ` Nil, April 01, 2015: ` 5,000.0 Million) issued on November 23,
2012 for a period of 36 months at a coupon rate of 9.20% p.a. Such debentures were secured by a pari-passu first ranking charge on the Parent Company’s specified fixed assets so as to provide a fixed asset cover of 1.25x and were listed on the National Stock Exchange. The loan was taken on November 23, 2012 and has been repaid during the year ended March 31, 2016.
(ii) Unsecured Term Loan of ` Nil (March 31, 2016: ` Nil, April 01, 2015: ` 2,500.0 Million) has been repaid during the year ended March 31, 2016.
The Parent Company has not defaulted on repayment of loan and interest payment thereon during the year.
Note 69 DETAILS OF SECURITIES FOR SHORT TERM BORROWINGS ARE AS UNDER:First charge has been created on a pari-passu basis, by hypothecation of inventories, trade receivables, outstanding money receivables, claims and bills and other receivables (includes under loans and advances and other assets), both present and future.
Note 70 LOANS/ADVANCES DUE FROM AN ASSOCIATE
` in Million
As at March 31, 2017
As at March 31, 2016
As at April 01, 2015
Interest bearing with specified repayment schedule:Zenotech Laboratories Limited, India *Considered good - - 326.8 Considered doubtful 726.9 663.5 274.0
726.9 663.5 600.8 Less: Allowance for doubtful loan/interest accrued and due on loan 726.9 663.5 274.0
- - 326.8
* includes interest accrued and due on loans amounting to ` 214.9 Million (March 31, 2016: ` 151.5 Million; April 01, 2015: ` 88.8 Million).
Loans have been granted to the above entity for the purpose of its business.
Consequent to the amalgamation of erstwhile RLL into the Parent Company as referred in Note 66, Zenotech Laboratories Limited (‘Zenotech’) had become an associate of the Parent Company. The erstwhile RLL had granted certain loans to Zenotech which were outstanding and inherited by the Parent Company. The Parent Company has not granted any further loans to Zenotech post effective date of amalgamation i.e. March 24, 2015. The balance of this inherited outstanding loan is ` 512.0 Million. The Parent Company is in process of evaluating various options in relation to recovery of the outstanding loans and interest thereon of ` 214.9 Million (March 31, 2016: ` 151.5 Million, April 01, 2015: ` 88.8 Million).

SUN PHARMACEUTICAL INDUSTRIES L IMITED258
NOTES TO THE CONSOLIDATED FINANCIAL STATEMENTS
FOR THE YEAR ENDED MARCH 31, 2017
Note 71
DETAILS OF SPECIFIED BANK NOTES (SBN) HELD AND TRANSACTED OF THE PARENT COMPANY AND SUBSIDIARIES COMPANIES IN INDIA DURING THE PERIOD FROM NOVEMBER 08, 2016 TO DECEMBER 30, 2016 IS AS FOLLOWS:
All amounts in absolute `
Particulars Specified bank notes*
Other denomination notes Total
Closing cash in hand as on November 08, 2016 2,964,000 5,427,960 8,391,960 Permitted receipts during November 08, 2016 and December 30, 2016 - 14,405,657 14,405,657 Permitted payments during November 08, 2016 and December 30, 2016 (280,500) (12,794,823) (13,075,323)Amount deposited in banks (2,683,500) - (2,683,500)Closing cash in hand as on December 30, 2016 - 7,038,794 7,038,794
* Specified bank notes are currency notes of ` 500 and ` 1000 discontinued vide notification S.O. 3407(E) dated November 08, 2016.
Note 72
The Group has benefited from active grants from Government of Romania and European Union. These grants were received for building, plant and machinery and laboratory equipment. The grant will be amortised in varying periods based on category of asset and from the date when grant is received. Amortisation period ranges from 2 months to 338 months.
Note 73
Property, plant and equipment consisting of land, building, plant and equipment, furniture and fixtures amounting to ` 65.9 Million (March 31, 2016: ` 71.9 Million, April 01, 2015: ` Nil) in respect of the manufacturing facility in Ireland are held for sale. The management expects disposal of these assets in financial year 2017-2018.
Note 74 DISCLOSURE OF A SUBSIDIARY THAT HAS NON-CONTROLLING INTEREST THAT IS MATERIAL TO THE GROUP
Name of Subsidiary Principal place of business
Country of incorporation Nature* As at March
31, 2017As at March
31, 2016As at April
01, 2015Taro Pharmaceutical Industries Ltd. and its subsidiaries (TARO Group)
United States of America
Israel Beneficial ownership
27.19% 31.02% 31.13%
Voting power 18.13% 20.68% 20.76%* Held by Non-controlling interest

259ANNUAL REPORT 2016-17
NOTES TO THE CONSOLIDATED FINANCIAL STATEMENTS
FOR THE YEAR ENDED MARCH 31, 2017
CORPORATE OVERVIEW STATUTORY REPORTS FINANCIAL STATEMENTS01-07 08-79 80-278
` in MillionProfit/(loss) allocated to non-
controlling interests Accumulated non-controlling interests
Name of Subsidiary Year ended March 31, 2017
Year ended March 31, 2016
As at March 31, 2017
As at March 31, 2016
As at April 01, 2015
TARO Group 8,599.9 11,037.8 36,547.7 39,800.3 27,551.9 Individually immaterial subsidiaries with non-controlling interests
218.7 88.2 1,360.9 1,052.2 960.0
Total 8,818.6 11,126.0 37,908.6 40,852.5 28,511.9
The summarised consolidated financial information of TARO Group before inter-company eliminations:` in Million
Consolidated balance sheet of TARO Group As at March 31, 2017
As at March 31, 2016
As at April 01, 2015
Non-current assets 34,063.2 27,934.4 24,493.7 Current assets 113,879.1 115,314.4 83,946.8 Non-current liabilities (277.6) (256.4) (556.6)Current liabilities (13,248.8) (14,691.7) (19,366.3)
` in MillionYear ended
March 31, 2017Year ended
March 31, 2016Consolidated Statement of profit and loss of TARO GroupTotal Income 60,748.8 63,350.5 Total Expenses (23,243.0) (21,951.6)Profit after Tax 30,612.9 35,472.4 Total comprehensive income for the year 25,241.9 40,406.9
` in MillionYear ended
March 31, 2017Year ended
March 31, 2016Consolidated cash flows information of TARO GroupCash flow from operating activities 29,345.5 25,853.2 Cash flow from investing activities (7,899.4) (18,629.9)Cash flow from financing activities 40,268.8 37,737.2
There has been no dividend paid by TARO during the year ended March 31, 2017 and March 31, 2016.
Note 75
(a) Sun Pharma Global FZE, a subsidiary of the Parent Company holds 23.35% in the capital of Enceladus Pharmaceutical B.V. However, as Sun Pharma Global FZE does not have any ‘Significant Influence’ in Enceladus Pharmaceutical B.V., as is required under Ind AS 28 - “Investment in Associates & Joint Ventures”, the said investment in Enceladus Pharmaceutical B.V. has not been consolidated as an “Associate Entity”.
(b) The Parent Company holds 24.91% in the capital of Shimal Research Laboratories Limited. However, as the Parent Company does not have any ‘Significant Influence’ in Shimal Research Laboratories Limited, as is required under Ind AS 28 - “Investment in Associates & Joint Ventures”, the said investment in Shimal Research Laboratories Limited has not been consolidated as an “Associate Entity”.

SUN PHARMACEUTICAL INDUSTRIES L IMITED260
NOTES TO THE CONSOLIDATED FINANCIAL STATEMENTS
FOR THE YEAR ENDED MARCH 31, 2017
Note 76
FIRST TIME IND AS ADOPTION RECONCILIATIONi Explanation to transition to Ind AS Ind AS 101 -“First-time Adoption of Indian Accounting Standards”
requires that all Ind AS standards and interpretations that are issued and effective for the first Ind AS consolidated financial statements which is for the year ended March 31, 2017 for the Group, be applied retrospectively and consistently for all financial years presented. Except for the Group has availed certain exemptions and complied with the mandatory exceptions provided in Ind AS 101, as described below. The Group has recognised all assets and liabilities whose recognition is required by Ind AS and has not recognised items of assets or liabilities which are not permitted by Ind AS, reclassified items from previous GAAP to Ind AS as required under Ind AS and applied Ind AS in measurement of recognised assets and liabilities.
Set out below are the Ind AS 101 optional exemptions availed as applicable and mandatory exceptions applied in the transition from previous GAAP to Ind AS.
ii Derecognition of financial assets and financial liabilities The Group has applied the derecognition requirements of financial
assets and financial liabilities prospectively for transactions occurring on or after the transition date.
iii Hedge accounting At the date of transition to Ind AS, the Group has measured all
derivatives at fair value and eliminated all deferred losses and gains arising on derivatives that were reported in accordance with previous GAAP as if they were assets or liabilities.
iv Classification and measurement of financial assets The Group has assessed conditions for classification of the
financial assets on the basis of the facts and circumstances that were exist on the date of transition to Ind AS.
v Deemed cost of property, plant and equipment and other intangible assets
On transition to Ind AS, the Parent Company and the Indian subsidiaries have elected to continue with the carrying value of all of its property, plant and equipment and other intangible assets recognised as at April 01, 2015 measured as per the previous GAAP and use that carrying value as the deemed cost of the property, plant and equipment and other intangible assets.
vi Designation of previously recognised financial instruments Ind AS 101 allows an entity to designate investments in equity
instruments at FVTOCI on the basis of the facts and circumstances at the date of transition to Ind AS. The Group has elected to apply this exemption for its investments in certain equity instruments.
vii Compound financial instruments Under Ind AS 32, the Group should split compound financial
instruments into separate equity and liability components. Ind AS 101 provides that if the liability component is no longer outstanding at the date of transition, a first-time adopter does not have to separate it from the equity component. The Group has elected to apply this exemption for its compound financial instruments.
viii Fair value measurement of financial assets and financial liabilities at initial recognition
The Group has applied the requirements in paragraph B5.1.2A (b) of Ind AS 109 prospectively to transactions entered into on or after the date of transition to Ind AS. This exemption has been availed by the Group.
ix Non - current assets held for sale and discontinued operations
Ind AS 105 requires that asset classified as non - current as per Ind AS 1 are not reclassified as current assets until they meet criteria to be classified as held for sale. The adopter can opt to either value those assets at carrying amount or fair value less cost of sale at the transition date and record any difference between such amount and carrying value directly to retained earnings. The Group has applied for this exemption.
x Business Combinations Ind AS 101 provides the option to apply Ind AS 103 prospectively
from the transition date or from a specific date prior to the transition date. This provides relief from full retrospective application that would require restatement of all business combinations prior to the transition date. The Group elected to apply Ind AS 103 prospectively to business combinations occurring after its transition date. Business combinations occurring prior to the transition date have not been restated.
xi Share-based payment transactions As per previous GAAP, the Group had applied the fair value
recognition and measurement principles similar to those prescribed

261ANNUAL REPORT 2016-17
NOTES TO THE CONSOLIDATED FINANCIAL STATEMENTS
FOR THE YEAR ENDED MARCH 31, 2017
CORPORATE OVERVIEW STATUTORY REPORTS FINANCIAL STATEMENTS01-07 08-79 80-278
under Ind AS 102 for all options granted before the Transition Date. Consequently, this exemption was not required to be applied.
xii Non-controlling interests Ind AS 110 requires entities to attribute the profit or loss and each component of other comprehensive income to the owners of the parent
and to the non-controlling interests. Ind AS 110 requires the above requirement to be followed prospectively from the date of transition. Consequently, the group has applied the above requirement prospectively.
xiii Cumulative translation differences on foreign operations The Group has elected the option to reset the cumulative translation differences on foreign operations that exists as of the transition date to zero.
xiv Excise duty Under the previous GAAP, excise duty was netted off against sale of products. However, under Ind AS, excise duty is included in sale of
products and is separately presented as expense in the consolidated statement of profit and loss.` in Million
Footnote No.
As at March 31,
2016
As at April 01,
2015Reconciliation of total equityEquity as per previous GAAP * 314,042.2 256,231.9
Add / (Less) : Adjustments for GAAP DifferencesAdjustment for proposed dividend (including corporate dividend tax) a 2,896.8 8,689.2 Effect of measuring derivative instruments at fair value through profit or loss b 922.5 823.8 Discount / (Unwinding of discount) on provisions c 885.1 1,382.3 Recognition of intangible assets not eligible for recognition under previous GAAP d 30.1 - Provision for expected credit losses f (201.2) (118.8)Effect of measuring financial instruments at fair value through OCI g 4,069.3 6,883.5 Effect of measuring investments at fair value through profit or loss h 72.8 581.6 Retrospective application of Ind AS 21 to goodwill arising in business combinations occurred before the date of transition to Ind AS
i 5,422.3 4,417.4
Tax impact on Ind AS adjustments (including on unrealised intra group profits on inventories) j 1,518.8 1,387.3 Other Ind AS adjustments 166.1 136.3
Equity as per Ind AS 329,824.8 280,414.5
* Equity as per previous GAAP includes share capital, share suspense account and reserves and surplus.

SUN PHARMACEUTICAL INDUSTRIES L IMITED262
NOTES TO THE CONSOLIDATED FINANCIAL STATEMENTS
FOR THE YEAR ENDED MARCH 31, 2017
` in MillionFootnote
No.Year ended
March 31, 2016Reconciliation of total comprehensive incomeProfit for the year as per previous GAAP 47,159.1
Add / (Less) : Adjustments for GAAP DifferencesEffect of measuring derivative instruments at fair value through profit or loss b 98.7 Effect of measuring investments at fair value through profit or loss h (508.8)Discount / (Unwinding of discount) on provisions c (497.2)Remeasurement of defined benefit obligation recognised in OCI under Ind AS e 389.7 Recognition of intangible assets not eligible for recognition under previous GAAP d 30.1 Provision for expected credit losses f (82.4)Tax impact on Ind AS adjustments (including on unrealised intra group profits on inventories) j 131.5 Other Ind AS adjustments k (1,263.6)
Profit for the year as per Ind AS - attributable to the owners of the company 45,457.1 Other comprehensive income (net of tax) 12,794.5
Total comprehensive income pertaining to the owners of the company 58,251.6
Effect of Ind AS adoption on the statement of cash flow for the year ended March 31, 2016` in Million
Previous GAAPEffect of
transition to Ind AS
Ind AS
Net cash flows from operating activities 67,693.8 (835.2) 66,858.6 Net cash flows from investing activities (44,549.1) 833.2 (43,715.9)Net cash flows from financing activities (19,243.2) 357.9 (18,885.3)Net increase in cash and cash equivalents 3,901.5 355.9 4,257.4
Net increase in cash and cash equivalents represents:(i) Movement in cash credit facilities considered as a component of cash and cash equivalents under Ind AS which as per previous GAAP, was considered as
financing activity.
(ii) Consideration paid for obtaining control of subsidiaries / business unit being disclosed as net of cash and cash equivalents acquired as part of such transactions under Ind AS and
(iii) Changes in cash and cash equivalent balances due to equity accounting of joint ventures under Ind AS.
Other Ind AS adjustments are either non cash adjustments or are regrouping among the cash flows from operating, investing and financing activities and has no impact on the net cash flow for the year ended March 31, 2016 as compared with the previous GAAP.
Footnotes:a) Proposed Dividend (including corporate dividend tax) Under Ind AS, dividend to holders of equity instruments is recognised as a liability in the period in which the obligation to pay is
established. Under previous GAAP, dividend proposed was recorded as a provision in the period to which it relates.
b) Derivative instruments at fair value through profit or loss Under previous GAAP, derivative instruments entered into for hedging the foreign currency fluctuation risk were accounted for on the
principles of prudence. Pursuant to this, losses, if any, on Mark to Market basis, were recognised and gains were not recognised. Under Ind AS, gains on derivative instruments have been measured at fair value through profit or loss.

263ANNUAL REPORT 2016-17
NOTES TO THE CONSOLIDATED FINANCIAL STATEMENTS
FOR THE YEAR ENDED MARCH 31, 2017
CORPORATE OVERVIEW STATUTORY REPORTS FINANCIAL STATEMENTS01-07 08-79 80-278
c) Discounting/(unwinding of discount) on provisions Under Ind AS, long term provisions are to be measured at
present value at the date of transition.
d) Separately acquired intangible assets Under Ind AS, separately acquired intangible assets shall be
capitalised which were not eligible for capitalisation under previous GAAP.
e) Employee benefits Under previous GAAP, actuarial gains and losses were recognised
in consolidated statement of profit and loss. Under Ind AS, the actuarial gains and losses form part of remeasurement of net defined benefit liability / asset, which is recognised in other comprehensive income in the respective periods.
f) Expected credit loss Under previous GAAP, the Group had created provision for
doubtful debts based on specific amount for incurred losses. Under Ind AS, the allowance for doubtful debts has been determined based on expected credit loss model.
g) Effect of measuring financial instruments at fair value through OCI
Under Ind AS, the Group has measured financial instruments at fair value through OCI, which were not applicable in previous GAAP.
h) Effect of measuring investments at fair value through profit or loss
Under previous GAAP, non current investments were stated at cost less provision, if any, for other than temporary diminution in value. Current investments were valued at lower of cost and fair value. Under Ind AS, gains or losses on investments have been measured at fair value through profit or loss.
i) Retrospective application of Ind AS 21 to goodwill arising in business combinations occurred before the date of tran-sition to Ind AS
Under Ind AS, retrospective application of Ind AS 21 to goodwill arising in business combinations occurred before the date of transition to Ind AS, which has resulted in increase in equity.
j) Tax impact on Ind AS adjustments In the financial statements prepared under Previous GAAP,
deferred tax was accounted as per the income statement approach which required creation of deferred tax asset/liability on temporary differences between taxable profit and accounting profit. Under Ind AS, deferred tax is accounted as per the Balance Sheet approach which requires creation of deferred tax asset/liability on temporary differences between the carrying amount of an asset/liability in the Balance Sheet and its corresponding tax base. The application of Ind AS has also resulted in recognition of deferred tax on new temporary differences which were not required to be recognised under previous GAAP, including deferred taxes in respect of unrealised intra group profits on inventories.
Further, deferred tax assets on unabsorbed depreciation and carry forward of losses was recognised only to the extent of virtual certainty supported by convincing evidence under previous GAAP as against recognition of such assets under Ind AS to the extent that it is probable that the said assets would be utilised.
k) Other Ind AS adjustments Other Ind AS adjustments mainly pertains to difference in loss
on disposal of foreign subsidiaries, determined under Ind AS as compared to previous GAAP, in view of the Group availing exemption as referred to in note 76(xiii) and difference in treatment of cumulative translation differences on translation of foreign operations.
Note 77
USE OF ESTIMATES AND JUDGEMENTSThe preparation of the Group’s financial statements requires the management to make judgements, estimates and assumptions that affect the reported amounts of revenues, expenses, assets and liabilities, and the accompanying disclosures, and the disclosure of contingent liabilities. Actual results may differ from these estimates. Estimates and underlying assumptions are reviewed on an ongoing basis. Revisions to accounting estimates are recognised in the period in which the estimates are revised and in any future periods affected. In particular, information about significant areas of estimation uncertainty and critical judgments in applying accounting policies that have the most significant effect on the amounts recognised in the consolidated financial statements is included in the following notes:

SUN PHARMACEUTICAL INDUSTRIES L IMITED264
NOTES TO THE CONSOLIDATED FINANCIAL STATEMENTS
FOR THE YEAR ENDED MARCH 31, 2017
1 Fair value measurement of Financial Instruments
When the fair values of financials assets and financial liabilities recorded in the financial statements cannot be measured based on quoted prices in active markets, their fair value is measured using valuation techniques which involve various judgements and assumptions.
2 Useful lives of property, plant and equipment and intangible assets (Refer note 2)
Property, plant and equipment and other intangible assets represent a significant proportion of the asset base of the Group. The charge in respect of periodic depreciation and amortisation is derived after determining an estimate of an asset’s expected useful life and the expected residual value at the end of its life. The useful lives and residual values of Group’s assets are determined by the management at the time the asset is acquired and reviewed periodically, including at each financial year end. The lives are based on historical experience with similar assets as well as anticipation of future events, which may impact their life, such as changes in technical or commercial obsolescence arising from changes or improvements in production or from a change in market demand of the product or service output of the asset.
3 Assets and obligations relating to employee benefits (Refer note 56)
The employment benefit obligations depends on a number of factors that are determined on an actuarial basis using a number of assumptions. The assumptions used in determining the net cost/ (income) include the discount rate, inflation and mortality assumptions. Any changes in these assumptions will impact upon the carrying amount of employment benefit obligations.
4 Tax expense [Refer Note 2(r)] Significant judgements are involved in determining the
provision for income taxes, if any, including amount expected to be paid/recovered for uncertain tax positions. Further, significant judgement is exercised to ascertain amount of deferred tax asset (DTA) that could be recognised based on the probability that future taxable profits will be available against which DTA can be utilized and amount of temporary difference
in which DTA can not be recognised on want of probable taxable profits.
5 Provisions [Refer note 2(n)]6 Write down in value of inventories (Refer Note 11)7 Contingencies (Refer note 40)8 Business combinations (Refer note 78)9 Impairment of goodwill (Refer note 48)
Note 78
BUSINESS COMBINATIONSa) Acquisition of plant (Baska, Gujarat) from Unimed
Technologies Limited On March 25, 2017, the Group completed the acquisition
of the manufacturing undertaking of Unimed Technologies Limited located at Baska, Gujarat which is engaged in the manufacturing of pharmaceutical products, on a slump sales basis to continue expansion of our business. The acquisition price of ` 10.0 Million was paid in cash.
The following assets and liabilities were recognised as at the date of acquisition (at fair value):
` In MillionAssetsCash and cash equivalents 0.2 Trade receivables 48.0 Inventories 307.7 Other current assets 371.1 Other non-current financial assets 10.6 Capital work-in-progress 522.1 Property, plant and equipment 633.5
1,893.2 LiabilitiesTrade payables (748.2)Provision for employee benefits (13.7)Other current financial liabilities (122.4)Borrowings (1,000.0)
(1,884.3)Total identifiable assets at fair value 8.9Goodwill 1.0 Total purchase price 9.9
The goodwill is tax deductible.
The gross amount of trade receivables acquired have been largely collected.

265ANNUAL REPORT 2016-17
NOTES TO THE CONSOLIDATED FINANCIAL STATEMENTS
FOR THE YEAR ENDED MARCH 31, 2017
CORPORATE OVERVIEW STATUTORY REPORTS FINANCIAL STATEMENTS01-07 08-79 80-278
There has not been any contribution to group revenue on account of this business purchase. The business acquired has contributed a net loss of ` 13.5 Million from the date of acquisition.
b) JSC Biosintez On December 20, 2016, the Group completed the acquisition
of 85.1% shares of JSC Biosintez, a Russian pharmaceutical company focused on the hospital segment with an objective to acquire the product portfolio and local manufacturing capability in Russia which would help in expanding our presence in Russia and serving Russia pharmaceutical market more effectively. The excess of the purchase consideration paid over the fair value of assets acquired has been attributed to goodwill. The goodwill is not tax deductible.
The business acquisition was conducted by entering into a share purchase agreement for cash consideration of ` 1,539.2 Million.
The Group has elected to measure the non-controlling interests in the acquiree at its proportionate share of net assets.
The following assets and liabilities were recognised in the acquisition (at fair value):
` In MillionAssetsCash and cash equivalents 2.8 Trade receivables 1,028.5 Inventories 399.9 Other current assets 31.9 Other non-current assets 60.9 Property, plant and equipment 3,522.0 Capital work-in-progress 259.4 Other intangible assets 3.5 Intangible assets under development 69.7
5,378.6 LiabilitiesBorrowings (2,617.9)Trade payables (706.7)Other current liabilities (41.5)Deferred tax liabilities (336.2)
(3,702.3)Total identifiable assets at fair value 1,676.3 Non-controlling interest 14.9%Non- controlling interest measured at the Group's proportionate share in net assets
(249.7)
Goodwill 112.6 Total purchase price 1,539.2
The gross amount of trade receivables acquired have been largely collected.
From the date of acquisition, JSC Biosintez has contributed revenue of ` 907.2 million and profit before tax of ` 43.0 million to the Group. If the business combinations had taken place at the beginning of the year, revenue would have been ` 3,308.7 million and the profit before tax would have been ` 216.8 million.
Transaction costs of ` 97.9 million have been expensed and are included in other expenses in the consolidated statement of profit and loss.
c) Insite Vision Incorporated On November 02, 2015, the Group acquired 100% shares
of Insite Vision Incorporated along with its subsidiary Insite Vision Limited (together referred as “Insite”). Accordingly, the results of operations for Insite have been included in these consolidated financial statements from that date forward. The Group acquired Insite to facilitate its entry and expansion into the ophthalmic market in the United States. The excess of the purchase consideration paid over the fair value of assets acquired has been attributed to goodwill. The goodwill is not tax deductible.
The business acquisition was conducted by entering into a share purchase agreement for cash consideration of ` 4,688.4 Million.
The following assets and liabilities were recognised as at the date of acquisition (at fair value):
` In MillionAssetsCash and cash equivalents 214.3Trade receivables 10.5Other current assets 13.0Property, plant and equipment 87.5Intangible assets under development 4,501.9
4,827.2 LiabilitiesTrade payables (257.5)Other current liabilities (276.1)
(533.6)Total identifiable assets at fair value 4,293.6 Goodwill 445.0 Total purchase price 4,738.6

SUN PHARMACEUTICAL INDUSTRIES L IMITED266
NOTES TO THE CONSOLIDATED FINANCIAL STATEMENTS
FOR THE YEAR ENDED MARCH 31, 2017
The gross amount of trade receivables acquired have been largely collected.
InSite Vision Incorporate had revenue of ` 50.7 Million and loss before tax of ` 459.4 Million during the five months of 2016. If the business combinations had taken place at the beginning of the year, revenue would have been ` 369.1 Million and the loss before tax would have been ` 1,561.1 Million.
Transaction costs of ` 68.2 million have been expensed and are included in other expenses in the consolidated statement of profit and loss.
d) Acquisition of GSK’s opiate business in Australia
On September 01, 2015, the Group completed the acquisition of GlaxoSmithKline’s (GSK’s) opiates business in Australia, strengthening its active pharmaceutical ingredients (API) and analgesic drug segments. This acquisition also enhances the opiate alkaloids portfolio of the group and depth in global opiates market. The acquisition price of ` 6,720.5 million was paid/payable in cash.
The following assets and liabilities were recognised as at the date of acquisition (at fair value):
` In MillionAssetsInventories 4,212.5 Property, plant and equipment 2,510.4 Other intangible assets 373.7
7,096.6 LiabilitiesProvision for employee benefits (224.7)Other current liabilities (151.4)
(376.1)Total identifiable assets at fair value 6,720.5 Goodwill -Total purchase price 6,720.5 GSK opiate business had revenue of ` 2,063.9 Million and loss of ` 281.1 million during the seven months of 2016 and revenue of ` 4,744.6 million and loss before tax of ` 345.2 Million in the current year.
Transaction costs of ` 47.8 Million have been expensed and are included in other expenses in the consolidated statement of profit and loss.
Note 79
a) During the December 2016, the Group acquired a branded
oncology product, Odomzo, from Novartis for an upfront payment of USD 175 Million equivalent to ` 11,884.3 Million approximately and additional milestone payments.
b) During the year ended March 31, 2016, the Group acquired portfolio consisting of 14 established prescription brands from Novartis AG and Novartis Pharma AG in Japan for a cash consideration of USD 293 Million equivalent to ` 19,414.2 Million approximately.
Note 80
a) Figures pertaining to the subsidiary companies have been
reclassified wherever necessary to bring them in line with the group financial statements.
b) Previous GAAP figures have been reclassified/regrouped wherever necessary to conform with the consolidated financial statements prepared under Ind AS.

267ANNUAL REPORT 2016-17
NOTES TO THE CONSOLIDATED FINANCIAL STATEMENTS
FOR THE YEAR ENDED MARCH 31, 2017
CORPORATE OVERVIEW STATUTORY REPORTS FINANCIAL STATEMENTS01-07 08-79 80-278
(Annexure ‘A’)
Disclosure of additional information pertaining to the Parent Company, subsidiaries, associates and joint ventures as per Schedule III of Companies Act, 2013:
Name of the EntityNet Assets, i.e., total assets
minus total liabilities Share in profit or (loss)Share in Other
Comprehensive Income (OCI)
Share in Total Comprehensive Income
(TCI)2016-17 2016-17 2016-17 2016-17
As % of consolidated
net assets` In Million
As % of consolidated
profit or (loss)
` In MillionAs % of
consolidated OCI
` In MillionAs % of
consolidated TCI
` In Million
Parent Entity - Sun Pharmaceutical Industries Limited 51.6 208,715.1 (0.5) (349.5) 4.8 (633.8) (1.7) (983.3)
Subsidiaries Indian1 Green Eco Development Centre Limited 0.0 1.6 (0.0) (0.5) - - (0.0) (0.5)2 Sun Pharma Laboratories Ltd 48.9 197,557.8 10.9 7,584.3 0.8 (107.0) 13.3 7,477.3 3 Faststone Mercantile Company Private Limited 0.0 11.1 0.0 0.3 - - 0.0 0.3 4 Neetnav Real Estate Private Limited 0.0 15.2 0.0 0.8 - - 0.0 0.8 5 Realstone Multitrade Private Limited 0.0 11.1 0.0 0.4 - - 0.0 0.4 6 Skisen Labs Private Limited 0.0 0.1 (0.0) (0.0) - - (0.0) (0.0)7 Softdeal Trading Company Private Limited 0.0 10.6 0.0 0.4 - - 0.0 0.4 8 Ranbaxy Drugs Limited 0.5 1,893.4 0.0 0.3 - - 0.0 0.3 9 Vidyut Investments Limited 0.0 27.4 0.0 2.5 - - 0.0 2.5 10 Gufic Pharma Limited 0.0 4.5 0.0 0.1 - - 0.0 0.1 11 Universal Enterprises Private Limited 0.0 5.3 0.0 0.0 - - 0.0 0.012 Sun Pharma Medisales Private Limited (Formerly known as
Solrex Pharmaceuticals Company)0.0 85.0 0.2 118.0 0.0 (0.7) 0.2 117.3
13 Sun Pharmaceutical Medicare Limited (0.0) (11.0) (0.0) (13.5) - - (0.0) (13.5)Foreign1 Sun Pharmaceutical (Bangladesh) Limited 0.2 942.2 0.3 219.2 - - 0.4 219.2 2 Sun Pharmaceutical Industries, Inc. (Consolidated with its
Subsidiaries, its associates and a Joint venture) 3.1 12,430.7 (2.3) (1,594.3)# - - (2.8) (1,594.3)#
3 Sun Farmaceutica Do Brasil Ltda. (0.5) (2,207.3) 0.3 185.1 - - 0.3 185.1 4 Sun Pharma De Mexico S.A. DE C.V. 0.2 758.1 0.2 118.5 - - 0.2 118.5 5 SPIL De Mexico S.A. DE C.V. 0.0 0.2 - - - - - - 6 Sun Pharmaceutical Peru S.A.C. (0.0) (150.0) (0.0) (19.9) - - (0.0) (19.9)7 OOO "Sun Pharmaceutical Industries" Limited (0.0) (182.6) 0.0 12.7 - - 0.0 12.7 8 Sun Pharma De Venezuela, C.A. (0.4) (1,444.5) (0.5) (325.3) - - (0.6) (325.3)9 Ranbaxy Pharmacie Generiques (0.4) (1,658.4) (0.2) (173.6) - - (0.3) (173.6)10 Ranbaxy (Malaysia) Sdn. Bhd. 0.1 333.4 0.1 86.6 - - 0.2 86.6 11 Ranbaxy Nigeria Limited 0.1 551.5 (0.2) (114.2) - - (0.2) (114.2)12 Ranbaxy (Netherlands) B.V. 13.2 53,421.2 1.5 1,079.2 - - 1.9 1,079.2 13 Alkaloida Chemical Company Zrt. 6.1 24,524.0 (1.9) (1,356.0) - - (2.4) (1,356.0)14 Sun Pharmaceuticals UK Limited (0.0) (91.4) (0.0) (0.8) - - (0.0) (0.8)15 Sun Pharmaceutical Industries (Australia) Pty Ltd 0.5 1,975.6 (0.5) (360.9) - - (0.6) (360.9)16 Aditya Acquisition Company Ltd. 0.0 6.0 0.0 5.6 - - 0.0 5.6 17 Sun Pharmaceutical Industries (Europe) B.V. (0.0) (110.5) 0.0 26.9 - - 0.0 26.9 18 Sun Pharmaceuticals Italia S.R.L. 0.0 40.5 (0.0) (1.5) - - (0.0) (1.5)19 Sun Pharmaceuticals Spain, S.L.U. - - (0.0) (5.2) - - (0.0) (5.2)20 Sun Pharmaceuticals Germany GmbH (0.0) (186.0) (0.0) (2.4) - - (0.0) (2.4)21 Sun Pharmaceuticals France (0.0) (17.1) (0.0) (4.3) - - (0.0) (4.3)22 Sun Pharma Global FZE (Consolidated with a Joint venture) 30.5 123,500.6 21.0 14,620.6 * 27.4 (3,657.4) 19.5 10,963.2* 23 Sun Pharmaceuticals (SA) (Pty) Ltd. (0.0) (0.1) (0.0) (0.0) - - (0.0) (0.0)24 Sun Global Canada Pty. Ltd. (0.0) (1.1) (0.0) (0.0) - - (0.0) (0.0)25 Sun Pharma Philippines, Inc. (0.1) (419.5) (0.2) (152.5) - - (0.3) (152.5)26 Sun Pharmaceuticals Korea Ltd. 0.0 4.2 (0.0) (0.3) - - (0.0) (0.3)

SUN PHARMACEUTICAL INDUSTRIES L IMITED268
NOTES TO THE CONSOLIDATED FINANCIAL STATEMENTS
FOR THE YEAR ENDED MARCH 31, 2017
Name of the EntityNet Assets, i.e., total assets
minus total liabilities Share in profit or (loss)Share in Other
Comprehensive Income (OCI)
Share in Total Comprehensive Income
(TCI)2016-17 2016-17 2016-17 2016-17
As % of consolidated
net assets` In Million
As % of consolidated
profit or (loss)
` In MillionAs % of
consolidated OCI
` In MillionAs % of
consolidated TCI
` In Million
27 Sun Global Development FZE 0.0 181.3 (0.0) (0.7) - - (0.0) (0.7)28 Sun Pharma Japan Ltd. (0.1) (443.6) (0.2) (117.8) - - (0.2) (117.8)29 Sun Pharma HealthCare FZE 0.0 181.0 0.0 2.5 - - 0.0 2.5 30 Sun Laboratories FZE (0.1) (344.7) (0.2) (114.3) - - (0.2) (114.3)31 Taro Pharmaceutical Industries Ltd. (TARO) 33.2 134,415.9 44.0 30,612.8 12.6 (1,683.7) 51.4 28,929.1 32 Alkaloida Sweden AB 0.0 20.0 0.0 9.6 - - 0.0 9.6 33 Sun Pharma Switzerland Limited (0.0) (21.8) (0.0) (27.8) - - (0.0) (27.8)34 Ocular Technologies 0.6 2,626.6 3.9 2,713.8 - - 4.8 2,713.8 35 Sun Pharma Holdings 50.4 203,802.5 (0.0) (9.7) - - (0.0) (9.7)36 Sun Pharma East Africa Limited (0.0) (71.5) (0.0) (32.2) - - (0.1) (32.2)37 Sun Pharma ANZ Pty Ltd (Formerly known as Ranbaxy
Australia Pty Ltd) (0.1) (429.7) 0.0 34.8 - - 0.1 34.8
38 Ranbaxy Farmaceutica Ltda. (0.3) (1,070.3) 0.1 87.3 - - 0.2 87.3 39 Ranbaxy Pharmaceuticals Canada Inc. 0.1 332.7 (0.1) (64.1) - - (0.1) (64.1)40 Ranbaxy Egypt LLC 0.1 265.7 (0.1) (95.4) - - (0.2) (95.4)41 Rexcel Egypt LLC (0.0) (10.9) (0.0) (11.8) - - (0.0) (11.8)42 Office Pharmaceutique Industriel Et Hospitalier 0.0 78.6 0.0 14.5 - - 0.0 14.5 43 Basics GmbH 0.2 842.2 0.1 41.2 - - 0.1 41.2 44 Ranbaxy GmbH 0.0 1.7 - - - - - - 45 Ranbaxy Ireland Limited 0.1 505.2 0.2 146.8 - - 0.3 146.8 46 Ranbaxy Italia S.P.A. 0.0 19.8 (0.0) (33.9) 0.0 (2.5) (0.1) (36.4)47 Sun Pharmaceutical Industries S.A.C. (Formerly known as
Ranbaxy - PRP (Peru) S.A.C.) (0.0) (94.5) (0.0) (22.2) - - (0.0) (22.2)
48 Ranbaxy (Poland) Sp. Z o.o. 0.0 156.9 0.0 11.0 - - 0.0 11.0 49 S. C. Terapia S.A. 2.6 10,409.9 3.2 2,237.1 - - 4.0 2,237.1 50 AO Ranbaxy (Formerly Known ZAO Ranbaxy) 0.2 987.2 0.2 143.0 - - 0.3 143.0 51 JSC Biosintez 0.4 1,703.7 0.0 25.1 - - 0.0 25.1 52 Ranbaxy South Africa Proprietary Limited (Consolidated with
its Subsidiary) 0.2 852.4 0.4 308.1 - - 0.5 308.1
53 Ranbaxy Pharmaceutical Proprietary Limited (0.3) (1,035.4) 0.3 186.9 - - 0.3 186.9 54 Be- Tabs Investments Proprietary Limited 0.0 17.3 0.0 0.1 - - 0.0 0.1 55 Laboratorios Ranbaxy, S.L.U. 0.1 248.6 0.2 104.9 - - 0.2 104.9 56 Ranbaxy (U.K.) Limited 0.3 1,164.6 0.1 63.2 - - 0.1 63.2 57 Ranbaxy Holdings (U.K.) Limited 0.6 2,480.0 (0.0) (1.0) - - (0.0) (1.0)58 Ranbaxy Europe Limited 0.0 148.1 0.0 0.0 - - 0.0 0.0 59 Ranbaxy Inc. (Consolidated with its Subsidiaries) 9.4 38,000.0 7.6 5,297.3 - - 9.4 5,297.3 60 Sun Pharmaceuticals Holdings USA, INC 5.1 20,673.7 0.0 0.1 - - 0.0 0.1 61 Ranbaxy (Thailand) Company Limited 0.0 160.8 (0.1) (91.1) - - (0.2) (91.1)62 Sun Pharmaceuticals Morocco LLC (Formerly known as
Ranbaxy Morocco LLC) (0.0) (40.2) 0.1 81.7 - - 0.1 81.7
63 "Ranbaxy Pharmaceuticals Ukraine" LLC 0.0 107.4 0.0 27.1 - - 0.0 27.1 Non controlling interest in all subsidiaries 9.4 37,908.6 (12.7) (8,818.6) (11.5) 1,534.3 (12.9) (7,284.3)Associate (Investment as per the equity method)Indian1 Zenotech Laboratories Limited - - - - - - - - Foreign Joint Ventures (Investment as per equity method)1 MSD - Sun LLC (Consolidated with its subsidiary) 0.0 0.7 - - - - - - Intercompany Elimination and Consolidation Adjustments (165.9) (670,772.1) 24.9 17,348.6 65.9 (8,786.8) 15.2 8,561.8 Total 100.0 404,305.3 100.0 69,643.7 100.0 (13,337.6) 100.0 56,306.1
# Includes share of profit and share of TCI, from its associates and a joint venture of ` 101.8 million
* Includes share of loss and share of TCI, from a joint venture of ` 2.5 million
The above amounts / percentage of net assets and net profit or (loss) in respect of the Parent Company, its subsidiaries, associates and joint ventures are determined based on the amounts of the respective entities included in consolidated financial statements before inter-company eliminations / consolidation adjustments. Refer note 39 (e)

269ANNUAL REPORT 2016-17
NOTES TO THE CONSOLIDATED FINANCIAL STATEMENTS
FOR THE YEAR ENDED MARCH 31, 2017
CORPORATE OVERVIEW STATUTORY REPORTS FINANCIAL STATEMENTS01-07 08-79 80-278
(Annexure ‘A’)
Disclosure of additional information pertaining to the Parent Company, subsidiaries, associates and joint ventures as per Schedule III of Companies Act, 2013:
Name of the EntityNet Assets, i.e., total assets
minus total liabilities Share in profit or (loss)Share in other
comprehensive income (OCI)
Share in total comprehensive income
(TCI)2015-16 2015-16 2015-16 2015-16
As % of consolidated
net assets` In Million
As % of consolidated
profit or (loss)
` In Million As % of
consolidated OCI
` In Million As % of
consolidated TCI
` In Million
Parent Entity - Sun Pharmaceutical Industries Limited 59.1 218,907.0 (23.9) (10,875.1) (1.9) (247.9) (19.1) (11,123.0)
Subsidiaries Indian1 Green Eco Development Centre Limited (0.0) (3.8) (0.0) (0.0) - - (0.0) (0.0)2 Sun Pharma Laboratories Ltd 51.9 192,535.8 13.8 6,256.9 (0.6) (79.6) 10.6 6,177.3 3 Faststone Mercantile Company Private Limited 0.0 10.8 0.0 0.1 - - 0.0 0.1 4 Neetnav Real Estate Private Limited 0.0 15.1 0.0 1.0 - - 0.0 1.0 5 Realstone Multitrade Private Limited 0.0 10.8 0.0 0.1 - - 0.0 0.1 6 Skisen Labs Private Limited 0.0 0.1 (0.3) (155.8) - - (0.3) (155.8)7 Softdeal Trading Company Private Limited 0.0 10.1 0.0 0.1 - - 0.0 0.1 8 Ranbaxy Drugs Limited 0.1 215.9 0.0 0.4 - - 0.0 0.4 9 Vidyut Investments Limited 0.0 24.8 0.0 1.1 - - 0.0 1.1 10 Gufic Pharma Limited 0.0 4.2 0.0 0.2 - - 0.0 0.2 11 Universal Enterprises Private Limited 0.0 5.3 0.0 0.0 - - 0.0 0.0 12 Sun Pharmaceutical Medicare Limited 0.5 1,834.1 0.3 124.1 (0.0) (1.1) 0.2 123.0 Foreign1 Sun Pharmaceutical (Bangladesh) Limited 0.2 721.1 0.4 162.5 - - 0.3 162.5 2 Sun Pharmaceutical Industries, Inc. (Consolidated with its
Subsidiaries, its associates and a Joint venture) 4.0 14,895.4 (2.1) (950.4)# - - (1.6) (950.4)#
3 Sun Farmaceutica Do Brasil Ltda. (0.6) (2,153.1) (1.3) (603.4) - - (1.0) (603.4)4 Sun Pharma De Mexico S.A. DE C.V. 0.2 710.1 0.4 173.2 - - 0.3 173.2 5 SPIL De Mexico S.A. DE C.V. 0.0 0.2 - - - - - - 6 Sun Pharmaceutical Peru S.A.C. (0.0) (127.9) (0.1) (29.7) - - (0.1) (29.7)7 OOO "Sun Pharmaceutical Industries" Limited (0.0) (165.0) (0.3) (123.3) - - (0.2) (123.3)8 Sun Pharma De Venezuela, C.A. (0.3) (1,152.5) (1.7) (761.7) - - (1.3) (761.7)9 Ranbaxy Pharmacie Generiques (0.4) (1,623.8) (0.3) (125.8) - - (0.2) (125.8)10 Ranbaxy (Malaysia) Sdn. Bhd. 0.1 294.0 (0.8) (358.1) - - (0.6) (358.1)11 Ranbaxy Nigeria Limited 0.3 1,055.6 0.2 104.8 - - 0.2 104.8 12 Ranbaxy (Netherlands) B.V. 14.3 52,964.2 (7.3) (3,326.5) - - (5.7) (3,326.5)13 Alkaloida Chemical Company Zrt. 7.1 26,395.3 (1.5) (685.7) - - (1.2) (685.7)14 Sun Pharmaceuticals UK Limited (0.0) (107.0) (0.0) (21.2) - - (0.0) (21.2)15 Sun Pharmaceutical Industries (Australia) Pty Ltd 0.6 2,394.6 (0.5) (246.8) - - (0.4) (246.8)16 Aditya Acquisition Company Ltd. 0.0 0.1 0.0 8.6 - - 0.0 8.6 17 Sun Pharmaceutical Industries (Europe) B.V. (0.0) (148.8) 0.0 15.9 - - 0.0 15.9 18 Sun Pharmaceuticals Italia S.R.L. (0.1) (379.6) (0.1) (40.8) - - (0.1) (40.8)19 Sun Pharmaceuticals Spain, S.L.U. (0.1) (370.7) (0.2) (80.3) - - (0.1) (80.3)20 Sun Pharmaceuticals Germany GmbH (0.1) (204.7) 0.0 5.9 - - 0.0 5.9 21 Sun Pharmaceuticals France (0.0) (15.0) 0.0 1.6 - - 0.0 1.6 22 Sun Pharma Global FZE (Consolidated with a Joint venture) 31.1 115,361.9 52.7 23,968.2@ (22.0) (2,820.8) 36.3 21,147.4@ 23 Sun Pharmaceuticals (SA) (Pty) Ltd. (0.0) (0.1) (0.0) (0.0) - - (0.0) (0.0)24 Sun Global Canada Pty. Ltd. (0.0) (1.2) (0.0) (0.2) - - (0.0) (0.2)25 Sun Pharma Philippines, Inc. (0.1) (308.9) (0.3) (131.1) - - (0.2) (131.1)26 Sun Pharmaceuticals Korea Ltd. 0.0 4.5 (0.0) (0.2) - - (0.0) (0.2)27 Sun Global Development FZE 0.1 185.9 (0.0) (0.7) - - (0.0) (0.7)28 Sun Pharma Japan Ltd. (0.1) (339.6) (0.2) (98.7) - - (0.2) (98.7)29 Sun Pharma HealthCare FZE 0.0 182.5 (0.0) (0.1) - - (0.0) (0.1)

SUN PHARMACEUTICAL INDUSTRIES L IMITED270
NOTES TO THE CONSOLIDATED FINANCIAL STATEMENTS
FOR THE YEAR ENDED MARCH 31, 2017
Name of the EntityNet Assets, i.e., total assets
minus total liabilities Share in profit or (loss)Share in other
comprehensive income (OCI)
Share in total comprehensive income
(TCI)2015-16 2015-16 2015-16 2015-16
As % of consolidated
net assets` In Million
As % of consolidated
profit or (loss)
` In Million As % of
consolidated OCI
` In Million As % of
consolidated TCI
` In Million
30 Sun Laboratories FZE (0.1) (238.2) (1.9) (847.6) - - (1.5) (847.6)31 Taro Pharmaceutical Industries Ltd. (TARO) 34.6 128,300.9 78.0 35,474.4 38.5 4,931.3 69.4 40,405.7 32 Alkaloida Sweden AB (0.0) (45.9) 0.0 11.3 - - 0.0 11.3 33 Sun Pharma Switzerland Limited 0.0 5.4 (0.0) (0.5) - - (0.0) (0.5)34 Sun Pharma Holdings 61.2 226,846.2 (0.0) (3.1) - - (0.0) (3.1)35 Sun Pharma East Africa Limited (0.0) (42.4) (0.1) (40.8) - - (0.1) (40.8)36 Sun Pharma ANZ Pty Ltd (Formerly known as Ranbaxy
Australia Pty Ltd) (0.2) (892.8) 0.1 33.6 - - 0.1 33.6
37 Ranbaxy Belgium N.V. - - 0.0 3.2 - - 0.0 3.2 38 Ranbaxy Farmaceutica Ltda. (0.3) (1,036.7) (0.9) (416.8) - - (0.7) (416.8)39 Ranbaxy Pharmaceuticals Canada Inc. 0.1 414.4 0.2 79.4 - - 0.1 79.4 40 Ranbaxy Egypt LLC 0.0 8.8 (0.4) (161.1) - - (0.3) (161.1)41 Rexcel Egypt LLC (0.0) (6.6) (0.0) (1.9) - - (0.0) (1.9)42 Office Pharmaceutique Industriel Et Hospitalier 0.0 70.5 0.0 3.5 - - 0.0 3.5 43 Basics GmbH 0.2 872.6 (0.2) (69.1) - - (0.1) (69.1)44 Ranbaxy GmbH 0.0 1.9 - - - - - - 45 Ranbaxy Ireland Limited 0.3 963.3 (0.8) (345.8) - - (0.6) (345.8)46 Ranbaxy Italia S.P.A. 0.0 58.7 (0.8) (345.5) - - (0.6) (345.5)47 Sun Pharmaceutical Industries S.A.C. (Formerly known as
Ranbaxy - PRP (Peru) S.A.C.) (0.0) (71.4) (0.0) (22.7) - - (0.0) (22.7)
48 Ranbaxy (Poland) Sp. Z o.o. 0.0 156.6 0.0 16.0 - - 0.0 16.0 49 Ranbaxy Portugal - Com E Desenvolv DeProd Farmaceuticos
Unipessoal Lda - - (0.0) (1.6) - - (0.0) (1.6)
50 S. C. Terapia S.A. 2.5 9,204.4 4.3 1,945.0 - - 3.3 1,945.0 51 AO Ranbaxy (Formerly Known ZAO Ranbaxy) 0.2 703.8 0.5 205.9 - - 0.4 205.9 52 Ranbaxy South Africa Proprietary Limited (Consolidated with
its Subsidiary) 0.1 553.5 0.4 183.3 - - 0.3 183.3
53 Ranbaxy Pharmaceutical Proprietary Limited (0.3) (1,131.3) (2.9) (1,325.8) - - (2.3) (1,325.8)54 Be- Tabs Investments Proprietary Limited 0.0 15.9 (0.0) (2.0) - - (0.0) (2.0)55 Laboratorios Ranbaxy, S.L.U. 0.0 162.8 0.4 183.6 - - 0.3 183.6 56 Ranbaxy (U.K.) Limited 0.4 1,304.8 0.7 334.8 - - 0.6 334.8 57 Ranbaxy Holdings (U.K.) Limited 0.8 2,925.9 (0.0) (0.9) - - (0.0) (0.9)58 Ranbaxy Europe Limited 0.0 174.6 0.0 15.7 - - 0.0 15.7 59 Ranbaxy Inc. (Consolidated with its Subsidiaries) 9.1 33,590.2 8.6 3,905.3 - - 6.7 3,905.3 60 Ranbaxy (Thailand) Company Limited 0.0 65.0 0.0 0.9 - - 0.0 0.9 61 Sun Pharmaceuticals Morocco LLC (Formerly known as
Ranbaxy Morocco LLC) (0.0) (124.5) (0.0) (19.0) - - (0.0) (19.0)
62 "Ranbaxy Pharmaceuticals Ukraine" LLC 0.0 86.5 0.1 25.0 - - 0.0 25.0
Non Controlling Interest in all subsidiaries 11.0 40,852.5 (24.5) (11,126.0) (12.2) (1,558.9) (21.8) (12,684.9)Associates (Investment as per the equity method)Indian1 Zenotech Laboratories Limited - - - - - - - - Foreign2 Daiichi Sankyo (Thailand) Ltd. 0.1 444.5 0.0 3.3 - - 0.0 3.3 Foreign Joint Ventures (Investment as per the equity method)2 MSD - Sun LLC (Consolidated with its subsidiary) 0.0 0.7 0.4 180.4 - - 0.3 180.4 Intercompany Elimination and Consolidation Adjustments (187.5) (695,155.0) 11.8 5,373.6 98.3 12,571.5 30.8 17,945.1 Total 100.0 370,677.3 100.0 45,457.1 100.0 12,794.5 100.0 58,251.6
# Includes share of profit and share of TCI, from its associates and a joint venture of ` 156.0 million@ Includes share of loss and share of TCI, from a joint venture of ` 13.2 million
The above amounts / percentage of net assets and net profit or (loss) in respect of the Parent Company, its subsidiaries, associates and joint ventures are determined based on the amounts of the respective entities included in consolidated financial statements before inter-company eliminations / consolidation adjustments.

271ANNUAL REPORT 2016-17
NOTES TO THE CONSOLIDATED FINANCIAL STATEMENTS
FOR THE YEAR ENDED MARCH 31, 2017
CORPORATE OVERVIEW STATUTORY REPORTS FINANCIAL STATEMENTS01-07 08-79 80-278
(Annexure ‘B’)
Ind AS- 24 - “ RELATED PARTY DISCLOSURES “
Names of related parties where there are transactions and description of relationships
a Key Managerial Personnel
Dilip S. Shanghvi Managing DirectorSudhir V. Valia Executive DirectorSailesh T. Desai Executive DirectorIsrael Makov Chairman and Non- Executive DirectorKalyansundaram Subramanian (w.e.f. February 14, 2017) Executive DirectorS. Mohanchand Dadha Non- Executive DirectorHasmukh S. Shah Non- Executive DirectorKeki M. Mistry Non- Executive DirectorAshwin S. Dani Non- Executive DirectorRekha Sethi Non- Executive Director
b Relatives of Key Managerial PersonnelAalok ShanghviVidhi Shanghvi
c Enterprise under control of Key Managerial Personnel or their relativesMakov Associates LtdShantilal Shanghvi FoundationDadha Pharma Pvt. Ltd.
d Enterprise under significant Influence of Key managerial Personnel or their relativesSun Pharma Advanced Research Company LtdSun Petrochemicals Pvt LtdAlfa Infraprop Pvt. Ltd.PV Power Technologies Pvt. Ltd.
e Joint VentureS & I Ophthalmic LLC
f AssociatesZenotech Laboratories LimitedDaiichi Sankyo (Thailand) Ltd.Medinstill LLCFrazier Healthcare VII, L.P.Versant Venture Capital V, L.P.scPharmaceuticals Inc.Trumpcard Advisors and Finvest LLP Generic Solar Power LLP
g Unconsolidated SubsidiaryFoundation for Disease Elimination and Control of India

SUN PHARMACEUTICAL INDUSTRIES L IMITED272
NOTES TO THE CONSOLIDATED FINANCIAL STATEMENTS
FOR THE YEAR ENDED MARCH 31, 2017
` in MillionParticulars March 31, 2017 March 31, 2016Purchase of goods 28.2 21.7
Associates 12.9 20.6 Enterprise under significant Influence of Key managerial Personnel or their relatives 15.3 1.1
Purchase of Property, Plant and Equipment and other intangible assets 885.4 4.0 Enterprise under significant Influence of Key managerial Personnel or their relatives 885.4 4.0
Sale of goods 103.4 881.9 Associates 38.8 871.9 Enterprise under significant Influence of Key managerial Personnel or their relatives 64.6 10.0
Sale of Property, Plant and Equipment and other intangible assets - 0.4 Enterprise under significant Influence of Key managerial Personnel or their relatives - 0.4
Receiving of Service 1,296.6 1,616.3 Enterprise under control of Key managerial Personnel or their relatives 283.0 506.2 Enterprise under significant Influence of Key managerial Personnel or their relatives 1,013.6 1,110.1
Reimbursement of Expenses Paid 17.7 61.7 Associates 2.8 - Key managerial personnel (` 45,815) 0.0 - Enterprise under significant Influence of Key managerial Personnel or their relatives 14.9 61.7
Rendering of Service 147.8 558.3 Joint Venture ( March 31, 2016 : ` 44,016 ) 11.6 0.1 Associates - 3.2 Enterprise under significant Influence of Key managerial Personnel or their relatives 136.2 555.0
Reimbursement of Expenses Received 290.1 41.6 Enterprise under significant Influence of Key managerial Personnel or their relatives 289.8 41.6 Unconsolidated Subsidiary 0.3 -
Purchase of Investment in Associates and Joint Venture and Unconsolidated Subsidiary 1,856.1 1,071.6 Associates (Refer Note 67) 1,856.0 744.5 Joint Venture - 327.1 Unconsolidated Subsidiary 0.1 -
Interest Income 70.4 69.9 Associates 70.4 69.9
Lease Rental and Hire Charges 51.1 48.7 Enterprise under significant influence of key managerial personnel or their relatives 51.1 48.7
Provision for doubtful Loans and Interest accrued and due on Loans 63.4 389.5 Associates 63.4 389.5
Remuneration 294.9 255.4 Key Managerial Personnel (Refer note 64) 281.6 242.4 Relatives of key Managerial personnel 13.3 13.0
Director's Sitting Fees 9.5 8.0 Corporate Social Responsibility Expense 52.1 -
Enterprise under control of Key Managerial Personnel or their relatives 52.1 -

273ANNUAL REPORT 2016-17
NOTES TO THE CONSOLIDATED FINANCIAL STATEMENTS
FOR THE YEAR ENDED MARCH 31, 2017
CORPORATE OVERVIEW STATUTORY REPORTS FINANCIAL STATEMENTS01-07 08-79 80-278
` in Million
Particulars As at March 31, 2017
As at March 31, 2016
As at April 01, 2015
Balance Outstanding as at the end of the year Receivables 1,130.4 669.0 624.9
Joint Venture - 0.9 1.3 Associates - 1.8 - Enterprise under significant influence of key managerial personnel or their relatives
1,129.6 666.3 623.6
Unconsolidated Subsidiary 0.8 - - Payables 833.8 176.1 350.8
Associates 137.7 13.5 32.1 Key managerial personnel 153.7 102.3 119.6 Relatives of key managerial personnel 0.6 2.4 1.2 Enterprise under control of Key managerial Personnel or their relatives 126.0 57.9 166.4 Enterprise under significant influence of key managerial personnel or their relatives
415.8 - 31.5
Deposit Received - 66.2 66.2 Enterprise under significant influence of key managerial personnel or their relatives
- 66.2 66.2
Loan Given 454.0 - 326.8 Associates * 454.0 - 326.8
* Net of Provision for doubtful loans and interest accrued and due on loans thereof ` 726.9 Million [ March 31, 2016 : ` 663.5 Million ; April 01, 2015: ` 274.0 Million] (Refer Note 70)
Key Managerial Personnel who are under the employment of the Company are entitled to post employment benefits and other long term employee benefits recognised as per Ind AS 19 - ‘Employee Benefits’ in the financial statements. As these employee benefits are lump sum amount provided on the basis of actuarial valuation, the same is not included above and there is no Share-based payments to key managerial personnel of Company.
Disclosure in respect of material transaction with related parties.
` in MillionParticulars March 31, 2017 March 31, 2016Purchase of goods
Zenotech Laboratories Limited 12.9 20.5 Sun Pharma Advanced Research Company Ltd 10.9 1.1
Purchase of Property, Plant and Equipment and other intangible assetsSun Pharma Advanced Research Company Ltd 885.4 4.0
Sale of goodsDaiichi Sankyo (Thailand) Ltd. 38.8 871.9 Sun Pharma Advanced Research Company Ltd 64.6 10.0
Sale of Property, Plant and Equipment and other intangible assetsSun Petrochemicals Pvt Ltd - 0.4
Receiving of ServiceSun Pharma Advanced Research Company Ltd 1,013.6 1,368.7 Makov Associates Ltd 283.0 247.6
Reimbursement of Expenses PaidSun Pharma Advanced Research Company Ltd 14.9 61.7
Rendering of ServiceSun Pharma Advanced Research Company Ltd 136.2 555.0

SUN PHARMACEUTICAL INDUSTRIES L IMITED274
NOTES TO THE CONSOLIDATED FINANCIAL STATEMENTS
FOR THE YEAR ENDED MARCH 31, 2017
` in MillionParticulars March 31, 2017 March 31, 2016Reimbursement of Expenses Received
Sun Pharma Advanced Research Company Ltd 289.8 41.6 Purchase of Investment in Associates and Joint Venture and Unconsolidated Subsidiary
Frazier Healthcare VII, L.P. 269.6 412.7 Versant Venture Capital V, L.P. 402.0 331.8 scPharmaceuticals Inc. 871.9 - S & I Ophthalmic LLC - 327.1
Interest IncomeZenotech Laboratories Limited 70.4 69.9
Lease Rental and Hire ChargesAlfa Infraprop pvt. Ltd. 46.8 47.3
Provision for doubtful Loans and AdvancesZenotech Laboratories Limited 63.4 389.5
RemunerationKey managerial personnel
Dilip S. Shanghvi @ 151.5 135.3 Sailesh T. Desai 31.6 12.1 Sudhir V. Valia # 91.8 95.0
Relatives of key managerial personnelAalok D. Shanghvi 12.1 12.1
Director's Sitting FeesS. Mohanchand Dadha 2.0 1.8 Hasmukh S. Shah 1.7 1.9
Corporate Social Responsibility ExpenseShantilal Shanghvi Foundation 52.1 -
@ Net of Refund of ` Nil ( March 31, 2016 ` 1.1 Million) in respect of excess remuneration paid for financial year 2013 -14.
# Net of Refund of ` Nil ( March 31, 2016 ` 1.0 Million) in respect of excess remuneration paid for financial year 2013 -14.

275ANNUAL REPORT 2016-17
NOTES TO THE CONSOLIDATED FINANCIAL STATEMENTS
FOR THE YEAR ENDED MARCH 31, 2017
CORPORATE OVERVIEW STATUTORY REPORTS FINANCIAL STATEMENTS01-07 08-79 80-278
FORM
AO
C - 1
PU
RSU
AN
T TO
FIR
ST P
ROV
ISO
TO
SU
B-SE
CTIO
N (3
) OF
SECT
ION
129
OF
COM
PAN
IES
ACT,
201
3 W
ITH
TH
E RU
LE 5
OF
COM
PAN
IES
(ACC
OU
NTS
) RU
LES,
201
4
ST
ATEM
ENT
CON
TAIN
ING
SA
LIEN
T FE
ATU
RES
OF
THE
FIN
AN
CIA
L ST
ATEM
ENT
OF
SUBS
IDIA
RIES
/ A
SSO
CIAT
E CO
MPA
NIE
S /
JOIN
T V
ENTU
RES
` In
Milli
onPa
rt “A
”: Su
bsid
iarie
s
Sr
NoNa
me
of th
e Su
bsid
iary C
ompa
ny
Date
sinc
e w
hen
subs
idiar
y w
as
acqu
ired
Repo
rting
Cu
rrenc
y R
ate
Cap
ital
Res
erve
To
tal
Asse
ts
Tota
l Li
abiliti
es
Inve
stm
ent
Oth
er th
an
Inve
stm
ent
in S
ubsid
iary
Turn
over
Pro
fit
/ (Lo
ss)
befo
re
Taxa
tion
Pro
visio
n for
Taxa
tion
Pro
fit
/ (Lo
ss)
after
Ta
xatio
n
Pro
pose
d Di
vide
nd
% o
f Sh
areh
oldi
ng
1Gr
een
Eco
Dev
elop
men
t Cen
tre L
imite
d12
.11.
2010
INR
1.00
7.0
(5.4
)1.
70.
1-
-(0
.5)
-(0
.5)
-10
0.00
%2
Sun
Phar
mac
eutic
al (B
angl
ades
h) L
imite
d29
.03.
2001
BDT
0.81
48.4
893.
81,
298.
635
6.4
-1,
351.
532
7.5
119.
620
7.9
-72
.50%
3Su
n Ph
arm
aceu
tical
Indu
strie
s, In
c.14
.06.
2011
USD
64.8
613
,856
.9(1
6,97
0.6)
53,0
82.4
56,1
96.1
5,08
5.6
27,9
48.8
(9,0
47.8
)(3
,223
.7)
(5,8
24.0
)-
100.
00%
4Su
n Fa
rmac
eutic
a do
Bra
sil Lt
da.
22.0
5.20
09BR
L20
.59
114.
8(2
,322
.0)
780.
22,
987.
5-
1,10
7.1
199.
5-
199.
5-
100.
00%
5Su
n Ph
arm
a D
e M
exico
S.A
. DE
C.V.
03.1
2.20
02M
XN3.
473.
576
4.0
858.
490
.9-
1,13
1.6
173.
859
.011
4.9
-75
.00%
6SP
IL D
e M
exico
S.A
. DE
C.V.
13.0
2.20
02M
XN3.
470.
2-
0.2
--
--
--
-10
0.00
%7
Sun
Phar
mac
eutic
al Pe
ru S
.A.C
.27
.06.
2006
PEN
19.9
60.
0(1
54.9
)0.
215
5.0
--
(27.
0)-
(27.
0)-
99.3
3%8
OO
O "S
un P
harm
aceu
tical
Indu
strie
s" L
imite
d12
.11.
2007
RUB
1.16
0.1
(171
.5)
42.1
213.
5-
143.
0(2
0.5)
5.1
(25.
6)-
100.
00%
9Su
n Ph
arm
a D
e Ven
ezue
la, C
.A.
06.1
1.20
11VE
F6.
490.
3(1
,444
.8)
1.1
1,44
5.6
-6.
5(3
14.7
)-
(314
.7)
-10
0.00
%10
Chatt
em C
hem
icals
Inc.
24.1
1.20
08US
D64
.86
2,23
3.2
1,43
6.2
3,85
2.4
183.
0-
1,48
1.3
(143
.2)
(47.
6)(9
5.6)
-10
0.00
%11
The
Taro
Dev
elop
men
t Cor
pora
tion
20.0
9.20
10US
D64
.86
0.0
(0.4
)1,
287.
71,
288.
1-
-(0
.0)
-(0
.0)
-10
0.00
%12
Alka
loid
a Ch
emica
l Com
pany
Zrt.
05.0
8.20
05US
D64
.86
5,78
9.0
18,7
35.1
36,8
37.3
12,3
13.2
-1,
561.
8(1
,311
.6)
-(1
,311
.6)
-99
.99%
13Su
n Ph
arm
aceu
ticals
UK
Lim
ited
20.0
6.20
05GB
P80
.83
0.1
(91.
6)0.
391
.8-
46.2
(0.8
)-
(0.8
)-
100.
00%
14Su
n Ph
arm
aceu
tical
Indu
strie
s (Au
stra
lia) P
ty Lt
d11
.03.
2008
AUD
49.6
12,
710.
9(7
35.1
)8,
898.
96,
923.
1-
5,17
6.3
(359
.7)
-(3
59.7
)-
100.
00%
15Ad
itya A
cqui
sition
Com
pany
Ltd.
22.0
4.20
07IL
S17
.84
0.0
6.0
47.0
41.0
-18
4.7
8.1
2.2
5.9
-10
0.00
%16
Sun
Phar
mac
eutic
al In
dust
ries (
Euro
pe) B
.V.
29.0
6.20
07EU
RO69
.30
1.2
(111
.7)
425.
953
6.4
-46
6.0
26.5
-26
.5-
100.
00%
17Su
n Ph
arm
aceu
ticals
Itali
a S.
R.L.
14.0
4.20
08EU
RO69
.30
0.7
39.8
41.2
0.7
-17
4.7
(1.4
)-
(1.4
)-
100.
00%
18Su
n Ph
arm
aceu
ticals
Spa
in, S
.L.U
.27
.04.
2009
EURO
69.3
00.
2(3
46.6
)1.
034
7.4
--
(4.8
)-
(4.8
)-
100.
00%
19Su
n Ph
arm
aceu
ticals
Ger
man
y Gm
bH11
.08.
2008
EURO
69.3
01.
7(1
87.7
)76
0.5
946.
5-
462.
010
.68.
12.
5-
100.
00%
20Su
n Ph
arm
aceu
ticals
Fra
nce
10.0
2.20
09EU
RO69
.30
2.6
(19.
7)16
5.5
182.
6-
109.
1(3
.3)
-(3
.3)
-10
0.00
%21
Sun
Phar
ma
Glob
al FZ
E25
.11.
2008
USD
64.8
626
7.5
123,
233.
113
2,39
3.3
8,89
2.6
2,88
8.9
35,
588.
710
,623
.1-
10,6
23.1
-10
0.00
%22
Sun
Phar
mac
eutic
als (S
A) (P
ty) L
td.
22.1
0.20
08ZA
R4.
840.
0(0
.1)
-0.
1-
0.0
(0.0
)-
(0.0
)-
100.
00%
23Su
n Gl
obal
Cana
da P
ty. L
td.
23.0
6.20
09US
D64
.86
0.1
(1.2
)-
1.1
--
(0.0
)-
(0.0
)-
100.
00%
24Su
n La
bora
torie
s FZE
13.0
3.20
11US
D64
.86
794.
6(1
,139
.3)
96.2
440.
90.
781
.4(1
10.3
)-
(110
.3)
-10
0.00
%25
Sun
Glob
al D
evel
opm
ent F
ZE13
.04.
2011
USD
64.8
618
5.4
(4.1
)20
0.8
19.5
--
(0.7
)-
(0.7
)-
100.
00%
26Su
n Ph
arm
a Jap
an Lt
d.01
.03.
2012
JPY
0.58
91.5
(534
.1)
3,58
8.4
4,03
1.0
-10
.6(1
07.9
)0.
2(1
08.1
)-
100.
00%
27Su
n Ph
arm
a Ph
ilippi
nes,
Inc.
08.1
2.20
11PH
P1.
2911
.2(4
07.5
)25
9.9
656.
2-
235.
8(7
7.4)
(23.
2)(5
4.2)
-10
0.00
%28
Sun
Phar
ma
Healt
hcar
e FZ
E25
.03.
2012
USD
64.8
618
5.4
(4.4
)18
1.1
0.0
--
2.4
-2.
4-
100.
00%
29Su
n Ph
arm
aceu
ticals
Kor
ea Lt
d.20
.09.
2011
KRW
0.06
5.8
(1.6
)5.
91.
6-
-(0
.3)
-(0
.3)
-10
0.00
%30
Cara
co P
harm
aceu
ticals
Priv
ate
Lim
ited
12.0
1.20
12IN
R1.
000.
1(0
.1)
0.0
0.0
--
0.1
0.0
0.0
-10
0.00
%31
Sun
Phar
ma
Labo
rato
ries L
td09
.03.
2012
INR
1.00
0.5
197,
557.
321
9,99
9.1
22,4
41.3
2,64
2.8
52,8
73.9
9,69
1.0
2,10
6.7
7,58
4.3
2040
.010
0.00
%32
Mor
ley &
Com
pany
, Inc
.05
.05.
1983
USD
64.8
60.
2(0
.1)
0.1
0.1
--
--
--
100.
00%
33Ta
ro P
harm
aceu
tical
Indu
strie
s Ltd
. (TA
RO)
20.0
9.20
10US
D64
.86
17,0
65.0
117,
022.
413
6,76
7.8
2,68
0.4
-14
,605
.47,
949.
71,
213.
06,
736.
6-
72.8
1%34
Taro
Pha
rmac
eutic
als In
c.20
.09.
2010
CAD
48.5
714
.372
,094
.574
,402
.12,
293.
2-
23,5
26.9
17,6
72.3
4,27
9.1
13,3
93.2
-72
.81%
35Ta
ro P
harm
aceu
ticals
U.S
.A., I
nc.
20.0
9.20
10US
D64
.86
546.
3(3
2.7)
45,5
06.7
44,9
93.1
230.
150
,459
.367
3.4
30.9
642.
5-
72.8
1%36
Taro
Pha
rmac
eutic
als N
orth
Am
erica
, Inc
.20
.09.
2010
USD
64.8
622
7.8
21,0
50.8
21,8
57.7
579.
1-
5,09
8.6
2,70
9.3
-2,
709.
3-
72.8
1%37
Taro
Pha
rmac
eutic
als E
urop
e B.
V.20
.09.
2010
EURO
69.3
01.
2(3
2.8)
1.5
33.1
--
(1.3
)-
(1.3
)-
72.8
1%38
Taro
Pha
rmac
eutic
als Ir
elan
d Li
mite
d20
.09.
2010
EURO
69.3
0 1
38.7
(4
00.5
) 7
3.1
334
.9
- -
(19.
4) -
(19.
4) -
72.8
1%39
Taro
Inte
rnati
onal
Ltd.
20.0
9.20
10US
D64
.86
- 8
5.3
550
.8
465
.6
- 7
57.5
7
3.4
17.
8 5
5.6
- 72
.81%
40Ta
ro P
harm
aceu
ticals
(UK)
Lim
ited
20.0
9.20
10GB
P80
.83
0.0
(741
.0)
79.
4 8
20.4
-
81.
1 (1
28.9
) -
(128
.9)
- 72
.81%

SUN PHARMACEUTICAL INDUSTRIES L IMITED276
NOTES TO THE CONSOLIDATED FINANCIAL STATEMENTS
FOR THE YEAR ENDED MARCH 31, 2017
` In
Milli
onPa
rt “A
”: Su
bsid
iarie
s
Sr
NoNa
me
of th
e Su
bsid
iary C
ompa
ny
Date
sinc
e w
hen
subs
idiar
y w
as
acqu
ired
Repo
rting
Cu
rrenc
y R
ate
Cap
ital
Res
erve
To
tal
Asse
ts
Tota
l Li
abiliti
es
Inve
stm
ent
Oth
er th
an
Inve
stm
ent
in S
ubsid
iary
Turn
over
Pro
fit
/ (Lo
ss)
befo
re
Taxa
tion
Pro
visio
n for
Taxa
tion
Pro
fit
/ (Lo
ss)
after
Ta
xatio
n
Pro
pose
d Di
vide
nd
% o
f Sh
areh
oldi
ng
41Ta
ro H
unga
ry In
telle
ctua
l Pro
perty
Lice
nsin
g Li
mite
d Li
abilit
y Com
pany
20.0
9.20
10US
D64
.86
- 0.
0 -
- -
- (1
.4)
- (1
.4)
- 72
.81%
42Ta
ro P
harm
aceu
ticals
Can
ada,
Ltd.
20.0
9.20
10CA
D48
.57
0.0
(0.0
) 0
.1
0.1
-
- (0
.0)
- (0
.0)
- 72
.81%
43Al
kalo
ida
Swed
en A
B22
.11.
2012
SEK
7.2
6 5
1.8
(31.
8) 2
98.7
2
78.8
-
748
.3
9.6
-
9.6
-
100.
00%
44D
usa
Phar
mac
eutic
als, I
nc.
19.1
2.20
12US
D64
.86
0.6
5
,063
.8
11,
577.
9 6
,513
.5
- 8
,916
.9
4,2
19.8
1
,619
.8
2,5
99.9
-
100.
00%
45M
utua
l Pha
rmac
eutic
al Co
mpa
ny In
c.05
.02.
2013
USD
64.8
6 4
,259
.1
4,9
23.0
9
,610
.3
428
.3
- 3
,104
.9
(916
.6)
(332
.7)
(583
.9)
- 10
0.00
%46
Fast
ston
e M
erca
ntile
Com
pany
Priv
ate
Lim
ited
01.0
4.20
12IN
R 1
.00
0.1
1
1.0
11.
1 0
.0 -
0.0
0
.5
0.2
0
.3
- 10
0.00
%47
Neet
nav R
eal E
stat
e Pr
ivate
Lim
ited
01.0
4.20
12IN
R 1
.00
0.1
2
,920
.1
3,0
77.5
1
57.3
3
.1
1.2
1
.2
0.4
0
.8
- 10
0.00
%48
Reals
tone
Mul
titra
de P
rivat
e Li
mite
d01
.04.
2012
INR
1.0
0 0
.1
11.
0 1
1.2
0.0
- 0
.0
0.6
0
.2
0.4
-
100.
00%
49Sk
isen
Labs
Priv
ate
Lim
ited
01.0
4.20
12IN
R 1
.00
163
.6
(163
.5)
0.1
0.
0 -
0.0
(0
.0)
0.0
(0
.0)
- 10
0.00
%50
Softd
eal T
radi
ng C
ompa
ny P
rivat
e Li
mite
d01
.04.
2012
INR
1.0
0 0
.1
10.
5 1
0.6
0.0
- 0
.0
0.6
0
.2
0.4
-
100.
00%
51Un
ivers
al En
terp
rises
Priv
ate
Lim
ited
31.0
8.20
12IN
R 1
.00
4.5
0
.8
5.3
0.
0 -
- 0
.0
0.0
0
.0
- 10
0.00
%52
Sun
Phar
ma
Switz
erlan
d Li
mite
d10
.06.
2013
CHF
64.8
1 6
.5
(28.
3) 2
,645
.1
2,6
66.9
-
- (2
6.1)
0.8
(2
6.9)
- 10
0.00
%53
Sun
Phar
ma
Hold
ings
06.0
8.20
15US
D64
.86
221
,858
.8
(17,
972.
1) 2
04,6
15.1
7
28.5
-
- (9
.4)
- (9
.4)
- 10
0.00
%54
Phar
malu
cenc
e, In
c.15
.07.
2014
USD
64.8
6 5
,664
.9
(683
.6)
6,5
71.7
1
,590
.4
- 1
,839
.2
(350
.9)
(127
.1)
(223
.7)
- 10
0.00
%55
PI R
eal E
stat
e Ven
ture
s LLC
15.0
7.20
14US
D64
.86
583
.8
125
.4
1,8
43.5
1
,134
.3
- 2
02.3
1
20.8
4
3.8
76.
9 -
100.
00%
56Su
n Ph
arm
a Ea
st A
frica
Lim
ited
13.0
6.20
14KE
S 0
.63
0.1
(5
1.1)
415
.8
466
.8
- 3
77.8
(2
3.8)
(6.8
) (1
7.0)
- 10
0.00
%57
Ranb
axy D
rugs
Lim
ited
24.0
3.20
15IN
R 1
.00
31.
0 1
,861
.2
1,8
93.1
0
.8
- -
39.
0 0
.2
38.
9 -
100.
00%
58Vi
dyut
Inve
stm
ents
Lim
ited
24.0
3.20
15IN
R 1
.00
250
.1
(222
.7)
27.
7 0
.3
- -
1.6
0
.5
1.1
-
100.
00%
59Gu
fic P
harm
a Li
mite
d24
.03.
2015
INR
1.0
0 0
.5
4.0
4
.5
0.0
- 0
.2
0.3
0
.1
0.2
-
100.
00%
60Ba
sics G
mbH
24.0
3.20
15EU
RO69
.30
337
.9
274
.3
4,3
92.1
3
,780
.0
- 2
,605
.6
62.
5 1
3.7
48.
8 -
100.
00%
61Ra
nbax
y Gm
bH24
.03.
2015
EURO
69.3
0 1
.7
- 2
77.8
2
76.0
-
191
.0
- -
- -
100.
00%
62"R
anba
xy P
harm
aceu
ticals
Ukr
aine"
LLC
24
.03.
2015
UAH
2.4
0 9
5.9
6.4
2
35.7
1
33.4
-
639
.9
9.0
1
.9
7.1
-
100.
00%
63Su
n Ph
arm
aceu
ticals
Mor
occo
LLC
(For
mer
ly kn
own
as R
anba
xy M
oroc
co L
LC)
24.0
3.20
15M
AD 6
.47
79.
2 (1
39.5
) 9
26.9
9
87.3
-
884
.6
81.
8 4
.4
77.
4 -
100.
00%
64Su
n Ph
arm
aceu
tical
Indu
strie
s S.A
.C. (
Form
erly
know
n as
Ran
baxy
- PR
P (P
eru)
S.A
.C.)
24.0
3.20
15PE
N19
.96
86.
7 (1
80.6
) 1
96.2
2
90.1
-
15.
0 (2
2.0)
- (2
2.0)
- 10
0.00
%
65Ra
nbax
y Hol
ding
s (U.
K.) L
imite
d24
.03.
2015
GBP
80.8
32,
469.
911
1.8
2,58
9.9
8.3
- -
(0.9
) -
(0.9
) -
100.
00%
66Ra
nbax
y Pha
rmac
ie G
ener
ique
s24
.03.
2015
EURO
69.3
0 1
,729
.0
(3,3
87.4
) 6
59.9
2
,318
.3
- 1
,334
.1
163
.4
- 1
63.4
-
100.
00%
67O
ffice
Pha
rmac
eutiq
ue In
dust
riel E
t Hos
pita
lier
24.0
3.20
15EU
RO69
.30
92.
2 (1
3.6)
216
.5
137
.9
- 2
73.0
1
3.6
- 1
3.6
- 10
0.00
%68
Ranb
axy I
talia
S.P.
A.24
.03.
2015
EURO
69.3
0 3
.5
19.
0 1
,314
.3
1,2
91.9
-
1,3
65.2
(2
2.3)
13.
2 (3
5.5)
- 10
0.00
%69
Ranb
axy P
harm
aceu
tical
Prop
rieta
ry L
imite
d24
.03.
2015
ZAR
4.8
4 96
7.8
(2,0
83.0
) 6
,750
.3
7,8
65.5
-
5,3
95.9
1
89.3
-
189
.3
- 10
0.00
%70
Sonk
e Ph
arm
aceu
ticals
Pro
prie
tary
Lim
ited
24.0
3.20
15ZA
R 4
.84
9.7
240
.8
2,6
70.8
2
,420
.3
- 6
,566
.0
195
.5
- 1
95.5
-
70.0
0%71
Ranb
axy S
outh
Afri
ca P
ropr
ieta
ry L
imite
d24
.03.
2015
ZAR
4.8
4 8
4.7
590
.7
1,9
81.9
1
,306
.5
- 1
,291
.2
170
.6
22.
8 1
47.8
-
100.
00%
72Ra
nbax
y Egy
pt L
LC24
.03.
2015
EGP
3.5
5 3
42.0
(7
4.7)
480
.6
213
.4
- 2
37.2
(6
3.8)
3.0
(6
6.9)
- 10
0.00
%73
Rexc
el E
gypt
LLC
24.0
3.20
15EG
P 3
.55
0.9
(1
1.8)
11.
4 2
2.3
- 7
.9
(7.8
)-
(7.8
) -
100.
00%
74Ra
nbax
y (U.
K.) L
imite
d 24
.03.
2015
GBP
80.8
3 1
,758
.1
(593
.4)
2,0
36.8
8
72.2
-
1,5
58.7
7
4.2
16.
1 5
8.1
- 10
0.00
%75
Ranb
axy (
Polan
d) S
p. Z
o.o
.24
.03.
2015
PLN
16.4
5 7
0.6
86.
3 1
92.9
3
6.0
- 4
58.2
1
4.3
3.6
1
0.7
- 10
0.00
%76
Ranb
axy N
iger
ia Li
mite
d24
.03.
2015
NGN
0.21
8.4
656.
32,
556.
21,
891.
4-
866.
3(7
9.3)
(39.
3)(4
0.0)
2.1
85.3
1%77
Ranb
axy (
Thail
and)
Com
pany
Lim
ited
24.0
3.20
15TH
B1.
8921
6.8
(56.
1)98
4.6
823.
8-
998.
4(8
6.4)
-(8
6.4)
-10
0.00
%78
Ohm
Lab
orat
orie
s, In
c.24
.03.
2015
USD
64.8
6(2
,354
.8)
5,42
7.2
82,4
03.8
79,3
31.4
-25
,336
.6(1
,995
.8)
(684
.7)
(1,3
11.1
)-
100.
00%
79Ra
nbax
y Lab
orat
orie
s, In
c.24
.03.
2015
USD
64.8
61,
951.
112
,156
.192
,020
.477
,913
.2-
14,4
85.5
6,61
4.1
2,35
4.2
4,25
9.8
-10
0.00
%80
Ranb
axy S
igna
ture
LLC
24.0
3.20
15US
D64
.86
3.2
(191
.4)
3.3
191
.4 -
504
.1 4
72.3
- 4
72.3
-67
.50%
81Ra
nbax
y Pha
rmac
eutic
als, I
nc.
24.0
3.20
15US
D64
.86
(4,8
17.3
) 1
3,28
3.7
181
,560
.9 1
73,0
94.5
- 2
9,42
2.6
2,9
58.4
1,0
95.5
1,8
62.9
-10
0.00
%82
Ranb
axy I
nc.
24.0
3.20
15US
D64
.86
3,7
92.5
11,
451.
2 5
7,68
4.1
42,
440.
4 -
- 1
42.0
239
.8 (9
7.7)
-10
0.00
%83
Ranb
axy I
relan
d Li
mite
d24
.03.
2015
EURO
69.3
0 4
92.9
11.
8 5
32.9
28.
2 -
1,1
81.7
138
.2 -
138
.2 -
100.
00%
84AO
Ran
baxy
(For
mer
ly Kn
own
ZAO
Ran
baxy
)24
.03.
2015
RUB
1.1
6 1
88.6
784
.0 4
,194
.9 3
,222
.3 -
5,7
81.8
345
.2 1
00.0
245
.3 -
100.
00%
85La
bora
torio
s Ran
baxy
, S.L
.U.
24.0
3.20
15EU
RO69
.30
69.
3 1
84.8
1,2
39.7
985
.6 -
1,4
26.2
98.
7 -
98.
7 -
100.
00%

277ANNUAL REPORT 2016-17
NOTES TO THE CONSOLIDATED FINANCIAL STATEMENTS
FOR THE YEAR ENDED MARCH 31, 2017
CORPORATE OVERVIEW STATUTORY REPORTS FINANCIAL STATEMENTS01-07 08-79 80-278
` In
Milli
onPa
rt “A
”: Su
bsid
iarie
s
Sr
NoNa
me
of th
e Su
bsid
iary C
ompa
ny
Date
sinc
e w
hen
subs
idiar
y w
as
acqu
ired
Repo
rting
Cu
rrenc
y R
ate
Cap
ital
Res
erve
To
tal
Asse
ts
Tota
l Li
abiliti
es
Inve
stm
ent
Oth
er th
an
Inve
stm
ent
in S
ubsid
iary
Turn
over
Pro
fit
/ (Lo
ss)
befo
re
Taxa
tion
Pro
visio
n for
Taxa
tion
Pro
fit
/ (Lo
ss)
after
Ta
xatio
n
Pro
pose
d Di
vide
nd
% o
f Sh
areh
oldi
ng
86Ra
nbax
y (M
alays
ia) S
dn. B
hd.
24.0
3.20
15M
YR14
.65
117
.2 2
18.2
1,3
12.4
976
.9 -
1,3
96.4
79.
2 -
79.
2 -
71.2
2%87
Ranb
axy F
arm
aceu
tica
Ltda
.24
.03.
2015
BRL
20.5
9 3
57.6
(1,4
39.0
) 9
70.5
2,0
51.8
- 1
,239
.1 5
7.2
- 5
7.2
-10
0.00
%88
Ranb
axy E
urop
e Li
mite
d24
.03.
2015
GBP
80.8
3 0
.8 1
47.2
148
.1 0
.1 -
- (1
.0)
(1.0
) (0
.0)
-10
0.00
%89
Sun
Phar
ma A
NZ
Pty L
td (F
orm
erly
know
n as
Ra
nbax
y Aus
tralia
Pty
Ltd)
24.0
3.20
15AU
D49
.61
863.
2 (1
,293
.3)
1,0
42.4
1,4
72.5
- 1
,679
.2 3
4.2
- 3
4.2
-10
0.00
%
90Ra
nbax
y Pha
rmac
eutic
als C
anad
a In
c.24
.03.
2015
CAD
48.5
7 1
09.3
223
.4 9
50.0
617
.3 -
1,8
57.5
(60.
9) -
(60.
9) -
100.
00%
91S.
C. T
erap
ia S.
A.24
.03.
2015
RON
15.2
3 3
81.1
10,
643.
9 1
3,69
9.6
2,6
74.6
- 9
,040
.1 2
,420
.1 3
43.7
2,0
76.4
-96
.70%
92Be
- Tab
s Inv
estm
ents
Pro
prie
tary
Lim
ited
24.0
3.20
15ZA
R 4
.84
0.0
17.
3 1
7.3
0.0
- -
0.1
- 0
.1 -
100.
00%
93Ra
nbax
y (Ne
ther
lands
) B.V
.24
.03.
2015
USD
64.8
6 3
7,93
2.6
15,
137.
4 5
3,14
6.0
76.
0 -
0.0
1,2
27.6
(1.3
) 1
,228
.9 -
100.
00%
94In
site V
ision
Inco
rpor
ated
02.1
1.20
15US
D64
.86
0.0
617
.6 2
,212
.1 1
,594
.6 -
3.2
(86.
2) (7
0.4)
(15.
8) -
100.
00%
95Su
n Ph
arm
a M
edisa
les P
rivat
e Li
mite
d (F
orm
erly
know
n as
Sol
rex
Phar
mac
eutic
als C
ompa
ny)
24.0
3.20
15IN
R 1
.00
1.0
83.
6 2
,247
.3 2
,162
.7 -
699
.2 1
12.5
29.
6 8
2.9
-10
0.00
%
96JS
C Bi
osin
tez
19.1
2.20
16RU
B 1
.16
0.3
857.
644
07.4
3549
.5 -
3319
.5 (7
.2)
26.7
(33.
9)-
85.1
0%97
Sun
Phar
mac
eutic
als H
oldi
ngs U
SA, I
NC
18.1
1.20
16US
D64
.86
2067
3.7
0.0
2067
3.7
0.0
-0.
0 -
0.0
--
100.
00%
98Fo
unda
tion
for D
iseas
e El
imin
ation
and
Con
trol
of In
dia
21.0
9.20
16IN
R 1
.00
0.1
(1.2
)0.
51.
7 -
0.0
(1.2
)0.
0 (1
.2)
-10
0.00
%
99O
cular
Tech
nolo
gies
SAR
L15
.12.
2016
USD
64.8
61.
4 (1
.4)
0.0
0.0
-0.
00.
00.
00.
0-
100.
00%
100
Sun
Phar
mac
eutic
al M
edica
re L
imite
d16
.01.
2017
INR
1.0
0 2
.5 (1
3.5)
1934
.519
45.5
-0.
0 (1
3.5)
0.0
(13.
5)-
100.
00%
Note
: 1
0.
0’ re
pres
ents
am
ount
less
than
0.0
5 m
illio
n an
d ro
unde
d off
2
In re
spec
t of e
ntitie
s at
Sr.
Nos
. 4 to
8, 6
2, 8
4, 9
4, 9
6, a
nd 9
9 th
e re
porti
ng d
ate
is as
of D
ecem
ber 3
1, 2
016
and
diffe
rent
from
the
repo
rting
dat
e of
the
Pare
nt C
ompa
ny. A
djus
tmen
ts h
ave
been
mad
e fo
r sig
nific
ant t
rans
actio
ns o
f the
se s
ubsid
iarie
s fo
r the
per
iods
from
Janu
ary
01, 2
016
to M
arch
31,
201
6 an
d Ja
nuar
y 01
, 201
7 to
Mar
ch 3
1, 2
017,
on
the
basis
of t
heir
man
agem
ent a
ccou
nts
for t
he s
aid
perio
ds.
3
The
abov
e do
es n
ot in
clud
e 3
Skyl
ine
LLC
, One
Com
mer
ce D
rive
LLC
, Si
rius
Labo
rato
ries
Inc,
Per
ryto
n W
ind
Pow
er L
LC, I
nsite
Visi
on L
td.,
Dus
a Ph
arm
aceu
tical
s N
ew Y
ork
Inc.
, Tar
o Ph
arm
aceu
tical
La
bora
torie
s In
c, T
aro
Phar
mac
eutic
al In
dia
Priv
ate
Lim
ited
bein
g su
bsid
iarie
s of
Tar
o Ph
arm
aceu
tical
Indu
strie
s Lt
d, C
arac
o Ph
arm
a In
c. 2
Inde
pend
ence
Way
LLC
, URL
Pha
rmaP
ro L
LC a
nd D
unga
n M
utua
l As
soci
ates
LLC
as
they
hav
e no
ope
ratio
n an
d do
es n
ot h
ave
any
Asse
ts, L
iabi
lities
or E
quity
as
on th
e cl
ose
of th
eir F
inan
cial
Yea
r.4
W
ith e
ffect
from
Mar
ch 2
, 201
7, S
un P
harm
aceu
tical
Spa
in, S
.L.U
. has
bee
n liq
uida
ted.
5
With
effe
ct fr
om F
ebru
ary
16, 2
017,
Tar
o H
unga
ry In
telle
ctua
l Pro
pert
y Li
cens
ing
Lim
ited
Liab
ility
Com
pany
has
bee
n liq
uida
ted.
6
Taro
Pha
rmac
eutic
al In
dia
Priv
ate
Lim
ited
is un
der l
iqui
datio
n.7
W
ith e
ffect
from
Aug
ust 1
6, 2
016
Dus
a Ph
arm
aceu
tical
s N
ew Y
ork,
Inc.
has
bee
n di
ssol
ved.
8
With
effe
ct fr
om F
ebru
ary
22, 2
017
Siriu
s La
bora
torie
s In
c ha
s be
en d
issol
ved.
9
With
effe
ct fr
om M
arch
16,
201
7, T
halli
on P
harm
aceu
tical
Inc.
, was
acq
uire
d an
d m
erge
d w
ith T
aro
Phar
mac
eutic
als
Inc.
,10
W
ith e
ffect
from
Apr
il 7,
201
6 Pe
rryt
on W
ind
Pow
er L
LC h
as b
een
liqui
date
d.11
D
urin
g th
e ye
ar, S
olre
x Ph
arm
aceu
tical
s C
ompa
ny, a
par
tner
ship
firm
has
bee
n co
nver
ted
into
com
pany
whi
ch is
kno
wn
as S
un P
harm
a M
edisa
les
Priv
ate
Lim
ited
12
MSD
- Su
n L
LC is
und
er li
quid
ation
.13
M
SD-S
un F
Z LL
C h
as b
een
dere
gist
ered
with
effe
ct fr
om S
epte
mbe
r 14,
201
5 ha
ving
der
egist
ratio
n ce
rtific
ate
date
d D
ecem
ber 2
5, 2
016.
14
Dai
ichi
San
kyo
(Tha
iland
) Ltd
.’s s
hare
s w
ere
sold
as
per a
gree
men
t dat
ed M
ay 1
3, 2
016.
15
With
effe
ct fr
om A
pril
01, 2
015,
URL
Pha
rma
Inc.
, has
mer
ged
into
Mut
ual P
harm
aceu
tical
Com
pany
, Inc
.16
W
ith e
ffect
from
Apr
il 01
, 201
5, A
R Sc
ienti
fic In
c. h
ave
mer
ged
into
URL
Pha
rma
Inc.
17
With
effe
ct fr
om A
pril
01, 2
015,
Uni
ted
Rese
arch
Lab
orat
orie
s Li
mite
d, h
ave
mer
ged
into
URL
Pha
rma
Inc.
18
Dur
ing
the
prev
ious
yea
r, th
e C
ompa
ny h
as s
old
its in
vest
men
t in
Silv
erst
reet
Dev
elop
ers
LLP
with
effe
ct fr
om A
pril
01, 2
015.
19
With
effe
ct fr
om M
arch
01,
201
6, R
anba
xy B
elgi
um N
.V. h
as b
een
liqui
date
d.20
W
ith e
ffect
from
June
30,
201
5 Ra
nbax
y Po
rtug
al -
Com
E D
esen
volv
DeP
rod
Farm
aceu
ticos
Uni
pess
oal L
da h
as b
een
liqui
date
d.21
Za
licus
Pha
rmac
eutic
als
Lim
ited
was
acq
uire
d du
ring
the
prev
ious
yea
r and
sub
sequ
ently
am
alga
mat
ed in
Tar
o Ph
arm
aceu
tical
s In
c., o
n O
ctob
er 0
5, 2
015.
22
With
effe
ct fr
om N
ovem
ber 0
2, 2
015,
The
a Ac
quisi
tion
Cor
pora
tion
has
been
mer
ged
with
Insit
e Vi
sion
Inco
rpor
ated
.

SUN PHARMACEUTICAL INDUSTRIES L IMITED278
NOTES TO THE CONSOLIDATED FINANCIAL STATEMENTS
FOR THE YEAR ENDED MARCH 31, 2017
Part “B”: Associate Companies and Joint Ventures
` In Million
Sr. No
Name of Associates/Joint Ventures
Jointly Controlled Entity Associates
Artes Biotechnology
GmbH
MSD - Sun LLC
S & I Ophthalmic
LLC
Zenotech Laboratories
Limited
Fraizer Healthcare
VII, L.P.
Versant Venture
Capital V, L.P.
scPharmaceuticals Inc.
Generic Solar Power
LLP
Trumpcard Advisors
and Finvest LLP
Medinstill LLC
1 Latest audited Balance Sheet Date
31-Dec-16 31-Mar-17 31-Mar-17 31-Mar-17 31-Dec-16 31-Dec-16 31-Mar-17 31-Mar-17 31-Mar-17 31-Mar-17
Date of acquisition 13.02.2014 06.06.2011 28.10.2013 24.03.2015 24.10.2013 21.04.2014 29.12.2016 09.10.2015 31.03.2017 13.03.20142 Shares of Associate/Joint
Ventures held by the company on the year end No. 15,853 NA NA 16,128,078 NA NA 13,000,000 28,760 NA 1,999 Amount of Investment in Associates/Joint Venture
244.9 0.7 184.0 - 1,437.0 951.5 794.4 0.0 312.5 1,110.3
Extend of Holding % 45.00% 50.00% 50.00% 46.84% 6.83% 7.75% 14.58% 28.76% 40.61% 19.99%3 Description of how there is
significant influence NA NA NA NA NA NA NA NA NA NA
4 Reason why the associate/joint venture is not consolidated
NA NA NA NA NA NA NA NA NA NA
5 Networth attributable to Shareholding as per latest audited Balance Sheet
47.8 - 184.0 - 1595.3 888.2 (396.0) 0.1 0.4 (443.7)
6 Profit / Loss for the year i. Considered in Consolidation
(9.7) - (191.3) NA (12.8) (28.8) (48.8) 0.0 0.0 (166.2)
ii. Not Considered in Consolidation
(11.8) - (191.3) NA (174.8) (343.0) (285.8) 0.0 0.0 (665.2)
For and on behalf of the Board of Directors of Sun Pharmaceutical Industries Limited
UDAY V. BALDOTA DILIP S. SHANGHVI SUDHIR V. VALIAChief Financial Officer Managing Director Wholetime Director
SUNIL R. AJMERA SAILESH T. DESAICompany Secretary Wholetime Director
Mumbai, May 26, 2017

279ANNUAL REPORT 2016-17
NOTES

SUN PHARMACEUTICAL INDUSTRIES L IMITED280
Board of DirectorsIsrael Makov Chairman
Dilip S. Shanghvi Managing Director
Sudhir V. Valia Whole-time Director
Sailesh T. Desai Whole-time Director
Mr. Kalyanasundaram Subramanian Whole-time Director (w.e.f. February 14, 2017)
S. Mohanchand Dadha Director
Hasmukh S. Shah Director
Keki M. Mistry Director
Ashwin Dani Director
Rekha Sethi Director
Chief Financial OfficerUday V. Baldota (upto June 19, 2017)C. S. Muralidharan (w.e.f. June 19, 2017)
Company SecretarySunil R. Ajmeraemail: [email protected]
AuditorsDeloitte Haskins & SellsChartered Accountants, Mumbai
Registrars & Share Transfer AgentsLink Intime India Pvt. Ltd.C 101, 247 Park,L B S Marg, Vikhroli (West),Mumbai – 400 083Tel: (022)-49186000Fax: (022)-49186060E-mail: [email protected]
Operational Manufacturing Plants1. Silvassa, Dadra & Nagar Haveli, India.2. Dadra, Dadra & Nagar Haveli, India.3. Halol, Gujarat, India.4. Panoli, Gujarat, India.5. Ankleshwar, Gujarat, India.6. Karkhadi, Gujarat, India.7. Ahmednagar, Maharashtra, India.8. Maduranthakamm, Tamil Nadu, India.9. Dahej, Gujarat, India. 10. Mohali, Punjab, India. 11. Ponda, Goa, India.12. Paonta Sahib, Himachal Pradesh, India.13. Baddi, Himachal Pradesh, India.14. Dewas, Madhya Pradesh, India.15. Malanpur, Madhya Pradesh, India.16. Toansa, Punjab, India.17. Sun Pharma Laboratories Ltd. Jammu, Jammu & Kashmir, India.18. Sun Pharma Laboratories Ltd. Ranipool, Sikkim, India.19. Sun Pharma Laboratories Ltd. Setipool, Sikkim, India.20. Sun Pharma Laboratories Ltd.
Guwahati, Assam, India 21. Sun Pharmaceutical (Bangladesh) Ltd. Joydevpur, Gazipur, Bangladesh.22. Taro Pharmaceuticals Inc. Brampton, Ontario, Canada.23. Ranbaxy Egypt (L.L.C.) October City, Giza, Egypt.24. Alkaloida Chemical Company Zrt Tiszavasvari, Kabay, Hungary.25. Taro Pharmaceutical Industries Ltd. Haifa Bay, Israel.26. Ranbaxy Malaysia Sdn. Bhd. Kuala Lumpur, Malaysia.27. Sun Pharma de Mexico S.A. El Sifon, Iztapalapa, Mexico.28. Ranbaxy Nigeria Limited Lagos, Nigeria.29. S.C Terapia S. A. Cluj, Romania.30. Ranbaxy Pharmaceuticals (Pty) Ltd. Roodepoort, Johannesburg, South Africa.31. Chattem Chemicals, Inc. Chattanooga, USA.32. Dusa Pharmaceuticals Inc. Wilmington, Massachusetts, USA.
33. Sun Pharmaceutical Industries Inc. Cranbury, New Jersey, USA.34. Pharmalucence Inc. Billerica, Massachusetts, USA.35. Ohm Laboratories, Inc. Brunswick, New Jersey, USA.36. Sun Pharmaceutical Industries
(Australia) Pty Ltd, Latrobe, Australia 37. Sun Pharmaceutical Industries
(Australia) Pty Ltd, Port Fairy, Australia38. JSC Biosintez, Penza, Russia
OfficesRegistered OfficeSun Pharma Advanced Research Centre (SPARC), Tandalja, Vadodara – 390 020, Gujarat.
Corporate OfficeSUN HOUSE, CTS No. 201 B/1, Western Express Highway, Goregaon (E), Mumbai 400063, Maharashtra.
Major Research Centres1. F.P.27, Part Survey No. 27,
C.S. No. 1050, TPS No. 24, Village Tandalja, District, Vadodara - 390 020, Gujarat.
2. 17-B, Mahal Industrial Estate, Mahakali Caves Road, Andheri (East), Mumbai - 400 093, Maharashtra.3. Village Sarhaul, Sector-18, Gurgaon - 122015 (Haryana).4. Chemistry and Discovery Research
Israel, 14 Hakitor Street, P.O. Box 10347 Haifa Bay 2624761, Israel. 5. Taro Pharmaceuticals Inc., 130 East Drive, Brampton, Ontario L6T 1C1, Canada. 6. Ohm Laboratories Inc., Terminal Road, New Brunswick, New Jersey 08901
USA
CORPORATE INFORMATION


SUN HOUSE CTS No. 201 B/1, Western Express Highway, Goregaon (E), Mumbai 400063, Maharashtra, India. Tel : (+91 22) 4324 4324 Fax : (+91 22) 4324 4343 CIN: L24230GJ1993PLC019050 www.sunpharma.com