audubon sugar institute - lsu · pdf fileaudubon sugar institute annual report 2002 ... of the...
TRANSCRIPT
Audubon Sugar Institute Annual Report 2002-2003 1
Audubon Sugar InstituteAudubon Sugar InstituteAnnual Report
2002 – 2003Annual Report
2002 – 2003
2 Audubon Sugar Institute Annual Report 2002-2003
Audubon Sugar InstituteLouisiana State University Agricultural Center
South Stadium DriveBaton Rouge, LA 70803
USA
Tel 225-578-2211 Fax 225-578-2708
Web site: www.lsuagcenter.com/audubon
Chancellor’s Foreword .......................................................................... 3
Mission and Goal Statements ............................................................... 4
Advisory Board ..................................................................................... 4
Head of Institute’s Report ..................................................................... 5
Research and Development ................................................................... 6
Extension Work ................................................................................... 20
Analytical Laboratory ......................................................................... 21
Training and Education
Short Courses ................................................................................ 22
Sugar Engineering ........................................................................ 23
Library and Publications ..................................................................... 24
Faculty and Staff ................................................................................. 26
Representation on Technical Societies and Research Institutes ......... 27
Louisiana State University Agricultural CenterWilliam B. Richardson, Chancellor
Louisiana Agricultural Experiment StationWilliam H. Brown, Vice Chancellor and Director
Louisiana Cooperative Extension ServicePaul D. Coreil, Vice Chancellor and Director
Produced by LSU AgCenter Communications
The LSU AgCenter provides equal opportunities in programs and employment.
On the cover: The Audubon Sugar Factory cane mill, whichconsists of a cane crusher and three mills, was built in 1938.
Audubon Sugar Institute Annual Report 2002-2003 3
Sugar: Vital to Louisiana’s Prosperity
Innovate. Educate. Improve lives. That is the motto the LSU AgCenter has adoptedto help people understand what it is that we do and stand for. The Audubon SugarInstitute is certainly an example of this motto in action. The ASI scientific team is amongour most creative and productive. Note the long list of recent publications at the end ofthis report. This past year, Dr. Michael Saska received one of the sugar industry’s mostprestigious awards – the Sugar Industry Technologists’ Crystal Award. This award ismade annually to only one technologist in the world who has made a significantcontribution to advancing the technology of the international sugar industry.
The Audubon Sugar Institute is dedicated to the enhancement of Louisiana’s sugarfactories through education and technology transfer. Note the accomplishments andfindings in the research reports that follow. The ASI also offers short courses to industryprofessionals and provides individual consultations for factories to help keepLouisiana’s industry competitive. The academic specialization in sugar engineering nowavailable at LSU will ensure that technically trained individuals are available tooperate Louisiana factories.
The LSU AgCenter provides the base of operations for the ASI, but we rely heavilyon our partners, the members of the American Sugar Cane League, to help supportspecific studies that are high industry priorities. The ASI and the AgCenter leadershipare proud of our long partnership with the League and grateful for its guidance andfinancial support.
The sugar industry continues to be critical to the economic development of ourstate. Our financial figures from 2002 indicate that sugarcane leads our cropcommodities in gross farm income ($334,336,300), value added ($213,975,200) andtotal value ($548,311,500). Only forestry and poultry had higher numbers.
Under the capable leadership of Dr. Peter Rein, the Audubon Sugar Institute willcontinue to advance and keep the Louisiana sugar processors (and producers) efficient,profitable and sustainable. Please let me know if you have any questions, and pleasevisit our Web site www.lsuagcenter.com to find out about our latest innovations.
William B. “Bill” Richardson
Audubon Sugar Institute Annual Report 2002-2003 3
William B. “Bill” RichardsonChancellor

4 Audubon Sugar Institute Annual Report 2002-2003
Audubon Sugar Institute Advisory Board
Goals of the Audubon Sugar Institute
Mission Statement
Dr. William Brown – LSU AgCenterMichael Daigle – LULA-Westfield
Neville Dolan – Raceland Raw Sugar CorporationTrevor Endres – Enterprise Factory
Barry Forse – Cinclare Central FactoryRonald Guillote – St. Mary Sugar Coop., Inc.
Roddy Hulett – South Louisiana Sugar Coop., Inc.Windell Jackson – American Sugar Cane League
Dr. Benjamin Legendre – LSU AgCenterDuane Legendre – LaFourche Sugar Corporation
Greg Nolan – LaFourche Sugar CorporationAnthony Parris – Iberia Sugar Coop., Inc.
Rivers Patout – Sterling Sugars, Inc.Robert Roane –Jeanerette Sugar Co., Inc.Dr. Peter Rein – Audubon Sugar InstituteChip Savoie – Westfield Sugar Factory
Charles Schudmak – Cora-Texas Mfg. Co., Inc.David Stewart – Alma Plantation
Jackie Theriot – Louisiana Sugar Cane Coop., Inc.Tommy Thibodeaux – Cajun Sugar Coop., Inc.
(As of March 2003)
Goal 1To enhance the productivity and profitability of the Louisiana sugar
and other sugar process-related industries. Goal 2
To improve the practice of sugar manufacture through educationand technology transfer.
Goal 3To conduct research toward a diversified sugar process industry.
Goal 4To attract, retain and develop a world-class staff to serve our stakeholders.
Goal 5To encourage use of low environmental impact technologies in sugar processing.
To foster a center of excellence for applied and original sugar research,
which exceeds the expectations of our stakeholders in Louisiana and the international sugar industry,
through innovative research, technology transfer and education.

Audubon Sugar Institute Annual Report 2002-2003 5
Dr. Peter Rein
Report from the Head of Audubon Sugar InstituteApril 2002 – March 2003
Audubon has made significant progress during the past year. We have concentrated on getting thebasics right. The Audubon factory building has been repaired and improved; new equipment andinstruments have been acquired through successful Board of Regents grants and funds made availablefrom the AgCenter; the basic infrastructure including a useful filing system and an upgraded library hasbeen put in place; we have eliminated the debt overhanging the Institute and are now financially viable.Most important perhaps is the commitment to the essence of our mission and goals, focusing on research,extension and training, for the benefit of our stakeholders. It is now time to build on the more solid baseand move on to new achievements.
Last year our research effort at the Louisiana mills was hampered by the atrocious weatherconditions. With the short season in Louisiana, the successful execution of factory-based research isdifficult at the best of times. A major problem in the past year was the phenomenon of hard-to-boilmassecuites. Little progress was made in establishing all the factors implicated, but some interestingprogress is described in the research reports following. Our graduate research program continues to bebuilt up with graduate students at Audubon registered in the chemical, mechanical and biologicalengineering departments, as well as food science. Our major source of outside funding is still theAmerican Sugar Cane League, with other contributions from the Louisiana Board of Regents and variouscompanies sponsoring contract research. New grant initiatives currently involve collaboration with theLSU departments of Chemistry and Mechanical Engineering.
Reasonable support was received for the sugar process engineering and sugar factory design coursesoffered through the College of Engineering for the first time. These are available to undergraduate andgraduate students, and provide both with the opportunity to graduate with some specialized sugarengineering knowledge. These courses continue, and are attracting an increasing amount of attentionfrom sugar-producing areas around the world. Final yeardesign projects have been undertaken on sugar processingtopics by senior mechanical engineering students supervisedby Audubon. By awarding scholarships to juniors andseniors, the American Society of Sugar Cane Technologists ishelping to foster interest from the local Louisiana industry.
Last year we started a policy of running short coursesgiven by world experts from outside Audubon. A course onboiler operation and design given by Norman Magasiner andcolleagues on bagasse boilers was a great success. Thisapproach continues again this year, with outside expertsgiving courses on automatic vacuum pan control and canepreparation and milling.
Audubon’s role and modus operandi in extension is stillbeing developed. We try to engage regularly in meeting withrepresentatives of the Louisiana industry in an attempt toestablish some common priorities. The past season plaguedby hurricanes and incessant rain made the task of fulfillingthe Louisiana mills’ extension requirements more difficult.The League generously sponsored a new post at Audubon torelieve faculty of some paperwork, enabling us to spend more time at the mills. This is a great help, and itis hoped that this will continue.
What of the future? The next stage in the revitalization of Audubon Sugar Institute must include aradical improvement to our facilities and an expansion of the faculty. This should leave us better placedto grasp the new opportunities available. Some of these involve the exploitation of cane biomass forchemicals and energy production, and may be extremely far-reaching in their implications.
We anticipate playing a more meaningful role in the Louisiana mills in research, extension andtraining. We also look forward to more international collaboration. We already have a collaborativeagreement with Cenicana in Colombia, and with other prospects in the wings. Our graduate students frommany sugar-producing nations in the world reflect the part that Audubon can play internationally.
What we have been able to achieve has been largely because of the support of the American SugarCane League and the LSU AgCenter. The League has been very supportive of what we do, and we aregrateful to it. I would also like to thank the AgCenter staff who do a great deal for us and especially Vice-Chancellor Dr. Bill Brown, who is always encouraging and willing to help Audubon at every opportunity.We look forward to the future with growing confidence.
Audubon Sugar Institute Annual Report 2002-2003 5
6 Audubon Sugar Institute Annual Report 2002-2003
Nicolas Gil Zapata, graduate assistant at ASI,inspecting cane stalks at Cinclare Central Factory.
Use of Mixed Dithiocarbamate Biocide forPreserving Fresh Sugarcane Juice
Regardless of method of preparation, sugarcane juice is bothchemically and biologically labile to decomposition. Contaminat-ing bacteria can produce the enzyme dextransucrase. This enzymecleaves sucrose into glucose and fructose, concurrently synthesiz-ing dextran. Within 6 to 10 hours, sufficient dextran can form toproduce significant Pol error. Proper factory control requires thatfactory laboratories receive samples of juice that are representa-tive of the state at time of collection.
To prevent biological decomposition, use of a biocidal agentis imperative. An ideal biocide would prevent microbiological lossof sucrose yet not interfere with analysis of the juice. The idealcandidate would not be toxic to people and should not constitutean environmental hazard. The agent in question should be active atlow concentration.
We studied the efficacy of mixed dithiocarbamate (mDTC)biocide to preserve fresh sugarcane juice. A comparison was madeof the mDTC agent at various concentrations against the more tra-ditional biocides sodium azide and mercuric chloride. Samples weretaken periodically and examined for sucrose, glucose and fructoseby HPLC. The samples were analyzed concurrently for sucrose bypolarimetry. The samples were frozen at –74 degrees C and ana-lyzed for dextran by antibody method at a later date. The resultswere compiled and compared against control samples as follows:the negative control will have no added biocide (worst case); posi-tive control will contain 500ppm of sodium azide or 200ppm ofmercuric chloride (best case).
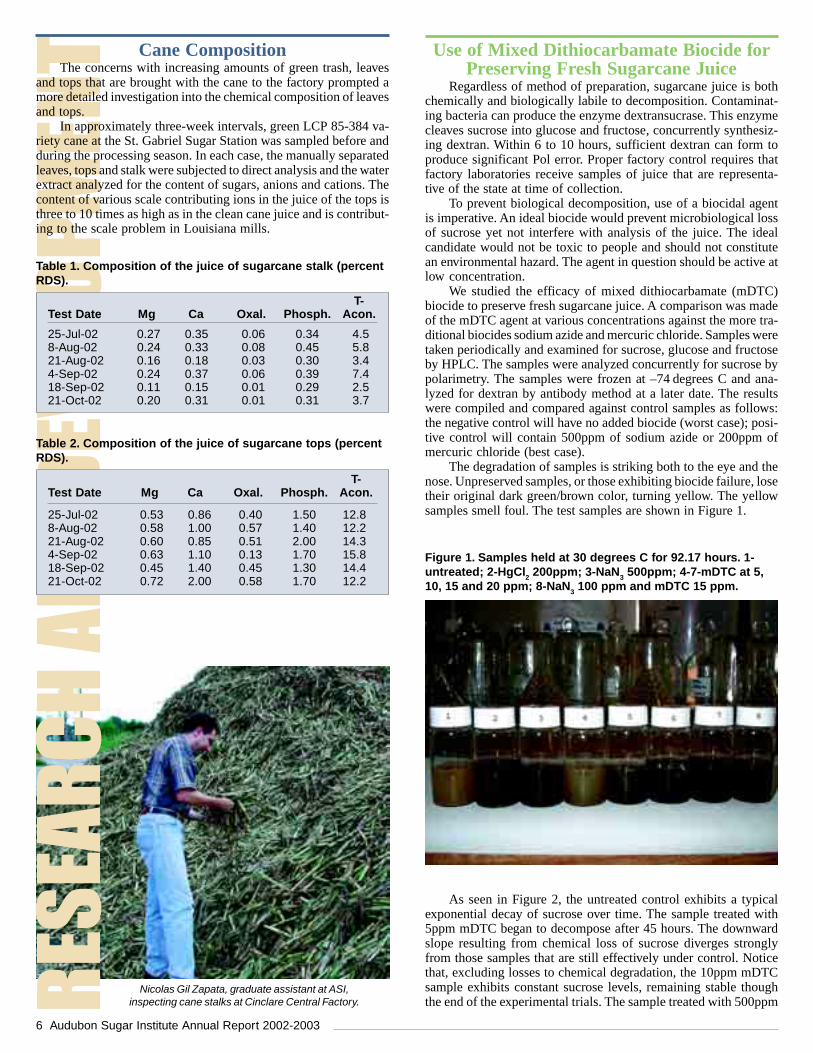
The degradation of samples is striking both to the eye and thenose. Unpreserved samples, or those exhibiting biocide failure, losetheir original dark green/brown color, turning yellow. The yellowsamples smell foul. The test samples are shown in Figure 1.
As seen in Figure 2, the untreated control exhibits a typicalexponential decay of sucrose over time. The sample treated with5ppm mDTC began to decompose after 45 hours. The downwardslope resulting from chemical loss of sucrose diverges stronglyfrom those samples that are still effectively under control. Noticethat, excluding losses to chemical degradation, the 10ppm mDTCsample exhibits constant sucrose levels, remaining stable thoughthe end of the experimental trials. The sample treated with 500ppm
Figure 1. Samples held at 30 degrees C for 92.17 hours. 1-untreated; 2-HgCl2 200ppm; 3-NaN3 500ppm; 4-7-mDTC at 5,10, 15 and 20 ppm; 8-NaN3 100 ppm and mDTC 15 ppm.
Cane CompositionThe concerns with increasing amounts of green trash, leaves
and tops that are brought with the cane to the factory prompted amore detailed investigation into the chemical composition of leavesand tops.
In approximately three-week intervals, green LCP 85-384 va-riety cane at the St. Gabriel Sugar Station was sampled before andduring the processing season. In each case, the manually separatedleaves, tops and stalk were subjected to direct analysis and the waterextract analyzed for the content of sugars, anions and cations. Thecontent of various scale contributing ions in the juice of the tops isthree to 10 times as high as in the clean cane juice and is contribut-ing to the scale problem in Louisiana mills.
Table 1. Composition of the juice of sugarcane stalk (percentRDS).
T-Test Date Mg Ca Oxal. Phosph. Acon.
25-Jul-02 0.27 0.35 0.06 0.34 4.58-Aug-02 0.24 0.33 0.08 0.45 5.821-Aug-02 0.16 0.18 0.03 0.30 3.44-Sep-02 0.24 0.37 0.06 0.39 7.418-Sep-02 0.11 0.15 0.01 0.29 2.521-Oct-02 0.20 0.31 0.01 0.31 3.7
T-Test Date Mg Ca Oxal. Phosph. Acon.
Table 2. Composition of the juice of sugarcane tops (percentRDS).
25-Jul-02 0.53 0.86 0.40 1.50 12.88-Aug-02 0.58 1.00 0.57 1.40 12.221-Aug-02 0.60 0.85 0.51 2.00 14.34-Sep-02 0.63 1.10 0.13 1.70 15.818-Sep-02 0.45 1.40 0.45 1.30 14.421-Oct-02 0.72 2.00 0.58 1.70 12.2
Audubon Sugar Institute Annual Report 2002-2003 7
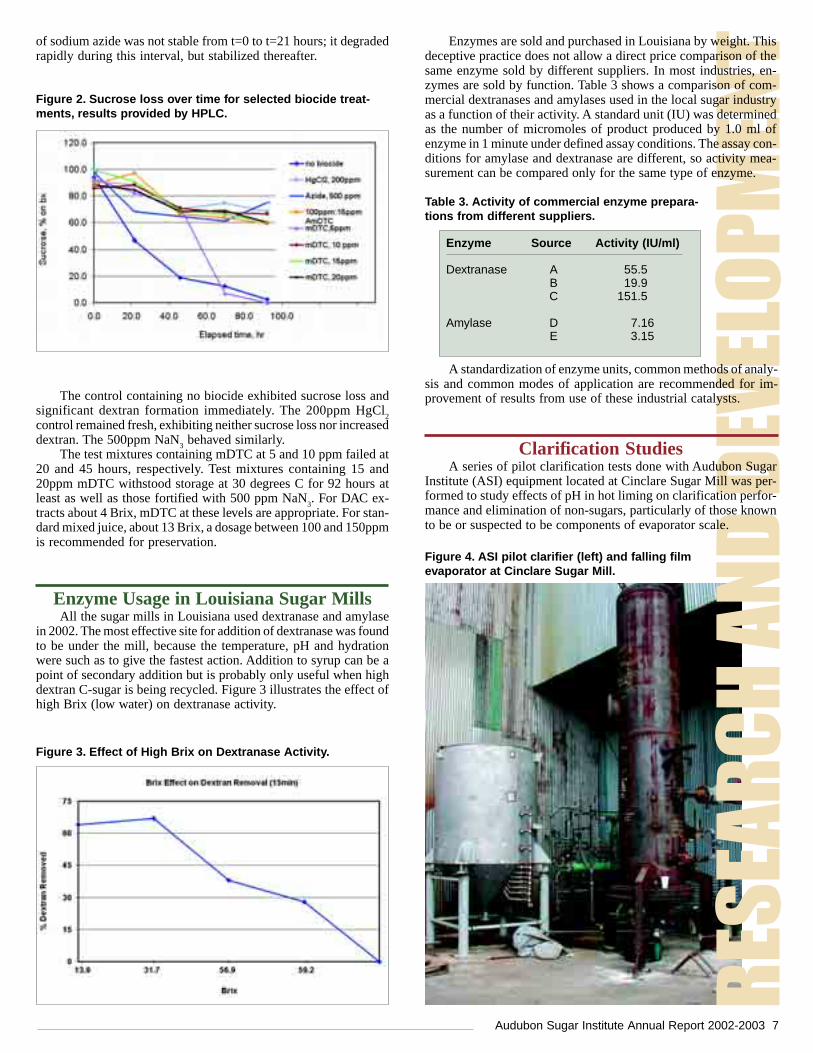
Figure 2. Sucrose loss over time for selected biocide treat-ments, results provided by HPLC.
The control containing no biocide exhibited sucrose loss andsignificant dextran formation immediately. The 200ppm HgCl
2control remained fresh, exhibiting neither sucrose loss nor increaseddextran. The 500ppm NaN
3 behaved similarly.
The test mixtures containing mDTC at 5 and 10 ppm failed at20 and 45 hours, respectively. Test mixtures containing 15 and20ppm mDTC withstood storage at 30 degrees C for 92 hours atleast as well as those fortified with 500 ppm NaN
3. For DAC ex-
tracts about 4 Brix, mDTC at these levels are appropriate. For stan-dard mixed juice, about 13 Brix, a dosage between 100 and 150ppmis recommended for preservation.
of sodium azide was not stable from t=0 to t=21 hours; it degradedrapidly during this interval, but stabilized thereafter.
Enzyme Usage in Louisiana Sugar MillsAll the sugar mills in Louisiana used dextranase and amylase
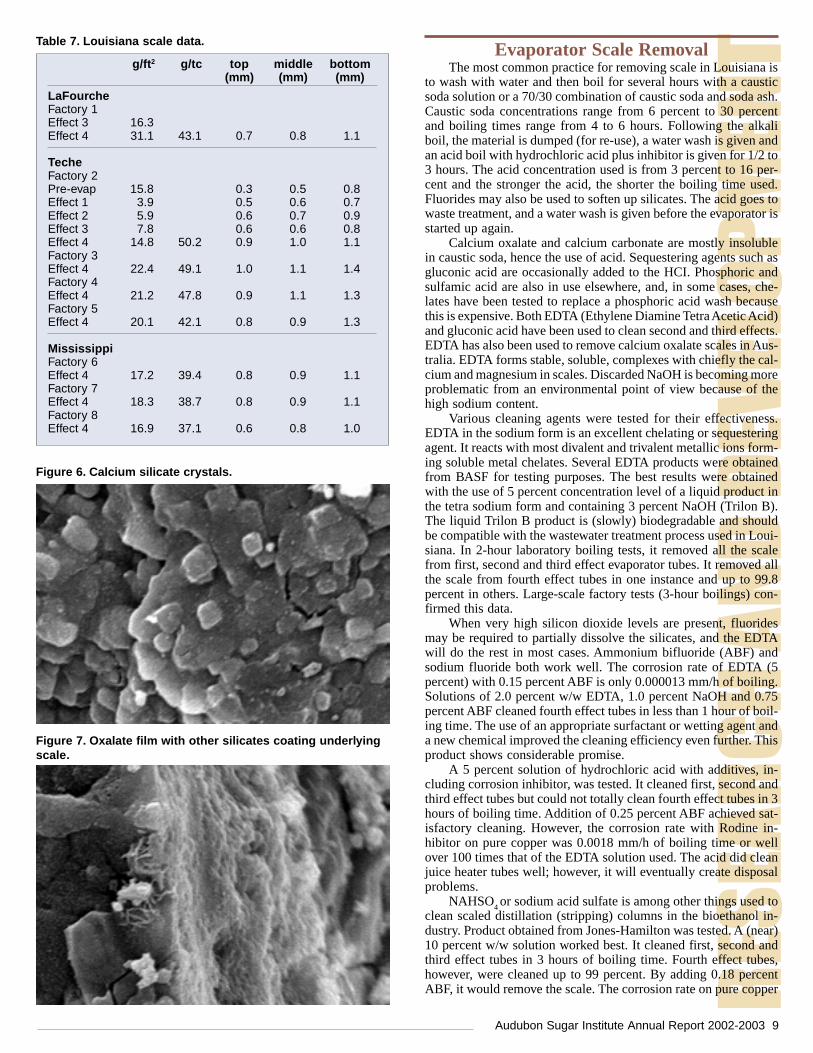
in 2002. The most effective site for addition of dextranase was foundto be under the mill, because the temperature, pH and hydrationwere such as to give the fastest action. Addition to syrup can be apoint of secondary addition but is probably only useful when highdextran C-sugar is being recycled. Figure 3 illustrates the effect ofhigh Brix (low water) on dextranase activity.
Figure 3. Effect of High Brix on Dextranase Activity.
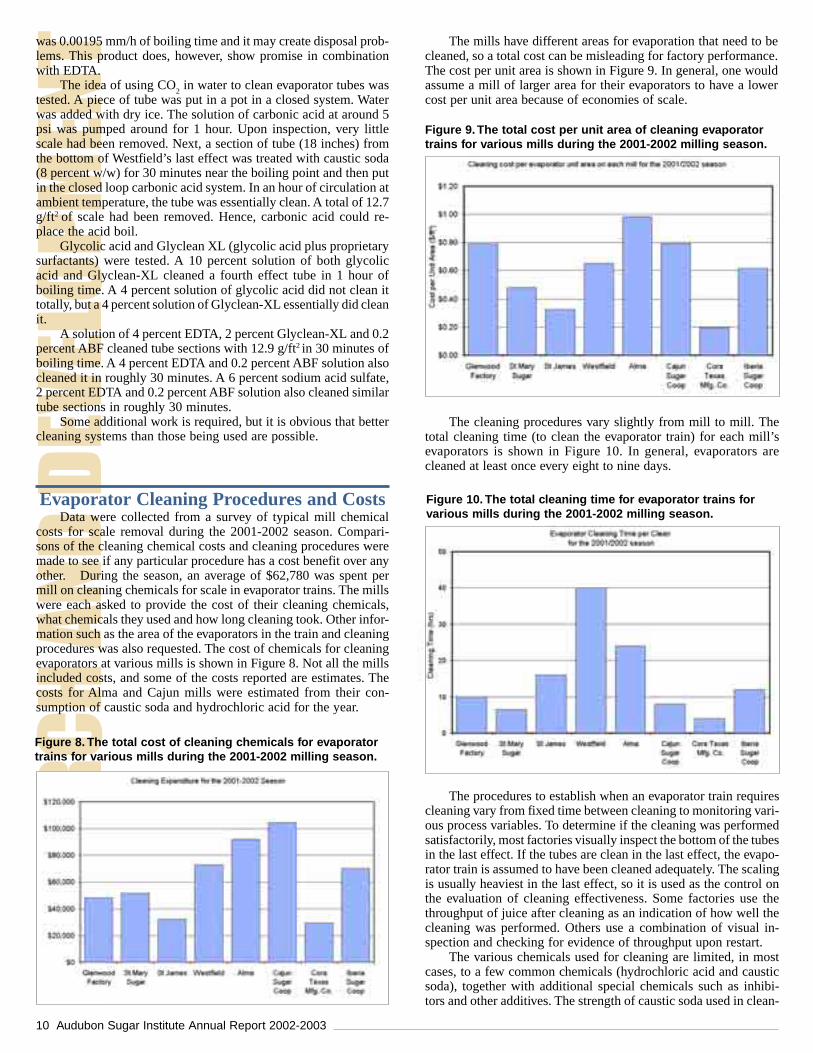
Figure 4. ASI pilot clarifier (left) and falling filmevaporator at Cinclare Sugar Mill.
Enzymes are sold and purchased in Louisiana by weight. Thisdeceptive practice does not allow a direct price comparison of thesame enzyme sold by different suppliers. In most industries, en-zymes are sold by function. Table 3 shows a comparison of com-mercial dextranases and amylases used in the local sugar industryas a function of their activity. A standard unit (IU) was determinedas the number of micromoles of product produced by 1.0 ml ofenzyme in 1 minute under defined assay conditions. The assay con-ditions for amylase and dextranase are different, so activity mea-surement can be compared only for the same type of enzyme.
Table 3. Activity of commercial enzyme prepara-tions from different suppliers.
Enzyme Source Activity (IU/ml)
Dextranase A 55.5B 19.9C 151.5
Amylase D 7.16E 3.15
Clarification StudiesA series of pilot clarification tests done with Audubon Sugar
Institute (ASI) equipment located at Cinclare Sugar Mill was per-formed to study effects of pH in hot liming on clarification perfor-mance and elimination of non-sugars, particularly of those knownto be or suspected to be components of evaporator scale.
A standardization of enzyme units, common methods of analy-sis and common modes of application are recommended for im-provement of results from use of these industrial catalysts.

8 Audubon Sugar Institute Annual Report 2002-2003
Figure 5: Oxalic acid and aconitic acid in scale (fourth effect),percent ash.
The thickness of evaporator scale was measured at the bottom,middle and top of the tubes, and the quantity of scale per ton ofcane processed was computed. The results are shown in Table 7.The thickness of the scale is greater at the bottom of the tubes,where the velocity is lowest, and decreases up the tube.
X-ray powder diffraction was used to assess the crystallinephases in scale samples. Together with differential thermal analy-sis, the extent of the amorphous and crystalline phases could beassessed. Figure 6 shows calcium silicate crystals, and Figure 7 anoxalate film followed by different silicates, coating the underlyingscale. Amorphous silicates are generally more amenable to clean-ing with strong alkali.
Table 6. Louisiana scale composition (individual elementsexpressed as percent on ash).
Ash Ca Si P Mg S Fe AlpercentScale
LaFourcheFactory 1Pre-evap 1 84.6 6.1 1.9 6.5 2.6 0.8 1.4 0.1Pre-evap 2 83.9 16.2 3.4 6.3 3.7 0.6 1.1 0.1Effect 1 88.9 21.2 2.8 8.9 2.2 0.6 0.6 0.1Effect 2 87.7 9.8 5.9 10.7 1.9 0.5 0.6 0.1Effect 3 87.5 12.4 13.1 4.0 3.0 0.4 0.8 0.1TecheFactory 2Pre-evap 84.7 20.6 1.3 6.1 2.8 0.7 0.4 0.1Effect 1 94.5 22.3 6.3 6.4 4.5 0.7 0.7 0.1Effect 2 92.1 22.6 1.9 11.8 2.7 0.6 0.9 0.1Effect 3 85.3 18.0 6.9 10.3 1.6 0.4 0.4 <0.1Effect 4 89.7 12.5 14.6 2.7 2.1 0.4 1.3 <0.1Factory 3Effect 4 82.0 20.1 17.8 3.6 4.4 0.2 1.1 <0.1Factory 4Effect 4 88.7 18.1 19.0 3.9 3.9 0.2 0.9 0.1Factory 5Effect 4 86.3 17.9 19.7 4.0 3.7 0.2 0.8 0.1MississippiFactory 6Effect 4 86.7 15.7 13.8 3.4 2.7 0.3 0.9 <0.1Factory 7Effect 4 87.0 14.1 14.0 3.7 2.8 0.4 0.7 0.1Factory 8Effect 4 84.2 13.4 12.3 3.3 2.6 0.3 2.6 <0.1
In addition, milk of lime was replaced in several tests withsoda ash for pH adjustment of hot juice, because soda ash wasfound in smaller scale tests at ASI last year to give clarified juiceof quality comparable with the traditional lime but much lower incalcium. Since calcium salts of oxalate, phosphate and other an-ions are known major components of evaporator scale, replacinglime with soda ash is expected to prove beneficial in reducing scaleformation. Tables 4 and 5 show the results from the clarificationstudy. Of interest is the increase in pH from clarified juice to syrupin the hot soda ash clarification compared to the decrease in pHobtained in the liming method. While the clarification with sodaash was good, and produced syrups that in sugar boiling and heattransfer trials at ASI proved indistinguishable from those preparedby conventional liming, the issues of melassigenicity and increasedsodium levels in final molasses are yet to be considered. Molassesexhaustion in Louisiana is obviously controlled by factors otherthan equilibrium limitations (approach to target purity as high asfive to 10 points are routinely seen), so the melassigenicity fromincreased sodium levels may not be an issue. Increase in sodium isoffset by reduction in calcium, which is quoted by some as a pos-sible factor in difficult boiling.
Table 4: Clarification study using hot soda ash.
Pilot Hot Soda Ash
8 8.6 0.6 94 718.1 8.7 0.6 93 587.7 8.2 0.5 94 367.8 8.7 0.9 98 777 7.1 0.1 92 46
Syrup percent P2O5 percent SiCJ pH (h) pH(amb) delta (pH) removed removed
Table 5: Clarification study using hot milk of lime.
Pilot Hot MOL
8.5 7.9 -0.6 99 588.5 7.9 -0.6 100 457.7 7.5 -0.2 95 518.8 8.3 -0.5 97 60
Syrup percent P2O5 percent SiCJ pH (h) pH(amb) delta (pH) removed removed
Evaporator ScalingScaling of evaporators in the Louisiana sugar industry is an
important issue. Cleaning time represents down time or else re-duced throughput, which is costly, quite apart from the cost of thechemicals. Cost of chemicals alone varies from $0.045 to $0.06per ton of cane.
Samples of scale have been collected from evaporators from anumber of different mills, covering different evaporator effects anddifferent cane supply areas.
The scale is composed of moisture (low), organic matter andinorganic salts (ash). Results of the ash analyses of scale samplesare shown in Table 6. Silicon scale is the most difficult to remove.It can be seen from this data that silicon is much higher in scalefrom later evaporator effects and higher in scale from mills in theTeche area.
Aconitic and oxalic acid levels in scale were calculated fromthe differences in the content of their components in clarified juiceand syrup. These calculations were checked by direct analysis ofscale and were found to be reliable. Results are shown in Figure 5.
Audubon Sugar Institute Annual Report 2002-2003 9
Figure 6. Calcium silicate crystals.
Figure 7. Oxalate film with other silicates coating underlyingscale.
LaFourcheFactory 1Effect 3 16.3Effect 4 31.1 43.1 0.7 0.8 1.1
TecheFactory 2Pre-evap 15.8 0.3 0.5 0.8Effect 1 3.9 0.5 0.6 0.7Effect 2 5.9 0.6 0.7 0.9Effect 3 7.8 0.6 0.6 0.8Effect 4 14.8 50.2 0.9 1.0 1.1Factory 3Effect 4 22.4 49.1 1.0 1.1 1.4Factory 4Effect 4 21.2 47.8 0.9 1.1 1.3Factory 5Effect 4 20.1 42.1 0.8 0.9 1.3
MississippiFactory 6Effect 4 17.2 39.4 0.8 0.9 1.1Factory 7Effect 4 18.3 38.7 0.8 0.9 1.1Factory 8Effect 4 16.9 37.1 0.6 0.8 1.0
Table 7. Louisiana scale data.
g/ft2 g/tc top middle bottom(mm) (mm) (mm)
Evaporator Scale RemovalThe most common practice for removing scale in Louisiana is
to wash with water and then boil for several hours with a causticsoda solution or a 70/30 combination of caustic soda and soda ash.Caustic soda concentrations range from 6 percent to 30 percentand boiling times range from 4 to 6 hours. Following the alkaliboil, the material is dumped (for re-use), a water wash is given andan acid boil with hydrochloric acid plus inhibitor is given for 1/2 to3 hours. The acid concentration used is from 3 percent to 16 per-cent and the stronger the acid, the shorter the boiling time used.Fluorides may also be used to soften up silicates. The acid goes towaste treatment, and a water wash is given before the evaporator isstarted up again.
Calcium oxalate and calcium carbonate are mostly insolublein caustic soda, hence the use of acid. Sequestering agents such asgluconic acid are occasionally added to the HCI. Phosphoric andsulfamic acid are also in use elsewhere, and, in some cases, che-lates have been tested to replace a phosphoric acid wash becausethis is expensive. Both EDTA (Ethylene Diamine Tetra Acetic Acid)and gluconic acid have been used to clean second and third effects.EDTA has also been used to remove calcium oxalate scales in Aus-tralia. EDTA forms stable, soluble, complexes with chiefly the cal-cium and magnesium in scales. Discarded NaOH is becoming moreproblematic from an environmental point of view because of thehigh sodium content.
Various cleaning agents were tested for their effectiveness.EDTA in the sodium form is an excellent chelating or sequesteringagent. It reacts with most divalent and trivalent metallic ions form-ing soluble metal chelates. Several EDTA products were obtainedfrom BASF for testing purposes. The best results were obtainedwith the use of 5 percent concentration level of a liquid product inthe tetra sodium form and containing 3 percent NaOH (Trilon B).The liquid Trilon B product is (slowly) biodegradable and shouldbe compatible with the wastewater treatment process used in Loui-siana. In 2-hour laboratory boiling tests, it removed all the scalefrom first, second and third effect evaporator tubes. It removed allthe scale from fourth effect tubes in one instance and up to 99.8percent in others. Large-scale factory tests (3-hour boilings) con-firmed this data.
When very high silicon dioxide levels are present, fluoridesmay be required to partially dissolve the silicates, and the EDTAwill do the rest in most cases. Ammonium bifluoride (ABF) andsodium fluoride both work well. The corrosion rate of EDTA (5percent) with 0.15 percent ABF is only 0.000013 mm/h of boiling.Solutions of 2.0 percent w/w EDTA, 1.0 percent NaOH and 0.75percent ABF cleaned fourth effect tubes in less than 1 hour of boil-ing time. The use of an appropriate surfactant or wetting agent anda new chemical improved the cleaning efficiency even further. Thisproduct shows considerable promise.
A 5 percent solution of hydrochloric acid with additives, in-cluding corrosion inhibitor, was tested. It cleaned first, second andthird effect tubes but could not totally clean fourth effect tubes in 3hours of boiling time. Addition of 0.25 percent ABF achieved sat-isfactory cleaning. However, the corrosion rate with Rodine in-hibitor on pure copper was 0.0018 mm/h of boiling time or wellover 100 times that of the EDTA solution used. The acid did cleanjuice heater tubes well; however, it will eventually create disposalproblems.
NAHSO4 or sodium acid sulfate is among other things used to
clean scaled distillation (stripping) columns in the bioethanol in-dustry. Product obtained from Jones-Hamilton was tested. A (near)10 percent w/w solution worked best. It cleaned first, second andthird effect tubes in 3 hours of boiling time. Fourth effect tubes,however, were cleaned up to 99 percent. By adding 0.18 percentABF, it would remove the scale. The corrosion rate on pure copper
10 Audubon Sugar Institute Annual Report 2002-2003
was 0.00195 mm/h of boiling time and it may create disposal prob-lems. This product does, however, show promise in combinationwith EDTA.
The idea of using CO2 in water to clean evaporator tubes was
tested. A piece of tube was put in a pot in a closed system. Waterwas added with dry ice. The solution of carbonic acid at around 5psi was pumped around for 1 hour. Upon inspection, very littlescale had been removed. Next, a section of tube (18 inches) fromthe bottom of Westfield’s last effect was treated with caustic soda(8 percent w/w) for 30 minutes near the boiling point and then putin the closed loop carbonic acid system. In an hour of circulation atambient temperature, the tube was essentially clean. A total of 12.7g/ft2 of scale had been removed. Hence, carbonic acid could re-place the acid boil.
Glycolic acid and Glyclean XL (glycolic acid plus proprietarysurfactants) were tested. A 10 percent solution of both glycolicacid and Glyclean-XL cleaned a fourth effect tube in 1 hour ofboiling time. A 4 percent solution of glycolic acid did not clean ittotally, but a 4 percent solution of Glyclean-XL essentially did cleanit.
A solution of 4 percent EDTA, 2 percent Glyclean-XL and 0.2percent ABF cleaned tube sections with 12.9 g/ft2 in 30 minutes ofboiling time. A 4 percent EDTA and 0.2 percent ABF solution alsocleaned it in roughly 30 minutes. A 6 percent sodium acid sulfate,2 percent EDTA and 0.2 percent ABF solution also cleaned similartube sections in roughly 30 minutes.
Some additional work is required, but it is obvious that bettercleaning systems than those being used are possible.
Evaporator Cleaning Procedures and CostsData were collected from a survey of typical mill chemical
costs for scale removal during the 2001-2002 season. Compari-sons of the cleaning chemical costs and cleaning procedures weremade to see if any particular procedure has a cost benefit over anyother. During the season, an average of $62,780 was spent permill on cleaning chemicals for scale in evaporator trains. The millswere each asked to provide the cost of their cleaning chemicals,what chemicals they used and how long cleaning took. Other infor-mation such as the area of the evaporators in the train and cleaningprocedures was also requested. The cost of chemicals for cleaningevaporators at various mills is shown in Figure 8. Not all the millsincluded costs, and some of the costs reported are estimates. Thecosts for Alma and Cajun mills were estimated from their con-sumption of caustic soda and hydrochloric acid for the year.
Figure 8. The total cost of cleaning chemicals for evaporatortrains for various mills during the 2001-2002 milling season.
The mills have different areas for evaporation that need to becleaned, so a total cost can be misleading for factory performance.The cost per unit area is shown in Figure 9. In general, one wouldassume a mill of larger area for their evaporators to have a lowercost per unit area because of economies of scale.
The cleaning procedures vary slightly from mill to mill. Thetotal cleaning time (to clean the evaporator train) for each mill’sevaporators is shown in Figure 10. In general, evaporators arecleaned at least once every eight to nine days.
Figure 9. The total cost per unit area of cleaning evaporatortrains for various mills during the 2001-2002 milling season.
The procedures to establish when an evaporator train requirescleaning vary from fixed time between cleaning to monitoring vari-ous process variables. To determine if the cleaning was performedsatisfactorily, most factories visually inspect the bottom of the tubesin the last effect. If the tubes are clean in the last effect, the evapo-rator train is assumed to have been cleaned adequately. The scalingis usually heaviest in the last effect, so it is used as the control onthe evaluation of cleaning effectiveness. Some factories use thethroughput of juice after cleaning as an indication of how well thecleaning was performed. Others use a combination of visual in-spection and checking for evidence of throughput upon restart.
The various chemicals used for cleaning are limited, in mostcases, to a few common chemicals (hydrochloric acid and causticsoda), together with additional special chemicals such as inhibi-tors and other additives. The strength of caustic soda used in clean-
Figure 10. The total cleaning time for evaporator trains forvarious mills during the 2001-2002 milling season.

Audubon Sugar Institute Annual Report 2002-2003 11
ing the evaporators varies between 12 percent and 50 percent. Foracid concentration in cleaning cycles, the strengths vary between 2percent and 17 percent.
The mills that seem to have the lowest cost per unit area ap-pear to be the ones that monitor a number of process variables toevaluate when cleaning is required. These evaluations are similarto calculating a heat transfer coefficient. In evaluating a number ofvariables, mills ensure the vessel’s performance drop is because ofa need for cleaning and not for other mill abnormalities furtherupstream.
Falling Film Plate Evaporatoras a Fourth Effect
The Audubon Sugar Institute’s pilot falling film plate evapo-rator was installed at Cinclare in parallel with the fourth effect.The feed to the pilot unit is the discharge from the third effect, andthe heating vapors also are from this effect. The vapor dischargewas connected immediately before the barometric condenser.
Clarification problems at Cinclare produced clarified juicecontaining large quantities of bagacillo and occasionally some mud.The quality of the clarified juice resulted in feed conditions fromthe third effect that were unfavorable to the pilot unit operation.The bagacillo carryover in the feed caused rapid plugging, makingit necessary to clean one of the two strainers every 10 minutes. Thefrequent cleaning required was an interference that prevented con-tinuous operation of the system.
The first test at steady state conditions operated the system fortwo and one-half hours. The feed was 32.9 Brix and 85.3 poundsper minute at 188 degrees F. The vacuum was 27.1 inches Hg, andthe vessel temperature 137 degrees F. The heating vapors were near192 degrees F and the measured condensate 2,712 pounds per hour.Hence, at 9 gallons per minute feed, the evaporation rate was near8 pounds per hour and the overall heat transfer coefficient 188 Btu/h.ft2. degrees F (1.07 kW/m2. degrees C).
BDT (now GEA Ecoflux, the plate pack manufacturer) visitedthe unit at Cinclare and advised on an increase in the feed rate toachieve higher wetting numbers and possibly better performance.An additional test in December was conducted when the unit wasoperated for 5 hours continuously. The feed rate was 15 gallons perminute at 31.9 Brix and syrup at 64.7 Brix, to yield an overall heattransfer coefficient of 202 Btu/h.ft2. degrees F. At a feed rate of 20gallons per minute, the overall heat transfer coefficient increasedto 210 Btu/h.ft2. degrees F (1.19 kW/m2. degrees C).
The falling film plate evaporator does not operate with a liq-uid head, as is the case in rising film or Robert units. Consequently,the effective temperature differential is higher and the overall heattransfer rate increases. The above results were obtained with a cleanunit, and further work is anticipated to investigate the effect of thefouling and optimum cleaning procedures.
Boiling Point Elevationof Technical Sugarcane Solutions
A series of boiling point elevation measurements was madewith sugarcane liquors at three purity levels and three absolute pres-sures and an equation
developed that fits the experimental data well. Through an intro-duction of the solubility and supersaturation concepts, a generalequation
Figure 11. BPE (degrees C) vs. supersaturation, at 80 purityand temperatures from 55 to 75 degrees C.
and a series of graphs were produced that are suitable for use in, orindirect incorporation into, the software of automatic control ofsugar boiling in the sugarcane industry.
High Temperature AmylaseTo avoid possible carryover of the amylase activity into raw
and refined sugar, an intermediate temperature amylase is routinelyused in the Louisiana mills rather than the high temperature type.Because the starch levels in Louisiana raw sugar of 100 – 200 ppmare common despite the amylase addition, which most often is intothe fourth effect of the evaporator, the efficacy appears limited inthe 50 – 60 Brix and 60 degrees C environment. Dosing of a high-temperature amylase in the clarifier inlet would present favorablelow Brix environment and a long residence time, and was tested ina series of pilot scale experiments. Residual enzyme activity wasdetermined in the clarified juice withdrawn from the clarifier atvarious time intervals, as well as in the raw sugar and molassesproduced from the amylase-treated clarified juice. At a 5 ppm doseon the clarified juice, starch hydrolysis is nearly complete within 5minutes and about 30 percent of the enzyme activity was carried
The HPAEC with PAD used by analytical chemist Brian Whiteis capable of detecting trace quantities of carbohydrates and alcohols.

12 Audubon Sugar Institute Annual Report 2002-2003
over to the sugar. A much lower amylase dose, at less than1ppm onclarified juice would, apparently, still be sufficient for completestarch hydrolysis within the 60 or so minutes available in mostclarifiers. Whether the residual activity in the sugar would then benegligible will need to be verified in further experiments.
Figure 12. The residual amylase activity is proportional to therate (slope of the lines) of the hydrolysis of starch-richsubstrate.
Hard to Boil MassecuitesSeveral incidents during the 2002 crop season of severe diffi-
culties with boiling massecuites were reported by the mills, pre-sumably related to the inclement weather conditions during thoseperiods. About 1 ton of refractory ‘A’ molasses was collected at theend of October at the LASUCA mill in St. Martinville and, againin mid-December at the Iberia Sugar Coop mill in New Iberia. Aseries of heat transfer measurements carried out at the ASI pilotfacility confirmed the mills’ observations. The overall boiling heattransfer coefficient at the Brix levels found during boiling is dras-tically lower than for the standard materials (St. James 2001 ‘A’molasses).
Further investigations indicated that neither the known indi-cators of cane deterioration, for example dextran, nor those of im-mature cane or cane with excessive amounts of tops and leaves, forexample, starch, correlate with the observed behavior. A numberof various treatments of the refractory materials with activated car-bon and adsorbent resins, and clarification using 50 percent etha-nol, with the addition of antifoams, surfactants, sodas ash and min-
eral acids were tested. While considerable improvement of the boil-ing was noted as a result of treatment with the solid adsorbents,indicating initial presence and partial removal of culprit compounds,the only possible economical recourse at present appears acidifi-cation directly in the pan with hydrochloric acid.
Figure 13. Heat transfer correlation with Brix levels duringboiling.
The feasibility of acidification from the standpoint of acid cost,sucrose inversion (at 65 degrees C, pH around 5.0 and 85-88 per-cent RDS) and other issues are still under investigation.
Figure 15. Effect of acidification on heat transfer.
Figure 14. Effect of acid treatment on pH in ‘A’ molasses.
Sucrose Gels in MassecuitesAs part of the study on hard-to-boil (HTB) massecuites, the
formation of gels by calcium sucrates with small amounts of car-bon dioxide was investigated. The carbon dioxide can be producedby microorganisms, especially heterotrophic soil bacteria that willproduce both organic acids and carbon dioxide. Large quantities ofthese bacteria enter the factories with the soil on the cane and inwash water and/or on cane. The gel structure produced in the fac-tory is a branched form of Ca-CO
3-Ca-C
12H
10O
11-Ca- (etc.) as de-
termined by Nuclear Magnetic Resonance Spectroscopy.After more than 60 trials in the laboratory, this gel was pro-
duced in a synthetic mixture of sucrose, water and milk of lime(pH 7.81 and Brix 13.9) to which small amounts of carbon dioxidewere added. The CO
2 was produced from dry ice in a closed Erlen-
meyer connected to a sintered steel sparger yielding 60 micronbubbles of carbon dioxide in a graduated cylinder with the sugarsolution. The dry ice slowly sublimated and, when the pressure inthe Erlenmeyer was able to overcome the hydrostatic pressure inthe graduated cylinder, the carbonation began. Too much carbondioxide prevents the formation of the gel.
Figure 16 shows synthetic mixtures after gel formation pouredinto ethanol (final concentration 80% v/v) precipitating gels/gums.The same was done with mixtures to which clarified juice fromAlma was added, which was known to yield HTB massecuites. Theresult was simply more precipitate, which also contained some truegums. The gel disappeared after mixing a small amount of EGTA(ethylene glycol tetra acetic acid) to the middle cylinder. EGTA

Audubon Sugar Institute Annual Report 2002-2003 13
will specifically chelate calcium (and works better than EDTA).The only evidence left were a few flakes at the bottom of the gradu-ated cylinder.
This confirms that dextran and starch are not actively involvedin HTB gel formation as already had been demonstrated atCoraTexas.
If HTB massecuites appear, a calcium measurement will al-low the determination of how much EGTA has to be added.
Figure 16.Precipitated gel (center) and gel and gums (atends).
Analysis of the Fluid Flow in SugarCrystallization
One of the last stages in the sugar mill process is the crystalli-zation of sucrose in batch or continuous vacuum pans. Valuableexperimental work has been done on the process, and acceptabledesigns of batch vacuum pans are available, which in recent yearshave extended rapidly to continuous pans. Sugar crystallization isyet to be fully understood, however, and there is a need for moreexperimental data and optimization of the current vacuum pan de-signs.
Currently, ASI and the mechanical engineering department atLouisiana State University are conducting a joint research projectusing computational fluid dynamics (CFD) and experimental tech-niques to study the sugarcane crystallization process. The maingoal is to understand better the flow patterns inside process vesselsand provide the capability to produce design alternatives to im-prove circulation. Improved circulation leads to maximum through-put in process equipment and improved sugar quality.
A scaled-down model to duplicate the flow patterns insidevacuum pans is being developed. Anemometry techniques will beapplied for the analysis to consider different factors important dur-ing a strike (viscosity, strike height, circulation rate, bottom geom-etry, downtake size) and validate the numerical results obtainedwith a commercial CFD code (FLUENT). This experiment is in-tended to develop a tool for analyzing industrial equipment andidentifying alternatives to optimize the process.
Figure 18. Phases contour and liquid velocityvectors predicted using CFD.
Figure 17. Scale model designed to represent andmeasure the flow inside a sugar vacuum pan.
Horizontal and Vertical Crystallizersand Batch and Continuous Pans
As part of a program to test and evaluate new types of equip-ment installed in the Louisiana sugar industry, work was conductedthis year on vertical crystallizers and on continuous pans.
Vertical Fletcher-Smith, Silver and Honiron crystallizers weretested together with Werkspoor and several Blanchard types.
A Nutsch device fitted with a low grade centrifugal screen andoperated with 100 psig air was used to obtain mother liquor samplesfrom the massecuite leaving the pan, leaving the crystallizers andleaving the massecuite reheater. Samples were analyzed for refrac-tometer Brix and apparent purity.
14 Audubon Sugar Institute Annual Report 2002-2003
Vacuum Pan – Crystal Yields and Purity DropsThe crystal yields (crystal content percent massecuite solids)
for the A, B and C strikes are summarized in Table 8. Purity drop(Massecuite purity – Molasses Purity) for the A, B and C strikesare summarized in Table 9.
Figure 19. C crystal yield at pan and out crystallizer.
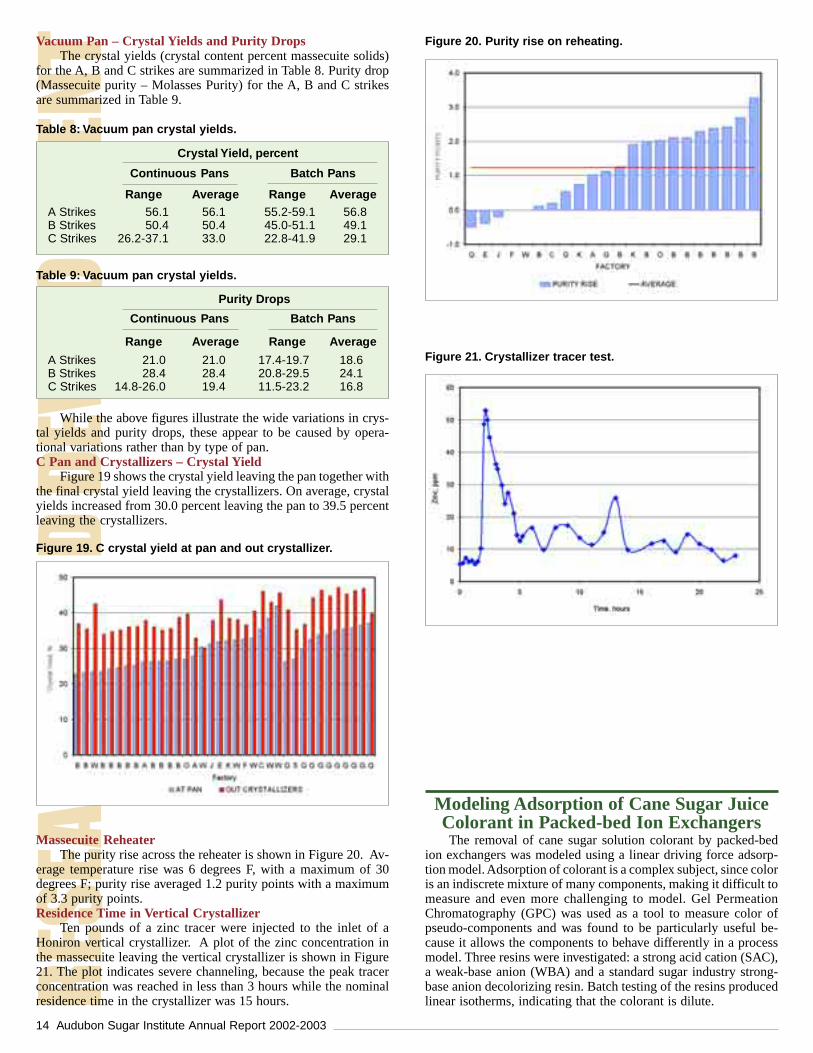
Figure 21. Crystallizer tracer test.
Figure 20. Purity rise on reheating.
Table 8: Vacuum pan crystal yields.
Table 9: Vacuum pan crystal yields.
While the above figures illustrate the wide variations in crys-tal yields and purity drops, these appear to be caused by opera-tional variations rather than by type of pan.C Pan and Crystallizers – Crystal Yield
Figure 19 shows the crystal yield leaving the pan together withthe final crystal yield leaving the crystallizers. On average, crystalyields increased from 30.0 percent leaving the pan to 39.5 percentleaving the crystallizers.
Crystal Yield, percent
A Strikes 56.1 56.1 55.2-59.1 56.8B Strikes 50.4 50.4 45.0-51.1 49.1C Strikes 26.2-37.1 33.0 22.8-41.9 29.1
Range Average Range Average
Continuous Pans Batch Pans
A Strikes 21.0 21.0 17.4-19.7 18.6B Strikes 28.4 28.4 20.8-29.5 24.1C Strikes 14.8-26.0 19.4 11.5-23.2 16.8
Purity Drops
Continuous Pans Batch Pans
Range Average Range Average
Massecuite ReheaterThe purity rise across the reheater is shown in Figure 20. Av-
erage temperature rise was 6 degrees F, with a maximum of 30degrees F; purity rise averaged 1.2 purity points with a maximumof 3.3 purity points.Residence Time in Vertical Crystallizer
Ten pounds of a zinc tracer were injected to the inlet of aHoniron vertical crystallizer. A plot of the zinc concentration inthe massecuite leaving the vertical crystallizer is shown in Figure21. The plot indicates severe channeling, because the peak tracerconcentration was reached in less than 3 hours while the nominalresidence time in the crystallizer was 15 hours.
Modeling Adsorption of Cane Sugar JuiceColorant in Packed-bed Ion Exchangers
The removal of cane sugar solution colorant by packed-bedion exchangers was modeled using a linear driving force adsorp-tion model. Adsorption of colorant is a complex subject, since coloris an indiscrete mixture of many components, making it difficult tomeasure and even more challenging to model. Gel PermeationChromatography (GPC) was used as a tool to measure color ofpseudo-components and was found to be particularly useful be-cause it allows the components to behave differently in a processmodel. Three resins were investigated: a strong acid cation (SAC),a weak-base anion (WBA) and a standard sugar industry strong-base anion decolorizing resin. Batch testing of the resins producedlinear isotherms, indicating that the colorant is dilute.

Audubon Sugar Institute Annual Report 2002-2003 15
Results from column testing showed that a plug-flow modelwith a constant linear isotherm was sufficient in all cases exceptthe SAC resin. The SAC showed particularly interesting dynamics,which are illustrated for component D in Figure 22. The SAC ad-sorption parameter decreased sharply as the pH increased, causingcolorant to be desorbed from the resin. Affinity of colorants forthis resin is seriously affected by pH. As the pH increases, the ad-sorption parameter decreases greatly, causing some components toelute from the column and others to be retained less strongly bythe resin. This situation must be avoided if optimal decolorizationis to be achieved.
Deconvolution of GPC Chromatogramsof Sugar Solutions
Chromatography is a multi-component separation methodbased on differential migration of components through a packedcolumn. Gel Permeation Chromatography (GPC) is a separationprocess based on molecular size. GPC of sugar solutions using re-fractive index (RI) and ultraviolet-visible (UV) detectors yieldschromatograms containing overlapping peaks. Further separationor deconvolution may be performed using a mathematical treat-
region. Deconvolution at 420 nm was able to quantify only twocomponents because insufficient separation was achieved in theGPC columns. At this wavelength, the different colored speciesbehave similarly, making it impossible to split the chromatogramup into more components. The UV region shows significant ben-efits over the visible region owing to the greater absorption of en-ergy:
Better separation Smoother baseline More components
Figures 23 and 24 show the regressed components at 300 nmand the comparison of measured and regressed data.
The retention time data obtained from the regressions may becompared to determine similarities between the peaks (Table 10).From this table it is clear that there is some correlation among allthe chromatograms. Since RI detects quantity and not color of dif-ferent molecular weight species, the absence of an RI peak corre-sponding to an absorbance peak could represent a small quantityof high intensity colorant. Likewise the absence of an absorbancepeak corresponding to an RI peak could represent material withzero color.
Figure 23. Regression of UV 300nm chromatogramswith eight Gaussian profiles.
Figure 24. Comparison of regressed and measuredUV 300nm data (r2 = 0.9944).
ment after the GPC analysis by representing the chromatogram asa number of Gaussian distributions. A deconvolution techniqueusing nonlinear least-squares optimization was developed that al-lows for accurate quantification of GPC chromatograms.
Parameters of the distributions were obtained using a step-wise nonlinear optimization routine. The method is a mathemati-cal separation that creates quantitative information on particularcomponents that can be examined to investigate the effects of unitoperations on high molecular weight material.
Absorbance chromatograms are typically measured at 420 nmin the visible region of the spectrum or at some point in the UV
Figure 22. A typical SAC breakthrough curve.
Table 10. Regressed retention times (min).
Peak Number
Sample 1 2 3 4 5 6 7 8 9 10
RI 12.53 13.91 16.54 17.75 18.60 19.38 20.78
254nm 16.34 17.72 18.68 20.11 21.22 22.68 23.67
300nm 14.06 16.29 17.14 17.78 18.55 19.80 21.29 22.87
420nm 17.42 20.61
16 Audubon Sugar Institute Annual Report 2002-2003
Effects of Dextranon Pol/Sucrose Measurements
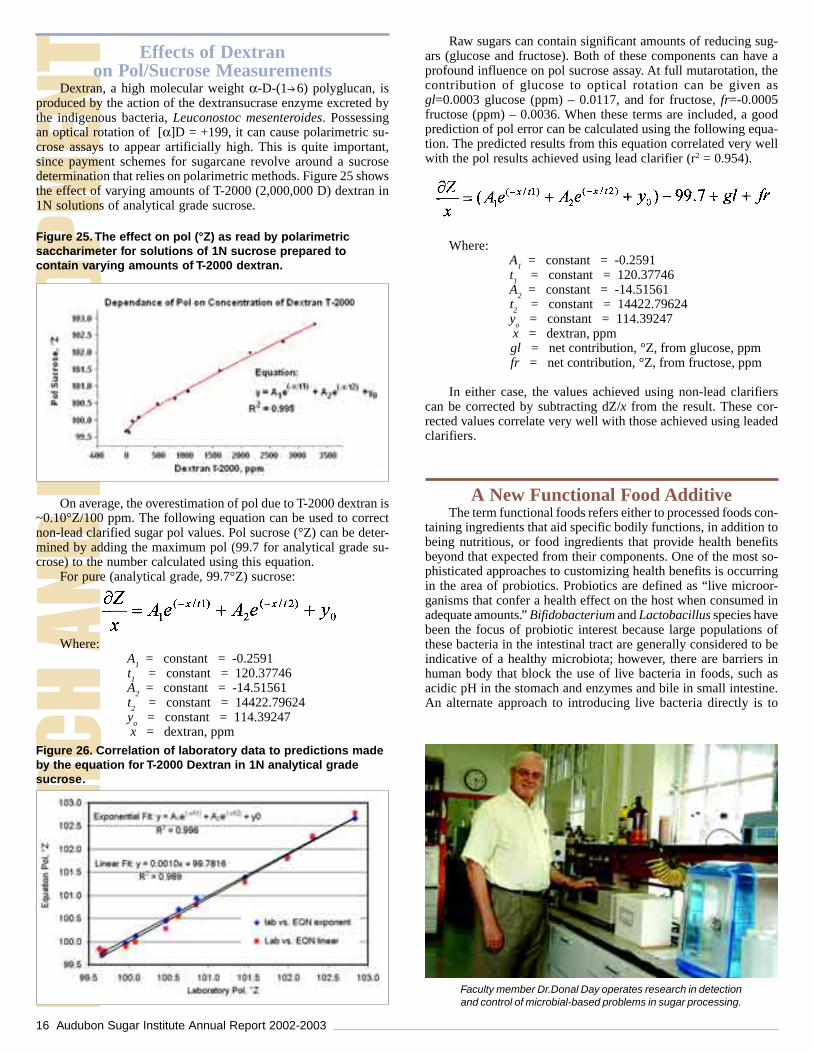
Dextran, a high molecular weight α-D-(1 6) polyglucan, isproduced by the action of the dextransucrase enzyme excreted bythe indigenous bacteria, Leuconostoc mesenteroides. Possessingan optical rotation of [α]D = +199, it can cause polarimetric su-crose assays to appear artificially high. This is quite important,since payment schemes for sugarcane revolve around a sucrosedetermination that relies on polarimetric methods. Figure 25 showsthe effect of varying amounts of T-2000 (2,000,000 D) dextran in1N solutions of analytical grade sucrose.
Where: A
1 = constant = -0.2591
t1 = constant = 120.37746
A2 = constant = -14.51561
t2 = constant = 14422.79624
yo = constant = 114.39247
x = dextran, ppm gl = net contribution, °Z, from glucose, ppm fr = net contribution, °Z, from fructose, ppm
In either case, the values achieved using non-lead clarifierscan be corrected by subtracting dZ/x from the result. These cor-rected values correlate very well with those achieved using leadedclarifiers.
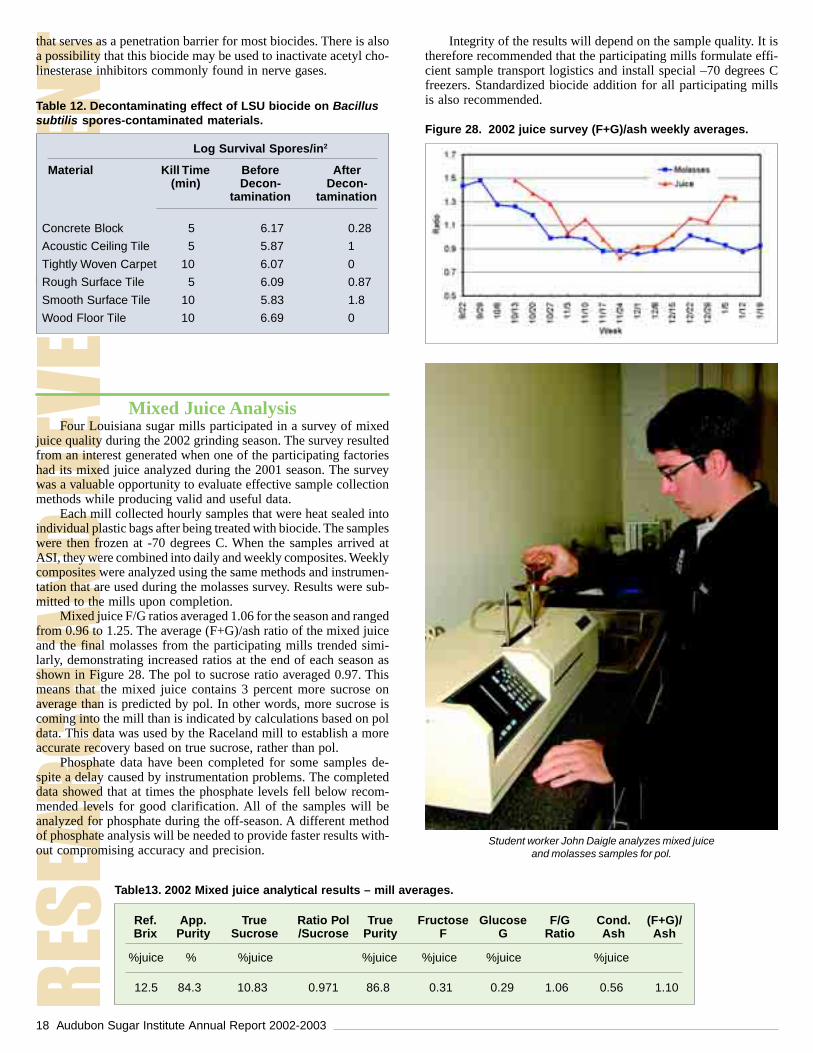
Raw sugars can contain significant amounts of reducing sug-ars (glucose and fructose). Both of these components can have aprofound influence on pol sucrose assay. At full mutarotation, thecontribution of glucose to optical rotation can be given asgl=0.0003 glucose (ppm) – 0.0117, and for fructose, fr=-0.0005fructose (ppm) – 0.0036. When these terms are included, a goodprediction of pol error can be calculated using the following equa-tion. The predicted results from this equation correlated very wellwith the pol results achieved using lead clarifier (r2 = 0.954).
Figure 26. Correlation of laboratory data to predictions madeby the equation for T-2000 Dextran in 1N analytical gradesucrose.
Where: A
1 = constant = -0.2591
t1 = constant = 120.37746
A2 = constant = -14.51561
t2 = constant = 14422.79624
yo = constant = 114.39247
x = dextran, ppm
On average, the overestimation of pol due to T-2000 dextran is~0.10°Z/100 ppm. The following equation can be used to correctnon-lead clarified sugar pol values. Pol sucrose (°Z) can be deter-mined by adding the maximum pol (99.7 for analytical grade su-crose) to the number calculated using this equation.
For pure (analytical grade, 99.7°Z) sucrose:
Figure 25. The effect on pol (°Z) as read by polarimetricsaccharimeter for solutions of 1N sucrose prepared tocontain varying amounts of T-2000 dextran.
A New Functional Food AdditiveThe term functional foods refers either to processed foods con-
taining ingredients that aid specific bodily functions, in addition tobeing nutritious, or food ingredients that provide health benefitsbeyond that expected from their components. One of the most so-phisticated approaches to customizing health benefits is occurringin the area of probiotics. Probiotics are defined as “live microor-ganisms that confer a health effect on the host when consumed inadequate amounts.” Bifidobacterium and Lactobacillus species havebeen the focus of probiotic interest because large populations ofthese bacteria in the intestinal tract are generally considered to beindicative of a healthy microbiota; however, there are barriers inhuman body that block the use of live bacteria in foods, such asacidic pH in the stomach and enzymes and bile in small intestine.An alternate approach to introducing live bacteria directly is to
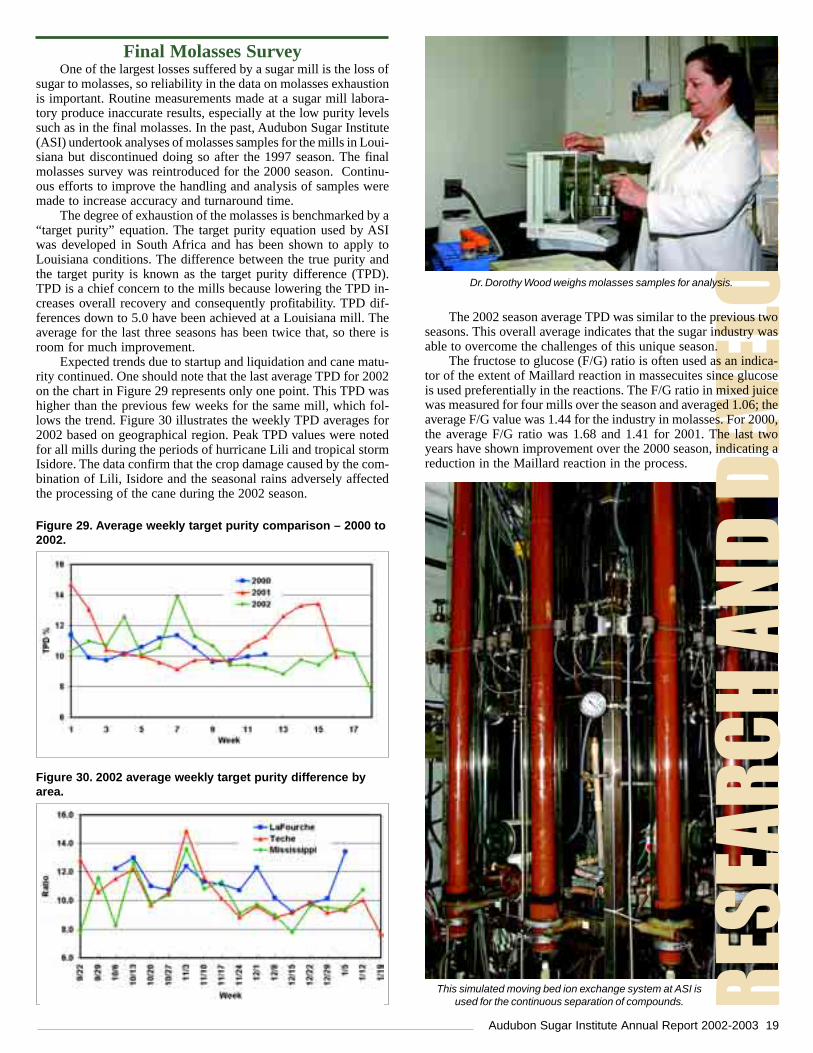
Faculty member Dr.Donal Day operates research in detectionand control of microbial-based problems in sugar processing.

Audubon Sugar Institute Annual Report 2002-2003 17
increase the number of Bifidobacteria and Lactobacilli in the in-testinal microbiota through the use of prebiotics. Prebiotics arenondigestible dietary components that pass through the digestivetract to the colon and selectively stimulate proliferation and/or ac-tivity of populations of desirable bacteria in situ.
Use of a chain shortening acceptor and a microbial strain thatprimarily produces highly branched polymers resulted in produc-tion of selected α-glucooligosaccharides from sucrose. These oli-gosaccharides were branched polymers between DP 2 and 8 in size.The branches were single glucose molecules in length. Oligosac-charides synthesized by this bacterium had α-1,6 backbone withα-1,3 and/or α-1,4-branched side chains. The oligosaccharide yieldwas 90 percent of the theoretical yield oligosaccharides. The fer-mentation was essentially complete in 24 hours. The productionrate was about 0.9 g/L hour. Changing the acceptor to carbon sourceratio altered the relative proportion of different size oligosaccha-rides produced by the fermentation. Concentration after mannitolremoval produced a clear syrup containing primarily oligosaccha-rides. The fructose portion of the sucrose molecule was convertedto mannitol during the course of the fermentation. Upon concen-tration and cooling, the mannitol crystallized from solution andwas recovered as a 99.99 percent pure product. The weight conver-sion was 60:40 in favor of oligosaccharides. Less than 5 percent ofother products was produced in this process.
Growth of S. typhimurium or E. coli on these oligosaccharideswas less than 40 percent of the growth on an equivalent amount ofglucose and similar to growth on commercial fructooligosaccha-rides. The bacteria Lactobacillus johnsonii and B. longum showedno difference in growth rate on glucose or the oligosaccharide prepa-rations. When L. johnsonii and S. typhimurium were grown togetheron the oligosaccharide preparations, the oligomers stimulated thegrowth of the Lactobacillus but were not readily used by the patho-genic organism. It appears that these oligosaccharides are used pref-erentially by probiotic strains.
Use of these oligosaccharides as prebiotics should lead to theproduction of intestinal lactic acid, increases in short-chain fattyacid production and lower pH’s in large intestines. With appropri-ate application, they may be useful food additives to help preventestablishment of pathogenic organisms. Similar effects have beenseen in studies on the effect of fructooligosaccharides in feed trialswith broilers. Oligosaccharides reduced the susceptibility to Sal-monella colonization of the intestine of chickens, increasedBifidobacterium levels and reduction in the level of Salmonellapresent in the caecum. Our studies do not allow direct predictionof “in vivo” effects but indicate that this type of oligomer can be aprebiotic for intestinal microflora.
Figure 27. Mannitol, crude nutraceutical and purifiednutraceutical produced from sucrose. Biocide Study
A simple and fast-acting biocide has been developed atAudubon Sugar Institute that is both bactericidal and sporicidalagainst a wide range of pathogenic microorganisms including po-tential bioterrorism agents such as Bacillus anthracis, the caus-ative agent of anthrax. The two compounds that make up this bio-cide are both user and environmental friendly and are approved bythe United States Food and Drug Administration.
Potential uses of this biocide as a disinfecting and/or decon-taminating agent are endless. Raw chicken is a significant sourceof the bacterial pathogens Escherichia coli and Salmonella. Poul-try processing for consumption presents many opportunities inwhich carcasses and other raw products can become newly con-taminated or cross contaminated with these microorganisms. Sal-monella and E. coli infections have been linked to poultry and meatsin several foodborne illness outbreaks, primarily because of theconsumption of raw or undercooked products. Table 11 shows theeffectiveness of LSU biocide in achieving several microbial logreductions in contaminated raw poultry during the chillingprocess.
In response to growing concerns of domestic terrorism, theLSU biocide was tested as a potential decontaminating agent againstseveral office materials previously contaminated with Bacillussubtilis (an anthrax stimulant). The current recommendation forBacillus anthracis spore disinfection is 15 percent bleach for acontact time of an hour, or use of glutaraldehyde or formaldehyde.A contact time of only 5 to10 minutes for LSU biocide is needed toachieve several log reductions of spore-contaminated surface of-fice materials. In addition, the biocide is also effective against mi-croorganisms entrapped within biofilms, a polysaccharide matrix
Log Survival Cells/Whole Chicken
Control 5.69 3 5.87
Chilled Water 5.69 3.09 6.09
LSU Biocide <1 <1 <1
Treatment Escherichia coli Salmonella spp. TPC*
*Total microbial count.
Table 11. Microbial killing effect of LSU biocide on rawpoultry.
Graduate student Giovanna Dequeiroz measures light absorbanceof samples using a UV/Vis spectrophotometer.
18 Audubon Sugar Institute Annual Report 2002-2003
that serves as a penetration barrier for most biocides. There is alsoa possibility that this biocide may be used to inactivate acetyl cho-linesterase inhibitors commonly found in nerve gases.
Table 12. Decontaminating effect of LSU biocide on Bacillussubtilis spores-contaminated materials.
Mixed Juice AnalysisFour Louisiana sugar mills participated in a survey of mixed
juice quality during the 2002 grinding season. The survey resultedfrom an interest generated when one of the participating factorieshad its mixed juice analyzed during the 2001 season. The surveywas a valuable opportunity to evaluate effective sample collectionmethods while producing valid and useful data.
Each mill collected hourly samples that were heat sealed intoindividual plastic bags after being treated with biocide. The sampleswere then frozen at -70 degrees C. When the samples arrived atASI, they were combined into daily and weekly composites. Weeklycomposites were analyzed using the same methods and instrumen-tation that are used during the molasses survey. Results were sub-mitted to the mills upon completion.
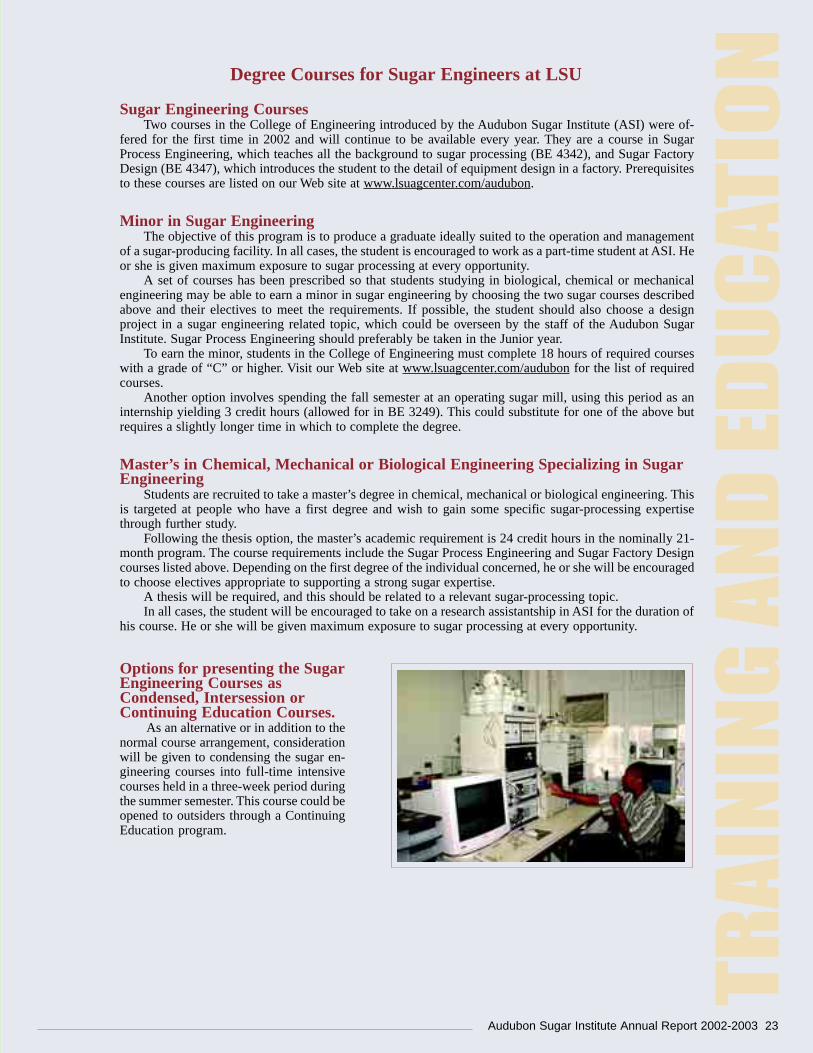
Mixed juice F/G ratios averaged 1.06 for the season and rangedfrom 0.96 to 1.25. The average (F+G)/ash ratio of the mixed juiceand the final molasses from the participating mills trended simi-larly, demonstrating increased ratios at the end of each season asshown in Figure 28. The pol to sucrose ratio averaged 0.97. Thismeans that the mixed juice contains 3 percent more sucrose onaverage than is predicted by pol. In other words, more sucrose iscoming into the mill than is indicated by calculations based on poldata. This data was used by the Raceland mill to establish a moreaccurate recovery based on true sucrose, rather than pol.
Phosphate data have been completed for some samples de-spite a delay caused by instrumentation problems. The completeddata showed that at times the phosphate levels fell below recom-mended levels for good clarification. All of the samples will beanalyzed for phosphate during the off-season. A different methodof phosphate analysis will be needed to provide faster results with-out compromising accuracy and precision.
Table13. 2002 Mixed juice analytical results – mill averages.
Ref. App. True Ratio Pol True Fructose Glucose F/G Cond. (F+G)/Brix Purity Sucrose /Sucrose Purity F G Ratio Ash Ash
%juice % %juice %juice %juice %juice %juice
12.5 84.3 10.83 0.971 86.8 0.31 0.29 1.06 0.56 1.10
Figure 28. 2002 juice survey (F+G)/ash weekly averages.
Integrity of the results will depend on the sample quality. It istherefore recommended that the participating mills formulate effi-cient sample transport logistics and install special –70 degrees Cfreezers. Standardized biocide addition for all participating millsis also recommended.
Student worker John Daigle analyzes mixed juiceand molasses samples for pol.
Log Survival Spores/in2
Concrete Block 5 6.17 0.28
Acoustic Ceiling Tile 5 5.87 1
Tightly Woven Carpet 10 6.07 0
Rough Surface Tile 5 6.09 0.87
Smooth Surface Tile 10 5.83 1.8
Wood Floor Tile 10 6.69 0
Material Kill Time Before After(min) Decon- Decon-
tamination tamination
Audubon Sugar Institute Annual Report 2002-2003 19
Final Molasses SurveyOne of the largest losses suffered by a sugar mill is the loss of
sugar to molasses, so reliability in the data on molasses exhaustionis important. Routine measurements made at a sugar mill labora-tory produce inaccurate results, especially at the low purity levelssuch as in the final molasses. In the past, Audubon Sugar Institute(ASI) undertook analyses of molasses samples for the mills in Loui-siana but discontinued doing so after the 1997 season. The finalmolasses survey was reintroduced for the 2000 season. Continu-ous efforts to improve the handling and analysis of samples weremade to increase accuracy and turnaround time.
The degree of exhaustion of the molasses is benchmarked by a“target purity” equation. The target purity equation used by ASIwas developed in South Africa and has been shown to apply toLouisiana conditions. The difference between the true purity andthe target purity is known as the target purity difference (TPD).TPD is a chief concern to the mills because lowering the TPD in-creases overall recovery and consequently profitability. TPD dif-ferences down to 5.0 have been achieved at a Louisiana mill. Theaverage for the last three seasons has been twice that, so there isroom for much improvement.
Expected trends due to startup and liquidation and cane matu-rity continued. One should note that the last average TPD for 2002on the chart in Figure 29 represents only one point. This TPD washigher than the previous few weeks for the same mill, which fol-lows the trend. Figure 30 illustrates the weekly TPD averages for2002 based on geographical region. Peak TPD values were notedfor all mills during the periods of hurricane Lili and tropical stormIsidore. The data confirm that the crop damage caused by the com-bination of Lili, Isidore and the seasonal rains adversely affectedthe processing of the cane during the 2002 season.
Figure 29. Average weekly target purity comparison – 2000 to2002.
Figure 30. 2002 average weekly target purity difference byarea.
This simulated moving bed ion exchange system at ASI isused for the continuous separation of compounds.
Dr. Dorothy Wood weighs molasses samples for analysis.
The 2002 season average TPD was similar to the previous twoseasons. This overall average indicates that the sugar industry wasable to overcome the challenges of this unique season.
The fructose to glucose (F/G) ratio is often used as an indica-tor of the extent of Maillard reaction in massecuites since glucoseis used preferentially in the reactions. The F/G ratio in mixed juicewas measured for four mills over the season and averaged 1.06; theaverage F/G value was 1.44 for the industry in molasses. For 2000,the average F/G ratio was 1.68 and 1.41 for 2001. The last twoyears have shown improvement over the 2000 season, indicating areduction in the Maillard reaction in the process.

20 Audubon Sugar Institute Annual Report 2002-2003
Bagasse Ash ContentAsh percent bagasse was determined for sev-
eral factories that experienced poor boiler perfor-mance. The ash content of the bagasse was unusu-ally high this year as a result of Hurricane Lili andheavy rains.
Boiler TestsBoiler efficiency tests were performed at sev-
eral factories where natural gas consumption wasmuch higher than normal. Boiler emission testswere monitored at one factory that installed a newboiler for the 2002 crop.
Extension Work
Pan CirculationsDesigns for steam-assisted circulation in pans
(jigger steam) were undertaken for some mills ex-periencing boiling problems.
Cane Quality Payment SystemAudubon continued to be involved in various
industry and other group discussions on options fora new cane payment system that will encouragegreater productivity in the Louisiana sugar industry.
Preparation Index and Milling TestsThe preparation index and the extraction
achieved at each mill in the tandem were determinedat two factories during the season.
Core Lab ProceduresSeveral factories requested help in standardiz-
ing core lab procedures. Inadequate drying of theresidue samples was the primary problem noted thisyear.
Undetermined LossesHigh undetermined losses were investigated at
a few factories. Low juice pH’s and the ditching ofmud and/or entrainment of filtrate juices, as a re-sult of high mud volumes this year, were the pri-mary causes of the high undetermined losses.
Cold Tolerance TestsThe rate of deterioration of various cane vari-
eties following the freeze in January was monitoredin collaboration with LSU AgCenter Extension andUSDA personnel.
Automatic Pan ControlsAudubon assisted in the specification of a new
automatic pan boiling system at St. James and as-sisted in its evaluation.
Alcohol ProductionA proposal for the production of alcohol at a
Louisiana sugar mill was undertaken.
Handling of High Brix C MassecuitesAdvice was given to some of the mills on modi-
fications necessary to handle high Brix Cmassecuites, a prerequisite for good molasses ex-haustion.
Clarifier ModificationsModifications necessary to improve the per-
formance of Dorr clarifiers by changing juiceofftakes were recommended for two mills.
20 Audubon Sugar Institute Annual Report 2002-2003

Audubon Sugar Institute Annual Report 2002-2003 21
Audubon Sugar Institute Analytical Capabilities
In 2002, Audubon Sugar Institute (ASI) continued to invest significantly in time and money to improveits analytical capabilities. New and used equipment was either purchased or received as gifts. New and usedinstruments were funded by grants. Personnel attended training seminars on the use of analytical equipmentand software. Existing analytical instruments were also upgraded and automated. Through this continuouseffort, ASI has further improved both the accuracy and the capacity of its analytical laboratories.
ASI now has seven operational HPLC systems. Three units are ion chromatography units, one set up forcation analyses and the other two for anion analyses including organic acids. One unit is a GPC unit fordextran analyses with both a UV-Visible and a Refractive Index detector. ASI also has an ion exchangechromatography unit used for alcohol, sugar and oligosaccharide analyses. One HPLC is used for routinesugar analyses on juice, syrup and molasses and other process samples. This unit has been upgraded with anew refractive index detector for improved accuracy and reliability. Another HPLC is set up for sugar analy-ses directed toward a specific project and is essentially dedicated to that project.
Other instrumentation includes a refractometer with 0.01 Brix resolution and temperature compensa-tion capabilities, a new polarimeter with 0.01 degree Z resolution and both 589 and 880 wavelength forsucrose by polarization and a conductivity meter with temperature compensation for conductivity ash. A gaschromatograph has been purchased and installed; it has been used mainly in analyses of alcohols.
ASI purchased a Near-Infrared Transmittance Spectrophotometer. All final molasses survey samples forthe last three seasons have been analyzed on this instrument, and conventional analyses will be completed onthese samples. Data will be used in creating a calibration for Louisiana molasses. Also mixed juice samplesfrom four mills were collected and will be used to develop a calibration for Louisiana mixed juice.
ASI has been able to acquire, in the last few years, several new analytical instruments. Included in thesepurchases are both a new refractometer and a new polarimeter. Some of the remaining analytical equipmentis dated, but is capable of producing good results. The personnel in place have the talents and abilities tomaintain and operate the equipment to get the most out of it.
Overall, significant improvements have been made to increase the capability and accuracy of the analy-ses that ASI conducts. ASI is embracing new technologies to improve the efficiency in all areas, includingthe analytical capabilities.
Audubon Sugar Institute Annual Report 2002-2003 21

22 Audubon Sugar Institute Annual Report 2002-2003
Six short courses were presented at AudubonSugar Institute in 2002. The courses were offeredto increase knowledge in the sugar industry, andthey qualify for Continuing Professional Develop-ment for registered professional engineers. Onenew course was added in 2002, and some of theclasses from the previous year were revised andupdated.
An innovation introduced this year was theholding of a course given by international expertsfrom outside the USA. The course on Boiler De-sign and Operations was presented by NormanMagasiner of South Africa and Dr. Mike Inkson ofthe United Kingdom and drew 24 delegates.
All courses offered at Audubon Sugar Insti-tute are available online on our Web site atwww.lsuagcenter.com/audubon
Introduction to the Technology ofSugar Production – Two days
This course provided a non-technical overviewof the important aspects of sugar production. Theoverview introduced issues that affect capacity andcosts and the factors that reduce losses and improvequality.
Technology Refresher-Improving RawSugar Factory Operations andProfitability – Two days
This new course was developed for individu-als who are involved in the operation or the designof raw sugar mills to enhance their technical skillsand get up to date with important issues that affectthe efficiency and profitability of raw cane sugarproduction.
LSU AgCenter, Audubon Sugar Institute Short Courses
Boiler Design and Operation –Two days
This class was designed for engineers involvedin running a sugar factory or project engineers as-sociated with the industry. The course provided anunderstanding of modern boiler and co-generationtechnology.
Continuous Vacuum Pan Boiling –One day
This course provided a detailed understandingof continuous pan boiling and how it compares withbatch processing. It was intended for factory op-erations personnel and those involved in the de-sign and planning of factory modifications and ex-pansions.
Vacuum Pan Instrumentation andControl – One day
The main objective of this course was to pro-vide a good understanding of the practical prin-ciples of automatic control of vacuum pans and tomaximize the performance and capacity of the panstation.
Introductory Sugar Boiling –Three days
This class offered individuals with little or noexperience in sugar boiling an overview of the sugarboiling process. It not only provided an understand-ing of the principles involved but also taught howto boil pans and allowed hands-on trials in makingsugar at ASI’s pilot plant.
22 Audubon Sugar Institute Annual Report 2002-2003
Audubon Sugar Institute Annual Report 2002-2003 23
Sugar Engineering CoursesTwo courses in the College of Engineering introduced by the Audubon Sugar Institute (ASI) were of-
fered for the first time in 2002 and will continue to be available every year. They are a course in SugarProcess Engineering, which teaches all the background to sugar processing (BE 4342), and Sugar FactoryDesign (BE 4347), which introduces the student to the detail of equipment design in a factory. Prerequisitesto these courses are listed on our Web site at www.lsuagcenter.com/audubon.
Minor in Sugar EngineeringThe objective of this program is to produce a graduate ideally suited to the operation and management
of a sugar-producing facility. In all cases, the student is encouraged to work as a part-time student at ASI. Heor she is given maximum exposure to sugar processing at every opportunity.
A set of courses has been prescribed so that students studying in biological, chemical or mechanicalengineering may be able to earn a minor in sugar engineering by choosing the two sugar courses describedabove and their electives to meet the requirements. If possible, the student should also choose a designproject in a sugar engineering related topic, which could be overseen by the staff of the Audubon SugarInstitute. Sugar Process Engineering should preferably be taken in the Junior year.
To earn the minor, students in the College of Engineering must complete 18 hours of required courseswith a grade of “C” or higher. Visit our Web site at www.lsuagcenter.com/audubon for the list of requiredcourses.
Another option involves spending the fall semester at an operating sugar mill, using this period as aninternship yielding 3 credit hours (allowed for in BE 3249). This could substitute for one of the above butrequires a slightly longer time in which to complete the degree.
Master’s in Chemical, Mechanical or Biological Engineering Specializing in SugarEngineering
Students are recruited to take a master’s degree in chemical, mechanical or biological engineering. Thisis targeted at people who have a first degree and wish to gain some specific sugar-processing expertisethrough further study.
Following the thesis option, the master’s academic requirement is 24 credit hours in the nominally 21-month program. The course requirements include the Sugar Process Engineering and Sugar Factory Designcourses listed above. Depending on the first degree of the individual concerned, he or she will be encouragedto choose electives appropriate to supporting a strong sugar expertise.
A thesis will be required, and this should be related to a relevant sugar-processing topic.In all cases, the student will be encouraged to take on a research assistantship in ASI for the duration of
his course. He or she will be given maximum exposure to sugar processing at every opportunity.
Degree Courses for Sugar Engineers at LSU
Options for presenting the SugarEngineering Courses asCondensed, Intersession orContinuing Education Courses.
As an alternative or in addition to thenormal course arrangement, considerationwill be given to condensing the sugar en-gineering courses into full-time intensivecourses held in a three-week period duringthe summer semester. This course could beopened to outsiders through a ContinuingEducation program.
Audubon Sugar Institute Annual Report 2002-2003 23
24 Audubon Sugar Institute Annual Report 2002-2003
The Audubon Sugar Institute Library has more than 2,200 books and is still growing. It is agreat research resource for the department and many related to the sugar industry. Thetheses cataloged here have doubled in the past year. In addition to the books, ASI hasmany professional sugar periodicals from local and international sources such as TheSugar Bulletin, ZuckerIndustrie, Louisiana Sugar Journal and International Sugar Journal.
Library
PublicationsBroadhurst, H.A., and Rein, P.W. (2002). Characterization of Colorants Produced in CaneSugar Processing. SPRI Conference, 292-310.
Broadhurst, H.A., Rein, P.W. (2003). Deconvolution of GPC Chromatograms of SugarSolutions. ZuckerIndustrie. 127, 2: 96-99.
Broadhurst, H. A. and Rein, P.W. (2003). Modeling Adsorption of Cane Sugar SolutionColorant in Packed-bed Ion Exchange. AIChE. Journal. in press.
Day, D.F., Chung, C.H. (2002). Glucooligosaccharides from Leuconostoc mesenteroidesB-742 (ATCC 13146): a potential prebiotic. Industial Microbiol and Biotechnol. 29: 196-199.
Day, D.F., Chung, C.H. (2002). Probiotics from Sucrose, 102nd Annual Meeting AmericanSociety for Microbiology. Salt Lake City, May 19-23.
Day, D.F., Cuddihy, J., Rauh, J. (2002). Versatility of the Antibody Dextran Test Method.ASSCT. Amelia Island Plantation, Florida, June 26-28.
Day, D.F., Kampen, W.H. (2002). Organic Acids in the Sugar Factory Environment. ASSCT.Amelia Island Plantation, Florida, June 26-28.
Day, D.F., Yoo, S.K., Kyun, Sun and Kim, D. (2001). Co-Production of Dextran and Mannitolby Leuconostoc Mesenteriodes. Microbiology and Biotechnology, 11: 880-883.
Day, D.F., and Yoo, S.K. (2003). Bacterial Metabolism of X- and B-Pinene and RelatedMonoterpenes by Pseudomonas sp. Strain PIN. Process Biochemistry, in press.
Day, D. F., Ott, C. M., Mayo, J.A., Kim, K. (2003) A Multi-Component Safe BiocidalComplex, US Patent filed August 24, 1999.
Day, D.F. (2003) Methods of Dextran Analysis, Sugar Bulletin, 81,7: 15-16.
Endres, T, Muzzell, D., Rein, P.W., White, B. (2003) Measurement of Recoveries andLosses at Raceland Mill. ASSCT. Baton Rouge, La.

Audubon Sugar Institute Annual Report 2002-2003 25
Kampen, W.H. (2002). Biorefinery and Sugarcane. Louisiana Agriculture. 45, 4: 28-29.
Kampen, W.H. (2002). Improved Removal of Evaporator Scale. Sugar Bulletin. 80, 11: 15.
Kampen, W.H. (2003). The Biorefinery. Int. Sugar J. in press.
Kampen, W. H., D. F. Day. (2003). Organic Acids (+). Annual Meeting ASSCT, LouisianaDivision, Baton Rouge, La.
Losso,J.n., Ogawa, M., Moody, M., Portier, R.J., McMillin, K.W., Day, D.F., Bell, J.,Schexnayder, M. (2002) Protamine and Collagen. Two Value-added Products at LouisianaSeafood Processing Facilities. Louisiana Agriculture. 45, 4: 11-12.
Madsen II, L., Rein, P.W., and White, B. (2003). Evaluation of a Near Infrared Spectro-meter for the Direct Analysis of Sugar Cane. Am. Soc. of Sugar Cane Technol. 23, 80-92.
Rein, P.W. (2003) The importance of Achieving a High Crystal Content in High GradeMassecuites. Sugar Bulletin. 81, 8: 12-17.
Rein, P.W. and Kampen, W. (2002). Evaporators in Cane Sugar Mills. Sugar Journal. 65,2: 18-21.
Rein, P.W. (2002). The Optimum pH for Juice Clarification. Sugar Bulletin. 80, 12:17-19.
Rein, P.W. (2002). Education and Training in Sugar Process Engineering. Sugar Bulletin.80, 7:11-15.
Rein, P.W. (2002). Energy Conservation from Cane Yard to Extraction Plant. ISSCTEngineering Workshop. Berlin, Germany.
Rein, P.W. (2002). Aspects of Louisiana Sugar Industry of Interest to South AfricanTechnologists. Proc. S. Afr. Sugar Technol. Ass. Conf. 76: 36-41.
Rein, P.W. (2003). Education and Training at the Audubon Sugar Institute. Int. Sugar J.105, 1249: 20.
Rein, P.W. (2002). ISSCT Engineering Workshop on Energy Management in Raw CaneSugar Factories. Sugar Journal. 65, 6: 22-24.
Rein, P.W. (2002). The Effects of Soil in Cane Delivered to the Mill and Options for DealingWith It. Sugar Bulletin. 81, 1: 13-15.
Rein, P.W. (2002). Planning Ahead for the Next Grinding Season, Sugar Bulletin. 81, 4: 18-19.
Saska, M., Rousset, F., Theoleyre, M., Gula, F. (2003) Raffinate Regeneration of Ion-Exchange Softeners in the Beet Sugar Industry. ASSBT, San Antonio, Tx.
Saska, M., Chen, F. (2002) Process for the Separation of Sugars. US Patent. US 6, 451,123B1, Sep 17.
Saska, M. (2002) Boiling Point Elevation of Technical Sugarcane Solutions and its Use inAutomatic Pan Boiling. Int. Sugar J. 104,1247: 500-507.
Saska, M. (2003) Hard to Boil Massecuites. ASSCT Conference Baton Rouge, La.
Saska, M. and Rein, P. W. (2001). Supersaturation and Crystal Content Control in VacuumPans. Proceedings of the Sugar Industry Technologists, Inc., 251-261.
Saska, M., Godshall, M. A., and Day, D. F. (2002). Dextran Analysis With Polarimetric andImmunological Roberts’ and Haze Methods. SPRI Conference, New Orleans, La., 411-417.
Saska, M. and Kampen, W.H. (2002). Value-Added products from corn ethanol stillageand corn steep liquor. Corn Utilization & Technol. Conf. June. Kansas City, Missouri.
Saska, M. and Chou, Chung C. (2002). Antioxidant Properties of Sugarcane Extracts.Proc. 1st Biannual World Conf. on Recent Developments in Sugar Technol.
Saska, M. (2002). Comments on Juice Clarification Practice in Louisiana. Sugar Bulletin,81, 2: 12-13.
Walker, T.H., Drapcho, C.M., Day, D.F. (2002). Bioconversion of Processing Byproductsand Wastes. Louisiana Agriculture. 45, 4:26-27

26 Audubon Sugar Institute Annual Report 2002-2003
Faculty and StaffAdministrative StaffDr. Peter Rein, Professor and Head –BSc. andMSc. Chemical Engineering (University of CapeTown, South Africa), PhD. Chemical Engineering(University of Natal, South Africa)Liz Thompson, University AdministrativeSpecialist –B.S. Business Administration (IndianaInstitute of Technology)Lisa Lindsay, Secretary – B.A. Spanish (Louisi-ana State University)Luke Theriot, Research Associate Specialist –B.S. Agribusiness (Louisiana State University),M.S. Ag Economics (Louisiana State University)
Analytical LabBrian White, Research Associate –AnalyticalChemist –B.S. Chemistry (Freed-HardemanUniversity)Dr. Dorothy Wood, Post-doctoral Researcher –B.S. Chemistry (University of Florida), PhD.Chemistry (Louisiana State University)Lee Madsen, Research Associate – B.S. Chemis-try (Louisiana State University)John Daigle, Student Worker – B.S. Biology(Nicholls State University)
Factory StaffJoe Bell, Research Associate – Factory Manager– B.S. Mechanical Engineering (Louisiana StateUniversity)Scott Barrow, Research Associate – Electronics/Instrumentation Engineer – B.S. General Studies(Alpena Community College)Lamar Aillet, Maintenance ForemanChris Cavanaugh, Student Worker
Faculty and StaffDr. Donal Day, Professor – BSc. Biochemistry(University of New Hampshire), PhD. Microbiol-ogy (McGill University, Canada)Dr. Michael Saska, Professor – B.S. ChemicalEngineering (Prague Institute of ChemicalTechnology, Czechoslovakia), M.S. ChemicalEngineering (Louisiana State University), PhD.Chemical Engineering (Georgia Institute ofTechnology)Dr. Harold Birkett, Associate Professor – B.S.Chemical Engineering (Louisiana State Univer-sity), M.S. Chemical Engineering (LouisianaState University), PhD. Chemical Engineering(Louisiana State University)
Dr. Willem Kampen, Associate Professor – B.S.(College of Sugar Tech, Amsterdam, Holland),M.S. Chemical Engineering (Louisiana StateUniversity), PhD. Food Science (Louisiana StateUniversity)Jeanie Stein, Research Associate – B.S. PlantScience (Nicholls State University)Stuart ‘Lenn’ Goudeau, Research Associate –B.S. Industrial Technology (Louisiana StateUniversity)Niconor Reece, Graduate Assistant –B.S.Biological and Agricultural Engineering (Louisi-ana State University)Dr. Chang-Ho Chung, Post-doctoral Researcher– B.S. Food Science (Sejong University, Korea),M.S. Food Science (Sejong University, Korea),PhD. Food Science (Louisiana State University)Giovanna Dequiroz, Graduate Assistant – B.S.Food Science (Clemson University), M.S. FoodScience (Clemson University)Duwoon Kim, Graduate Assistant – B.S. FoodScience (Chonnam National University, Korea),M.S. Food Science (Louisiana State University)Luis Echeverri, Graduate Assistant – B.S.Mechanical Engineering (Universidad del Valle,Colombia)Bruce Ellis, Graduate Assistant – B.S. ChemicalEngineering (University of Natal, South Africa)David Solberg, Graduate Assistant – B.S.Chemical Engineering (University of Natal,South Africa)Nicolas Gil Zapata, Graduate Assistant – B.S.Chemical Engineering (Universidad Industrial deSantander)
Adjunct FacultyMary Godshall, SPRI –B.S. Biological Science(Louisiana State University, New Orleans), M.S.Biochemistry (University of New Orleans)Dr. Terry Walker, Department of BiologicalEngineering –B.S. Engineering Science &Mechanics (University of Tennessee), M.S.Agricultural Engineering (University of Tennes-see), PhD. Agricultural Engineering (Universityof Tennessee)
Staff ChangesDr. Willem Kampen retired as of February 2003.Luke Theriot transferred as of February 2003.Melati Tessier, Research Associate Specialist –BSc. Chemical Engineering (Louisiana StateUniversity) as of March 2003

Audubon Sugar Institute Annual Report 2002-2003 27
Representationon Technical Societies
and Research Institutes
ISSCT (International Society of Sugar CaneTechnologists)Executive Committee and Immediate PastChairman: P.W. ReinCo-Products Section Committee: D.F. DaySPRI (Sugar Processing Research Institute)P.W. Rein (Member of Board of Directors)International Sugar JournalM. Saska (Referee)American Society of Microbiology D.F. DayAmerican Society of Advancement of ScienceD.F. DaySociety for Industrial MicrobiologyD.F. DaySouthern Region Development Committee –USDAD.F. Day
Foreign Visitorsto the Institute
April 2002Luis Bento (Portugal), Pam Morel du Boil (SouthAfrica), Robert Quirk (Australia)May 2002Earle Roberts (Jamaica), Joshua Jaddoo (Ja-maica), Andree Nembhard (Jamaica), CarlosBriceño (Colombia), Norman Magasiner (SouthAfrica), Ben Misplon (South Africa), Tito Silva(Nicaragua), Dr. Mike Inkson (United Kingdom)June 2002Alex Chavarro (Colombia)July 2002Michelle Hamilton (Jamaica)September 2002Ayub Quadri (Bangladesh)October 2002Klaus Niepoth (Germany), Alvaro Amaya(Colombia)November 2002Mike Getaz (England), Gerard Journet (France)February 2003Jose Jimenez (Cuba)March 2003Tim Diringer (Germany), Mario Tremblay(Canada), Dr. David Love (South Africa)
Meetings, Conferencesand Workshops Attended
April 2002ASI Annual Conference (all staff and faculty)May 2002SIT, Ft. Lauderdale, Fla. (P.W. Rein, W. Kampen, M. Saska)June 2002ASSCT, Amelia Island, Fla. (P.W. Rein, D.F. Day, H. Birkett, B.White, D. Wood, L. Madsen, J. Stein)SunGrant Initiative, Dallas, Texas. (M. Saska)Corn Utilization & Technology Conference, Kansas City, Mo.(M. Saska)European Conf. and Tech. Exhibition on Biomass for Energy,Industry and Climate Protection, Amsterdam (W. Kampen)August 2002South African Sugar Technologists Conference (P. Rein and B.White)Int’l Cong. of Chem. & Proc. Engineering, Prague (M. Saska)FOSS NIR Users Conference, Fla. (P. Rein)October 2002ISSCT Engineering Workshop, Berlin (P. Rein)January 2003Philsurin Sugar Technology Training Program, Manila (P. Rein)February 2003ISSCT Executive Meeting, Guatemala (P. Rein)February 2003ASSBT, San Antonio, Texas. (P. Rein)February 2003ASSCT (La. Division) Baton Rouge, La. (all staff and faculty)
Dr. Stephen Clarke (left), 2002 president of SIT, presents the CrystalAward to Dr. Michael Saska at the SIT Conference held in Delray Beach,
Fla., May 2002. The award recognizes his significant contribution toadvancing the technology of the international sugar industry.
Photo courtesy of Sugar Industry Technologists Inc.

28 Audubon Sugar Institute Annual Report 2002-2003
Audubon Sugar InstituteLSU AgCenterSouth Stadium DriveBaton Rouge, LA 70803USA