audit of outdoor food advertising near perth schools
TRANSCRIPT

AUDIT OF OUTDOOR FOOD ADVERTISING NEAR PERTH SCHOOLS: BUILDING A LOCAL EVIDENCE BASE FOR CHANGE
Dr Gina Trapp, Dr Paula Hooper, Dr Lukar Thornton, Ms Joelie Mandzufas, Mr Wesley Billingham
Cancer Council WA Rapid Obesity
Policy Translation Research Project
Funded by:

2 | Company Name | Annual Report 2018
Outdoor advertising
Overall aimGenerate robust evidence describing, benchmarking and
quantifying the volume and nature of all outdoor food
advertising within a 500m radius of Perth schools
INFORMAS protocolMethodology for monitoring outdoor advertising around schools
enabling intra and inter-country comparisons
School selection64 schools (primary, secondary, K-12) across 16 Perth LGA’s
were selected using random sampling within population density
(high/low) and SES (high/low) strata
3 | Company Name | Annual Report 2018
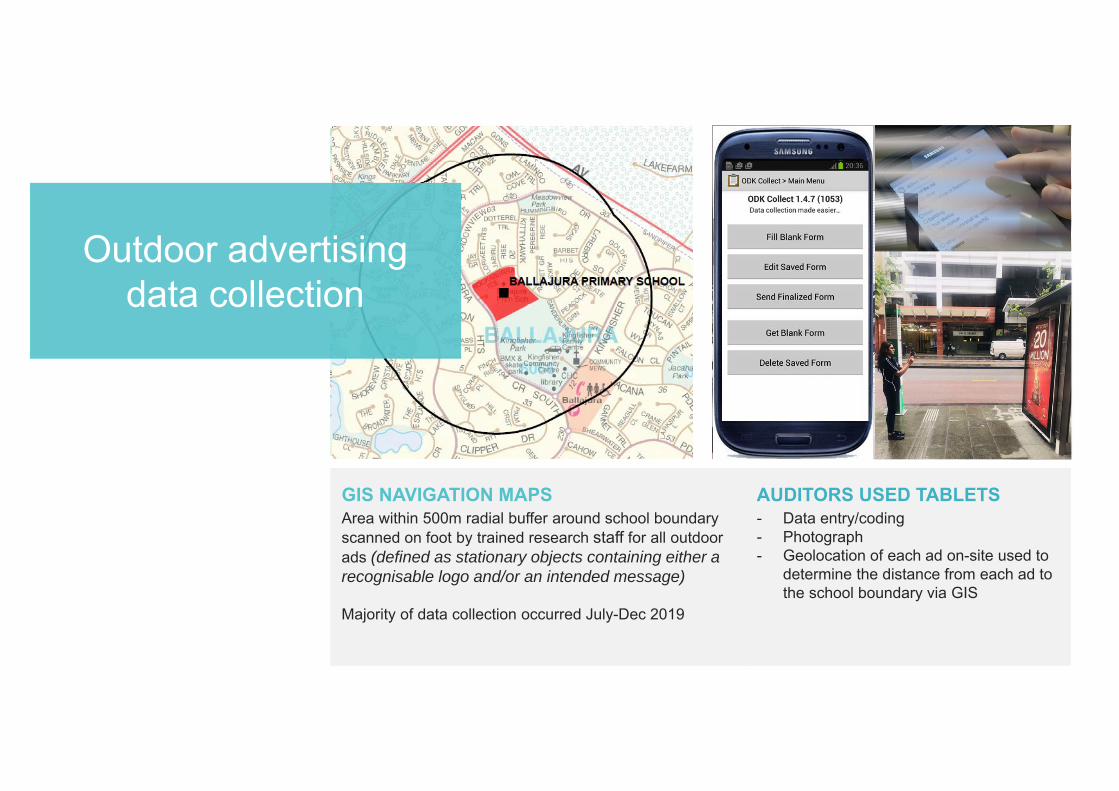
GIS NAVIGATION MAPSArea within 500m radial buffer around school boundary scanned on foot by trained research staff for all outdoor ads (defined as stationary objects containing either a recognisable logo and/or an intended message)
Majority of data collection occurred July-Dec 2019
AUDITORS USED TABLETS - Data entry/coding- Photograph- Geolocation of each ad on-site used to
determine the distance from each ad to the school boundary via GIS
Outdoor advertising data collection

4 | Company Name | Annual Report 2018
Advertisement coding - size
Small ≥A4 but <1.3m x 1.9m
Medium >1.3m x 1.9m but
<2.0m x 2.5m
Large >2.0m x 2.5m

5 | Company Name | Annual Report 2018
Advertisement coding - type
Billboard Poster/banner Free-standing
Painted Digital/LED Merchandising

6 | Company Name | Annual Report 2018
Advertisement coding – setting
Food shop Non-food shop Road
Building Bus shelter Train station

7 | Company Name | Annual Report 2018
Advertisement coding – content
FoodINFORMAS/AGTHE aligned food categories: • Core (healthy) foods recommended to meet daily nutritional req (n=11)
• Non-core (unhealthy) foods surplus to daily requirements (n=15)
• Miscellaneous foods (n=4)
• Branding only (companies/logos and brands, no products)
Non-foodRetail, entertainment and leisure, motor vehicles,
finance, communications, travel/accommodation,
media/TV/news, Government/Council

8 | Company Name | Annual Report 2018
Advertisement coding – content
Other info recorded:- Company/shop/business and/or brand
- Pictures and/or words
- Number of food products and INFORMAS/AGTHE sub-
categories depicted in each ad
- Outdoor advertising company (if applicable, e.g., APN)
Ineligibility criteria:- Real estate signs (e.g., for sale/open for inspection)
- Construction signage, fencing or screening
- On-premise signage imparting info only (e.g., name, contact
details, logo, opening hours)
- Ads inside stores (except windows)
- Community safety or public information only
-

9 | Company Name | Annual Report 2018
Our data collection team
Investigators, research staff & students
Emma Charlton (Research Assistant)Naomi Plummer (Research Assistant)Olivia Catchick (Research Assistant)Michaela Johnston (Research Assistant)
VolunteersAmy Sievers (Practicum student)Monica McDonald (Practicum student)Nicole Wickens (Practicum student)Benedetta Giuntini (Practicum student)Smriti Sikri (Practicum student)Harindra Vidyattilake (Practicum student)
Nicole Davidson Jacinta KernaghanLisa Anne Spalding Kalyisah FaridAida Noordin Megan BakerCampbell Peters Serena LouieCassie Murphy Isabel DunstanDylan Ferrier Holifiah BaharEmily Chan Hayley Caratti
Gina Trapp (Project Lead)Paula Hooper (GIS/Map support)Lukar Thornton (App support)Joelie Mandzufas (Project Co-ordinator)Wesley Billingham (Statistician)

10 | Company Name | Annual Report 2018
Results: School sample
SES Population Density
Primary School
Secondary School
K-12 school
Total
High High 9 4 3 16High Low 8 4 4 16Low High 10 4 2 16Low Low 8 7 1 16
Total 35 19 10 64

11 | Company Name | Annual Report 2018
Results

12 | Company Name | Annual Report 2018
There were 9xas many ads for unhealthy foods than healthy
foods

13 | Company Name | Annual Report 2018
Results: most frequently advertised food products
Alcohol 25%
Fast food (burgers/chips/pizza/kebabs)
14%
Sugar-sweetenedbeverages
13%
14 | Company Name | Annual Report 2018
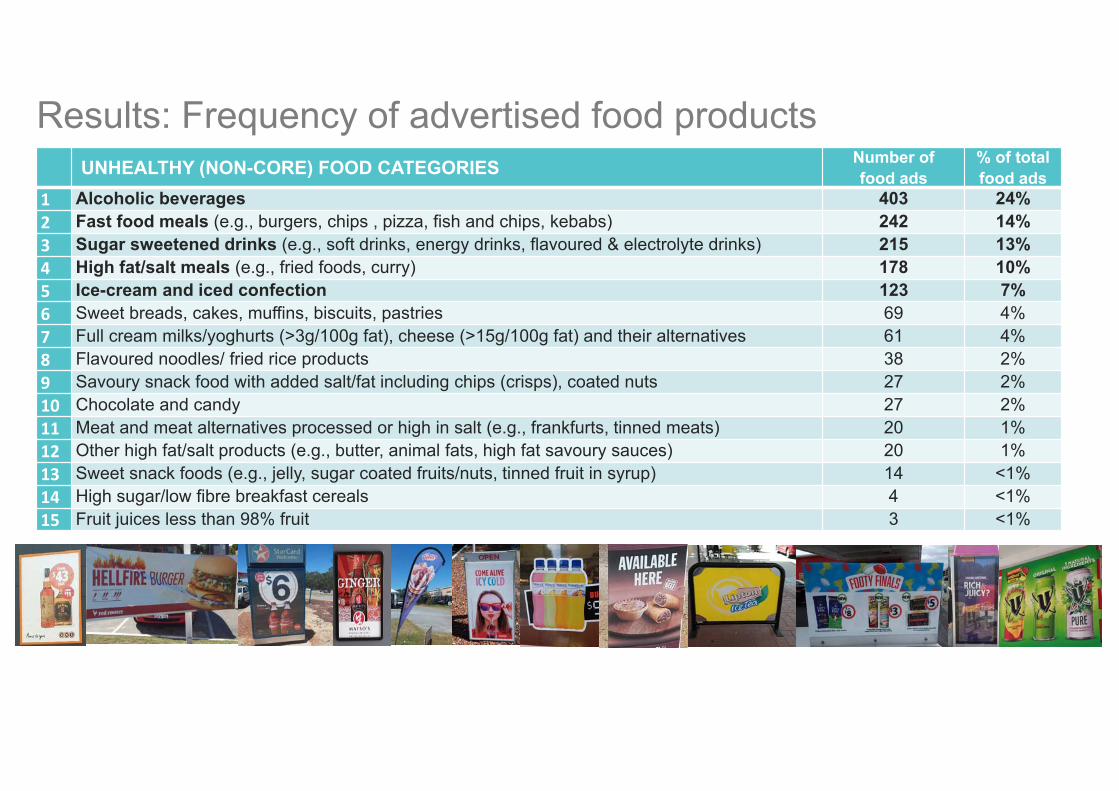
Results: Frequency of advertised food productsUNHEALTHY (NON-CORE) FOOD CATEGORIES Number of
food ads% of total food ads
1 Alcoholic beverages 403 24%2 Fast food meals (e.g., burgers, chips , pizza, fish and chips, kebabs) 242 14%3 Sugar sweetened drinks (e.g., soft drinks, energy drinks, flavoured & electrolyte drinks) 215 13%4 High fat/salt meals (e.g., fried foods, curry) 178 10%5 Ice-cream and iced confection 123 7%6 Sweet breads, cakes, muffins, biscuits, pastries 69 4%7 Full cream milks/yoghurts (>3g/100g fat), cheese (>15g/100g fat) and their alternatives 61 4%8 Flavoured noodles/ fried rice products 38 2%9 Savoury snack food with added salt/fat including chips (crisps), coated nuts 27 2%10 Chocolate and candy 27 2%11 Meat and meat alternatives processed or high in salt (e.g., frankfurts, tinned meats) 20 1%12 Other high fat/salt products (e.g., butter, animal fats, high fat savoury sauces) 20 1%13 Sweet snack foods (e.g., jelly, sugar coated fruits/nuts, tinned fruit in syrup) 14 <1%14 High sugar/low fibre breakfast cereals 4 <1%15 Fruit juices less than 98% fruit 3 <1%

15 | Company Name | Annual Report 2018
HEALTHY (CORE) FOOD CATEGORIES Number of food ads
% of total food ads
1 Low fat meals (e.g., soups, sandwiches, salads, sushi) 104 6%2 Meat and meat alternatives, nuts and seeds 55 3%3 Fruits and fruit juice >98% fruit 48 3%4 Vegetables 45 3%5 Breads, rice and rice products (nothing fried) 41 2%6 Bottled water (unflavoured mineral/sodas) 10 <1%7 Healthy snacks – based on core foods (fruit/veg, grain, dairy, meat, meat alternatives) 5 <1%8 Low in sugar and high in fibre cereals (<20g sugar, >5g of dietary fibre per 100g) 3 <1%9 Milk, yoghurt, cheese, probiotic drinks 2 <1%10 Mono/ polyunsaturated fats e.g. olive oils, plant-based margarines 2 <1%11 Baby foods (not formula) 0 <1%
Results: Frequency of advertised food products

16 | Company Name | Annual Report 2018
MISCELLANEOUS Number of food ads
% of total food ads
1 Tea and coffee 191 11%2 Vitamin/ mineral or other dietary supplements, sugar free gum 32 2%3 Recipe additions including soup cubes, herbs, seasonings 11 <1%4 Baby formula 0 0
Results: Frequency of advertised food products

17 | Company Name | Annual Report 2018
Results: Number of food sub-categories depicted in each food ad
18
122
181
1387
0 200 400 600 800 1000 1200 1400 1600
Four+
Three
Two
One
Count of food ads

18 | Company Name | Annual Report 2018
Results: outdoor advertisementsWithin 500m of the 64 schools
3 schools0 ads of any kind
75% of schools
had ≥1 food ad
Average=36 ads, range 3-190
70% of schools
had ≥1 unhealthy food ad
Average=28 ads, range 1-136
55% of schools
had ≥1 alcohol ad
Average=10 ads, range 1-62
37%of schools
had ≥1 healthy food ad
Average=6 ads, range 1-19

19 | Company Name | Annual Report 2018
Results: Total number of ads within 500m of schools by SES
1875
2051
832 876
0
500
1000
1500
2000
2500
High SES Low SES
Non food ads Food ads
Cou
nt o
f ads
Compared with schools located in HIGH SES areas:
Schools located in LOW SES areas had a
significantly higher ratio of unhealthy (non‐core) food ads to healthy ads

20 | Company Name | Annual Report 2018
Results: Proportion of ads by SES and distance
Within 251-500m
Schools located in LOW SES areas had a significantly higher proportion of:‐ total food ads within 250m (vs 250‐500m)
High SES Low SES
Prop
ortio
n of
tota
l foo
d ad
s
51%34%

21 | Company Name | Annual Report 2018
Results: Proportion of ads by SES and distance
Within 251-500m
Schools located in LOW SES areas had a significantly higher proportion of:‐ unhealthy food ads (excl alcohol) within 250m (vs 250‐500m)
High SES Low SES
40%30%
Prop
ortio
n of
unh
ealth
y fo
od a
ds (e
xcl a
lcoh
ol)

22 | Company Name | Annual Report 2018
Results: Proportion of ads by SES and distance
Within 0-250m Within 251-500m
Schools located in LOW SES areas had a significantly higher proportion of:‐ alcohol ads within 250m (vs 250‐500m)
High SES Low SES
Prop
ortio
n of
food
s ad
s th
at w
ere
for a
lcoh
ol
51%32%

23 | Company Name | Annual Report 2018
Results: Total number of ads within 500m by population density2846
10801088
620
0
500
1000
1500
2000
2500
3000
High Low
Non food ads Food ads
Population density
Cou
nt o
f ads
More non‐food and food ads in high population dense areas
Proportion of food ads to non‐food ads higher in low population‐dense areas
Content of food ad (healthy, unhealthy, branding, misc)
was not significantly different between high/low population
dense areas

24 | Company Name | Annual Report 2018
Results: Average number of ads within 500m by school type
81
57 58
41
2522
0
10
20
30
40
50
60
70
80
90
K-12 Primary Secondary
Non-Food ad Food Ad
Aver
age
num
ber o
f ads
with
in 5
00m
School type

25 | Company Name | Annual Report 2018
Results: Proportion of ads by school type and distance
K‐12 schools had a significantly higher proportion of:‐ total food ads within 250m (vs 250‐500m)
Prop
ortio
n of
tota
l foo
d ad
s
P<0.001
K-12 Primary Secondary
50% 33% 30%

26 | Company Name | Annual Report 2018
Results: Proportion of ads by school type and distance
K‐12 schools had a significantly higher proportion of:‐ healthy (core) food ads within 250m (vs 250‐500m)
Prop
ortio
n of
hea
lthy
(cor
e) fo
od a
ds
K-12 Primary Secondary
60% 31% 35%

27 | Company Name | Annual Report 2018
Results: Proportion of ads by school type and distance
K‐12 schools had a significantly proportion of:‐ alcohol ads within 250m (vs 250‐500m)
Prop
ortio
n of
tota
l foo
d ad
s
K-12 Primary Secondary
65% 34% 25%

28 | Company Name | Annual Report 2018
Results: Average count of ads within 500m by presence of shopping area
82
21
38
4
0
10
20
30
40
50
60
70
80
90
Shopping area present No shopping area
Non-Food ad Food Ad
Aver
age
coun
t of a
ds

29 | Company Name | Annual Report 2018
Results: Average number of food ads by ad content and distanceAv
erag
e nu
mbe
r of o
utdo
or fo
od a
ds
Distance from the school (metres)

30 | Company Name | Annual Report 2018
Results: Count of outdoor food ads within 500m by ad type
This pattern of results was consistent across all school types, SES and population density
904
726
4813 11 6
0
100
200
300
400
500
600
700
800
900
1000
Poster/banner Free-standing Merchandising Paintedbuidling/wall
Digital sign Billboard
Cou
nt o
f foo
d ad
s

31 | Company Name | Annual Report 2018
Results: Size of outdoor food ads within 500m of all schools
1454
209
450
200
400
600
800
1000
1200
1400
1600
Small Medium Large
Small outdoor food ads
75% unhealthy (non-core)Most frequent = alcohol (25%)
70% unhealthy (non-core)Most frequent = alcohol (19%)
66% unhealthy (non-core)Most frequent = alcohol (34%)
Medium outdoor food ads
Large outdoor food ads
Cou
nt o
f foo
d ad
s

32 | Company Name | Annual Report 2018
Results: Count of total food ads within 500m by setting
954
196
508
0 644
0
200
400
600
800
1000
1200
Food shop Non-food shop/business Road Train station Building Bus shelter
Cou
nt o
f foo
d ad
s

33 | Company Name | Annual Report 2018
Results: bus shelter food ads
Unhealthy (non-core) foods excl
alcohol
Alcohol

34 | Company Name | Annual Report 2018
Results: bus shelter food ads
AlcoholUnhealthy (non-core) foods excl
alcohol

35 | Company Name | Annual Report 2018
Results: bus shelter food ads
AlcoholUnhealthy (non-core) foods excl
alcohol
Unhealthy (non-core) foods excl
alcohol
Alcohol

36 | Company Name | Annual Report 2018
KEY FINDINGS
74% of outdoor food advertising within 500m of Perth schools was for unhealthy food
Alcoholwas the most frequently advertised food product, followed by fast food and sugar sweetened beverages
9x as many ads for unhealthy foods than healthy foods
Low SES areashad a higher proportion of total food ads, unhealthy food ads and alcohol ads (but not healthy ads) within 250m of schools

37 | Company Name | Annual Report 2018
KEY FINDINGS
Primary schools had an average of 25 outdoor food advertisements (range=0-190)
87%of food ads on bus shelters were for unhealthy (non-core) foods including alcohol
Food shopor road
The majority of food ads were located at a
Secondary schools had an average of 22 outdoor food advertisements (range=0-94)
K-12 schools had an average of 41 outdoor food ads (range=0-116) and a significantly higher proportion of total food ads, healthy and alcohol ads within 250m

38 | Company Name | Annual Report 2018
We need a comprehensive mix of strategies to reduce unhealthy food advertising near schools
Implications for policy & practice
Revise national advertising industry codesTo impose restrictions on the density/type/content of advertisements that surround schools
Changes to the Dept. of Planning’s guidelines for advertising on transport corridors
To impose restrictions on unhealthy food/alcohol advertisements
Remove unhealthy food & alcohol advertising from all state-based assetsIncluding billboards, digital/LED signs and bus shelters, which contain a high proportion of
unhealthy food ads including alcohol
Create healthy food zones near schoolsChanges to land use and zoning policies to restrict unhealthy food/alcohol outlets near schools
Changes to Local Government Local Planning Policies To contain provisions relating to the guidance or regulation of food/alcohol advertising
