atx-lpa axis contributes to proliferation of chondrocytes ... · atx-lpa 1 axis contributes to...
TRANSCRIPT
Scientific Reports
Supplemental Information
ATX-LPA1 axis contributes to proliferation of chondrocytes by
regulating fibronectin assembly leading to proper cartilage formation
Tatsuji Nishioka, Naoaki Arima, Kuniyuki Kano, Kotaro Hama, Eriko Itai, Hiroshi
Yukiura, Ryoji Kise, Asuka Inoue, Seok-Hyung Kim, Lilianna Solnica-Krezel, Wouter H.
Moolenaar , Jerold Chun and Junken Aoki

Supplemental material
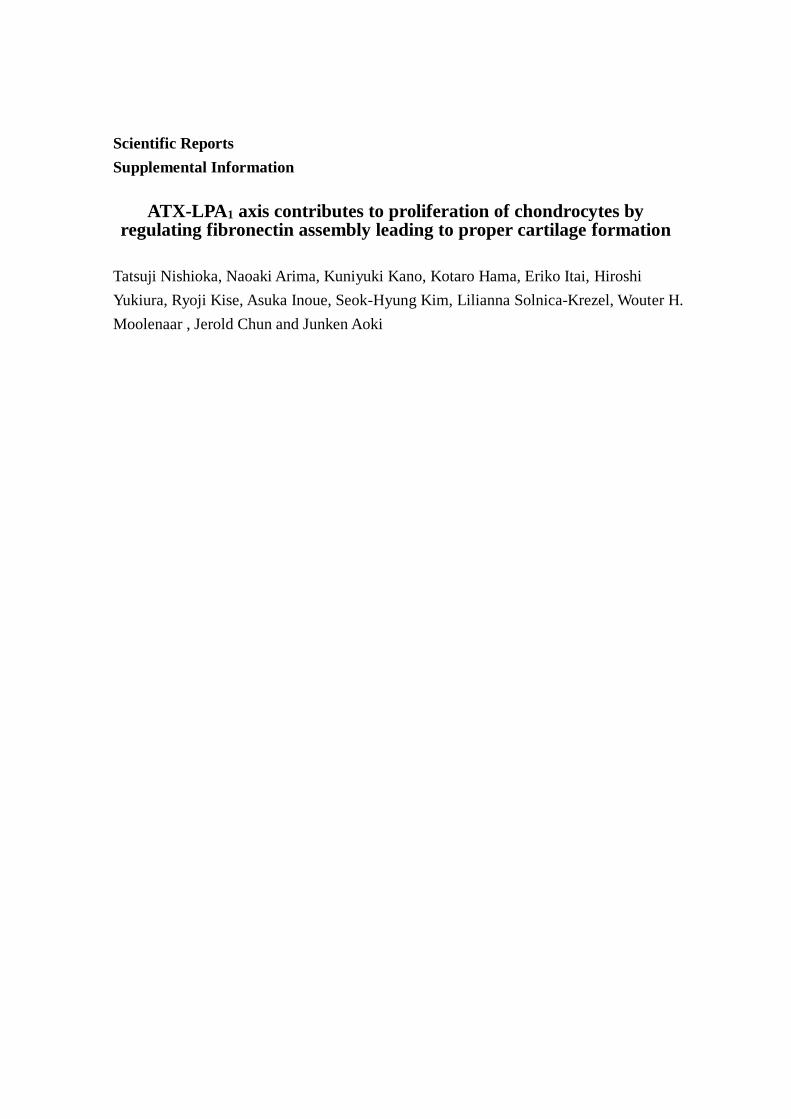
Figure S1. Loss of ATX-LPA1 signaling resulted in dyschondroplasia in zebrafish
(a) DNA sequence of wt and lpa1 mutant zebrafish induced by tilling assay. The gene
structure of zebrafish lpa1 from exon1 – 3 is also shown. (b) Cartilages of zebrafish
embryo around 96 hpf visualized by alcian blue and alizarin red staining (dorsal view).
Schematic diagram is also shown. (c, d) Loss of LPA1 signaling leads to deformation of
gill cartilages. Length of Meckel’s and ceratohyal cartilages in wt and lpa1 mutant
zebrafish (c) and in vehicle- or Ki16425-treated wt zebrafish (d) (Data are mean ± s.d., n
= 20-22, **P <0.01, ***P <0.001). (e, f) Loss of ATX-LPA1 signaling leads to
deformation of cephalic region. Percentage of LPA1 or ATX morphant embryos (e) and
Ki16425-treated wt zebrafish embryos (f) with obvious cephalic malformation (Fig. 1b)
is shown. (g) The expression patterns of slug and sox10, markers of CNCCs, in wt, LPA1
or ATX morphant embryos. Scale bar: 50 m.
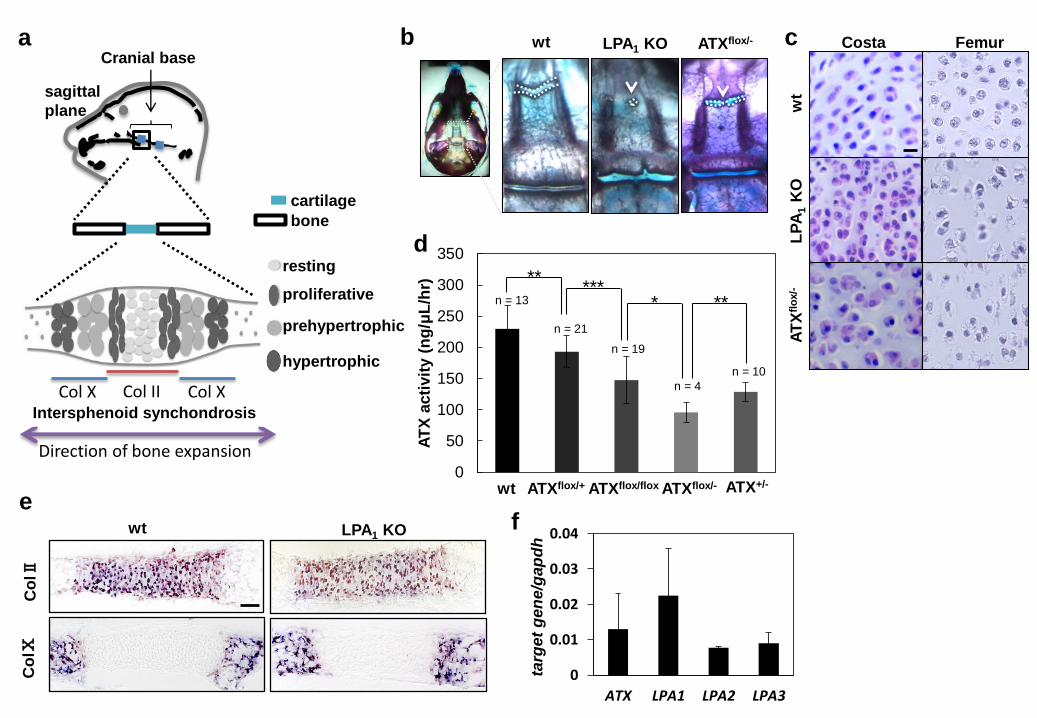
Figure S2. Loss of ATX-LPA1 signaling resulted in dyschondroplasia in mice
(a) Schematic diagram of intersphenoid synchondrosis in skull bone of mice. Expression
marker of resting and proliferating zone (Col II) and prehypertrophic and hypertrophic
zone (Col X) of cartilages and direction of bone expansion are also indicated. (b, c) Loss
of ATX- LPA1 signaling leads dyschondroplasia in mice. LPA1 KO and ATXflox/- mice
showed early ossification in intersphenoid synchondrosis (b), and mislocalization of
chondrocytes both in costa and femur (c). Scale bar: 10 m. (d-g) Decreased plasma ATX
level induced dyschondroplasia in mice. (d) Plasma ATX level of wt, ATX HT and
ATXflox/- (Data are mean ± s.d., n = 4). (e) Loss of LPA1 signaling has no effect on the
expression of chondrocyte differentiation markers (Col II and Col X) as judged by in situ
hybridization. Scale bar: 50 m. (f) Gene expression of atx, lpa1, lpa2 and lpa3 in
intersphenoid synchondrosis (Data are mean ± s.d., n = 3).
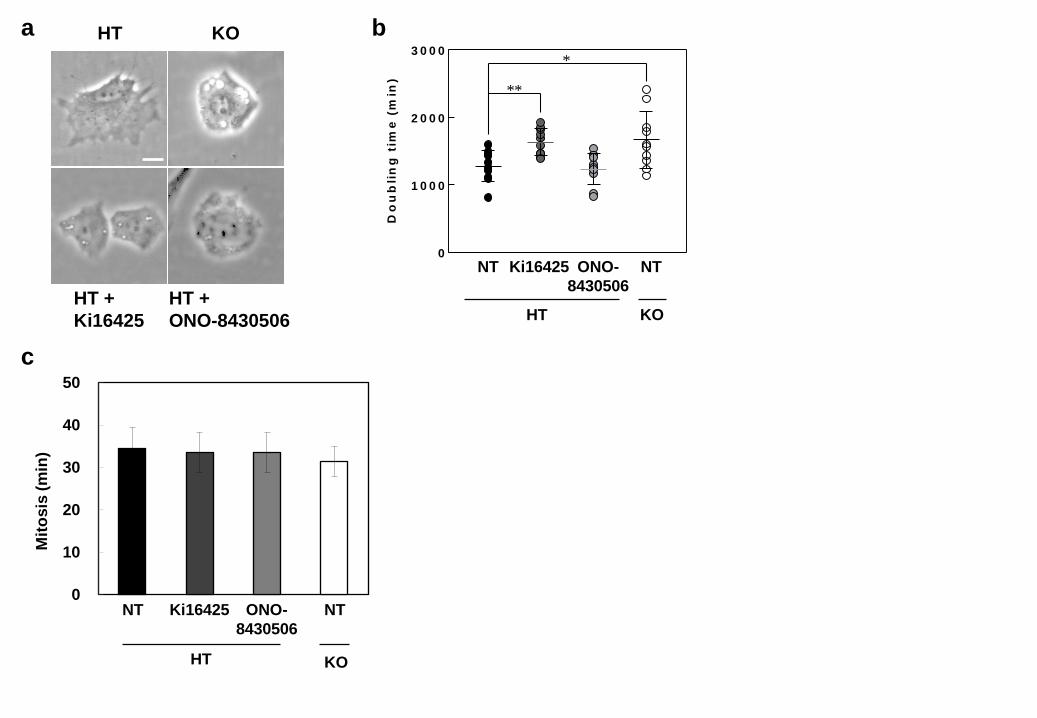
Figure S3. Inhibition of LPA1 signaling results in elongation of doubling time in
cultured chondrocytes
(a) Inhibition of LPA1 signaling resulted in decreased cell size. LPA1+/- chondrocytes
(HT) and LPA1-/- chondrocytes (KO) were cultured in medium containing 10% FCS and
LPA1 antagonist (Ki16425) or ATX inhibitor (ONO-8430506). Scale bar: 10 m. (b, c)
Loss of LPA1 signaling resulted in elongation of doubling time but did not affect duration
of M phase. (b) HT and KO chondrocytes were cultured in medium containing 10% FCS
and LPA1 antagonist (Ki16425) or ATX inhibitor (ONO-8430506) for 48 hr. The doubling
time (b) and duration of M phase (c) were measured from time lapse images (NT:
non-treated, Data are mean ± s.d., n = 10, * P < 0.05, **P < 0.01).
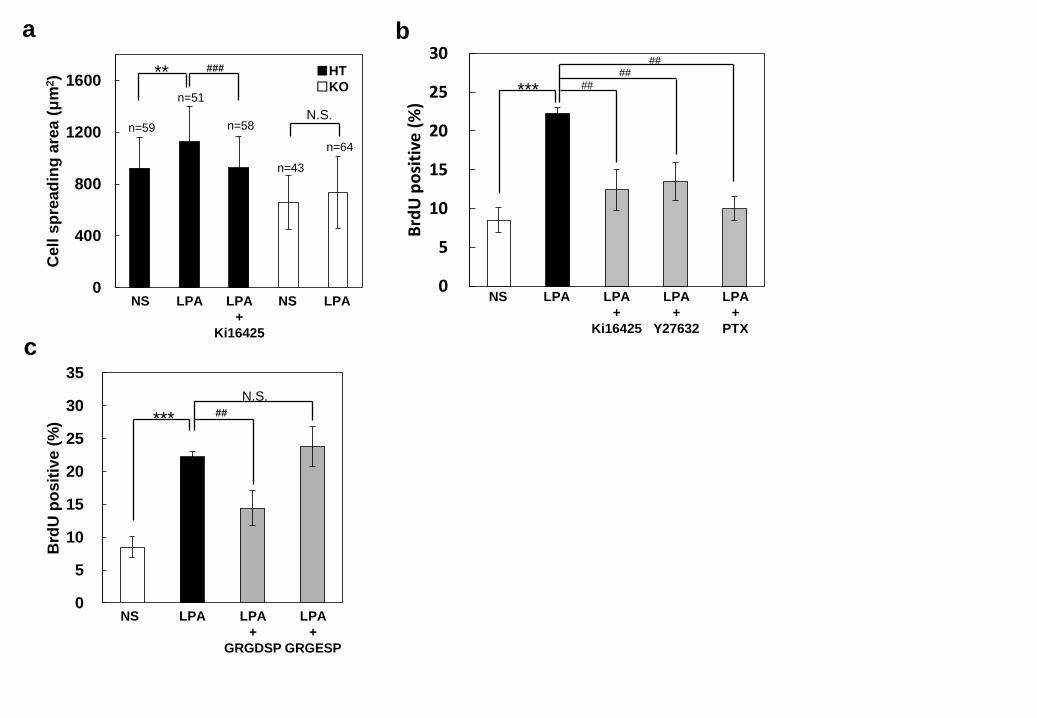
Figure S4. LPA-induced S-phase entry of chondrocytes is integrin-dependent also on
Col II-coated plates
(a) HT and KO chondrocytes were stimulated with LPA and evaluated the cell spreading
area on Col II-coated plates 12 hr after the stimulation (NS: non-stimulated, Data are
mean ± s.d., N.S.: not significant, **P < 0.01, ###P < 0.001). (b) Effects of LPA1 signal
inhibitors (LPA1 antagonist (Ki16425), ROCK inhibitor (Y27632) or PTX) on
LPA-induced S-phase entry on Col II-coated plates (NS: non-stimulated, Data are mean ±
s.d., n = 4, ***P < 0.001, ##P < 0.01). (c) LPA-induced S-phase entry is
integrin-dependent also on Col II-coated plates. LPA-induced S-phase entry of HT
chondrocytes was evaluated by BrdU incorporation in the presence of integrin-blocking
peptide (GRGDSP) and control peptide (GRGESP) (NS: non-stimulated, Data are mean ±
s.d., n = 4, N.S.: not significant, ***P < 0.001, ###P < 0.001).
Figure S5. LPA promotes formation of focal adhesions through LPA1
LPA promotes formation of focal adhesions through LPA1, G12/13, Gi and
integrin-mediated signaling. Chondrocytes were stimulated with LPA in the presence or
absence of LPA1 antagonist (Ki16425), ROCK inhibitor (Y27632), PTX (Gi inhibitor).
Cells were immunostained with anti-vinculin, anti-1-integrin antibody and phalloidin.
Scale bar: 5 m.
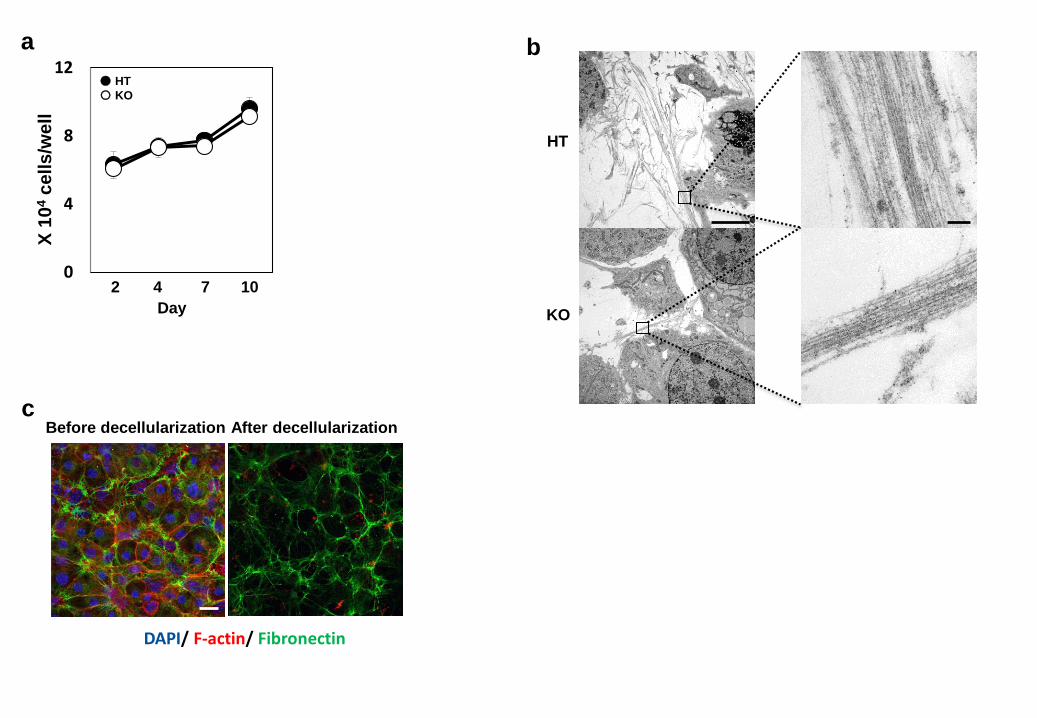
Figure S6. Decellularization of cultured chondrocytes
(a) The cell number of HT and KO chondrocytes cultured in medium containing 10%
FCS at high density for 10 days. (b) Transmission electron micrographs of ECM formed
by HT or KO chondrocytes cultured in medium containing 10% FCS at day10. Scale bar:
5 m and 200 nm in magnified view. (c) Chondrocytes were cultured for 10 days. To
perform decellularization, the cells were treated with Triton X-100, ammonium hydroxide
and DNase. Then the plates were immunostained with anti-FN antibody and phalloidin.
Scale bar: 10 m.
Video 1
Time lapse images of LPA1+/- chondrocytes cultured in medium with 10% FCS for 48 hr.
Video 2
Time lapse images of LPA1-/- chondrocytes cultured in medium with 10% FCS for 48 hr.
Video 3
Time lapse images of LPA1+/- chondrocytes cultured in medium with 10% FCS in the
presence of LPA1 antagonist (Ki16425) for 48 hr.
Video 4
Time lapse images of LPA1+/- chondrocytes cultured in medium with 10% FCS in the
presence of ATX inhibitor (ONO-8430506) for 48 hr.
G309A
exon 1 exon 2 exon 3
exons;introns;
0.1 kbp10kbp
wt sibling
lpa1 mutant
ACGGTTAGCACGTGGTTGCTTCGACAA
ACGGTTAGCACGTGATTGCTTCGACAA
295 321W
a
c
Co
ntr
ol
AT
X M
O
Sox10
lateral dorsal
LP
A1
MO
g Slug
lateral dorsal
50
100
200
Len
gth
of Meckel’s
(μm
)
150161.0
139.3
Len
gth
of
cera
toh
yal
(μm
)
100
150
250
200207.8
185.4
lpa1
mutant
wt
50
100
200
Ki16425vehicle
150161.0
145.7
100
150
250
Ki16425vehicle
200207.8
195.7
d
Len
gth
of Meckel’s
(μm
)
Len
gth
of
cera
toh
yal
(μm
)
lpa1
mutant
wt
e
control LPA1 MO ATX MO0
20
40
60
80
100
%o
f em
bry
o
f
% o
f em
bry
o
0
20
40
60
80
100
control Ki16425
STOP
***
***
***
**
Meckel’s
Ceratohyalb
□normal■malformation □normal■malformation
a b
LP
A1
KO
AT
Xfl
ox/-
wt
c Costa Femurwt LPA1 KO ATXflox/-
sagittal
plane
proliferative
resting
prehypertrophic
hypertrophic
Cranial base
Col IICol X Col X
Direction of bone expansion
cartilage
bone
Intersphenoid synchondrosis
d
e
Co
lⅡC
olⅩ
wt LPA1 KO
0
0.01
0.02
0.03
0.04
ATX LPA1 LPA2 LPA3
targ
et
gen
e/g
ap
dh
f
0
50
100
150
200
250
300
350
AT
X a
cti
vit
y (
ng
/μL
/hr)
n = 19
n = 4
n = 10
n = 13
n = 21
wt ATXflox/-ATXflox/+ ATXflox/flox
*****
***
ATX+/-
0
1 0 0 0
2 0 0 0
3 0 0 0
Do
ub
lin
g t
ime
(m
in)
0
10
20
30
40
50
Mit
osis
(m
in)
a b
NT Ki16425 ONO-
8430506
NT
HT KO
**
*
NT Ki16425 ONO-
8430506
NT
HT KO
HT KO
HT +
Ki16425
HT +
ONO-8430506
c
a b
c
0
400
800
1200
1600
Cell
sp
read
ing
are
a (μ
m2)
n=59
n=51
n=58
n=43
n=64
###**
NS LPA LPA
+
Ki16425
NS LPA0
5
10
15
20
25
30
Brd
Up
osi
tive
(%
)
NS LPA LPA
+
Ki16425
LPA
+
Y27632
LPA
+
PTX
*** ####
##
0
5
10
15
20
25
30
35
Brd
Up
osit
ive (
%)
NS LPA LPA
+
GRGDSP
LPA
+
GRGESP
##***
N.S.
■HT
□KO
N.S.

LP
A
+ K
i16425
LP
A
+ Y
27632
LP
A
+ P
TX
HT
KO
LP
AN
on
sti
mu
lati
on
No
n
sti
mu
lati
on
β1-integrinVinculin mergeF-actin
LP
A
DAPI/ F-actin/ Fibronectin
Before decellularization
a b
2 4 7 10
Day
0
4
8
12X
10
4cells/w
ell
After decellularizationc
HT
KO
● HT
〇 KO