attitudes towards institutions, politics, and policies
TRANSCRIPT

number 17 march 2021
MATHEW MATHEWSTEO KAY KEYMELVIN TAYALICIA WANG
ATTITUDES TOWARDS INSTITUTIONS, POLITICS, ANDPOLICIES: KEY FINDINGS FROMTHE WORLD VALUES SURVEY

IPS Exchange Series
The IPS Exchange Series is published by the Institute of Policy Studies (IPS). It comprises final reports on primary research conducted by IPS researchers and the Institute’s associates, as well as reports of study groups, conferences and seminars organised by the Institute. The objective of this publication series is to disseminate research findings as well as deliberations and policy suggestions that arise from the Institute’s programmes.
When using material from this series, please cite the “IPS Exchange Series” and details of the issue you are referencing. The views expressed in the IPS Exchange Series should be attributed to the authors, or to the study groups and meetings where these views were generated, rather than to IPS. About the Institute of Policy Studies
The Institute of Policy Studies (IPS) was established in 1988 as an independent think-tank to study and generate public policy ideas in Singapore. IPS became an autonomous research centre of the Lee Kuan Yew School of Public Policy at the National University of Singapore in 2008.
Today, IPS continues to analyse public policy, build bridges between thought leaders, and communicate its findings to a wide audience. The Institute examines issues of critical national interest across a variety of fields, and studies the attitudes and aspirations of Singaporeans through surveys of public perception. It adopts a multi-disciplinary approach in its analysis and takes the long-term view in its strategic deliberation and research.
IPS Exchange. Number 17. March 2021 Attitudes towards Institutions, Politics, and Policies: Key Findings from the World Value Survey Mathew, Mathews; Teo, Kay Key; Tay, Melvin and Wang, Alicia ISSN 2382-6002 (e-periodical) © Copyright 2021 National University of Singapore. All Rights Reserved.
Institute of Policy Studies
Lee Kuan Yew School of Public Policy National University of Singapore 1C Cluny Road House 5 Singapore 259599 Tel: +65 6516 8388 Web: www.lkyspp.nus.edu.sg/ipsRegistration Number: 200604346E

ATTITUDES TOWARDS INSTITUTIONS, POLITICS, AND POLICIES: KEY FINDINGS FROM THE WORLD VALUES SURVEY
MATHEW Mathews TEO Kay Key
Melvin TAY Alicia WANG
ips exchange series
number 17 . march 2021

2
CONTENTS
Preface 3
Chapter 1 Introduction 8
1.1 Survey Methodology 12
1.2 Analysis, Index Measures and Cluster Analyses 12
1.3 Demographics and Representation 14
Chapter 2 Public Confidence in Institutions 15
2.1 Overall Findings 16
2.2 State Institutions 21
2.3 Electoral Institutions 34
2.4 Economic and Academic Institutions 40
2.5 The Fourth Estate 47
2.6 Civil Society 53
2.7 International Institutions 64
Chapter 3 Political and Policy Attitudes 72
3.1 Political Attitudes 73
3.2 Attitudes towards Government Surveillance 83
3.3 Attitudes towards Immigration 93
Chapter 4 Conclusion 121
Annex 1 References 126
Annex 2 Acknowledgements 130
Annex 3 About the Authors 132
Preface
3
Preface
Attitudes towards Institutions, Politics, and Policies
4
PREFACE Since its independence in 1965, Singapore's transformation from mediocrity to a world leader by various socio-economic metrics is often attributed to its resolute, pragmatist political leadership. However, the role of its citizens should not be underestimated too; their trust, compliance and support of public institutions and policies are integral to the continued success of the city-state. Against this backdrop, this report, titled Attitudes towards Institutions, Politics, and Policies, is the second of a three-part series1 presenting the salient findings from the latest instalment of the World Values Survey (WVS). WVS is the largest non-commercial, cross-national, and time-series survey of public attitudes and values globally. Spanning 80 countries and currently in its seventh iteration, WVS seeks to study individuals' changing values across polities and their impact on social and political life. In this most recent wave, WVS continues to monitor cultural values, attitudes and beliefs towards gender, family, and religion; attitudes and experience of poverty; education, health, and security; social tolerance and trust; attitudes towards multilateral institutions; cultural differences and similarities between regions and societies. It aims to investigate public attitudes to a range of issues, including family, work, culture, diversity, the environment, subjective well-being, politics, religion, and the impact of globalisation. In addition, new topics such as issues of justice, moral principles, corruption, accountability and risk, migration, national security, and global governance are included in the survey questionnaire. For ease of understanding, we have organised the WVS findings and analyses into three main themes: 1) personal values, 2) perceptions of institutions, politics, and policies, and 3) well-being and social trust. This second report explicates the second theme and spotlights the issue of public confidence or trust in state, electoral, economic, academic, media, civil, and international institutions. Where appropriate, the analyses presented consider results from various polities in tandem to illustrate differences in levels of trust across societies. The second substantive section of this report focuses on political attitudes and two issue-spheres as practical case studies of trust in government: attitudes towards government surveillance, and attitudes towards immigration. Across all sections in the reports, we use open-source data weighted to the national populations of each polity from the WVS website to make cross-country comparisons (Haerpfer et al., 2020). The reports present and discuss findings only pertaining to notable variables with significant results, due to space exigencies. The Singapore component of the WVS survey was carried out by the Institute of Policy Studies (IPS) Social Lab. IPS is a think-tank in the Lee Kuan Yew School of Public Policy (LKYSPP) at the National University of Singapore. The survey implementation received additional support from LKYSPP faculty members, particularly Associate Professor Alfred Wu. Other faculty members who collaborated with funding arrangements were Dr Tan Poh Lin, Dr Joelle Fong, Dr Mehmet Akif Demircioglu, and Dr Xi Lu.
1 The first report titled, Our Singaporean Values was released in February 2021. This report which examines the values Singaporeans embrace across a range of issues ranging from family, morality, to the economy, is available at https://lkyspp.nus.edu.sg/docs/default-source/ips/ips-exchange-series-16.pdf

Preface
5
A general population sampling frame comprising randomly generated household addresses and contact details was obtained from the Singapore Department of Statistics (DOS). Surveyors subsequently visited these addresses to recruit Singaporeans and Permanent Residents (PRs) aged 21 years and above. Fieldwork in Singapore for WVS was conducted from November 2019 to March 2020, with 2,012 respondents completing the survey. The findings from this overall dataset are representative of the Singapore resident population. There was a relatively low refusal rate for the study – only 24.5 per cent of households refused to participate in the survey, or indicated that they were too busy to complete the survey and did not subsequently agree to participate. The duration the survey was in the field cut through two periods – prior to the middle of January 2020, when there was relatively little concern about the Covid-19 pandemic; and after this period where concerns were steadily increasing with the first local transmissions being reported on 4 February 2020. Expectedly, the concerns over Covid-19 could have resulted in some changes in sentiments, ranging from trust in institutions to perceptions of foreigners. As such, the research team carefully examined whether there were any sentiment shifts between these two periods. In general, the changes were small with some exceptions for specific issues. Cases of the latter are elaborated upon in the analyses that follow. The first substantive section of this report begins in Chapter 2 with a perusal of public confidence of institutions. Respondents in Singapore generally expressed confidence in institutions; they were most confident of state institutions relative to electoral institutions, the media, and civil society. At least 70 per cent of respondents indicated a great deal or quite a lot of confidence across all state institutions. Older respondents were more likely to feel confident in these institutions relative to the general populace. Additionally, over 90 per cent expressed their belief that few or none of the individuals working in government or the civil service were involved in corruption. Older respondents were also more likely to be confident that Singapore has low levels of corruption, while higher-educated respondents were likelier to believe that there are high risks of facing penalties for corruption in Singapore. In all, these levels of public confidence in state institutions are among the highest globally. Meanwhile, about seven in ten respondents expressed a great deal, or quite a lot of confidence in Singapore's electoral processes; though just over half felt the same way with political parties in the city-state. In the economic arena, two-thirds of respondents exhibited confidence in financial institutions like the CPF and banks. Trust in academia matched that of state institutions in Singapore, with more than four-fifths of respondents indicating confidence in our universities. However, public trust levels in the media, civil society, and international institutions were markedly lower. In general, just over half of respondents expressed a great deal, or quite a lot of trust in the press and television programming, labour unions, and international organisations such as ASEAN and the UN. It is essential to note the differences in confidence levels of institutions across citizenship status. Naturalised citizens and Permanent Residents (PRs) appear to be more confident with our state and electoral institutions than local-born citizens. However, given the smaller number of respondents for naturalised citizens and PRs (n = 397) relative to local-born citizens (n = 1,615) within the total sample of 2,012 respondents, it is essential to exercise caution when attempting to draw major conclusions from these results. In addition, other significant factors
Attitudes towards Institutions, Politics, and Policies
6
should also be considered in tandem when perusing issues of public confidence; we find that those with higher political interest also expressed higher confidence with electoral institutions than those with low or no political interest. The second and final substantive section of this report presents analyses of participants' responses vis-à-vis political attitudes and two issue-spheres. At the outset, we peruse participants' levels of political interest in Singapore, alongside their views and attitudes towards democracy, human rights, and the prevailing political system. We find that the majority of respondents were uninterested in politics, with those expressing higher levels of interest more likely to be male, more educated, and more affluent. Over nine in ten respondents indicated that Singapore was either democratic or somewhat democratic; older respondents were more likely to believe that Singapore is democratically governed. Around nine in ten respondents also indicated their beliefs that human rights are respected in Singapore, and that they were satisfied with the prevailing political system. These proportions were among the highest compared to other societies globally. Yet, this seemingly prevalent docility of the local populace belies the levels of discernment and nuances of issue-based attitudes. On the issue of government surveillance, we find that two-thirds of respondents indicated the Government should have the right to keep people under video surveillance in public areas. However, approximately three-quarters of respondents felt the Government should not have the right to monitor all emails and other information exchanged online, or collect information about anyone living in Singapore without their knowledge. In addition, we find that respondents who are more confident in state institutions, more interested in politics, and more satisfied with the prevailing political system, were also significantly more likely to support government surveillance. There are also differences in perspectives on the impact of immigration in Singapore based on citizenship status. Most respondents were on the fence regarding the impact of immigrants on Singapore's development. Still, naturalised citizens, PRs and more educated respondents were likelier to view the impact of immigration in a positive light. Approximately two-thirds of naturalised citizens and PRs indicated agreement rather than neutrality or disagreement that immigration strengthened cultural diversity and filled important job vacancies. While more local-born citizens indicated agreement that immigration would lead to social conflict rather than disagreement or neutrality, the converse was true for naturalised citizens and PRs. Similarly, while just under half of local-born citizens agreed that immigration increased unemployment, more naturalised citizens and PRs disagreed this was the case. Still, the impact of demographic factors on immigration perspectives is also tempered by respondents' confidence in state institutions and satisfaction with the prevailing political system. It must be noted that the primary intent of this series of reports is to present the findings of the WVS survey factually, with minimal value judgments attached to the statistical analyses presented. The report is deliberately structured in a simple and accessible format to reach a wider audience, and encourage a more inclusive public deliberation process vis-à-vis policy in Singapore. Nonetheless, we do not forfeit the rigour and quality of our findings; all toplines and figures are only presented in this report if they hold with in-depth measures of statistical significance and robustness checks. The latter is omitted from the report for ease of reading and to render the narrative more succinct.

Preface
7
We leave it to our readers to draw more in-depth conclusions as to what these findings represent in terms of whether, or how our attitudes shape the way we lead our lives, interact with society-at-large, and influence policymaking.

Attitudes towards Institutions, Politics, and Policies
8
Chapter 1
Introduction

Chapter 1 | Introduction
9
CHAPTER 1 | INTRODUCTION In this preamble, we explain and review the study's key themes in the following order: public confidence in institutions, interest in politics, and attitudes towards policies. In the following sections, we briefly discuss the survey methodology employed and respondents' demographic profiles, before venturing into the survey results and analyses. According to the OECD (2019), confidence in public institutions and the belief that socio-economic institutions are not subject to corruption are keys to a cohesive society. In addition, confidence in public institutions has been found to be of importance for a well-functioning democracy, political legitimacy and economic development of a country (North, 2012; Holmgren et al., 2016). Where there is a lack of public confidence, the effectiveness of public institutions is undermined and contributes to economic and social problems. There is no universal definition of what constitutes public confidence in government, but there is an understanding that it is correlated with measures of good performance (Cowell et al., 2012). According to Kim (2005, p.616), confidence "represents a feeling or belief that one can act in a proper and effective way. It arises from another party's capacity to function properly based on past experience, through which one's ability is tested and confirmed." Public confidence in institutions may be determined by subjective wellbeing, political values and attitudes, the economic condition of the state, employment, demographic influences and the like. These bases of support can fall into two categories: diffuse and specific bases of support, a distinction drawn from Easton's (1965) research on public confidence in institutions. Diffuse institutional support is more enduring over time as people draw from a reservoir of favourable attitudes or goodwill that helps them be more tolerant of institutional outcomes that they might opposed or deemed as contrary to their self-interests. On the other hand, specific support is more transient, fluctuating according to the fulfilment of demands for particular policies or actions. The current scholarship focuses on monitoring confidence in institutions, by following specific issues and events such as elections or crises. Price and Romantan (2004) measure the change in levels of confidence in the branches of government (executive, legislative, and judicial) in the wake of the 2000 US presidential elections. Other studies have done comparative analyses on the level of confidence in institutions across countries. For example, Steen (1996) compares confidence levels in institutions across the Baltic states with France and Norway. The extant literature also attempts to identify the sources of decline or increase in confidence. For instance, Clausen, Kraay and Nyiri (2011) found a negative correlation between corruption and confidence in public institutions. Garcia-Rivero and Kotze (2017) explore whether sources of political confidence are more firmly based on political attitudes or economic attitudes across seven countries. Shin (2006) argues that diminished citizen confidence in Korea's public institutions was due to multiple factors; including political culture, institutional performance, and politician and government misconduct.

Attitudes towards Institutions, Politics, and Policies
10
It is also essential to discuss corruption in tandem with confidence in institutions. Broadly defined, corruption is the abuse of entrusted (often public) power for private gain. It can lead to various insidious outcomes, including the erosion of trust, weakening of democracy, hampering of economic development, and the further exacerbating of inequality, poverty, social divisions and the environmental crisis (Transparency International, 2020). Perceptions of corruption are negatively correlated with confidence in political institutions. For instance, using a sample composed of more than 100 countries, Clausen, Kraay and Nyiri (2011) find that in countries where corruption is perceived to be widespread, confidence in public institutions is also low. On the other hand, where corruption is perceived to be low, confidence in public institutions tends to be high – as found in Scandinavian countries. This is because high levels of corruption result in institutions becoming rent-seeking instruments in the hands of a corrupt political and economic elite (Pellegata & Memoli, 2016). The public then faces an increase in cost and a reduction in the quality of public services. This results in inefficient institutions that ultimately lose their credibility in the eyes of the public and, in turn, cause an erosion of trust towards these corrupt political institutions. In the Singapore context, much of the existing literature focuses on the effective combating of corruption rather than citizens' perceptions of this phenomenon (Quah, 2001; 2006; 2013). This is mainly due to prevailing perceptions of Singapore as one of the least corrupt countries globally (Transparency International, 2019). As can be seen from above literature, a clear link can be drawn between corruption and confidence in institutions. Hence, we begin Chapter 2 by perusing levels of confidence Singapore residents have in various institutions, including the state, elections, media, civil society and the public's perceptions of corruption across these institutions. In Chapter 3, we move on to exploring the political and policy attitudes of Singaporeans. In the first part of Chapter 3, we focus on Singaporean's political interest. In Gabriel Almond and Sidney Verba's seminal study of civic political culture, political interest means "following governmental and political affairs and paying attention to politics" (Almond & Verba, 1963, p.88). In other words, political interest refers to an individual's degree of interest in and concern with politics. It is also different from political participation. Political interest is more concerned with the psychological involvement for political affairs whereas political participation is about the action or inaction in politics (Zhong, 2018). Markus Prior (2019) delves comprehensively into the political interest. He explains what political interest is, where it comes from, and why it matters. Prior makes a distinction between situational interest and dispositional interest. According to him, the first type is triggered by something in the political environment and results in a fleeting emotion. The second type is a more enduring sentiment that is self-sustaining, even when the initial environmental stimulus has disappeared. Dispositional political interest thus entails an expectation that engaging with politics again in the future will turn out to be gratifying (Prior, 2019, p. 4). Studying political interest is germane as it leads to a more politically knowledgeable, mobilisable and participative citizenry. It is also an essential factor in encouraging electoral participation. The second part of Chapter 3 examines the policy attitudes of Singaporeans across two contexts: how comfortable respondents were with government surveillance and immigration policies. With increasing internet penetration rate and sophisticated technology infrastructure occurring globally, state surveillance has become the norm. At its best, it ensures safety,

Chapter 1 | Introduction
11
stability, and efficient markets, while maintaining respect for privacy and individual liberty. The Cambridge Handbook of Surveillance Law (2017) presents a comprehensive overview of surveillance technologies from location tracking to modern biometrics, including its value as a policy instrument, the positive and negative impacts of surveillance, and how different societies regulate surveillance. Much research has been done on surveillance in Singapore as well. The issue of surveillance has become even more pertinent in light of the recent Covid-19 pandemic. Singapore implemented a multipronged surveillance and containment strategy that included contact tracing for patients diagnosed with Covid-19 and enhanced surveillance of specific patient groups (Ng et al., 2020). This strategy is similar to the Government's surveillance methods used during the 2002 severe acute respiratory syndrome (SARS) outbreak (Ong et al., 2005; Qian & Lim, 2010). In addition, during the Covid-19 Circuit Breaker period, individuals served with quarantine orders were closely monitored by the police to ensure compliance; robots were even used to ensure social distancing amongst the population. Buckee et al. (2020) similarly note that Singapore has a robust surveillance system with a high capacity for case detection. In the same vein, personal data collection has also increased in recent times with the implementation of mandatory nationwide contact tracing endeavours, such as scanning NRICs for entry to public spaces like wet markets and malls (Personal Data Protection Commission, 2020). A mobile application called TraceTogether was launched by the Ministry of Health and Government Technology Agency to enable community contact-tracing through location-tracking of users. However, what should be the extent of data collected, and is there a boundary where state surveillance cannot cross? Furthermore, do citizens feel that their right to privacy has been violated, and is this contingent on the prevailing pandemic situation? Do they think over-surveillance has occurred, or have they been socialised to accept the state's surveillance strategies? In fact, an IPS report in May 2020, based on surveys conducted during the circuit breaker period revealed the nuanced positions that Singaporeans hold to the use of surveillance technologies to deal with the Covid-19 pandemic. While 87 per cent supported strict surveillance of those who need to be quarantined, only 49 per cent of Singapore residents were agreeable to having their mobile phone data tracked without their consent. There was more acceptance of the use of closed-circuit television (CCTV) footage to monitor people's movements during the circuit breaker period (Mathew, Tan and Suhaini, 2020). Meanwhile, there is considerable theoretical debate on the factors contributing to anti-immigration attitudes and associated perspectives too. Scholars remain divided on whether prejudice against immigration stems from economic or non-economic factors such as ideology (O'Rourke & Sinnott, 2006). Economic-based perspectives primarily incorporate narratives of immigration engendering competition with the native-born individuals as immigrants are often recruited to correct labour market shortages. This is a prevalent narrative in Singapore, with substantial inflows of foreign talent or professionals from Mainland China, South Asia, the Philippines and other countries since the mid-1990s due to a relatively open immigration policy. Singapore is additionally reliant on transient foreign labour, who take jobs most Singaporeans are averse to, such as construction or sanitation work. One source of local dislike for foreign talent stems from the perceived notion that foreign talent compete for high-paying, white-collar jobs in the labour market.

Attitudes towards Institutions, Politics, and Policies
12
On the other hand, ideology-based explanations of attitudes towards immigration focus on beliefs. Usually, anti-immigrant attitudes reflect beliefs about the native-born being superior to the culturally or racially different "other". However, being anti-immigration could represent a purely political view with little association to a sense of superiority towards immigrants per se. In the modern world, government surveillance and immigration remain core issues to the populace. Hence, it is vital we study them and understand public attitudes towards their associated policies, to ensure good governance in the face of an increasingly complex society. 1.1 SURVEY METHODOLOGY Data for this report is primarily derived from the latest 2020 Singapore instalment of the WVS survey. The survey instrument is developed in concert with the overall global WVS survey framework used across other polities to facilitate cross-country comparisons. Data collection for this instalment took place from November 2019 to March 2020, and was conducted by IPS Social Lab. In total, 2,012 Singaporean residents participated in the survey. At the outset, a sample frame comprising a list of 3,000 randomly generated household addresses was obtained from the Singapore Department of Statistics (DoS). There was a reasonable response rate for this iteration of the WVS survey; approximately two-thirds of those eligible to complete the study did so. As such, the findings are representative of the Singapore adult resident population, as the next section expounds in greater detail. IPS Social Lab surveyors approached the pre-determined prospective households to recruit Singaporeans and Permanent Residents (PRs) aged 21 years and above. They identified eligible respondents using a set of criteria (including gender and age) to ensure demographic proportionality, briefed the respondent about the study, and invited the respondent to participate in the survey. If they agreed, the survey was administered in a face-to-face interview format in either of the four official languages – English, Mandarin Chinese, Malay, or Tamil. Respondents who completed the survey were given a $15 grocery shopping voucher. Interviewer training stressed the importance of presenting questions and receiving responses without expressing any judgment. Nevertheless, given that this is a face-to-face survey where respondents provided their answers to the interviewer verbally, we cannot exclude the role of social desirability. This is, unfortunately, a bias inherent in the design of the face-to-face survey methodology. 1.2 ANALYSIS, INDEX MEASURES AND CLUSTER ANALYSES Cross-country comparisons are collated with open-source data weighted to the national populations of each polity from the official WVS website (Haerpfer et al., 2020). Malaysia, Thailand, Japan, South Korea, China, Hong Kong, Taiwan, Australia, US, UK, Switzerland, Sweden were the dozen chosen for comparison; in toto, they reflect a well-rounded range of polities with diverse attributes. Malaysia and Thailand are chosen for their geographical

Chapter 1 | Introduction
13
proximity to Singapore. China, Japan, South Korea, Hong Kong, and Taiwan are included in comparisons as a well-documented cluster representing Asian values and East Asia; the latter four are also the Asian Tigers with comparable levels of economic development. Australia, the US, the UK, Switzerland and Sweden round up the dozen as comparative Anglo-centric or Euro-centric democratic societies. As part of the broader three-part thematic study, we have condensed the myriad findings across the three reports using a two-step approach of 1) standard regressions based on pre-defined scales, and 2) cluster analysis to discern collections of similar values or beliefs prevalent within the respondent pool. For the first step, we construct scales that provide an aggregated measure of the values or principles respondents hold across various component issues. Regressions and descriptive statistics are presented within the various sub-sections to complement the more accessible cross-tabulations. The second step involves cluster analysis, which is a broad-based quantitative exploratory analysis attempting to identify structures or segments within the data. Based on overarching value dimensions analysed in the first report, we had mapped out a total of four logically salient clusters of WVS respondents. These value groupings were primarily driven by views across three broad dimensions: politics, economy, and society, as their names suggest (see Mathew et al., 2021 for details). At the outset, the largest group, the Conservative Democrats, make up 45.2 per cent of the sample. This group has a very positive disposition towards democracy and neoliberal economics coupled with conservative social values. This group has a much larger proportion of older respondents and racial minorities relative to others. The Secular Liberals, who comprise 14.2 per cent of the sample and are overwhelmingly young and Chinese, share similar views of democracy and neoliberal economics with Conservative Democrats, albeit having a lower degree of faith-based beliefs and being more open about social issues. Meanwhile, Conservative Autocrats form the smallest group at 6.0 per cent of the sample; they score low on support for democracy, hold traditional views vis-à-vis social issues, and do not think highly of neoliberal economic values. Middle-aged and older respondents make up most of this group, with larger-than-average proportions of less affluent and racial minorities belonging to this cluster. Middle Grounders are named thus because of their centrist stance on all value dimensions relative to the other clusters, and form 34.6 per cent of the sample population. With the second-largest proportion of respondents belonging to this cluster, these individuals are quite supportive of democracy and neoliberal economic practices, and do not hold particularly strong views on social issues. This group has a lower average age relative to the rest of the sample, and has a higher percentage of degree holders relative to the rest of the clusters. In this report we present through the use of cross-tabulations, where significant, how attitudes differ not only by respondents of different demographic backgrounds; but also based on their value positions derived through this cluster analysis.

Attitudes towards Institutions, Politics, and Policies
14
1.3 DEMOGRAPHICS AND REPRESENTATION The overall responses for each question reported in the ensuing chapters are weighted to ensure that the WVS sample's demographic proportions closely approximate those of the national population in terms of age cohort, gender, and race. This enables us to effectively compare results across different iterations of the survey, and provide a general gauge of the overall population's value systems. However, further two-level breakdowns of the results are not weighted to provide a more accurate representation of separate demographic groups. It is important to note the slight discrepancies between cross-wave comparisons presented in this report vis-à-vis the World Values Survey's official data online. This is due to variations in weighting methodologies across the two previous waves (2002 and 2012) to reflect Singapore's demographic proportions in the original WVS data. We have re-weighted this in line with updated methodologies to achieve better consistency in our comparisons, although this is not a panacea for the prevailing data collation limitations. The sample demographics largely mirror the Singapore resident population. To keep this report more succinct, we invite the reader to refer to the first World Values Survey report for a more detailed rundown of the profile of respondents (Mathew et al., 2021).

Chapter 2 | Public Confidence in Institutions
15
Chapter 2
Public Confidence in Institutions
Attitudes towards Institutions, Politics, and Policies
16
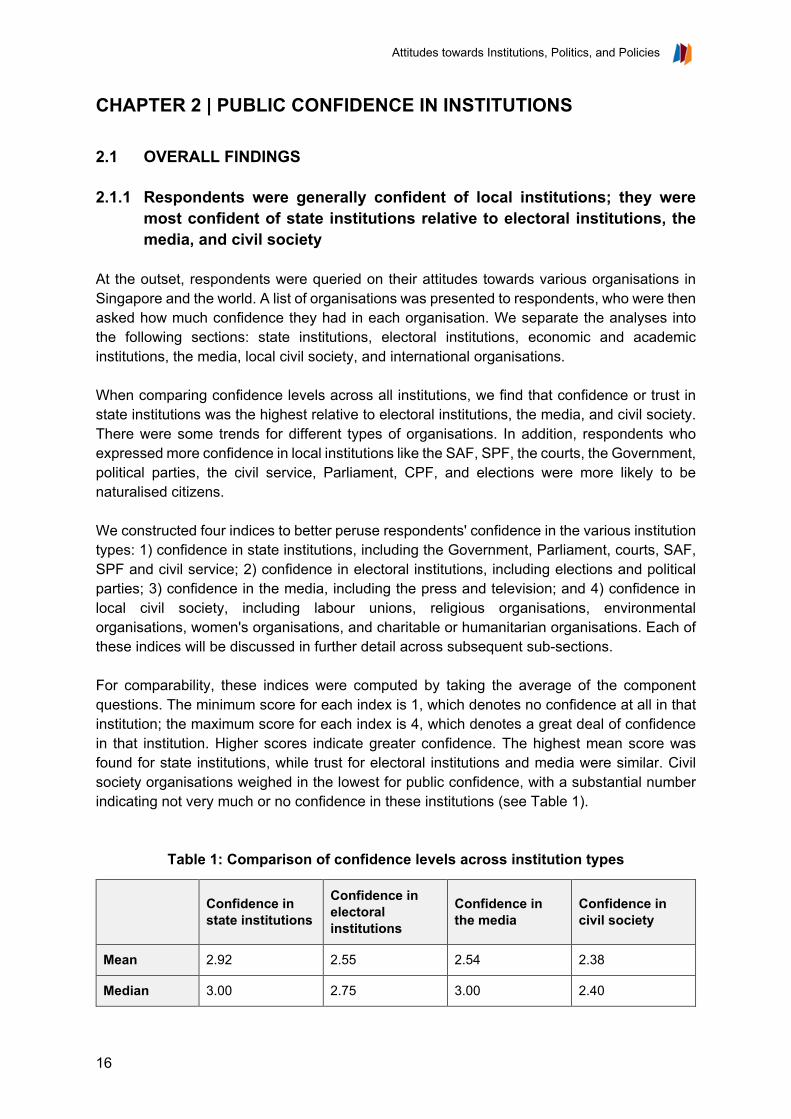
CHAPTER 2 | PUBLIC CONFIDENCE IN INSTITUTIONS 2.1 OVERALL FINDINGS 2.1.1 Respondents were generally confident of local institutions; they were most confident of state institutions relative to electoral institutions, the media, and civil society At the outset, respondents were queried on their attitudes towards various organisations in Singapore and the world. A list of organisations was presented to respondents, who were then asked how much confidence they had in each organisation. We separate the analyses into the following sections: state institutions, electoral institutions, economic and academic institutions, the media, local civil society, and international organisations. When comparing confidence levels across all institutions, we find that confidence or trust in state institutions was the highest relative to electoral institutions, the media, and civil society. There were some trends for different types of organisations. In addition, respondents who expressed more confidence in local institutions like the SAF, SPF, the courts, the Government, political parties, the civil service, Parliament, CPF, and elections were more likely to be naturalised citizens. We constructed four indices to better peruse respondents' confidence in the various institution types: 1) confidence in state institutions, including the Government, Parliament, courts, SAF, SPF and civil service; 2) confidence in electoral institutions, including elections and political parties; 3) confidence in the media, including the press and television; and 4) confidence in local civil society, including labour unions, religious organisations, environmental organisations, women's organisations, and charitable or humanitarian organisations. Each of these indices will be discussed in further detail across subsequent sub-sections. For comparability, these indices were computed by taking the average of the component questions. The minimum score for each index is 1, which denotes no confidence at all in that institution; the maximum score for each index is 4, which denotes a great deal of confidence in that institution. Higher scores indicate greater confidence. The highest mean score was found for state institutions, while trust for electoral institutions and media were similar. Civil society organisations weighed in the lowest for public confidence, with a substantial number indicating not very much or no confidence in these institutions (see Table 1).
Table 1: Comparison of confidence levels across institution types
Confidence in state institutions
Confidence in electoral institutions
Confidence in the media
Confidence in civil society
Mean 2.92 2.55 2.54 2.38
Median 3.00 2.75 3.00 2.40

Chapter 2 | Public Confidence in Institutions
17
2.1.2 Older respondents were more likely to believe that Singapore has low levels of corruption; higher-educated respondents were more likely to think corruption in Singapore would entail punitive consequences In 2020, Singapore was ranked third least corrupt out of 180 countries in the Corruption Perceptions Index, a global indicator of public sector corruption (Transparency International, 2021). Singapore also maintained a high score of 85 out of 100, with high scores indicating lower perceptions of corruption. Results from the WVS survey corroborate these high scores and the extant literature. Respondents were asked to rate, on a scale of 1 (no corruption) to 10 (abundant corruption), how much corruption there was in Singapore. The mean score for this question was 3.45, while the median score was 3; these indicate a high degree of confidence in the country's low corruption rates. A second question asked respondents to indicate how likely corrupt individuals in Singapore would be held accountable on a scale of 1 (no risk) to 10 (high risk). Perceptions of accountability also appear to be generally positive, with a mean score of 6.24 and a median score of 7 denoting respondents believe there is a considerable risk of punitive consequences for corrupt individuals. For ease of comparison, the response scales for the two questions above were condensed into three categories. For the question on levels of corruption in Singapore, responses from 1 to 3 indicate low corruption; 4 to 7, middling levels of corruption; and 8 to 10, abundant corruption. For the question on the risk of facing penalties, ratings of 1 to 3 indicate low risk, 4 to 7, medium risk, and 8 to 10, high risk. A majority of respondents, or 62.1 per cent, felt there were low levels of corruption in Singapore; only 4.8 per cent perceived abundant corruption. Meanwhile, 45.4 per cent of respondents perceived high risks of facing penalties for corruption, while 27.7 per cent felt there were medium risks (see Figures 1 and 2).
62.1%
33.1%
4.8%
Figure 1: Views on levels of corruption in Singapore
Low corruption
Middling levels of corruption
Abundant corruption
26.9%
27.7%
45.4%
Figure 2: Views on "the degree of risk in Singapore to be held
accountable for giving or receiving a bribe, gift, or favour
in return for public service"
Low risk Medium risk High risk

Attitudes towards Institutions, Politics, and Policies
18
Some differences were observed across age groups when comparing perceptions of corruption levels; there were also significant differences in perceptions of accountability for acts of corruption across education levels. A significantly smaller proportion of respondents aged between 21 and 35 felt that there was low corruption (55 per cent) compared to the rest of the sample (approximately 65 per cent). Meanwhile, degree-educated respondents were more confident compared to the rest of the sample that corrupt individuals would be held accountable for their actions. Over half of degree holders felt there was a high risk or chance of punitive measures for corruption, compared to just over 40 per cent of their less-educated peers indicating likewise (see Tables 2 and 3).
Table 2: Perceptions of levels of corruption, by age cohort
Age Cohort N = 1,972
Degree of corruption in Singapore
Low corruption Middling levels of corruption Abundant corruption
21-35 55.0 38.7 6.2
36-50 62.1 34.1 3.8
51-65 64.7 30.0 5.2
Above 65 69.4 27.2 3.4
Table 3: Perceptions of risk of penalties for corruption, by education level
Education Level N = 1,988
Risk of being held accountable for acts of corruption in public service
Low risk Medium risk High risk
Below secondary 26.9 31.2 41.8
Secondary / ITE 25.9 33.0 41.1
Dip. / Prof. qual. 31.7 25.6 42.7
Bachelor's and above 24.9 22.4 52.7
2.1.3 Public confidence in state, financial and academic institutions generally increased from 2012 to 2020; in contrast, confidence in political parties, the media, and international organisations declined We next explore variations in levels of confidence across institutions across time by comparing the results from the latest 2020 iteration with the preceding 2012 results2. When perusing
2 It is important to note the slight discrepancies between cross-wave comparisons presented in this report vis-à-vis the official data presented by the World Values Survey online. This is due to variations in weighting methodologies across the two previous waves (2002 and 2012) to reflect Singapore's demographic proportions in the original WVS data. We have re-weighted this in line with updated methodologies to achieve better consistency in our comparisons, although this is not a panacea for the prevailing data collation limitations.
Chapter 2 | Public Confidence in Institutions
19
confidence levels for state institutions, we find that public confidence in Government, the SPF, the SAF, and the Singapore Civil Service increased over time. In particular, the SPF experienced the greatest increase in public confidence, with 79.1 per cent of 2012 respondents indicating a great deal or quite a lot of confidence in the institution, and 87 per cent of 2020 respondents indicating likewise. The 2020 proportions for confidence in the SPF are also the highest among all state institutions. Meanwhile, 2020 respondents were less likely to indicate confidence in political parties as a whole, relative to their 2012 counterparts. While 68.5 per cent of the latter group indicated significant confidence levels, this proportion experienced a significant dip to 54.7 per cent for the 2020 iteration. Alongside the marginal decrease in public confidence in Parliament, this trend may reflect opposing views of a more diverse local political scene, comprising several newly-formed parties between 2012 and 2020. In contrast, respondents' confidence levels in economic and academic institutions rose from 2012 to 2020. While 68.8 per cent of respondents in 2012 indicated substantial confidence in local banks, this proportion increased to 79.4 per cent in 2020. Universities likewise experienced an increase in public confidence, albeit a more marginal one from a higher baseline level of trust (over 80 per cent in both iterations). Public confidence trends for civil society organisations were mixed. Respondents in 2020 were less likely to indicate confidence in religious organisations (60 per cent) and labour unions (54 per cent), relative to their 2012 counterparts (70.3 per cent for religious organisations and 58.8 per cent for labour unions). However, organisations focused on issues that have gained increasing traction have instead experienced marginal growth in public confidence. While 69.2 per cent and 65.9 per cent of 2012 respondents indicated confidence in environmental and women's organisations respectively, these proportions rose to 72.1 per cent and 67.1 per cent for 2020 respondents, respectively. Levels of public confidence in the media and international organisations are the lowest among the institution types in both survey iterations; they have continued to decline from 2012 to 2020. While confidence in the press and television programming marginally declined to approximately 57 per cent in 2020, the corresponding levels of confidence in ASEAN and the UN fell below 60 per cent from 2012 to 2020 (see Figure 3).

Attitudes towards Institutions, Politics, and Policies
20
24.0%
21.1%
20.4%
14.2%
25.1%
22.4%
23.6%
24.7%
24.2%
21.8%
16.6%
15.2%
15.9%
7.2%
16.2%
14.5%
21.7%
16.2%
11.8%
6.2%
11.7%
6.2%
22.4%
12.7%
11.2%
5.8%
13.8%
10.7%
13.3%
8.8%
11.1%
8.6%
12.7%
5.3%
14.5%
6.5%
55.3%
60.4%
55.0%
58.5%
57.6%
59.9%
55.5%
62.3%
52.4%
61.5%
59.1%
64.7%
52.6%
47.5%
58.6%
64.9%
61.2%
67.5%
46.0%
49.9%
46.8%
51.2%
47.9%
47.3%
47.6%
48.2%
55.4%
61.4%
52.6%
58.3%
49.2%
50.8%
49.3%
51.1%
47.0%
47.2%
18.2%
15.9%
21.7%
23.6%
15.1%
15.9%
18.9%
11.6%
21.3%
14.8%
22.6%
18.4%
28.2%
40.5%
23.1%
18.8%
15.9%
15.0%
37.7%
39.0%
36.8%
38.0%
26.0%
35.0%
36.5%
39.4%
28.9%
25.7%
31.5%
30.1%
36.6%
37.4%
34.1%
38.9%
33.8%
39.3%
2.5%
2.5%
3.0%
3.6%
2.2%
1.8%
2.1%
1.4%
2.1%
1.9%
1.6%
1.7%
3.3%
4.9%
2.0%
1.9%
1.2%
1.3%
4.4%
5.0%
4.7%
4.6%
3.7%
5.0%
4.7%
6.6%
1.9%
2.2%
2.6%
2.9%
3.0%
3.3%
3.9%
4.7%
4.8%
7.0%
0% 20% 40% 60% 80% 100%
Government 2012Government 2020
Parliament 2012Parliament 2020
Courts 2012Courts 2020
SPF 2012SPF 2020SAF 2012SAF 2020
Civil Service 2012Civil Service 2020
Political Parties 2012Political Parties 2020
Banks 2012Banks 2020
Universities 2012Universities 2020
Press 2012Press 2020
Television 2012Television 2020
Religious Orgs 2012Religious Orgs 2020Labour Unions 2012Labour Unions 2020
Envt Orgs 2012Envt Orgs 2020
Women's Orgs 2012Women's Orgs 2020Chari / H Orgs 2012Chari / H Orgs 2020
ASEAN 2012ASEAN 2020
UN 2012UN 2020
Figure 3: Confidence in institutions, by institution type and survey iteration
A great deal Quite a lot Not very much None at all
Chapter 2 | Public Confidence in Institutions
21
2.2 STATE INSTITUTIONS 2.2.1 Overall, respondents expressed high levels of confidence in Singapore's
state institutions; naturalised citizens and PRs were more likely to indicate greater confidence relative to their local-born peers
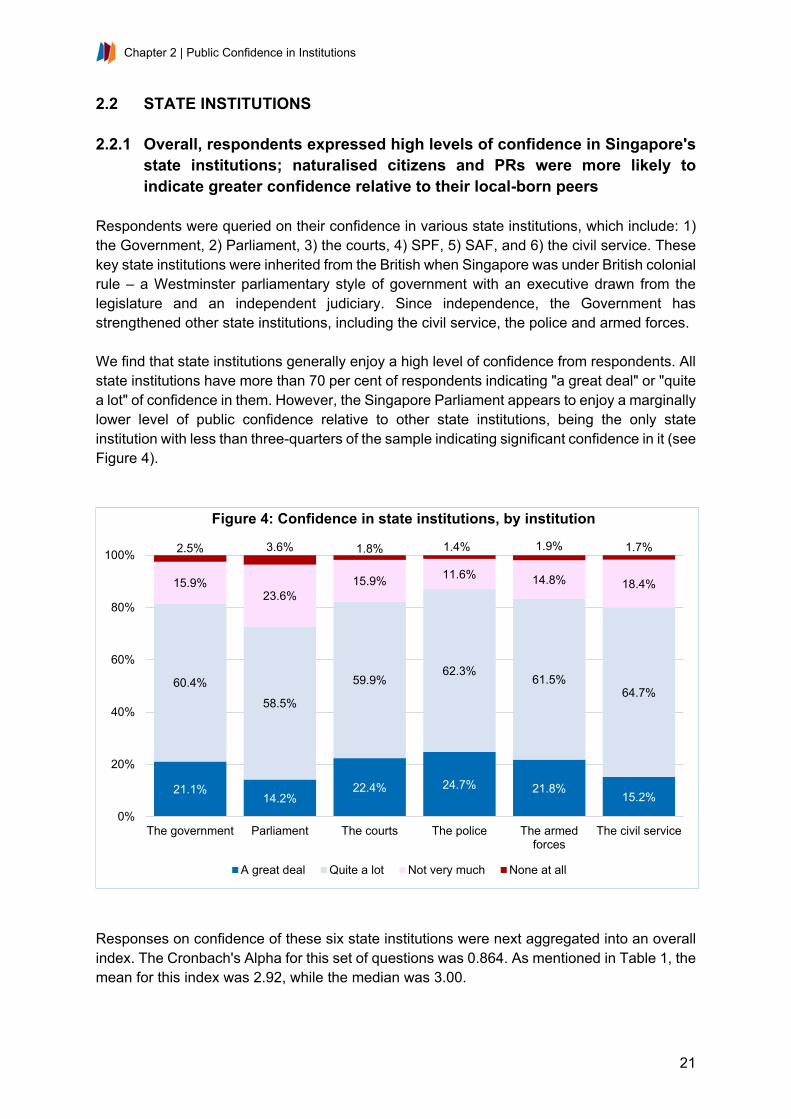
Respondents were queried on their confidence in various state institutions, which include: 1) the Government, 2) Parliament, 3) the courts, 4) SPF, 5) SAF, and 6) the civil service. These key state institutions were inherited from the British when Singapore was under British colonial rule – a Westminster parliamentary style of government with an executive drawn from the legislature and an independent judiciary. Since independence, the Government has strengthened other state institutions, including the civil service, the police and armed forces. We find that state institutions generally enjoy a high level of confidence from respondents. All state institutions have more than 70 per cent of respondents indicating "a great deal" or "quite a lot" of confidence in them. However, the Singapore Parliament appears to enjoy a marginally lower level of public confidence relative to other state institutions, being the only state institution with less than three-quarters of the sample indicating significant confidence in it (see Figure 4).
Responses on confidence of these six state institutions were next aggregated into an overall index. The Cronbach's Alpha for this set of questions was 0.864. As mentioned in Table 1, the mean for this index was 2.92, while the median was 3.00.
21.1%14.2%
22.4% 24.7% 21.8%15.2%
60.4%
58.5%
59.9%62.3%
61.5%64.7%
15.9%23.6%
15.9% 11.6% 14.8% 18.4%
2.5% 3.6% 1.8% 1.4% 1.9% 1.7%
0%
20%
40%
60%
80%
100%
The government Parliament The courts The police The armedforces
The civil service
Figure 4: Confidence in state institutions, by institution
A great deal Quite a lot Not very much None at all
Attitudes towards Institutions, Politics, and Policies
22
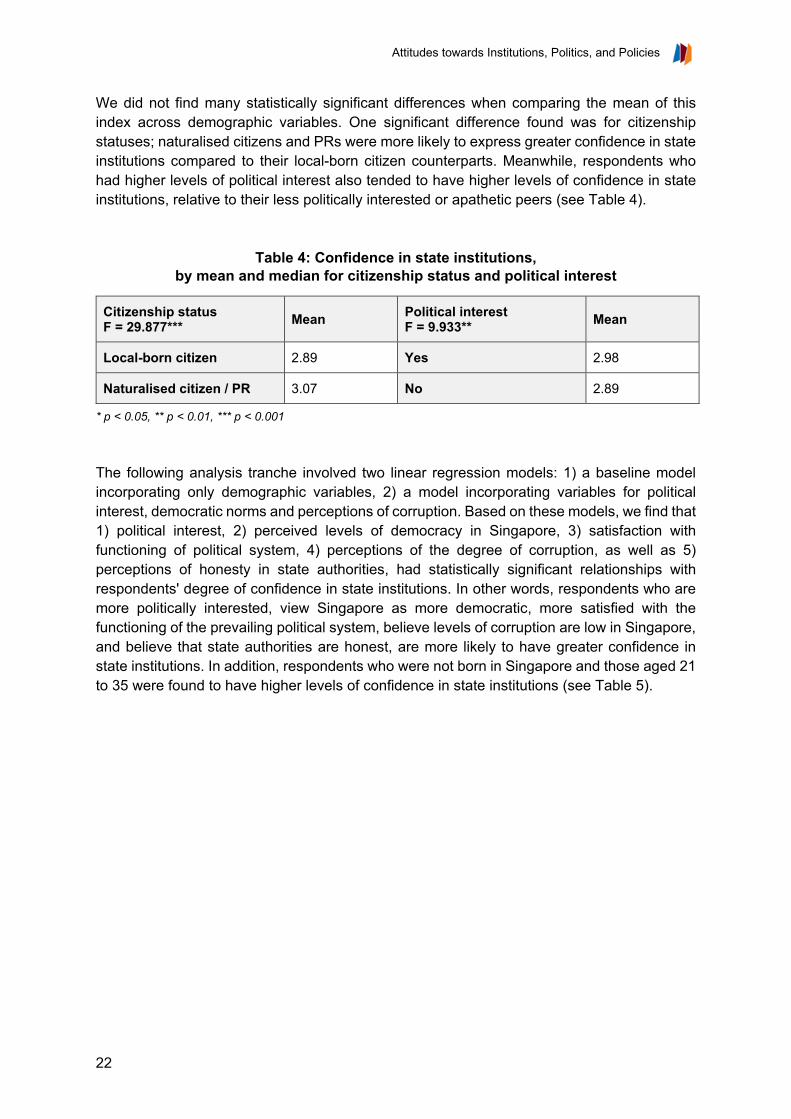
We did not find many statistically significant differences when comparing the mean of this index across demographic variables. One significant difference found was for citizenship statuses; naturalised citizens and PRs were more likely to express greater confidence in state institutions compared to their local-born citizen counterparts. Meanwhile, respondents who had higher levels of political interest also tended to have higher levels of confidence in state institutions, relative to their less politically interested or apathetic peers (see Table 4).
Table 4: Confidence in state institutions, by mean and median for citizenship status and political interest
Citizenship status F = 29.877*** Mean Political interest
F = 9.933** Mean
Local-born citizen 2.89 Yes 2.98
Naturalised citizen / PR 3.07 No 2.89
* p < 0.05, ** p < 0.01, *** p < 0.001 The following analysis tranche involved two linear regression models: 1) a baseline model incorporating only demographic variables, 2) a model incorporating variables for political interest, democratic norms and perceptions of corruption. Based on these models, we find that 1) political interest, 2) perceived levels of democracy in Singapore, 3) satisfaction with functioning of political system, 4) perceptions of the degree of corruption, as well as 5) perceptions of honesty in state authorities, had statistically significant relationships with respondents' degree of confidence in state institutions. In other words, respondents who are more politically interested, view Singapore as more democratic, more satisfied with the functioning of the prevailing political system, believe levels of corruption are low in Singapore, and believe that state authorities are honest, are more likely to have greater confidence in state institutions. In addition, respondents who were not born in Singapore and those aged 21 to 35 were found to have higher levels of confidence in state institutions (see Table 5).

Chapter 2 | Public Confidence in Institutions
23
Table 5: Confidence in state institutions (linear regressions)
Variables Model 1 Standardised Coefficient
Model 2 Standardised Coefficient
Political interest (Y/N) .052*
How democratic is SG .155***
Satisfaction with political system functioning
.238***
Degree of corruption in SG -.153***
State authorities are honest (Y/N) .061**
Local-born (vs not local-born) -.117*** -.048*
Gender (females vs males) .016 -.011
Age
21-35 -.052 .068*
36-50 -.039 .046
51-65 -.034 .026
Reference group: Above 65
Education
Below secondary school -.013 .014
Secondary school/ ITE -.021 .025
Diploma/ Prof. qualification .014 .028
Reference group: Bachelor's and above
Housing type
1- 3-room HDB -.049 -.055
4-room HDB -.025 -.042
5+-room HDB -.011 -.025
Reference group: Private property
Adjusted R2 .012 .216
* p < 0.05, ** p < 0.01, *** p < 0.001 Next, we will describe the findings for the individual component questions of this index and present significant demographic differences from sub-sections 2.2.2 thru 2.2.7. 2.2.2 Most respondents expressed confidence in Government and believed
that there was low or no prevalence of corruption in Singapore; these proportions were among the highest globally
A majority of Singapore respondents (81.5 per cent) indicated significant confidence in the Government, with 21.1 per cent indicating "a great deal of confidence" and 60.4 per cent indicating "quite a lot of confidence". When compared against other polities, only Mainland China had a higher confidence rate, with 94.9 per cent saying that they had either "a great

Attitudes towards Institutions, Politics, and Policies
24
deal" or "quite a lot" of confidence in their government. Respondents from Thailand, Taiwan, Hong Kong, Malaysia, South Korea, Sweden, and Switzerland also expressed relatively high levels of confidence in their governments. In contrast, less than half of respondents in Japan, Australia, the US, and the UK expressed confidence in their governments (see Figure 5).
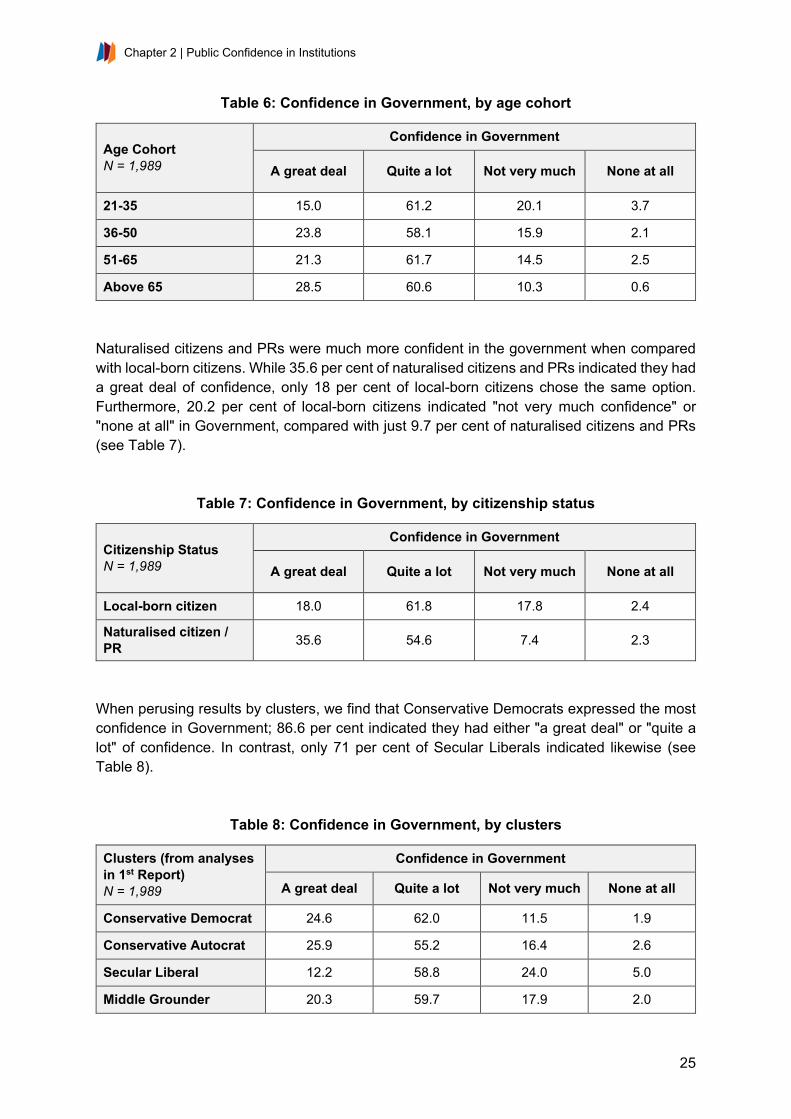
When perusing results by age cohort, we find a positive correlation between confidence in Government and age. Similar proportions of respondents across all age groups — between 58 per cent and 62 per cent — choosing "quite a lot of confidence" as their answer. However, a much lower proportion of respondents from the youngest age cohort (15 per cent) compared with those in the oldest age cohort (28.5 per cent) indicated "a great deal of confidence" in the Government (see Table 6).
21.1%11.6% 13.2%
3.5% 4.2%
47.8%
11.8% 7.1% 4.1% 8.4% 4.7% 5.0% 9.3%
60.4%
38.6%42.4%
39.9%47.1%
47.1%
43.4%46.0%
26.3%25.3%
24.9%
46.8%
57.6%
15.9%
36.4%33.6%
45.7%40.9%
4.4%
33.4% 34.7%
50.7%37.1%
50.5%
38.4%
28.2%
2.5%13.5% 10.7% 10.9% 7.8%
0.7%
11.4% 12.2%18.9%
29.3%19.9%
9.8%4.9%
0%
10%
20%
30%
40%
50%
60%
70%
80%
90%
100%
Figure 5: Confidence in governments, by polity
A great deal Quite a lot Not very much None at all
Chapter 2 | Public Confidence in Institutions
25
Table 6: Confidence in Government, by age cohort
Age Cohort N = 1,989
Confidence in Government
A great deal Quite a lot Not very much None at all
21-35 15.0 61.2 20.1 3.7
36-50 23.8 58.1 15.9 2.1
51-65 21.3 61.7 14.5 2.5
Above 65 28.5 60.6 10.3 0.6
Naturalised citizens and PRs were much more confident in the government when compared with local-born citizens. While 35.6 per cent of naturalised citizens and PRs indicated they had a great deal of confidence, only 18 per cent of local-born citizens chose the same option. Furthermore, 20.2 per cent of local-born citizens indicated "not very much confidence" or "none at all" in Government, compared with just 9.7 per cent of naturalised citizens and PRs (see Table 7).
Table 7: Confidence in Government, by citizenship status
Citizenship Status N = 1,989
Confidence in Government
A great deal Quite a lot Not very much None at all
Local-born citizen 18.0 61.8 17.8 2.4
Naturalised citizen / PR 35.6 54.6 7.4 2.3
When perusing results by clusters, we find that Conservative Democrats expressed the most confidence in Government; 86.6 per cent indicated they had either "a great deal" or "quite a lot" of confidence. In contrast, only 71 per cent of Secular Liberals indicated likewise (see Table 8).
Table 8: Confidence in Government, by clusters
Clusters (from analyses in 1st Report) N = 1,989
Confidence in Government
A great deal Quite a lot Not very much None at all
Conservative Democrat 24.6 62.0 11.5 1.9
Conservative Autocrat 25.9 55.2 16.4 2.6
Secular Liberal 12.2 58.8 24.0 5.0
Middle Grounder 20.3 59.7 17.9 2.0
Attitudes towards Institutions, Politics, and Policies
26
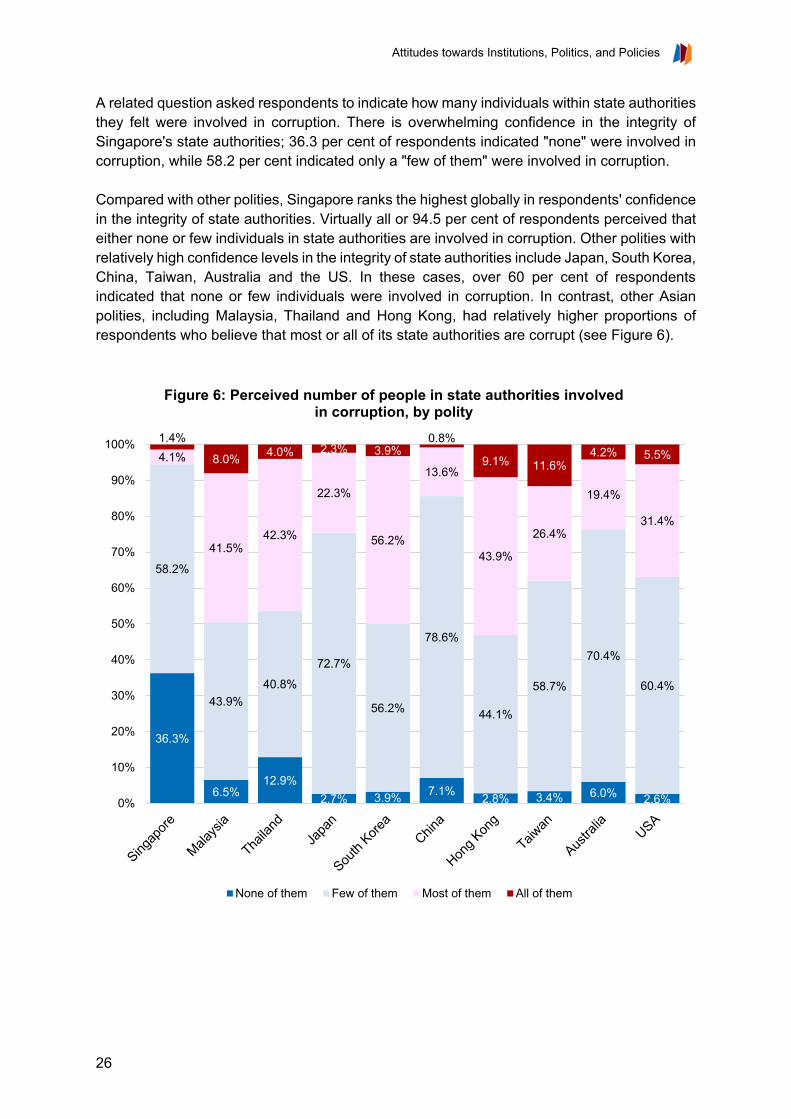
A related question asked respondents to indicate how many individuals within state authorities they felt were involved in corruption. There is overwhelming confidence in the integrity of Singapore's state authorities; 36.3 per cent of respondents indicated "none" were involved in corruption, while 58.2 per cent indicated only a "few of them" were involved in corruption. Compared with other polities, Singapore ranks the highest globally in respondents' confidence in the integrity of state authorities. Virtually all or 94.5 per cent of respondents perceived that either none or few individuals in state authorities are involved in corruption. Other polities with relatively high confidence levels in the integrity of state authorities include Japan, South Korea, China, Taiwan, Australia and the US. In these cases, over 60 per cent of respondents indicated that none or few individuals were involved in corruption. In contrast, other Asian polities, including Malaysia, Thailand and Hong Kong, had relatively higher proportions of respondents who believe that most or all of its state authorities are corrupt (see Figure 6).
36.3%
6.5%12.9%
2.7% 3.9% 7.1% 2.8% 3.4% 6.0% 2.6%
58.2%
43.9%40.8%
72.7%
56.2%
78.6%
44.1%
58.7%
70.4%
60.4%
4.1%
41.5%42.3%
22.3%
56.2%
13.6%
43.9%
26.4%
19.4%
31.4%
1.4%
8.0% 4.0% 2.3% 3.9%0.8%
9.1% 11.6%4.2% 5.5%
0%
10%
20%
30%
40%
50%
60%
70%
80%
90%
100%
Figure 6: Perceived number of people in state authorities involved in corruption, by polity
None of them Few of them Most of them All of them
Chapter 2 | Public Confidence in Institutions
27
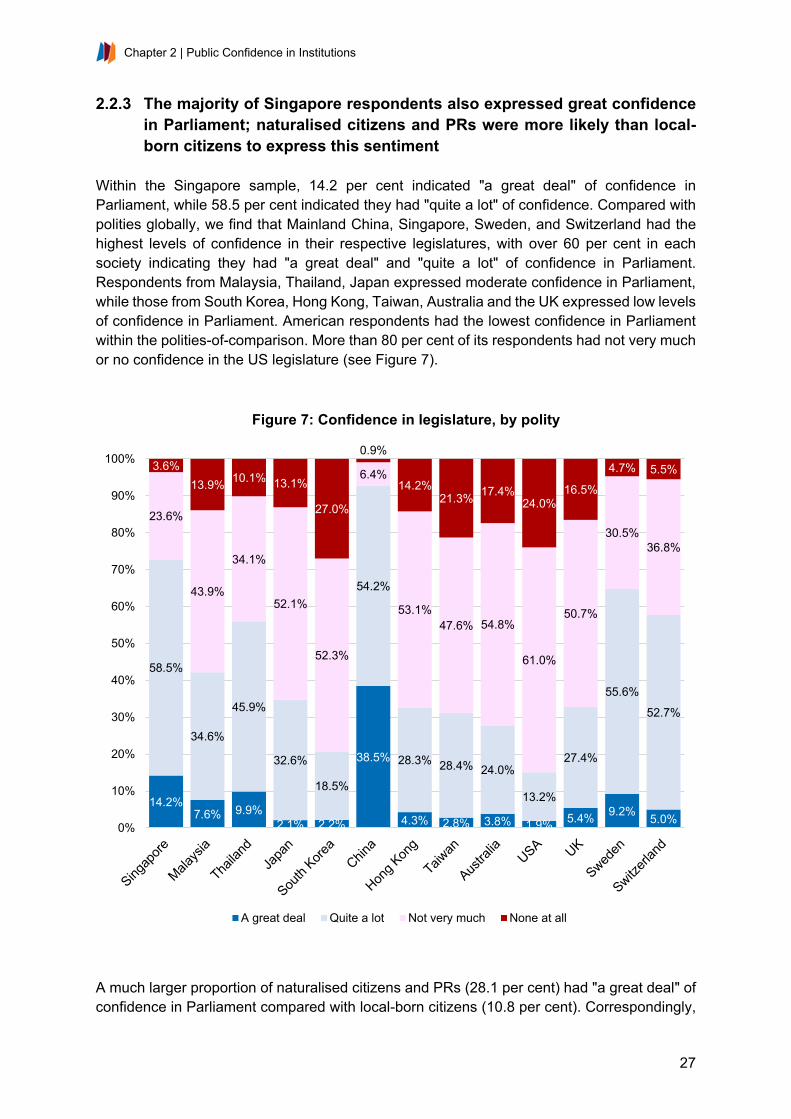
2.2.3 The majority of Singapore respondents also expressed great confidence in Parliament; naturalised citizens and PRs were more likely than local-born citizens to express this sentiment
Within the Singapore sample, 14.2 per cent indicated "a great deal" of confidence in Parliament, while 58.5 per cent indicated they had "quite a lot" of confidence. Compared with polities globally, we find that Mainland China, Singapore, Sweden, and Switzerland had the highest levels of confidence in their respective legislatures, with over 60 per cent in each society indicating they had "a great deal" and "quite a lot" of confidence in Parliament. Respondents from Malaysia, Thailand, Japan expressed moderate confidence in Parliament, while those from South Korea, Hong Kong, Taiwan, Australia and the UK expressed low levels of confidence in Parliament. American respondents had the lowest confidence in Parliament within the polities-of-comparison. More than 80 per cent of its respondents had not very much or no confidence in the US legislature (see Figure 7).
A much larger proportion of naturalised citizens and PRs (28.1 per cent) had "a great deal" of confidence in Parliament compared with local-born citizens (10.8 per cent). Correspondingly,
14.2%7.6% 9.9%
2.1% 2.2%
38.5%
4.3% 2.8% 3.8% 1.9% 5.4% 9.2% 5.0%
58.5%
34.6%
45.9%
32.6%
18.5%
54.2%
28.3% 28.4% 24.0%
13.2%
27.4%
55.6%
52.7%
23.6%
43.9%
34.1%
52.1%
52.3%
6.4%
53.1%47.6% 54.8%
61.0%
50.7%
30.5%36.8%
3.6%13.9% 10.1% 13.1%
27.0%
0.9%
14.2%21.3% 17.4%
24.0%16.5%
4.7% 5.5%
0%
10%
20%
30%
40%
50%
60%
70%
80%
90%
100%
Figure 7: Confidence in legislature, by polity
A great deal Quite a lot Not very much None at all

Attitudes towards Institutions, Politics, and Policies
28
naturalised citizens and PRs reported a much higher level of overall confidence in Parliament at 83 per cent, compared with only 70.9 per cent of local-born citizens. When the results are further broken down by clusters, we find that Secular Liberals have the least confidence in Parliament relative to other clusters. This was the only cluster with over 30 per cent of respondents indicating not very much or no confidence at all in Parliament (see Tables 9 and 10).
Table 9: Confidence in Parliament, by citizenship status
Citizenship status N = 1,925
Confidence in Parliament
A great deal Quite a lot Not very much None at all
Local-born citizen 10.8 60.1 25.4 3.7
Naturalised citizen / PR 28.1 54.9 13.8 3.2
Table 10: Confidence in Parliament, by clusters
Clusters (from analyses in 1st Report) N = 1,925
Confidence in Parliament
A great deal Quite a lot Not very much None at all
Conservative Democrat 14.9 62.6 20.1 2.4
Conservative Autocrat 22.2 48.5 25.3 4.0
Secular Liberal 7.9 56.5 28.1 7.6
Middle Grounder 14.7 57.2 24.7 3.4
2.2.4 Over four-fifths of Singapore respondents expressed confidence in the
courts; this proportion is among the highest globally alongside Japan, Mainland China, and Hong Kong
There were similarly high confidence levels for the courts, with 22.4 per cent of Singapore respondents indicating "a great deal" of confidence and 59.9 per cent indicating "quite a lot of confidence". The high level of confidence in Singapore's judiciary is similar to levels reported in Japan, Mainland China, Hong Kong, and Sweden. In contrast, the Taiwanese, Australians, and Americans have markedly lower confidence in their courts, with less than 60 per cent of respondents in these polities indicating as such (see Figure 8).

Chapter 2 | Public Confidence in Institutions
29
2.2.5 Over four-fifths of respondents also indicated great confidence in the
SAF; these levels were among the highest globally Respondents had quite a high level of confidence in the Singapore Armed Forces (SAF), where 21.8 per cent chose the "a great deal" option, while 61.5 per cent chose "quite a lot". When compared against selected societies, Singaporean respondents have similar confidence rates in the armed forces as those in China, Japan, Australia, the USA and the UK. In comparison, respondents from Malaysia, Thailand, South Korea, Hong Kong, Taiwan and Sweden expressed lower confidence in their armed forces (see Figure 9).
22.4%18.0%
26.9%20.4%
6.3%
28.6% 25.5%
8.9%14.2% 11.2%
18.0% 18.7%10.2%
59.9%
44.7%
42.7%65.2%
55.2%
57.7%54.5%
48.6%45.4%
46.6%
46.5%
59.3%
60.5%
15.9%
33.2%24.8%
12.3%
32.9%
12.3%17.7%
32.7% 31.8% 35.4%29.6%
18.6%25.3%
1.8% 4.0% 5.6% 2.1% 5.5% 1.4% 2.2%9.7% 8.7% 6.7% 5.9% 3.3% 4.0%
0%
10%
20%
30%
40%
50%
60%
70%
80%
90%
100%
Figure 8: Confidence in the courts, by polity
A great deal Quite a lot Not very much None at all

Attitudes towards Institutions, Politics, and Policies
30
2.2.6 Public confidence in the SPF was the highest among all state institutions,
and also globally across all polities of comparison There was quite a high level of confidence in the Singapore Police Force (SPF), with over 80 per cent saying they either had a great deal or quite a lot of confidence in them. More specifically, 24.7 per cent chose "a great deal", and 62.3 per cent chose "quite a lot" as their answers. Singaporean respondents' confidence level in the police was similar to that of respondents from China, Japan, Taiwan, Australia, Sweden, and Switzerland. Meanwhile, respondents from Malaysia, Thailand, South Korea, Hong Kong showed lower confidence in their respective police forces (see Figure 10).
21.8% 22.1%15.4%
26.0%
5.1%
49.5%
12.2% 13.7%
31.0% 33.2%39.5%
8.0% 8.4%
61.5%52.4%
45.8%
61.0%
48.8%
46.0%
43.7%50.8%
51.7% 48.1%
47.9%
50.4% 48.8%
14.8%22.6%
27.7%
11.4%
40.4%
4.1%
35.5%
30.5%
13.5% 15.4%10.3%
38.1%34.6%
1.9% 2.8%11.1%
1.5%5.7%
0.5%
8.6% 5.0% 3.8% 3.3% 2.3% 3.6%8.2%
0%
10%
20%
30%
40%
50%
60%
70%
80%
90%
100%
Figure 9: Confidence in armed forces, by polity
A great deal Quite a lot Not very much None at all

Chapter 2 | Public Confidence in Institutions
31
Compared with 22 per cent of local-born citizens, 35.2 per cent of naturalised citizens and PRs indicated they had a great deal of confidence in the SPF. While a larger proportion of local-born citizens compared with naturalised citizens and PRs noted that they had quite a lot of confidence in the SPF, there was still a greater proportion of the former choosing the options "not very much" and "none at all" (see Table 11).
Table 11: Confidence in the SPF, by citizenship status
Citizenship status N = 1,992
Confidence in the SPF
A great deal Quite a lot Not very much None at all
Local-born citizen 22.0 63.9 12.5 1.5
Naturalised citizen / PR 35.2 55.7 8.4 0.8
24.7%14.9% 12.1%
17.3%
5.4%
28.8%
14.5%19.9%
29.4%20.9% 24.4% 24.4%
19.6%
62.3%
44.7%41.2%
64.4%
51.2%
56.0%
53.3%
62.7%51.3%
47.9%
52.2%61.9%
65.8%
11.6%
34.8%
35.4%
16.0%
38.9%
13.1%
26.1%
14.5% 15.5%
24.7%19.9%
12.2% 13.1%
1.4%5.7%
11.3%2.3% 4.6% 2.1% 6.1% 2.8% 3.8% 6.6% 3.5%
1.5% 1.5%
0%
10%
20%
30%
40%
50%
60%
70%
80%
90%
100%
Figure 10: Confidence in police force, by polity
A great deal Quite a lot Not very much None at all

Attitudes towards Institutions, Politics, and Policies
32
2.2.7 Four-fifths of respondents were confident in the Singapore Civil Service, and very few believed that civil servants are involved in corruption
Respondents generally have some level of confidence in the Singapore Civil Service, with 15.2 per cent choosing "a great deal" and 64.7 per cent choosing "quite a lot" as their responses. The results from Singapore are similar to those reported by Mainland China; over 80 per cent of respondents in these polities expressed high levels of confidence in the civil service. Other polities reflect moderately high confidence levels in their respective civil services, except for the US, which reported the lowest confidence (41.9 per cent) in the American bureaucracy (see Figure 11).
While 12.9 per cent of local-born citizens had a great deal of confidence in the Singapore Civil Service, 24.7 per cent of naturalised citizens and PRs gave the same answer. Furthermore, only 11.3 per cent of naturalised citizens and PRs, compared with 20.3 per cent of local-born citizens, had not very much confidence. It thus appears that naturalised citizens and PRs had a much higher level of confidence in the civil service when compared with local-born citizens (see Table 12).
15.2% 11.4% 15.0%
2.8% 3.5%
26.0%
6.3% 6.7% 4.8% 4.4%9.5% 6.2% 6.0%
64.7%
48.6%46.4%
46.4%52.9%
60.9%
50.9%58.8%
44.2%37.5%
46.3%57.8% 60.3%
18.4%
35.9% 31.7%
42.3%
39.5%
11.5%
37.2%29.2%
44.1%47.2%
37.8%32.0% 30.3%
1.7%4.1% 6.8% 8.6%
4.0%1.6%
5.6% 5.3% 6.9% 10.8% 6.5% 4.0% 3.4%
0%
10%
20%
30%
40%
50%
60%
70%
80%
90%
100%
Figure 11: Confidence in the civil service, by polity
A great deal Quite a lot Not very much None at all
Chapter 2 | Public Confidence in Institutions
33
Table 12: Confidence in the Singapore Civil Service, by citizenship status
Citizenship status N = 1,963
Confidence in the Singapore Civil Service
A great deal Quite a lot Not very much None at all
Local-born citizen 12.9 65.1 20.3 1.8
Naturalised citizen / PR 24.7 62.6 11.3 1.3
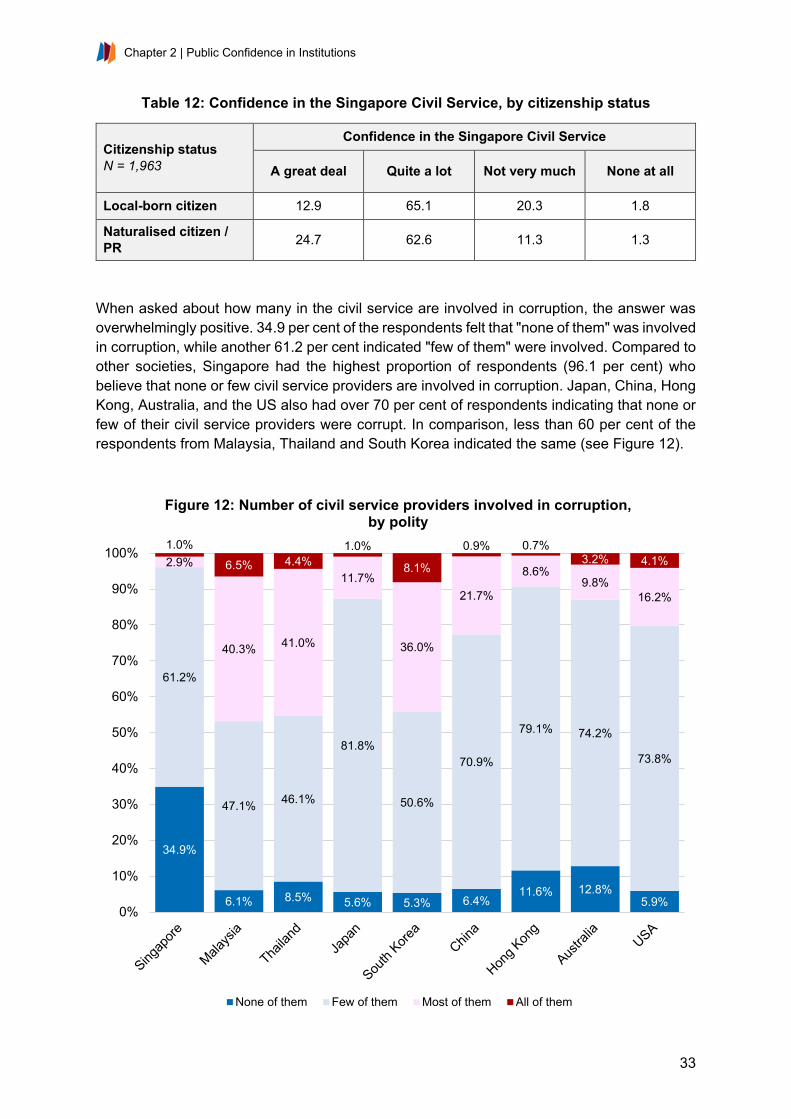
When asked about how many in the civil service are involved in corruption, the answer was overwhelmingly positive. 34.9 per cent of the respondents felt that "none of them" was involved in corruption, while another 61.2 per cent indicated "few of them" were involved. Compared to other societies, Singapore had the highest proportion of respondents (96.1 per cent) who believe that none or few civil service providers are involved in corruption. Japan, China, Hong Kong, Australia, and the US also had over 70 per cent of respondents indicating that none or few of their civil service providers were corrupt. In comparison, less than 60 per cent of the respondents from Malaysia, Thailand and South Korea indicated the same (see Figure 12).
34.9%
6.1% 8.5% 5.6% 5.3% 6.4%11.6% 12.8%
5.9%
61.2%
47.1% 46.1%
81.8%
50.6%
70.9%
79.1% 74.2%
73.8%
2.9%
40.3% 41.0%
11.7%
36.0%
21.7%
8.6%9.8%
16.2%
1.0%
6.5% 4.4%1.0%
8.1%
0.9% 0.7%3.2% 4.1%
0%
10%
20%
30%
40%
50%
60%
70%
80%
90%
100%
Figure 12: Number of civil service providers involved in corruption, by polity
None of them Few of them Most of them All of them

Attitudes towards Institutions, Politics, and Policies
34
2.3 ELECTORAL INSTITUTIONS 2.3.1 Though most were confident in electoral institutions like elections and
political parties, the less-educated, naturalised citizens and PRs were more likely to express such sentiments
Respondents revealed generally high levels of confidence in electoral institutions like elections and political parties. When asked about elections, 13 per cent indicated they had a great deal of confidence, while 57 per cent had quite a lot of confidence. However, the proportion of respondents indicating likewise about political parties were smaller in comparison; 7.2 per cent had "a great deal of confidence" and 47.5 per cent had "quite a lot of confidence" (see Figure 13).
Reactions towards electoral institutions were aggregated into an overall index. The Cronbach's Alpha for this set of questions was 0.733. For this index, the mean was 2.55, and the median was 2.75. Education had a negative impact on the degree of confidence people had in electoral institutions, with higher-educated groups reporting a lower mean score. Meanwhile, respondents earning between $3,000 and $4,999 and those earning above $6,999 were least confident in electoral institutions, while those earning between $5,000 and $6,999 were the most confident. Naturalised citizens and PRs were more confident than local-born citizens, while those with higher political interest expressed higher confidence than those with no political interest. In addition, respondents who felt that honest elections were "very important" or "rather important" expressed higher confidence, compared to those who felt elections were "not very important" or "not at all important" (see Tables 13 and 14).
13.0% 7.2%
57.0%
47.5%
25.9%
40.5%
4.1% 4.9%
0%
20%
40%
60%
80%
100%
Elections Political parties
Figure 13: Confidence in electoral institutions, by item
A great deal Quite a lot Not very much None at all

Chapter 2 | Public Confidence in Institutions
35
Table 13: Confidence in electoral institutions, by mean and median for education level, income and citizenship status
Education F = 3.888** Mean Income
F = 2.381* Mean Citizenship status F = 6.267*
Mean
Below secondary 5.28 Below $1,500 5.09 Local-born
citizen 5.06
Secondary / ITE 5.16 $1,500-$2,999 5.20 Naturalised citizen / PR 5.29
Dip. / Prof. qual. 5.12 $3,000-$4,999 4.94
Bachelor’s and above 4.95 $5,000-$6,999 5.33
Above $6,999 4.99
* p < 0.05, ** p < 0.01, *** p < 0.001
Table 14: Confidence in electoral institutions, by mean and median for importance of honest elections and political interest
Importance of honest elections F = 15.658***
Mean Political interest F = 11.829*** Mean
Very or rather important 5.16 Yes 5.27
Not very or not at all important 4.48 No 5.01
* p < 0.05, ** p < 0.01, *** p < 0.001 When we build linear regression models to ascertain the main factors impacting confidence in electoral institutions, we find that respondents who 1) are more interested in politics, 2) think Singapore is more democratic, 3) more satisfied with the functioning of the political system, and 4) believe there are low levels of corruption in Singapore, are more likely to be confident in electoral institutions. Additionally, younger respondents aged between 21 and 50 and the less educated were more likely to feel this way (see Table 15).

Attitudes towards Institutions, Politics, and Policies
36
Table 15: Confidence in electoral institutions (linear regressions)
Variables Model 1 Standardised Coefficient
Model 2 Standardised Coefficient
Political interest (Y/N) .083***
How democratic is SG .104***
Satisfaction with political system functioning
.225***
Degree of corruption in SG -.116***
Local-born (vs not local-born) -.056* .001
Gender (females vs males) .033 .016
Age
21-35 -.023 .076*
36-50 -.001 .070*
51-65 .007 .059
Reference group: Above 65
Education
Below secondary school .110*** .134***
Secondary school/ ITE .062* .101***
Diploma/ Professional qualification .050 .063**
Reference group: Bachelor's and above
Housing type
1- 3-room HDB -.022 -.020
4-room HDB .019 .018
5+-room HDB .034 .030
Reference group: Private property
Adjusted R2 .010 .142
* p < 0.05, ** p < 0.01, *** p < 0.001 2.3.2 Naturalised citizens, PRs and older respondents were more likely to
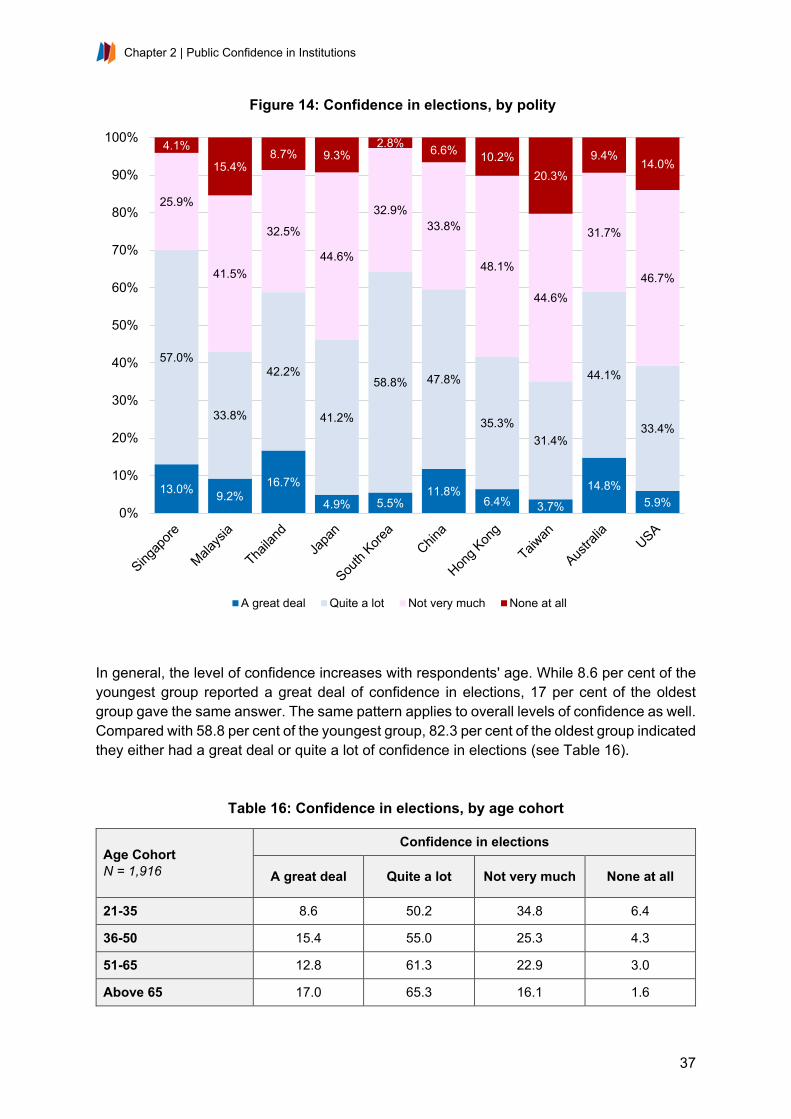
express confidence in elections With regard to elections, 13 per cent indicated they had a great deal of confidence, while 57 per cent had quite a lot of confidence. Compared to other selected societies, Singapore had the highest proportion of respondents reporting either a great deal or quite a lot of confidence in elections. Thailand, South Korea, China, and Australia also reported confidence levels similar to those found in Singapore. Meanwhile, less than half of respondents from Malaysia, Japan, Hong Kong, Taiwan, and the US reported some confidence in elections (see Figure 14).
Chapter 2 | Public Confidence in Institutions
37
In general, the level of confidence increases with respondents' age. While 8.6 per cent of the youngest group reported a great deal of confidence in elections, 17 per cent of the oldest group gave the same answer. The same pattern applies to overall levels of confidence as well. Compared with 58.8 per cent of the youngest group, 82.3 per cent of the oldest group indicated they either had a great deal or quite a lot of confidence in elections (see Table 16).
Table 16: Confidence in elections, by age cohort
Age Cohort N = 1,916
Confidence in elections
A great deal Quite a lot Not very much None at all
21-35 8.6 50.2 34.8 6.4
36-50 15.4 55.0 25.3 4.3
51-65 12.8 61.3 22.9 3.0
Above 65 17.0 65.3 16.1 1.6
13.0% 9.2%16.7%
4.9% 5.5%11.8%
6.4% 3.7%
14.8%5.9%
57.0%
33.8%
42.2%
41.2%
58.8% 47.8%
35.3%31.4%
44.1%
33.4%
25.9%
41.5%
32.5%
44.6%
32.9%33.8%
48.1%
44.6%
31.7%
46.7%
4.1%
15.4%8.7% 9.3%
2.8% 6.6% 10.2%20.3%
9.4%14.0%
0%
10%
20%
30%
40%
50%
60%
70%
80%
90%
100%
Figure 14: Confidence in elections, by polity
A great deal Quite a lot Not very much None at all

Attitudes towards Institutions, Politics, and Policies
38
There were similar proportions of those indicating "quite a lot" and "none at all" for local-born citizens and naturalised citizens and PRs. However, a larger proportion of naturalised citizens and PRs (20.6 per cent) reported a great deal of confidence in elections compared with local-born citizens (11.3 per cent) (see Table 17).
Table 17: Confidence in elections, by citizenship status
Citizenship status N = 1,916
Confidence in elections
A great deal Quite a lot Not very much None at all
Local-born citizen 11.3 57.0 27.4 4.3
Naturalised citizen / PR 20.6 57.4 19.0 3.0
2.3.3 Naturalised citizens, PRs and less-educated respondents were more
likely to have "a great deal" of confidence in political parties Only a small proportion (7.2 per cent) had a great deal of confidence in political parties. However, when combined with the response rate for "quite a lot" (47.5 per cent), we find a slight majority expressing some level of confidence for Singapore's political parties. When compared with other selected polities, Singapore and China were the only two for which a majority expressed some level of confidence in political parties. Chinese respondents were by far the most confident, with 91 per cent saying they had a great deal or quite a lot of confidence. Over 30 per cent of Thai, Malaysian, Japanese, and Swedish respondents indicated some confidence in political parties (see Figure 15).

Chapter 2 | Public Confidence in Institutions
39
Local-born citizens (5.7 per cent) were less likely to say they had a great deal of confidence in political parties compared with naturalised citizens and PRs (13.9 per cent). Furthermore, a larger proportion of local-born citizens (47 per cent) noted they did not have very much or any confidence in political parties, compared with 37.1 per cent of naturalised citizens and PRs (see Table 18).
Table 18: Confidence in political parties, by citizenship status
Citizenship status N = 1,913
Confidence in political parties
A great deal Quite a lot Not very much None at all
Local-born citizen 5.7 47.2 42.1 4.9
Naturalised citizen / PR 13.9 49.1 32.8 4.3
7.2% 4.0%8.4% 1.9% 2.6%
36.7%
2.4% 2.0% 0.8% 1.7% 1.7% 2.0% 0.6%
47.5%
27.5%
31.5%
27.1% 21.9%
54.3%
21.7% 21.9%9.9% 9.5% 14.8%
30.4%25.3%
40.5%
50.3%
45.4%57.6%
58.1%
8.0%
57.9%50.3%
62.7% 64.5%60.9%
58.5%
60.3%
4.9%
18.2% 14.7% 13.3% 17.4%
1.0%
18.1%25.8% 26.6% 24.2% 22.5%
9.1%13.8%
0%
10%
20%
30%
40%
50%
60%
70%
80%
90%
100%
Figure 15: Confidence in political parties, by polity
A great deal Quite a lot Not very much None at all

Attitudes towards Institutions, Politics, and Policies
40
Respondents with below secondary education were the most likely to say that they had a great deal of confidence compared with the other groups. As 11.3 per cent chose that option, while 52.8 per cent reported quite a lot of confidence in political parties, this group reported the highest overall confidence rate amongst the other education groups. In contrast, those with university degrees reported much lower rates, with only 48.4 per cent indicating they had "a great deal" or "quite a lot" of confidence in political parties (see Table 19).
Table 19: Confidence in political parties, by education level
Education level N = 1,909
Confidence in political parties
A great deal Quite a lot Not very much None at all
Below secondary 11.3 52.8 33.0 2.9
Secondary / ITE 8.5 45.6 41.2 4.8
Dip. / Prof. qual. 6.2 52.3 35.6 5.9
Bachelor's and above 4.9 43.5 46.3 5.2
2.4 ECONOMIC AND ACADEMIC INSTITUTIONS 2.4.1 Two-thirds or more of respondents indicate confidence in Singapore's
financial institutions The majority of survey respondents had considerable confidence in two financial institutions they were queried on: 1) Singapore's Central Provident Fund (CPF), a compulsory comprehensive savings and pension programme that funds retirement, healthcare, and housing needs of Singapore Citizens and Permanent Residents, and 2) local banks. Over three-quarters of respondents indicated confidence in Singapore's Central Provident Fund (CPF), with 20.3 per cent of the population having "a great deal of confidence" and 56.7 per cent having "quite a lot of confidence" in the organisation. Since the CPF is a Singaporean institution, the question was only posed to local respondents (see Figure 16).
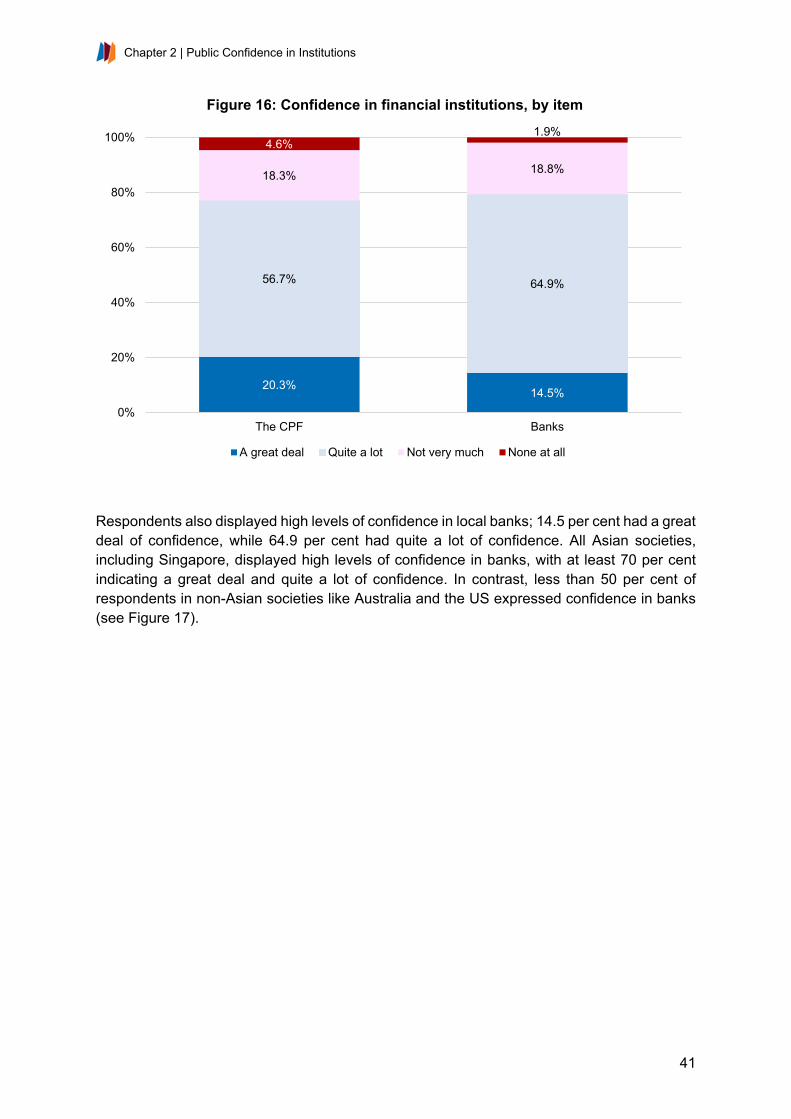
Chapter 2 | Public Confidence in Institutions
41
Respondents also displayed high levels of confidence in local banks; 14.5 per cent had a great deal of confidence, while 64.9 per cent had quite a lot of confidence. All Asian societies, including Singapore, displayed high levels of confidence in banks, with at least 70 per cent indicating a great deal and quite a lot of confidence. In contrast, less than 50 per cent of respondents in non-Asian societies like Australia and the US expressed confidence in banks (see Figure 17).
20.3% 14.5%
56.7% 64.9%
18.3% 18.8%
4.6%1.9%
0%
20%
40%
60%
80%
100%
The CPF Banks
Figure 16: Confidence in financial institutions, by item
A great deal Quite a lot Not very much None at all

Attitudes towards Institutions, Politics, and Policies
42
2.4.2 Three-fifths of respondents indicated confidence in major companies;
Singapore respondents were the least likely globally to believe that business executives are corrupt, though the less educated and affluent were more likely to think otherwise
There was lower confidence in major companies, where only 4.2 per cent reported a great deal of confidence, while 55.9 per cent indicated they had a lot of confidence. Nonetheless, Singapore respondents had relatively higher confidence levels in major companies compared to those from Thailand, Japan, South Korea and Hong Kong (see Figure 18).
14.5% 18.5%
31.3%
8.0% 6.2%
25.9%18.4% 15.6%
4.2% 4.9%
64.9% 56.9%
48.6%
62.9% 65.1%
64.6%
63.9% 68.2%
30.9%39.6%
18.8% 22.6% 15.8%25.3% 26.8%
8.8%16.2% 14.0%
44.6%
43.1%
1.9% 1.9% 4.3% 3.8% 1.9%0.6% 1.5%
2.3%
20.2%12.3%
0%
10%
20%
30%
40%
50%
60%
70%
80%
90%
100%
Figure 17: Confidence in banks, by polity
A great deal Quite a lot Not very much None at all
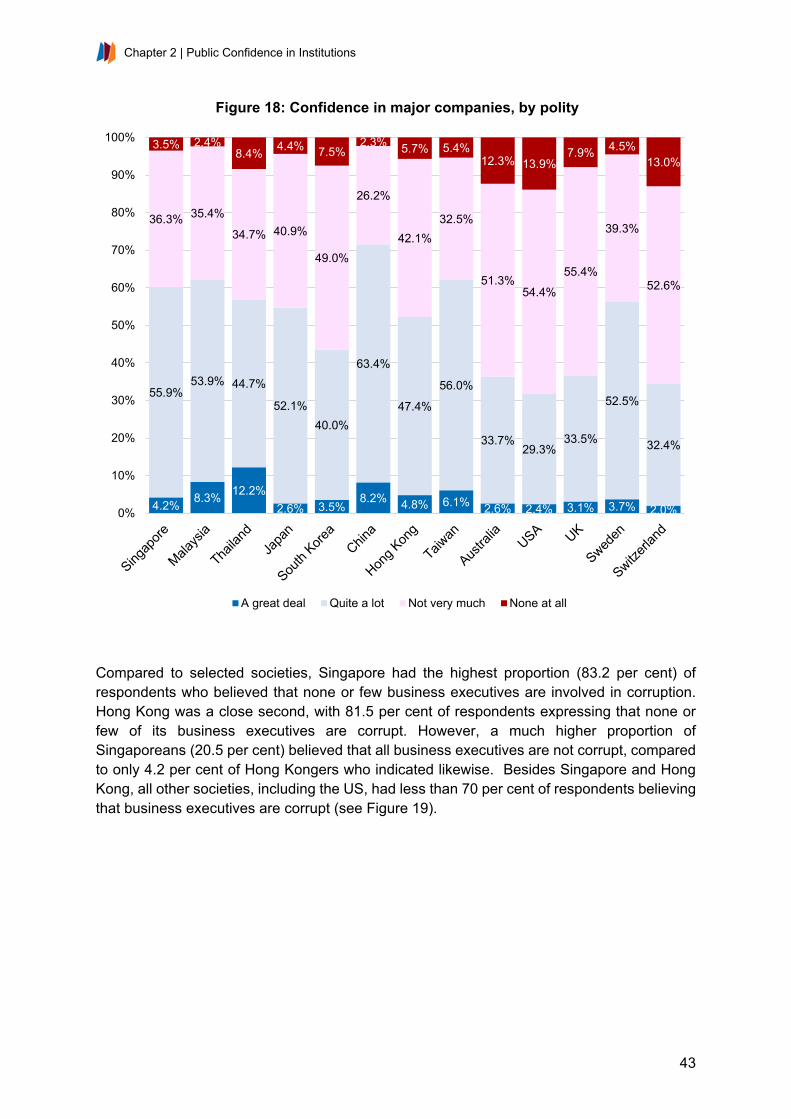
Chapter 2 | Public Confidence in Institutions
43
Compared to selected societies, Singapore had the highest proportion (83.2 per cent) of respondents who believed that none or few business executives are involved in corruption. Hong Kong was a close second, with 81.5 per cent of respondents expressing that none or few of its business executives are corrupt. However, a much higher proportion of Singaporeans (20.5 per cent) believed that all business executives are not corrupt, compared to only 4.2 per cent of Hong Kongers who indicated likewise. Besides Singapore and Hong Kong, all other societies, including the US, had less than 70 per cent of respondents believing that business executives are corrupt (see Figure 19).
4.2% 8.3% 12.2%2.6% 3.5%
8.2% 4.8% 6.1% 2.6% 2.4% 3.1% 3.7% 2.0%
55.9%53.9% 44.7%
52.1%40.0%
63.4%
47.4%
56.0%
33.7%29.3%
33.5%
52.5%
32.4%
36.3% 35.4%
34.7% 40.9%
49.0%
26.2%
42.1%32.5%
51.3%54.4%
55.4%
39.3%
52.6%
3.5% 2.4%8.4% 4.4% 7.5%
2.3% 5.7% 5.4%12.3% 13.9%
7.9% 4.5%13.0%
0%
10%
20%
30%
40%
50%
60%
70%
80%
90%
100%
Figure 18: Confidence in major companies, by polity
A great deal Quite a lot Not very much None at all
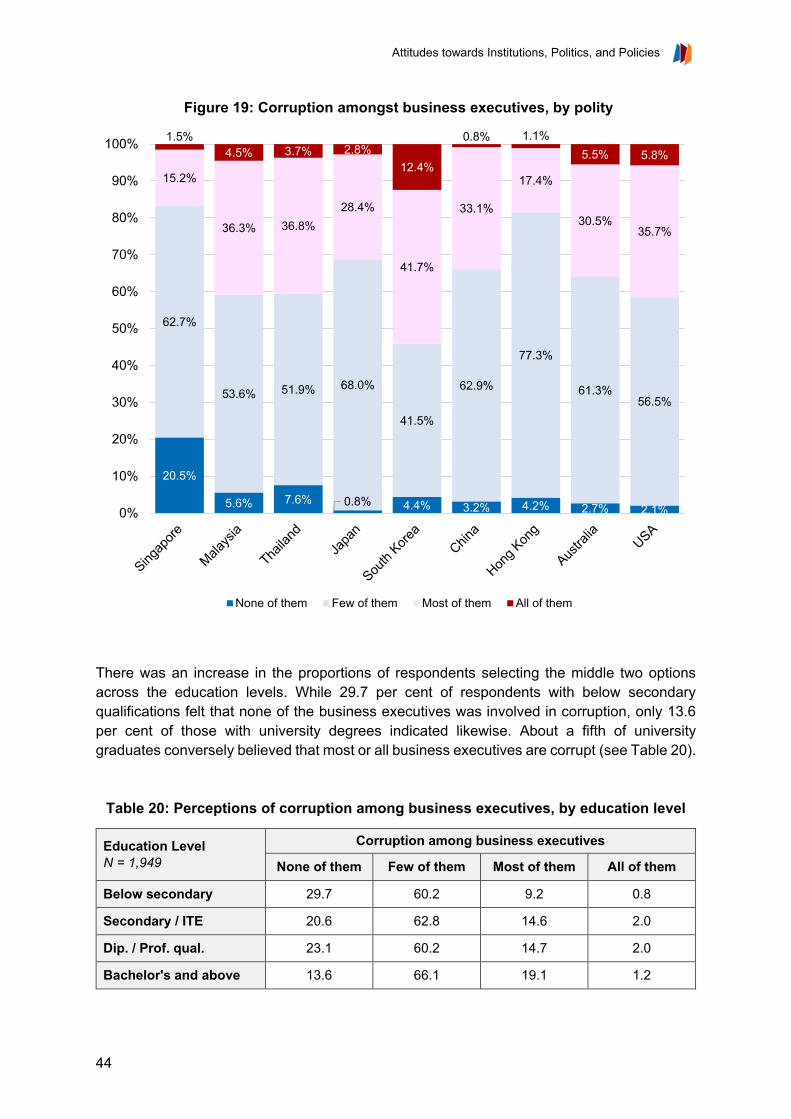
Attitudes towards Institutions, Politics, and Policies
44
There was an increase in the proportions of respondents selecting the middle two options across the education levels. While 29.7 per cent of respondents with below secondary qualifications felt that none of the business executives was involved in corruption, only 13.6 per cent of those with university degrees indicated likewise. About a fifth of university graduates conversely believed that most or all business executives are corrupt (see Table 20).
Table 20: Perceptions of corruption among business executives, by education level
Education Level N = 1,949
Corruption among business executives
None of them Few of them Most of them All of them
Below secondary 29.7 60.2 9.2 0.8
Secondary / ITE 20.6 62.8 14.6 2.0
Dip. / Prof. qual. 23.1 60.2 14.7 2.0
Bachelor's and above 13.6 66.1 19.1 1.2
20.5%
5.6% 7.6% 0.8% 4.4% 3.2% 4.2% 2.7% 2.1%
62.7%
53.6% 51.9% 68.0%
41.5%
62.9%
77.3%
61.3%56.5%
15.2%
36.3% 36.8%28.4%
41.7%
33.1%
17.4%
30.5%35.7%
1.5%4.5% 3.7% 2.8%
12.4%
0.8% 1.1%5.5% 5.8%
0%
10%
20%
30%
40%
50%
60%
70%
80%
90%
100%
Figure 19: Corruption amongst business executives, by polity
None of them Few of them Most of them All of them

Chapter 2 | Public Confidence in Institutions
45
When the data was analysed by housing type, we find similar trust levels for respondents who lived in public housing. Around a fifth of respondents residing in public housing believed none of the business executives was involved in corruption, while around 60 per cent believed few were corrupt. In contrast, private property dwellers were more pessimistic, with 11.7 per cent believing that none of them was involved in corruption, and 22 per cent indicating most or all business executives were corrupt (see Table 21).
Table 21: Perceptions of corruption among business executives, by housing type
Housing Type N = 1,953
Corruption among business executives
None of them Few of them Most of them All of them
1- to 3-room HDB 19.6 63.7 14.9 1.8
4-room HDB 23.5 61.2 14.7 0.6
5+-room HDB 23.6 61.6 12.5 2.4
Private property 11.7 66.4 20.1 1.9
2.4.3 More than four-fifths of respondents indicated a high level of confidence
in universities Amongst the population, 16.2 per cent reported a great deal of confidence in universities, while 67.5 per cent indicated quite a lot of confidence. In general, all polities-of-comparison were relatively confident of universities, with over 60 per cent of respondents in all polities except the US indicating a great deal or quite a lot of confidence. Among the polities-of-comparison, Singapore had the second-highest proportion of respondents expressing either a great deal or quite a lot of confidence in universities (83.7 per cent). Meanwhile, respondents from Mainland China were the most confident, with 91.4 per cent saying they had either a great deal or quite a lot of confidence (see Figure 20).
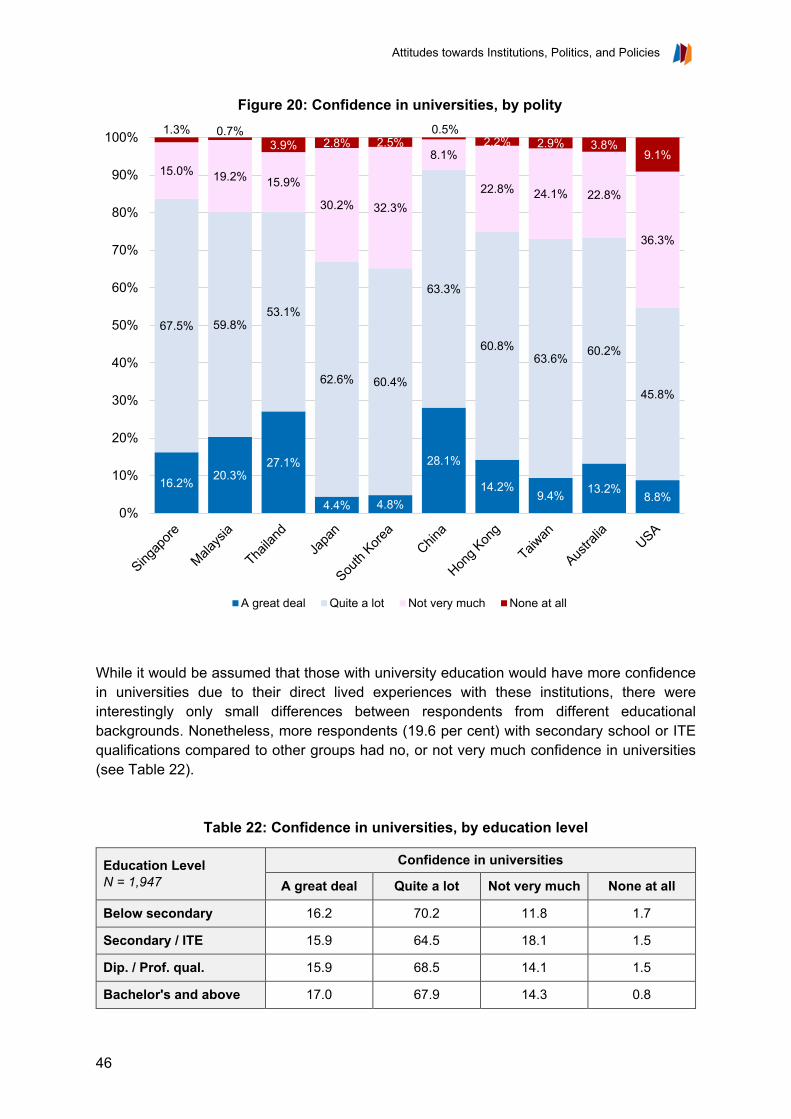
Attitudes towards Institutions, Politics, and Policies
46
While it would be assumed that those with university education would have more confidence in universities due to their direct lived experiences with these institutions, there were interestingly only small differences between respondents from different educational backgrounds. Nonetheless, more respondents (19.6 per cent) with secondary school or ITE qualifications compared to other groups had no, or not very much confidence in universities (see Table 22).
Table 22: Confidence in universities, by education level
Education Level N = 1,947
Confidence in universities
A great deal Quite a lot Not very much None at all
Below secondary 16.2 70.2 11.8 1.7
Secondary / ITE 15.9 64.5 18.1 1.5
Dip. / Prof. qual. 15.9 68.5 14.1 1.5
Bachelor's and above 17.0 67.9 14.3 0.8
16.2% 20.3%27.1%
4.4% 4.8%
28.1%
14.2%9.4% 13.2%
8.8%
67.5% 59.8%53.1%
62.6% 60.4%
63.3%
60.8%63.6% 60.2%
45.8%
15.0% 19.2% 15.9%
30.2% 32.3%
8.1%
22.8% 24.1% 22.8%
36.3%
1.3% 0.7%3.9% 2.8% 2.5%
0.5%2.2% 2.9% 3.8%
9.1%
0%
10%
20%
30%
40%
50%
60%
70%
80%
90%
100%
Figure 20: Confidence in universities, by polity
A great deal Quite a lot Not very much None at all

Chapter 2 | Public Confidence in Institutions
47
2.5 THE FOURTH ESTATE 2.5.1 Most respondents were confident in the media; older, less educated,
naturalised citizens and PR respondents were more likely to indicate higher levels of confidence
Reactions towards the media, including the press and television, were aggregated into an overall index. The Cronbach's Alpha for this set of questions was 0.854. The mean score was 2.54, while the median score was 3.0; these suggest a decent level of confidence in the media. When comparing mean scores of different groups, we find that older, less-educated, and non-local-born respondents had higher levels of confidence in the media (see Table 23).
Table 23: Confidence in the media, by mean and median for age cohort, education level, and citizenship status
Age F = 9.239*** Mean Education
F = 16.204*** Mean Citizenship status F = 12.816***
Mean
21-35 4.86 Below secondary 5.48 Local-born
citizen 5.02
36-50 5.07 Secondary / ITE 5.12 Naturalised citizen / PR 5.31
51-65 5.12 Dip. / Prof. qual. 5.02
Above 65 5.37 Bachelor's and above 4.85
* p < 0.05, ** p < 0.01, *** p < 0.001 Based on regression analysis to identify the key factors impacting confidence in the media, we find that respondents who 1) have greater conviction that Singapore is democratic, 2) are satisfied with the functioning of the political system, 3) believe that corruption in Singapore was not widespread, and 4) believe that journalists and media personnel were honest, were more likely to have greater confidence in media institutions. In addition, less-educated respondents were more likely to have greater confidence in the media (see Table 24).

Attitudes towards Institutions, Politics, and Policies
48
Table 24: Confidence in the media (linear regressions)
Variables Model 1 Standardised Coefficient
Model 2 Standardised Coefficient
Political interest (Y/N) .005
How democratic is SG .124***
Satisfaction with political system functioning
.115***
Degree of corruption in SG -.150***
Journalists and media personnel are honest (Y/N)
.090***
Local-born (vs not local-born) -.081*** -.035
Gender (females vs males) .042 .023
Age
21-35 -.070 .022
36-50 -.017 .044
51-65 -.017 .027
Reference group: Above 65
Education
Below secondary school .186*** .192***
Secondary school/ ITE .095*** .121***
Diploma/ Professional qualification .062* .069**
Reference group: Bachelor's and above
Housing type
1- 3-room HDB -.016 -.019
4-room HDB -.002 -.017
5+-room HDB .004 -.008
Reference group: Private property
Adjusted R2 .038 .146
* p < 0.05, ** p < 0.01, *** p < 0.001 2.5.2 Over half of respondents had confidence in the press, though this view is
negatively correlated with education levels While a very low proportion of 6.2 per cent reported "a great deal of confidence" in the press, nearly half, or 49.9 per cent, reported "quite a lot of confidence". Based on these results, there seem to be some reservations with the press relative to other institutions. Nonetheless, compared with other polities, respondents from Singapore and other Asian societies like Thailand, Japan, South Korea, and Hong Kong (except Malaysia and Taiwan) still have sizeable confidence in the press. This is in contrast with non-Asian societies like the US, the UK, Sweden, and Switzerland, which all reported lower proportions of respondents indicating "a great deal" or "quite a lot of confidence" in the press (see Figure 21).

Chapter 2 | Public Confidence in Institutions
49
Respondents who had below secondary education were the most confident in the press, with 9 per cent saying they had a great deal of confidence and 63.1 per cent saying they had quite a lot of confidence. In contrast, the respondents with university degrees were the most sceptical, with 49.9 per cent selecting either "not very much" or "none at all" as their answers (see Table 25).
Table 25: Confidence in the press, by education level
Education Level N = 1,965
Confidence in the press
A great deal Quite a lot Not very much None at all
Below secondary 9.0 63.1 26.5 1.4
Secondary / ITE 5.2 50.9 39.7 4.1
Dip. / Prof. qual. 6.0 47.5 40.5 6.0
Bachelor's and above 5.6 44.5 43.3 6.6
6.2% 5.2%11.3%
4.8% 3.1%11.4%
6.4% 1.5% 1.3% 5.3% 2.0% 2.5%1.5%
49.9%
33.3%
42.7%
66.7%
46.4%
57.1%
47.4%
25.0%16.3%
24.4%
11.7%
37.6%
28.1%
39.0%
52.4%
38.9%
25.0%
43.5%
29.4%
41.1%
53.8%
57.6%
46.3%
57.7%
48.7%
55.1%
5.0% 9.2% 7.1% 3.5% 7.0%2.1% 5.1%
19.7%24.9% 24.0%
28.5%
11.2% 15.2%
0%
10%
20%
30%
40%
50%
60%
70%
80%
90%
100%
Figure 21: Confidence in the press, by polity
A great deal Quite a lot Not very much None at all
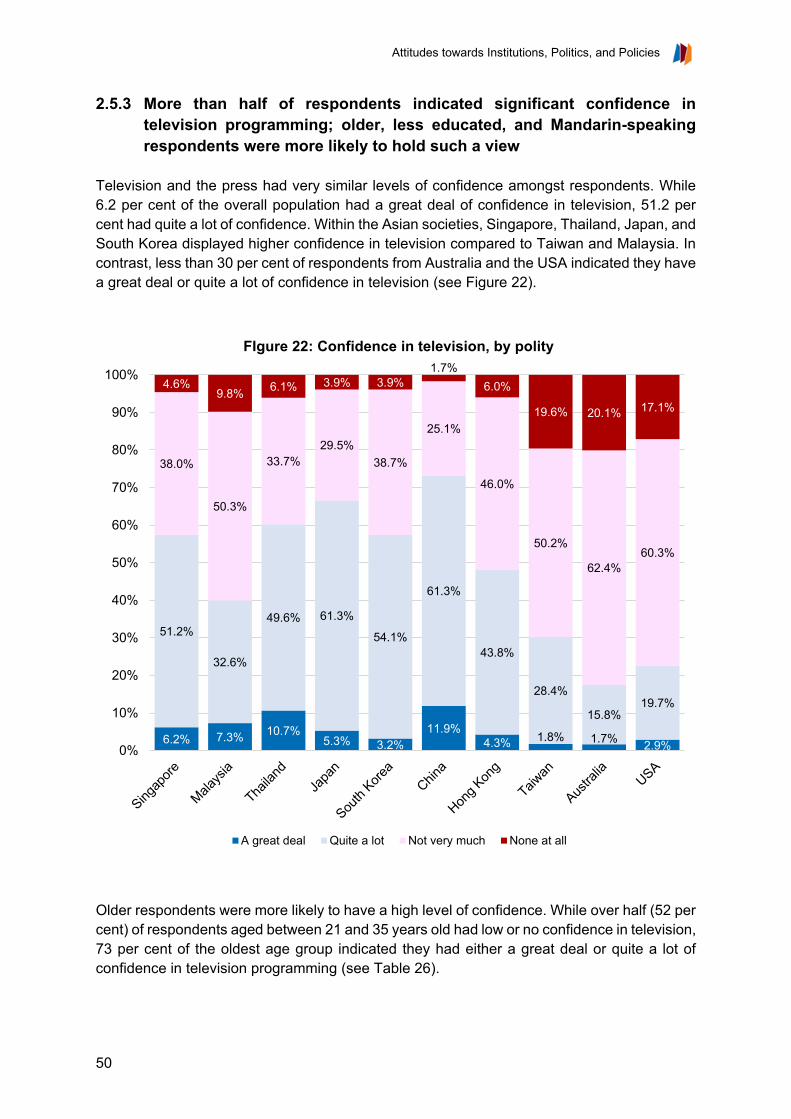
Attitudes towards Institutions, Politics, and Policies
50
2.5.3 More than half of respondents indicated significant confidence in television programming; older, less educated, and Mandarin-speaking respondents were more likely to hold such a view
Television and the press had very similar levels of confidence amongst respondents. While 6.2 per cent of the overall population had a great deal of confidence in television, 51.2 per cent had quite a lot of confidence. Within the Asian societies, Singapore, Thailand, Japan, and South Korea displayed higher confidence in television compared to Taiwan and Malaysia. In contrast, less than 30 per cent of respondents from Australia and the USA indicated they have a great deal or quite a lot of confidence in television (see Figure 22).
Older respondents were more likely to have a high level of confidence. While over half (52 per cent) of respondents aged between 21 and 35 years old had low or no confidence in television, 73 per cent of the oldest age group indicated they had either a great deal or quite a lot of confidence in television programming (see Table 26).
6.2% 7.3% 10.7%5.3% 3.2%
11.9%4.3% 1.8% 1.7% 2.9%
51.2%
32.6%
49.6% 61.3%
54.1%
61.3%
43.8%
28.4%
15.8%19.7%
38.0%
50.3%
33.7%29.5%
38.7%
25.1%
46.0%
50.2%
62.4%60.3%
4.6%9.8% 6.1% 3.9% 3.9%
1.7%6.0%
19.6% 20.1% 17.1%
0%
10%
20%
30%
40%
50%
60%
70%
80%
90%
100%
FIgure 22: Confidence in television, by polity
A great deal Quite a lot Not very much None at all

Chapter 2 | Public Confidence in Institutions
51
Table 26: Confidence in television, by age cohort
Age Cohort N = 1,978
Confidence in television
A great deal Quite a lot Not very much None at all
21-35 5.0 43.0 46.1 5.9
36-50 7.2 48.4 39.2 5.2
51-65 5.8 55.9 34.1 4.2
Above 65 7.3 65.7 25.2 1.8
Tamil-speaking respondents were the most likely to indicate a great deal of confidence in television, followed by Malay-speaking respondents. When taking the respondents who answered either "a great deal" or "quite a lot" of confidence into account, we find that Mandarin speakers had the highest levels of confidence in television, with 68.8 per cent selecting one of the two options (see Table 27).
Table 27: Confidence in television, by preferred spoken language
Preferred Spoken Language N = 1,978
Confidence in television
A great deal Quite a lot Not very much None at all
English 6.2 43.0 44.7 6.2
Mandarin 4.6 62.2 30.1 3.1
Chinese dialect 6.0 57.2 34.3 2.4
Malay 9.5 51.4 35.8 3.4
Tamil 12.8 52.3 27.9 7.0
Others 8.0 36.0 52.0 4.0
In general, respondents with lower education qualifications had higher levels of confidence in television. Seventy-eight per cent of those with below secondary school qualifications chose either "a great deal" or "quite a lot", compared with 48.1 per cent of those with university degrees (see Table 28).

Attitudes towards Institutions, Politics, and Policies
52
Table 28: Confidence in television, by education level
Education Level N = 1,974
Confidence in television
A great deal Quite a lot Not very much None at all
Below secondary 11.8 66.2 20.3 1.6
Secondary / ITE 5.4 55.3 36.1 3.2
Dip. / Prof. qual. 5.8 46.5 43.0 4.8
Bachelor's and above 4.1 44.0 44.7 7.2
2.5.4 Singapore respondents were among the least likely globally to believe
that journalists and people in the media are involved in corruption Singapore had the highest proportion of respondents (88.8 per cent) who believe that none or few journalists and media are involved in corruption. Similar results were found for China (83 per cent) and Hong Kong (87.7 per cent). All other societies, including Malaysia, Thailand, Japan, South Korea, Australia, and the USA, had less than 70 per cent of its respondents who believe that none or few journalists and media were corrupt (see Figure 23).
27.7%
9.6% 14.8%2.8% 3.5%
10.8% 16.1%4.8% 4.7%
61.1%
58.9%54.7%
66.4%54.4%
72.2%71.6%
56.5% 55.8%
9.8%
26.1% 26.8% 26.7%
32.9%
16.5% 11.3%
30.5% 30.7%
1.4%5.4% 3.7% 4.1% 9.2%
0.5% 1.0%8.3% 8.8%
0%
10%
20%
30%
40%
50%
60%
70%
80%
90%
100%
Figure 23: Perceptions of number of journalists and media personnel involved in corruption, by polity
None of them Few of them Most of them All of them
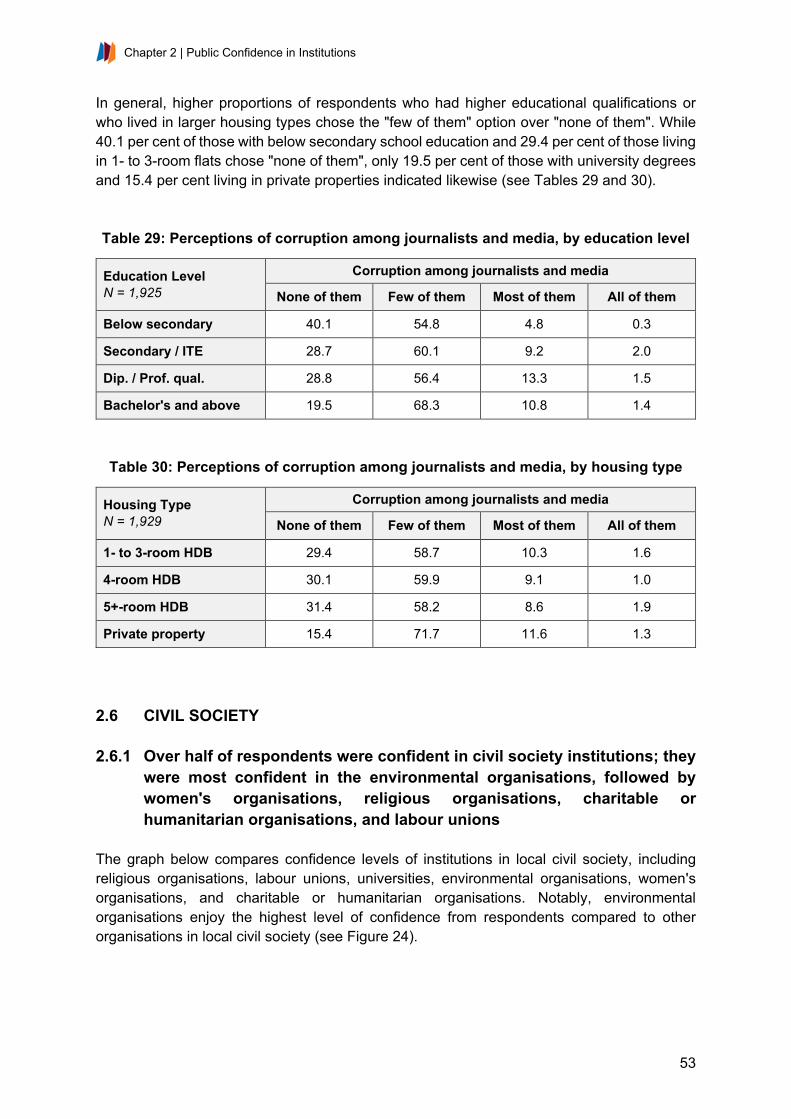
Chapter 2 | Public Confidence in Institutions
53
In general, higher proportions of respondents who had higher educational qualifications or who lived in larger housing types chose the "few of them" option over "none of them". While 40.1 per cent of those with below secondary school education and 29.4 per cent of those living in 1- to 3-room flats chose "none of them", only 19.5 per cent of those with university degrees and 15.4 per cent living in private properties indicated likewise (see Tables 29 and 30). Table 29: Perceptions of corruption among journalists and media, by education level
Education Level N = 1,925
Corruption among journalists and media
None of them Few of them Most of them All of them
Below secondary 40.1 54.8 4.8 0.3
Secondary / ITE 28.7 60.1 9.2 2.0
Dip. / Prof. qual. 28.8 56.4 13.3 1.5
Bachelor's and above 19.5 68.3 10.8 1.4
Table 30: Perceptions of corruption among journalists and media, by housing type
Housing Type N = 1,929
Corruption among journalists and media
None of them Few of them Most of them All of them
1- to 3-room HDB 29.4 58.7 10.3 1.6
4-room HDB 30.1 59.9 9.1 1.0
5+-room HDB 31.4 58.2 8.6 1.9
Private property 15.4 71.7 11.6 1.3
2.6 CIVIL SOCIETY 2.6.1 Over half of respondents were confident in civil society institutions; they
were most confident in the environmental organisations, followed by women's organisations, religious organisations, charitable or humanitarian organisations, and labour unions
The graph below compares confidence levels of institutions in local civil society, including religious organisations, labour unions, universities, environmental organisations, women's organisations, and charitable or humanitarian organisations. Notably, environmental organisations enjoy the highest level of confidence from respondents compared to other organisations in local civil society (see Figure 24).

Attitudes towards Institutions, Politics, and Policies
54
Reactions towards these five types of local civil society organisations, namely labour unions, religious organisations, environmental organisations, women's organisations, and charitable or humanitarian organisations, were aggregated into an overall index. The Cronbach's Alpha for this set of questions was 0.742. As presented above, the mean score is 2.38, while the median score is 2.40, indicating marked confidence in these institutions. When mean scores were compared across groups, we find that respondents with secondary or ITE qualifications, who earned between $5,000 and $6,999, resided in 1- to 3-room flats, not local-born, interviewed before Covid-19 cases were reported in Singapore, and who had higher political interest, had greater confidence in local civil society (see Tables 31 and 32).
12.7%5.8% 10.7% 8.8% 8.6%
47.3%
48.2%
61.4%58.3%
50.8%
35.0%39.4%
25.7%30.1%
37.4%
5.0% 6.6% 2.2% 2.9% 3.3%
0%
20%
40%
60%
80%
100%
Religiousorganisations
Labour unions Environmentalorganisations
Women'sorganisations
Charitable orhumanitarianorganisations
Figure 24: Confidence in Singapore civil society, by institution
A great deal Quite a lot Not very much None at all

Chapter 2 | Public Confidence in Institutions
55
Table 31: Confidence in civil society, by mean and median for education level, income and housing type
Education F = 2.841* Mean Income
F = 3.852** Mean Housing type F = 2.704* Mean
Below secondary 11.42 Below $1,500 12.34 1 to 3-room
HDB 12.21
Secondary / ITE 12.12 $1,500-$2,999 11.59 4-room HDB 11.75
Dip. / Prof. qual. 11.85 $3,000-$4,999 11.40 5+-room HDB 11.59
Bachelor’s and above 11.95 $5,000-$6,999 12.48 Private
property 11.91
Above $6,999 11.93
* p < 0.05, ** p < 0.01, *** p < 0.001
Table 32: Confidence in civil society, by mean and median for survey date, citizenship status and political interest
Before / During Covid-19 F = 7.147**
Mean Citizenship status F = 19.554***
Mean Political interest F = 15.966***
Mean
Surveyed before Covid-19 12.06 Local-born
citizen 11.70 Yes 12.31
Surveyed during Covid-19 11.61 Naturalised
citizen / PR 12.62 No 11.63
* p < 0.05, ** p < 0.01, *** p < 0.001 When perusing the key factors impacting confidence in civil society with regression modelling, we find that having political interest, believing that Singapore is democratic, and being more satisfied with the functioning of the political system is correlated with an increase of confidence in local civil society organisations. On the demographic front, respondents who were not born in Singapore, younger, or were secondary or ITE qualifications, were more likely to be confident in civil society organisations relative to local-born citizens, the elderly, or degree holders. (see Table 33).

Attitudes towards Institutions, Politics, and Policies
56
Table 33: Confidence in civil society (linear regressions)
Variables Model 1 Standardised Coefficient
Model 2 Standardised Coefficient
Political interest (Y/N) .088***
How democratic is SG .105***
Satisfaction with political system functioning
.147***
Degree of corruption in SG .015
Local-born (vs not local-born) -.107*** -.077***
Gender (females vs males) .029 .021
Age
21-35 .109** .168***
36-50 .100** .144***
51-65 .079* .109***
Reference group: Above 65
Education
Below secondary school .000 .029
Secondary school/ ITE .059* .086**
Diploma/ Professional qualification -.002 .008
Reference group: Bachelor’s and above
Housing type
1- 3-room HDB .034 .033
4-room HDB -.036 -.032
5+-room HDB -.041 -.044
Reference group: Private property
Adjusted R2 .019 .074
* p < 0.05, ** p < 0.01, *** p < 0.001 2.6.2 Muslims, Catholics and Christians were most likely to indicate confidence
in religious organisations; Taoists and the non-religious were less likely to do so
Respondents were quite confident in religious organisations, with 12.7 per cent saying they had a great deal of confidence and 47.3 per cent saying they had quite a lot of confidence. This question was also posed to other societies, with the names of the religious organisations modified to the ones most relevant to the polity’s religious make-up. Singaporean respondents had quite a lot of confidence in religious organisations when compared to other societies, with only Malaysia and Thailand reporting higher proportions of respondents saying they either have a great deal or quite a lot of confidence. In contrast, Japanese respondents were the least confident in religious organisations, with only 8.9 per cent expressing a great deal or quite a lot of confidence in them (see Figure 25).
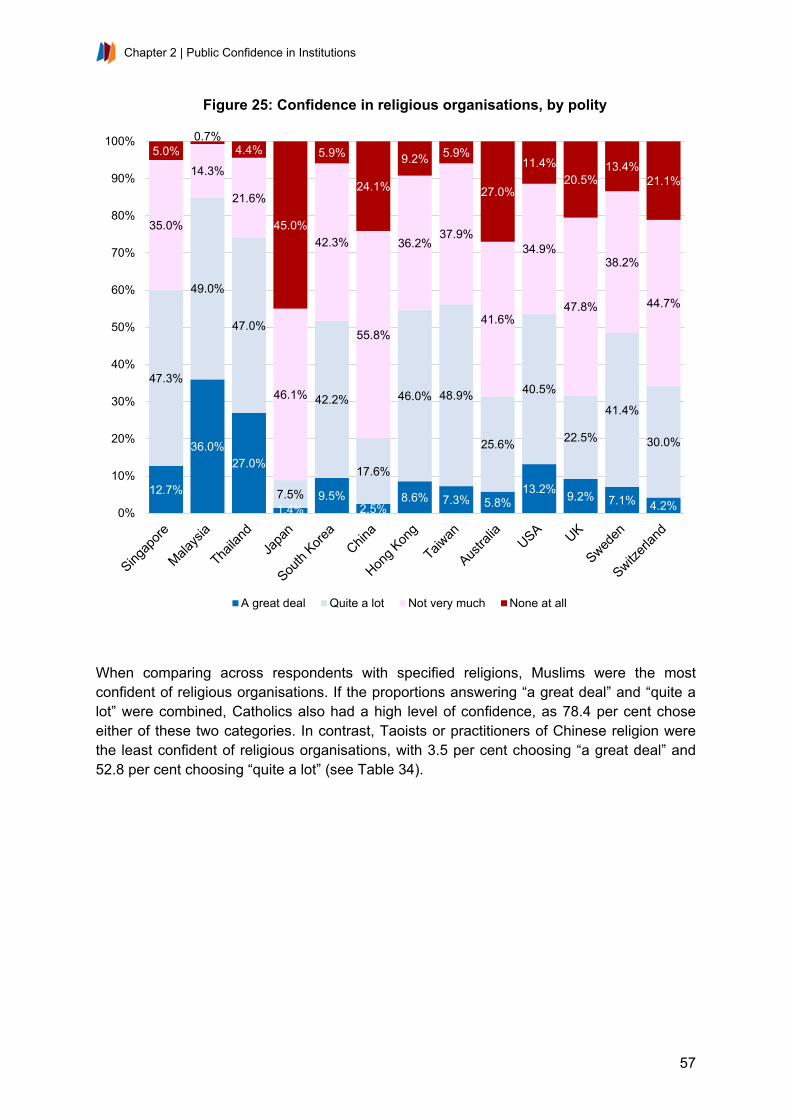
Chapter 2 | Public Confidence in Institutions
57
When comparing across respondents with specified religions, Muslims were the most confident of religious organisations. If the proportions answering “a great deal” and “quite a lot” were combined, Catholics also had a high level of confidence, as 78.4 per cent chose either of these two categories. In contrast, Taoists or practitioners of Chinese religion were the least confident of religious organisations, with 3.5 per cent choosing “a great deal” and 52.8 per cent choosing “quite a lot” (see Table 34).
12.7%
36.0%27.0%
1.4%9.5%
2.5%8.6% 7.3% 5.8%
13.2% 9.2% 7.1% 4.2%
47.3%
49.0%
47.0%
7.5%
42.2%
17.6%
46.0% 48.9%
25.6%
40.5%
22.5%
41.4%
30.0%
35.0%
14.3%
21.6%
46.1%
42.3%
55.8%
36.2%37.9%
41.6%
34.9%
47.8%
38.2%
44.7%
5.0%0.7%
4.4%
45.0%
5.9%
24.1%
9.2% 5.9%
27.0%
11.4%20.5%
13.4%21.1%
0%
10%
20%
30%
40%
50%
60%
70%
80%
90%
100%
Figure 25: Confidence in religious organisations, by polity
A great deal Quite a lot Not very much None at all

Attitudes towards Institutions, Politics, and Policies
58
Table 34: Confidence in religious organisations, by religion
Religion N = 1,953
Confidence in religious organisations
A great deal Quite a lot Not very much None at all
Buddhist 6.3 53.3 36.7 3.7
Taoist/ Chinese religion 3.5 52.8 41.0 2.8
Protestant 12.4 58.5 27.4 1.8
Catholic 18.4 60.0 20.0 1.6
Muslim 39.1 39.4 19.0 2.6
Hindu 17.6 38.9 37.0 6.5
No religion 3.3 33.5 51.3 11.8
Others 28.6 0 57.1 14.3
2.6.3 Respondents with full-time employment and lower educational
qualifications were more likely to have confidence in labour unions Respondents were only confident in labour unions to some extent, where 5.8 per cent indicated they had a great deal of confidence, while 48.2 per cent had quite a lot of confidence. Singapore was among the top five societies – the other four being Malaysia, China, Taiwan and Sweden – that placed a great deal or quite a lot of confidence in labour unions. In comparison, respondents from Australia, the US, and the UK expressed low confidence in its labour unions, with less than 40 per cent in each society indicating a great deal or quite a lot of confidence in labour unions (see Figure 26).

Chapter 2 | Public Confidence in Institutions
59
Naturalised citizens and PRs have more confidence in labour unions. While 9 per cent chose “a great deal” and 54.1 per cent chose “quite a lot”, the proportions for local-born citizens were 5 per cent and 46.6 per cent, respectively (see Table 35).
Table 35: Confidence in labour unions, by citizenship status
Citizenship Status N = 1,845
Confidence in labour unions
A great deal Quite a lot Not very much None at all
Local-born citizen 5.0 46.6 41.6 6.8
Naturalised citizen / PR 9.0 54.1 31.5 5.4
While the unemployed respondents were the most likely to say they had a great deal of confidence in labour unions, they were the least likely to select “quite a lot” as their answer. They also had the highest response rate for the “none at all” option. For respondents currently
5.8% 8.1% 10.5%2.2% 3.5%
8.8%3.6% 4.0% 3.5% 6.0% 3.9% 5.9% 2.7%
48.2%50.9% 45.3%
47.7%38.2%
60.1%
39.0%
52.4%
25.9%27.3% 31.4%
52.0%
40.8%
39.4%38.0%
36.8%43.2%
53.3%
28.2%
49.7%
38.5%
48.0%50.4% 48.8%
35.4%
45.2%
6.6% 3.0%7.4% 6.9% 5.0% 2.8%
7.7% 5.2%
22.6%16.3% 16.0%
6.7%11.3%
0%
10%
20%
30%
40%
50%
60%
70%
80%
90%
100%
Figure 26: Confidence in labour unions, by polity
A great deal Quite a lot Not very much None at all

Attitudes towards Institutions, Politics, and Policies
60
in some form of paid employment, the full-time employees had the highest level of confidence in labour unions, while the self-employed had the lowest levels (see Table 36).
Table 36: Confidence in labour unions, by employment type
Employment Type N = 1,845
Confidence in labour unions
A great deal Quite a lot Not very much None at all
Full-time employee 5.9 51.2 35.4 7.5
Part-time employee 5.5 46.3 42.7 5.5
Self-employed 4.8 39.7 46.0 9.5
Retired/ pensioned 5.8 50.0 40.5 3.7
Housewife 7.3 50.0 39.1 3.6
Student 0 40.5 55.7 3.8
Unemployed 7.6 33.9 48.3 10.2
Others 7.1 35.7 57.1 0
Across the education groups, an overall decrease in confidence levels is observed. While 64 per cent of the respondents with below secondary qualifications chose either “a great deal” or “quite a lot” as their answers, 51.8 per cent of those with university degrees chose either “not very much” or “none at all” (see Table 37).
Table 37: Confidence in labour unions, by education level
Education Level N = 1,842
Confidence in labour unions
A great deal Quite a lot Not very much None at all
Below secondary 10.6 53.4 30.7 5.3
Secondary / ITE 5.5 50.1 38.5 5.9
Dip. / Prof. qual. 4.8 46.9 42.2 6.1
Bachelor's and above 4.2 44.0 43.9 7.9
2.6.4 While two-thirds of respondents indicated sizeable confidence in
women’s organisations, more females expectedly felt this way A majority indicated some level of confidence in women’s organisations; 8.8 per cent had a great deal of confidence, and 58.3 per cent had quite a lot of confidence. With less than 70 per cent of respondents indicating a great deal or quite a lot of confidence in women’s organisations, Singapore’s results were similar to those found in Thailand, South Korea, Hong Kong, Australia, and the US. In contrast, respondents from China, Taiwan, and Malaysia
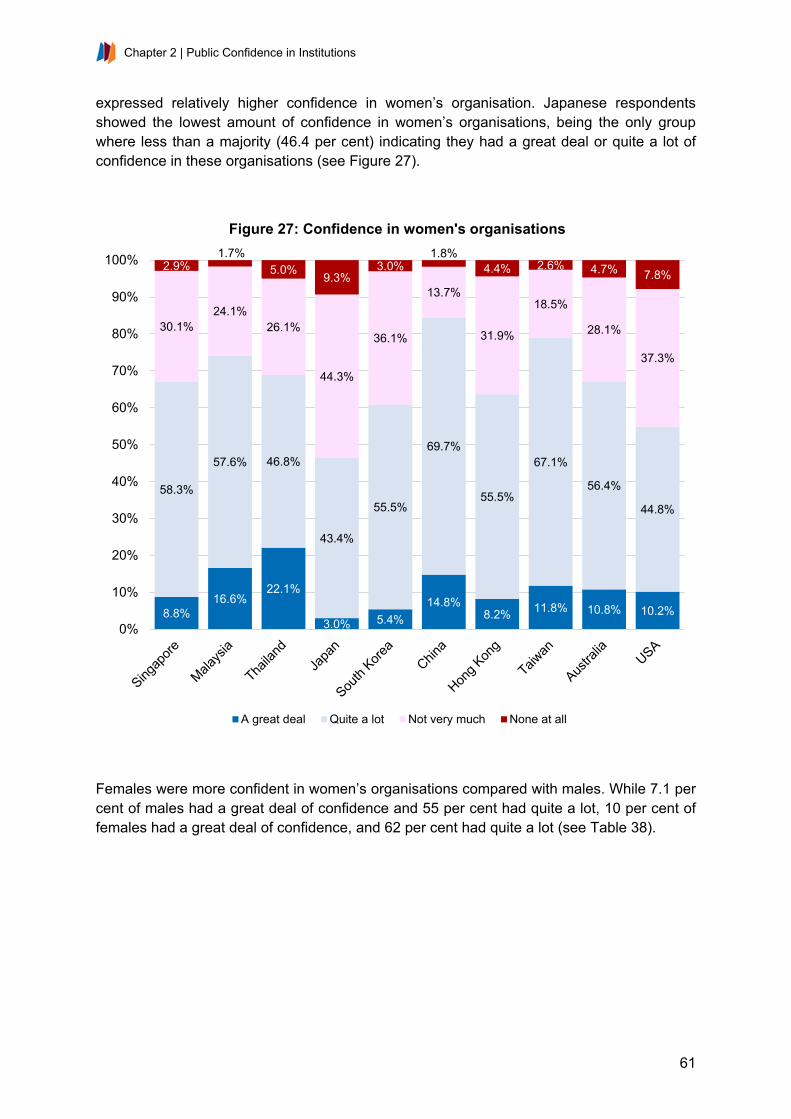
Chapter 2 | Public Confidence in Institutions
61
expressed relatively higher confidence in women’s organisation. Japanese respondents showed the lowest amount of confidence in women’s organisations, being the only group where less than a majority (46.4 per cent) indicating they had a great deal or quite a lot of confidence in these organisations (see Figure 27).
Females were more confident in women’s organisations compared with males. While 7.1 per cent of males had a great deal of confidence and 55 per cent had quite a lot, 10 per cent of females had a great deal of confidence, and 62 per cent had quite a lot (see Table 38).
8.8%16.6%
22.1%
3.0% 5.4%14.8%
8.2% 11.8% 10.8% 10.2%
58.3%
57.6% 46.8%
43.4%
55.5%
69.7%
55.5%
67.1%
56.4%
44.8%
30.1%24.1%
26.1%
44.3%
36.1%
13.7%
31.9%
18.5%
28.1%
37.3%
2.9%1.7%
5.0% 9.3%3.0%
1.8%4.4% 2.6% 4.7% 7.8%
0%
10%
20%
30%
40%
50%
60%
70%
80%
90%
100%
Figure 27: Confidence in women's organisations
A great deal Quite a lot Not very much None at all
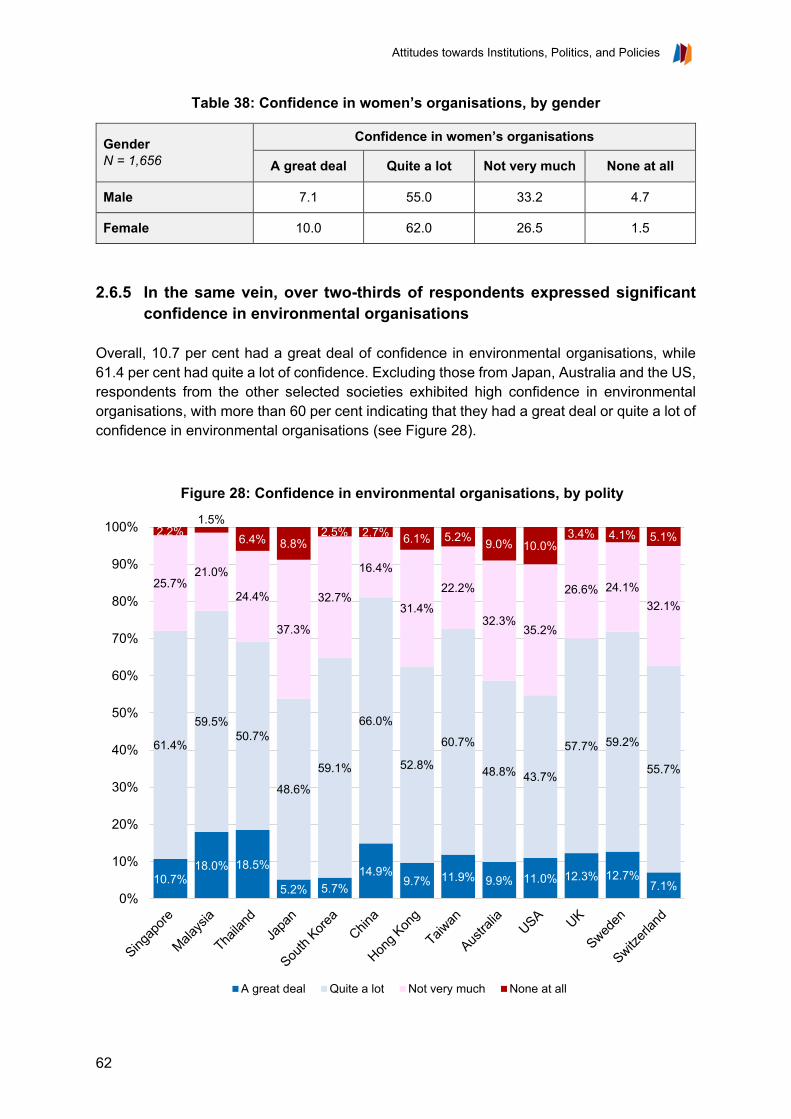
Attitudes towards Institutions, Politics, and Policies
62
Table 38: Confidence in women’s organisations, by gender
Gender N = 1,656
Confidence in women’s organisations
A great deal Quite a lot Not very much None at all
Male 7.1 55.0 33.2 4.7
Female 10.0 62.0 26.5 1.5
2.6.5 In the same vein, over two-thirds of respondents expressed significant
confidence in environmental organisations Overall, 10.7 per cent had a great deal of confidence in environmental organisations, while 61.4 per cent had quite a lot of confidence. Excluding those from Japan, Australia and the US, respondents from the other selected societies exhibited high confidence in environmental organisations, with more than 60 per cent indicating that they had a great deal or quite a lot of confidence in environmental organisations (see Figure 28).
10.7%18.0% 18.5%
5.2% 5.7%14.9%
9.7% 11.9% 9.9% 11.0% 12.3% 12.7%7.1%
61.4%
59.5%50.7%
48.6%
59.1%
66.0%
52.8%
60.7%
48.8% 43.7%
57.7% 59.2%
55.7%
25.7%21.0%
24.4%
37.3%
32.7%
16.4%
31.4%
22.2%
32.3%35.2%
26.6% 24.1%32.1%
2.2%1.5%
6.4% 8.8%2.5% 2.7% 6.1% 5.2% 9.0% 10.0%
3.4% 4.1% 5.1%
0%
10%
20%
30%
40%
50%
60%
70%
80%
90%
100%
Figure 28: Confidence in environmental organisations, by polity
A great deal Quite a lot Not very much None at all

Chapter 2 | Public Confidence in Institutions
63
2.6.6 While a majority of Singapore respondents indicated confidence in charities or humanitarian organisations; this proportion weighed in at the tail-end of the pack across polities globally
Approximately half of respondents indicated confidence in charitable or humanitarian organisations. While 8.6 per cent had a great deal of confidence, 50.8 per cent had quite a lot of confidence in these organisations. With the exception of Japan, all the societies examined reported a majority of respondents indicating a great deal or quite a lot of confidence in charitable or humanitarian organisations. Meanwhile, only 40.7 per cent of Japanese respondents expressed a great deal or quite a lot of confidence in charitable or humanitarian organisations (see Figure 29).
8.6%19.5% 19.3%
2.9% 5.9%14.3% 9.9% 9.7% 9.8% 11.9%
50.8%
56.5%48.1%
37.8%
55.6%
59.5%
52.2% 54.6%48.5%
50.6%
37.4%
22.4%
26.0%
46.3%
34.5%
22.5%
32.8% 28.3%33.2%
32.5%
3.3%1.7%
6.6%13.0%
4.0% 3.8% 5.2% 7.5% 8.5% 5.0%
0%
10%
20%
30%
40%
50%
60%
70%
80%
90%
100%
Figure 29: Confidence in charitable or humanitarian organisations, by polity
A great deal Quite a lot Not very much None at all

Attitudes towards Institutions, Politics, and Policies
64
2.7 INTERNATIONAL INSTITUTIONS 2.7.1 The confidence of respondents in international organisations was
generally lower compared to confidence levels for local organisations Respondents were also asked about their confidence levels of institutions in the global civil society or international organisations, ranging from ASEAN to WTO3. Compared to the other organisations mentioned above, international organisations have lower confidence levels from respondents, especially NATO, with only 3.6 per cent of respondents who indicated a great deal of confidence in it (see Figure 30).
3 Given that these were international organisations, approximately 300-400 respondents indicated that they did not know about these organisations across the items. These responses are not included in the calculations of the proportions who indicated confidence in these different organisations.
5.3% 6.5% 6.8% 8.3%3.6% 5.6%
12.7%6.4%
51.1% 47.2% 48.4%51.9%
39.9%
47.6%
57.1%
51.4%
38.9%39.3% 39.1%
35.7%
48.0%
41.6%
27.2%
37.6%
4.7% 7.0% 5.7% 4.1%8.5% 5.2% 2.9% 4.6%
0%
20%
40%
60%
80%
100%
ASEAN UN IMF ICC NATO World Bank WHO WTO
Figure 30: Confidence in international organisations, by institution
A great deal Quite a lot Not very much None at all

Chapter 2 | Public Confidence in Institutions
65
2.7.2 Though over half of respondents expressed confidence in ASEAN, this proportion was the lowest among ASEAN countries polled; similar proportions also indicated confidence in the UN
Slightly over half of the respondents expressed some level of confidence for ASEAN4; 5.3 per cent reported a great deal of confidence, while 51.1 per cent indicated quite a lot of confidence. When compared to Malaysian and Thai respondents, Singaporean respondents were found to have the lowest confidence levels in ASEAN. Meanwhile, there was even lower confidence in the United Nations (UN)5. While 6.5 per cent indicated they had a great deal of confidence, 47.2 per cent reported quite a lot of confidence in the organisation. Singaporean respondents expressed similar levels of confidence as those from Malaysia, Thailand, Japan, Hong Kong, Taiwan, and the UK. In comparison, under 50 per cent of American and Swiss respondents indicated a great deal or quite a lot of confidence in the UN (see Figures 31 and 32).
4 With respect to ASEAN, 6 respondents refused to answer, while 379 respondents indicated that they did not know about this organisation. 5 When asked about the UN, 6 respondents refused to answer, while 394 respondents said they did not know about this organisation.
5.3%10.7%
19.7%
51.1%51.3%
43.3%
38.9%34.8% 30.6%
4.7% 3.1% 6.4%
0%
10%
20%
30%
40%
50%
60%
70%
80%
90%
100%
Singapore Malaysia Thailand
Figure 31: Confidence in ASEAN, by polity
A great deal Quite a lot Not very much None at all

Attitudes towards Institutions, Politics, and Policies
66
The North Atlantic Treaty Organisation (NATO)6 garnered one of the lowest rates of confidence; 3.6 per cent of respondents reported a great deal of confidence, while 39.9 per cent indicated they had quite a lot of confidence in the organisation. However, over half of respondents reported not having very much confidence, or none at all. Singaporean respondents’ confidence in the NATO lay on the lower end of the spectrum, with similar confidence rates reported by respondents from Hong Kong, Australia and the US. Meanwhile, over half of Thais, South Koreans, Malaysians, Japanese, and Taiwanese expressed some level of confidence in NATO (see Figure 33).
6 Overall, 9 respondents refused to answer, and 420 respondents said they did not know when asked about NATO.
6.5%11.1%
18.7%
6.6%11.7% 8.2% 7.4% 11.7% 8.0% 8.1%
14.4%4.6%
47.2%44.5%
42.4%
53.7%
58.2%
47.5%43.7%
42.9%
36.4%43.9%
56.5%
43.5%
39.3% 37.9% 30.2% 32.2%
28.3%
37.8%40.8% 33.9%
39.9%
37.1%
23.4%
41.3%
7.0% 6.5% 8.7% 7.5%1.8%
6.5% 8.1% 11.6% 15.7%11.0%
5.6%10.7%
0%
10%
20%
30%
40%
50%
60%
70%
80%
90%
100%
Figure 32: Confidence in UN, by polity
A great deal Quite a lot Not very much None at all
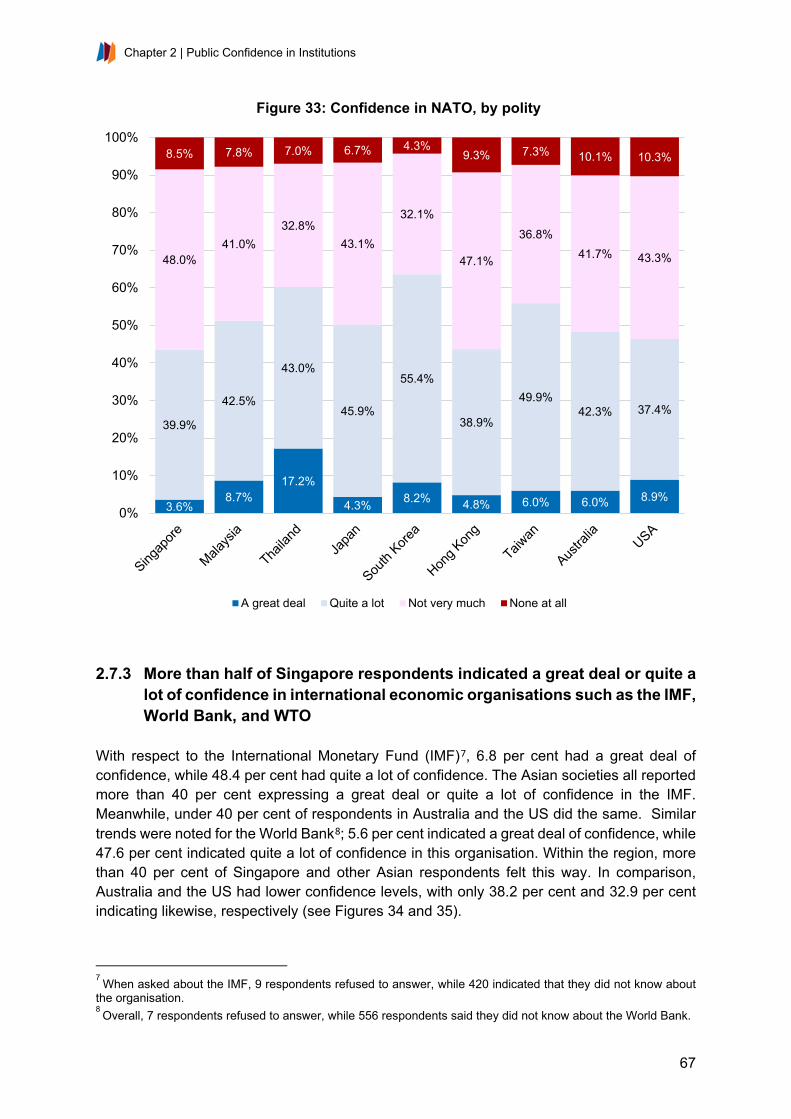
Chapter 2 | Public Confidence in Institutions
67
2.7.3 More than half of Singapore respondents indicated a great deal or quite a
lot of confidence in international economic organisations such as the IMF, World Bank, and WTO
With respect to the International Monetary Fund (IMF)7, 6.8 per cent had a great deal of confidence, while 48.4 per cent had quite a lot of confidence. The Asian societies all reported more than 40 per cent expressing a great deal or quite a lot of confidence in the IMF. Meanwhile, under 40 per cent of respondents in Australia and the US did the same. Similar trends were noted for the World Bank8; 5.6 per cent indicated a great deal of confidence, while 47.6 per cent indicated quite a lot of confidence in this organisation. Within the region, more than 40 per cent of Singapore and other Asian respondents felt this way. In comparison, Australia and the US had lower confidence levels, with only 38.2 per cent and 32.9 per cent indicating likewise, respectively (see Figures 34 and 35).
7 When asked about the IMF, 9 respondents refused to answer, while 420 indicated that they did not know about the organisation. 8 Overall, 7 respondents refused to answer, while 556 respondents said they did not know about the World Bank.
3.6%8.7%
17.2%
4.3% 8.2% 4.8% 6.0% 6.0% 8.9%
39.9%
42.5%
43.0%
45.9%
55.4%
38.9%
49.9%42.3% 37.4%
48.0%41.0%
32.8%43.1%
32.1%
47.1%
36.8%41.7% 43.3%
8.5% 7.8% 7.0% 6.7% 4.3%9.3% 7.3% 10.1% 10.3%
0%
10%
20%
30%
40%
50%
60%
70%
80%
90%
100%
Figure 33: Confidence in NATO, by polity
A great deal Quite a lot Not very much None at all
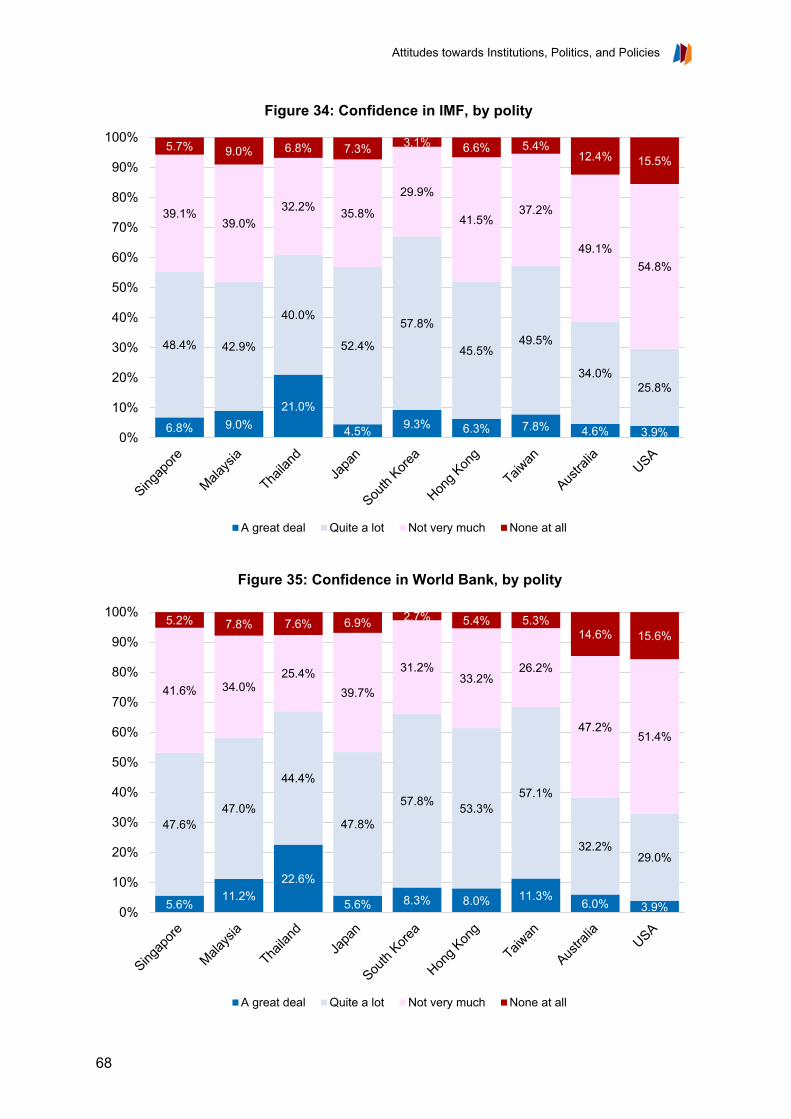
Attitudes towards Institutions, Politics, and Policies
68
6.8% 9.0%21.0%
4.5% 9.3% 6.3% 7.8% 4.6% 3.9%
48.4% 42.9%
40.0%
52.4%
57.8%
45.5%49.5%
34.0%25.8%
39.1%39.0%
32.2% 35.8%
29.9%
41.5%37.2%
49.1%54.8%
5.7% 9.0% 6.8% 7.3% 3.1% 6.6% 5.4%12.4% 15.5%
0%
10%
20%
30%
40%
50%
60%
70%
80%
90%
100%
Figure 34: Confidence in IMF, by polity
A great deal Quite a lot Not very much None at all
5.6%11.2%
22.6%
5.6% 8.3% 8.0% 11.3% 6.0% 3.9%
47.6%47.0%
44.4%
47.8%
57.8% 53.3%57.1%
32.2%29.0%
41.6% 34.0%25.4%
39.7%
31.2%33.2%
26.2%
47.2%51.4%
5.2% 7.8% 7.6% 6.9% 2.7% 5.4% 5.3%14.6% 15.6%
0%
10%
20%
30%
40%
50%
60%
70%
80%
90%
100%
Figure 35: Confidence in World Bank, by polity
A great deal Quite a lot Not very much None at all

Chapter 2 | Public Confidence in Institutions
69
Under 60 per cent of respondents indicated confidence in the World Trade Organization (WTO)9. 6.4 per cent had a great deal of confidence, while 51.4 per cent had quite a lot of confidence in the organisation. Compared to respondents from Malaysia, Thailand, South Korea, Hong Kong and Taiwan, Singaporean respondents displayed lower levels of confidence in the WTO. Meanwhile, Japanese respondents expressed similar levels of confidence in the organisation compared to Singaporeans. Australian and American respondents had the lowest confidence in the WTO, with under 45 per cent from each polity indicating they had a great deal or quite a lot of confidence in the WTO (see Figure 36).
9 When asked about the WTO, 7 respondents refused to answer while 486 indicated that they did not know about the organisation.
6.4% 10.7%19.9%
5.9% 7.9% 8.8% 9.7% 6.5% 4.8%
51.4%49.4%
45.0%
50.8%
63.1%51.3%
58.1%
36.9%30.1%
37.6% 34.2% 28.0%36.9%
27.4%
34.5%28.5%
46.5%
52.1%
4.6% 5.7% 7.2% 6.3%1.6%
5.4% 3.7%10.0% 12.9%
0%
10%
20%
30%
40%
50%
60%
70%
80%
90%
100%
Figure 36: Confidence in WTO, by polity
A great deal Quite a lot Not very much None at all
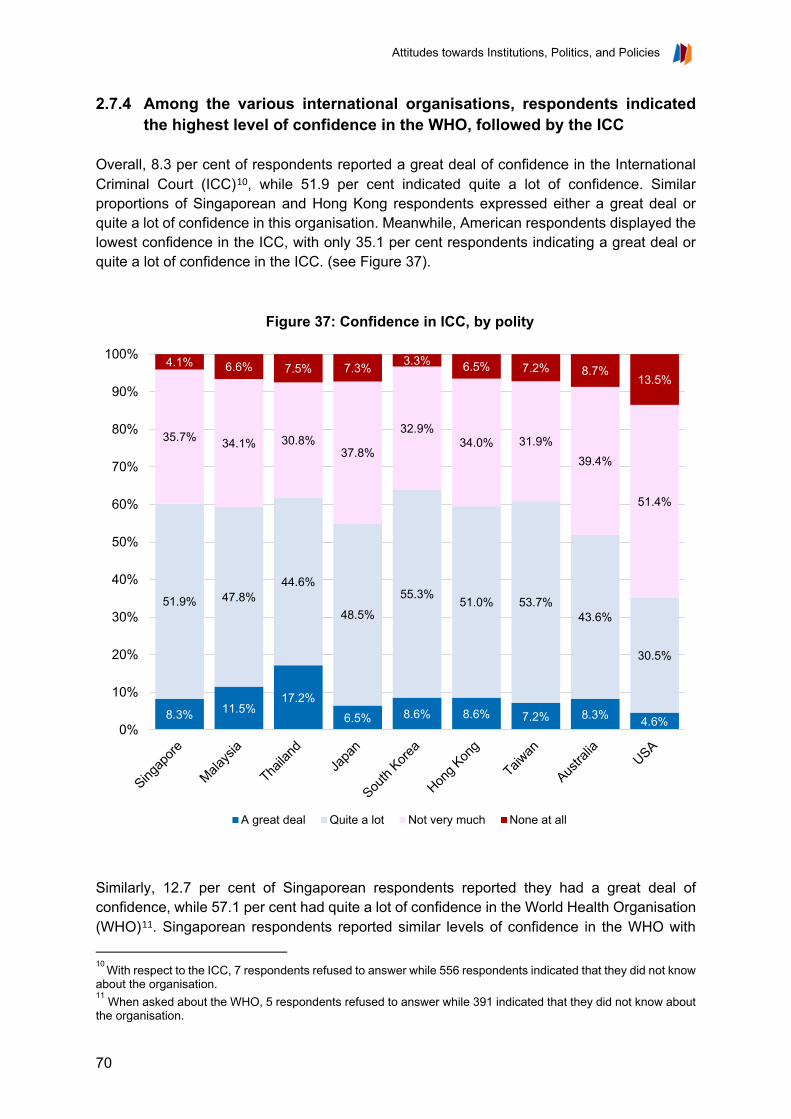
Attitudes towards Institutions, Politics, and Policies
70
2.7.4 Among the various international organisations, respondents indicated the highest level of confidence in the WHO, followed by the ICC
Overall, 8.3 per cent of respondents reported a great deal of confidence in the International Criminal Court (ICC)10, while 51.9 per cent indicated quite a lot of confidence. Similar proportions of Singaporean and Hong Kong respondents expressed either a great deal or quite a lot of confidence in this organisation. Meanwhile, American respondents displayed the lowest confidence in the ICC, with only 35.1 per cent respondents indicating a great deal or quite a lot of confidence in the ICC. (see Figure 37).
Similarly, 12.7 per cent of Singaporean respondents reported they had a great deal of confidence, while 57.1 per cent had quite a lot of confidence in the World Health Organisation (WHO)11. Singaporean respondents reported similar levels of confidence in the WHO with
10 With respect to the ICC, 7 respondents refused to answer while 556 respondents indicated that they did not know about the organisation. 11 When asked about the WHO, 5 respondents refused to answer while 391 indicated that they did not know about the organisation.
8.3% 11.5%17.2%
6.5% 8.6% 8.6% 7.2% 8.3% 4.6%
51.9% 47.8%44.6%
48.5%
55.3% 51.0% 53.7%43.6%
30.5%
35.7% 34.1% 30.8%37.8%
32.9%34.0% 31.9%
39.4%
51.4%
4.1% 6.6% 7.5% 7.3% 3.3% 6.5% 7.2% 8.7%13.5%
0%
10%
20%
30%
40%
50%
60%
70%
80%
90%
100%
Figure 37: Confidence in ICC, by polity
A great deal Quite a lot Not very much None at all

Chapter 2 | Public Confidence in Institutions
71
Taiwanese and Australian respondents, while being comparatively less confident in the organisation compared to Malaysia, Japan, South Korea, Hong Kong and Taiwan. Meanwhile, American respondents expressed the lowest level of confidence in the WHO (see Figure 38).
12.7%18.1%
22.6%
10.9% 12.0% 16.1% 16.0% 17.4%12.4%
57.1%
57.9% 45.4%62.7% 61.4%
60.3% 60.7%52.5%
40.5%
27.2%20.8%
26.4%22.5% 25.1% 20.6% 19.5%
25.0%
37.2%
2.9% 3.2% 5.6% 3.9%1.4%
3.0% 3.8% 5.1%10.0%
0%
10%
20%
30%
40%
50%
60%
70%
80%
90%
100%
Figure 38: Confidence in WHO, by polity
A great deal Quite a lot Not very much None at all
Attitudes towards Institutions, Politics, and Policies
72
Chapter 3
Political and Policy Attitudes

Chapter 3 | Political and Policy Attitudes
73
CHAPTER 3 | POLITICAL AND POLICY ATTITUDES
3.1 POLITICAL ATTITUDES 3.1.1 The majority of respondents were uninterested in politics; those who expressed higher levels of interest were more likely to be male, more educated, and more affluent A majority of the respondents reflected that they were either “not very interested” or “not at all interested” in politics. Only 37.2 per cent indicated they were “somewhat interested” or “very interested” in politics. Respondents who expressed higher levels of interest in politics were more likely to be male, higher educated, or more affluent. Given the socioeconomic disparity, it is likely that political interest develops in individuals only after daily needs are attended to, or when they have had more exposure to these issues via education or other opportunities that present with higher education. Compared to other selected polities, Singaporean respondents expressed one of the lowest levels of political interest (37.2 per cent), above only Hong Kong (30.4 per cent) and Taiwan (31.6 per cent). In all the other selected societies, more than 40 per cent of their respondents indicated that they were very interested or somewhat interested in politics (see Figure 39).

Attitudes towards Institutions, Politics, and Policies
74
Male respondents seem to be more interested in politics compared with female respondents. Overall, 43.7 per cent of male respondents indicated they were either very or somewhat interested in politics. In comparison, 31 per cent of female respondents gave the same response (see Table 39).
Table 39: Political interest, by gender
Gender N = 2,004
Political interest
Very interested
Somewhat interested
Not very interested
Not at all interested
Male 7.2 36.5 37.5 18.8
Female 2.5 28.5 40.7 28.3
With 49.1 per cent saying that they were very or somewhat interested in politics, Secular Liberals expressed the most political interest amongst the four clusters. Meanwhile,
4.8% 8.5%15.3%
10.1%2.4%
9.9%3.2% 3.6%
12.7%21.3%
15.0% 18.7%11.8%
32.4%
39.1%
42.7% 51.2%
41.9%
40.8%
27.2% 28.0%
42.0%
43.4%
36.6%
41.2%
42.4%
39.3%
38.8%
31.4%32.8%
48.9% 38.2%
45.1% 38.8%
29.0%
24.5%
26.4%
30.7%35.8%
23.4%13.7% 10.6%
6.0% 6.7%11.1%
24.6%29.7%
16.3%10.8%
21.9%
9.4% 10.1%
0%
10%
20%
30%
40%
50%
60%
70%
80%
90%
100%
FIgure 39: Levels of political interest, by polity
Very interested Somewhat interested Not very interested Not at all interested
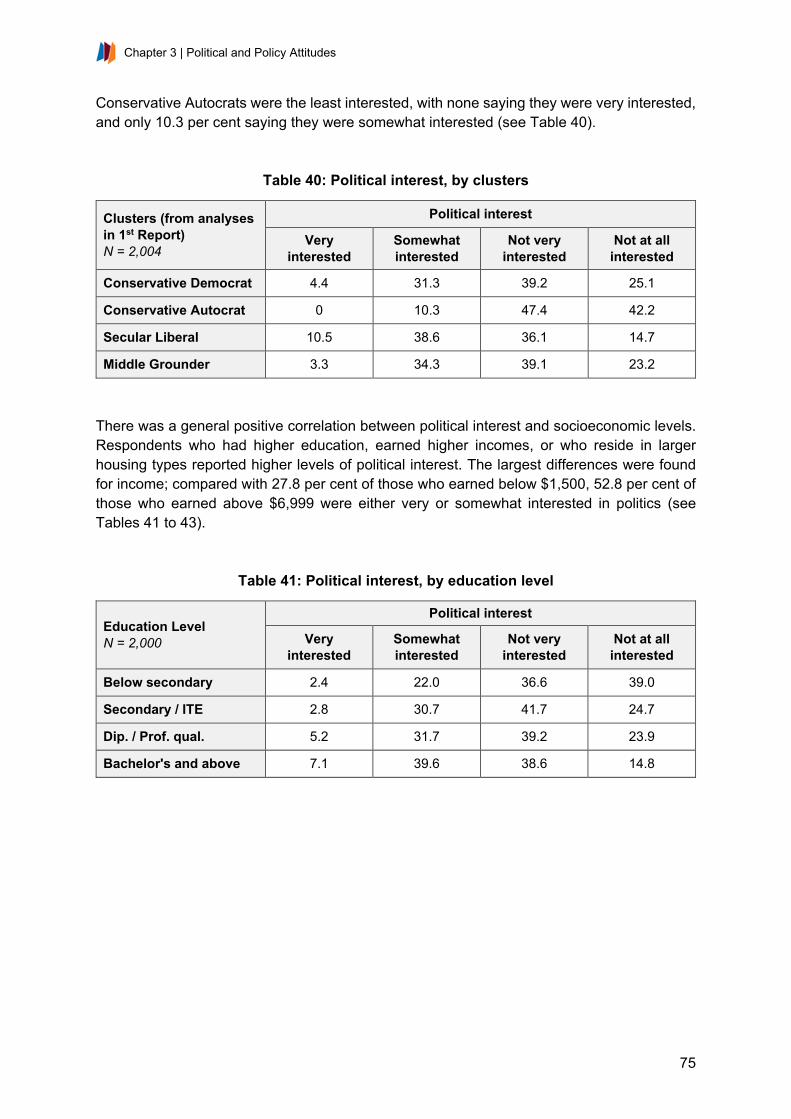
Chapter 3 | Political and Policy Attitudes
75
Conservative Autocrats were the least interested, with none saying they were very interested, and only 10.3 per cent saying they were somewhat interested (see Table 40).
Table 40: Political interest, by clusters
Clusters (from analyses in 1st Report) N = 2,004
Political interest
Very interested
Somewhat interested
Not very interested
Not at all interested
Conservative Democrat 4.4 31.3 39.2 25.1
Conservative Autocrat 0 10.3 47.4 42.2
Secular Liberal 10.5 38.6 36.1 14.7
Middle Grounder 3.3 34.3 39.1 23.2
There was a general positive correlation between political interest and socioeconomic levels. Respondents who had higher education, earned higher incomes, or who reside in larger housing types reported higher levels of political interest. The largest differences were found for income; compared with 27.8 per cent of those who earned below $1,500, 52.8 per cent of those who earned above $6,999 were either very or somewhat interested in politics (see Tables 41 to 43).
Table 41: Political interest, by education level
Education Level N = 2,000
Political interest
Very interested
Somewhat interested
Not very interested
Not at all interested
Below secondary 2.4 22.0 36.6 39.0
Secondary / ITE 2.8 30.7 41.7 24.7
Dip. / Prof. qual. 5.2 31.7 39.2 23.9
Bachelor's and above 7.1 39.6 38.6 14.8
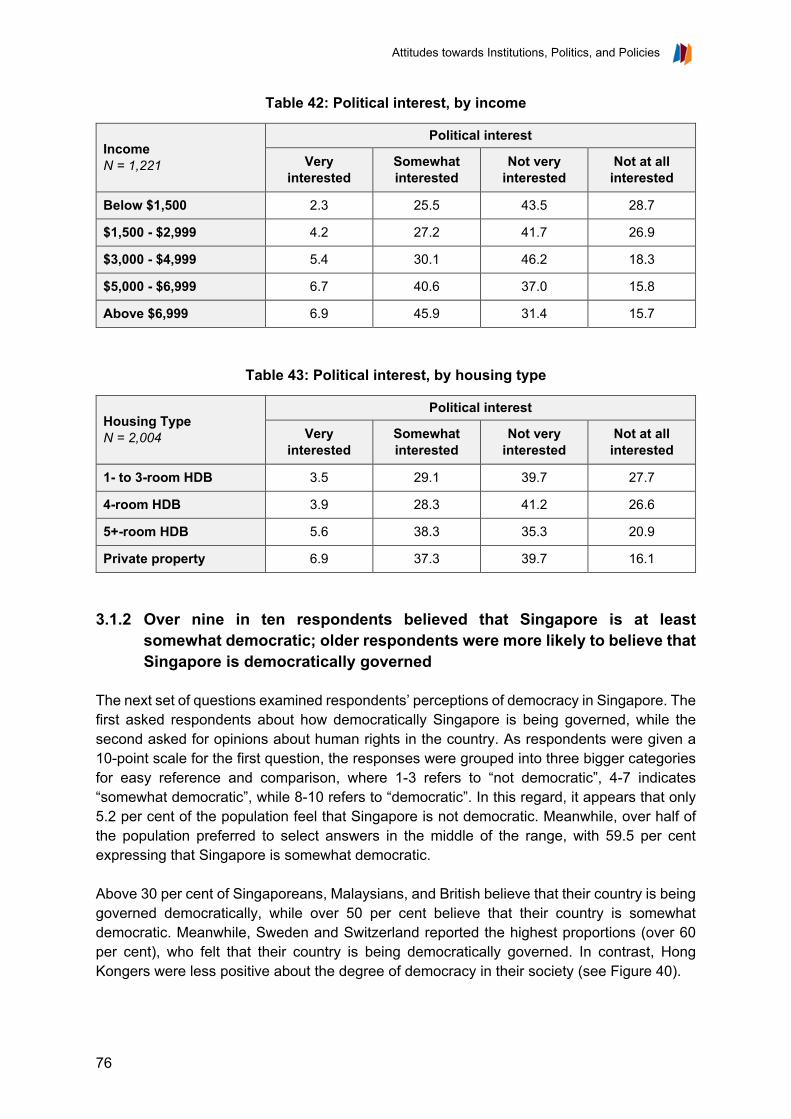
Attitudes towards Institutions, Politics, and Policies
76
Table 42: Political interest, by income
Income N = 1,221
Political interest
Very interested
Somewhat interested
Not very interested
Not at all interested
Below $1,500 2.3 25.5 43.5 28.7
$1,500 - $2,999 4.2 27.2 41.7 26.9
$3,000 - $4,999 5.4 30.1 46.2 18.3
$5,000 - $6,999 6.7 40.6 37.0 15.8
Above $6,999 6.9 45.9 31.4 15.7
Table 43: Political interest, by housing type
Housing Type N = 2,004
Political interest
Very interested
Somewhat interested
Not very interested
Not at all interested
1- to 3-room HDB 3.5 29.1 39.7 27.7
4-room HDB 3.9 28.3 41.2 26.6
5+-room HDB 5.6 38.3 35.3 20.9
Private property 6.9 37.3 39.7 16.1 3.1.2 Over nine in ten respondents believed that Singapore is at least
somewhat democratic; older respondents were more likely to believe that Singapore is democratically governed
The next set of questions examined respondents’ perceptions of democracy in Singapore. The first asked respondents about how democratically Singapore is being governed, while the second asked for opinions about human rights in the country. As respondents were given a 10-point scale for the first question, the responses were grouped into three bigger categories for easy reference and comparison, where 1-3 refers to “not democratic”, 4-7 indicates “somewhat democratic”, while 8-10 refers to “democratic”. In this regard, it appears that only 5.2 per cent of the population feel that Singapore is not democratic. Meanwhile, over half of the population preferred to select answers in the middle of the range, with 59.5 per cent expressing that Singapore is somewhat democratic. Above 30 per cent of Singaporeans, Malaysians, and British believe that their country is being governed democratically, while over 50 per cent believe that their country is somewhat democratic. Meanwhile, Sweden and Switzerland reported the highest proportions (over 60 per cent), who felt that their country is being democratically governed. In contrast, Hong Kongers were less positive about the degree of democracy in their society (see Figure 40).

Chapter 3 | Political and Policy Attitudes
77
The older the respondents, the more likely they were to answer within the democratic range of the answer scale. Compared with 28.5 per cent of the respondents aged between 21 and 35, 46.9 per cent of those above 65 felt Singapore is being governed democratically. Meanwhile, younger respondents were more likely to say that Singapore is somewhat democratic rather than democratic (see Table 44).
Table 44: Perceptions of democracy in Singapore, by age cohort
Age Cohort N = 1,962
Levels of democracy in Singapore
Not democratic Somewhat democratic Democratic
21-35 4.8 66.7 28.5
36-50 5.3 58.4 36.3
51-65 6.6 57.7 35.7
Above 65 2.8 50.3 46.9
35.3% 31.3%25.9%
49.4%
29.7%
47.7%
19.2%
53.9% 50.2%
28.5%38.2%
67.5% 64.7%
59.5%
51.4% 59.0%
45.1%
69.2%
46.0%
66.9%
40.5% 45.1%
57.6%
52.1%
28.3% 32.5%
5.2%
17.3% 15.0%5.6%
1.0%6.3%
13.9%5.6% 4.8%
13.9% 9.8%4.4% 2.8%
0%
10%
20%
30%
40%
50%
60%
70%
80%
90%
100%
Figure 40: How democratically is this country being governed today, by polity
Democratic Somewhat democratic Not democratic

Attitudes towards Institutions, Politics, and Policies
78
Given that support for democracy was one of the value dimensions included in the cluster analysis, it is of interest to see how the various clusters perceived Singapore governance. Conservative Democrats had the most positive impression of Singapore’s level of democracy, with 42.8 per cent saying that it is being governed democratically. Middle Grounders were also rather positive, with 32.5 per cent indicating that Singapore is being governed democratically. In contrast, Conservative Autocrats had the lowest proportion giving responses along the same range (see Table 45).
Table 45: Perceptions of democracy in Singapore, by clusters
Clusters (from analyses in 1st Report) N = 1,962
Levels of democracy in Singapore
Not democratic Somewhat democratic Democratic
Conservative Democrat 3.2 54.0 42.8
Conservative Autocrat 2.2 78.5 19.4
Secular Liberal 8.9 64.4 26.7
Middle Grounder 6.4 61.2 32.5
3.1.3 Over four-fifths of respondents believed that human rights are respected
in Singapore; this proportion was among the highest globally When it came to human rights, 87.6 per cent also felt that there is a great deal or fairly much respect for individual human rights in Singapore. More specifically, 15.1 per cent indicated that there is a great deal of respect for human rights, while 72.5 per cent felt that there is fairly much respect. Based on these answers, it appears that there was a generally positive evaluation of the state of democracy and human rights record in Singapore. When compared to other societies, Singapore ranked second behind China (88.5 per cent), with 87.6 per cent of its respondents indicating that there is a great deal of respect or fairly much respect for individual human rights. Meanwhile, Malaysia and the US had significantly lower proportions of respondents indicating likewise (see Figure 41).

Chapter 3 | Political and Policy Attitudes
79
When responses about human rights were separated by cluster, Conservative Democrats and Conservative Autocrats held similarly positive views. In comparison, smaller proportions of Secular Liberals felt that there was a great deal or fairly much respect for individual human rights (see Table 46).
Table 46: Perceptions of respect for human rights in Singapore, by clusters
Clusters (from analyses in 1st Report) N = 1,970
Respect for human rights
A great deal of respect
Fairly much respect
Not much respect
No respect at all
Conservative Democrat 18.6 72.6 7.7 1.1
Conservative Autocrat 16.7 72.5 9.8 1.0
Secular Liberal 12.1 69.4 14.9 3.6
Middle Grounder 12.0 73.4 12.9 1.8
15.1% 11.1%
24.9%
6.9% 5.0%
30.1%
8.1%18.1%
26.4%
10.9%
72.5%
46.8%
44.0%
66.5%81.0%
58.4%
64.7%
61.8%54.3%
45.9%
10.5%
36.9%
27.0%24.9%
13.7% 9.9%
24.6%17.2% 15.7%
37.1%
1.8%5.3% 4.1%
1.7% 0.3% 1.6%2.7% 3.0% 3.6% 6.1%
0%
10%
20%
30%
40%
50%
60%
70%
80%
90%
100%
Figure 41: Perceptions of respect for individual human rights, by polity
A great deal of respect Fairly much respect Not much respect No respect at all

Attitudes towards Institutions, Politics, and Policies
80
3.1.4 A large majority of respondents were at least somewhat satisfied with the functioning of the political system in Singapore; this was likewise among the highest compared to most other societies globally
Respondents were asked to evaluate the functioning of the political system along a 10-point scale. For easy comparability, the responses were condensed into three categories, where 1-3 refers to “not satisfied”, 4-7 refers to “somewhat satisfied”, and 8-10 refers to “satisfied”. Overall, 6.5 per cent were not satisfied. Meanwhile, 56.6 per cent of respondents indicated they were somewhat satisfied with the functioning of the political system. Singapore was the third most satisfied society with regards to their evaluation of the political system, with only China (57 per cent) and Switzerland (48.2 per cent) having higher proportions of respondents saying they were satisfied with the functioning of the political system. In contrast, the US (12.4 per cent), Taiwan (13.7 per cent), and Hong Kong (13.9 per cent) had the lowest proportions choosing within the “satisfied” range of answers. It should be noted that, with the exception of China, the bulk of respondents in all the selected societies indicated that they were somewhat satisfied with the functioning of their political systems rather than choosing answers on the extreme end of the response range (see Figure 42).
36.9%
24.2%18.6% 19.9%
24.3%
57.0%
13.9% 13.7%
25.3%
12.4%17.0%
32.1%
48.2%
56.6%
49.5% 63.1% 60.8%
74.5%
38.9%
61.7% 61.1%
53.4%
50.8%
56.5%
56.4%
45.5%
6.5%
26.2%18.4% 19.3%
1.1%4.1%
24.5% 25.3% 21.4%
36.7%26.4%
11.6%6.3%
0%
10%
20%
30%
40%
50%
60%
70%
80%
90%
100%
Figure 42: Satisfaction with functioning of political system, by polity
Satisfied Somewhat satisfied Not Satisfied

Chapter 3 | Political and Policy Attitudes
81
Compared with male respondents, of which 33.8 per cent indicated that they were satisfied, a higher proportion of female respondents were satisfied with the functioning of Singapore’s political system (see Table 47).
Table 47: Satisfaction with functioning of political system, by gender
Gender N = 1,992
Satisfaction with functioning of political system
Not satisfied Somewhat satisfied Satisfied
Male 8.7 57.6 33.8
Female 4.4 54.9 40.6
Older respondents were more satisfied with the functioning of Singapore’s political system. While 23.3 per cent of the youngest group indicated satisfaction to some degree, 52.1 per cent of those in the oldest group gave similar responses. It thus appears that younger respondents might be more critical of the political system. When age groups were further divided by political interest, different effects were found for respondents of different ages. For the youngest group, similar proportions expressed satisfaction for the political system, but there was a larger proportion of politically interested individuals who were not satisfied. For respondents aged between 36 and 65, there were smaller proportions of politically interested individuals who were somewhat satisfied, but larger proportions who were either not satisfied, or satisfied. In contrast, there were no major differences for respondents older than 65 when they were divided by political interest levels (see Tables 48 and 49).
Table 48: Satisfaction with functioning of political system, by age cohort
Age Cohort N = 1,992
Satisfaction with functioning of political system
Not satisfied Somewhat satisfied Satisfied
21-35 6.2 70.5 23.3
36-50 7.2 52.7 40.1
51-65 7.0 53.0 40.0
Above 65 4.2 43.7 52.1
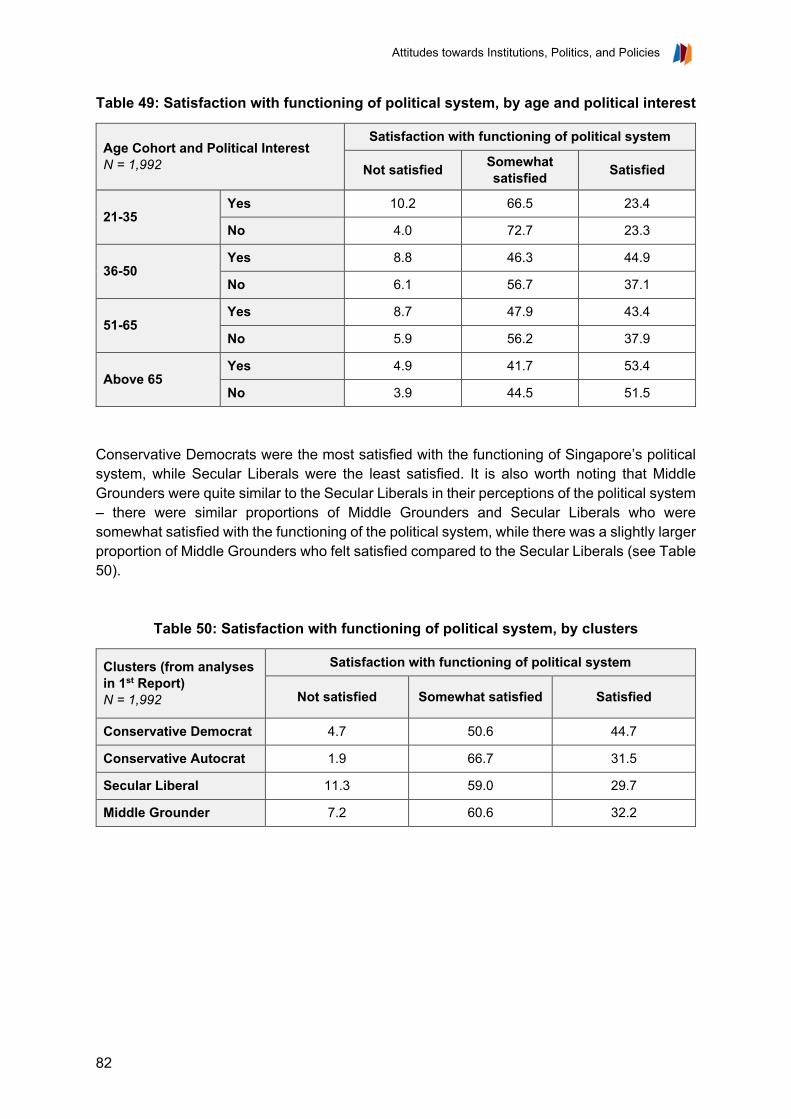
Attitudes towards Institutions, Politics, and Policies
82
Table 49: Satisfaction with functioning of political system, by age and political interest
Age Cohort and Political Interest N = 1,992
Satisfaction with functioning of political system
Not satisfied Somewhat satisfied Satisfied
21-35 Yes 10.2 66.5 23.4
No 4.0 72.7 23.3
36-50 Yes 8.8 46.3 44.9
No 6.1 56.7 37.1
51-65 Yes 8.7 47.9 43.4
No 5.9 56.2 37.9
Above 65 Yes 4.9 41.7 53.4
No 3.9 44.5 51.5
Conservative Democrats were the most satisfied with the functioning of Singapore’s political system, while Secular Liberals were the least satisfied. It is also worth noting that Middle Grounders were quite similar to the Secular Liberals in their perceptions of the political system – there were similar proportions of Middle Grounders and Secular Liberals who were somewhat satisfied with the functioning of the political system, while there was a slightly larger proportion of Middle Grounders who felt satisfied compared to the Secular Liberals (see Table 50).
Table 50: Satisfaction with functioning of political system, by clusters
Clusters (from analyses in 1st Report) N = 1,992
Satisfaction with functioning of political system
Not satisfied Somewhat satisfied Satisfied
Conservative Democrat 4.7 50.6 44.7
Conservative Autocrat 1.9 66.7 31.5
Secular Liberal 11.3 59.0 29.7
Middle Grounder 7.2 60.6 32.2

Chapter 3 | Political and Policy Attitudes
83
3.2 ATTITUDES TOWARDS GOVERNMENT SURVEILLANCE 3.2.1 Generally, respondents were supportive of having some form of
surveillance in public, but were significantly less so vis-à-vis the state monitoring people in private situations and without their knowledge
The WVS study asked respondents whether the government should have the right to keep people under video surveillance in public areas, monitor all emails and other information exchanged on the Internet, or collect information about anyone living in Singapore without their knowledge. There were varying responses to these three aspects of surveillance. While respondents were quite supportive of having some form of surveillance in public areas, they were much more disapproving of monitoring people in private situations and without notification. Their preferences were clear, given that a majority of respondents felt that video surveillance in public areas was acceptable, but over 70 per cent felt that monitoring emails or collecting information without notifying the target individuals were not (see Figure 43).
27.2%
7.4% 6.6%
39.2%
19.5%
15.2%
19.1%
38.7%
33.5%
14.5%
34.4%
44.7%
0.0%
10.0%
20.0%
30.0%
40.0%
50.0%
Keep people under videosurveillance in public areas
Monitor all emails and any otherinformation exchanged on the
Internet
Collect information about anyoneliving in Singapore without their
knowledge
Figure 43: Should the government have these rights, by item
Definitely should have the right Probably should have the right
Probably should not have the right Definitely should not have the right
Attitudes towards Institutions, Politics, and Policies
84
3.2.2 Close to two-thirds of respondents felt the Government has the right to keep people under video surveillance in public; elderly respondents were more likely to feel that the government “definitely” has the right to do so
Respondents were quite supportive of keeping people under video surveillance when in public areas, where 27.2 per cent believed that the government should definitely have the right, while 39.2 per cent felt that the government probably should have the right. Overall, it appears that respondents were quite accepting of being kept under video surveillance. As compared to societies like Thailand (78.6 per cent), China (82.2 per cent), Taiwan (76.9 per cent), Australia (82.5 per cent), the USA (68.6 per cent), the UK (81.5 per cent) and Sweden (87.4 per cent) a lower proportion of Singaporean respondents (66.4 per cent) believed that the government definitely should or probably should have the right for public surveillance. Similar to Singapore, less than 70 per cent of respondents from Malaysia, Japan, Hong Kong and Switzerland believed that the government definitely should or probably should have the right to conduct public surveillance. In contrast, South Koreans appeared more averse towards surveillance by the government, with the highest proportion across these selected societies indicating that the government definitely or probably should not have the right to keep people under public video surveillance (see Figure 44).

Chapter 3 | Political and Policy Attitudes
85
Older respondents were more likely to believe that the government definitely should have the right to keep people under video surveillance in public areas. Compared with 19.6 per cent of those aged between 21 and 35, 42.6 per cent of respondents aged above 65 years old chose the “definitely should have the right” option. Meanwhile, younger respondents who agreed with this proposition were more likely to choose the less definite option, “probably should have the right”. When compared with respondents interviewed before Covid-19 cases were reported in Singapore, those interviewed after were more likely to disagree about video surveillance vehemently. There were decreases in proportions for all the answer categories except for “definitely should not have the right”, which increased by at least eight percentage points. The sentiments divided by interview date and age reveal both age and time effects. Respondents of all age groups were more likely to disagree with the government keeping people under video surveillance if they were interviewed after the first case of Covid-19 was reported in Singapore, but younger respondents were still more disapproving compared to their older counterparts in both time periods (see Tables 51 to 53).
27.2% 27.4%
40.1%
12.8%6.4%
43.0%
8.1%
34.3%40.6%
23.0%34.9%
52.6%
21.6%
39.2% 42.0%
38.5%
50.2%
44.3%
39.2%
48.9%
42.6%41.9%
45.6%
46.6%
34.8%
40.7%
19.1% 16.1%
12.6%
26.2%
32.9%
10.4%
31.8%
12.8%12.1%
20.8%
11.7%10.3%
24.4%
14.5% 14.5%8.8% 10.8%
16.5%7.4% 11.2% 10.3%
5.4%10.6% 6.8% 2.3%
13.3%
0%
10%
20%
30%
40%
50%
60%
70%
80%
90%
100%
Figure 44: Government should have the right to keep people under video surveillance in public areas, by polity
Definitely should have the right Probably should have the right
Probably should not have the right Definitely should not have the right
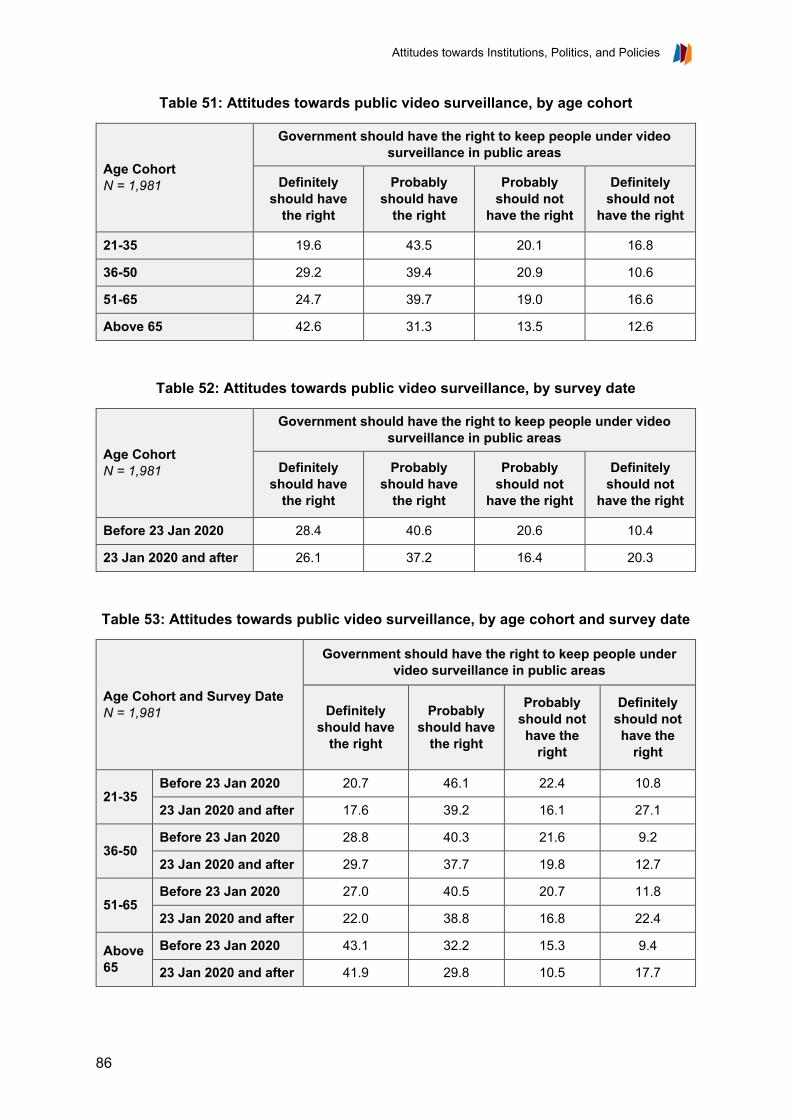
Attitudes towards Institutions, Politics, and Policies
86
Table 51: Attitudes towards public video surveillance, by age cohort
Age Cohort N = 1,981
Government should have the right to keep people under video surveillance in public areas
Definitely should have
the right
Probably should have
the right
Probably should not
have the right
Definitely should not
have the right
21-35 19.6 43.5 20.1 16.8
36-50 29.2 39.4 20.9 10.6
51-65 24.7 39.7 19.0 16.6
Above 65 42.6 31.3 13.5 12.6
Table 52: Attitudes towards public video surveillance, by survey date
Age Cohort N = 1,981
Government should have the right to keep people under video surveillance in public areas
Definitely should have
the right
Probably should have
the right
Probably should not
have the right
Definitely should not
have the right
Before 23 Jan 2020 28.4 40.6 20.6 10.4
23 Jan 2020 and after 26.1 37.2 16.4 20.3
Table 53: Attitudes towards public video surveillance, by age cohort and survey date
Age Cohort and Survey Date N = 1,981
Government should have the right to keep people under video surveillance in public areas
Definitely should have
the right
Probably should have
the right
Probably should not have the
right
Definitely should not have the
right
21-35 Before 23 Jan 2020 20.7 46.1 22.4 10.8
23 Jan 2020 and after 17.6 39.2 16.1 27.1
36-50 Before 23 Jan 2020 28.8 40.3 21.6 9.2
23 Jan 2020 and after 29.7 37.7 19.8 12.7
51-65 Before 23 Jan 2020 27.0 40.5 20.7 11.8
23 Jan 2020 and after 22.0 38.8 16.8 22.4
Above 65
Before 23 Jan 2020 43.1 32.2 15.3 9.4
23 Jan 2020 and after 41.9 29.8 10.5 17.7

Chapter 3 | Political and Policy Attitudes
87
3.2.3 Only over a quarter of respondents felt the Government has the right to monitor people’s online activities; older and less affluent respondents were more likely to feel this way
Vis-à-vis monitoring people’s online activities, there was general disapproval towards giving the government such rights. Here, 38.7 per cent felt that the government probably should not have the right, while 34.4 per cent were adamantly against it. With the exception of China, where a majority of respondents indicated that the government definitely should have or probably should have the right to monitor private information, under 50 per cent of Singaporean respondents, like those in all the other selected societies, believed that the government should have the right to monitor any personal information online (see Figure 45).
While respondents aged between 21 and 35 were slightly less likely to agree with the proposition to any extent when compared with those aged between 36 and 65, there was an even greater disparity between the first three groups and those aged above 65. While less than 8 per cent of those aged between 21 and 65 felt that the government definitely should have the right to monitor online activity, 15.5 per cent of those aged above 65 expressed this
7.4% 11.7% 9.9%3.5% 2.3%
23.8%
3.2%11.3% 7.0% 4.7%
9.7% 7.0% 5.6%
19.5%
23.5%32.8%
21.8% 20.2%
37.3%
20.7%
25.4%23.1%
18.7%
29.1%
22.3% 20.5%
38.7%30.5%
26.7%51.5%
36.7%
24.1%
46.1%32.1%
36.2%
36.5%
31.0%
36.0% 38.3%
34.4% 34.3% 30.6%23.2%
40.8%
14.9%
30.1% 31.2% 33.6%40.0%
30.2% 34.7% 35.6%
0%
10%
20%
30%
40%
50%
60%
70%
80%
90%
100%
Figure 45: Government should have the right to monitor all emails and any other information exchanged on the Internet, by polity
Definitely should have the right Probably should have the right
Probably should not have the right Definitely should not have the right

Attitudes towards Institutions, Politics, and Policies
88
opinion. Despite these differences, a majority of each age group still disagreed with the proposition to some extent (see Table 54).
Table 54: Attitudes towards online monitoring, by age cohort
Age Cohort N = 1,950
Government should have the right to monitor all emails and any other information exchanged on the Internet
Definitely should have
the right
Probably should have
the right
Probably should not
have the right
Definitely should not
have the right
21-35 3.5 16.8 40.3 39.4
36-50 7.4 20.0 40.6 31.9
51-65 6.8 19.2 37.5 36.4
Above 65 15.5 24.9 32.0 27.5
While respondents earning below $1,500 were more in favour of the proposal to give the Government the right to monitor online activity, the other income groups had very similar opinions. The same pattern was observed across housing types; respondents living in 1- to 3-room flats were more likely to agree with the proposal compared with the rest of the population. Overall, 39.4 per cent of those earning below $1,500 felt that the Government should have the right to some extent, whereas only 20 to 25 per cent of the other income groups felt so. Meanwhile, 35.3 per cent of those living in 1- to 3-room flats chose either “definitely should have the right” or “probably should have the right”, but less than 28 per cent of the other housing groups did so (see Tables 55 and 56).
Table 55: Attitudes towards online monitoring, by income
Income N = 1,200
Government should have the right to monitor all emails and any other information exchanged on the Internet
Definitely should have
the right
Probably should have
the right
Probably should not
have the right
Definitely should not
have the right
Below $1,500 11.7 27.7 28.2 32.5
$1,500 - $2,999 4.6 16.6 46.6 32.2
$3,000 - $4,999 5.2 16.1 41.0 37.7
$5,000 - $6,999 3.7 22.0 37.2 37.2
Above $6,999 4.5 21.0 42.0 32.5

Chapter 3 | Political and Policy Attitudes
89
Table 56: Attitudes towards online monitoring, by housing type
Housing Type N = 1,950
Government should have the right to monitor all emails and any other information exchanged on the Internet
Definitely should have
the right
Probably should have
the right
Probably should not
have the right
Definitely should not
have the right
1- to 3-room HDB 12.6 22.7 31.6 33.0
4-room HDB 6.6 21.3 40.1 32.0
5+-room HDB 5.2 15.3 44.5 35.1
Private property 3.0 17.1 38.4 41.5 3.2.4 More than three-quarters of respondents were against giving the
Government the right to collect information about individuals living in Singapore without the latter’s knowledge
Respondents were generally against giving the Government rights to collecting information about anyone in Singapore without their knowledge. Here, 33.5 per cent chose “probably should not have the right”, while 44.7 per cent were completely against the idea. When comparing across selected societies, China was the only one where over 50 per cent of the respondents believed that the government definitely should have or probably should have the right to collect information without their knowledge. Most Singaporean respondents did not agree with this, with only 21.8 per cent saying that the government has the right to do so. These results were similar to those found in South Korea (19.5 per cent), Sweden (20.6 per cent), and Switzerland (18.1 per cent). The societies that were the most disapproving of the government collecting information about residents were Japan (13.1 per cent) and Hong Kong (16.5 per cent) (see Figure 46).
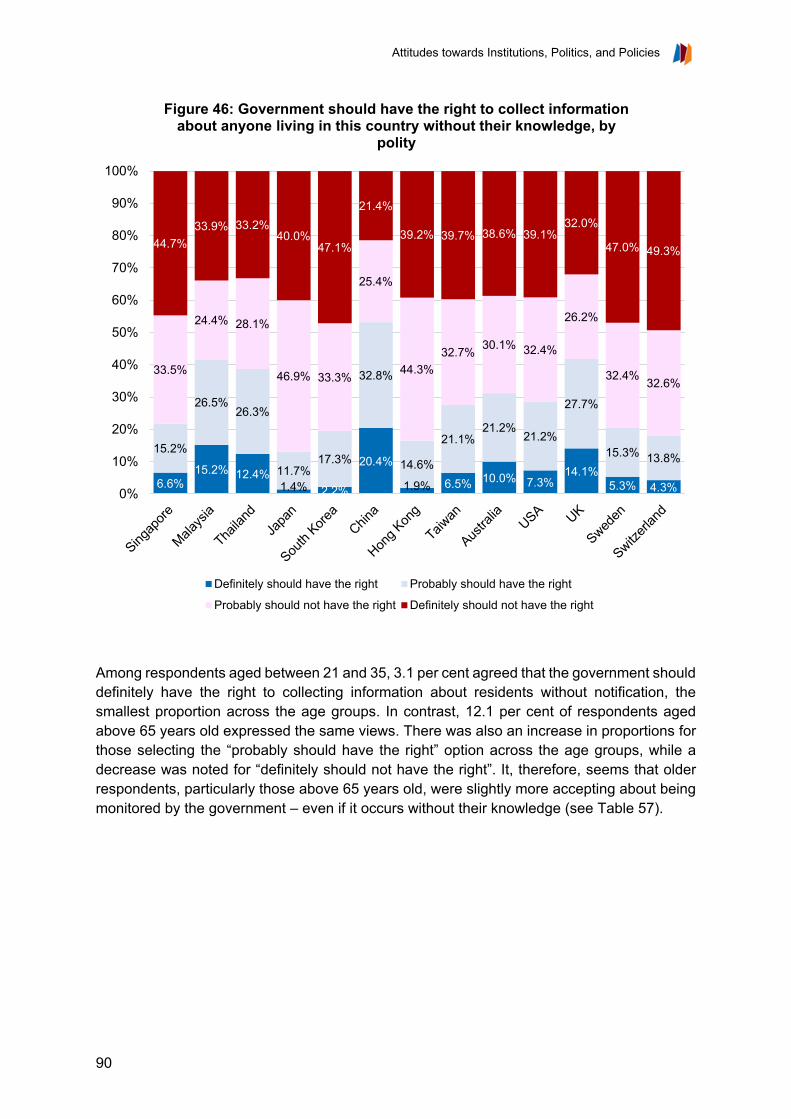
Attitudes towards Institutions, Politics, and Policies
90
Among respondents aged between 21 and 35, 3.1 per cent agreed that the government should definitely have the right to collecting information about residents without notification, the smallest proportion across the age groups. In contrast, 12.1 per cent of respondents aged above 65 years old expressed the same views. There was also an increase in proportions for those selecting the “probably should have the right” option across the age groups, while a decrease was noted for “definitely should not have the right”. It, therefore, seems that older respondents, particularly those above 65 years old, were slightly more accepting about being monitored by the government – even if it occurs without their knowledge (see Table 57).
6.6%15.2% 12.4%
1.4% 2.2%
20.4%
1.9% 6.5% 10.0% 7.3%14.1%
5.3% 4.3%
15.2%
26.5%26.3%
11.7%17.3%
32.8%
14.6%
21.1%21.2%
21.2%
27.7%
15.3% 13.8%
33.5%
24.4% 28.1%
46.9% 33.3%
25.4%
44.3%32.7% 30.1% 32.4%
26.2%
32.4% 32.6%
44.7%33.9% 33.2%
40.0%47.1%
21.4%
39.2% 39.7% 38.6% 39.1%32.0%
47.0% 49.3%
0%
10%
20%
30%
40%
50%
60%
70%
80%
90%
100%
Figure 46: Government should have the right to collect information about anyone living in this country without their knowledge, by
polity
Definitely should have the right Probably should have the right
Probably should not have the right Definitely should not have the right
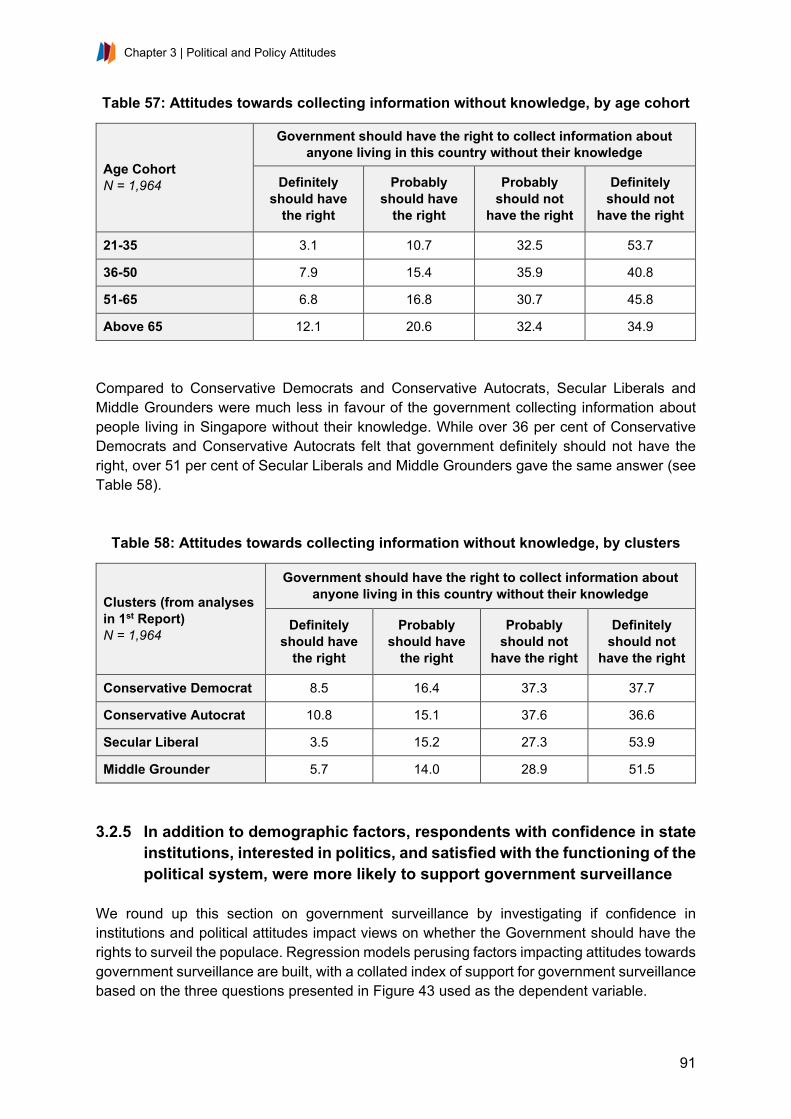
Chapter 3 | Political and Policy Attitudes
91
Table 57: Attitudes towards collecting information without knowledge, by age cohort
Age Cohort N = 1,964
Government should have the right to collect information about anyone living in this country without their knowledge
Definitely should have
the right
Probably should have
the right
Probably should not
have the right
Definitely should not
have the right
21-35 3.1 10.7 32.5 53.7
36-50 7.9 15.4 35.9 40.8
51-65 6.8 16.8 30.7 45.8
Above 65 12.1 20.6 32.4 34.9
Compared to Conservative Democrats and Conservative Autocrats, Secular Liberals and Middle Grounders were much less in favour of the government collecting information about people living in Singapore without their knowledge. While over 36 per cent of Conservative Democrats and Conservative Autocrats felt that government definitely should not have the right, over 51 per cent of Secular Liberals and Middle Grounders gave the same answer (see Table 58).
Table 58: Attitudes towards collecting information without knowledge, by clusters
Clusters (from analyses in 1st Report) N = 1,964
Government should have the right to collect information about anyone living in this country without their knowledge
Definitely should have
the right
Probably should have
the right
Probably should not
have the right
Definitely should not
have the right
Conservative Democrat 8.5 16.4 37.3 37.7
Conservative Autocrat 10.8 15.1 37.6 36.6
Secular Liberal 3.5 15.2 27.3 53.9
Middle Grounder 5.7 14.0 28.9 51.5
3.2.5 In addition to demographic factors, respondents with confidence in state
institutions, interested in politics, and satisfied with the functioning of the political system, were more likely to support government surveillance
We round up this section on government surveillance by investigating if confidence in institutions and political attitudes impact views on whether the Government should have the rights to surveil the populace. Regression models perusing factors impacting attitudes towards government surveillance are built, with a collated index of support for government surveillance based on the three questions presented in Figure 43 used as the dependent variable.

Attitudes towards Institutions, Politics, and Policies
92
Aside from age and affluence as the main demographic factors driving attitudes towards surveillance as elaborated on in 3.2.1 to 3.2.4, we find that respondents who are 1) more confident in state institutions, 2) politically interested, and 3) more satisfied with the functioning of the political system, are more likely to exhibit higher support for government surveillance. In addition, respondents who 1) were not born in Singapore, 2) were older than 65 years old, 3) had secondary or ITE education, and 4) resided in 1- to 3-room HDB flats, were more likely to feel this way (see Table 59).
Table 59: Support for government surveillance (linear regression)
Variables Model 1 Standardised Coefficient
Confidence in state institutions .076***
Political interest (Y/N) .050*
How democratic is SG .025
Satisfaction with political system functioning .185***
Local-born (vs not local-born) -.134***
Gender (females vs males) .019
Age
21-35 -.123***
36-50 -.050
51-65 -.093**
Reference group: Above 65
Education
Below secondary school .035
Secondary school/ ITE .092***
Diploma/ Professional qualification .021
Reference group: Bachelor’s and above
Housing type
1- 3-room HDB .089**
4-room HDB .053
5+-room HDB .000
Reference group: Private property
Adjusted R2 .121
* p < 0.05, ** p < 0.01, *** p < 0.001
Chapter 3 | Political and Policy Attitudes
93
3.3 ATTITUDES TOWARDS IMMIGRATION 3.3.1 Overall attitudes towards immigration were driven primarily by
citizenship status; education and affluence shaped views on the economic and socio-cultural implications of immigration
This section examines respondent attitudes towards immigration and immigrants. Given that Singapore has had large migration inflows since before its independence, it is essential to get an accurate grasp on what citizens and PRs think about these newcomers, such as whether they are positive additions to society. The questions posed about immigration include one that asked whether people wanted immigrants as neighbours, the kinds of effects or contributions immigrants had made to society, as well as their preferred policy stance that the government should take on immigration going forward. It is not surprising to find that naturalised citizens and PRs had more positive views of immigrants and immigration, given that they were part of this group themselves. It was also found that respondents with higher education, earning higher salaries, or who lived in larger housing types were more positive about the economic impact of immigrants and immigration, but less so when asked about social and cultural implications. This finding implies that any aversion towards immigration is likely derived from different sources for people of different socioeconomic levels; those who were less well-off viewed immigrants as economic and employment threats, while those who were more well-off were more concerned about the social and cultural dimension. The results were also compared across interview periods to see if there has been any impact on views due to the ongoing Covid-19 pandemic. Given that Covid-19 spread faster around the globe due to the high volume of international travel, it was thought that there would be a higher aversion to immigrants regardless of the question. Results from the three sub-sections neither support nor disprove this conjecture. Both positive and negative sentiments towards immigrants and immigration decreased; instead, respondents were more likely to choose the neutral or less extreme options, depending on the nature of the response scale. 3.3.2 Under half of respondents were on the fence regarding the impact of
immigrants on Singapore’s development; naturalised citizens, PRs and more educated respondents were likelier to assess the impact positively
The next set of questions examined what type of impact respondents think immigrants have on Singapore. When asked whether immigrants have positively or negatively impacted Singapore’s development, 45.1 per cent were on the fence. Compared with respondents who believed the impact was quite bad or very bad; however, a higher proportion felt that immigrants had “quite good” or “very good” impact on Singapore’s development. Based on these answers, it seems like the overall attitude towards immigrants was either neutral or positive. The proportion of Singaporean respondents who have a positive evaluation of the impact of immigrants on development is most similar to the results found in Taiwan, the US, Sweden,

Attitudes towards Institutions, Politics, and Policies
94
and Switzerland. Chinese respondents were the most positive about immigrants, given that only 7.9 per cent felt that immigrants had a very bad or quite bad impact on the country’s development and 52.2 per cent felt that their impact was quite good or very good. Meanwhile, over 40 per cent of Malaysians, Thais, and Australians felt that immigrants had a “quite bad” or “very bad” impact on their country’s development (see Figure 47).
Compared with local-born citizens, naturalised citizens and PRs had a much higher evaluation of immigrants. Here, 12.2 per cent of local-born citizens felt that the impact of immigrants was quite bad, while 48.7 per cent felt it was neither good nor bad. In contrast, only 4.3 per cent of the naturalised citizens and PRs felt that the impact was quite bad. Furthermore, a smaller proportion of 30.1 per cent chose the neutral option, while 46.2 per cent believed that the impact was quite good. Given that they were immigrants themselves, it is possible that they personally related to this question, and therefore, gave quite positive evaluations (see Table 60).
2.9%
18.4% 14.8%5.3% 0.9% 1.1%
7.6% 4.3%12.8%
3.5% 3.9% 7.5%3.2%
10.6%
30.5%
27.3%
25.8%
21.2%
6.8%
23.7%
19.5%
28.8%
12.7% 11.1%
23.9%
11.4%
45.1%
33.6% 50.1%
37.1%50.7%
39.9%
54.5%
35.5%
31.2%
43.8%
35.5%
28.9%
45.7%
34.0%
15.5%
6.2%
28.0%26.6%
42.3%
12.8%
36.3%
20.5%
28.7%
34.8%
31.2% 31.2%
7.5%2.1%
1.6%3.8%
0.6%
9.9%
1.4%4.3% 6.8%
11.3% 14.8%8.5% 8.6%
0%
10%
20%
30%
40%
50%
60%
70%
80%
90%
100%
Figure 47: Impact of immigrants on society's development, by polity
Very bad Quite bad Neither good, nor bad Quite good Very good

Chapter 3 | Political and Policy Attitudes
95
Table 60: Perceived impact of immigration on development, by citizenship status
Citizenship Status N = 1,999
Impact of immigration on Singapore’s development
Very bad Quite bad Neither
good nor bad
Quite good Very good
Local-born citizen 3.4 12.2 48.7 31.1 4.5
Naturalised citizen / PR 0.8 4.3 30.1 46.2 18.7
Respondents with higher education were more positive about the impact of immigrants on Singapore’s development. The lowest-educated respondents were most likely to perceive a neutral or adverse impact on development; only 32.1 per cent felt the impact of immigration on development was good. In contrast, 52.8 per cent of those with Bachelor’s or higher qualifications felt that the impact of immigrants was “quite good” or “very good” (see Table 61).
Table 61: Perceived impact of immigration on development, by education level
Education Level N = 1,995
Impact of immigration on Singapore’s development
Very bad Quite bad Neither
good nor bad
Quite good Very good
Below secondary 5.2 10.9 51.8 27.5 4.6
Secondary / ITE 3.7 13.9 46.2 29.9 6.2
Dip. / Prof. qual. 2.0 11.0 48.9 32.2 6.0
Bachelor's and above 1.5 7.7 38.0 42.3 10.5
When asked about specific effects encompassing diversity, safety and economics, respondents were more divided. Most people think that coming to Singapore offers people from poor countries a better living, and that immigrants help to fill important job vacancies, indicating that perceptions and attitudes towards immigration are largely based on economic considerations. The next two points that over 40 per cent of respondents agreed with are “strengthen cultural diversity” and “lead to social conflict”. While these two statements are contradictory, it does point to concerns about the cultural effect of immigration. Meanwhile, giving political asylum is seen as the least possible effect of immigration. In general, younger respondents, particularly the group aged between 21 and 35, as well as naturalised citizens and PRs, held more positive attitudes towards immigrants. As immigrants themselves, it is not surprising to see naturalised citizens and PRs being more positive about the impact of immigration on Singapore. Meanwhile, the more positive attitudes held by younger respondents appear consistent with their general tendency across the survey to be more open to diversity and differences. There also seem to be more neutral attitudes towards immigrants — together with drops in both agreement and disagreement rates — expressed
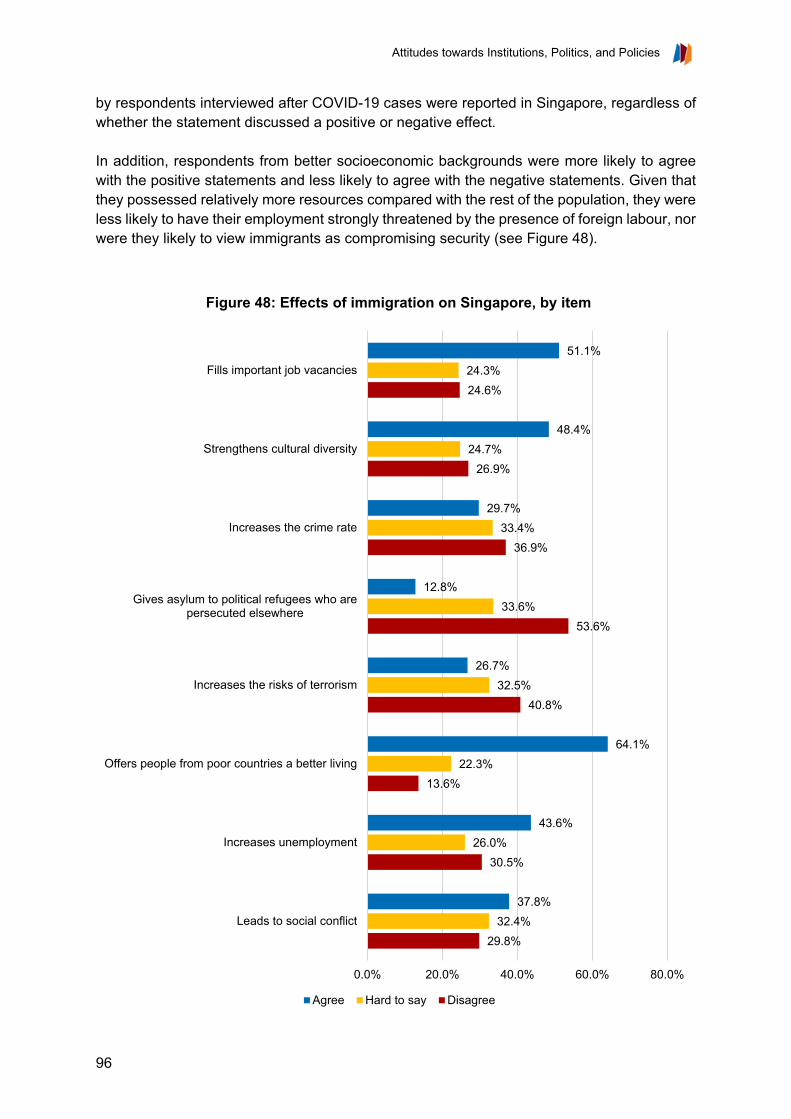
Attitudes towards Institutions, Politics, and Policies
96
by respondents interviewed after COVID-19 cases were reported in Singapore, regardless of whether the statement discussed a positive or negative effect. In addition, respondents from better socioeconomic backgrounds were more likely to agree with the positive statements and less likely to agree with the negative statements. Given that they possessed relatively more resources compared with the rest of the population, they were less likely to have their employment strongly threatened by the presence of foreign labour, nor were they likely to view immigrants as compromising security (see Figure 48).
29.8%
30.5%
13.6%
40.8%
53.6%
36.9%
26.9%
24.6%
32.4%
26.0%
22.3%
32.5%
33.6%
33.4%
24.7%
24.3%
37.8%
43.6%
64.1%
26.7%
12.8%
29.7%
48.4%
51.1%
0.0% 20.0% 40.0% 60.0% 80.0%
Leads to social conflict
Increases unemployment
Offers people from poor countries a better living
Increases the risks of terrorism
Gives asylum to political refugees who arepersecuted elsewhere
Increases the crime rate
Strengthens cultural diversity
Fills important job vacancies
Figure 48: Effects of immigration on Singapore, by item
Agree Hard to say Disagree
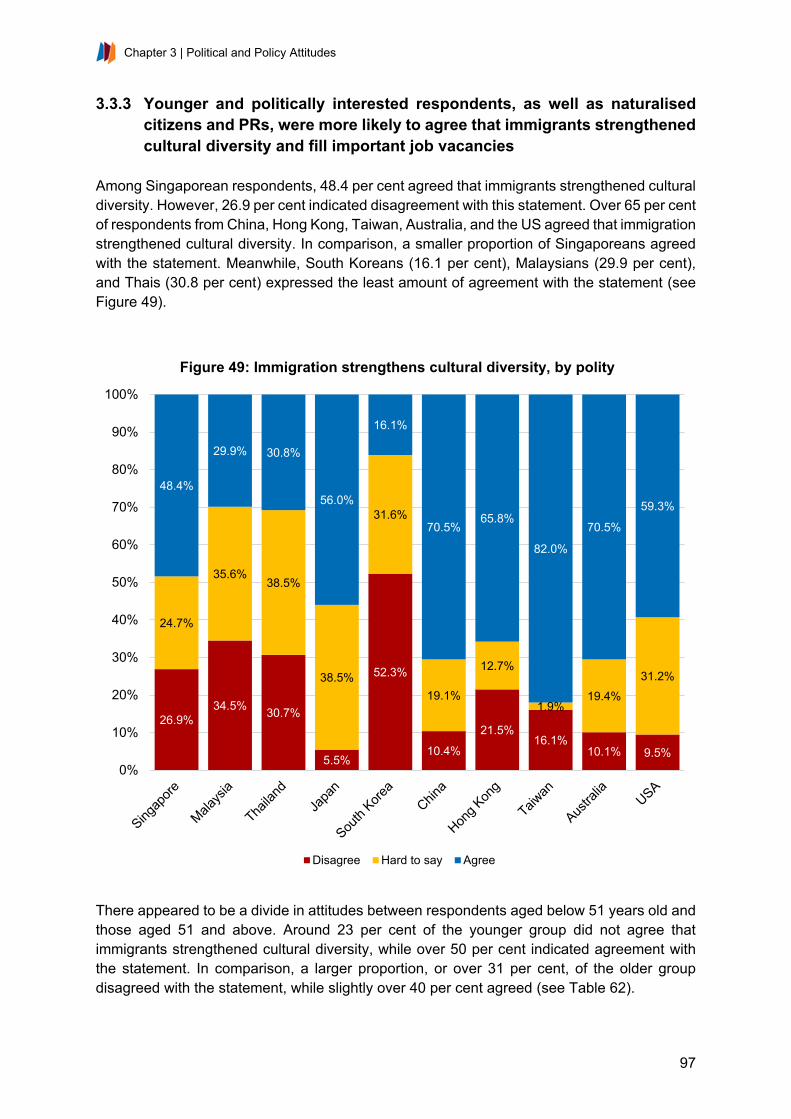
Chapter 3 | Political and Policy Attitudes
97
3.3.3 Younger and politically interested respondents, as well as naturalised citizens and PRs, were more likely to agree that immigrants strengthened cultural diversity and fill important job vacancies
Among Singaporean respondents, 48.4 per cent agreed that immigrants strengthened cultural diversity. However, 26.9 per cent indicated disagreement with this statement. Over 65 per cent of respondents from China, Hong Kong, Taiwan, Australia, and the US agreed that immigration strengthened cultural diversity. In comparison, a smaller proportion of Singaporeans agreed with the statement. Meanwhile, South Koreans (16.1 per cent), Malaysians (29.9 per cent), and Thais (30.8 per cent) expressed the least amount of agreement with the statement (see Figure 49).
There appeared to be a divide in attitudes between respondents aged below 51 years old and those aged 51 and above. Around 23 per cent of the younger group did not agree that immigrants strengthened cultural diversity, while over 50 per cent indicated agreement with the statement. In comparison, a larger proportion, or over 31 per cent, of the older group disagreed with the statement, while slightly over 40 per cent agreed (see Table 62).
26.9%34.5% 30.7%
5.5%
52.3%
10.4%
21.5%16.1%
10.1% 9.5%
24.7%
35.6%38.5%
38.5%
31.6%
19.1%
12.7%
1.9%19.4%
31.2%
48.4%
29.9% 30.8%
56.0%
16.1%
70.5%65.8%
82.0%
70.5%
59.3%
0%
10%
20%
30%
40%
50%
60%
70%
80%
90%
100%
Figure 49: Immigration strengthens cultural diversity, by polity
Disagree Hard to say Agree
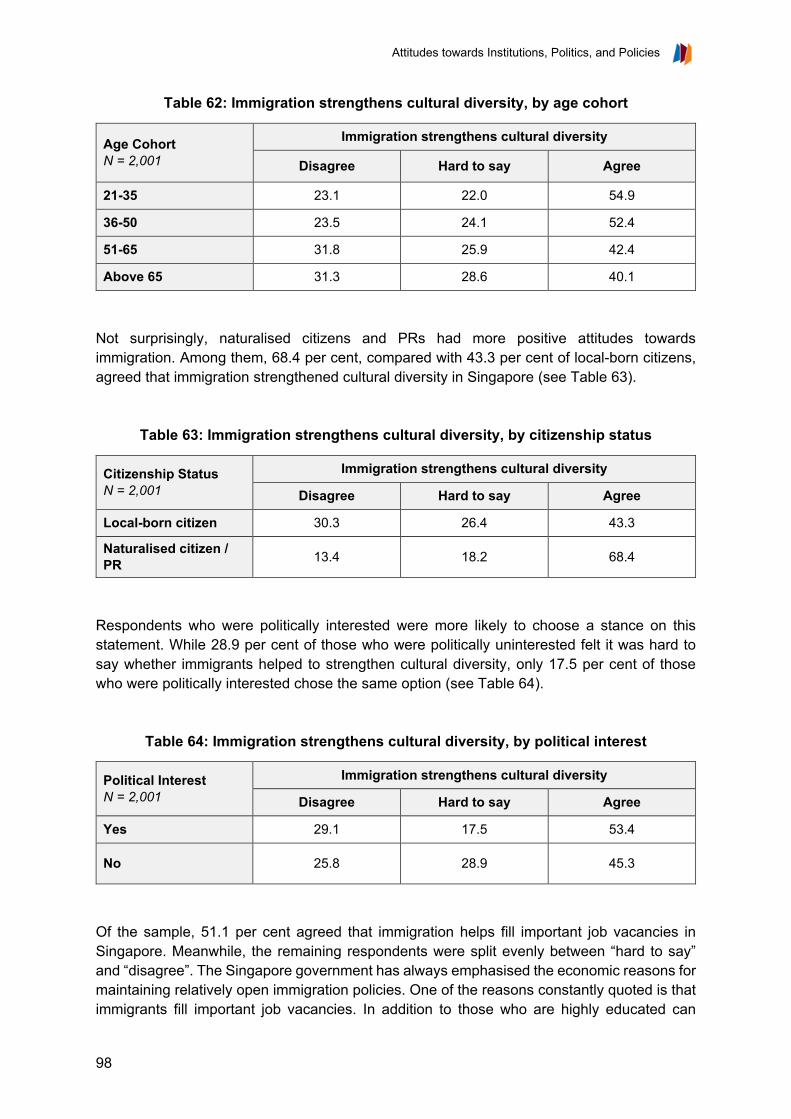
Attitudes towards Institutions, Politics, and Policies
98
Table 62: Immigration strengthens cultural diversity, by age cohort
Age Cohort N = 2,001
Immigration strengthens cultural diversity
Disagree Hard to say Agree
21-35 23.1 22.0 54.9
36-50 23.5 24.1 52.4
51-65 31.8 25.9 42.4
Above 65 31.3 28.6 40.1
Not surprisingly, naturalised citizens and PRs had more positive attitudes towards immigration. Among them, 68.4 per cent, compared with 43.3 per cent of local-born citizens, agreed that immigration strengthened cultural diversity in Singapore (see Table 63).
Table 63: Immigration strengthens cultural diversity, by citizenship status
Citizenship Status N = 2,001
Immigration strengthens cultural diversity
Disagree Hard to say Agree
Local-born citizen 30.3 26.4 43.3
Naturalised citizen / PR 13.4 18.2 68.4
Respondents who were politically interested were more likely to choose a stance on this statement. While 28.9 per cent of those who were politically uninterested felt it was hard to say whether immigrants helped to strengthen cultural diversity, only 17.5 per cent of those who were politically interested chose the same option (see Table 64).
Table 64: Immigration strengthens cultural diversity, by political interest
Political Interest N = 2,001
Immigration strengthens cultural diversity
Disagree Hard to say Agree
Yes 29.1 17.5 53.4
No 25.8 28.9 45.3
Of the sample, 51.1 per cent agreed that immigration helps fill important job vacancies in Singapore. Meanwhile, the remaining respondents were split evenly between “hard to say” and “disagree”. The Singapore government has always emphasised the economic reasons for maintaining relatively open immigration policies. One of the reasons constantly quoted is that immigrants fill important job vacancies. In addition to those who are highly educated can
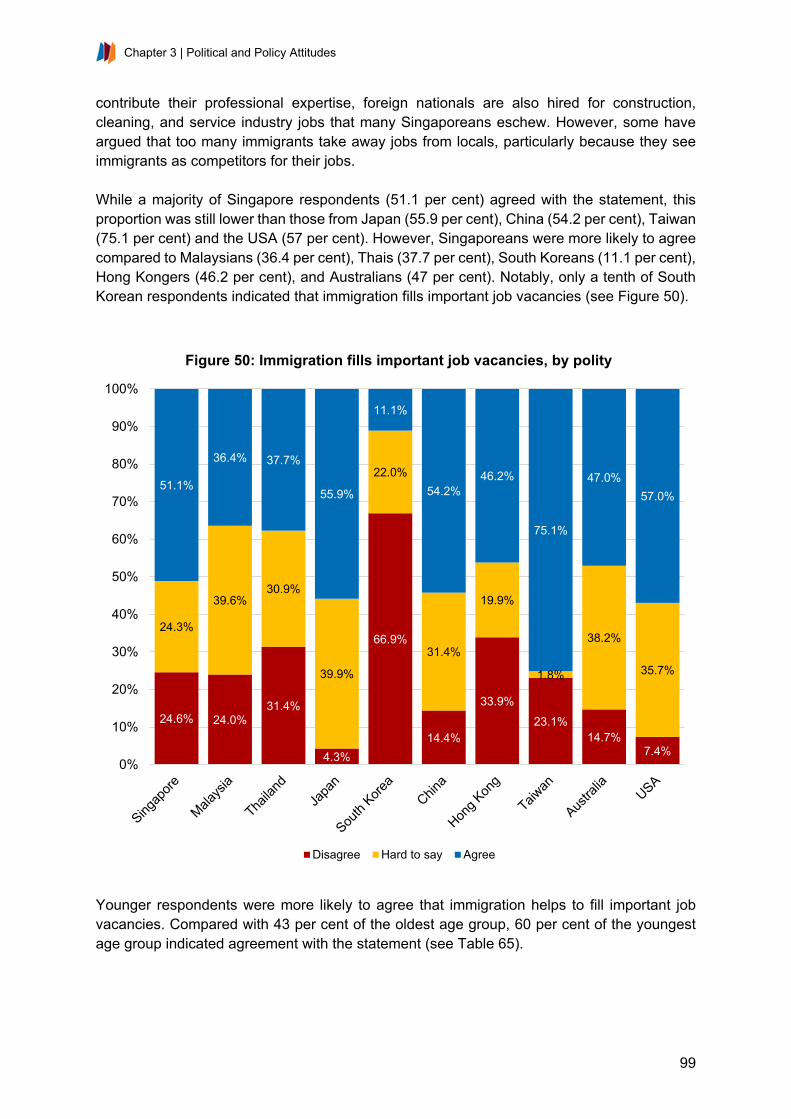
Chapter 3 | Political and Policy Attitudes
99
contribute their professional expertise, foreign nationals are also hired for construction, cleaning, and service industry jobs that many Singaporeans eschew. However, some have argued that too many immigrants take away jobs from locals, particularly because they see immigrants as competitors for their jobs. While a majority of Singapore respondents (51.1 per cent) agreed with the statement, this proportion was still lower than those from Japan (55.9 per cent), China (54.2 per cent), Taiwan (75.1 per cent) and the USA (57 per cent). However, Singaporeans were more likely to agree compared to Malaysians (36.4 per cent), Thais (37.7 per cent), South Koreans (11.1 per cent), Hong Kongers (46.2 per cent), and Australians (47 per cent). Notably, only a tenth of South Korean respondents indicated that immigration fills important job vacancies (see Figure 50).
Younger respondents were more likely to agree that immigration helps to fill important job vacancies. Compared with 43 per cent of the oldest age group, 60 per cent of the youngest age group indicated agreement with the statement (see Table 65).
24.6% 24.0%31.4%
4.3%
66.9%
14.4%
33.9%23.1%
14.7%7.4%
24.3%
39.6%30.9%
39.9%
22.0%
31.4%
19.9%
1.8%
38.2%
35.7%
51.1%
36.4% 37.7%
55.9%
11.1%
54.2%46.2%
75.1%
47.0%57.0%
0%
10%
20%
30%
40%
50%
60%
70%
80%
90%
100%
Figure 50: Immigration fills important job vacancies, by polity
Disagree Hard to say Agree

Attitudes towards Institutions, Politics, and Policies
100
Table 65: Immigration fills important job vacancies, by age cohort
Age Cohort N = 1,999
Immigration fills important job vacancies
Disagree Hard to say Agree
21-35 17.1 22.9 60.0
36-50 23.1 24.2 52.8
51-65 29.2 25.6 45.2
Above 65 31.1 25.9 43.0
While a large proportion of local-born citizens do agree that immigration helps fill important job vacancies in Singapore, this sentiment is stronger amongst the naturalised citizens and PRs. Over half, or 65.9 per cent, of the latter group indicated agreement with the statement, compared with 47.3 per cent of local-born citizens (see Table 66).
Table 66: Immigration fills important job vacancies, by citizenship status
Citizenship Status N = 1,999
Immigration fills important job vacancies
Disagree Hard to say Agree
Local-born citizen 27.3 25.4 47.3
Naturalised citizen / PR 13.1 21.0 65.9
When compared across employment types, the proportions of the groups that disagreed with the statement generally stayed below 30 per cent. The only exception was the students, of which only 13.5 per cent felt immigrants did not fill important job vacancies. They were also the group that has by far the largest agreement rate at 70.8 per cent. In contrast, between 45 per cent to 56 per cent of the other specified employment types agreed (see Table 67).
Table 67: Immigration fills important job vacancies, by employment type
Employment Type N = 1,999
Immigration fills important job vacancies
Disagree Hard to say Agree
Full-time employee 25.3 23.8 50.9
Part-time employee 28.5 25.3 46.2
Self-employed 20.9 32.1 47.0
Retired/pensioned 26.1 26.9 47.0
Housewife 25.2 24.3 50.5
Student 13.5 15.7 70.8

Chapter 3 | Political and Policy Attitudes
101
Unemployed 20.6 23.8 55.6
Others 12.5 12.5 75.0
3.3.4 Over a third of respondents were worried that immigration leads to social
conflict and unemployment, but many disagreed that immigration increases the risk of terrorism and crime rates
Singaporean respondents were almost equally split across the three options. While the most popular response to whether immigration leads to social conflict was “agree”, the distribution of answers was still quite even across the three answer categories. Here, 29.8 per cent felt that immigration did not lead to social conflict, 37.8 per cent indicated otherwise, while 32.4 per cent were undecided. They expressed similar opinions to Thais, Australians, and Americans, with around 40 per cent indicating that immigration led to social conflict. Singaporeans were more in favour of the statement compared to Japanese (23.5 per cent), South Koreans (12.7 per cent), and Chinese (20.6 per cent), but less so compared to Malaysians (60.8 per cent), Hong Kongers (69.8 per cent), and Taiwanese (62.7 per cent) (see Figure 51).

Attitudes towards Institutions, Politics, and Policies
102
Naturalised citizens and PRs held the opposite view to local-born citizens on this topic. While 40.3 per cent of local-born citizens agreed that immigration led to social conflict, 43.8 per cent of naturalised citizens and PRs disagreed with this statement (see Table 68).
Table 68: Immigration leads to social conflict, by citizenship status
Citizenship Status N = 1,992
Immigration leads to social conflict
Disagree Hard to say Agree
Local-born citizen 26.4 33.4 40.3
Naturalised citizen / PR 43.8 26.6 29.6
Respondents living in 1- to 3-room flats were least likely to choose “hard to say”, where only 26.1 per cent, compared with at least 31 per cent of the other groups, chose this option. Within this group, a slightly higher proportion (39.2 per cent) chose “agree” compared with “disagree” (34.8 per cent). For the rest of the groups, there was a slight positive correlation between
29.8%
10.4%
22.9%
11.3%
41.2%50.6%
18.1%
33.2%
17.0%11.9%
32.4%
28.8%
31.2%65.2%
46.1% 28.8%
12.1%
4.1% 38.6% 47.2%
37.8%
60.8%
45.9%
23.5%12.7%
20.6%
69.8%62.7%
44.3% 40.9%
0%
10%
20%
30%
40%
50%
60%
70%
80%
90%
100%
Figure 51: Immigration leads to social conflict, by polity
Disagree Hard to say Agree

Chapter 3 | Political and Policy Attitudes
103
agreement rates and housing type. Compared with 34.5 per cent of those staying in 4-room flats, 42.6 per cent of private property dwellers agreed that immigration led to social conflict (see Table 69).
Table 69: Immigration leads to social conflict, by housing type
Housing Type N = 1,992
Immigration leads to social conflict
Disagree Hard to say Agree
1- to 3-room HDB 34.8 26.1 39.2
4-room HDB 30.0 35.4 34.5
5+-room HDB 26.0 35.1 38.8
Private property 25.5 31.9 42.6
Despite agreeing that immigration helps to fill important job vacancies, a large proportion also believed that immigration increases unemployment. Among the population, 43.6 per cent gave this answer, while 26 per cent were undecided, and 30.5 per cent disagreed. Singaporean respondents had similar perspectives to Thais. In comparison, respondents from Malaysia, Hong Kong, and Taiwan were more likely to view immigration negatively, with 55.7 per cent, 52.9 per cent, and 65 per cent of its respondents agreeing that immigration increases unemployment, respectively. On the other end of the spectrum, less than 30 per cent of respondents in Japan and South Korea agreed that immigration would increase unemployment (see Figure 52).

Attitudes towards Institutions, Politics, and Policies
104
While respondents aged 50 years and below were more split between the two stances, those aged above 50 were more in favour of the statement. Around 50 per cent of those aged above 50 believed immigration increased unemployment for Singapore (see Table 70).
Table 70: Immigration increases unemployment, by age cohort
Age Cohort N = 1,997
Immigration increases unemployment
Disagree Hard to say Agree
21-35 34.4 27.3 38.4
36-50 32.8 27.6 39.6
51-65 25.4 24.2 50.4
Above 65 27.7 22.3 50.0
30.5%
16.2%
28.0%
11.8%
37.5% 40.6%
29.3% 31.9%25.2%
20.4%
26.0%
28.1%
30.5% 65.0%
44.7%28.3%
17.8%3.1%
38.9% 46.3%
43.6%
55.7%
41.6%
23.2%17.8%
31.1%
52.9%
65.0%
35.8% 33.3%
0%
10%
20%
30%
40%
50%
60%
70%
80%
90%
100%
Figure 52: Immigration increases unemployment, by polity
Disagree Hard to say Agree

Chapter 3 | Political and Policy Attitudes
105
Naturalised citizens and PRs held quite different views from local-born citizens. While 47.5 per cent of local-born citizens agreed that immigration increased unemployment, a similar proportion of 46.1 per cent of naturalised citizens and PRs disagreed (see Table 71).
Table 71: Immigration increases unemployment, by citizenship status
Citizenship Status N = 1,997
Immigration increases unemployment
Disagree Hard to say Agree
Local-born citizen 26.5 26.0 47.5
Naturalised citizen / PR 46.1 24.3 29.6
While it was found that over 40 per cent of those who were employed in some form had agreed that immigration fills important job vacancies, slightly higher proportions of the same groups felt that immigration increased unemployment. The lowest rate of agreement came from students, who were likely to be viewing the situation from a more macro perspective, given that they had not entered the working world and felt the impact of a more competitive job market (see Table 72).
Table 72: Immigration increases unemployment, by employment type
Employment Type N = 1,997
Immigration increases unemployment
Disagree Hard to say Agree
Full-time employee 30.7 27.5 41.8
Part-time employee 27.4 25.8 46.8
Self-employed 31.3 27.6 41.0
Retired/ pensioned 29.2 21.3 49.4
Housewife 31.2 24.2 44.7
Student 42.7 24.7 32.6
Unemployed 24.6 21.4 54.0
Others 18.8 31.2 50.0
Over half of those with ITE or lower qualifications agreed that immigration increased unemployment. In comparison, those with diploma or professional qualifications were more undecided; while 43.9 per cent agreed, there was 30.2 per cent of the group that chose “hard to say”. Meanwhile, there was a slightly higher proportion of university graduates who disagreed compared with those who agreed (see Table 73).

Attitudes towards Institutions, Politics, and Policies
106
Table 73: Immigration increases unemployment, by education level
Education Level N = 1,993
Immigration increases unemployment
Disagree Hard to say Agree
Below secondary 26.4 23.4 50.1
Secondary / ITE 26.8 20.8 52.4
Dip. / Prof. qual. 25.9 30.2 43.9
Bachelor's and above 38.4 28.4 33.2
In general, a negative correlation was found between agreement rates and income levels, as well as between agreement rates and housing types. Respondents who had higher income were more likely to disagree with the statement and less likely to agree. Similarly, individuals living in the larger housing types were more likely to disagree that immigration increases unemployment (see Tables 74 and 75).
Table 74: Immigration increases unemployment, by income
Income N = 1,219
Immigration increases unemployment
Disagree Hard to say Agree
Below $1,500 25.6 23.7 50.7
$1,500 - $2,999 22.3 26.5 51.1
$3,000 - $4,999 30.6 30.1 39.2
$5,000 - $6,999 38.2 25.5 36.4
Above $6,999 41.1 25.3 33.5
Table 75: Immigration increases unemployment, by housing type
Housing Type N = 1,997
Immigration increases unemployment
Disagree Hard to say Agree
1- to 3-room HDB 28.4 22.7 48.9
4-room HDB 28.0 27.0 45.0
5+-room HDB 29.2 28.1 42.7
Private property 39.8 25.3 34.9 While 40.8 per cent disagreed that immigration increased the risks of terrorism, 32.5 per cent were undecided about this statement. The proportion of Singaporean respondents (26.7 per cent) who agreed that immigration causes an increase in the risks of terrorism was found to
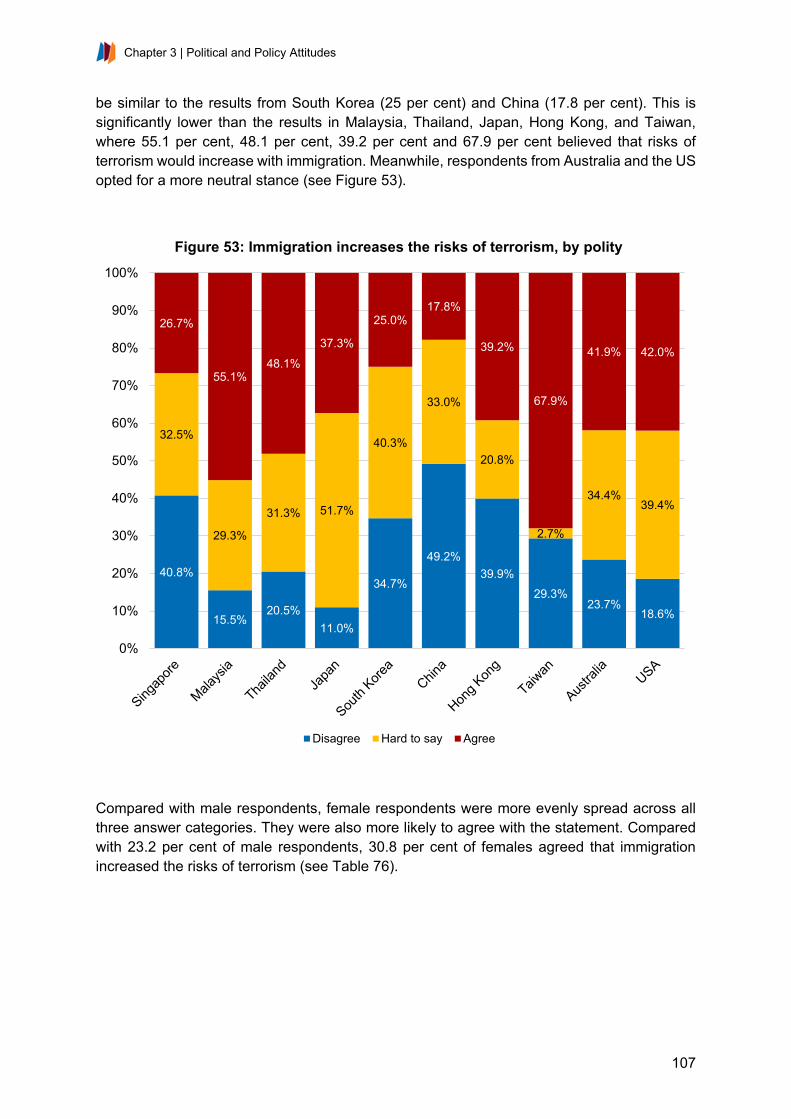
Chapter 3 | Political and Policy Attitudes
107
be similar to the results from South Korea (25 per cent) and China (17.8 per cent). This is significantly lower than the results in Malaysia, Thailand, Japan, Hong Kong, and Taiwan, where 55.1 per cent, 48.1 per cent, 39.2 per cent and 67.9 per cent believed that risks of terrorism would increase with immigration. Meanwhile, respondents from Australia and the US opted for a more neutral stance (see Figure 53).
Compared with male respondents, female respondents were more evenly spread across all three answer categories. They were also more likely to agree with the statement. Compared with 23.2 per cent of male respondents, 30.8 per cent of females agreed that immigration increased the risks of terrorism (see Table 76).
40.8%
15.5%20.5%
11.0%
34.7%
49.2%39.9%
29.3%23.7%
18.6%
32.5%
29.3%
31.3% 51.7%
40.3%
33.0%
20.8%
2.7%
34.4%39.4%
26.7%
55.1%48.1%
37.3%
25.0%17.8%
39.2%
67.9%
41.9% 42.0%
0%
10%
20%
30%
40%
50%
60%
70%
80%
90%
100%
Figure 53: Immigration increases the risks of terrorism, by polity
Disagree Hard to say Agree

Attitudes towards Institutions, Politics, and Policies
108
Table 76: Immigration increases risks of terrorism, by gender
Gender N = 1,988
Immigration increases risks of terrorism
Disagree Hard to say Agree
Male 42.4 34.4 23.2
Female 39.2 30.0 30.8
While the proportion of respondents who were undecided remain quite constant at between 30 per cent and 34 per cent, younger respondents were more likely to disagree with the statement. Over half, or 50.2 per cent, of those aged between 21 and 35 years old disagreed, compared with just 33.3 per cent of those above 65. There thus appears to be a more suspicious attitude towards immigration on the part of older respondents (see Table 77).
Table 77: Immigration increases risks of terrorism, by age cohort
Age Cohort N = 1,988
Immigration increases risks of terrorism
Disagree Hard to say Agree
21-35 50.2 30.4 19.4
36-50 40.2 32.9 27.0
51-65 36.0 33.5 30.5
Above 65 33.3 30.9 35.8
Naturalised citizens and PRs were more likely to disagree, and less likely to choose “hard to say” when compared with local-born citizens. While 38.4 per cent of local-born citizens disagreed that immigration increased the risks of terrorism, 49.6 per cent of the naturalised citizens and PRs gave the same answer (see Table 78).
Table 78: Immigration increases risks of terrorism, by citizenship status
Citizenship Status N = 1,988
Immigration increases risks of terrorism
Disagree Hard to say Agree
Local-born citizen 38.4 33.1 28.4
Naturalised citizen / PR 49.6 27.6 22.8
Responses from those with ITE qualifications or below were quite evenly split between the three answer categories. In contrast, the two higher education groups were more likely to disagree with the statement, with at least 41 per cent choosing “disagree” (see Table 79).

Chapter 3 | Political and Policy Attitudes
109
Table 79: Immigration increases risks of terrorism, by education level
Education Level N = 1,984
Immigration increases risks of terrorism
Disagree Hard to say Agree
Below secondary 37.4 31.3 31.3
Secondary / ITE 37.5 32.1 30.4
Dip. / Prof. qual. 41.6 33.3 25.1
Bachelor's and above 44.6 31.3 24.1
The responses to immigration increasing crime rates were more or less evenly distributed across the three answer categories. However, a larger proportion, or 36.9 per cent, disagreed, compared with 29.7 per cent who agreed. When compared across selected societies, it was found that the only society with a majority of the respondents disagreeing with the statement was South Korea. There were also significant proportions of respondents from Taiwan (40.5 per cent), Singapore (36.9 per cent), and China (37.3 per cent) who disagreed. On the other hand, Malaysia, Thailand, Hong Kong and Taiwan had a majority who agreed with the statement instead. Japan, Australia and the USA had a majority who chose “hard to say”, adopting a more ambivalent stance towards whether immigration increased the crime rate (see Figure 54).

Attitudes towards Institutions, Politics, and Policies
110
The youngest age group held the most positive attitude towards immigrants, where 46.2 per cent disagreed that immigration increased the crime rate, compared with less than 36 per cent of each of the other groups. In addition, while over 30 per cent of all the other groups agreed with the statement, 22 per cent of the youngest group chose the same answer (see Table 80).
Table 80: Immigration increases the crime rate, by age cohort
Age Cohort N = 1,995
Immigration increases the crime rate
Disagree Hard to say Agree
21-35 46.2 31.8 22.0
36-50 35.2 34.5 30.4
51-65 33.3 32.6 34.2
Above 65 30.1 33.4 36.5
36.9%
13.5%19.7%
9.3%
52.6%
37.3%
23.2%
40.5%
19.8% 17.3%
33.4%
25.5%
28.8% 50.0%
31.7%
32.8%
19.0%
5.2% 45.3% 51.6%
29.7%
61.1%51.5%
40.6%
15.7%
29.9%
57.8% 54.3%
34.8% 31.1%
0%
10%
20%
30%
40%
50%
60%
70%
80%
90%
100%
Figure 54: Immigration increases the crime rate, by polity
Disagree Hard to say Agree
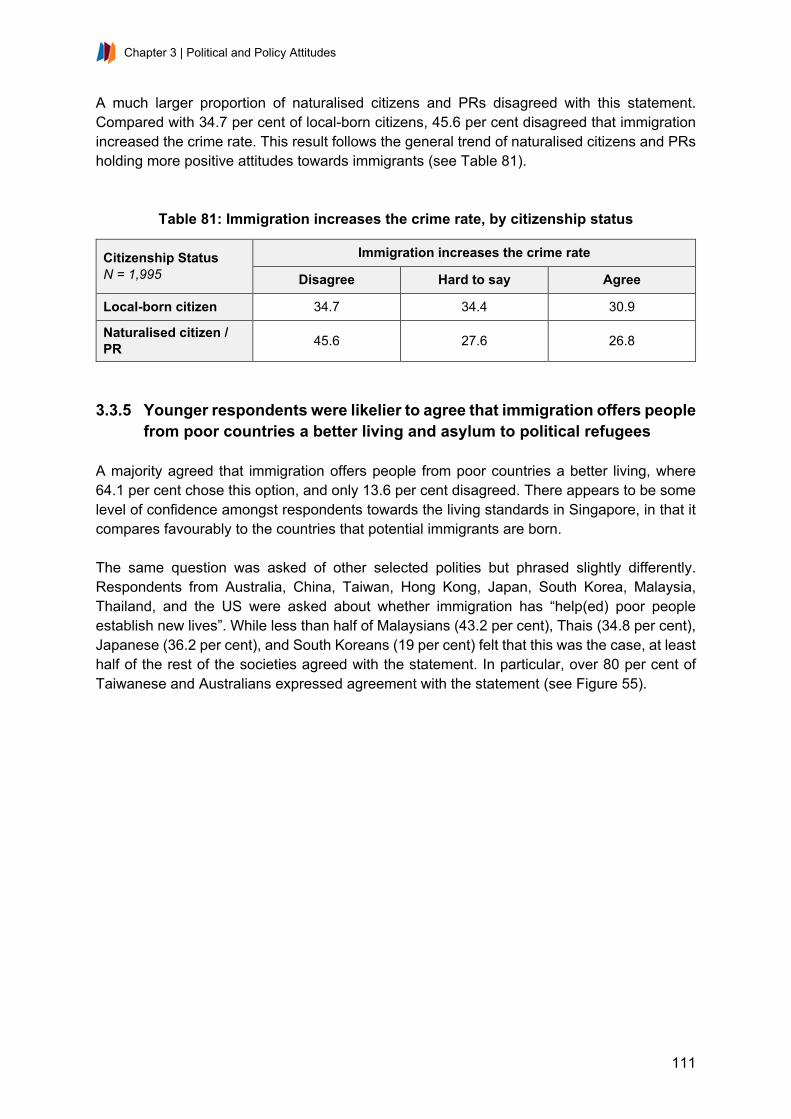
Chapter 3 | Political and Policy Attitudes
111
A much larger proportion of naturalised citizens and PRs disagreed with this statement. Compared with 34.7 per cent of local-born citizens, 45.6 per cent disagreed that immigration increased the crime rate. This result follows the general trend of naturalised citizens and PRs holding more positive attitudes towards immigrants (see Table 81).
Table 81: Immigration increases the crime rate, by citizenship status
Citizenship Status N = 1,995
Immigration increases the crime rate
Disagree Hard to say Agree
Local-born citizen 34.7 34.4 30.9
Naturalised citizen / PR 45.6 27.6 26.8
3.3.5 Younger respondents were likelier to agree that immigration offers people
from poor countries a better living and asylum to political refugees A majority agreed that immigration offers people from poor countries a better living, where 64.1 per cent chose this option, and only 13.6 per cent disagreed. There appears to be some level of confidence amongst respondents towards the living standards in Singapore, in that it compares favourably to the countries that potential immigrants are born. The same question was asked of other selected polities but phrased slightly differently. Respondents from Australia, China, Taiwan, Hong Kong, Japan, South Korea, Malaysia, Thailand, and the US were asked about whether immigration has “help(ed) poor people establish new lives”. While less than half of Malaysians (43.2 per cent), Thais (34.8 per cent), Japanese (36.2 per cent), and South Koreans (19 per cent) felt that this was the case, at least half of the rest of the societies agreed with the statement. In particular, over 80 per cent of Taiwanese and Australians expressed agreement with the statement (see Figure 55).
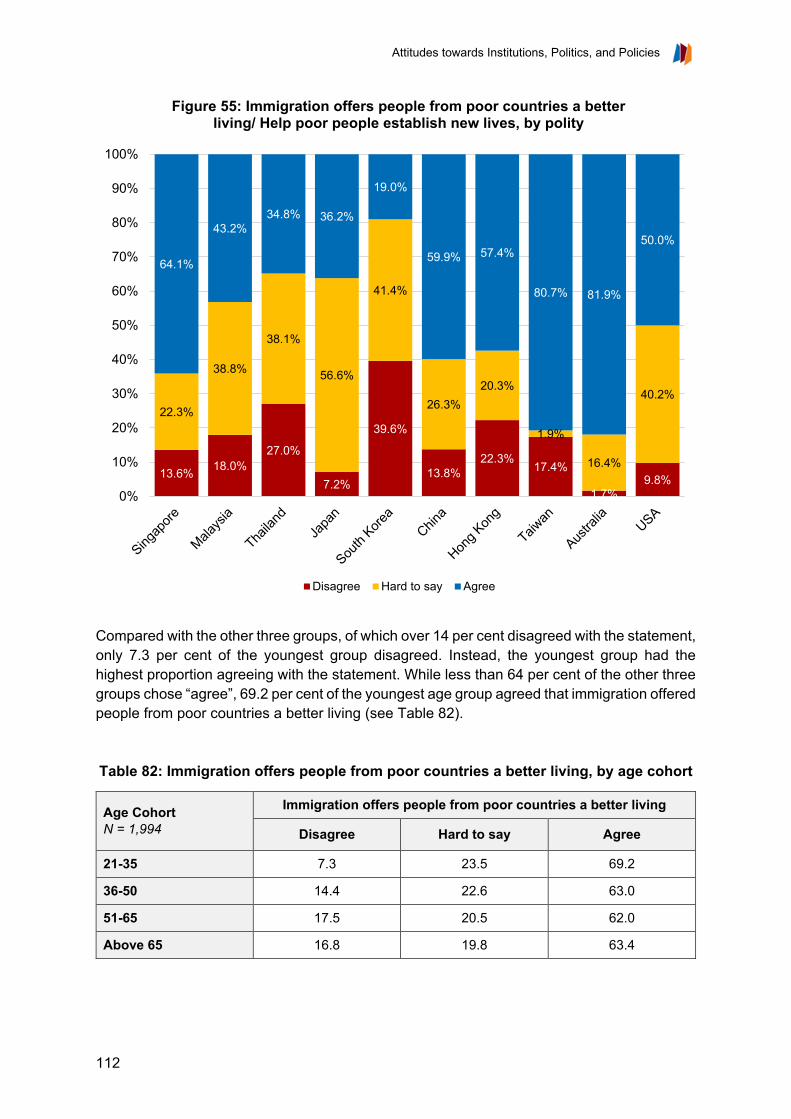
Attitudes towards Institutions, Politics, and Policies
112
Compared with the other three groups, of which over 14 per cent disagreed with the statement, only 7.3 per cent of the youngest group disagreed. Instead, the youngest group had the highest proportion agreeing with the statement. While less than 64 per cent of the other three groups chose “agree”, 69.2 per cent of the youngest age group agreed that immigration offered people from poor countries a better living (see Table 82). Table 82: Immigration offers people from poor countries a better living, by age cohort
Age Cohort N = 1,994
Immigration offers people from poor countries a better living
Disagree Hard to say Agree
21-35 7.3 23.5 69.2
36-50 14.4 22.6 63.0
51-65 17.5 20.5 62.0
Above 65 16.8 19.8 63.4
13.6% 18.0%27.0%
7.2%
39.6%
13.8%22.3%
17.4%
1.7%9.8%
22.3%
38.8%
38.1%
56.6%
41.4%
26.3%20.3%
1.9%
16.4%
40.2%
64.1%
43.2%34.8% 36.2%
19.0%
59.9% 57.4%
80.7% 81.9%
50.0%
0%
10%
20%
30%
40%
50%
60%
70%
80%
90%
100%
Figure 55: Immigration offers people from poor countries a better living/ Help poor people establish new lives, by polity
Disagree Hard to say Agree
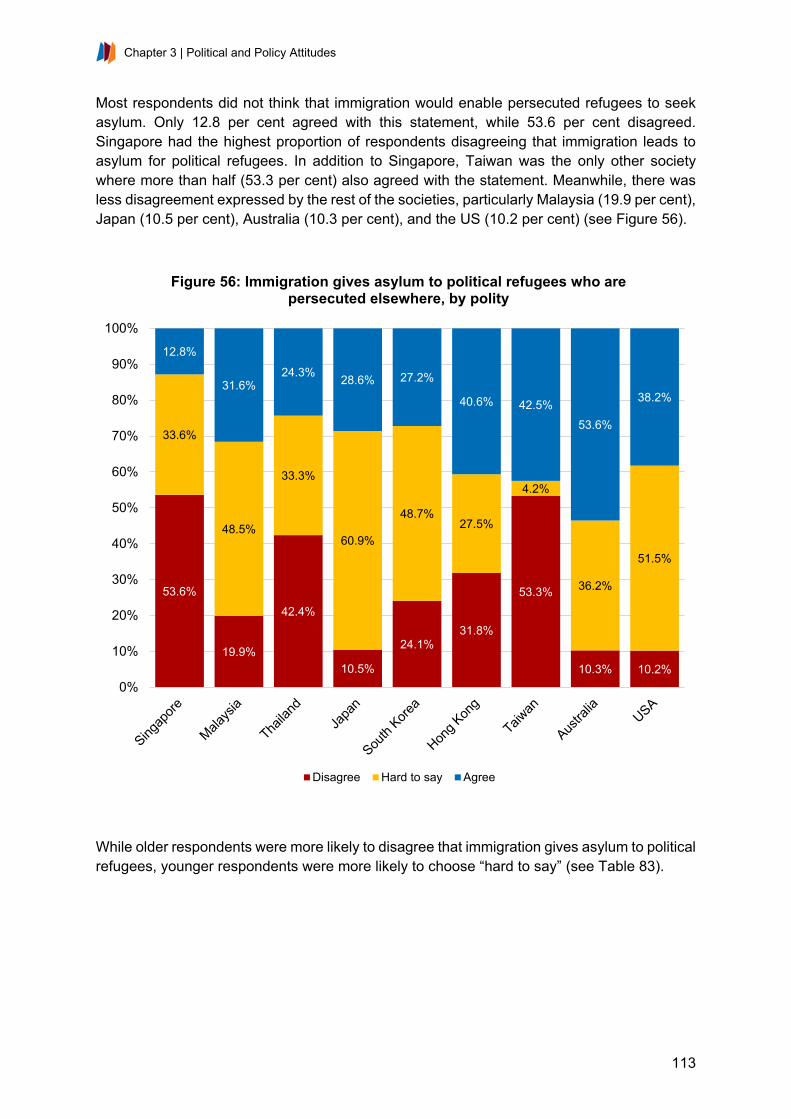
Chapter 3 | Political and Policy Attitudes
113
Most respondents did not think that immigration would enable persecuted refugees to seek asylum. Only 12.8 per cent agreed with this statement, while 53.6 per cent disagreed. Singapore had the highest proportion of respondents disagreeing that immigration leads to asylum for political refugees. In addition to Singapore, Taiwan was the only other society where more than half (53.3 per cent) also agreed with the statement. Meanwhile, there was less disagreement expressed by the rest of the societies, particularly Malaysia (19.9 per cent), Japan (10.5 per cent), Australia (10.3 per cent), and the US (10.2 per cent) (see Figure 56).
While older respondents were more likely to disagree that immigration gives asylum to political refugees, younger respondents were more likely to choose “hard to say” (see Table 83).
53.6%
19.9%
42.4%
10.5%
24.1%31.8%
53.3%
10.3% 10.2%
33.6%
48.5%
33.3%
60.9%
48.7%27.5%
4.2%
36.2%
51.5%
12.8%
31.6%24.3% 28.6% 27.2%
40.6% 42.5%53.6%
38.2%
0%
10%
20%
30%
40%
50%
60%
70%
80%
90%
100%
Figure 56: Immigration gives asylum to political refugees who are persecuted elsewhere, by polity
Disagree Hard to say Agree

Attitudes towards Institutions, Politics, and Policies
114
Table 83: Immigration gives asylum to political refugees, by age cohort
Age Cohort N = 1,955
Immigration gives asylum to political refugees
Disagree Hard to say Agree
21-35 47.4 37.5 15.1
36-50 53.8 32.8 13.4
51-65 56.5 31.6 11.9
Above 65 60.7 28.5 10.8
3.3.6 Older and local-born citizens are more likely to desire strict limits on the
number of foreigners who can enter Singapore Respondents were also asked about the policy direction the government should take with regard to foreign nationals coming to Singapore to work. While the Government had implemented a fairly open immigration policy to augment Singapore’s workforce for three decades, stricter policies have been imposed since 2011 such as tightening conditions for the hiring of foreigners via imposing quotas on Work Permit and S-Pass holders within companies, and limiting the numbers of permanent residencies and new citizenships granted. The vast majority of respondents believed that strict limits should be placed on the numbers coming in, while the option “let people come as long as there are jobs available” was a distant second. We note that older and local-born respondents preferred placing strict limits on the inflow of people. While more than 70 per cent of respondents from Singapore, Malaysia, and Taiwan preferred the government to place strict limits on the number of arriving foreigners, slightly over half of those from Thailand, Japan, and Hong Kong indicated likewise. Meanwhile, less than half of South Koreans, Australians, and Americans preferred such a policy (see Figure 57).
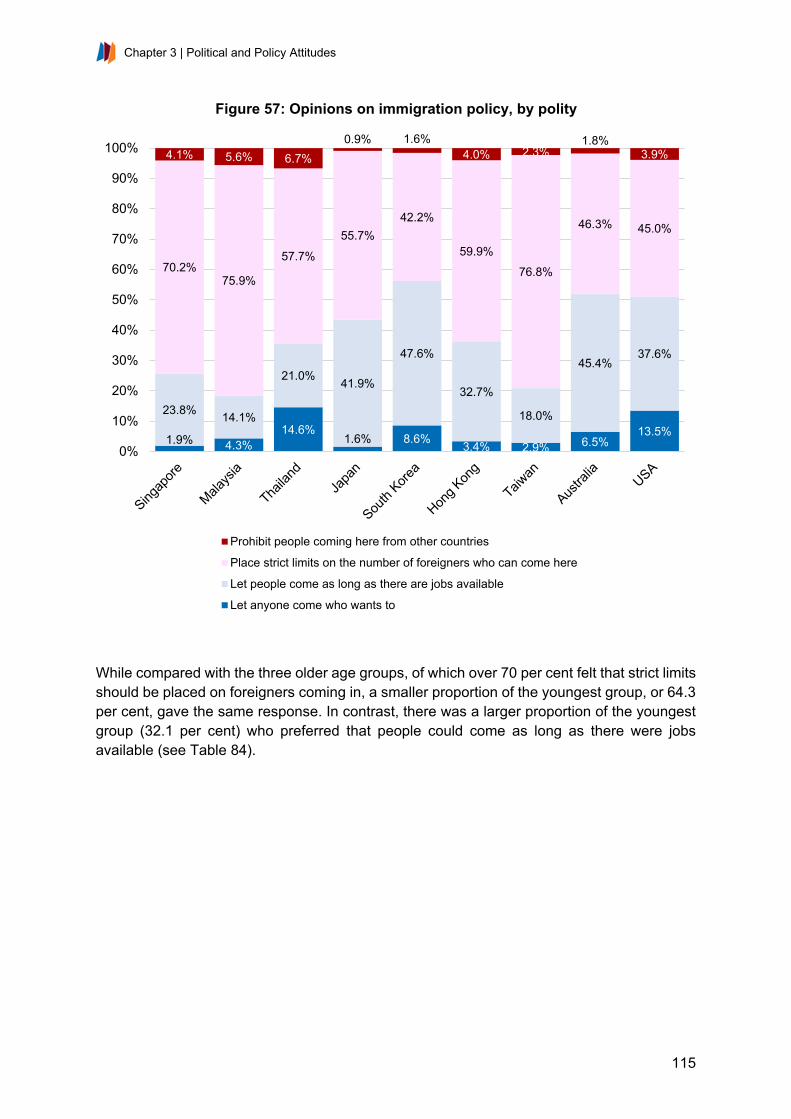
Chapter 3 | Political and Policy Attitudes
115
While compared with the three older age groups, of which over 70 per cent felt that strict limits should be placed on foreigners coming in, a smaller proportion of the youngest group, or 64.3 per cent, gave the same response. In contrast, there was a larger proportion of the youngest group (32.1 per cent) who preferred that people could come as long as there were jobs available (see Table 84).
1.9% 4.3%14.6%
1.6% 8.6% 3.4% 2.9% 6.5%13.5%
23.8% 14.1%
21.0% 41.9%
47.6%
32.7%
18.0%
45.4%37.6%
70.2%75.9%
57.7%
55.7%42.2%
59.9%
76.8%
46.3% 45.0%
4.1% 5.6% 6.7%0.9% 1.6%
4.0% 2.3%1.8%
3.9%
0%
10%
20%
30%
40%
50%
60%
70%
80%
90%
100%
Figure 57: Opinions on immigration policy, by polity
Prohibit people coming here from other countries
Place strict limits on the number of foreigners who can come here
Let people come as long as there are jobs available
Let anyone come who wants to

Attitudes towards Institutions, Politics, and Policies
116
Table 84: Opinions on immigration policy, by age cohort
Age Cohort N = 1,982
Opinions on immigration policy
Let anyone come who wants
to
Let people come as long as there
are jobs available
Place strict limits on the number of
foreigners who can come here
Prohibit people coming here from other countries
21-35 1.5 32.1 64.3 2.2
36-50 2.5 22.9 71.0 3.6
51-65 2.2 18.6 74.1 5.1
Above 65 1.2 19.4 72.9 6.5
Comparing across citizenship statuses, the majority of both groups believed that strict limits should be placed. However, compared with 73.3 per cent of local-born citizens, only 58.4 per cent of naturalised citizens and PRs chose this option. Instead, 36 per cent felt that people could come as long as there were jobs available, a much larger proportion compared with the 20.7 per cent response rate from local-born citizens (see Table 85).
Table 85: Opinions on immigration policy, by citizenship status
Citizenship Status N = 1,982
Opinions on immigration policy
Let anyone come who wants to
Let people come as long as there are
jobs available
Place strict limits on the number of
foreigners who can come here
Prohibit people coming
here from other
countries
Local-born citizen 1.3 20.7 73.3 4.8
Naturalised citizen / PR 4.4 36.0 58.4 1.3
Compared to Conservative Autocrats and Secular Liberals, Conservative Democrats and Middle Grounders were more adamant about placing strict limits on foreigners coming to Singapore for work. While over 70 per cent of the first two groups chose that option, only 55.2 per cent of Conservative Autocrats and 61.6 per cent of Secular Liberals did the same (see Table 86).

Chapter 3 | Political and Policy Attitudes
117
Table 86: Opinions on immigration policy, by clusters
Clusters (from analyses in 1st Report) N = 1,982
Opinions on immigration policy
Let anyone come who wants to
Let people come as long as there are
jobs available
Place strict limits on the number of foreigners
who can come here
Prohibit people
coming here from other countries
Conservative Democrat 1.9 18.2 73.2 6.7
Conservative Autocrat 3.8 35.2 55.2 5.7
Secular Liberal 2.5 34.1 61.6 1.8
Middle Grounder 1.4 24.9 72.4 1.3
3.3.7 Few respondents were averse to having immigrants or foreign workers as
neighbours; naturalised citizens and PRs were less likely to express such a sentiment compared to local-born citizens
Respondents were asked which groups of people they did not want as their neighbours. Hence, this question checks the degree of aversion respondents hold towards different groups. With regards to immigrants or foreign workers, not many were particularly averse, given that only 11.3 per cent mentioned this group. Compared to those from Malaysia, Thailand, Japan, South Korea, and Taiwan, Singaporean respondents showed less aversion to immigrants or foreign workers as neighbours. In this regard, Singapore’s results were similar to Hong Kong, Australia, and the US. Respondents from Sweden and Switzerland were the least averse to living near immigrants, given that less than 5 per cent of their respondents mentioned this group (see Figure 58).

Attitudes towards Institutions, Politics, and Policies
118
Compared with naturalised citizens and PRs, of which only 6.8 per cent mentioned immigrants and foreign workers, 12.6 per cent of local-born citizens did so. Given that naturalised citizens and PRs are themselves immigrants, they may be slightly more welcoming of other immigrants, hence the lower proportion of mentions (see Table 87).
Table 87: Thoughts on living next to immigrants / foreigners, by citizenship status
Citizenship Status N = 2,012
Do not want to live next to immigrants/foreign workers
Mentioned Not mentioned
Local-born citizen 12.6 87.4
Naturalised citizen / PR 6.8 93.2
11.3%
50.6%38.9%
29.1%22.0% 25.6%
9.0%
21.7%
8.9% 8.0% 6.4% 3.0% 4.9%
88.7%
49.4%61.1%
67.8%78.0% 72.2%
91.0%
78.3%
91.1% 85.8% 93.3% 95.3% 94.1%
0%
10%
20%
30%
40%
50%
60%
70%
80%
90%
100%
Figure 58: Would you not like immigrants or foreign workers as neighbours, by polity
Mentioned Not mentioned
Chapter 3 | Political and Policy Attitudes
119
3.3.8 Alongside demographic factors, we find that confidence in state institutions and satisfaction with the functioning of the political system are positively correlated with support for immigration
To conclude and concretise our findings on attitudes towards immigration, we built regression models based on a 7-item aggregate scale12 based on questions presented in Figure 48. We find that respondents with 1) more confidence in state institutions and 2) higher satisfaction in the functioning of the political system predicted higher levels of support for immigration. With respect to the demographic variables, respondents who were not born in Singapore, aged between 21 and 50, or had university education had higher levels of support for immigration compared to those who were born in Singapore, aged above 65, or had secondary or ITE education (see Table 88).
12 Factor analysis was conducted on the items associated with immigration; all “positive” items (i.e., immigration engendering cultural diversity, filling important job vacancies, etc.) were loaded on the same factor, while the negative items (i.e., immigration increasing crime, risks of terrorism, etc.) were loaded on another factor. Two scales were created; one 4-item “positive-only”, and a broader 7-item scale encompassing all questions (with the exception of the item on asylum due to the potential for respondents to view the phenomena in both positive and negative terms). We use the broader 7-item scale in the regression model presented in Table 88.

Attitudes towards Institutions, Politics, and Policies
120
Table 88: Support for immigration (linear regression)
Variables Model 1 Standardised Coefficient
Confidence in state institutions .107***
Political interest (Y/N) -.001
How democratic is SG .052
Satisfaction with political system functioning .116***
Local-born (vs not local-born) -.188***
Gender (females vs males) -.051*
Age
21-35 .267***
36-50 .101**
51-65 .044
Reference group: Above 65
Education
Below secondary school .005
Secondary school/ ITE -.071**
Diploma/ Professional qualification -.038
Reference group: Bachelor’s and above
Housing type
1- 3-room HDB -.046
4-room HDB -.047
5+-room HDB -.037
Reference group: Private property
Adjusted R2 .136
* p < 0.05, ** p < 0.01, *** p < 0.001

Chapter 4 | Conclusion
121
Chapter 4
Conclusion
Attitudes towards Institutions, Politics, and Policies
122
CHAPTER 4 | CONCLUSION This second WVS report has attempted to provide an overview of three broad themes with augmented societal interest in recent times: 1) public confidence in institutions; 2) political interest, perspectives on human rights, and views on the prevailing political system; and 3) policy attitudes towards government surveillance and immigration. In general, this study has found that the majority of Singaporeans have confidence in institutions, especially local ones. Given that citizen confidence in institutions is an important evaluation of the performance of these institutions (Newton & Norris, 2000), it is heartening to know that Singaporeans accord great trust in local institutions. In the same vein, an overwhelming majority perceive corruption as highly atypical in the city-state. While the majority of Singaporeans are disinterested in politics, the seemingly politically docile population does not eschew expressing their concerns about possible policies concerning surveillance and immigration, which may impact their lives. As is common in many polities, there is substantial diversity of opinion across the local populace. More importantly, we explicate the connection between greater confidence in state institutions as illustrated in Chapter 2, and support for government surveillance and immigration, as Chapter 3 details. We conclude with a summary of the key insights across the three key areas of interest: institutions, politics and policies. Higher confidence levels were found in state institutions, such as the Government, Parliament, courts, the police (SPF), the military (SAF), and the civil service, as compared to electoral institutions, media and civil society. We surmise that these high levels of trust in state institutions are related to how these institutions have been the vanguards of Singapore’s economic and social transformation after independence. Singapore is often referred to as an “administrative state” due to its efficient and effective institutions, where its capabilities and capacity were mainly utilized to achieve economic progress and infrastructural development. These state institutions work closely together and undergird the nation’s overall development and stability. We also found that older respondents had higher confidence in the Government than younger respondents. Undoubtedly, older individuals have experienced and witnessed effective Government policy decisions that led to noteworthy progress in Singapore’s social, infrastructural and economic landscape since independence. Over the decades of consistent economic development and social progress, the trust of older cohorts in the Government might have increased, explaining their high reported levels of confidence. Conversely, younger respondents who grew up in an already highly industrialised and economically developed state would not have witnessed or experienced the significant progress made by the Government. This may explain their hesitation to indicate high levels of confidence in the Government. The survey results also support the established finding that there is a negative correlation between corruption and confidence in public institutions. Where perceptions of corruption are low, confidence in public institutions is likely to be high. Due to its effective and strong anti-corruption strategies, Singapore has become known as one of the least corrupt countries in

Chapter 4 | Conclusion
123
the world. It is not surprising that high proportions of Singaporean respondents perceive state authorities, the civil service, business executives and media and journalists to have high integrity. However, if we compare between institutions, there was a higher proportion of respondents who indicated that none or few civil servants were involved in corruption compared to business executives and the media sector. While the Corrupt Practices Investigation Bureau (CPIB) investigates corruption cases both in the public and private sector, control and oversight in the public sector may be more easily enforced in a tight bureaucratic organisation as compared to the private sector and the media, whose activities lie outside state purview. As such, the public may view the private sector and the media as slightly more susceptible to corruption, explaining why a lower proportion of Singapore respondents believe that these two groups are not involved in corruption as compared to state institutions. This suggests that state efforts to combat corruption should be a continued effort. While most respondents were confident about electoral institutions such as elections and political parties, education had a negative impact on the degree of confidence in these institutions. On the other hand, naturalised citizens and PRs, less educated, and older respondents are more confident in elections and political parties. The more educated in the population, armed with a greater knowledge of electoral processes and the different political parties, are expectedly more critical in their evaluation of elections and political parties. The results of the survey also illustrate that most respondents find Singapore to be at least somewhat democratic and satisfied with the functioning of its political system. As democratic systems are dependent on citizen’s confidence, the high level of confidence in the democratic nature and political system by Singaporeans points in a positive direction for democratic sustainability and strength. High levels of satisfaction in a democratic political system may be due to the high trust in the legislature, political parties and the Government, which are key pillars to the functioning of a democratic regime. When it comes to political interest, affluence, education level and gender were found to be distinguishing factors. Higher-educated, more affluent, and male respondents were more likely to have greater interest in politics. The increased desire to explore politics with rising income and education appears to be compatible with Inglehart’s post-materialist theory, which argues that when basic or materialist needs, such as economic and physical security are met, individuals now seek to pursue post-materialist values, such as quality of life and self-expression. Inglehart (1981, p. 890) specifically points out that post-materialists who have satisfied their immediate physiological needs tend to have a “greater amount of … energy to invest in more remote concerns such as politics.” While Inglehart’s theory may not be well supported when considering nation-states – Singapore is one of the most economically developed nations in Asia, but there is relatively little political interest – the reality is that the majority of Singaporean respondents still perceive themselves to have needs that remain at the economic and physical level. A politically disinterested majority, however, is not synonymous with a politically undiscerning polity. When it came to issues of government surveillance and immigration, political nuances emerge and are made clear. In general, older people were more accepting of government surveillance, whether in public or private; informed or uninformed. This could be due to the

Attitudes towards Institutions, Politics, and Policies
124
digital divide between the older generation and the more tech-savvy millennials and “Gen-Zs”. The media acuity of the younger generation may have informed them of the dangers of privacy attacks and phishing, resulting in a greater scepticism of surveillance. In an age of massive data harvesting, there is a greater need for state surveillance, to be transparent and for the government to tread with caution when collecting and using citizen’s data. Successful surveillance policy execution can additionally only be realised with a healthy baseline level of public confidence in state institutions, and satisfaction with the prevailing political system. On the topic of the impact of immigration, more well-off and educated individuals were more likely to have positive evaluations on the impact of immigrants on Singapore’s development. When asked about the specific impacts of immigration, naturalised citizens and PRs were consistently found to have more positive attitudes than local-born citizens. One notable difference between these groups pertained to the view of whether immigrants cause social conflict. While 40.3 per cent of local-born citizens agreed that immigration led to social conflict, 43.8 per cent of naturalised citizens and PRs disagreed with the same statement. These two groups were also divided on the impact of immigration on unemployment. When it comes to policy preferences vis-à-vis immigration, the majority of Singapore respondents are open to foreigners coming into Singapore; but believe that numbers should be within strict limits enforced by the state. Youths, however, appear less adamant about this; a larger proportion compared to their older counterparts, prefer that people could come as long as there were available jobs. Perhaps, older respondents were less idealistic about immigration and were more concerned that a lack of strict enforcement of immigration quotas would have negative consequences on their livelihood. The latter may be a more imperative and immediate concern, when one is settling down in life and starting a family. This diversity of views when it comes to immigration highlights the need for policy-making to consider potential impacts as well as the population’s threshold for immigration in lived spaces. The statistically significant correlation confidence in state institutions and satisfaction in the prevailing political system have on attitudes towards immigration should also be considered in present and future endeavours to render Singapore’s immigration policies more robust. This report on institutions, politics and policies reveals a significant number of differing viewpoints across a number of demographic variables, especially socio-economic status, education levels, and citizenship. For effective policy-making and policy communications, it is crucial that a better grasp of the reasons behind these differing views is achieved. Oftentimes, differing opinions within the population are a corollary of varying lived experiences across demographics. For instance, those with lower educational qualifications may be exposed to realities their more privileged peers may not be privy to. Similarly, those who are more affluent have greater resources at their disposal and often experience higher levels of job and social stability; and may hence be less concerned about the impact of immigration on their jobs. Where appropriate, analyses in the report also reference the four clusters arising from the cluster analysis set out in greater detail in the first WVS report. Across confidence in institutions as well as attitudes towards politics, surveillance, and immigration, we find statistically significant results reflecting relatively consistent correlations across individuals’ views and opinions across three broad dimensions: politics, economy, and society. For instance, Conservative Democrats and Conservative Autocrats are more likely to indicate

Chapter 4 | Conclusion
125
confidence in institutions, and satisfaction with the prevailing political system. These findings are in line with the tenets of conservatism, which comprises values and beliefs illustrating an individual’s commitment to traditional values and trust in prevailing socio-political institutions. While efficiency and efficacy remain at the core of Singapore governance, the city-state should strive to constantly refresh and revise its existing politics and policies in line with the aspirations and perspectives of its diverse populace. It is our hope that the findings presented in this report go some way to build a clearer understanding of prevailing attitudes. The latter is vital in engendering constructive conversations and policymaking to ensure the continued durability of Singapore’s institutions and high baseline levels of public trust.

Attitudes towards Institutions, Politics, and Policies
126
Annex 1
References

Annex 1 | References
127
REFERENCES
Almond, G., & Verba, S. (1963). Civic Culture: Political Attitudes in Five Nations. Princeton, NJ: Princeton University Press.
Buckee, C.O., et al. (2020). Identifying Locations with Possible Undetected Imported Severe Acute Respiratory Syndrome Coronavirus 2 Cases by Using Importation Predictions. Emerging Infectious Diseases, 26(7), 1465-1469.
Clausen, B., Kraay, A. & Nyiri, Z. (2011). Corruption and Confidence in Public Institutions: Evidence from a Global Survey. The World Bank Economic Review, 25(2), 212-249.
Cowell, R., Downe, J., Martin, S. & Chen, A. (2012). Public Confidence and Public Services: It Matters What You Measure. Policy & Politics, 40(1), 123-143.
Easton, D. (1965). A Systems Analysis of Political Life. New York: Wiley.
Garcia-Rivero, C. & Kotze, H. Institutions, Crises, and Political Confidence in Seven Contemporary Democracies. An Elite–Mass Analysis. Journal of Public Affairs, 17(1-2), e1642.
Haerpfer, C., Inglehart, R., Moreno, A., Welzel, C., Kizilova, K., Diez-Medrano, J., Lagos, M., Norris, P., Ponarin, E. & Puranen B. (eds.). (2020). World Values Survey: Round Seven - Country-Pooled Datafile. Madrid, Spain & Vienna, Austria: JD Systems Institute & WVSA Secretariat. doi.org/10.14281/18241.1. Available at http://www.worldvaluessurvey.org/WVSOnline.jsp
Holmgren, L., Rossorp, F. & Rohden, H. (2016). Confidence in Public Institutions: A Focus Group Study on Views on the Swedish Social Insurance Agency. Work, 55, 77-91.
Inglehart, R. (1981). Post-Materialism in an Environment of Insecurity. The American Political Science Review, 75-4, 880-900.
Kim, S. (2005). The Role of Trust in the Modern Administrative State: An Integrative Model. Administration & Society. 37(5), 611-635.
Mathew, M., Tan, A. & Suhaini, S. (2020). Attitudes towards the use of surveillance technologies in the fight against COVID-19. IPS Report, 24 May 2020. Available at https://lkyspp.nus.edu.sg/docs/default-source/ips/ips-report-on-attitudes-towards-the-use-of-surveillance-technologies-in-the-fight-against-covid-19-240520.pdf
Mathew, M., Teo, K. K., Tay, M., & Wang, A. (2021). Our Singaporean Values: Key Findings from the World Values Survey. IPS Exchange Series no. 16. Institute of Policy Studies, Singapore.
Newton, K. & Norris, P. (2000). Confidence in Public Institutions: Faith, Culture or Performance? In Pharr, S. J. & Putnam, R. D. (Eds.) In Disaffected Democracies: What's Troubling the Trilateral Countries? (pp. 52–73). Princeton, NJ: Princeton University Press
Ng, Y., Li, Z., Chua, Y. X., Chaw, W. L., Zhao, Z., Er, B., Pung, R., Chiew, C. J., Lye, D. C., Heng, D., Lee, V. J. (2020). Evaluation of the Effectiveness of Surveillance and

Attitudes towards Institutions, Politics, and Policies
128
Containment Measures for the First 100 patients with COVID-19 in Singapore, January 2–February 29, 2020. Morbidity and Mortality Weekly Report, 69(11), 307–311.
North, D. C. (2012). Institutions, Institutional Change and Economic Performance. United Kingdom: Cambridge University Press.
O’Rourke, K. H., & Sinnott, R. (2006). The Determinants of Individual Attitudes towards Immigration. European Journal of Political Economy, 22(4), 838–861.
OECD. (2019). Society at a Glance 2019: OECD Social Indicators. OECD Publishing: Paris. https://doi.org/10.1787/soc_glance-2019-en
Ong, S.N., Teo, P., Yeoh, B.S.A. (2005). SARS in Singapore: Surveillance Strategies in a Globalising City. Health Policy, 72(3), 279-291.
Pellegata, A. & Memoli, V. (2016). Can Corruption Erode Confidence in Political Institutions Among European Countries? Comparing the Effects of Different Measures of Perceived Corruption. Social Indicators Research, 128, 391-412.
Personal Data Protection Commission. (2020). Advisories on Collection of Personal Data for COVID-19 Contact Tracing and Use of SafeEntry. https://www.pdpc.gov.sg/Help-and-Resources/2020/03/Advisory-on-Collection-of-Personal-Data-for-COVID-19-Contact-Tracing
Price, V. & Romantan, A. (2004). Confidence in Institutions Before, During, and After “Indecision 2000”. The Journal of Politics, 66(3), 939-956.
Prior, M. (2019). Hooked: How Politics Captures People’s Interest. Cambridge: Cambridge University Press.
Qian, F., & Lim, M. K. (2010). Singapore’s Response to the Severe Acute Respiratory Syndrome Outbreak: What Do Singapore Physicians Think? International Journal of Public Health, 55, 139-143
Quah, J. S. T. (2001). Combating Corruption In Singapore: What Can Be Learned? Journal of Contingencies and Crisis Management, 9 (1), 29–35.
Quah, J. S. T. (2006). Preventing Police Corruption In Singapore: The Role Of Recruitment, Training and Socialisation. Asia Pacific Journal of Public Administration, 28 (1), 59–75
Quah, J. S. T. (Ed.). (2013). Different Paths to Curbing Corruption: Lessons from Denmark, Finland, Hong Kong, New Zealand and Singapore. New York: Emerald Group Publishing.
Shin, M. (2006). Confidence in Public Institutions and Democracy in South Korea, Korea Observer, 37(2), 277-304.
Steen, A. (1996). Confidence in Institutions in Post-Communist Societies: The Case of the Baltic States. Scandinavian Political Studies, 19(3), 205-225
Transparency International. (2020). What Is Corruption? TI Corruptionary A-Z. Berlin: Transparency International.
Transparency International. (2019). Transparency International Corruption Perceptions Index (TI-CPI) 2019. Berlin: Transparency International.

Annex 1 | References
129
Transparency International. (2021). Our Work In: Singapore. https://www.transparency.org/en/countries/singapore#
Zhong, Y. (2018). Political Culture and Participation in Urban China. Singapore: Palgrave Macmillan.
Attitudes towards Institutions, Politics, and Policies
130
Annex 2
Acknowledgements

Annex 2 | Acknowledgements
131
ACKNOWLEDGEMENTS
While the four of us have the pleasure of bringing this substantive publication to fruition, this would not have been possible without the gracious support of our colleagues over the span of a year who contributed commentary, suggestions, and critiques across various iterations of this manuscript. In particular, we would like to thank Clara Lee for her excellent research support rendered in the preparation of this report. We would also like to extend our heartfelt appreciation to the Operations team at IPS Social Lab for their assistance in collecting and collating the 2020 Singapore iteration of the World Values Survey data.

Attitudes towards Institutions, Politics, and Policies
132
Annex 3
About the Authors

Annex 3 | About the Authors
133
ABOUT THE AUTHORS MATHEW MATHEWS is Head of IPS Social Lab and Principal Research Fellow at the Institute of Policy Studies. To date, Mathews has been involved in over fifty research projects, most of them addressing social policy issues. These have included research using both quantitative and qualitative methods on race, religion, immigrant integration, family, ageing and poverty. In the process of his research, Mathews has been the PI, Co-PI or academic consultant of over twenty nationwide surveys. He also studies the impact of social programmes on social issues and has been involved in a number of evaluations on the usefulness of various government initiatives. He has taught courses on social policy and has published in a range of outlets. Mathews currently sits on the boards of OnePeople.sg and National Volunteer and Philanthropy Centre. He is a Research Advisor to the Ministry of Social and Family Development, and is part of the VWOs-Charities Capability Fund Panel and Families for Life Council. TEO Kay Key is Postdoctoral Fellow at the Institute of Policy Studies Social Lab. A recent PhD graduate from the Department of Political Science at the National University of Singapore, Dr Teo’s current projects examine a myriad of issues in Singapore, including attitudes towards the family, social norms and values, and national identity. She also holds a Master’s in Political Behaviour from the University of Essex in the United Kingdom. Her research interests are an amalgamation of the varied experiences she has had, and include voting behaviour, public opinion, and Singapore society. Prior to joining IPS, she worked in the Singapore Civil Service for nearly three years doing strategic planning, training, and policy work. Melvin TAY is Research Associate at the Institute of Policy Studies, National University of Singapore. His research interests lie at the intersection of politics and society; with a focus on societal faultlines, their significance, and their management via policy instruments and community platforms. He has scoped, managed, and contributed to several public sector-commissioned projects on race, religion, immigration, class, sexuality, age, and education – key faultlines in the Singapore context. A triple-scholarship recipient including the NUS Graduate Teaching Fellowship, Master’s, and Undergraduate Scholarships, Melvin has a Master of Social Sciences (Political Economy) and a Bachelor of Social Sciences (1st Class Honours) in Political Science and Philosophy. Melvin previously worked in the corporate strategy team at a top consulting firm, and contributed to strategy and visioning projects for key public sector agencies. Alicia WANG is Research Associate at the Institute of Policy Studies, Lee Kuan Yew School of Public Policy, National University of Singapore. She has been involved in several public sector-commissioned research projects pertaining to religious spaces in the Singapore context, and has substantive research foci across religion, identity politics, and authoritarianism in Asian contexts. Prior to her role at the Institute, she graduated with a Master’s in Social Sciences (Political Science) from the National University of Singapore.